the Creative Commons Attribution 4.0 License.
the Creative Commons Attribution 4.0 License.
 | 02 Nov 2022
Measurement report: Characterization of sugars and amino acids in atmospheric fine particulates and their relationship to local primary sources
Ren-Guo Zhu
Hua-Yun Xiao
Liqin Cheng
Huixiao Zhu
Hongwei Xiao
Yunyun Gong
Sugars and amino acids are major classes of organic components in atmospheric fine particles and play important roles in atmospheric processes. However, the identification of their sources in different regions is explored little. To characterize local primary sources (biomass burning, plant, and soil sources) and evaluate their contributions to the total sugar compound and amino acid (AA) pool in different regions, fine particulate matter samples were collected from the urban, rural, and forest areas in Nanchang, China. The concentrations and compositions of sugar compounds (anhydrosugars, primary sugars, and sugar alcohols), free amino acids (FAAs), and combined amino acids (CAAs) were analysed by gas chromatography–mass spectrometry (GC-MS) after silylation derivatization. Urban areas had significantly higher average Σ sugar concentration (317±139 ng m−3) than that of the rural (181±72 ng m−3) and forest (275±154 ng m−3) areas (p<0.05). Overall, the distribution pattern of sugar compounds and CAAs in PM2.5 was generally similar in three areas. Levoglucosan accounted for 24.4 %, 22.0 %, and 21.7 %, respectively, of the total sugar pool in the urban, rural, and forest areas. This suggests that plant and soil sources, as well as biomass burning (BB), provide important contributions to aerosol sugars and CAAs in three areas. In the urban area, the concentrations of anhydrosugars showed a positive correlation with combined Gly concentrations, but no correlation was found between these two compounds in the rural and forest areas, indicating that the urban area is mainly affected by local combustion sources. This conclusion was also supported by the positive correlation between levoglucosan and non-sea-salt potassium, only observed in the urban area (Lev=0.07 K). In addition, the average levoglucosan / mannosan () ratio in the urban area (59.9) was much higher than in the rural (6.9) and forest areas (7.2), implying BB aerosols collected in the urban area originated from lignite burning, while the type of biofuels used in the rural and forest areas is mainly softwood. The concentrations of sugar alcohols in the rural and forest areas were positively correlated with that of CAAs, which are abundant in the topsoil (), suggesting that the contribution of local topsoil sources is large in these two areas. In the rural and forest areas, the concentrations of primary sugars were positively correlated with those of combined CAA species abundant in local dominant vegetation. Our findings suggest that combining specific sugar tracers and chemical profiles of CAAs in local emission sources can provide insight into primary source characteristics, including the types of biofuels burned, the contribution of topsoil sources, and local vegetation types.
- Article
(2505 KB) - Full-text XML
-
Supplement
(848 KB) - BibTeX
- EndNote


Organic aerosols (OAs) are an important topic of study because they account for a significant fraction (20 %–90 %) of fine aerosols (Verma et al., 2021; Wu et al., 2018; Xu et al., 2020a). Furthermore, they may influence the global climate as condensation nuclei (CCN) and ice nuclei (IN) (Ng et al., 2010; Steinfeld, 1998), contribute a large amount of terrestrial organic carbon to the remote oceans (Zhu et al., 2015), and cause human health problems (Nel, 2005; Fu et al., 2008). Thus, a profound understanding of the abundance, composition, and sources of OAs in fine aerosols is of great significance to reduce the adverse effects of OAs on the atmospheric environment and human beings' health (Fan et al., 2020).
As a vital fraction of water-soluble organic compounds (WSOCs), sugars and AAs are ubiquitous in the atmosphere from different geographical locations, including urban (Wang et al., 2019), forest (Mace et al., 2003), mountain (Barbaro et al., 2020; Fu et al., 2008), marine (Fu et al., 2013; Matsumoto and Uematsu, 2005), and polar regions (Feltracco et al., 2020; Feltracco et al., 2019). Moreover, chemical fingerprints of these two major classes of organic components in atmospheric particles have been used to elucidate relative contribution of different sources to aerosols (Jia et al., 2010; Matos et al., 2016; Yan et al., 2019). Specifically, levoglucosan and related anhydrosugar isomers (mannosan and galactosan), produced from pyrolysis of cellulose and hemicellulose at temperatures higher than 300∘ and ranking as the most abundant compounds in biomass burning emissions, have been recognized as specific molecular markers for biomass burning (BB) sources (Simoneit, 2002). Although there is still lack of knowledge about BB and amino acids, the potential correlation between the free glycine (Gly) concentrations and BB aerosols has been suggested in past studies (Zhu et al., 2020a; Samy et al., 2013; Violaki and Mihalopoulos, 2010).
Primary sugars and sugar alcohols are frequently utilized in tracking and estimating the contribution of soil and associated biogenic aerosols, including fungi, viruses, bacteria, pollen, and plant and animal debris (Liang et al., 2016). For instance, plant-debris-derived aerosol organic carbon was estimated based on the relationship of glucose and plant debris (Fan et al., 2020). Sucrose have been widely employed to indicate airborne pollen grains (Wang et al., 2021; Fu et al., 2012; Yan et al., 2019). The sugar alcohols arabitol and mannitol are found to be produced by fungi, lichens, soil biota, and algae to overcome environmental stress (Medeiros et al., 2006). These sugar alcohols have been recently proposed as molecular tracers for fungal spores (Elbert et al., 2007). In addition, algae and higher plants are also proved to be an important source of mannitol (Feltracco et al., 2020). Similarly, the level of combined amino acids (CAAs) in aerosols has been used as a marker for primary biological aerosol particles (PBAPs), and their composition can distinguish different types of PBAPs based on the chemical composition of CAAs in corresponding biological sources (Axelrod et al., 2021; Abe et al., 2016).
Sugars and AAs in aerosols may share similar sources to some extent. However, the concentrations, compositions, and source apportionment of sugars and AAs in aerosols have been studied separately in previous studies. Until the present, few studies have focused on sugars and amino acids in aerosols simultaneously, and the concentration and composition profiles of sugar compounds and AAs in different areas impacted by different local primary sources are still poorly understood (Barbaro et al., 2019; Ruiz-Jimenez et al., 2021). It is expected that coupling source-specific sugars with most abundant AA species in local primary sources may provide insight into more source signatures.
In recent years, we investigated the source and possible atmospheric transformation process of amino acids and proteinaceous material in different size-segregated particles collected from the forest, rural, suburban, and urban sites under different ambient oxidation levels (Zhu et al., 2020a, b, 2021a, b; Wen et al., 2022). The nitrogen isotope composition of free glycine (δ15NF−Gly) in potentially emission sources was analysed, and δ15NF−Gly values released by BB sources are significantly higher than those from natural primary sources (Zhu et al., 2020a). In the study of Zhu et al. (2020b), the origin of FAAs and CAAs and their atmospheric transformation processes in PM2.5 were explored by analysing the concentrations of FAAs and CAAs and δ15N values of free and combined Gly in PM2.5 and main primary emission sources (plant, soil, and aerosol from BB). Combining compound-specific δ15N patterns of hydrolyzed amino acids (HAAs) and the degradation index with the variance within trophic HAAs in fine and coarse particles, we demonstrated that AAs in coarse particles have advanced bacterial degradation states compared to fine particles (Zhu et al., 2021b). Correlations between the concentrations of FAAs, CAAs, and oxidants under different ambient NO2 and O3 levels were discussed to elucidate the mechanism of FAA formation from the protein degradation in relation to ambient NO2 and O3 concentrations (Zhu et al., 2021a). Although primary sources are proved to be important sources of AAs in the atmosphere in our previous study, further information of local primary sources characteristics, including the type of biofuels burned, local vegetation types, and the contribution of topsoil sources, is missing.
To further clarify local primary source information in different locations, the concentration and composition of sugars, FAAs, and CAAs in PM2.5 samples collected from the urban, rural, and forest areas in Nanchang, China, were analysed. In order to obtain a sufficient sample size for analysis of sugar compounds (anhydrosugars, primary sugars, and sugar alcohols), FAAs, and CAAs in one sample simultaneously, in this study, different filter samples were collected during the same sampling period as our previous study (Zhu et al., 2020b). Given the documented roles of specific sugars as tracers for BB and PBAP sources and the distribution of CAAs in primary sources, the variation pattern of the concentration and composition of specific CAA species predominant in local primary source and the corresponding sugar tracers were compared. The correlations of source-specific sugars with free amino acids (FAAs) and with major CAA species in local primary sources were evaluated (1) to character the concentration and composition profiles of sugar compounds, FAAs, and CAAs in urban, rural, and forest areas and (2) to obtain information on the type of biofuels, local vegetation types and the contribution of topsoil sources in different sampling areas.
2.1 Sample collection
PM2.5 samples were collected at three different areas (urban, rural, and forest areas) in Nanchang, China, from 30 April 2019 to 13 May 2019 (Fig. S1 in the Supplement). The sampling period in this study is 6 months before the outbreak of the COVID-19 pandemic. PM2.5 samples collected in this study are not pre- or post-epidemic samples. More details of sampling locations are available in the Supplement (Table S1). A total of 42 filter samples were collected daily with a duration of 23.5 h on prebaked quartz fibre filters (450 ∘C, 10 h) using high-volume air samplers (KC-1000, Qingdao Laoshan Electronic Instrument company, China) at a flow rate of 1.05±0.03 m3 min−1. Sampling was performed on the roof of buildings (15 m height) at each site. After the sampling, the filter was recovered into a pre-baked glass jar with a Teflon-lined screw cap, immediately placed in the freezer (the temperature is set to ), and then transported to the laboratory within 1 h and stored at before analysis, to prevent loss of semi-volatile/volatile organic compounds from the samples.
The field blank samples were collected using a modified method described by Chow et al. (2010). After being treated at 450 ∘C for 10 h, field blank filters were loaded into filter holders and accompanied the sampled filters to each sampling site. Field blanks accompanied sample shipments and were placed in the high-volume air samplers along with the sampled filters. The passive period for field blank filters was consistent with the samples. The only difference between samples and field blanks is that air is not drawn through field blanks. After the sampling, field blank filters were also recovered into filter holders and accompanied with the samples back to the laboratory. Three field blank samples were collected in this study, accounting for 7 % of total sample number.
2.2 Analysis of sugar concentrations
For sugar analysis, samples were prepared using a modified version of Fu et al. (2008). In brief, a filter aliquot (∼160 m3 of air) of each aerosol sample was extracted three times with dichloromethane / methanol () under ultrasonication for 10 min. The solvent extract was filtered through quartz wool packed in a Pasteur pipette and then dried with pure nitrogen gas. The dried extracts were reacted with 50 ml of N,O-bis-(trimethylsilyl) trifluoroacetamide (BSTFA) containing 1 % trimethylsilyl chloride (Sigma-Aldrich, St Louis, MO, USA) and 10 µl of pyridine (Sigma-Aldrich, St Louis, MO, USA) at 70∘ for 3 h. After the reaction, derivatives were diluted by the addition of 140 µl of n-hexane containing the internal standard (C13 n-alkane, 1.43 ng µl−1) prior to analysis by gas chromatography–mass spectrometry (GC-MS).
GC-MS analyses were performed on a Thermo Scientific TRACE GC instrument (Thermo Scientific, Bremen, Germany) connected to a Thermo Scientific ISQ QD single-quadrupole MS instrument. The GC separation was achieved on a DB-5MS fused silica capillary column (30 m ×0.25 mm i.d., 0.25 µm film thickness) with the same GC oven temperature programme: the temperature is held at 90∘ for 1 min, increased from 90 to 120∘ at a rate of 12∘ min−1, and then further increased from 120 to 285∘ at a rate of 6∘ min−1, with a final isotherm hold at 285∘ for 18 min. Helium was used as the carrier gas at a constant flow rate of 1.2 ml min−1. The temperatures of the GC injector and MS ion source were 280 and 250∘, respectively. The mass spectrometer was operated in the electron impact (EI) mode at 70 eV and scanned from 50 to 650 Da. The individual compounds (TMS derivatives) were identified by comparing mass spectra with those reported in the literature and library data and authentic standards (Medeiros and Simoneit, 2007). Compounds were quantified using total ion current (TIC) peak area of each authentic standard relative to that of internal standard (C13 n-alkane) and converted to compound mass using calibration curves of internal standards. In general, the obtained calibration curves show good linearity (R2>0.99) in the exploited range (Table S2). The field blank filters were also analysed by the procedure mentioned above in this section and then were run in parallel with the samples for all analyses in order to monitor significant background interferences (Urban et al., 2012). No signal different than that of the base line was obtained for any of the studied sugars. The concentrations of sugar reported here are corrected for the field blanks. The detailed method validation is provided in the Supplement.
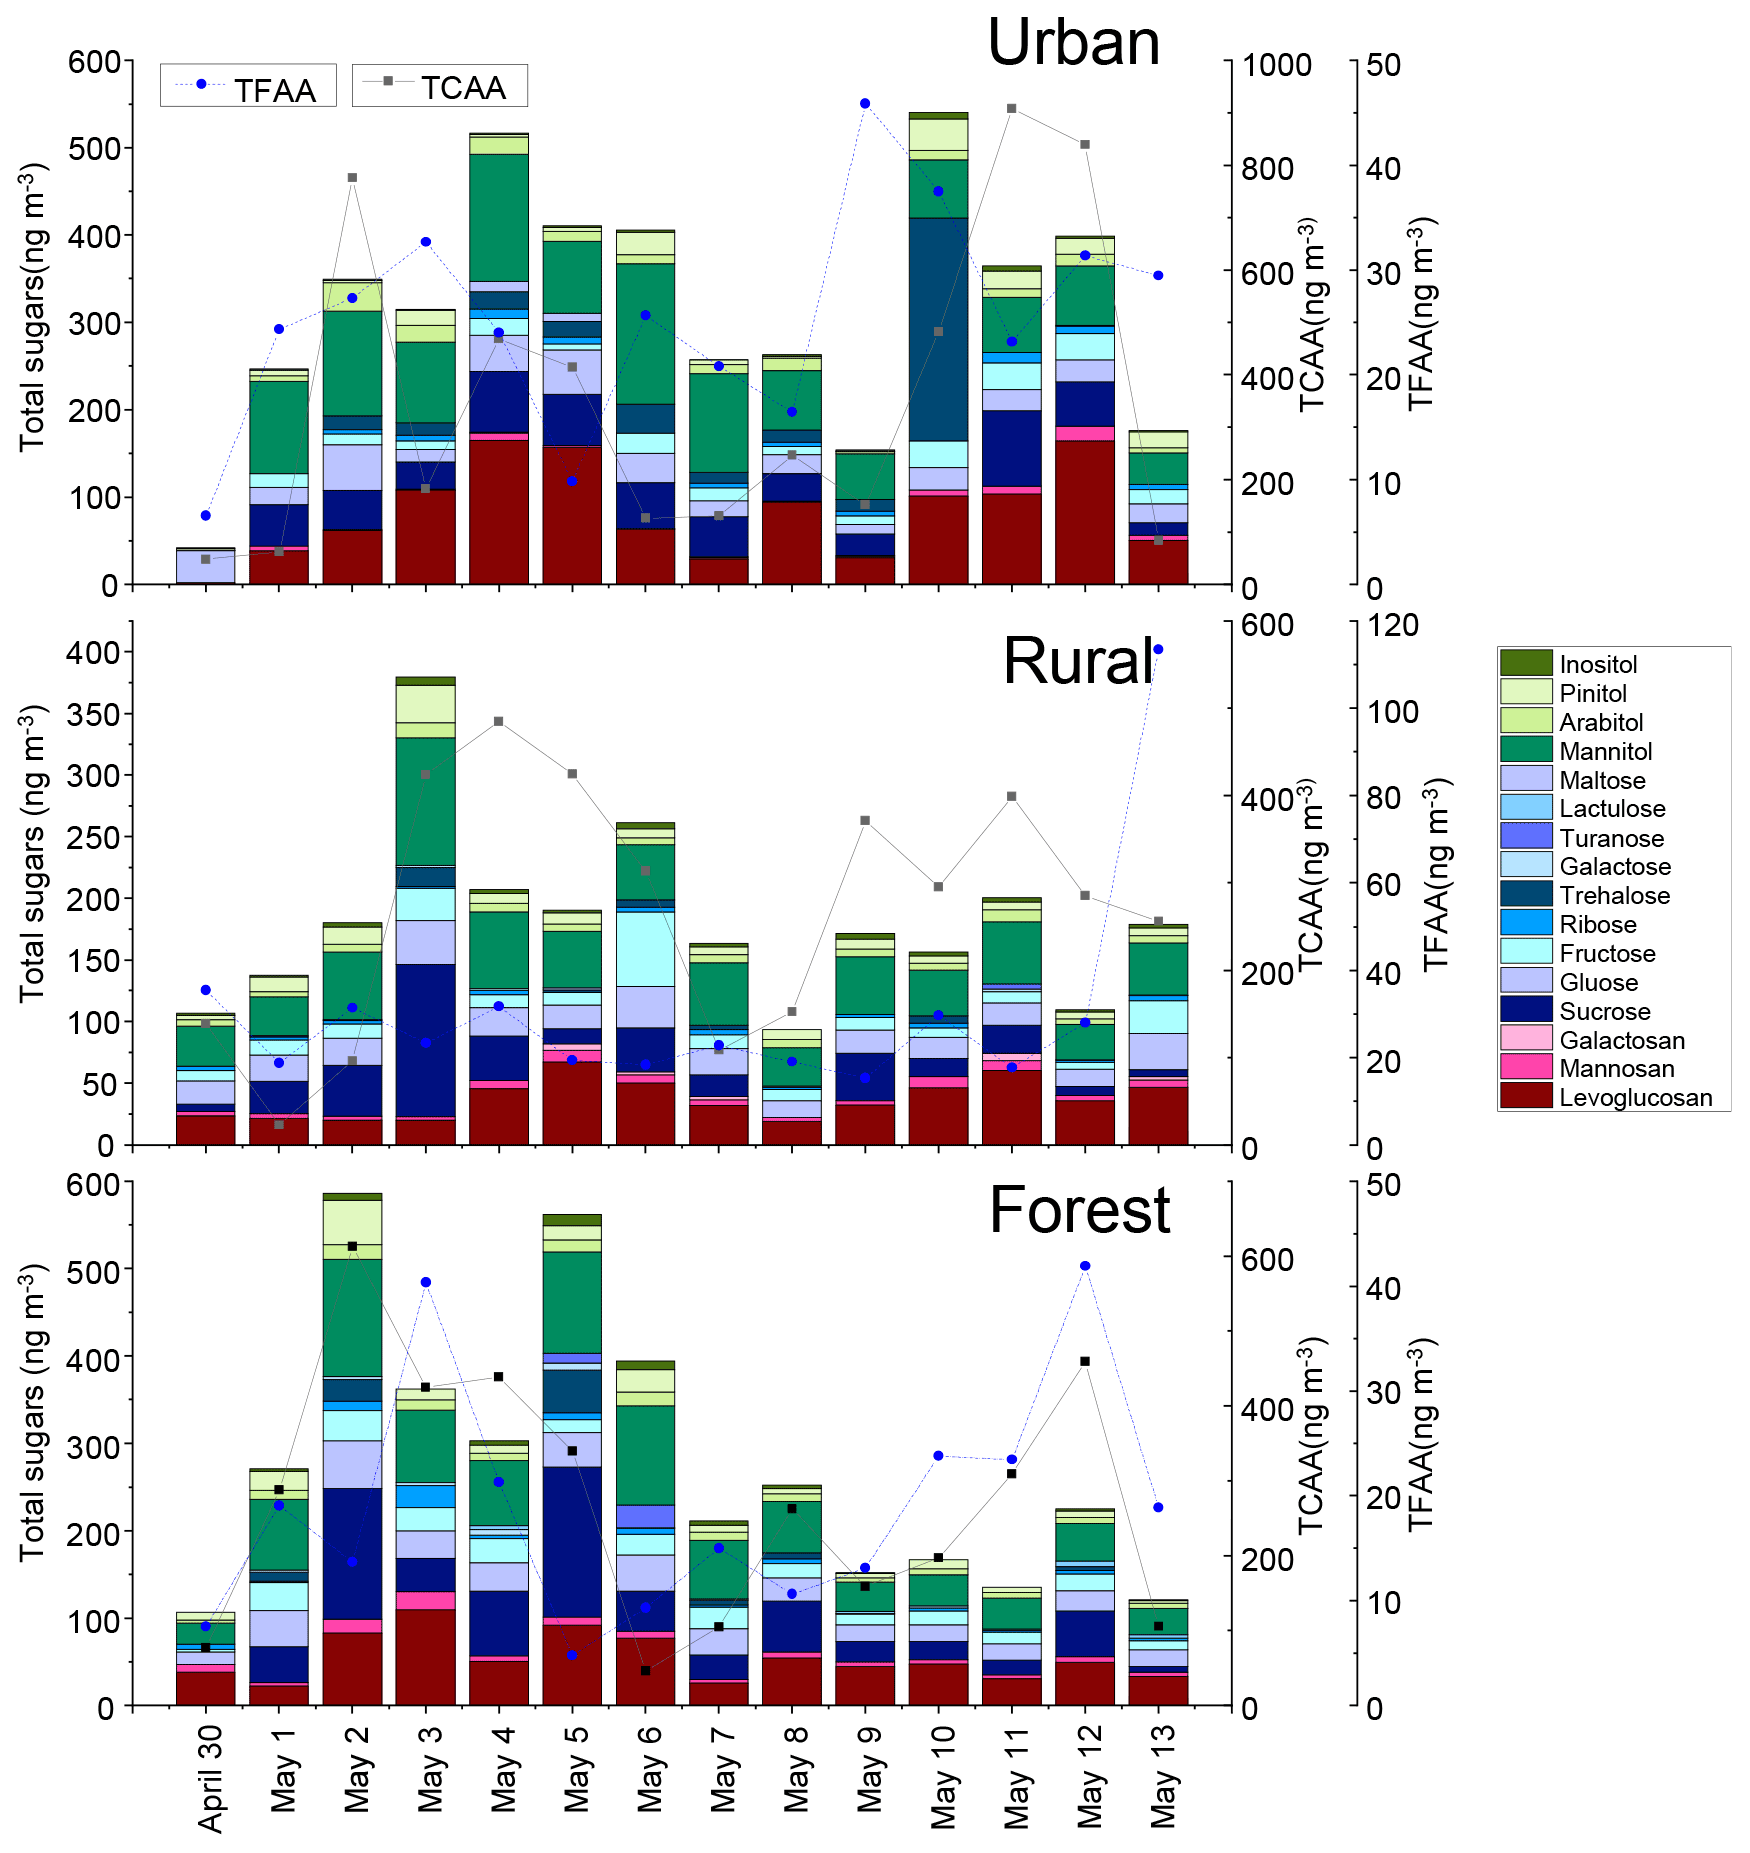
Figure 1Temporal variations in the concentrations of total sugars and total combined amino acids measured in PM2.5 samples collected at the urban, rural, and forest sites in Nanchang, China.
2.3 Analysis of FAA and CAA concentrations
The concentrations of FAAs and CAAs were prepared following the method described by our previous study and analysed by a gas chromatograph–mass spectrometer (Thermo Scientific, Bremen, Germany) (Zhu et al., 2020b). More details of the concentration analysis method are provided in the Supplement.
2.4 Analysis of water-soluble ions
Water-soluble ions (Na+, NH, K+, Mg2+, Ca2+, Cl−, NO3−, and SO) were measured by ion chromatography (Dionex Aquion (AQ)™, ICS-90, Thermo Scientific™, USA) (Guo et al., 2020). Briefly, one-eighth quartz filters were cut into pieces and transferred to a Nalgene tube. After adding 50 ml Milli-Q water, the tube was subject to ultrasonic vibration (30 min), shaking (30 min), and centrifugation (10 min). Then, the supernatant was filtered using a pinhole filter with a 0.22 µm microporous membrane. The extract was stored in a refrigerator at −20 ∘C for analyses. The anions (Cl−, NO, and SO) were determined by the ion chromatography system with an AS23 4×250 mm analytical column, while the cations (Na+, NH, K+, Mg2+, and Ca2+) were determined using the same IC system with a CS12A 4×250 mm column. A sample volume was 100 µl for both anion and cation analyses. Strict quality control was performed to avoid any possible contamination of the samples. In order to ensure the reliability of data, standard samples were re-measured every 20 samples. The standard solutions were bought from Merck, Germany. More details on quality assurance and control of water-soluble ions are available in the Supplement.
The mass concentrations of non-sea-salt K+ (nss-K+) and non-sea-salt Ca+ (nss-Ca+) were calculated based on the measured Na+ being assumed to be derived from sea salt as follows (Ren et al., 2018, and Zhang et al., 2018):

Figure 2Concentrations of anhydrosugars and combined Phe and Gly in urban, rural, and forest areas. The concentrations of anhydrosugars and CAAs for each sample were normalized for the total volume of air sampled.
2.5 Statistical analyses
Statistical analysis and graphs were mainly conducted by R (version 4.0.2) and Origin 2018 (OriginLab Corporation, USA). Shapiro–Wilk normality tests were performed. The concentrations of sugar compounds (anhydrosugars, primary sugars, and sugar alcohols), FAAs, and CAAs are normally distributed. Pearson's correlations were conducted to examine the relationship between the target sugar category and total free amino acids (TFAAs), between the target sugar category and total combined amino acids (TCAAs), between specific sugar tracers and individual CAAs, and between specific sugar tracers and individual FAAs. Significant differences in the sugar concentration among three sampling sites were tested using the one-way analysis of variance (ANOVA) procedure and compared using the least significant difference (LSD) test; differences were considered significant at the level of p<0.05.
3.1 Sugars in the urban, rural, and forest locations
3.1.1 Sugar concentrations in PM2.5
The temporal variations of total sugar concentrations in PM2.5 measured at the urban, rural, and forest locations during the sampling campaign were shown in Fig. 1. A total of 16 sugars (Σ sugars) were quantified in the atmospheric fine particulates. Average Σ sugar concentration measured in the urban, rural, and forest locations was , and 275 ±154 ng m−3, respectively. Urban locations had significantly higher average Σ sugar concentration than observed in rural locations (p<0.05), but the differences in average Σ sugar concentration between rural and forest locations are not significant (p>0.05) (Fig. S2).
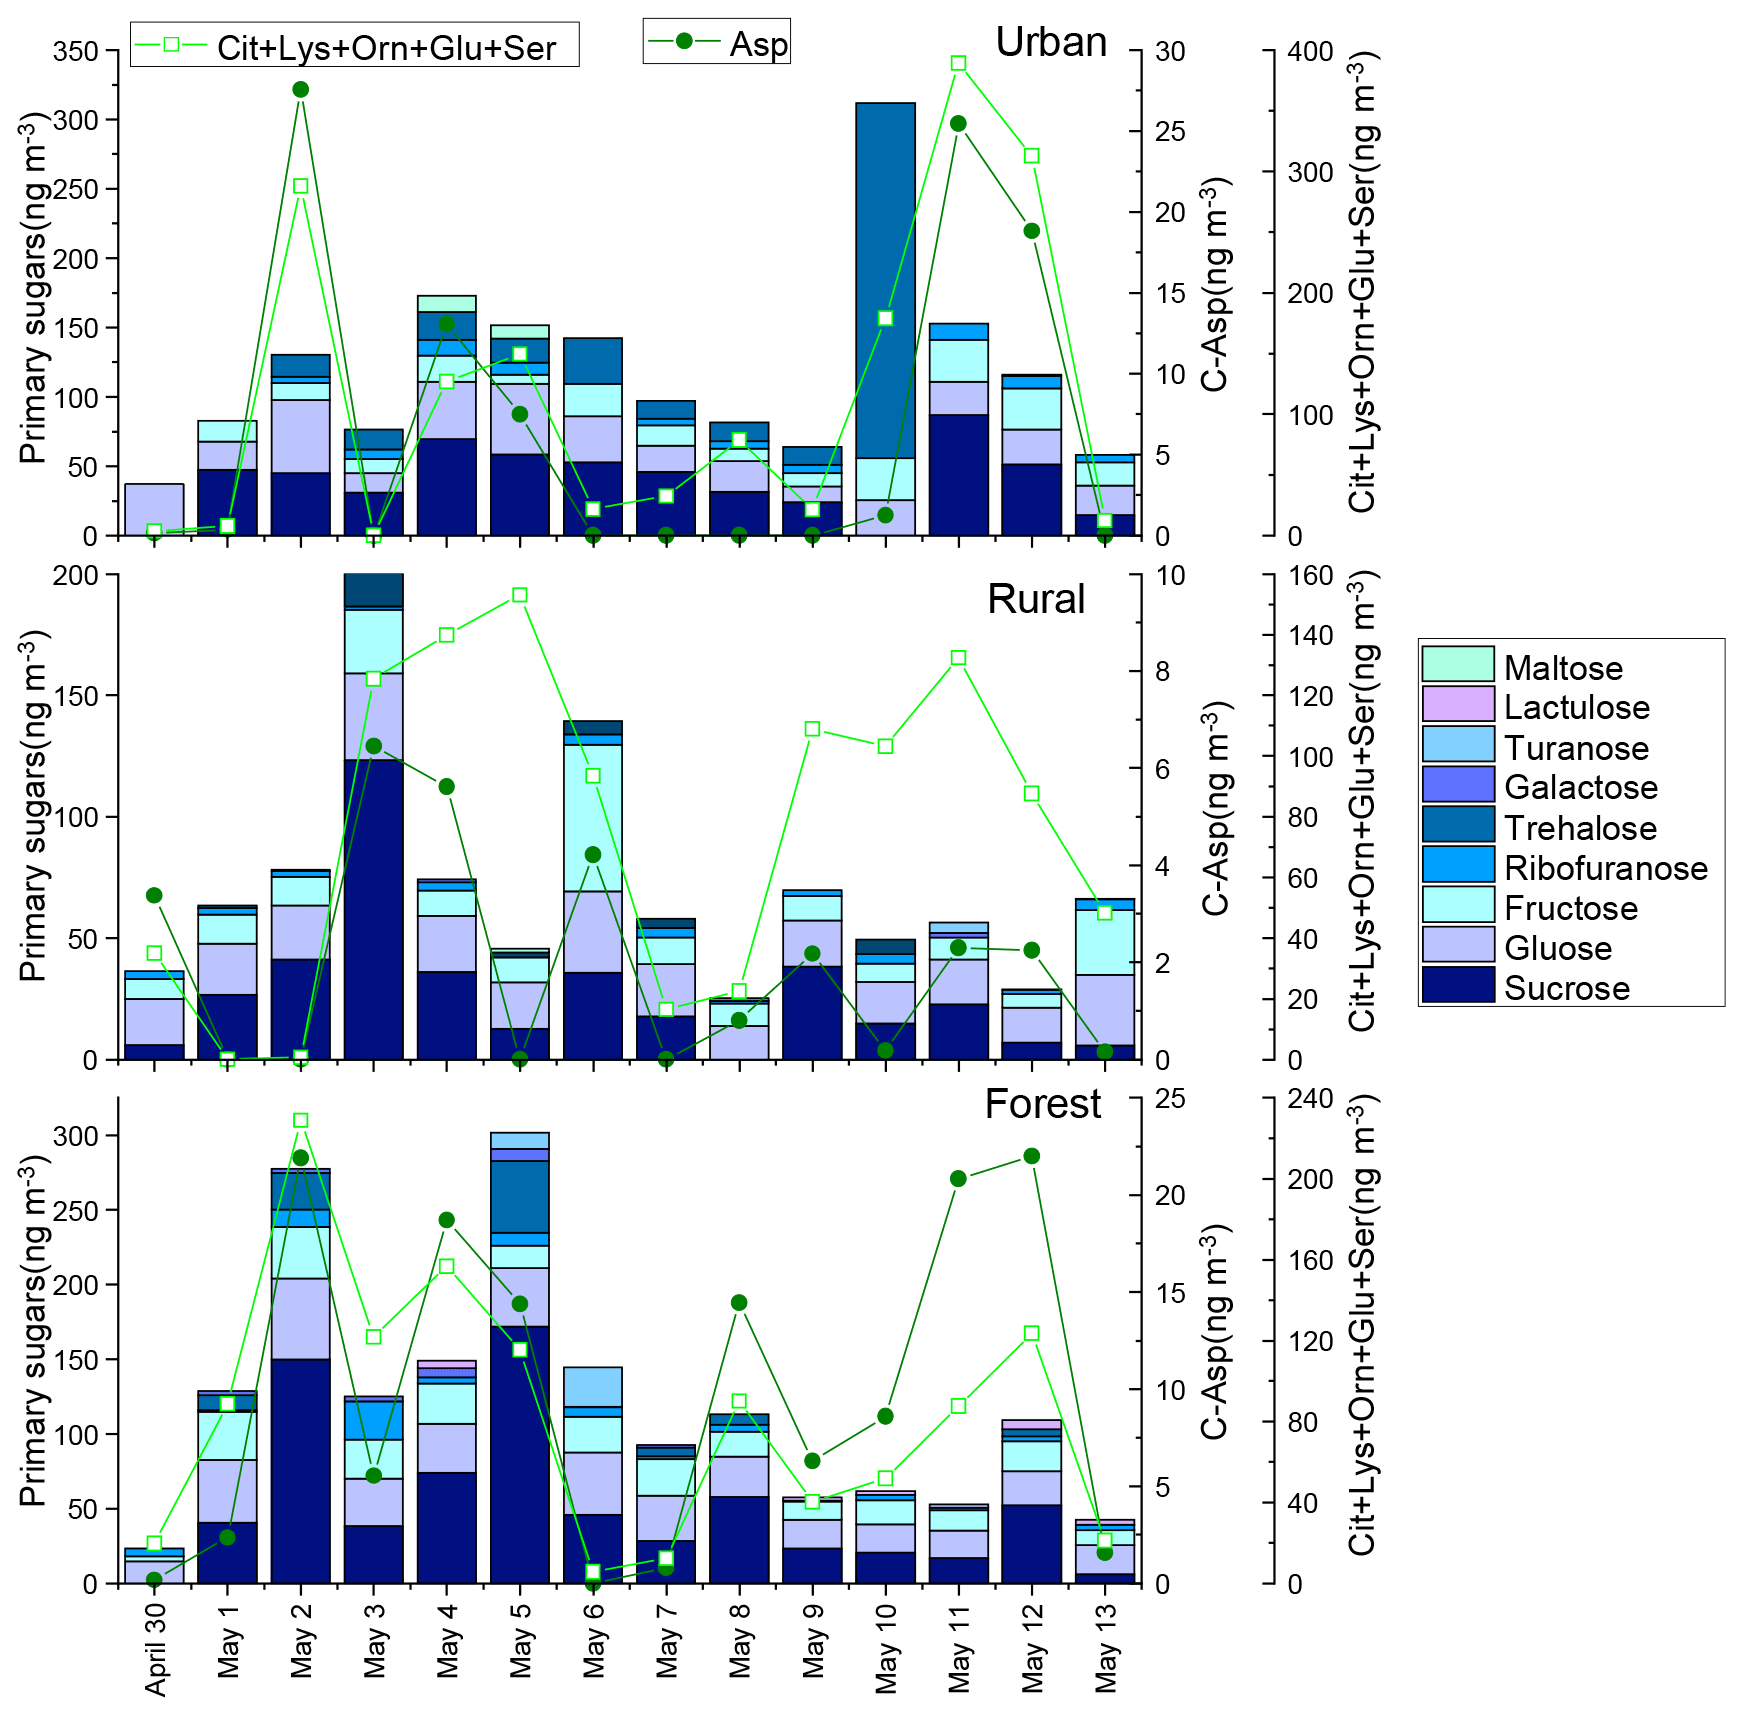
Figure 3Concentrations of primary saccharides and combined Asp and the sum of Cit, Lys, Orn, Glu, and Ser in urban, rural, and forest areas. The concentrations of primary saccharides and CAAs for each sample were normalized for the total volume of air sampled.
Three target sugar categories (anhydrosugars, primary sugars, and alcohol sugar) were compared between the three sampling locations. The average concentrations of anhydrosugars in the urban location (88±56 ng m−3) were higher than those in the rural (44±20 ng m−3) and forest locations (62±31 ng m−3) (Fig. S2). Similarly, the highest average concentration of levoglucosan, a good tracer of BB (Sheesley et al., 2003), was found in the urban location (83±53 ng m−3), followed by that in the rural (37±16 ng m−3) and forest locations (54±27 ng m−3) (Fig. 2), indicating enhanced biomass burning activities in the urban location.
Nine primary sugars (galactose, ribose, fructose, glucose, sucrose, maltose, turanose, lactulose, and trehalose) were measured in this study. The average concentration of total primary sugars measured in PM2.5 was comparable in the urban, rural, and forest location, with the averaged value of , and 120±82 ng m−3, respectively (Fig. 3). It is interesting to note that the average concentration of trehalose was higher in the urban location (28±66 ng m−3) than in the rural (2±4 ng m−3) and forest locations (7±14 ng m−3) (p<0.05) (Fig. S3). Trehalose has been reported to be the most abundant sugar in soils and is used as a tracer for the resuspension of surface soil and unpaved road dust (Fu et al., 2012; Medeiros et al., 2006). Thus, high levels of trehalose observed in the urban location indicate that soil resuspension and unpaved road dust are important sources in the urban location.
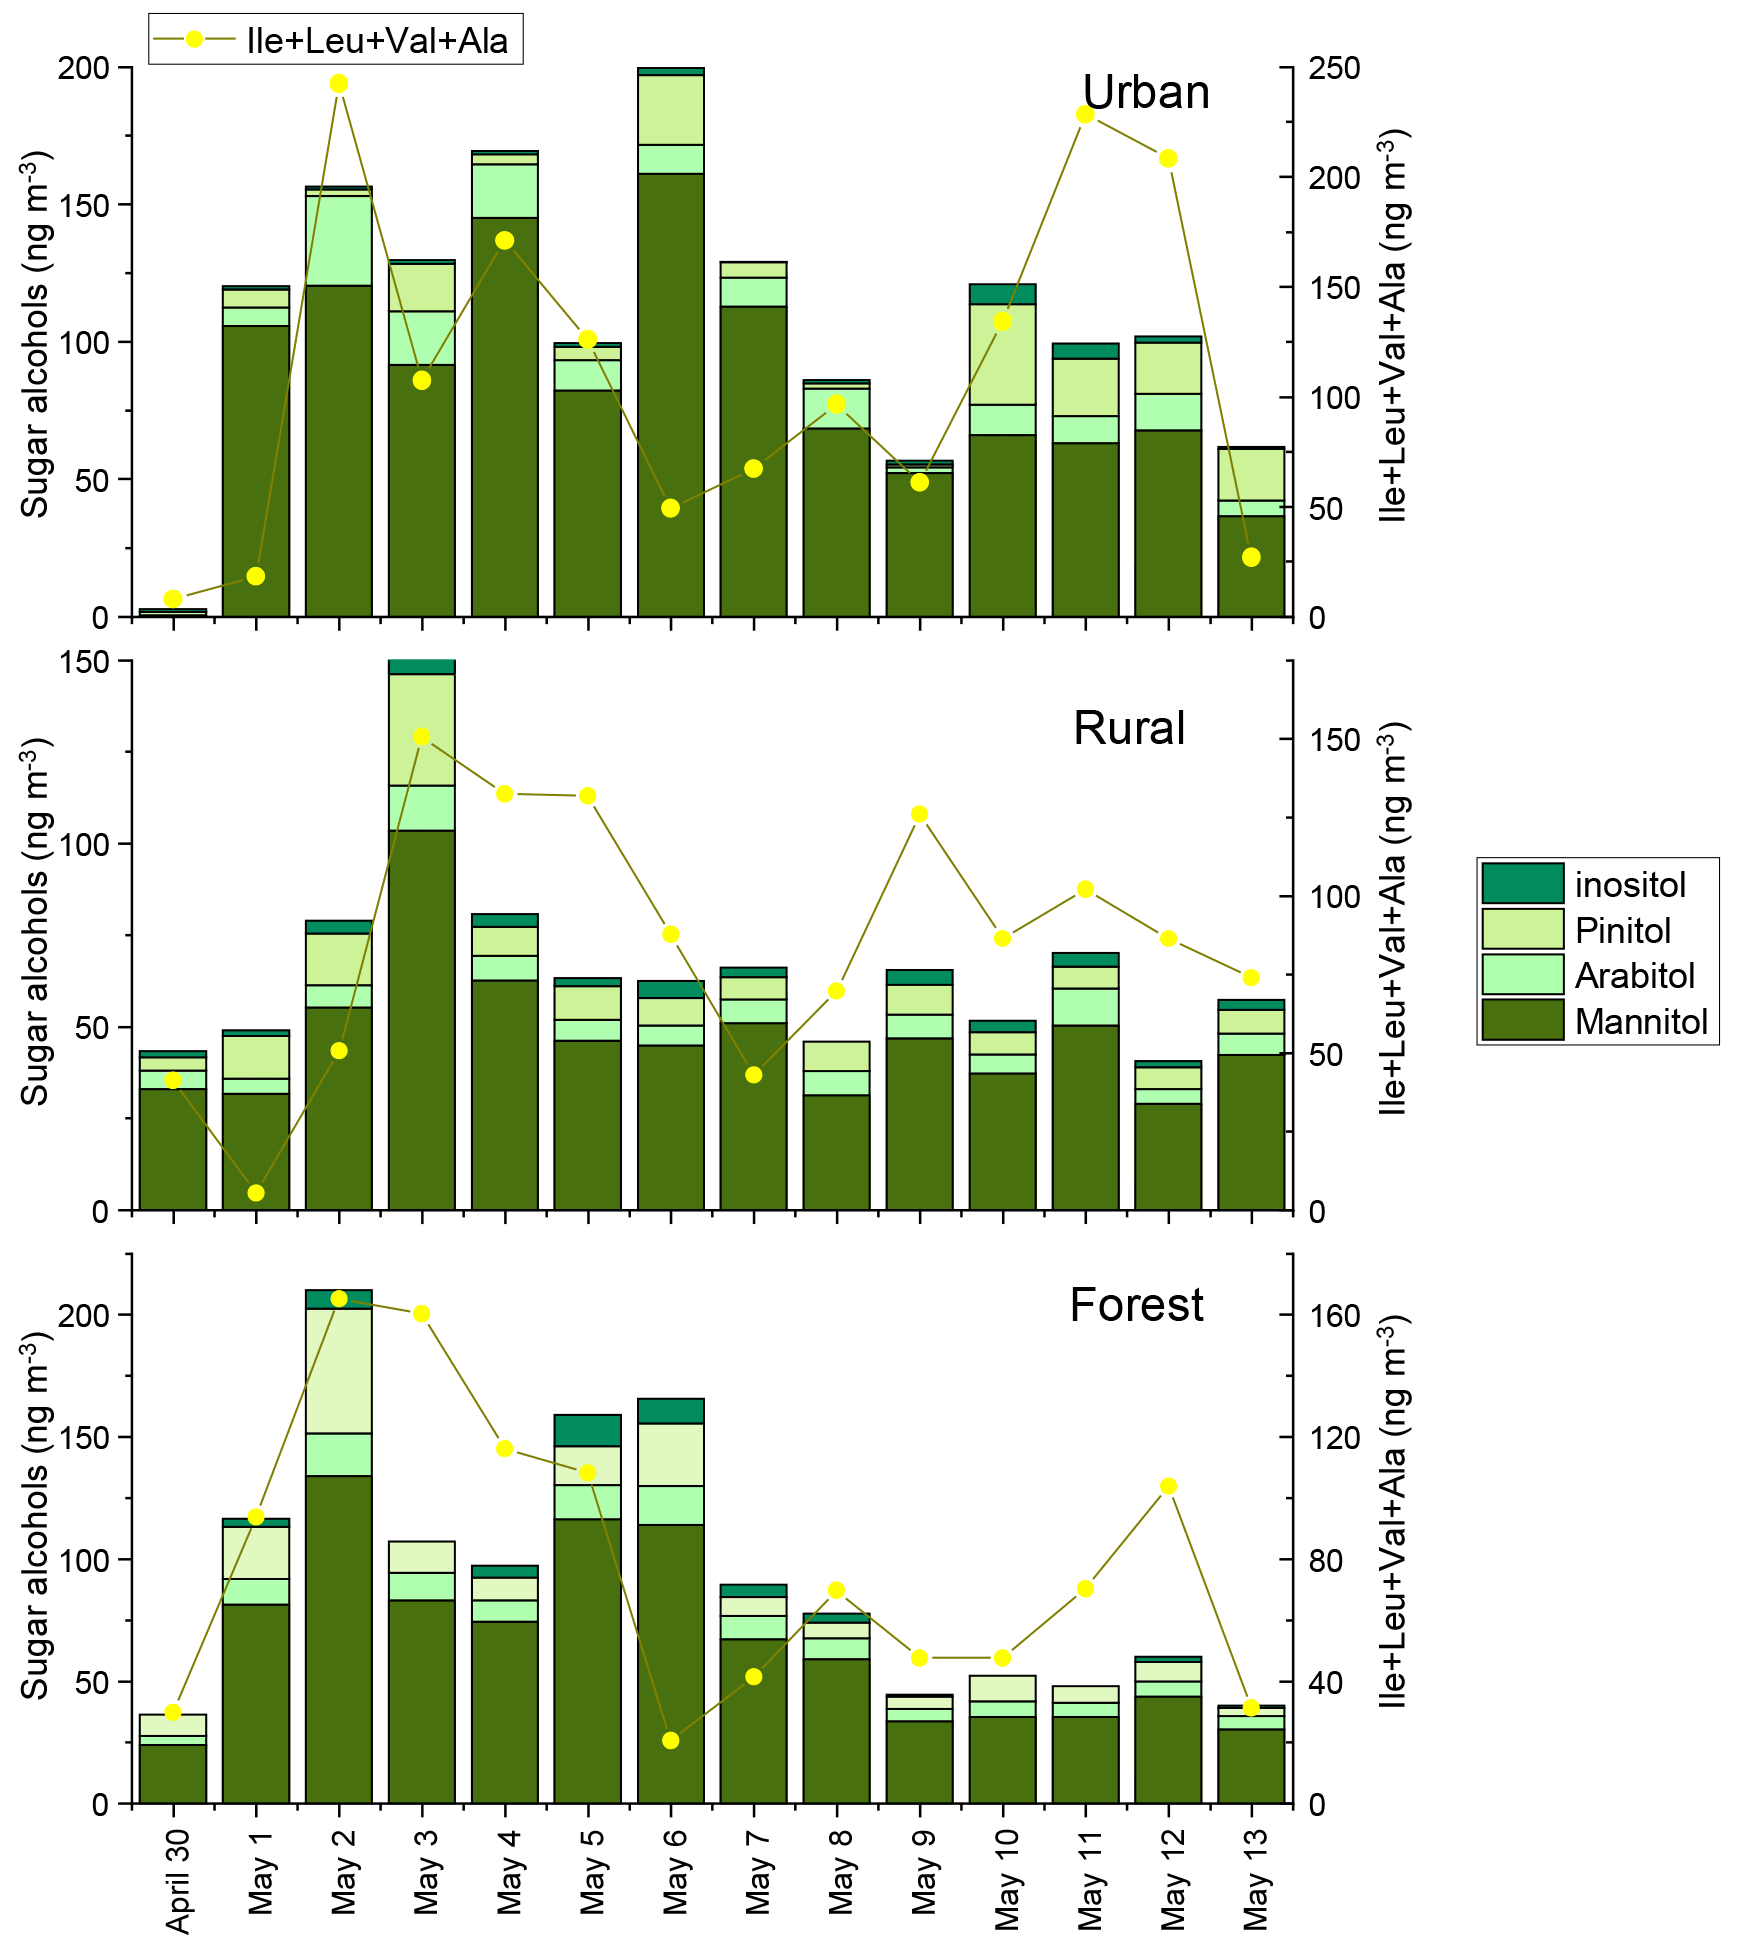
Figure 4Concentrations of sugar alcohols the sum of Ile, Leu, Val, and Ala in urban, rural, and forest areas. The concentrations of sugar alcohols for each sample were normalized for the total volume of air sampled.
We also determined four sugar alcohols, consisting of mannitol, arabitol, pinitol, and inositol. The concentrations of total sugar alcohols averaged , and 93±54 ng m−3 in the urban, rural, and forest locations, respectively (Fig. 4). Averages of the sum of mannitol and arabitol concentrations measured in the three sampling locations (75 ng m−3) were higher than those reported in the megacity of Beijing (21 ng m−3) (Kang et al., 2018) and the rural site of Lincang, China (21.5 ng m−3) (Wang et al., 2021). Since these sugar polyols are reported to be abundant in fungi, trees, branches, and leaves (Wang et al., 2021; Fu et al., 2008), the high abundance of mannitol and arabitol found in this study can be attributed largely to a biological origin.
The average Σ sugar concentrations measured in the three sampling locations were comparable to several previous studies, including those measured in urban Beijing, China (average: 200±100 ng m−3) (Yan et al., 2019), urban Hong Kong, China (292 ng m−3) (Wan and Yu, 2007), and Mangshan National Forest Park, China (325 ng m−3) (Verma et al., 2021) and lower than those observed in rural Linchang, China (638 ng m−3) (Wang et al., 2021) and rural Wangdu, China (487±567 ng m−3) (Yan et al., 2019) but much higher compared to those measured in a natural forest area in India (156 ng m−3) (Fu et al., 2010b) and Arctic aerosol (0.6±0.5 ng m−3) (Feltracco et al., 2020). In summary, the concentrations of aerosol sugars span a large range in a variety regions by different research groups, which may be caused by many factors, including PM2.5 concentration, the fraction of organic carbon in PM2.5, vegetation and BB activities, and anthropogenic activities (Jia et al., 2010; Verma et al., 2021). To further elucidate the differences in sugar levels in aerosols collected from different regions, source apportionment is necessary.
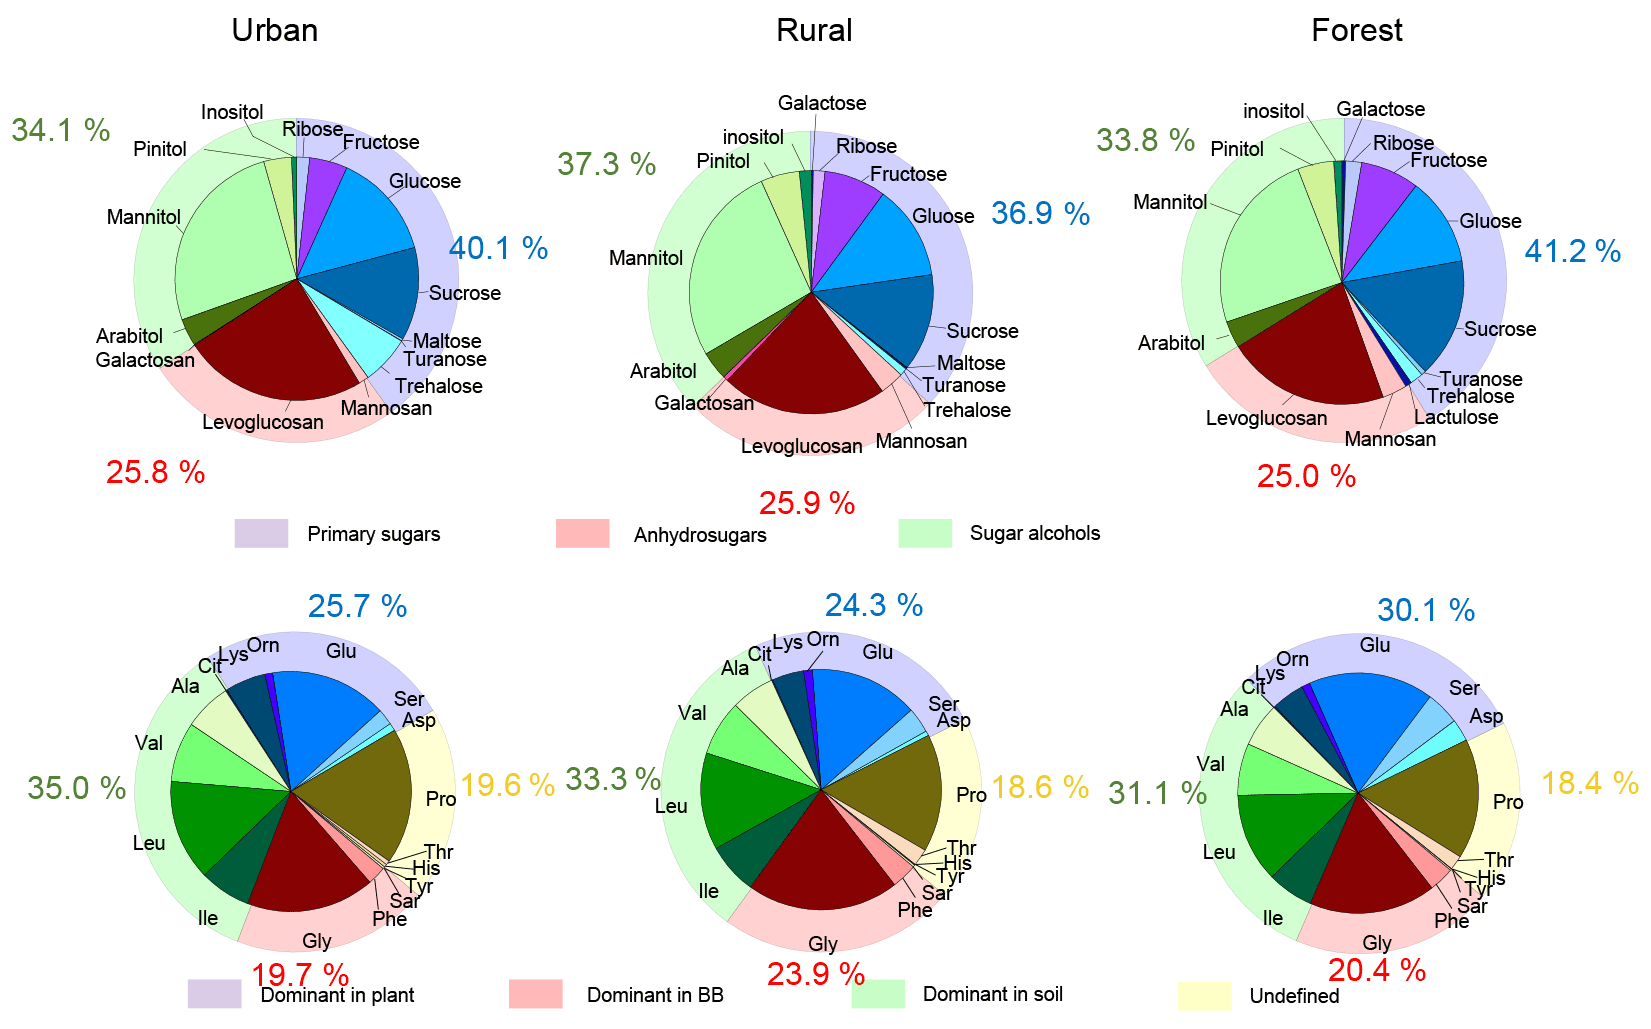
Figure 5Illustrations of the average contributions of individual species to total sugars and those of each CAA to total combined amino acids in urban, rural, and forest areas.
3.1.2 The composition of sugars in PM2.5
The distribution pattern of sugar compounds in PM2.5 was generally similar among the urban, rural, and forest locations (Fig. 5). The average contribution of anhydrosugars to total measured sugars in the urban, rural, and forest locations was 25.8 %, 25.9 %, and 25.0 %, respectively (Fig. 5). Levoglucosan was the most dominant species among anhydrosugars in all sampling locations (Fig. S4), accounting for 24.4 %, 22.0 %, and 21.7 % of the total sugar pool in PM2.5 in the urban, rural, and forest locations, respectively, indicating biomass burning is common in all locations. However, the average contribution of levoglucosan to the total measured sugars in all locations was lower than the aerosol samples sampled from other regions in China, such as Mount Tai (46.1±20.4 % of total sugars in the daytime versus 39.0±18.0 % in the night-time) and 14 cities in China (around 90 %) (Fu et al., 2008; Wang et al., 2006). This suggests that besides BB sources, other sources are also important sources for sugar compounds in PM2.5 in this study.
The contribution of primary sugars to total measured sugars measured at urban (40.1 %) and forest locations (41.2 %) was slightly higher than that in rural locations (36.9 %) (Fig. 5). Fructose, glucose, and sucrose were the dominant primary sugar species in the three sampling locations (Fig. S5). It is noted that PM2.5 sampled from the urban location had a larger contribution from trehalose (an average 6.5 % of the total sugars) compared to the rural (0.2 %) and forest (0.8 %) locations (Fig. 5). Since trehalose is proved to be the most abundant saccharide in soils, the higher fraction of trehalose in the total sugar pool in the urban location than that in the rural and forest locations may indicate that PM2.5 collected in the urban location may be more impacted by resuspension of surface soil or road dust outflow than the rural and forest locations (Simoneit et al., 2004; Medeiros et al., 2006; Rogge et al., 2007; Fu et al., 2012). This is further supported by the significantly higher average concentration of nss-Ca2+ observed at urban sites (1834.3 ng m−3) than at rural (1027.8 ng m−3) and forest (1130.7 ng m−3) sites. nss-Ca2+ is reported to be mainly derived from resuspended dust/soil in the ambient air (Barbaro et al., 2019; Rathnayake et al., 2016).
The average contribution of sugar alcohols to the total sugar pool in PM2.5 was also close in the urban (34.1 %), rural (37.2 %), and forest (33.8 %) locations (Fig. 5). Mannitol was the major sugar alcohol species in PM2.5 (Fig. S6), with an average contribution of 26.7 %, 26.1 %, and 24.4 % to the total sugar pool in the urban, rural, and forest locations, respectively. Primary sugars and sugar alcohols are reported to be generally abundant in several animals, vegetative debris, microorganisms, fungal spores, and pollen (Jaenicke, 2005; Jia et al., 2010). The large proportion of primary sugars and sugar alcohols observed in PM2.5 was collected from the three locations, further implying that ambient sugars in this study were greatly influenced by primary biological sources.
3.2 AAs in the urban, rural, and forest locations
3.2.1 Concentration of specific CAAs
As exhibited in Fig. 1, the temporal variation pattern of ambient total free amino acids (TFAAs) was different from that of Σ sugar concentrations in all locations. Therefore, the concentration and composition of FAAs will not be compared with sugar compounds in the following sections. In contrast, the temporal variation pattern of Σ sugar concentrations was consistent with that of TCAAs measured in the three locations during the sampling period (Fig. 1). Furthermore, the temporal variations in the concentrations of source-specific sugars (including anhydrosugars, primary sugars and sugar alcohols) were compared with those of some specific CAA species in PM2.5. CAA species were initially grouped by their correlation with source-specific sugars at three sampling sites (Fig. 6) and their abundance in local primary biological sources (Fig. S7).
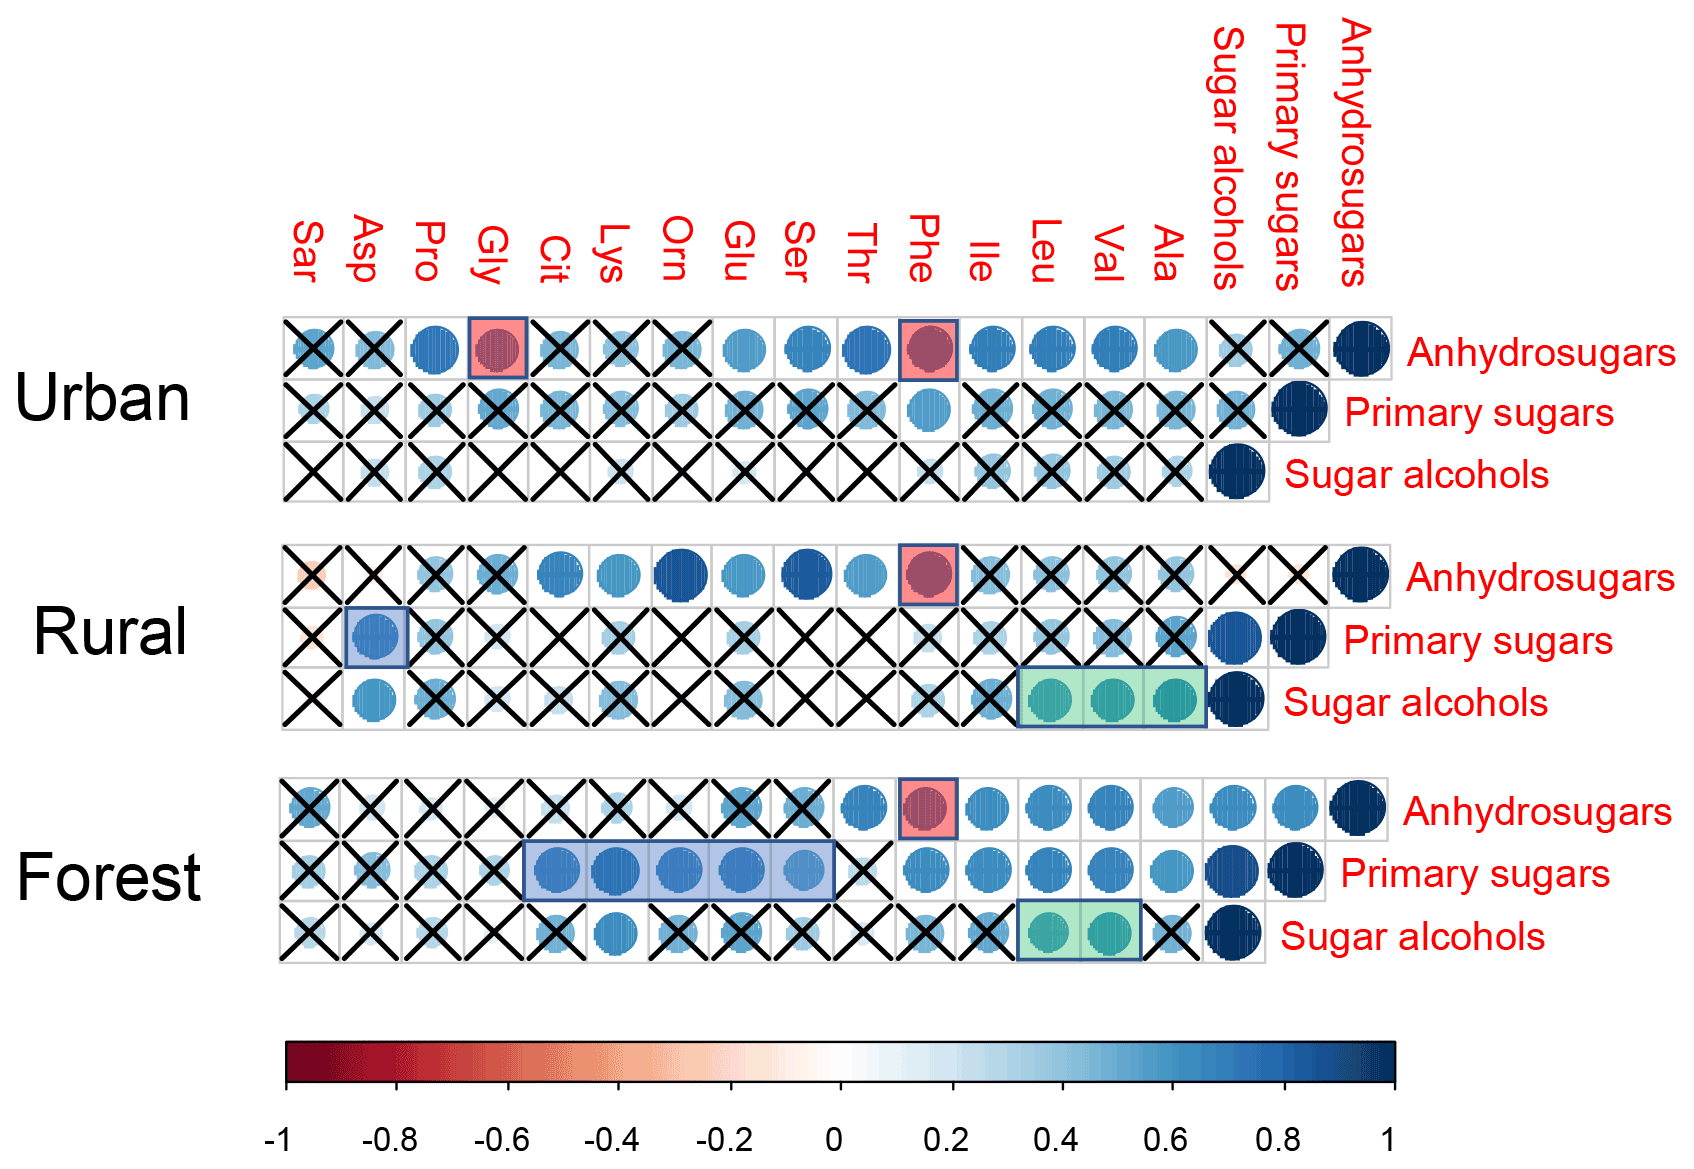
Figure 6Pearson's correlations between three target sugars (anhydrosugars, primary sugars, and sugar alcohols) and individual combined amino acids. The cross indicates a p value higher than 0.05. The ball indicates a p value less than 0.05. The larger a ball is, the more significant the correlation is.
In our previous study, the composition profiles of CAAs in the biomass burning (honeycomb briquette, pine, and straw burning), local soil, and plant sources (pine and straw) were investigated. Gly was found to be the predominant CAA in the aerosol from biomass burning sources, hydrophobic species (Ala, Val, Leu, and Ile) were the major CAA species in soil sources, and hydrophilic species (Glu, Lys, and Asp) were the abundant CAA species in plant sources (Zhu et al., 2020b). Based on this, temporal variation patterns between source-specific sugar markers and CAA species abundant in this specific primary biological source were compared. It is interesting to note that there were similar time variation patterns in the concentrations of anhydrosugars (BB tracer), combined Gly and Phe (Fig. 2). The temporal variation pattern of primary sugar (primary bioaerosol tracer) concentrations was similar to that of the Asp and the sum of combined Cit, Lys, Orn, Glu, and Ser (Fig. 3). Additionally, the time variation pattern of sugar alcohol (soil and associated biota tracer) concentrations was consistent with that of the sum of Ala, Val, Leu, and Ile concentrations (Fig. 4)
Since the composition profiles of aerosol CAAs highly depended on the composition profiles of CAAs in major emission sources (Abe et al., 2016), the CAA species predominant in this primary biological source may positively correlate with molecular markers of this emission source and exhibit a similar temporal variation pattern of the specific molecular marker. Therefore, according to the positive correlation between source-specific sugar markers and specific CAA species, and CAA species predominant in each local primary biological source, as well as the similar temporal variation patterns between source-specific sugars and specific CAA species (Fig. S8), ambient CAAs were finally divided into four groups: the first group includes Gly and Phe, which may be closely related to the BB source; the second group includes Ala, Val, Leu, and Ile, which are greatly impacted by soil source; the third group including Asp, Cit, Lys, Orn, Glu, and Ser, which is close with plant sources, and the other CAAs are classified into the fourth group (Fig. 5).
The sum of Phe and Gly concentrations (group 1) in PM2.5 averaged 58±46, 55±33, and 57±38 ng m−3 in the urban, rural, and forest locations, respectively (Fig. 2). Average concentrations of the sum of Ala, Val, Leu, and Ile (group 2) in urban, rural, and forested mosses were 110±75, 85±40, and 79±45 ng m−3, respectively, and average concentrations of the sum of Asp, Cit, Lys, Orn, Glu, and Ser (group 3) were 123±135, 78±53, and 93±68 ng m−3, respectively (Figs. 3 and 4). By comparing the concentration of CAAs in different groups, it can be found that the average of the sum of CAA concentrations in group 2 and group 3 is higher than that in group 1. This suggested that similar to sugar compounds, CAAs in PM2.5 collected from the three sampling locations were greatly impacted by plant and soil sources in addition to biomass burning sources.
3.2.2 Composition profiles of specific CAAs at the three sampling sites
To better understand the influence of primary sources on the composition profiles of sugar compounds and CAAs, the percentage of CAA species abundant in specific primary sources was compared with that of the corresponding sugar molecular markers. As discussed above, combined Gly and Phe are the predominant CAA species in the aerosols from BB sources, and they exhibited similar time variation patterns with molecular markers for BB sources (anhydrosugars). Therefore, their percentage were compared with the contribution of BB molecular marker to the total sugar compounds in three sampling sites. These two CAAs together accounted for an average of 19.7 %, 23.9 %, and 20.4 %, respectively, of the TCAA pool in PM2.5 collected from the urban, rural, and forest areas. It is interesting to note that the percentage of Gly and Phe in the total CAA pool was generally similar to the percentage of the anhydrosugars in total sugar compounds in PM2.5. Ala, Val, Leu, and Ile (abundant in local soil source) together contributed an average of 35.0 %, 33.3 %, and 31.1 %, respectively, to the TCAA pool in the urban, rural, and forest locations, which was also similar to the contribution of sugar alcohols to the total sugar compounds in the three locations. Furthermore, the average contribution of the combined CAA species in groups 3 and 4 to the TCAA pool was similar to the percentage of primary sugars to total sugar compounds in the three sampling locations (Fig. 5). It is likely that composition profiles of sugar compounds and CAAs in PM2.5 are mainly controlled by their primary sources.
3.3 Temporal variation of ambient sugar tracers and AAs
The temporal variations of sugar and AA compounds in the PM2.5 samples collected during the sampling periods were quite different at the three sites (Fig. 1). In the urban area, the total sugar concentrations showed two major peaks, one during 4–6 May and the other during 10–12 May. Anhydrosugars, the marker of BB sources, showed a similar trend, with the highest concentration occurring during 4–6 May and 10–12 May, suggesting that urban areas may be more influenced by BB sources. In the rural area, the temporal variations of the total sugar concentrations showed different patterns, with two major peaks on 3 and 6 May. On these 2 d, sugar alcohols and primary sugars exhibited the highest concentration, indicating a significant contribution from primary biogenic sources in the rural location. In the forest area, total sugars showed a concentration maximum on 2 and 5 May. The concentrations of sugar alcohols and primary sugars in the forest area showed similar trends to total sugars, with the highest concentration occurring on 2 and 5 May, implying that this area may be greatly influenced by primary biological sources.
Figure S8 presents the overall temporal variations of three classes of sugar compounds (anhydrosugars, primary sugars, and sugar alcohols) in PM2.5 collected at the three sampling sites. The temporal patterns of biomass burning tracers (anhydrosugars), primary bioaerosols tracers (primary saccharides), and surface soil and associated biota tracers (sugar alcohols) were similar in the forest area. In the rural area, the temporal variation of primary saccharides was similar to that of sugar alcohols, but it was not consistent with that of anhydrosugars. In contrast, anhydrosugars, primary sugars, and sugar alcohols showed different trends in the urban area. This further supported that the difference in the temporal variations of sugar compounds in PM2.5 may point to the contribution of sources along the sampling period. The sugar compounds in PM2.5 collected in the urban area might be more influenced by combustion sources, whereas ambient sugars in the forest area may be more influenced by primary biogenic sources.
The covariation of TCAA concentration with total sugar concentration was found in the three sampling areas. On the contrary, the temporal variations of TFAA concentrations showed different patterns from total sugar concentrations. This suggests that CAA may have similar sources and atmospheric processes to sugar compounds in PM2.5, whereas FAA may have different sources and atmospheric processes to them, which will be discussed further in the following section.
3.4 Comparative behaviour of sugars and AAs in aerosols
3.4.1 Implications of formation pathways and atmospheric processes of ambient sugars and AAs
Pearson's correlation coefficients were performed based on sugar and AA concentrations in PM2.5 samples aggregated by sampling sites, and the results are shown in Fig. 7. It is interesting to note that no correlation was observed between total free amino acids (TFAA) and the other individual measured sugar and total sugars in the three sampling locations (Fig. 7a, yellow shadow). This could be explained by the formation pathways and atmospheric processes of aerosol FAAs and sugars. The fact that secondary processes are an important formation pathway of FAAs in the atmosphere has been corroborated by many studies (Wang et al., 2019; Xu et al., 2020b). Both laboratory simulations and field measurements demonstrated that the oxidation of proteins and peptides with hydroxyl radicals (⋅OH) and O3 can release FAAs (Liu et al., 2017; Mcgregor and Anastasio, 2001; Song et al., 2017). On the other hand, sugar compounds are suggested to be atmospheric primary organic aerosol, which is directly emitted from sources such as plant material, soil dust, microorganisms, and BB and then aerosolized (Fröhlich-Nowoisky et al., 2016; Joung et al., 2017). Moreover, compared to FAAs, sugars are not derived from secondary photochemical processes in the atmosphere.

Figure 7(a) Pearson's correlations between TFAA and sugar species and between TCAAs and sugar species in PM2.5 collected in urban, rural, and forest sites. The cross indicates a p value higher than 0.05. The ball indicates a p value less than 0.05. The larger a ball is, the more significant the correlation is. (b) The range of δ15N for combined Gly in PM2.5 and major emission sources. The data of combined Gly are from Zhu et al. (2020b). Open circles represent the isotopic composition data of combined Gly.
To further investigate the correlation between ambient Σ sugar concentrations and FAAs, Pearson's correlation coefficients were calculated based on total sugar concentrations and individual FAA concentrations in PM2.5 aggregated by sampling locations, which are exhibited in Fig. S9. Generally, no correlation was recorded at the three sampling sites (Fig. S9). Only Gln, Cit, Phe, and Thr were weakly correlated with the concentration of total sugar concentrations in the forest location, and Glu exhibited a weak correlation with total sugar compounds in the rural location. These individual FAAs are known to be relatively highly reactive, with short half-lives in the atmosphere (Mcgregor and Anastasio, 2001). It is likely that these individual reactive FAAs are directly emitted from biological sources rather than secondary processes. Accordingly, we infer that there are differences in the formation pathways and atmospheric processes of sugars and FAAs in fine particles.
On the contrary, significant correlations at 95 % confidence level were found between TCAAs and total sugars () at each sampling site in this study (Fig. 7a). Although the relationship between CAAs and sugars in the atmosphere has not been directly analysed, their sources have been explored in previous studies. For instance, Feltracco et al. (2019) investigated the possible sources of AAs in Arctic aerosol and proved FAAs and CAAs in aerosols might have different sources. They suggest that similar to aerosol sugars, ambient CAA derive from PBAPs, including viruses, algae, fungi, bacteria, protozoa, spores and pollen, fragments of plants and insects, and epithelial cells of animals and humans. Previous studies also demonstrated that unlike FAAs greatly influenced by atmospheric processes, composition profiles of aerosol CAAs are highly dependent on the origin of CAAs, and they have been used to trace emission sources including primary biological sources and BB sources (Abe et al., 2016; Zhu et al., 2020b). Thus, significant correlations between TCAAs and total sugars in aerosols found in this study further corroborate that they may have common sources and are less impacted by atmospheric photochemical processes.
3.4.2 Evaluate the contribution of primary emission sources in different locations
Sugars in the atmosphere have been demonstrated to be derived from numerous sources. Three target sugar categories (anhydrosugars, primary sugars, and sugar alcohols) can be used as tracers for specific source information (Simoneit, 2002; Simoneit et al., 2004). Anhydrosugars (including levoglucosan, mannosan, and galactosan), generated by the thermal decomposition of cellulose and hemicellulose, are regarded as the specific markers for BB in the atmosphere (Simoneit et al., 2004; Zangrando et al., 2016). In this study, TCAAs were found to be positively correlated with anhydrosugars at the urban and rural locations, whereas no correlation between TCAAs and anhydrosugars was observed in the forest location (Fig. 7a, red shadow), indicating that the urban and rural areas were more influenced by BB sources compared to the forest area. These conclusions were also corroborated by the δ15N signatures of combined Gly (δ15NC−Gly) in PM2.5 measured at these three sites. Our previous study found that more positive δ15NC−Gly values were observed in PM2.5 at the urban (average ) and the rural (average ) site than the forest site (average ) (Zhu et al., 2020b) (Fig. 7b). According to the δ15N inventories of emission sources of atmospheric combined Gly, the urban location was highly influenced by combustion sources, followed by the rural location, while the forest location was more affected by natural sources.
Primary sugars are reported to be derived from microorganisms, plants, animals, lichens, and bacteria and have been considered to be good tracers for PBAPs (Fu et al., 2013; Zangrando et al., 2016). Particularly, sucrose and fructose are predominantly produced from plant fragments (e.g., bark, pollen grain, flowers buds, fruit, and leaves) and soil dust (Fu et al., 2012; Xu et al., 2020a). In this study, TCAAs only exhibited positive correlation with primary sugars (fructose and sucrose) in the forest location (Fig. 7a, purple shadow), pointing to aerosols in the forest area being mainly influenced by intensive biological activities and vegetation growth during sampling period. Previous studies mentioned that increased biological activities and active vegetation such as developing flower buds in the spring can emit abundant primary sugars into the air (Jia et al., 2010). Hence, the sampling period (spring) of this study and intensive biological sources in the forest location may explain the positive correlation between TCAAs and primary sugars in the forest area.
Sugar alcohols primarily come from fungal spores, bacteria, plants, algae, and detritus of mature leaves (Bauer et al., 2008; Feltracco et al., 2020). Xu et al. (2020a) suggest that in spring mannitol and arabitol may be closely related to the activities of the terrestrial biosphere. When comparing the correlation results of sugars classes between sites, it is important to note that the correlation of primary sugars with sugar alcohols varied at different sampling sites (Fig. 7a, green shadow). More species of primary sugars and sugar alcohols in PM2.5 were positively correlated at the rural and forest sites (p<0.05) compared to the urban site. Moreover, a stronger correlation between primary sugars and sugar alcohols was observed for PM2.5 samples collected from the rural and forest sites than that at the urban site. This may imply that the impact from local biogenic sources at the rural and forest sites was greater than that at the urban site, which is also supported by the temporal patterns of anhydrosugars, primary sugars, and alcohol sugar at the three sites (Fig. S8). We can thus conclude that the influence of primary biogenic and BB sources on aerosols in different locations can be evaluated by the correlations between TCAAs and source-specific sugar tracers (anhydrosugars, primary sugars, and sugar alcohols).
3.4.3 Identify burning tissues, local vegetation classes, and soil-related biological sources
Pearson's correlation test was also calculated for the dataset containing ambient concentrations of sugar compounds and individual CAAs in PM2.5 collected at three sites, which are exhibited in Fig. 6. In the urban location, the concentrations of anhydrosugars showed a positive correlation with those of combined Gly, but no correlation was found between these two compounds in the other two locations. As we discussed above, combined Gly is a major CAA species in honeycomb briquette, pine, and straw burning aerosols. Therefore, anhydrosugars and combined Gly are both closely related to biomass burning sources. A possible explanation for the positive correlation found between these two BB tracers is that the urban region is mainly affected by local combustion sources, while rural and forest regions may be more influenced by BB source from long-transport.
Significant positive correlations of anhydrosugars with Phe were observed simultaneously in the urban (), rural (), and forest () locations, serving as statistical support for a common source for the combined Phe and anhydrosugars in aerosols (Fig. 6). Previous studies indicate that the amino acid Phe is not only used as a vital constituent of proteins, but also as a critical metabolic node that plays an essential role in lignin biosynthesis in vascular plants (Bonawitz and Chapple, 2010; Wallace and Fry, 1994). It is estimated that nearly 30 %–45 % of photosynthetically fixed carbon is channelled through Phe for the biosynthesis of lignin during wood formation (Pascual et al., 2016). In addition, the vascular plant cell wall is a heterogeneous natural nanocomposite of cellulose, hemicelluloses, and lignin (Agarwal, 2006; Jin et al., 2017). Lignin, the second most abundant polymer in plants, is deposited in the secondary wall, which is cross-linked to the structural polysugars, such as hemicellulose and cellulose, found there (Bonawitz and Chapple, 2010; Wallace and Fry, 1994). During the combustion processes of the plant cell wall, the thermal breakdown of lignin takes place, along with cellulose/hemicellulose. Therefore, the combustion of the plant cell wall may explain the observed concentration coupling between combined Phe and anhydrosugars.
In this study, primary sugars were found to be highly correlated with combined Asp in PM2.5 samples collected in the rural location, but primary sugars were correlated with combine Glu, Lys, Orn, Cit, and Ser in the forest location (Fig. 6, blue shadow), which is consistent with the temporal variation pattern of primary sugars and these CAA species (Fig. 3). This may be attributed to the difference vegetation types in these two regions. The rural site is a typical agricultural area, where grasses and crops are the main vegetation classes. Asp is reported to be the most abundant free and combined amino acid in Gramineae (Barnett and Naylor, 1966) (Burkholder et al., 1959; Wilson and Tilley, 1965). On the other hand, conifers dominate ecosystems at the forest site. In particular, hydrophilic species (Glu, Lys, Orn, and Ser) have been shown to be the predominant CAA species in pine needles (Zhu et al., 2020b). Hence, the correlation between primary sugars (primary bioaerosols tracers) and specific CAAs may be used to track the predominant local vegetation types.
Consistent correlations were observed between sugar alcohols and combined Ala, Val, and Leu at the rural and forest sites (Fig. 6, green shadow), pointing to the significant contribution of biological sources associated with surface soil to aerosols at these two sites (Simoneit et al., 2004; Fu et al., 2013; Moura et al., 2013; Zhu et al., 2020b). As mentioned above, sugar alcohols indicate that soil and associated biota contribute to ambient aerosols through resuspension by wind erosion or agricultural activities (Fu et al., 2013, 2010a). Similarly, Friedel and Scheller (2002) showed that Ala, Val, and Leu were the main hydrolysable amino acid species in soil organic matter and soil microbial biomass. Grass land environments are characterized by higher content of Ala, Asp, and Leu (Moura et al., 2013). Our previous studies also demonstrated that hydrophobic Ala, Val, Leu, and Ile were the major CAA species in local crop soil (Zhu et al., 2020b). Conversely, primary sugars and sugar alcohols exerted no correlation with individual CAA at the urban site except for Phe, further supporting that aerosols at urban location are less influenced by biogenic sources than combustion sources. Thus, it can be concluded that the correlations between individual CAAs and target category sugars can provide insight into various source characteristics such as plant tissues used for combustion, local vegetation classes (based on the correlation of primary sugars with specific CAAs dominant in local plants), and soil-related biological sources vs combustion sources (based on the correlation of sugar alcohols with specific CAAs dominant in soil source).
3.5 Identify classes of combustion sources
Levoglucosan has been frequently used as a tracer for biomass burning and is produced from the pyrolytic decomposition of cellulose and hemicellulose or thermal stripping of sugar polyols during the combustion processes (Jia et al., 2010; Kang et al., 2018; Simoneit, 2002), but it could not distinguish different classes of biomass combustion sources. Detailed fingerprint tracers should be measured to get comprehensive information to identify different biomass burning types. To accurately qualify the BB source in different locations, nss-K+ has also been used as a typical tracer of BB in previous studies (Kunwar and Kawamura, 2014). However, previous studies also indicated that soil dust could be another source of water-soluble nss-K+ in aerosols (Urban et al., 2012, 2014; Wang et al., 2021). The nss-K+ concentrations averaged 633.1 ng m−3 in the urban area, which was higher than those observed in the rural (549.6 ng m−3) and forest (590.2 ng m−3) areas. Using levoglucosan as a representative BB tracer, the correlations between anhydrosugars and nss-K+ were further analysed at three sampling sites to investigate the contribution of BB sources at each site (Table S3). The nss-K+ showed a statistically significant linear correlation with levoglucosan in the urban location (r), whereas no correlation between levoglucosan and nss-K+ was observed in the rural and forest locations (Table S3). This may suggest the rural and forest areas were more impacted by the other sources of nss-K+, such as soil resuspension and fertilizers, while the urban area was more influenced by BB sources. This conclusion can also be confirmed by the fact that the stronger positive correlations between TCAAs and anhydrosugars and between combined Gly and anhydrosugars were observed in the urban area compared to rural and forest areas. Most positive δ15NC−Gly values were observed in the urban location. In addition, a different temporal variation pattern of anhydrosugars from that of primary sugars and sugar alcohols was only found in the urban area.
The average ratio of levoglucosan to potassium () in urban areas was 0.07 given by the slope of the linear regression equation, which is close to the value of aerosols collected from the rural areas of the state of São Paulo, Brazil (average =0.08), which is strongly influenced by the burning of sugar cane (Urban et al., 2012). Furthermore, the ratios observed in this study are also comparable with the ratio (0.05) found in Beijing, China, during the typical summer period, which was characteristic of the combustion of crop residuals (Cheng et al., 2013). However, this value was lower than that for aerosol samples collected in the Amazon (average =1.01) and in Austria (0.22 to 1.7). The sources of these two sites were proved to be attributed mainly to wood burning (Urban et al., 2012). The ratio of was used to characterize the type of biomass burned (Wang et al., 2021). Cheng et al. (2013) found that the levoglucosan to K+ ratio in emissions from the combustion of crop residuals was below 1.0, which is much lower than the ratio for hardwood burning (average ) and softwood burning (average ). Therefore, the contribution of wood burning was negligible for the biomass burning aerosol in the urban area. However, using the ratio to identify the type of combustion source is severely limited in the presence of potassium derived from non-biomass-burning sources (Urban et al., 2012). Therefore, biomass combustion sources in the rural and forest locations cannot be distinguished by the ratio.
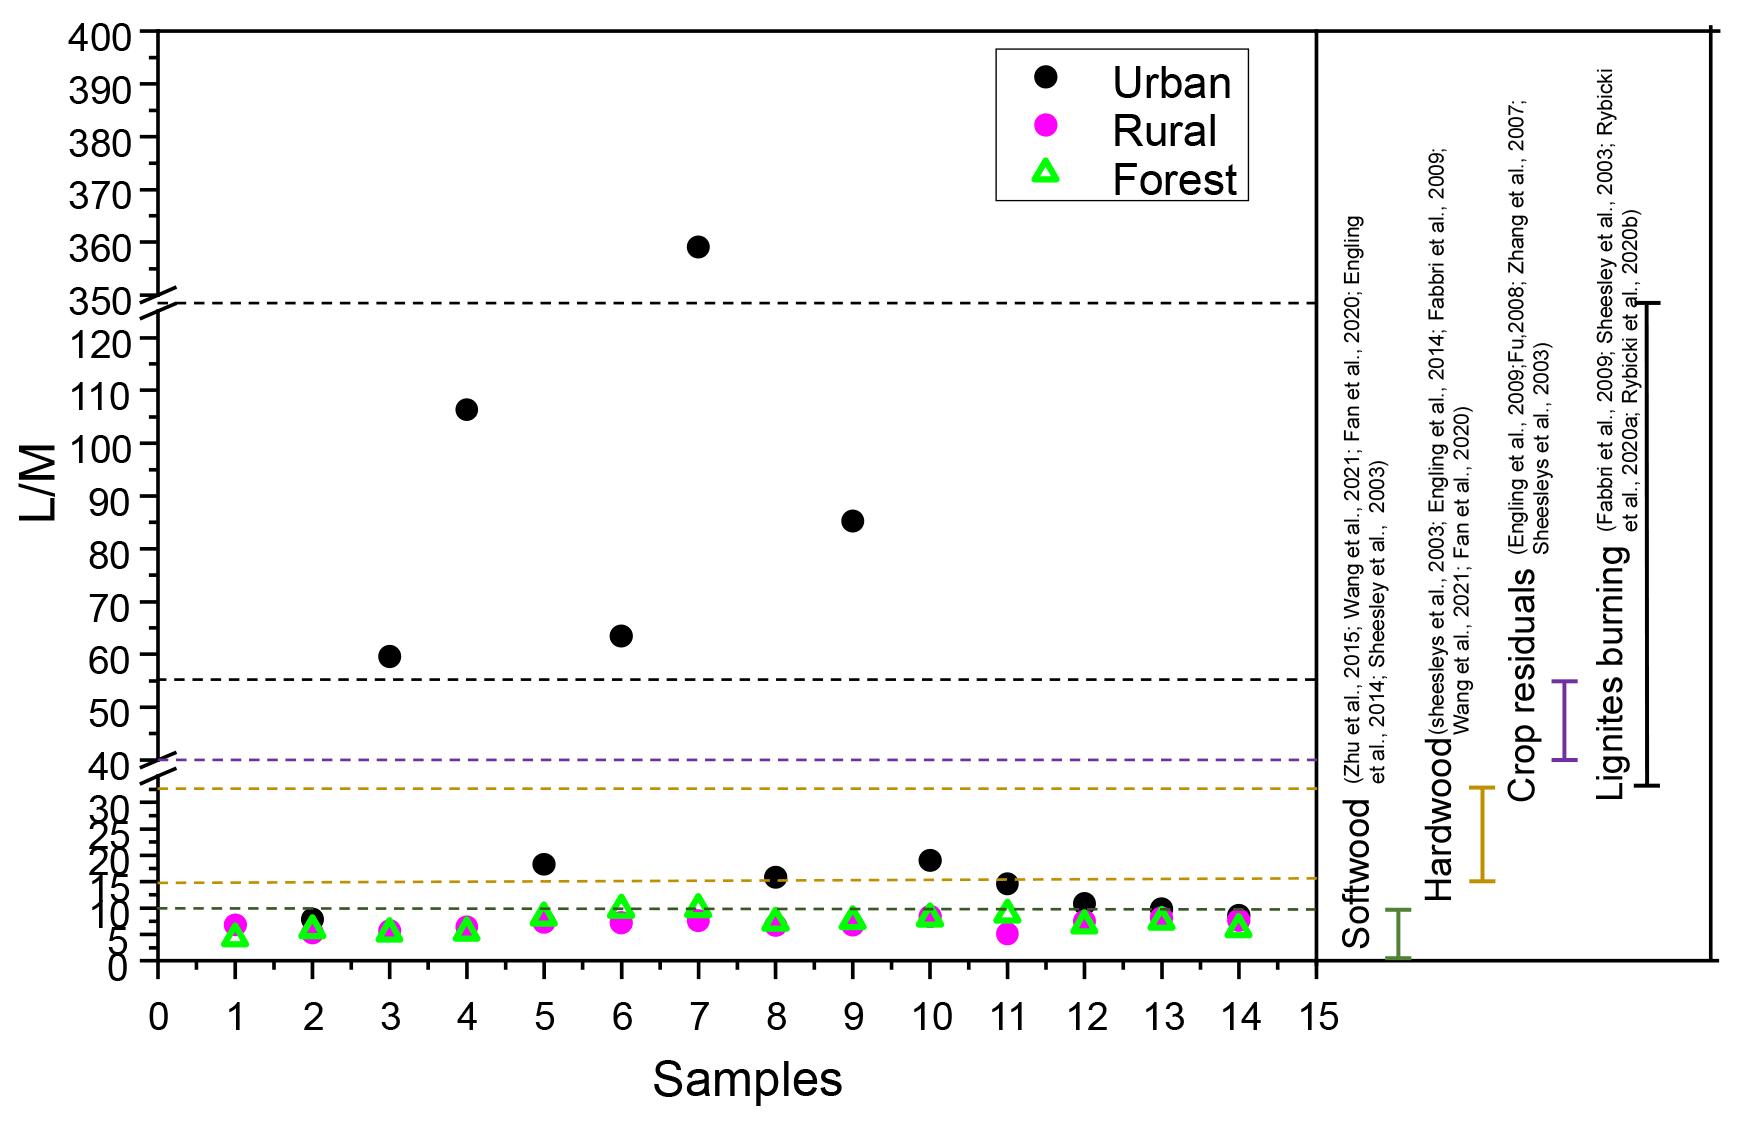
Figure 8Ratios of levoglucosan to mannosan in PM2.5 and source test emissions from softwood, hardwood, crop residuals, and lignite burning.
Levoglucosan / mannosan () ratios have been employed to identify specific burning substrates in numerous studies (Fabbri et al., 2009; Fan et al., 2020; Zhu et al., 2015). ratios for smoke particles from the burning of crop residues (∼40 to 55.7) were high, while ratios for the burning of hardwood (15–33) and softwood (3–10) were low (Engling et al., 2009, 2014; Sheesley et al., 2003; Wang et al., 2021). Besides that, recent studies demonstrate that levoglucosan is also present in lignite smoke particle matter (Rybicki et al., 2020a). Moreover, pyrolysis experiments confirm that lignite produces levoglucosan concentrations fully comparable to those of hardwoods and softwoods (Fabbri et al., 2009; Sheesley et al., 2003). Burning of lignite has been proved to be an additional input of levoglucosan to the atmosphere in regions where brown coal is utilized. Rybicki et al. (2020b) reported that the ratios in lignite smoke (ranged from 31 to 189) were generally higher than those found for other fuel types because cellulose is more resistant to diagenetic (bio)degradation than hemicelluloses.
To better understand the different classes of combustion sources, the ratio in the three areas was investigated. In this study, the ratios of in the rural and forest areas ranged from 5.1 to 8.4 (average: 6.9) and from 4.3 to 9.8 (average: 7.2), respectively. According to Fig. 8, the ratios for rural and forest areas fell within the range for softwood burning. Thus, biomass burning aerosol in the rural and forest areas was mainly derived from softwood burning. However, extremely high ratios were found in the urban area (ranged: 7.9 to 359.1; average: 59.9). These ratios were even higher than the values in the smoke particles released by the burning of crop residuals (>57) reported in the previous literature but fell within the range of lignite combustion, implying the urban area may be influenced by lignite combustion besides burning of crop residuals. Further support for this result was provided by the fact that a great quantity of lignite was used at the urban site (on average 3 803 646 t yr−1; the data are from the Statistical Yearbook of Nanchang City, http://tjj.nc.gov.cn//zbft/front/tjjnjnew/2020/mobile/index.html, last access: 1 November 2022). Besides that, the average concentration of Cl− in the urban location (107.3±68.4 ng m−3) was higher than in the rural (99.9±71.3 ng m−3) and forest (62.5±29.9 ng m−3) areas. Cl− has been reported to be a major chemical composition of coal combustion (Guo et al., 2020).
Determining the presence and signatures of source-specific sugars and AAs in aerosol samples can be of great value to estimate the contribution of primary biogenic and BB sources to aerosols at different sampling locations. Anhydrosugar, a confirmed BB tracer, highly correlated with combined Phe, which suggests the burning of the plant cell wall. The correlations between primary sugars (primary bioaerosol tracer) and specific CAAs dominant in local plant classes can help to identify potential local plant classes. Combined sugar alcohols (soil and associated biota tracer) with specific CAA species dominant in soil source can help to distinguish soil-related biological sources contribution. Previous work on aerosols focused on using only sugars or AA biomarkers alone to trace the aerosol sources. To the best of our knowledge, this is the first report combining source-specific sugar tracers with amino acids species dominant in primary emission sources to trace primary sources signatures at different locations. Moreover, this paper clearly demonstrates that combining these two molecular biomarkers in atmospheric particles may provide more source characteristics than using a single biomarker alone. Future work should be aimed at comprehensively characterizing physical, chemical, and biological properties of sugars and amino acids in aerosols, assessing possible interaction mechanisms between them, and extensively addressing the distribution of these two compound classes in potential aerosol sources.
The data for lignite consumption at the urban site were obtained from the Statistical Yearbook of Nanchang City (http://tjj.nc.gov.cn/zbft/front/tjjnjnew/2020/mobile/index.html) (Nanchang Statistics Bureau, 2020). Raw datasets (Zhu, 2021) used in this paper are available at https://doi.org/10.6084/m9.figshare.17158661.v1.
The supplement related to this article is available online at: https://doi.org/10.5194/acp-22-14019-2022-supplement.
This research was designed RGZ and HYX. Laboratory measurements were performed by HXZ, LC, and YG. The paper was prepared by RGZ, HYX, and HX.
The contact author has declared that none of the authors has any competing interests.
Publisher's note: Copernicus Publications remains neutral with regard to jurisdictional claims in published maps and institutional affiliations.
The authors are grateful to Alex Huffman for helpful advice and two anonymous reviewers for their constructive comments.
This work was supported by the National Natural Science Foundation of China (grant nos. 41425014 and 41463007).
This paper was edited by Alex Huffman and reviewed by two anonymous referees.
Abe, R. Y., Akutsu, Y., and Kagemoto, H.: Protein amino acids as markers for biological sources in urban aerosols, Environ. Chem. Lett., 14, 155–161, https://doi.org/10.1007/s10311-015-0536-0, 2016.
Agarwal, U. P.: Raman imaging to investigate ultrastructure and composition of plant cell walls: distribution of lignin and cellulose in black spruce wood (Picea mariana), Planta, 224, 1141, https://doi.org/10.1007/s00425-006-0295-z, 2006.
Axelrod, K., Samburova, V., and Khlystov, A. Y.: Relative abundance of saccharides, free amino acids, and other compounds in specific pollen species for source profiling of atmospheric aerosol, Sci. Total Environ., 799, 149254, https://doi.org/10.1016/j.scitotenv.2021.149254, 2021.
Barbaro, E., Feltracco, M., Cesari, D., Padoan, S., Zangrando, R., Contini, D., Barbante, C., and Gambaro, A.: Characterization of the water soluble fraction in ultrafine, fine, and coarse atmospheric aerosol, Sci. Total Environ., 658, 1423–1439, https://doi.org/10.1016/j.scitotenv.2018.12.298, 2019.
Barbaro, E., Morabito, E., Gregoris, E., Feltracco, M., Gabrieli, J., Vardè, M., Cairns, W. R. L., Dallo, F., De Blasi, F., Zangrando, R., Barbante, C., and Gambaro, A.: Col Margherita Observatory: A background site in the Eastern Italian Alps for investigating the chemical composition of atmospheric aerosols, Atmos. Environ., 221, 117071, https://doi.org/10.1016/j.atmosenv.2019.117071, 2020.
Barnett, N. M. and Naylor, A. W.: Amino Acid and Protein Metabolism in Bermuda Grass During Water Stress, Plant Physiol., 41, 1222–1230, https://doi.org/10.1104/pp.41.7.1222, 1966.
Bauer, H., Claeys, M., Vermeylen, R., Schueller, E., Weinke, G., Berger, A., and Puxbaum, H.: Arabitol and mannitol as tracers for the quantification of airborne fungal spores, Atmos. Environ., 42, 588–593, https://doi.org/10.1016/j.atmosenv.2007.10.013, 2008.
Bonawitz, N. D. and Chapple, C.: The Genetics of Lignin Biosynthesis: Connecting Genotype to Phenotype, Annu. Rev. Genet., 44, 337–363, https://doi.org/10.1146/annurev-genet-102209-163508, 2010.
Burkholder, P. R., Burkholder, L. M., and Rivero, J. A.: Some Chemical Constituents of Turtle Grass, Thalassia testudinum, Bull. Torrey Bot. Club, 86, 88–93, https://doi.org/10.2307/2482989, 1959.
Cheng, Y., Engling, G., He, K.-B., Duan, F.-K., Ma, Y.-L., Du, Z.-Y., Liu, J.-M., Zheng, M., and Weber, R. J.: Biomass burning contribution to Beijing aerosol, Atmos. Chem. Phys., 13, 7765–7781, https://doi.org/10.5194/acp-13-7765-2013, 2013.
Chow, J. C., Watson, J. G., Chen, L.-W. A., Rice, J., and Frank, N. H.: Quantification of PM2.5 organic carbon sampling artifacts in US networks, Atmos. Chem. Phys., 10, 5223–5239, https://doi.org/10.5194/acp-10-5223-2010, 2010.
Elbert, W., Taylor, P. E., Andreae, M. O., and Pöschl, U.: Contribution of fungi to primary biogenic aerosols in the atmosphere: wet and dry discharged spores, carbohydrates, and inorganic ions, Atmos. Chem. Phys., 7, 4569–4588, https://doi.org/10.5194/acp-7-4569-2007, 2007.
Engling, G., Lee, J. J., Tsai, Y.-W., Lung, S.-C. C., Chou, C. C. K., and Chan, C.-Y.: Size-Resolved Anhydrosugar Composition in Smoke Aerosol from Controlled Field Burning of Rice Straw, Aerosol Sci. Technol., 43, 662–672, https://doi.org/10.1080/02786820902825113, 2009.
Engling, G., He, J., Betha, R., and Balasubramanian, R.: Assessing the regional impact of indonesian biomass burning emissions based on organic molecular tracers and chemical mass balance modeling, Atmos. Chem. Phys., 14, 8043–8054, https://doi.org/10.5194/acp-14-8043-2014, 2014.
Fabbri, D., Torri, C., Simoneit, B. R. T., Marynowski, L., Rushdi, A. I., and Fabiańska, M. J.: Levoglucosan and other cellulose and lignin markers in emissions from burning of Miocene lignites, Atmos. Environ., 43, 2286–2295, https://doi.org/10.1016/j.atmosenv.2009.01.030, 2009.
Fan, Y., Liu, C.-Q., Li, L., Ren, L., Ren, H., Zhang, Z., Li, Q., Wang, S., Hu, W., Deng, J., Wu, L., Zhong, S., Zhao, Y., Pavuluri, C. M., Li, X., Pan, X., Sun, Y., Wang, Z., Kawamura, K., Shi, Z., and Fu, P.: Large contributions of biogenic and anthropogenic sources to fine organic aerosols in Tianjin, North China, Atmos. Chem. Phys., 20, 117–137, https://doi.org/10.5194/acp-20-117-2020, 2020.
Feltracco, M., Barbaro, E., Kirchgeorg, T., Spolaor, A., Turetta, C., Zangrando, R., Barbante, C., and Gambaro, A.: Free and combined L-and D-amino acids in Arctic aerosol, Chemosphere, 220, 412–421, https://doi.org/10.1016/j.chemosphere.2018.12.147, 2019.
Feltracco, M., Barbaro, E., Tedeschi, S., Spolaor, A., Turetta, C., Vecchiato, M., Morabito, E., Zangrando, R., Barbante, C., and Gambaro, A.: Interannual variability of sugars in Arctic aerosol: Biomass burning and biogenic inputs, Sci. Total Environ., 706, 136089, https://doi.org/10.1016/j.scitotenv.2019.136089, 2020.
Friedel, J. K. and Scheller, E.: Composition of hydrolysable amino acids in soil organic matter and soil microbial biomass, Soil Biol. Biochem., 34, 315–325, https://doi.org/10.1016/S0038-0717(01)00185-7, 2002.
Fröhlich-Nowoisky, J., Kampf, C. J., Weber, B., Huffman, J. A., Pöhlker, C., Andreae, M. O., Lang-Yona, N., Burrows, S. M., Gunthe, S. S., Elbert, W., Su, H., Hoor, P., Thines, E., Hoffmann, T., Després, V. R., and Pöschl, U.: Bioaerosols in the Earth system: Climate, health, and ecosystem interactions, Atmos. Res., 182, 346–376, https://doi.org/10.1016/j.atmosres.2016.07.018, 2016.
Fu, P., Kawamura, K., Okuzawa, K., Aggarwal, S. G., Wang, G., Kanaya, Y., and Wang, Z.: Organic molecular compositions and temporal variations of summertime mountain aerosols over Mt. Tai, North China Plain, J. Geophys. Res.-Atmos., 113, D19107, https://doi.org/10.1029/2008JD009900, 2008.
Fu, P., Kawamura, K., Kanaya, Y., and Wang, Z.: Contributions of biogenic volatile organic compounds to the formation of secondary organic aerosols over Mt. Tai, Central East China, Atmos. Environ., 44, 4817–4826, https://doi.org/10.1016/j.atmosenv.2010.08.040, 2010a.
Fu, P., Kawamura, K., Kobayashi, M., and Simoneit, B. R. T.: Seasonal variations of sugars in atmospheric particulate matter from Gosan, Jeju Island: Significant contributions of airborne pollen and Asian dust in spring, Atmos. Environ., 55, 234–239, https://doi.org/10.1016/j.atmosenv.2012.02.061, 2012.
Fu, P. Q., Kawamura, K., Pavuluri, C. M., Swaminathan, T., and Chen, J.: Molecular characterization of urban organic aerosol in tropical India: contributions of primary emissions and secondary photooxidation, Atmos. Chem. Phys., 10, 2663–2689, https://doi.org/10.5194/acp-10-2663-2010, 2010b.
Fu, P. Q., Kawamura, K., Chen, J., Charrière, B., and Sempéré, R.: Organic molecular composition of marine aerosols over the Arctic Ocean in summer: contributions of primary emission and secondary aerosol formation, Biogeosciences, 10, 653–667, https://doi.org/10.5194/bg-10-653-2013, 2013.
Guo, W., Zhang, Z., Zheng, N., Luo, L., Xiao, H., and Xiao, H.: Chemical characterization and source analysis of water-soluble inorganic ions in PM2.5 from a plateau city of Kunming at different seasons, Atmos. Res., 234, 104687, https://doi.org/10.1016/j.atmosres.2019.104687, 2020.
Jaenicke, R.: Abundance of Cellular Material and Proteins in the Atmosphere, Science, 308, 73–73, https://doi.org/10.1126/science.1106335, 2005.
Jia, Y., Clements, A. L., and Fraser, M. P.: Saccharide composition in atmospheric particulate matter in the southwest US and estimates of source contributions, J. Aerosol Sci., 41, 62–73, https://doi.org/10.1016/j.jaerosci.2009.08.005, 2010.
Jin, X., Chen, X., Shi, C., Li, M., Guan, Y., Yu, C. Y., Yamada, T., Sacks, E. J., and Peng, J.: Determination of hemicellulose, cellulose and lignin content using visible and near infrared spectroscopy in Miscanthus sinensis, Bioresour. Technol., 241, 603–609, https://doi.org/10.1016/j.biortech.2017.05.047, 2017.
Joung, Y. S., Ge, Z., and Buie, C. R.: Bioaerosol generation by raindrops on soil, Nat. Commun., 8, 14668, https://doi.org/10.1038/ncomms14668, 2017.
Kang, M., Ren, L., Ren, H., Zhao, Y., Kawamura, K., Zhang, H., Wei, L., Sun, Y., Wang, Z., and Fu, P.: Primary biogenic and anthropogenic sources of organic aerosols in Beijing, China: Insights from saccharides and n-alkanes, Environ. Pollut., 243, 1579–1587, https://doi.org/10.1016/j.envpol.2018.09.118, 2018.
Kunwar, B. and Kawamura, K.: One-year observations of carbonaceous and nitrogenous components and major ions in the aerosols from subtropical Okinawa Island, an outflow region of Asian dusts, Atmos. Chem. Phys., 14, 1819–1836, https://doi.org/10.5194/acp-14-1819-2014, 2014.
Liang, L., Engling, G., Du, Z., Cheng, Y., Duan, F., Liu, X., and He, K.: Seasonal variations and source estimation of saccharides in atmospheric particulate matter in Beijing, China, Chemosphere, 150, 365–377, https://doi.org/10.1016/j.chemosphere.2016.02.002, 2016.
Liu, F., Lai, S., Tong, H., Lakey, P. S. J., Shiraiwa, M., Weller, M. G., Pöschl, U., and Kampf, C. J.: Release of free amino acids upon oxidation of peptides and proteins by hydroxyl radicals, Anal. Bioanal. Chem., 409, 2411–2420, https://doi.org/10.1007/s00216-017-0188-y, 2017.
Mace, K. A., Artaxo, P., and Duce, R. A.: Water-soluble organic nitrogen in Amazon Basin aerosols during the dry (biomass burning) and wet seasons, J. Geophys. Res.-Atmos., 108, 4512, https://doi.org/10.1029/2003JD003557, 2003.
Matos, J. T. V., Duarte, R. M. B. O., and Duarte, A. C.: Challenges in the identification and characterization of free amino acids and proteinaceous compounds in atmospheric aerosols: A critical review, TrAC, Trends Anal. Chem., 75, 97–107, https://doi.org/10.1016/j.trac.2015.08.004, 2016.
Matsumoto, K. and Uematsu, M.: Free amino acids in marine aerosols over the western North Pacific Ocean, Atmos. Environ., 39, 2163–2170, https://doi.org/10.1016/j.atmosenv.2004.12.022, 2005.
McGregor, K. G. and Anastasio, C.: Chemistry of fog waters in California's Central Valley: 2. Photochemical transformations of amino acids and alkyl amines, Atmos. Environ., 35, 1091–1104, https://doi.org/10.1016/S1352-2310(00)00282-X, 2001.
Medeiros, P. M. and Simoneit, B. R. T.: Analysis of sugars in environmental samples by gas chromatography – mass spectrometry, J. Chromatogr., 1141, 271–278, https://doi.org/10.1016/j.chroma.2006.12.017, 2007.
Medeiros, P. M., Conte, M. H., Weber, J. C., and Simoneit, B. R. T.: Sugars as source indicators of biogenic organic carbon in aerosols collected above the Howland Experimental Forest, Maine, Atmos. Environ., 40, 1694–1705, https://doi.org/10.1016/j.atmosenv.2005.11.001, 2006.
Moura, A., Savageau, M. A., and Alves, R.: Relative amino acid composition signatures of organisms and environments, PLoS One, 8, e77319–e77319, https://doi.org/10.1371/journal.pone.0077319, 2013.
Nanchang Statistics Bureau: Nanchang Statistical Yearbook, Nanchang [data set], http://tjj.nc.gov.cn/zbft/front/tjjnjnew/2020/mobile/index.html (last access: 11 April 2022), 2020.
Nel, A.: Air Pollution-Related Illness: Effects of Particles, Sicence, 308, 804–806, https://doi.org/10.1126/science.1108752, 2005.
Ng, N. L., Canagaratna, M. R., Zhang, Q., Jimenez, J. L., Tian, J., Ulbrich, I. M., Kroll, J. H., Docherty, K. S., Chhabra, P. S., Bahreini, R., Murphy, S. M., Seinfeld, J. H., Hildebrandt, L., Donahue, N. M., DeCarlo, P. F., Lanz, V. A., Prévôt, A. S. H., Dinar, E., Rudich, Y., and Worsnop, D. R.: Organic aerosol components observed in Northern Hemispheric datasets from Aerosol Mass Spectrometry, Atmos. Chem. Phys., 10, 4625–4641, https://doi.org/10.5194/acp-10-4625-2010, 2010.
Pascual, M. B., El-Azaz, J., de la Torre, F. N., Cañas, R. A., Avila, C., and Cánovas, F. M.: Biosynthesis and Metabolic Fate of Phenylalanine in Conifers, Front. Plant Sci., 7, 1030, https://doi.org/10.3389/fpls.2016.01030, 2016.
Rathnayake, C. M., Metwali, N., Baker, Z., Jayarathne, T., Kostle, P. A., Thorne, P. S., O'Shaughnessy, P. T., and Stone, E. A.: Urban enhancement of PM10 bioaerosol tracers relative to background locations in the Midwestern United States, J. Geophys. Res.-Atmos., 121, 5071–5089, https://doi.org/10.1002/2015JD024538, 2016.
Ren, L., Bai, H., Yu, X., Wu, F., Yue, S., Ren, H., Li, L., Lai, S., Sun, Y., and Wang, Z.: Molecular composition and seasonal variation of amino acids in urban aerosols from Beijing, China, Atmos. Res., 203, 28–35, https://doi.org/10.1016/j.atmosres.2017.11.032, 2018.
Rogge, W. F., Medeiros, P. M., and Simoneit, B. R. T.: Organic marker compounds in surface soils of crop fields from the San Joaquin Valley fugitive dust characterization study, Atmos. Environ., 41, 8183–8204, https://doi.org/10.1016/j.atmosenv.2007.06.030, 2007.
Ruiz-Jimenez, J., Okuljar, M., Sietiö, O.-M., Demaria, G., Liangsupree, T., Zagatti, E., Aalto, J., Hartonen, K., Heinonsalo, J., Bäck, J., Petäjä, T., and Riekkola, M.-L.: Determination of free amino acids, saccharides, and selected microbes in biogenic atmospheric aerosols – seasonal variations, particle size distribution, chemical and microbial relations, Atmos. Chem. Phys., 21, 8775–8790, https://doi.org/10.5194/acp-21-8775-2021, 2021.
Rybicki, M., Marynowski, L., and Simoneit, B. R. T.: Composition of organic compounds from low-temperature burning of lignite and their application as tracers in ambient air, Chemosphere, 249, 126087, https://doi.org/10.1016/j.chemosphere.2020.126087, 2020a.
Rybicki, M., Marynowski, L., Bechtel, A., and Simoneit, B. R. T.: Variations in δ13C values of levoglucosan from low-temperature burning of lignite and biomass, Sci. Total Environ., 733, 138991, https://doi.org/10.1016/j.scitotenv.2020.138991, 2020b.
Samy, S., Robinson, J., Rumsey, I. C., Walker, J. T., Hays, M. D., Robinson, J., Rumsey, I. C., and Hays, M. D.: Speciation and trends of organic nitrogen in southeastern U.S. fine particulate matter (PM2.5), J. Geophys. Res.-Atmos., 118, 1996–2006, https://doi.org/10.1029/2012JD017868, 2013.
Sheesley, R. J., Schauer, J. J., Chowdhury, Z., Cass, G. R., and Simoneit, B. R. T.: Characterization of organic aerosols emitted from the combustion of biomass indigenous to South Asia, J. Geophys. Res.-Atmos., 108, 4285, https://doi.org/10.1029/2002JD002981, 2003.
Simoneit, B. R., Elias, V. O., Kobayashi, M., Kawamura, K., Rushdi, A. I., Medeiros, P. M., Rogge, W. F., and Didyk, B. M.: Sugars dominant water-soluble organic compounds in soils and characterization as tracers in atmospheric particulate matter, Environ. Sci. Technol., 38, 5939–5949, https://doi.org/10.1021/es0403099, 2004.
Simoneit, B. R. T.: Biomass burning -a review of organic tracers for smoke from incomplete combustion, Appl. Geochem., 17, 129–162, https://doi.org/10.1016/S0883-2927(01)00061-0, 2002.
Song, T., Wang, S., Zhang, Y., Song, J., Liu, F., Fu, P., Shiraiwa, M., Xie, Z., Yue, D., Zhong, L., Zheng, J., and Lai, S.: Proteins and Amino Acids in Fine Particulate Matter in Rural Guangzhou, Southern China: Seasonal Cycles, Sources, and Atmospheric Processes, Environ. Sci. Technol., 51, 6773–6781, 10.1021/acs.est.7b00987, 2017.
Steinfeld, J. I.: Atmospheric Chemistry and Physics: From Air Pollution to Climate Change, Environment: Science and Policy for Sustainable Development, 40, 26–26, https://doi.org/10.1080/00139157.1999.10544295, 1998.
Urban, R. C., Lima-Souza, M., Caetano-Silva, L., Queiroz, M. E. C., Nogueira, R. F. P., Allen, A. G., Cardoso, A. A., Held, G., and Campos, M. L. A. M.: Use of levoglucosan, potassium, and water-soluble organic carbon to characterize the origins of biomass-burning aerosols, AtmEn, 61, 562–569, https://doi.org/10.1016/j.atmosenv.2012.07.082, 2012.
Urban, R. C., Alves, C. A., Allen, A. G., Cardoso, A. A., Queiroz, M. E. C., and Campos, M. L. A. M.: Sugar markers in aerosol particles from an agro-industrial region in Brazil, AtmEn, 90, 106–112, https://doi.org/10.1016/j.atmosenv.2014.03.034, 2014.
Verma, S. K., Kawamura, K., Yang, F., Fu, P., Kanaya, Y., and Wang, Z.: Measurement report: Diurnal and temporal variations of sugar compounds in suburban aerosols from the northern vicinity of Beijing, China – an influence of biogenic and anthropogenic sources, Atmos. Chem. Phys., 21, 4959–4978, https://doi.org/10.5194/acp-21-4959-2021, 2021.
Violaki, K. and Mihalopoulos, N.: Water-soluble organic nitrogen (WSON) in size-segregated atmospheric particles over the Eastern Mediterranean, Atmos. Environ., 44, 4339–4345, https://doi.org/10.1016/j.atmosenv.2010.07.056, 2010.
Wallace, G. and Fry, S. C.: Phenolic Components of the Plant Cell Wall, Int. Rev. Cytol., 151 229–267, https://doi.org/10.1016/S0074-7696(08)62634-0, 1994.
Wan, E. C. H. and Yu, J. Z.: Analysis of Sugars and Sugar Polyols in Atmospheric Aerosols by Chloride Attachment in Liquid Chromatography/Negative Ion Electrospray Mass Spectrometry, Environ. Sci. Technol., 41, 2459–2466, https://doi.org/10.1021/es062390g, 2007.
Wang, G., Kawamura, K., Lee, S., Ho, K., and Cao, J.: Molecular, Seasonal, and Spatial Distributions of Organic Aerosols from Fourteen Chinese Cities, Environ. Sci. Technol., 40, 4619–4625, https://doi.org/10.1021/es060291x, 2006.
Wang, S., Song, T., Shiraiwa, M., Song, J., Ren, H., Ren, L., Wei, L., Sun, Y., Zhang, Y., Fu, P., and Lai, S.: Occurrence of Aerosol Proteinaceous Matter in Urban Beijing: An Investigation on Composition, Sources, and Atmospheric Processes During the “APEC Blue” Period, Environ. Sci. Technol., 53, 7380–7390, https://doi.org/10.1021/acs.est.9b00726, 2019.
Wang, Z., Wu, D., Li, Z., Shang, X., Li, Q., Li, X., Chen, R., Kan, H., Ouyang, H., Tang, X., and Chen, J.: Measurement report: Saccharide composition in atmospheric fine particulate matter during spring at the remote sites of southwest China and estimates of source contributions, Atmos. Chem. Phys., 21, 12227–12241, https://doi.org/10.5194/acp-21-12227-2021, 2021.
Wilson, R. F. and Tilley, J. M. A.: Amino-acid composition of lucerne and of lucerne and grass protein preparations, J. Sci. Food Agric., 16, 173–178, https://doi.org/10.1002/jsfa.2740160401, 1965.
Wu, X., Vu, T. V., Shi, Z., Harrison, R. M., Di, L., and Kuang, C.: Characterization and source apportionment of carbonaceous PM2.5 particles in China – A review, Atmos. Environ., 189, 187–212, https://doi.org/10.1016/j.atmosenv.2018.06.025, 2018.
Xu, S., Ren, L., Lang, Y., Hou, S., Ren, H., Wei, L., Wu, L., Deng, J., Hu, W., Pan, X., Sun, Y., Wang, Z., Su, H., Cheng, Y., and Fu, P.: Molecular markers of biomass burning and primary biological aerosols in urban Beijing: size distribution and seasonal variation, Atmos. Chem. Phys., 20, 3623–3644, https://doi.org/10.5194/acp-20-3623-2020, 2020a.
Xu, Y., Xiao, H., Wu, D., and Long, C.: Abiotic and Biological Degradation of Atmospheric Proteinaceous Matter Can Contribute Significantly to Dissolved Amino Acids in Wet Deposition, Environ. Sci. Technol., 54, 6551–6561, https://doi.org/10.1021/acs.est.0c00421, 2020b.
Yan, C., Sullivan, A. P., Cheng, Y., Zheng, M., Zhang, Y., Zhu, T., and Collett, J. L.: Characterization of saccharides and associated usage in determining biogenic and biomass burning aerosols in atmospheric fine particulate matter in the North China Plain, Sci. Total Environ., 650, 2939–2950, https://doi.org/10.1016/j.scitotenv.2018.09.325, 2019.
Zangrando, R., Barbaro, E., Kirchgeorg, T., Vecchiato, M., Scalabrin, E., Radaelli, M., Đorđević, D., Barbante, C., and Gambaro, A.: Five primary sources of organic aerosols in the urban atmosphere of Belgrade (Serbia), Sci. Total Environ., 571, 1441–1453, https://doi.org/10.1016/j.scitotenv.2016.06.188, 2016.
Zhang, J., Tong, L., Huang, Z., Zhang, H., He, M., Dai, X., Zheng, J., and Xiao, H.: Seasonal variation and size distributions of water-soluble inorganic ions and carbonaceous aerosols at a coastal site in Ningbo, China, ScTEn, 639, 793–803, https://doi.org/10.1016/j.scitotenv.2018.05.183, 2018.
Zhu, C., Kawamura, K., and Kunwar, B.: Effect of biomass burning over the western North Pacific Rim: wintertime maxima of anhydrosugars in ambient aerosols from Okinawa, Atmos. Chem. Phys., 15, 1959–1973, https://doi.org/10.5194/acp-15-1959-2015, 2015.
Zhu, R.-g., Xiao, H.-Y., Lv, Z., Xiao, H., Zhang, Z., and Xiao, H.: Nitrogen isotopic composition of free Gly in aerosols at a forest site, Atmos. Environ., 222, 117179, https://doi.org/10.1016/j.atmosenv.2019.117179, 2020a.
Zhu, R.-g., Xiao, H.-Y., Zhu, Y., Wen, Z., Fang, X., and Pan, Y.: Sources and Transformation Processes of Proteinaceous Matter and Free Amino Acids in PM2.5, J. Geophys. Res.-Atmos., 125, e2020JD032375, https://doi.org/10.1029/2020jd032375, 2020b.
Zhu, R.-G.: Concentration of saccharides in PM2.5.xlsx, figshare, [data set], https://doi.org/10.6084/m9.figshare.17158661.v1, 2021.
Zhu, R.-G., Xiao, H.-Y., Wen, Z., Zhu, Y., Fang, X., Pan, Y., Chen, Z., and Xiao, H.: Oxidation of Proteinaceous Matter by Ozone and Nitrogen Dioxide in PM2.5: Reaction Mechanisms and Atmospheric Implications, J. Geophys. Res.-Atmos., 126, e2021JD034741, https://doi.org/10.1029/2021JD034741, 2021a.
Zhu, R.-G., Xiao, H.-Y., Luo, L., Xiao, H., Wen, Z., Zhu, Y., Fang, X., Pan, Y., and Chen, Z.: Measurement report: Hydrolyzed amino acids in fine and coarse atmospheric aerosol in Nanchang, China: concentrations, compositions, sources and possible bacterial degradation state, Atmos. Chem. Phys., 21, 2585–2600, https://doi.org/10.5194/acp-21-2585-2021, 2021b.