the Creative Commons Attribution 4.0 License.
the Creative Commons Attribution 4.0 License.
 | 27 Jan 2022
Inferring iron-oxide species content in atmospheric mineral dust from DSCOVR EPIC observations
Alexei Lyapustin
Gregory L. Schuster
Myungje Choi
Paul Ginoux
Mian Chin
Olga Kalashnikova
Oleg Dubovik
Jhoon Kim
Arlindo da Silva
Brent Holben
Jeffrey S. Reid
The iron-oxide content of dust in the atmosphere and most notably its apportionment between hematite (α-Fe2O3) and goethite (α-FeOOH) are key determinants in quantifying dust's light absorption, its top of atmosphere ultraviolet (UV) radiances used for dust monitoring, and ultimately shortwave dust direct radiative effects (DREs). Hematite and goethite column mass concentrations and iron-oxide mass fractions of total dust mass concentration were retrieved from the Deep Space Climate Observatory (DSCOVR) Earth Polychromatic Imaging Camera (EPIC) measurements in the ultraviolet–visible (UV–Vis) channels. The retrievals were performed for dust-identified aerosol plumes over land using aerosol optical depth (AOD) and the spectral imaginary refractive index provided by the Multi-Angle Implementation of Atmospheric Correction (MAIAC) algorithm over six continental regions (North America, North Africa, West Asia, Central Asia, East Asia, and Australia). The dust particles are represented as an internal mixture of non-absorbing host and absorbing hematite and goethite. We use the Maxwell Garnett effective medium approximation with carefully selected complex refractive indices of hematite and goethite that produce mass fractions of iron-oxide species consistent with in situ values found in the literature to derive the hematite and goethite volumetric/mass concentrations from MAIAC EPIC products. We compared the retrieved hematite and goethite concentrations with in situ dust aerosol mineralogical content measurements, as well as with published data. Our data display variations within the published range of hematite, goethite, and iron-oxide mass fractions for pure-mineral-dust cases. A specific analysis is presented for 15 sites over the main dust-source regions. Sites in the central Sahara, Sahel, and Middle East exhibit a greater temporal variability of iron oxides relative to other sites. The Niger site (13.52∘ N, 2.63∘ E) is dominated by goethite over the Harmattan season with a median of ∼ 2 weight percentage (wt %) of iron oxide. The Saudi Arabia site (27.49∘ N, 41.98∘ E) over the Middle East also exhibited a surge of goethite content with the beginning of the shamal season. The Sahel dust is richer in iron oxide than Saharan and northern China dust except in summer. The Bodélé Depression area shows a distinctively lower iron-oxide concentration (∼ 1 wt %) throughout the year. Finally, we show that EPIC data allow the constraining of the hematite refractive index. Specifically, we select 5 out of 13 different hematite refractive indices that are widely variable in published laboratory studies by constraining the iron-oxide mass ratio to the known measured values. The provided climatology of hematite and goethite mass fractions across the main dust regions of Earth will be useful for dust shortwave DRE studies and climate modeling.
- Article
(20601 KB) - Full-text XML
-
Supplement
(4452 KB) - BibTeX
- EndNote


Eolian dust, suspended in the troposphere at a rate of 1–4 Pg yr−1, persists for 1–7 d or longer depending on particle size (Boucher et al., 2013). Such dust emissions are caused by saltation in desert regions, seasonal river discharges, and anthropogenic land use (e.g., overgrazing; Ginoux et al., 2012). Airborne dust contributes to the direct radiative effect (DRE) by absorbing or scattering solar and terrestrial radiation in the shortwave (SW, 0.185–4.0 µm) and longwave (LW, 3.33–1000 µm) spectral regions, respectively (Di Biagio et al., 2020). However, these dust absorption/scattering properties may change substantially during transport with dust chemical composition and size distribution varying over different source regions and with time. Accurate information on the space–time variability of dust spectral absorbing/scattering properties is therefore crucial in estimating direct radiative forcing (Samset et al., 2018).
The dust DRE at the top of the atmosphere (TOA) is unresolved in both sign and magnitude. For example, Kok et al. (2017) suggested that the net (SW + LW) dust DRE is cooling at −0.20 W m−2 with an uncertainty range of −0.48 to +0.20 W m−2, based on the complex refractive index from the Optical Properties of Aerosols and Clouds (OPAC) database (Hess et al., 1998; Volz, 1973). Di Biagio et al. (2020) also suggested cooling at a lower rate of −0.03 W m−2 with an uncertainty range of −0.29 to +0.23 W m−2, based on complex refractive indices obtained of different types of mineral dust (Di Biagio et al., 2017; Balkanski et al., 2007). Li et al. (2021) determined a warming effect of +0.04 W m−2 with an uncertainty range of −0.23 to +0.35 W m−2, based on CAM5 with a complex refractive index proposed by Scanza et al. (2015). Uncertainties in the SW DRE are generally greater than those in the LW DRE. The DRE of pure mineral dust is determined mainly by its particle size distribution, mineral composition, and particle shape (Sokolik and Toon, 1999; Knippertz and Stuut, 2014) as well as the absolute dust concentration and the height and profile of the dust layer in the atmosphere. Previous studies have pointed out that current climate models use a globally invariant spectral complex refractive index (and therefore spectral single-scattering albedo (SSA); Scanza et al., 2015; Samset et al., 2018; Di Biagio et al., 2019), which implicitly assumes the same dust mineralogical composition on a global scale.
A few Earth-system models (ESMs, i.e., coupled climate models) have adopted a regionally and temporally variable spectral refractive index of dust by parameterization with common soil mineralogy components (Scanza et al., 2015; Perlwitz et al., 2015a, b). The rationale for this is that dust aerosols are soil particles suspended in the atmosphere (Scanza et al., 2015). Specifically, in CAM5 (Scanza et al., 2015; Liu et al., 2012), dust aerosol emission mineralogy is transformed from clay-sized (diameter Dp = 0–2 µm) and silt-sized (Dp = 2–50 µm) particles in soil mineralogy to bimodal eolian dust size distributions (accumulation-mode Dp = 0.1–1.0 µm; coarse-mode Dp = 1–10 µm) by brittle fragmentation theory (Kok, 2011). The dust aerosol refractive index is then calculated using a volume-weighted mixing rule for all mineral components including water. Mineral components are internally mixed within each particle mode and externally mixed between different particle modes (Liu et al., 2012, 2016). Finally, radiation is simulated by CAM5 for SW and LW spectral regions. The direct radiative forcing of dust is determined by the difference between the results of two calculations: radiative forcing with all aerosol species and radiative forcing with all aerosol species except mineral dust. In short, dust radiative forcing is highly dependent on mineral-specific dust absorption properties in the CAM5 ESM.
Li et al. (2021) recently quantified the importance of soil mineralogical content uncertainty on the dust DRE estimate using the soil atlases C1999 (Claquin et al., 1999) and J2014 (Journet et al., 2014), with the addition of goethite to C1999. They concluded that the iron-oxide fraction in dust represents 97 % of the uncertainty in their estimated total dust DRE (−0.23 to +0.35 W m−2) using CAM5 only and 85 % across multiple climate models. They also highlighted the importance of the speciation of iron oxides into hematite and goethite to better estimate the SW dust DRE, without which the model would underestimate dust warming by 56 % because the absorption magnitudes of hematite and goethite are up to an order of magnitude different at ultraviolet (UV) and visible (Vis) wavelengths (Fig. 1).
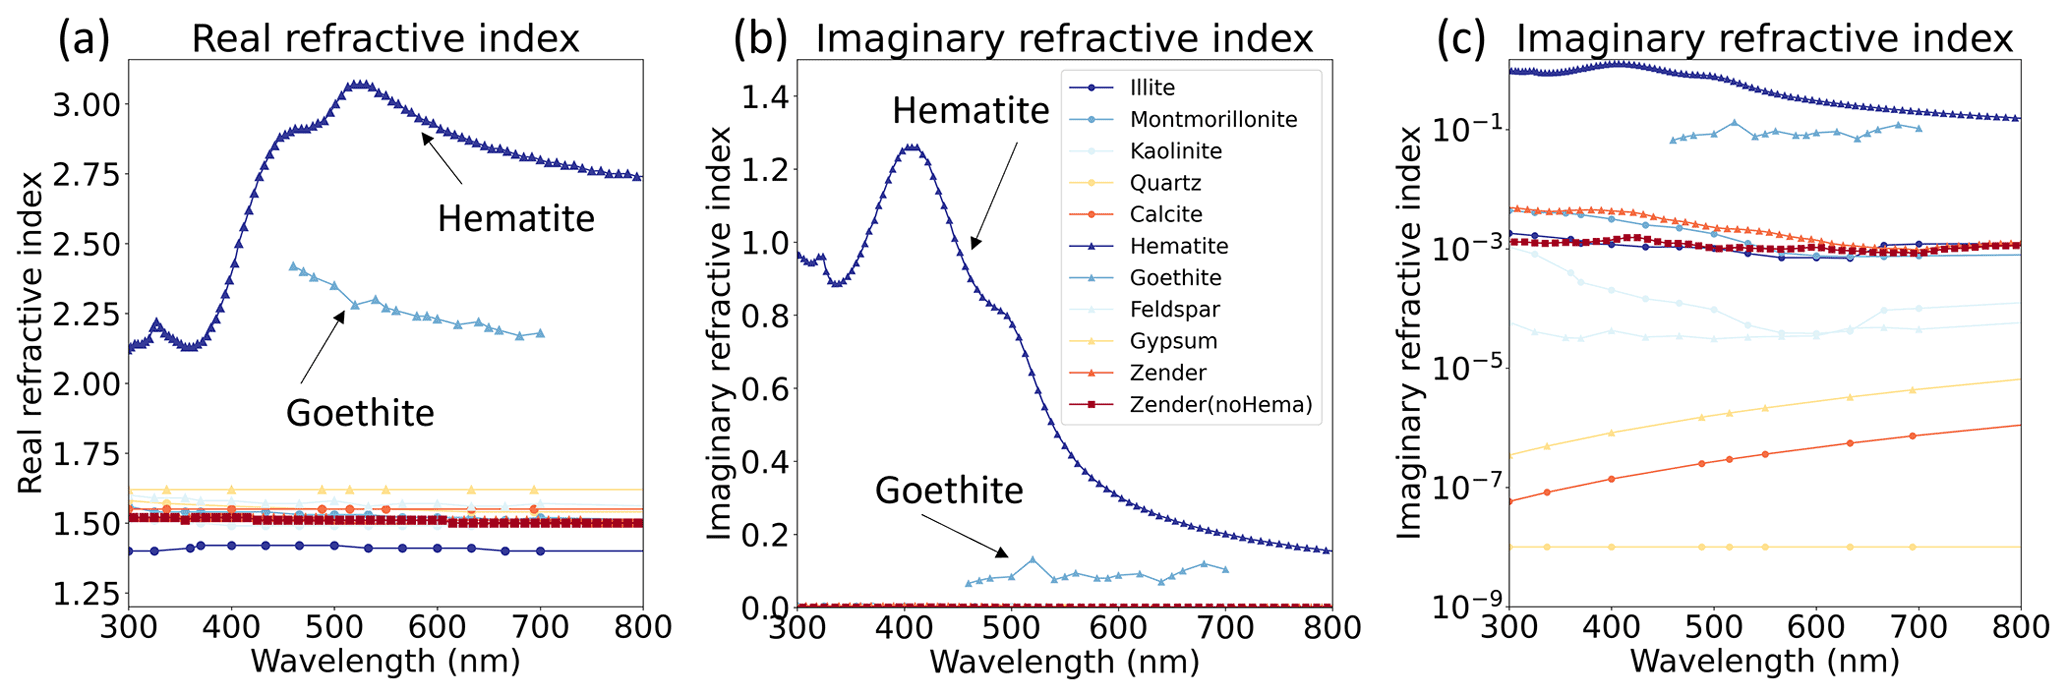
Figure 1Complex refractive index based on soil mineralogy at 300–800 nm (Scanza et al., 2015). Shown are the real refractive index (a) and the imaginary refractive index in linear (b) and log (c) scales. The goethite refractive index is from Bedidi and Cervelle (1993).
Hematite (α-Fe2O3) and goethite (α-FeOOH), both in the Fe(III) oxidation state, are the major iron-oxide species (also referred together as “free iron” or “iron oxides”) in mineral dust (Lafon et al., 2004) and exert major control on the absorption magnitude of pure dust for SW radiation (e.g., Sokolik and Toon, 1999; Arimoto et al., 2002; Lafon et al., 2006; Formenti et al., 2014a), as can be inferred from their complex imaginary refractive index (Fig. 1). The imaginary index magnitudes of both hematite and goethite (10−1–100) are more than 100 times those of other soil mineral components (10−8–10−3) at wavelengths of < 1 µm, which means that hematite and goethite dominate absorption while other minerals can be considered non-absorbing. The hematite imaginary index (0.2 at 700 nm to 0.8 at 460 nm) is generally about 3 times higher than that of goethite (∼ 0.1) (Bedidi and Cervelle, 1993) in the red–near infrared (NIR), the discrepancy further increasing toward blue–UV. At 350–450 nm, the imaginary index of hematite peaks at 1.0–1.2, whereas it changes little for goethite, remaining at ∼ 0.1. This significant difference in spectral absorption between hematite and goethite facilitates their separate retrievals.
Despite its high radiative impact on the SW dust DRE, the relative proportion of iron oxides in the total dust mass is very small (up to 6.5 weight percentage-wt %; Schuster et al., 2016). Iron oxides also control the color of soil (Torrent et al., 1983). A reddish color indicates hematite (hues of 5YR and 10R) and yellowish-brown colors indicate goethite (hues of 7.5YR and 2.5Y) in soils, with the range of hues depending on the concentration, crystal size, and degree of cementation (Schwertmann, 1971, 1993). Hematite and goethite generally occur together in both soil and the atmosphere, and they are internally mixed with other mineral particles, whereas most other dust minerals are externally mixed (Formenti et al., 2014a). Their formation in soil is influenced by climate change, with cooler and more humid conditions favoring goethite formation owing to changes in the organic-matter regime of the soil (Schwertmann, 1971).
The GRASP/Component algorithm (Li et al., 2019) uses the Maxwell Garnett effective medium approximation to provide aerosol speciation from the Polarization & Anisotropy of Reflectances for Atmospheric Sciences coupled with Observations from a Lidar (PARASOL) developed for the POLarization and Directionality of the Earth's Reflectances (POLDER) program. Several future satellite missions such as the Multi-Angle Imager for Aerosols (MAIA) (Diner et al., 2018) and Earth Surface Mineral Dust Source Investigation (EMIT) (Green et al., 2020) will be providing aerosol composition or mineralogical information. The Earth Polychromatic Imaging Camera (EPIC) instrument has been operational since 2015, while POLDER/PARASOL was decommissioned in December 2013.
Several studies have used regional or global AErosol RObotic NETwork (AERONET; Holben et al., 1998) inversion products (Arola et al., 2011; Koven and Fung, 2006; Schuster et al., 2005, 2016) or ground-based data (Li et al., 2013, 2015; Wang et al., 2013, 2021) to retrieve aerosol components.
This study retrieves hematite and goethite volume fractions and mass concentrations in atmospheric mineral dust from the EPIC UV–Vis (340, 388, 443, 680 nm) data, based upon the above physical characteristics of hematite and goethite. We began with Multi-Angle Implementation of Atmospheric Correction (MAIAC)-retrieved spectral aerosol absorption information, i.e., the imaginary index at 680 nm (k0) and spectral absorption exponent (b) (Lyapustin et al., 2021), currently optimized for “pure” smoke or dust.
The methodology is based on the Maxwell Garnett effective medium approximation and follows the work of Schuster et al. (2016). Assuming atmospheric aerosols are inhomogeneous particles with different complex dielectric functions, the Maxwell Garnett approximation can be used to calculate average dielectric functions because of the interactions of electromagnetic waves between inhomogeneous particles (Bohren and Huffman, 1983). The theory considers randomly inhomogeneous mixtures comprised of two inclusions embedded in a homogeneous matrix (Bohren and Huffman, 1983). With the host considered a homogeneous matrix with inclusions of hematite and goethite, we undertook component retrievals from dust-identified aerosol plumes with the MAIAC EPIC algorithm over six continental regions following Schuster et al. (2016) with some modifications. One issue with hematite is that its spectral refractive indices obtained in laboratory studies vary widely (Schuster et al., 2016; Zhang et al., 2015). In Sects. 2.3 and 4 we examine how the volume fractions of hematite and goethite change with the hematite refractive index.
The remainder of this paper is organized as follows. Section 2 describes the input data and methodology; Sect. 3 presents the results of selected case studies (Sect. 3.1), a comparison with data derived from in situ soil samples (Sect. 3.2), and a summary of regional–seasonal climatology (Sect. 3.3); Sect. 4 presents elimination analysis of different hematite refractive index models consistent with EPIC UV–Vis measurements and in situ iron-oxide mass ratio. The results of this work are summarized in the concluding Sect. 5.
2.1 MAIAC EPIC v2 algorithm
The EPIC aboard the DSCOVR satellite has been providing observations of the sunlit side of Earth from the first Lagrangian point (L1) since 2015. EPIC provides hourly measurements of the sunlit part of Earth as it rotates from sunrise to sunset. Such a capability has not previously been available from any other spacecraft or Earth-observing platform. Following the Moderate Resolution Imaging Spectroradiometer (MODIS) MAIAC algorithm (Lyapustin et al., 2018), the MAIAC EPIC algorithm over land provides cloud detection, retrieval of aerosol optical depth (AOD) with regionally specified background aerosol models, and atmospheric correction. Recently, we expanded the MAIAC EPIC algorithm to include simultaneous retrieval of AOD and the spectral imaginary refractive index for the detected absorbing aerosols, e.g., biomass burning smoke and mineral dust (Lyapustin et al., 2021). Spectral absorption in MAIAC is represented by a power-law expression:
where λ0=680 nm and k is an imaginary refractive index. The real refractive index and the size distribution for smoke and dust models are fixed. Parameters (AOD443, k0, b) are derived simultaneously by matching the EPIC TOA reflectance at 340, 388, and 443 nm. The surface reflectance at these wavelengths is parameterized using the EPIC red band (680 nm) and their spectral ratios to the red band obtained for each 10 km grid cell using the minimum reflectance method. The variety of retrieved combinations (k0, b) characterizes the magnitude of aerosol absorption and its spectral variability. MAIAC retrievals are reported for the effective aerosol heights of 1 and 4 km with 2 km box-shaped profiles, representing the typical boundary layer and free-troposphere transported aerosol. As the current MAIAC EPIC cannot discriminate between smoke and dust, it uses the dust model for known dust-source regions (e.g., Sahara, Arabian Peninsula), and the smoke model is applied elsewhere globally. The lack of the mixed smoke–dust aerosol types is a current limitation of the algorithm. MAIAC EPIC version 2 reports the combination of AOD, k0, and b along with calculated SSA at 443 nm. Our comparisons of SSA of MAIAC EPIC for 2018 for mineral dust with AERONET SSA showed an agreement with correlation coefficient r ∼ 0.62, RMSE ∼ 0.021, and mean bias error (MBE) ∼ 0.006 over the Sahara–Arabia–Middle East region and with 85 % of SSA values within the expected error (EE) of ±0.03 (Lyapustin et al., 2021). The global AOD and SSA accuracy analysis of MAIAC EPIC for the entire mission period 2015–2021 will be published elsewhere.
A comparison of the spectral dependence of dust absorption (log(k440) vs. log(k670)) with AERONET showed a very similar pattern and slope, albeit with MAIAC EPIC giving a smaller range of variation. Such good unbiased agreement was observed for dust at 1 km effective height, indicating that the bulk of dust for the majority of dust storms was in the boundary layer. On the contrary, a similar SSA validation for the wildfire smoke over the USA showed a much better agreement with AERONET for the lofted smoke at 4 km effective height (for 15 out of 17 AERONET sites; Lyapustin et al., 2021). For this reason, the current work uses MAIAC EPIC dust retrievals reported for the 1 km height.
2.2 Composition retrieval of hematite and goethite
The forward and inversion algorithms for hematite and goethite retrievals are illustrated in Fig. 2. The forward model uses the Maxwell Garnett effective medium approximation to simulate the complex dielectric function of the total column. Although internal mixing is clearly an assumption for minerals, as minerals are generally externally mixed – other than iron oxides (hematite, goethite; Formenti et al., 2014a) – ESMs within each particle mode and AERONET retrievals also assume internal mixing, so the retrieval can be directly fitted into ESMs or compared with AERONET data in the future.
The complex dielectric function (ε), the so-called relative permittivity, is equal to the square of the corresponding complex refractive index ), where ε1, ε2, and εh indicate the complex dielectric functions of inclusion 1, inclusion 2, and the host, respectively:
Here, inclusions 1 and 2 refer to hematite and goethite, respectively, and the host is generally a homogeneous aerosol mixture whose absorption can be neglected (kh(λj) =0). This assumes that all absorption in mixed aerosols is attributed to hematite and goethite particles. The complex refractive indices of hematite and goethite were brought by Scanza et al. (2015) and Bedidi and Cervelle (1993), respectively, as depicted in Fig. 1 (note that in Scanza et al., 2015, the complex refractive index of hematite was originally cited as personal communication with A. H. M. J. Triaud, 2005). Here, we linearly extrapolated the goethite refractive index to 340 nm in the UV region. The real part of the refractive index of the host (nh(λj)) is 1.52, 1.52, 1.51, and 1.5 at 340, 388, 443, and 680 nm, respectively, as determined by Di Biagio et al. (2019).
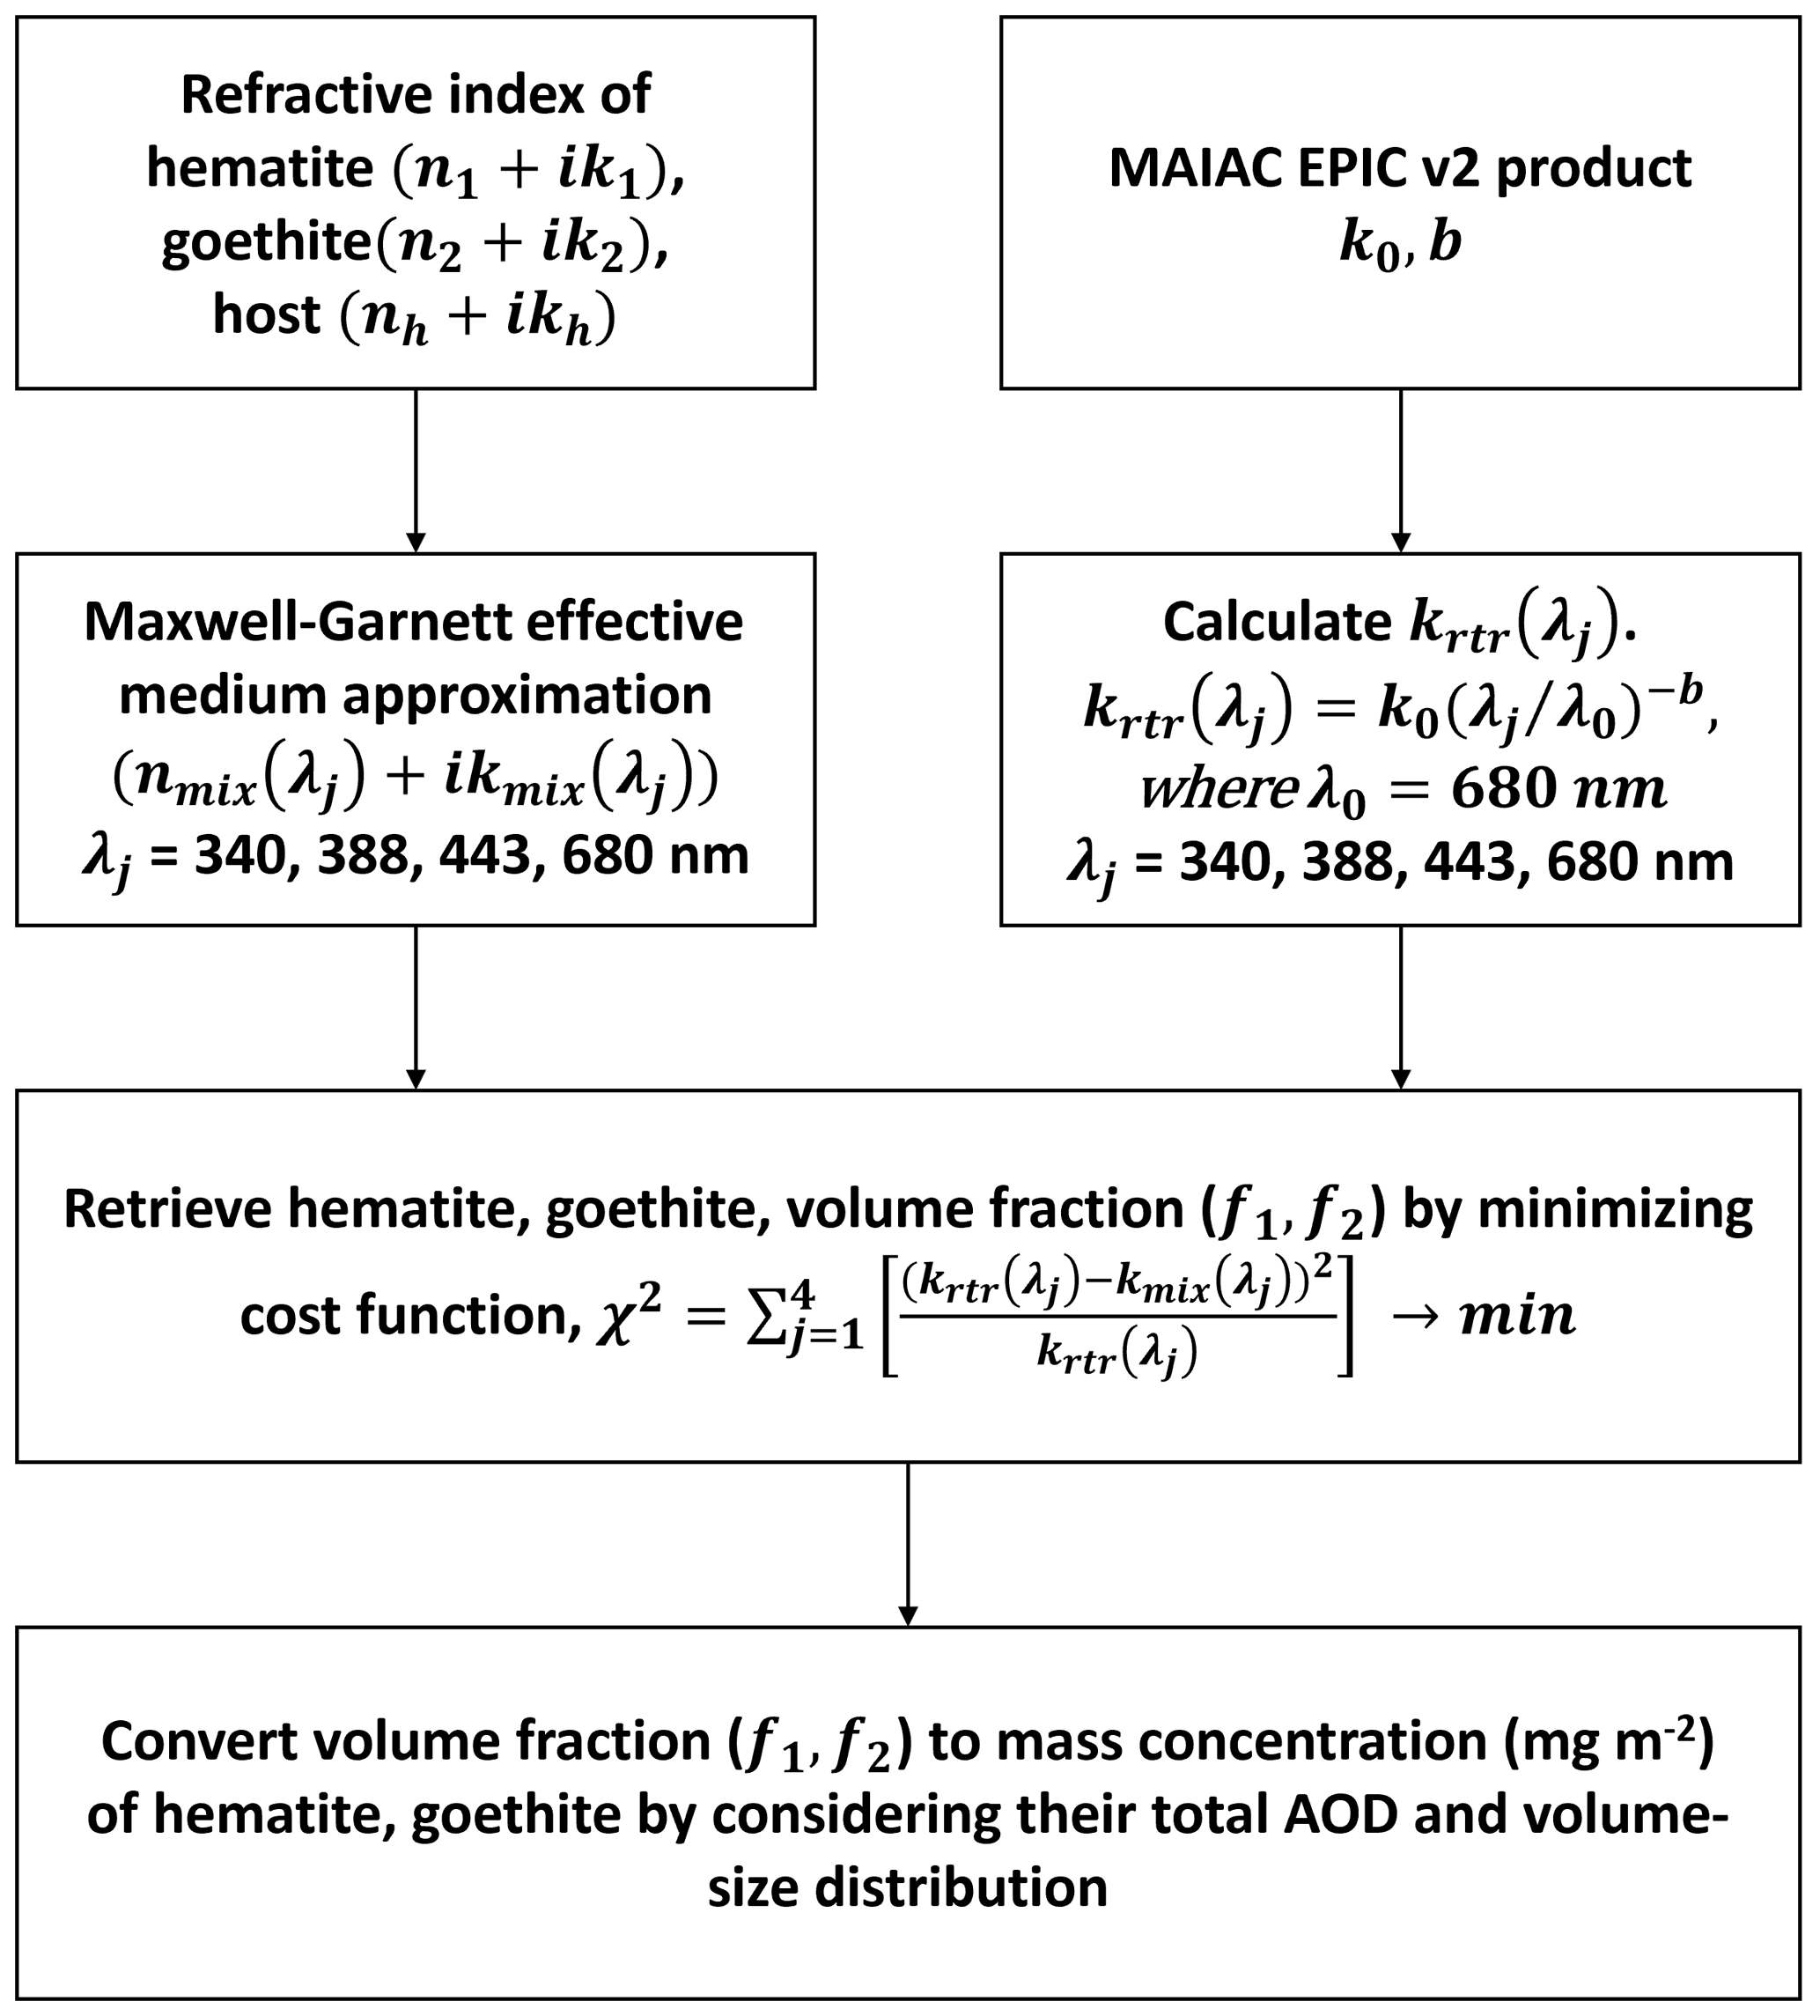
Figure 2Schematic diagram of the methodology of this study. Spectral aerosol absorption data from MAIAC EPIC (b and k0 values) are used to infer imaginary refractive indices (krtr) at 340, 388, 443, and 680 nm. These values are fitted with imaginary indices of mixtures with hematite, goethite, and the host complex refractive index using the Maxwell Garnett effective medium approximation rule. The cost functions between the EPIC imaginary and mixture refractive indices are minimized by iteration of the volume fractions (f) of hematite and goethite (Sect. 2.2).
The complex dielectric function of mixed aerosol (εMG) can be summarized as follows using the Maxwell Garnett effective medium approximation:
where f1 and f2 refer to volume fractions (unitless) of inclusions 1 and 2, respectively. The volume fraction of the host is . Therefore, the complex refractive index of the mixture is a function of two inclusions and one homogeneous host:
where the real and imaginary parts of the aerosol mixture, derived from the relation , are
The inversion minimizes the following cost function by iteratively updating the volume fraction of inclusions ([f1,f2]):
where
The parameter λj represents the four EPIC wavelengths of 340, 388, 443, and 680 nm. Unlike Schuster et al. (2016), we minimize only the imaginary term of the mixture refractive index. However, the real parts of the refractive indices of inclusions 1 and 2 and the host are significant, as the imaginary term of the mixture (kmix(λj)) is calculated from both real (εMG,r) and imaginary (εMG,i) parts of the complex dielectric function. Therefore, realistic values of the real part of the refractive indices of inclusions 1 and 2 and the host are still required as well as those of the imaginary part. Di Biagio et al. (2019) concluded that the real part of the refractive index is generally source- and wavelength-independent with a range of 1.48–1.55 and a sample mean of 1.52, based on a study of 19 mineral dust aerosols generated from soil samples coming from the main global dust-source regions. As we mentioned above, we used the values 1.52, 1.52, 1.51, and 1.5 at 340, 388, 443, and 680 nm, respectively.
The retrieved volume fractions of hematite and goethite ([f1,f2]) can be converted to mass concentrations (mg m−2) by considering their total AOD and volume–size distributions. Specifically, total AOD (τa) is a summation of the fine-mode and coarse-mode AOD, with MAIAC considering fixed hi(λ) (AOD per unit volume concentration) values and CVi (volume concentration) for each mode (Lyapustin et al., 2011):
For dust, MAIAC uses a dynamic model of size distribution for the Solar Village AERONET site (Dubovik et al., 2002). In this model, the volume fraction of the coarse mode rapidly increases with AOD. This justifies the approximation in Eq. (11) as MAIAC provides (AOD, k0, b) retrievals (Lyapustin et al., 2021) only when the background model AOD is sufficiently high (AOD > 0.6). A constant value of hc(443)=1.2526 for dust yields the following simple equation:
The volume concentration of hematite (CV,hema) can be obtained by multiplying the coarse-mode volume concentration and retrieved volume fraction of hematite:
and the mass concentration of hematite (CM,hema) is calculated by multiplying the corresponding densities (ρhema =5260 kg m−3; ρgoethite =3800 kg m kg m−3; Scanza et al., 2015):
Accordingly, the mass concentration of goethite (CM, goet) and host (CM, host) can be calculated by replacing fhema and ρhema in Eqs. (13) and (14) with the corresponding volume fraction and density. The density of free iron is roughly twice that of other minerals (Schuster et al., 2016; Formenti et al., 2014a).
2.3 Hematite refractive index
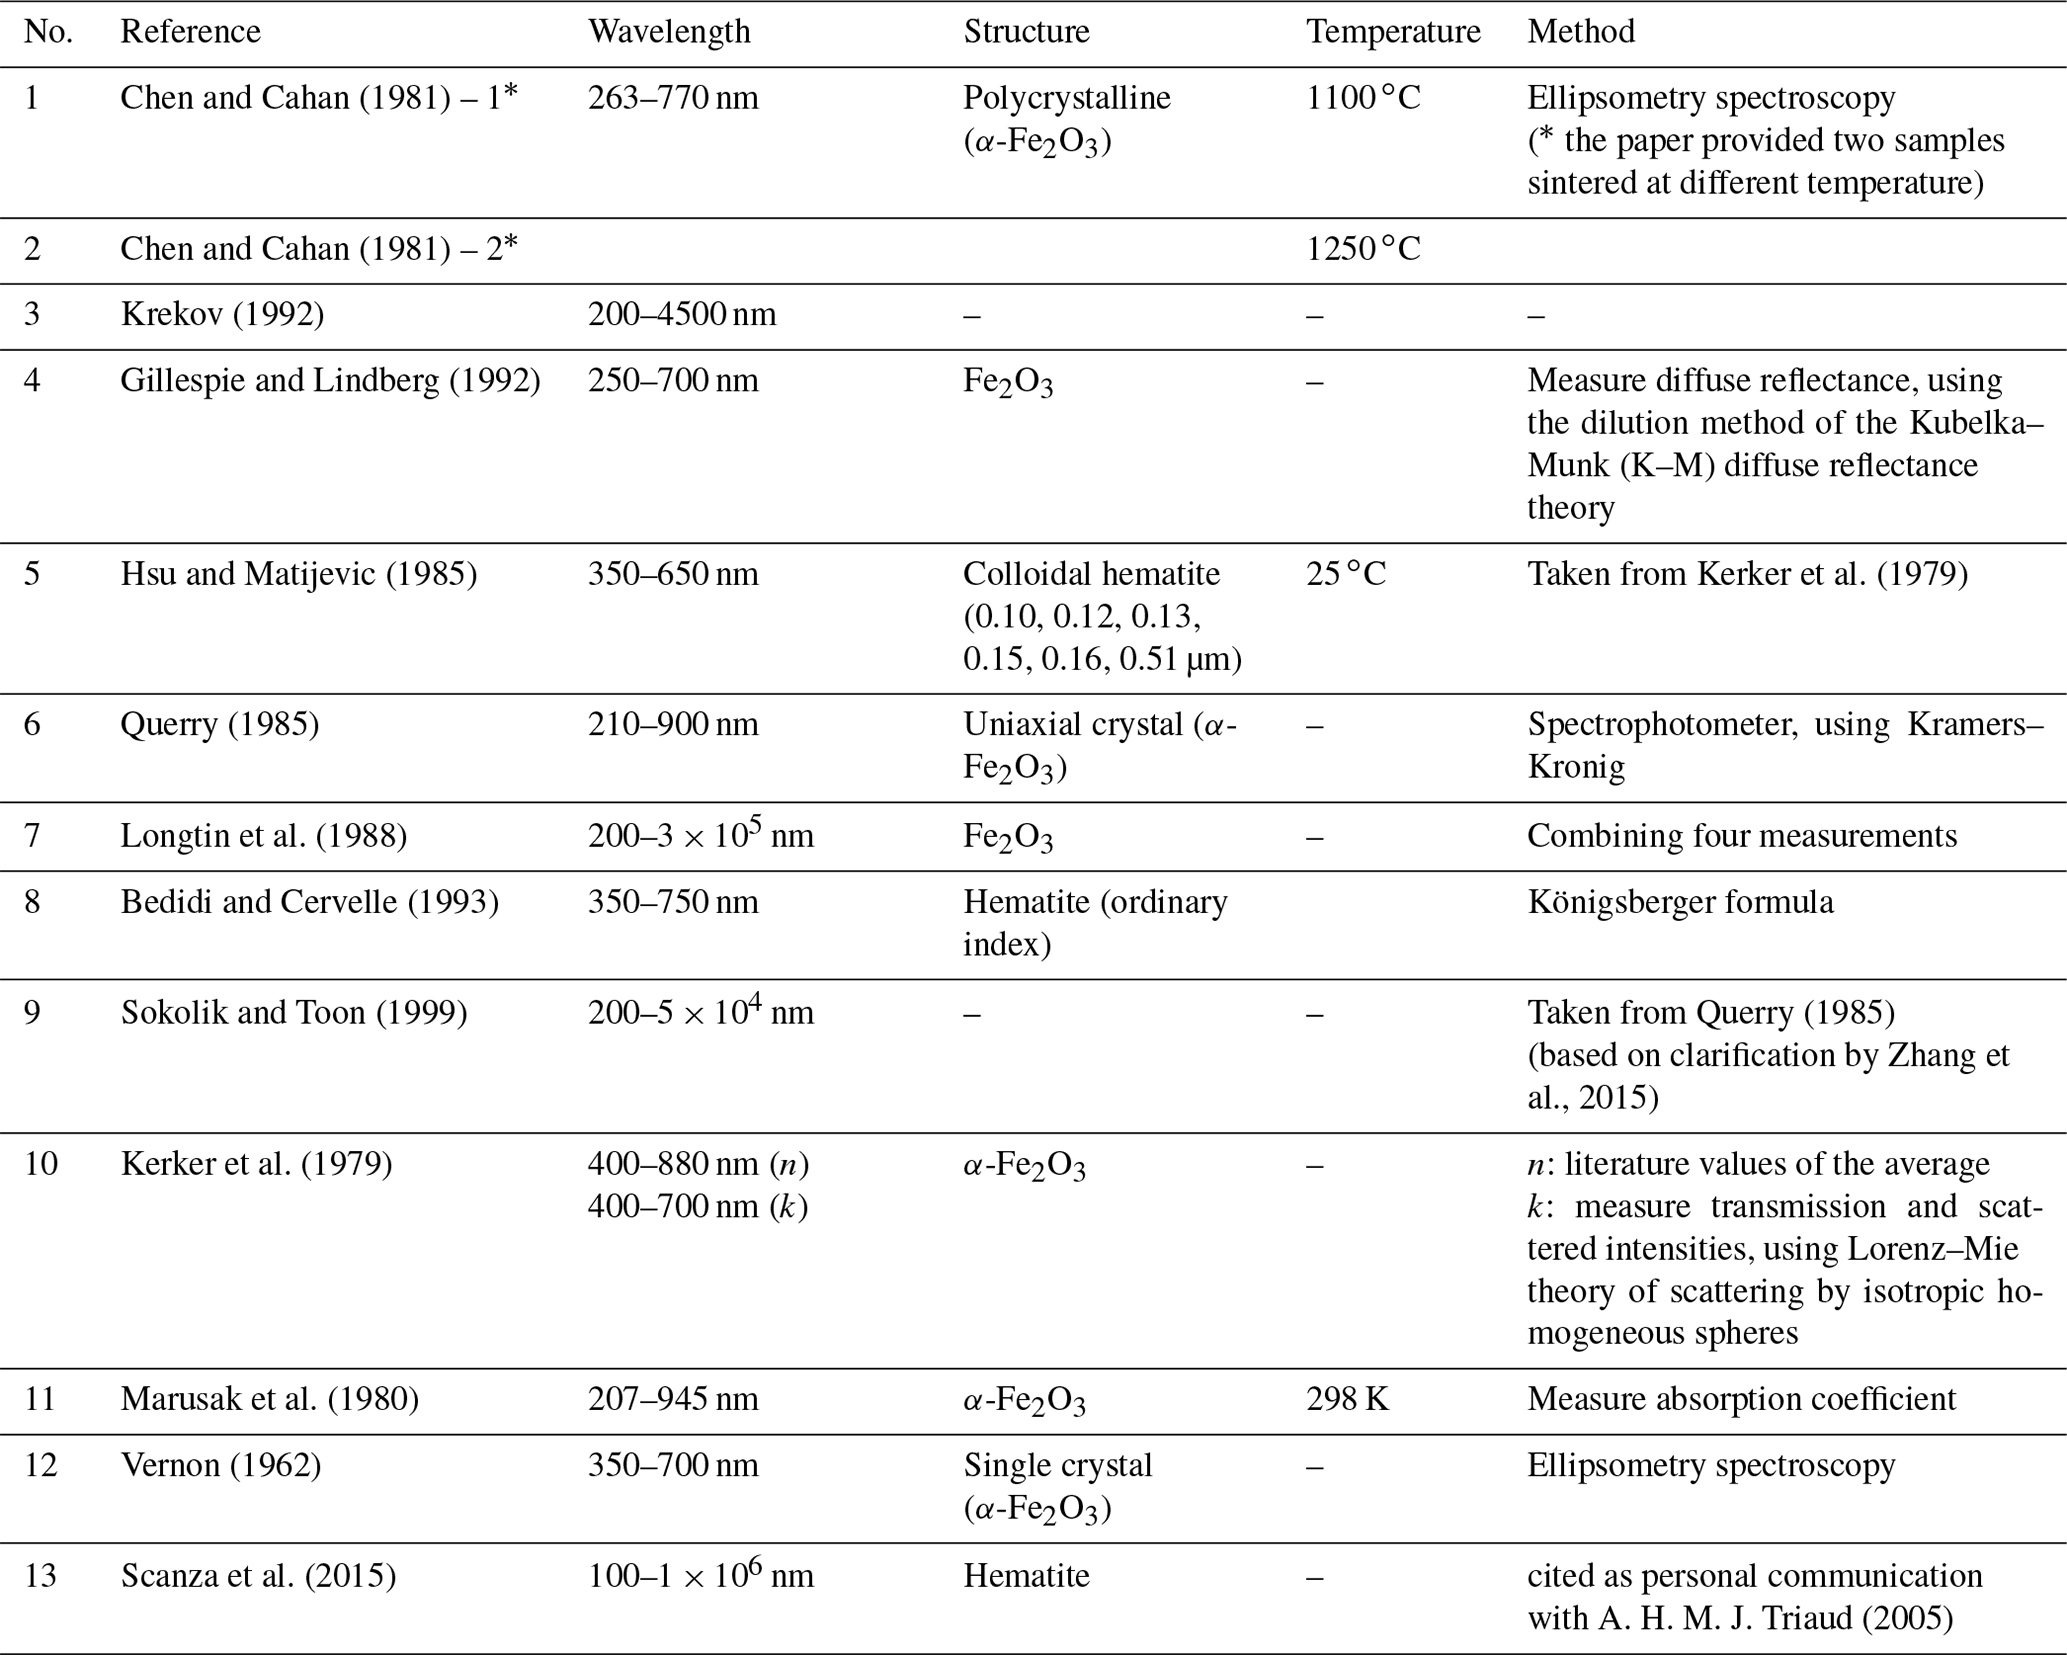
The published values of laboratory-based spectral refractive indices of hematite in the 300–700 nm range are highly variable (Fig. 3; Table 1; Schuster et al., 2016; Zhang et al., 2015). Hematite is a uniaxial crystal with hexagonal structure. The optical functions of hematite (complex dielectric function () or complex refractive index (m)) have been obtained in laboratory studies using techniques such as ellipsometry spectroscopy, which provides complex dielectric functions as a function of the photon energy of ordinary and extraordinary rays (Chen and Cahan, 1981; Vernon 1962); reflectance spectra measurements (Querry, 1985; Sokolik and Toon, 1999; Bedidi and Cervelle, 1993); transmission and scattering measurements (Kerker et al., 1979; Hsu and Matijevic, 1985); diffuse reflectance measurements (Gillespie and Lindberg, 1992); and absorption coefficient measurements (Marusak et al., 1980). The refractive index of hematite has also been calculated by combining four existing measurements of Galuza et al. (1979), Kerker et al. (1979), Steyer (1974), and Onari et al. (1977) (Longtin et al., 1988).
Information on the complex refractive index of goethite is much more scarce, with two types of index having been published by Bedidi and Cervelle (1993) and Glotch and Roman (2009) for 0.45–0.75 and 8–50 µm wavelength ranges, respectively. Hematite and goethite complex refractive indices (or dielectric functions) are needed for the UV–Vis region as a priori information for determination of the retrieved volume fraction of hematite and goethite by MAIAC EPIC (Sect. 2.2). We therefore examined how the volume fractions of hematite and goethite change with the different types of hematite refractive index (Sects. 2.3 and 4).
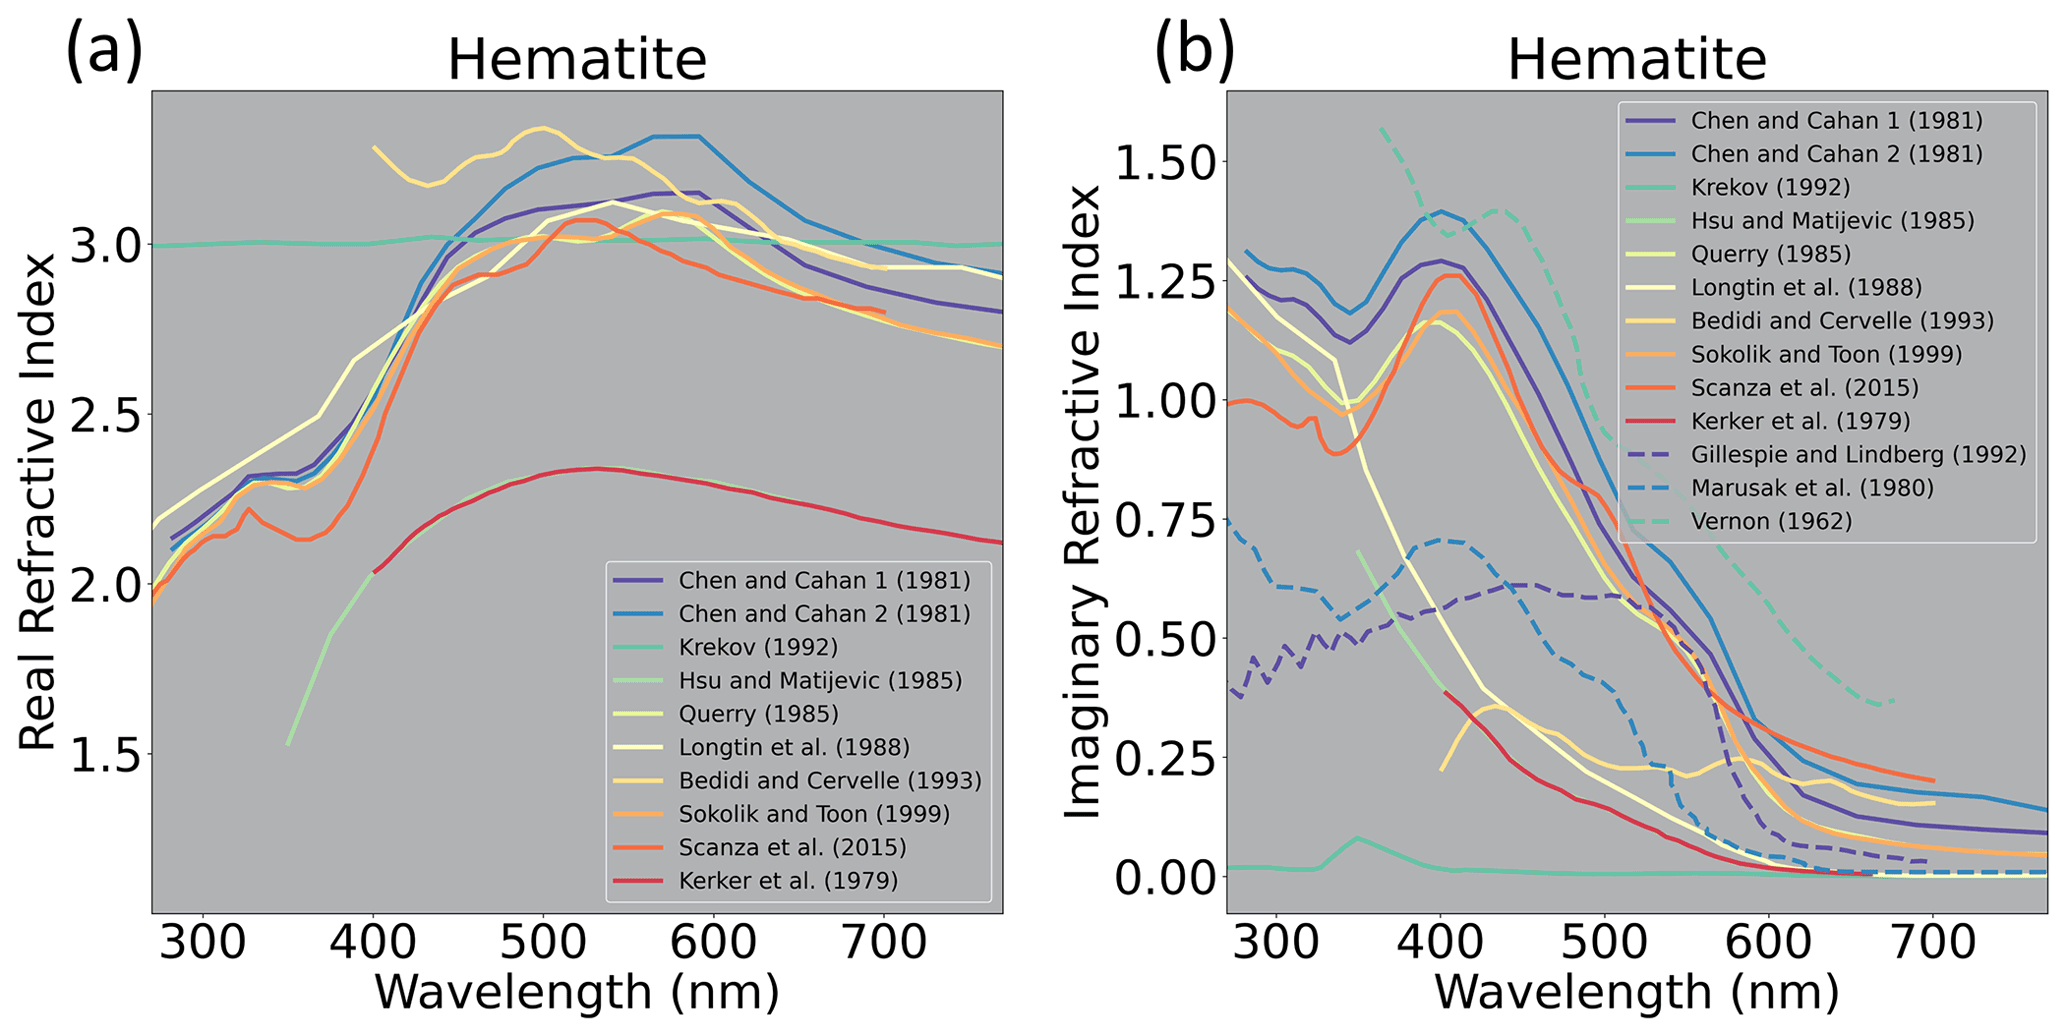
Figure 3Plots of previously published hematite refractive indices at 300–700 nm: (a) real part and (b) imaginary part. The reference information is also summarized in Table 1.
Table 1Summary of hematite refractive index information used in Fig. 3.
Ginoux et al. (2012) described eight different global dust-source regions. We further divided the North Africa dust source into two regions, northern Africa and the Sahel, following Di Biagio et al. (2017), and therefore considered a total of nine different subcontinental dust-source regions (Fig. 4) including northern Africa (region 1), the Sahel (2), East Africa and the Middle East (3), Central Asia (4), East Asia (5), North America (6), South America (7), southern Africa (8), and Australia (9). With EPIC lacking bands beyond 780 nm, MAIAC cannot differentiate between the smoke and dust despite it detecting absorbing aerosols. As smoke is a much more ubiquitous aerosol type, MAIAC makes dust retrievals only over pre-defined dust regions. At present, South America (7) and southern Africa (8) are not designated as dust regions in MAIAC EPIC. For regions 1–6 and 9, we selected 24 significant AOD dust events during 2015–2020 (Table 2; Figs. 5, A1–A6, S1) for this study.
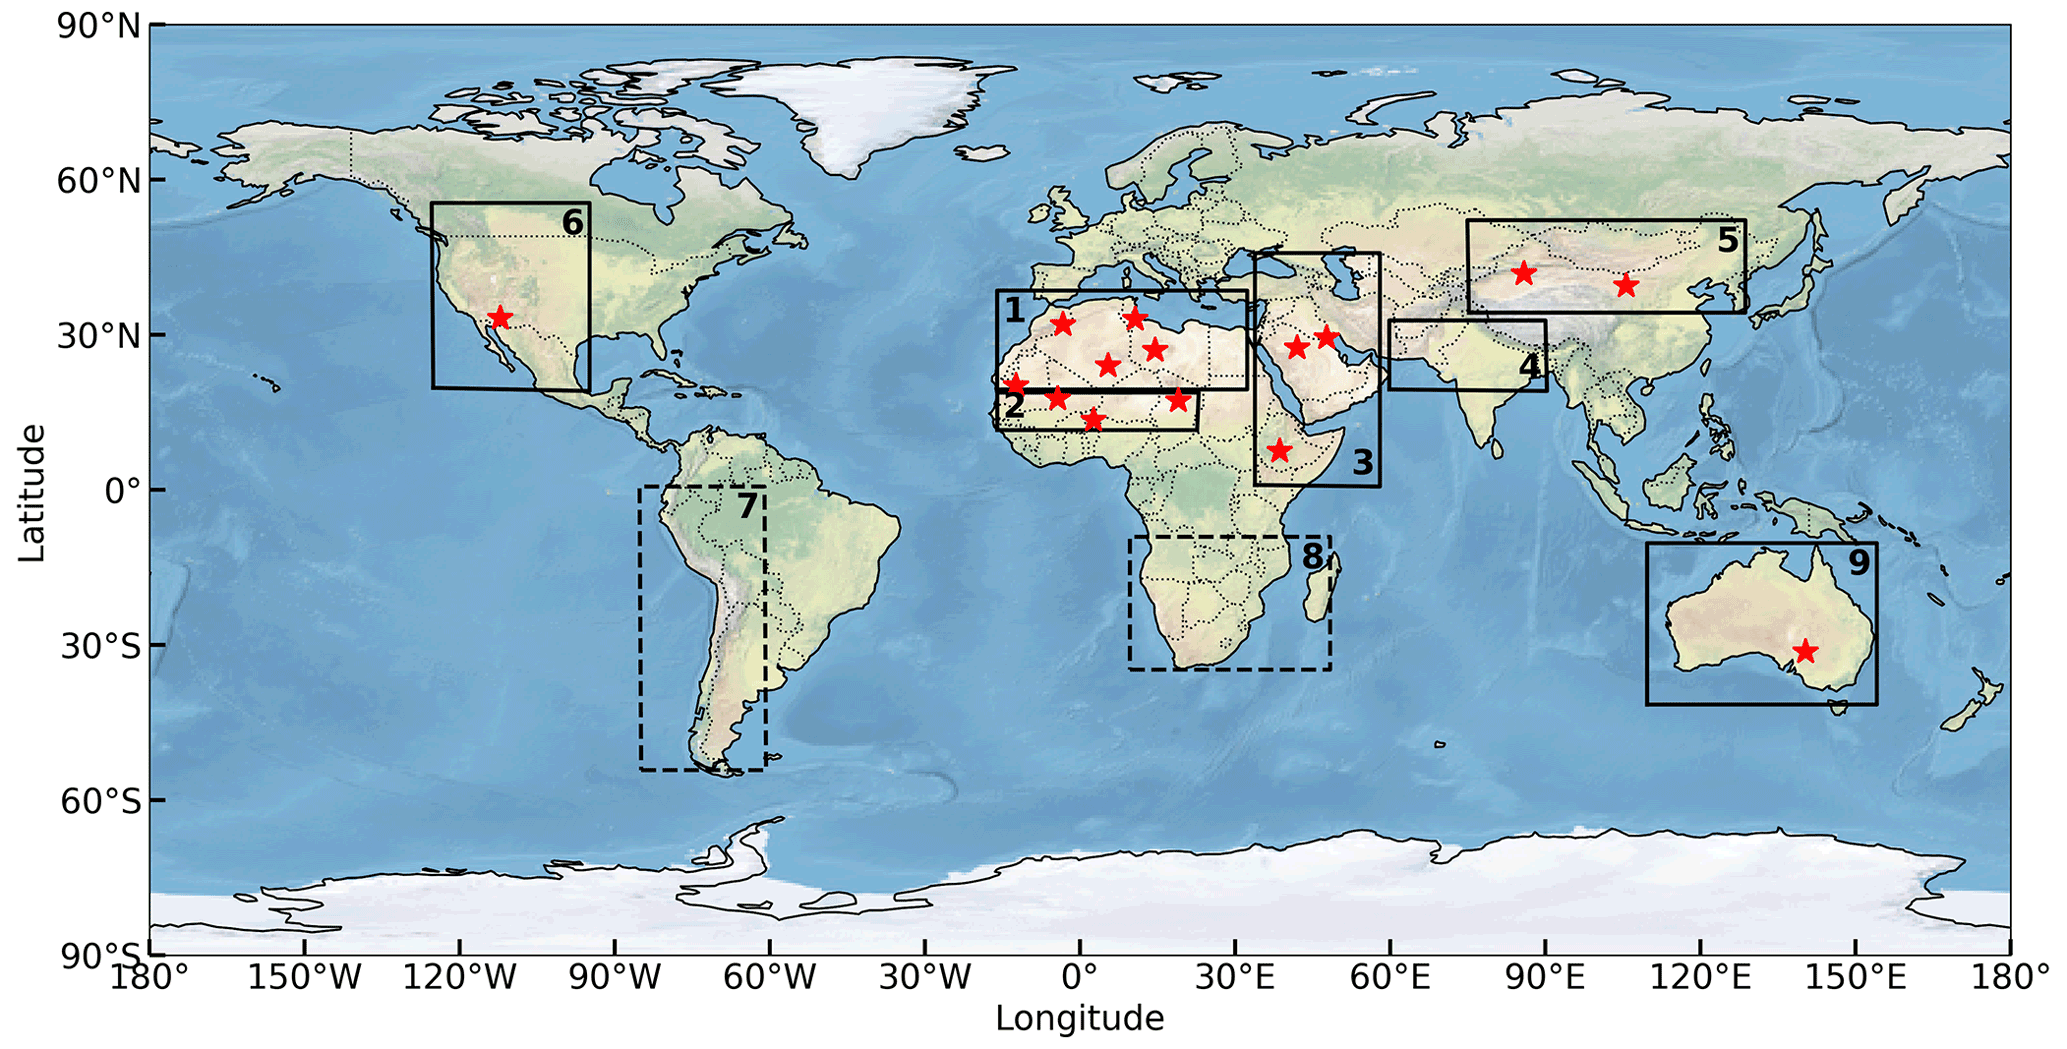
Figure 4The nine main global dust-source regions: (1) northern Africa, (2) the Sahel, (3) East Africa and the Middle East, (4) Central Asia, (5) East Asia, (6) North America, (7) South America, (8) southern Africa, and (9) Australia. From the eight regions originally selected by Ginoux et al. (2012), North Africa was divided into northern Africa and the Sahel (Di Biagio et al., 2017). MAIAC EPIC version 2 does not provide dust aerosol data over regions 7 and 8 (rectangular boxes with dashed lines). The 15 red stars denote locations of Di Biagio et al. (2019) collected soil samples which were analyzed for the iron-oxide content, complex refractive indices, and SSA using laboratory measurements of aerosol generated from these samples.
Table 2Summary of information for selected dust episodes used in this study (Figs. 5, A1–A6). The corresponding aerosol plume height (based on CALIOP) and volume size distribution (based on AERONET version 3; Sinyuk et al., 2020) are additionally presented in Fig. S1.

3.1 Case studies
3.1.1 Northern Africa (Sahara) and the Sahel
Three different dust events over the Sahara and Sahel regions are depicted in Fig. 5, which are the same episodes illustrated by Lyapustin et al. (2021) in their Fig. 4. In winter (late November to mid-March), western Africa is known for its northeasterly dry, dusty wind, the “Harmattan”. In summer, due to the Intertropical Convergence Zone (ITCZ) moving northward by ∼ 20∘ N during July–August and returning south by January (close to equatorial over western Africa; Nicholson, 2018), there is a southwesterly humid monsoon flow from the Gulf of Guinea over the low West African Sahelian area (Formenti et al., 2011b).
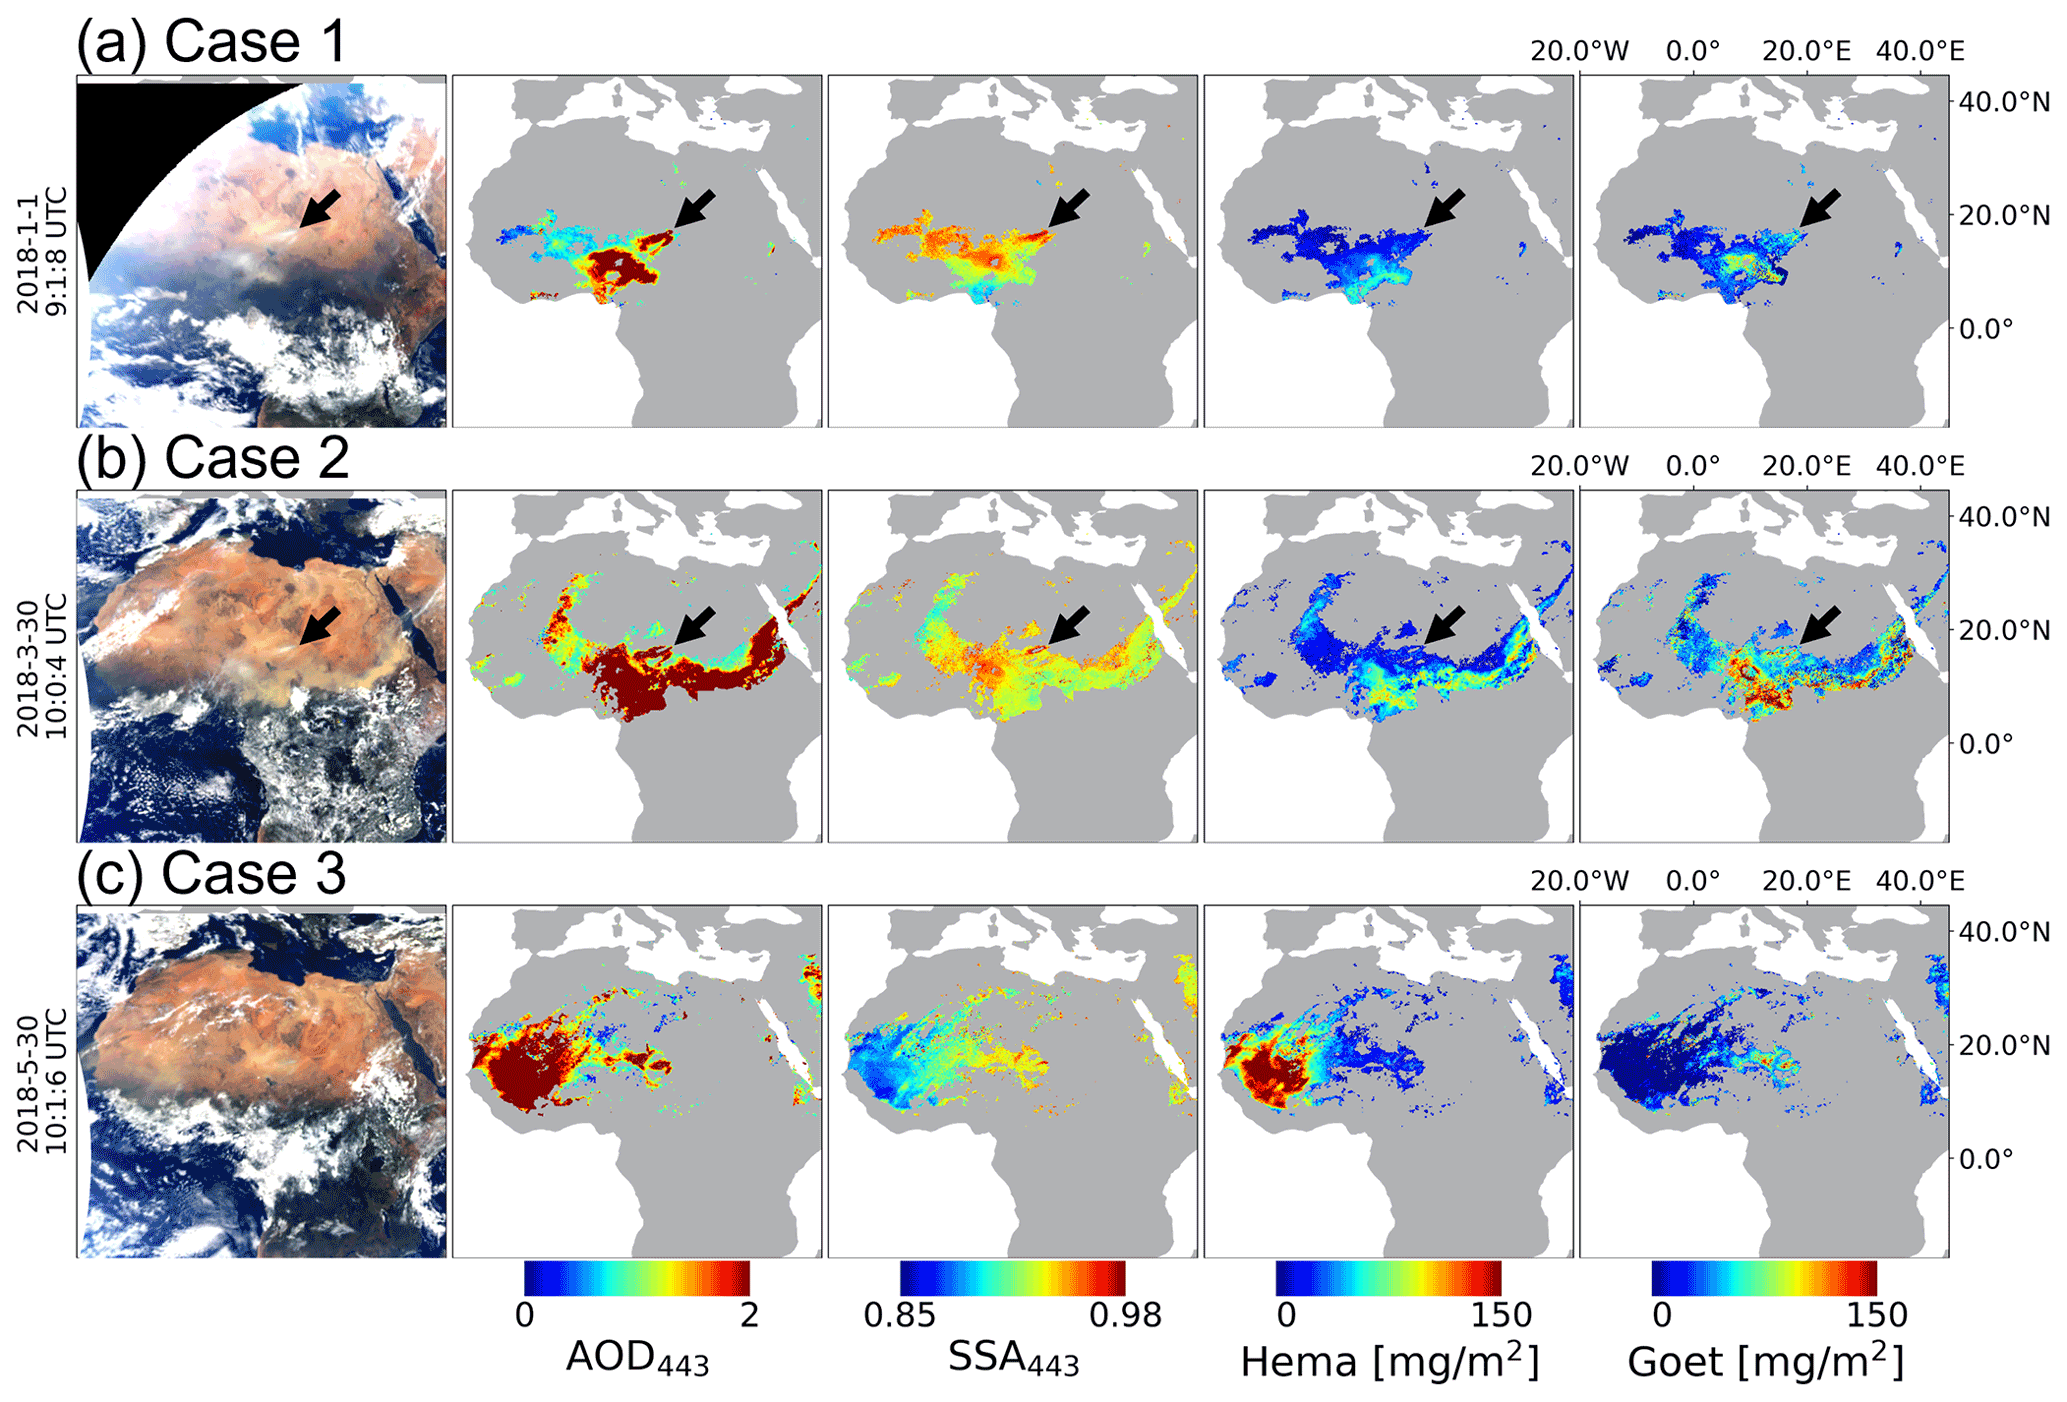
Figure 5Dust episodes over Sahara–Sahel region. From left, RGB TOA image generated from EPIC L1B version 3 data, MAIAC AOD and SSA at 443 nm, and hematite and goethite mass concentrations for 1 January 2018 (a), 30 March 2018 (b), and 30 May 2018 (c). The black arrows point to the Bodélé Depression area.
The topmost row in Fig. 5 shows the Bodélé Depression episode of 1 January 2018. In Chad, this is known as the largest single dust source with low iron-oxide content (∼ 0.7 wt %; Di Biagio et al., 2019) due to the diatomaceous sediments of the region (Todd et al., 2007; Moskowitz et al., 2016). On that particular day, the AOD443 was high at ∼ 2.0 over the Bodélé Depression and there was negligible hematite mass concentration and up to 75 mg m−2 goethite mass concentration, corresponding to 0.5 wt %–1 wt % iron oxide near the source regions by our calculation (not shown), consistent with the 0.7 wt % of Di Biagio et al. (2019). Immediately south of Bodélé, a different dust source was active with higher hematite concentration judging by its reddish color compared with the white dust from the Bodélé Depression.
The second row in Fig. 5 illustrates another dust event of 30 March 2018, with typical values of 443 nm dust SSA of ∼ 0.92. This event began on 28 March near the central Sahara and spread to the Sahara and Sahel regions, where it persisted for about a week, moving south before spreading to the southwest. During these events, our retrieval shows a variable hematite concentration of 75–100 mg m−2, with higher goethite mass concentrations of 75–150 mg m−2 in some areas. This trend toward goethite predominance over hematite in the Sahara and Sahel regions is consistent with the findings of Lafon et al. (2006) and Formenti et al. (2014a), although our results pertain to late March, while the former and latter other studies were laboratory generated from soil and in summer and winter, respectively. In the analysis by Formenti et al. (2014a), the goethite content of iron oxides was 52 wt %–78 wt %, with the highest values being for dust originating in the Sahel. Our analysis shows a similar range (over 50 wt %) of goethite in iron oxides in this event.
The third row in Fig. 5 shows dust events with high hematite contents and highly absorbing (SSA443 ∼ 0.87) properties over the western Sahara on 30 May 2018. Visual analysis indicates that the dust originated in the western Sahara over Algeria and Mali on 27 May and was transported by northeasterly winds toward the western Sahel and then on to the Atlantic Ocean.
Another dust case over northern Africa is shown in Fig. A1, with the top row (21 February 2016) depicting dust blown northward from the Sahara to Portugal and Spain by the Calima, a warm southeasterly wind common in North Africa in winter. On the same day, AERONET measurements at the Valladolid site in Spain detected a coarse-mode aerosol with SSA443 of ∼ 0.875 to ∼ 0.925 (Fig. S1), similar to the MAIAC EPIC SSA recorded over Spain. The second row (22 February 2017) also depicts dust events involving Calima transport from Algeria to Spain. On that particular day, AERONET at the Granada site in Spain detected the coarse-mode size distribution with SSA443 of ∼ 0.90, similar to the MAIAC-retrieved SSA value of ∼ 0.90. The Calima often carries dust to the Canary Islands, although the atmospheric low-pressure systems may deflect the winds northward. On 22 February 2017, the Cloud-Aerosol Lidar with Orthogonal Polarization (CALIOP) detected dust aerosol mostly at 2–4 km (Fig. S1) above southern Spain. Both the first- and second-row cases in Fig. A1 involved the Calima wind and demonstrated hematite transport to the Iberian Peninsula, whereas goethite transport was negligible.
The third (6 August 2015) and fourth (7 August 2015) rows of Fig. A1 describe dust transport north from the Sudan toward southern Egypt near Aswan, which is clearly visible in red–green–blue (RGB) images generated with TOA reflectance. On both these days, the SSA value of the plume as determined by MAIAC was slightly below 0.92, the typical dust SSA value. Ginoux et al. (2012) described this area as the “Nile River Basin”, containing essentially natural sources. Prospero et al. (2002) determined that dust sources over Egypt become active during March–October. Our retrieval results indicate that the iron oxides there comprised mainly hematite with a spatial distribution similar to that of the plume AOD443.
3.1.2 Middle East
Selected dust cases over the Middle East are shown in Fig. A2, where the top two rows (1 and 2 September 2015) represent the general characteristics of the shamal, with hot and dry northwesterly winds blowing toward the Persian Gulf in summer, including the haboob wind. This dust event was triggered on 31 August by a surface low-pressure system on the Syria–Iraq border, moving across Iraq, Iran, and the Persian Gulf region over the next 2 to 3 d. The first row (1 September) in Fig. A2 depicts a cyclone-shaped dust storm with AOD443 > 2 and a moderately absorbing SSA443 value (∼ 0.92). Hematite was located more toward the center of the cyclone, whereas goethite was distributed within its tail, toward the southeastern part of the cyclone core. On 2 September (Fig. A2, second row), the dust storm moved toward the coastline near the Persian Gulf with consistent AOD443 and SSA443 values of ∼ 2 and ∼ 0.92, respectively. However, the reduced spectral absorption exponent b with a slightly increased k0 value indicates a change in chemical composition (not shown). The cyclone appears to have a higher goethite content than hematite in its core. Note that the first row and second row in Fig. A2 are observed at 06:50 and 06:59 UTC, respectively. Therefore, the changed chemical composition is not likely affected by the geometry dependency of the MAIAC EPIC (b, k0) retrieval algorithm.
Figure A2, third row (7 September 2015), shows the dust first emerging on 6 September near the Euphrates in Syria. By 7 September the dust had engulfed Syria, northern Jordan, and southern Turkey over the Mediterranean coast. On 7 September, the Sede Boker AERONET site in southern Israel detected a coarse-mode dominant volume–size distribution and corresponding SSA of 0.89–0.92 (Fig. S1). By 9 September, the dust had moved southwest over northeastern Egypt, and the Sede Boker AERONET site detected AOD443 > 2.75 (version 3, level 2; Giles et al., 2019). Ginoux et al. (2012) described this source region as comprising “anthropogenic”, “natural”, and “hydrologic” aerosol and named it the “Mesopotamia source”, which is most active during June–August. Ginoux et al. (2012) considered it natural if < 30 % of the area was agricultural; otherwise it was anthropogenic (> 30 % agricultural). If the dust-event incidence was associated with ephemeral water bodies, the source was termed hydrologic. For the Euphrates area, farmland northeast of the city of Ar Raqqah in Syria has the most frequently active anthropogenic dust sources (Walker et al., 2009), and several salt-flat areas near the Iraq–Syria border are significant natural dust sources (Ginoux et al., 2012). Our retrieval results indicate that on 6 September, hematite was predominant northeast of Ar Raqqah, but on 7 September (third row, Fig. A2) the goethite content was predominant, likely owing to different land use (Fitzpatrick, 2004; Journet et al., 2014).
The Fig. A2, fourth row, episode (28 July 2018) describes another dust event in the shamal over the Rub' al Khali sandy desert area. This event swept across the Arabian Peninsula during 27–28 July, with a swirling cyclone shape over part of the Persian Gulf, Gulf of Oman, Arabian Sea, and Gulf of Aden during 29–30 July. Near this dust-storm region, there are two dust sources (Ginoux et al., 2012), the “Empty Quarter” and “highlands of Saudi Arabia”. The former refers to a salt-flat region named Sabkha Matti on the border between the United Arab Emirates and Saudi Arabia. The latter lies in the northern Rub' al Khali sandy desert area, which comprises three dry riverbeds (Ginoux et al., 2012). Our chemical-composition retrieval results (Fig. A2) indicate a hematite-dominated distribution overall but mixed with goethite along the coast of Oman.
3.1.3 Central Asia (India)
A dust event over India is depicted in Fig. A3. Large amounts of dust were observed during the pre-monsoon season of March–May over northern India, with the lowest dust incidence in the post-monsoon season of September–November (Ginoux et al., 2012). Pre-monsoonal dust storms are attributed primarily to the Arabian Peninsula and the Thar Desert, with wind transport to northwestern India (Sarkar et al., 2019). Three 2018 dust storms (Fig. A3) swept across the Rajasthan and Uttar Pradesh regions by westerly or southwesterly winds from western India. The Himalayan mountain region blocks dust movement further north and usually deflects transport eastward.
Figure A3, first row (3 May 2018), indicates dust with AOD443 values of 1–2 near Rajasthan with an SSA443 value of ∼ 0.92. Despite the uniform SSA over the aerosol plume, our compositional retrieval results indicate that hematite was predominant in the northern part of the plume, with goethite occurring only in that part over the Thar Desert near to the border with Pakistan or over coastal areas of western India.
A week later (second row, 14 May 2018) and a month later (third row, 14 June), the same Rajasthan region suffered severe dust storms again, with these being recorded as anomalously intense dust storms. In the latter event, dust was trapped over northern India by southerly winds from the Bay of Bengal. In both cases, hematite was concentrated more toward the center of the plume, with concentrations of > 100 mg m−2, whereas the goethite content was small (< 50 mg m−2).
The Kanpur region of northern India may have aerosol properties reflecting mixtures of pollution aerosol from the combustion of fossil fuels and biofuels and desert dust (Eck et al., 2010). During the events depicted in Fig. A3, the AERONET inversion data (version 3, level 2) for Karachi (northwestern coast of India) indicated a coarse-mode dominant size distribution on 3 and 14 May (second and third rows, Fig. A3) with SSA values of ∼ 0.9 (Fig. S1), whereas in the Kanpur region (northern India) small bio-modal size distributions were detected (fine/coarse volume–size distribution peak on 3 May, on 13 May, on 14 June). This implies that dust aerosol might have been mixed with fine-mode pollution aerosol over northern India. Our retrieval algorithm currently fits only the pure-dust model, so the retrieved hematite and goethite concentrations may be biased in this case.
3.1.4 East Asia
In East Asia, there are two main regional sources of mineral dust, the Taklimakan and Gobi deserts. Figure A4 (first and second rows) illustrates a Taklimakan Desert dust event in spring (30 April and 1 May 2016). During this event, dust was transported by easterly winds and circulated clockwise around the Tarim Basin for 2 d. The Tarim Basin is flanked by ∼ 5 km high mountain ranges to the west, south, and north; therefore, dust storms usually blow in from the east at low levels, trapping the event in the basin. Strong surface winds may carry dust to altitudes of ∼ 10 km, transporting it across China and the Pacific Ocean. On 30 April 2016, a severe dust event (AOD443 ∼ 2.0) with SSA443 values of ∼ 0.90 displayed hematite predominance over goethite at 07:27 UTC. Over the next 2 d, the SSA443 increased to ∼ 0.95 with the reduced hematite content while goethite content increased slightly to 50–60 mg m−2.
Figure A4, third row, describes a dust event originating in the Gobi Desert with dust being transported to Russia over East Asia. This event was pushed by a cold front over the Gobi Desert near the border of China and Mongolia and was clearly captured by MODIS Aqua on 3 May 2017 (not shown). On 4 May the dust moved to the Russian border just east of Mongolia in a cyclonic circulation, bypassing the Beijing area. The AERONET sites in Beijing (Fig. S1), Beijing_RADI, and XiangHe detected coarse-mode dominant volume–size distributions with SSA values of ∼ 0.91 on 4 May, implying pure-dust aerosol. Our algorithm retrieved moderate goethite concentrations (∼ 75 mg m−2) with low hematite concentrations (< 50 mg m−2).
3.1.5 North America
Dust events over North America near the White Sands in New Mexico are illustrated in Fig. A5, for 31 March 2017 (first and second rows) and 10 April 2019 (third and fourth rows). The highest frequencies of dust events over North America occur in the southwestern USA and northern Mexico at up to 30 % of the time in spring (Ginoux et al., 2012). However, MAIAC EPIC version 2 does not retrieve dust aerosol over the southwestern USA, so only northern Mexico events are considered here.
On 31 March 2017 (first and second rows, Fig. A5), MAIAC captured dust patterns changing hourly in the southern White Sands area. The likely dust source was the Chihuahuan Desert near the border of Mexico and New Mexico, south of El Paso International Airport, or near Janos in Mexico (based on MODIS RGB images not shown here). In both the 31 March cases, the goethite concentration was not much (< 50 mg m−2). Hematite was also rare at 19:05 UTC (first row) with AOD443 < 1.0 and SSA443 ∼ 0.91 but reached 50–75 mg m−2 at 20:53 UTC (second row), increasing to AOD443 > 1.5 and SSA443 < 0.91.
The 10 April 2019 dust storm was induced by a low-pressure meteorological system. Winds lofted dust from several sources around the region, including the White Sands area, Lordsburg Playa in southwestern New Mexico, the Chihuahuan Desert, and near the border of Mexico and New Mexico. In Fig. A5 (third and fourth rows), the white circle of the White Sands is located near the center of the RGB image. Dust storms passed to the southeast of that area with moderate hematite contents (50–75 mg m−2) and small goethite contents (< 50 mg m−2).
3.1.6 Australia
Australia is often referred to as the “red continent” (Viscarra Rossel et al., 2010), with highly absorbing dust aerosols (Di Biagio et al., 2019). In Fig. A6, the first (12 February 2019, 03:44 UTC) and second (05:32 UTC) rows depict a dust event near Lake Eyre and Lake Blanche, both salt lakes in central South Australia – an area considered the “Lake Eyre basin”, which is the most active dust source in Australia (Ginoux et al., 2012). Hourly EPIC RGB images indicate that the event started on 12 February at 01:56–03:44 UTC (not shown). On that day, the AERONET sites at Birdsville (25.9∘ S, 139.3∘ E), in the northwest of the dust plume, detected a coarse-mode-dominant volume–size distribution with SSA443 ∼ 0.82 at 07:23 UTC (Fig. S1). Our retrieval results (SSA443 < 0.85) indicate high hematite concentrations, attributable to the iron-rich soils in the region.
On 13 February (third row, Fig. A6), the dust likely left over from the previous day kept moving by southwesterly wind. The CALIOP instrument detected dust aerosol over eastern Australia at 32–26∘ S at 0–3 km height (Fig. S1). The northern part of the dust plume might have passed the source of Simpson Desert, where dust activity is most frequent in the austral spring and summer (Ginoux et al., 2012). Overall, hematite was predominant over the area with AOD443 > 1.5.
3.1.7 Summary plot of the case studies
The 24 cases described here are summarized in Fig. 6. Over the Sahara, Sahel, and the Middle East, the iron-oxide volume fractions are comparable with those over North America, but the high AOD443 values yield higher mass concentrations than those in North America. Although Australia had lower AOD443 values than those of the Sahara, Sahel, and Middle East, the high volume fraction equated with high mass concentrations of hematite. The mass concentration of iron oxide was relatively low over India, East Asia, and North America. Figure 7 shows the relationship between the iron-oxide mass fraction, SSA443, and the imaginary refractive index at 443 nm. The previous study of Di Biagio et al. (2019) and Moosmüller et al. (2012) dealt with this relationship to estimate the spectrally resolved SW absorption of dust based on composition. Our retrievals were consistent with results of Di Biagio et al. (2019) in the relationship between the iron-oxide mass fraction and SSA443 but showed a discrepancy in the relationship between the iron-oxide mass fraction and imaginary refractive index at 443 nm likely due to the use of a spherical particle shape in the Di Biagio et al. (2019) calculation of the imaginary refractive index (Kalashnikova and Sokolik, 2004).
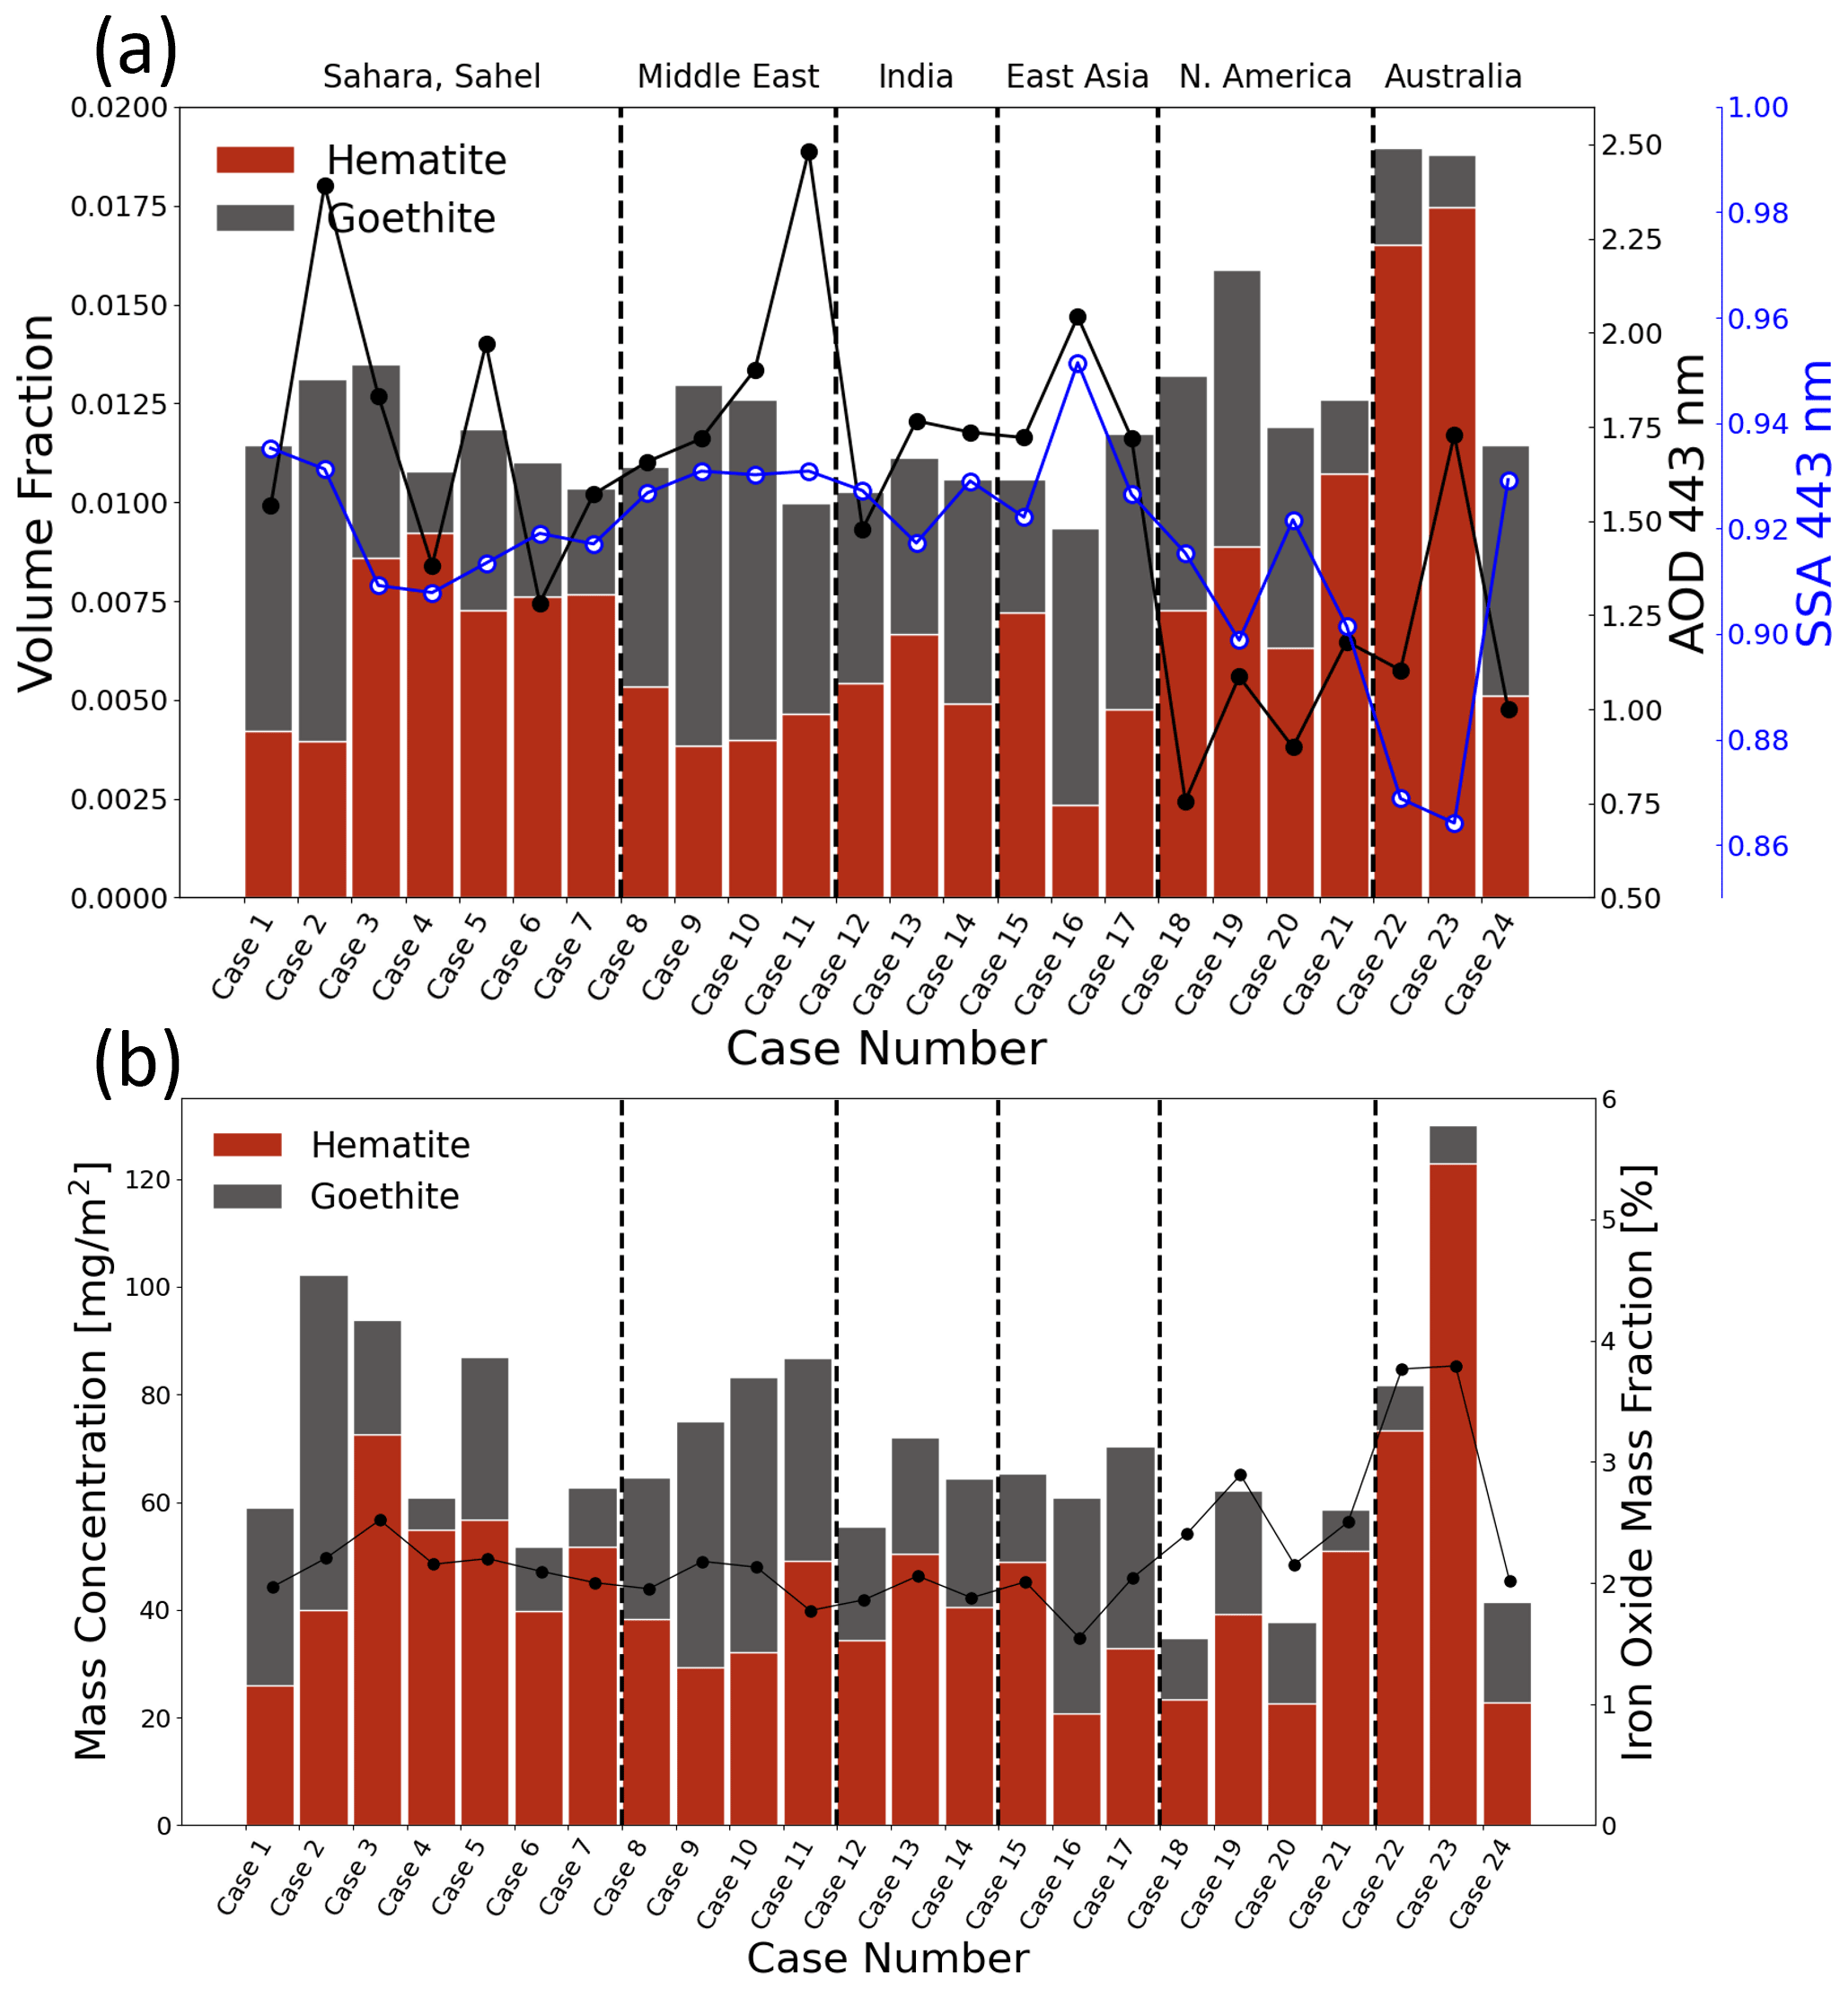
Figure 6Bar plot for the 24 cases described in Sect. 3.1. Case numbers for each row from Figs. 5 and A1–A6 are shown on the x axis and summarized in Table 2. (a) Mean volume fractions of hematite (red) and goethite (dark gray). Black and blue points show the corresponding mean AOD (right axis) and SSA at 443 nm for each case. (b) Mean mass concentrations of hematite (red) and goethite (dark gray). Black points indicate the corresponding iron-oxide mass fraction (wt %; right axis) of total dust concentration. Iron-oxide mass fraction is calculated as .
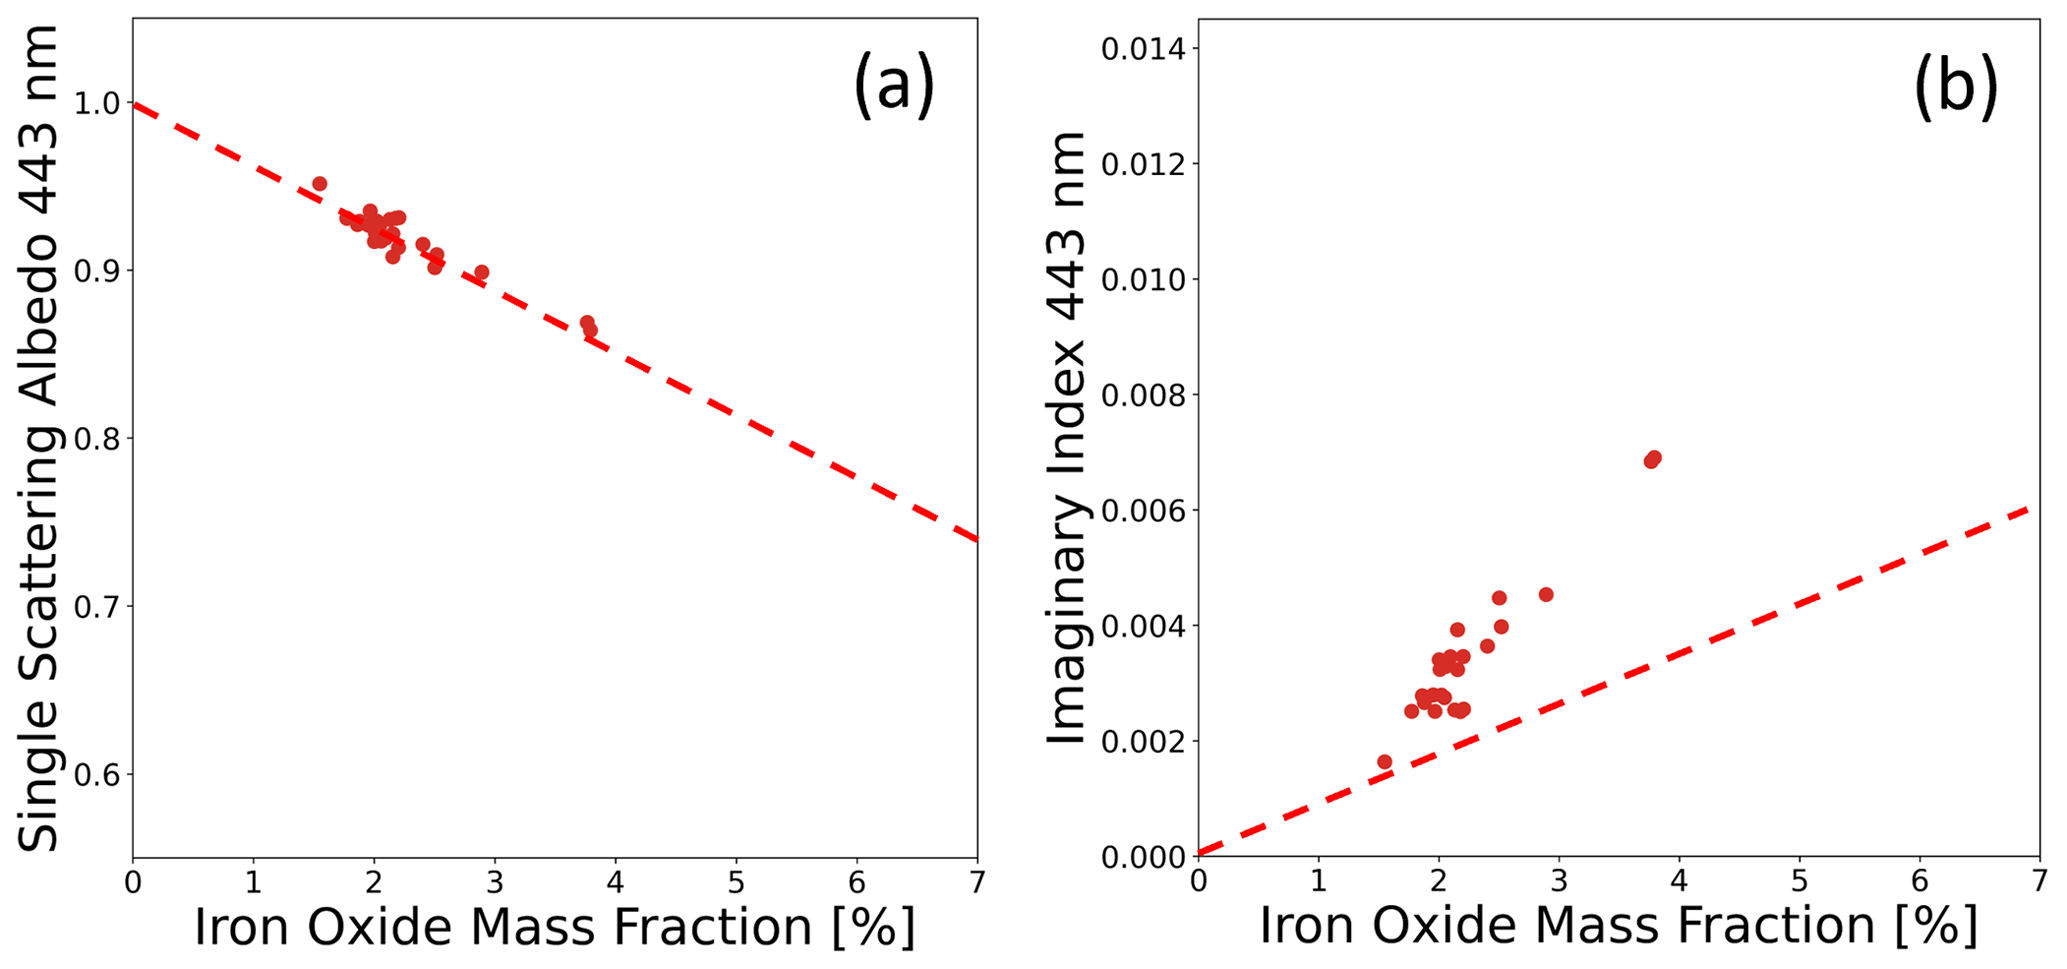
Figure 7Relationship between the iron-oxide mass fraction (wt %; x axis) and SSA 443 nm (y axis, a) and the imaginary refractive index (y axis, b). Red points represent the mean values of the 24 cases described in Sect. 3.1. The dashed line shows the estimated relationship at 443 nm from Di Biagio et al. (2019).
3.2 Comparison with in situ measurements of soil samples
Di Biagio et al. (2019) analyzed aerosols generated from natural soil samples from 19 main dust-source regions representing global dust optical properties and determined their hematite and goethite contents by the X-ray absorption near-edge structure (XANES) method, providing bulk compositions of pure-dust aerosol in dry conditions with a time span typical of 2–6 d of transport following emission. We compare their measured hematite and goethite mass concentrations (wt %) with our retrieval results over 15 sites in Fig. 8 (for statistics, see Table S1). Each site represents an area of ±1∘ of MAIAC EPIC data except for Australia, where the box size was expanded to ±3∘ to accumulate enough retrievals. Only satellite pixels with AOD443 > 1.0 were used in the monthly composite, as some pixels of goethite retrieval with AOD443 < 1.0 display “noise” or “blob” patterns (e.g., third and fourth rows, Fig. A1). This noise may be attributed to the low signal-to-noise ratio at low AOD.
In Fig. 8, Tunisia (33.02∘ N, 10.67∘ E) and Morocco (31.97∘ N, 3.28∘ W) represent northern Africa; Libya (27.01∘ N, 14.50∘ E) and Algeria (23.95∘ N, 5.47∘ E) represent the central Sahara; Mauritania (20.16∘ N, 12.33∘ W) represents western Africa above the Sahel latitude (∼ 20∘ N; Niger (13.52∘ N, 2.63∘ E), Mali (17.62∘ N, 4.29∘ W), and Bodélé (17.23∘ N, 19.03∘ E) represent the Sahel; Ethiopia (7.50∘ N, 38.65∘ E) represents East Africa; Saudi Arabia (27.49∘ N, 41.98∘ E) and Kuwait (29.42∘ N, 47.69∘ E) represent the Middle East (especially the Arabian Peninsula); the Gobi (39.43∘ N, 105.67∘ E) and Taklimakan (41.83∘ N, 85.88∘ E) represent East Asia; Arizona (33.15∘ N, 112.08∘ W) represents North America; and Australia (31.33∘ S, 140.33∘ E) is represented by sites near Lake Eyre in central South Australia. The locations of all of the above are shown in Fig. 4.
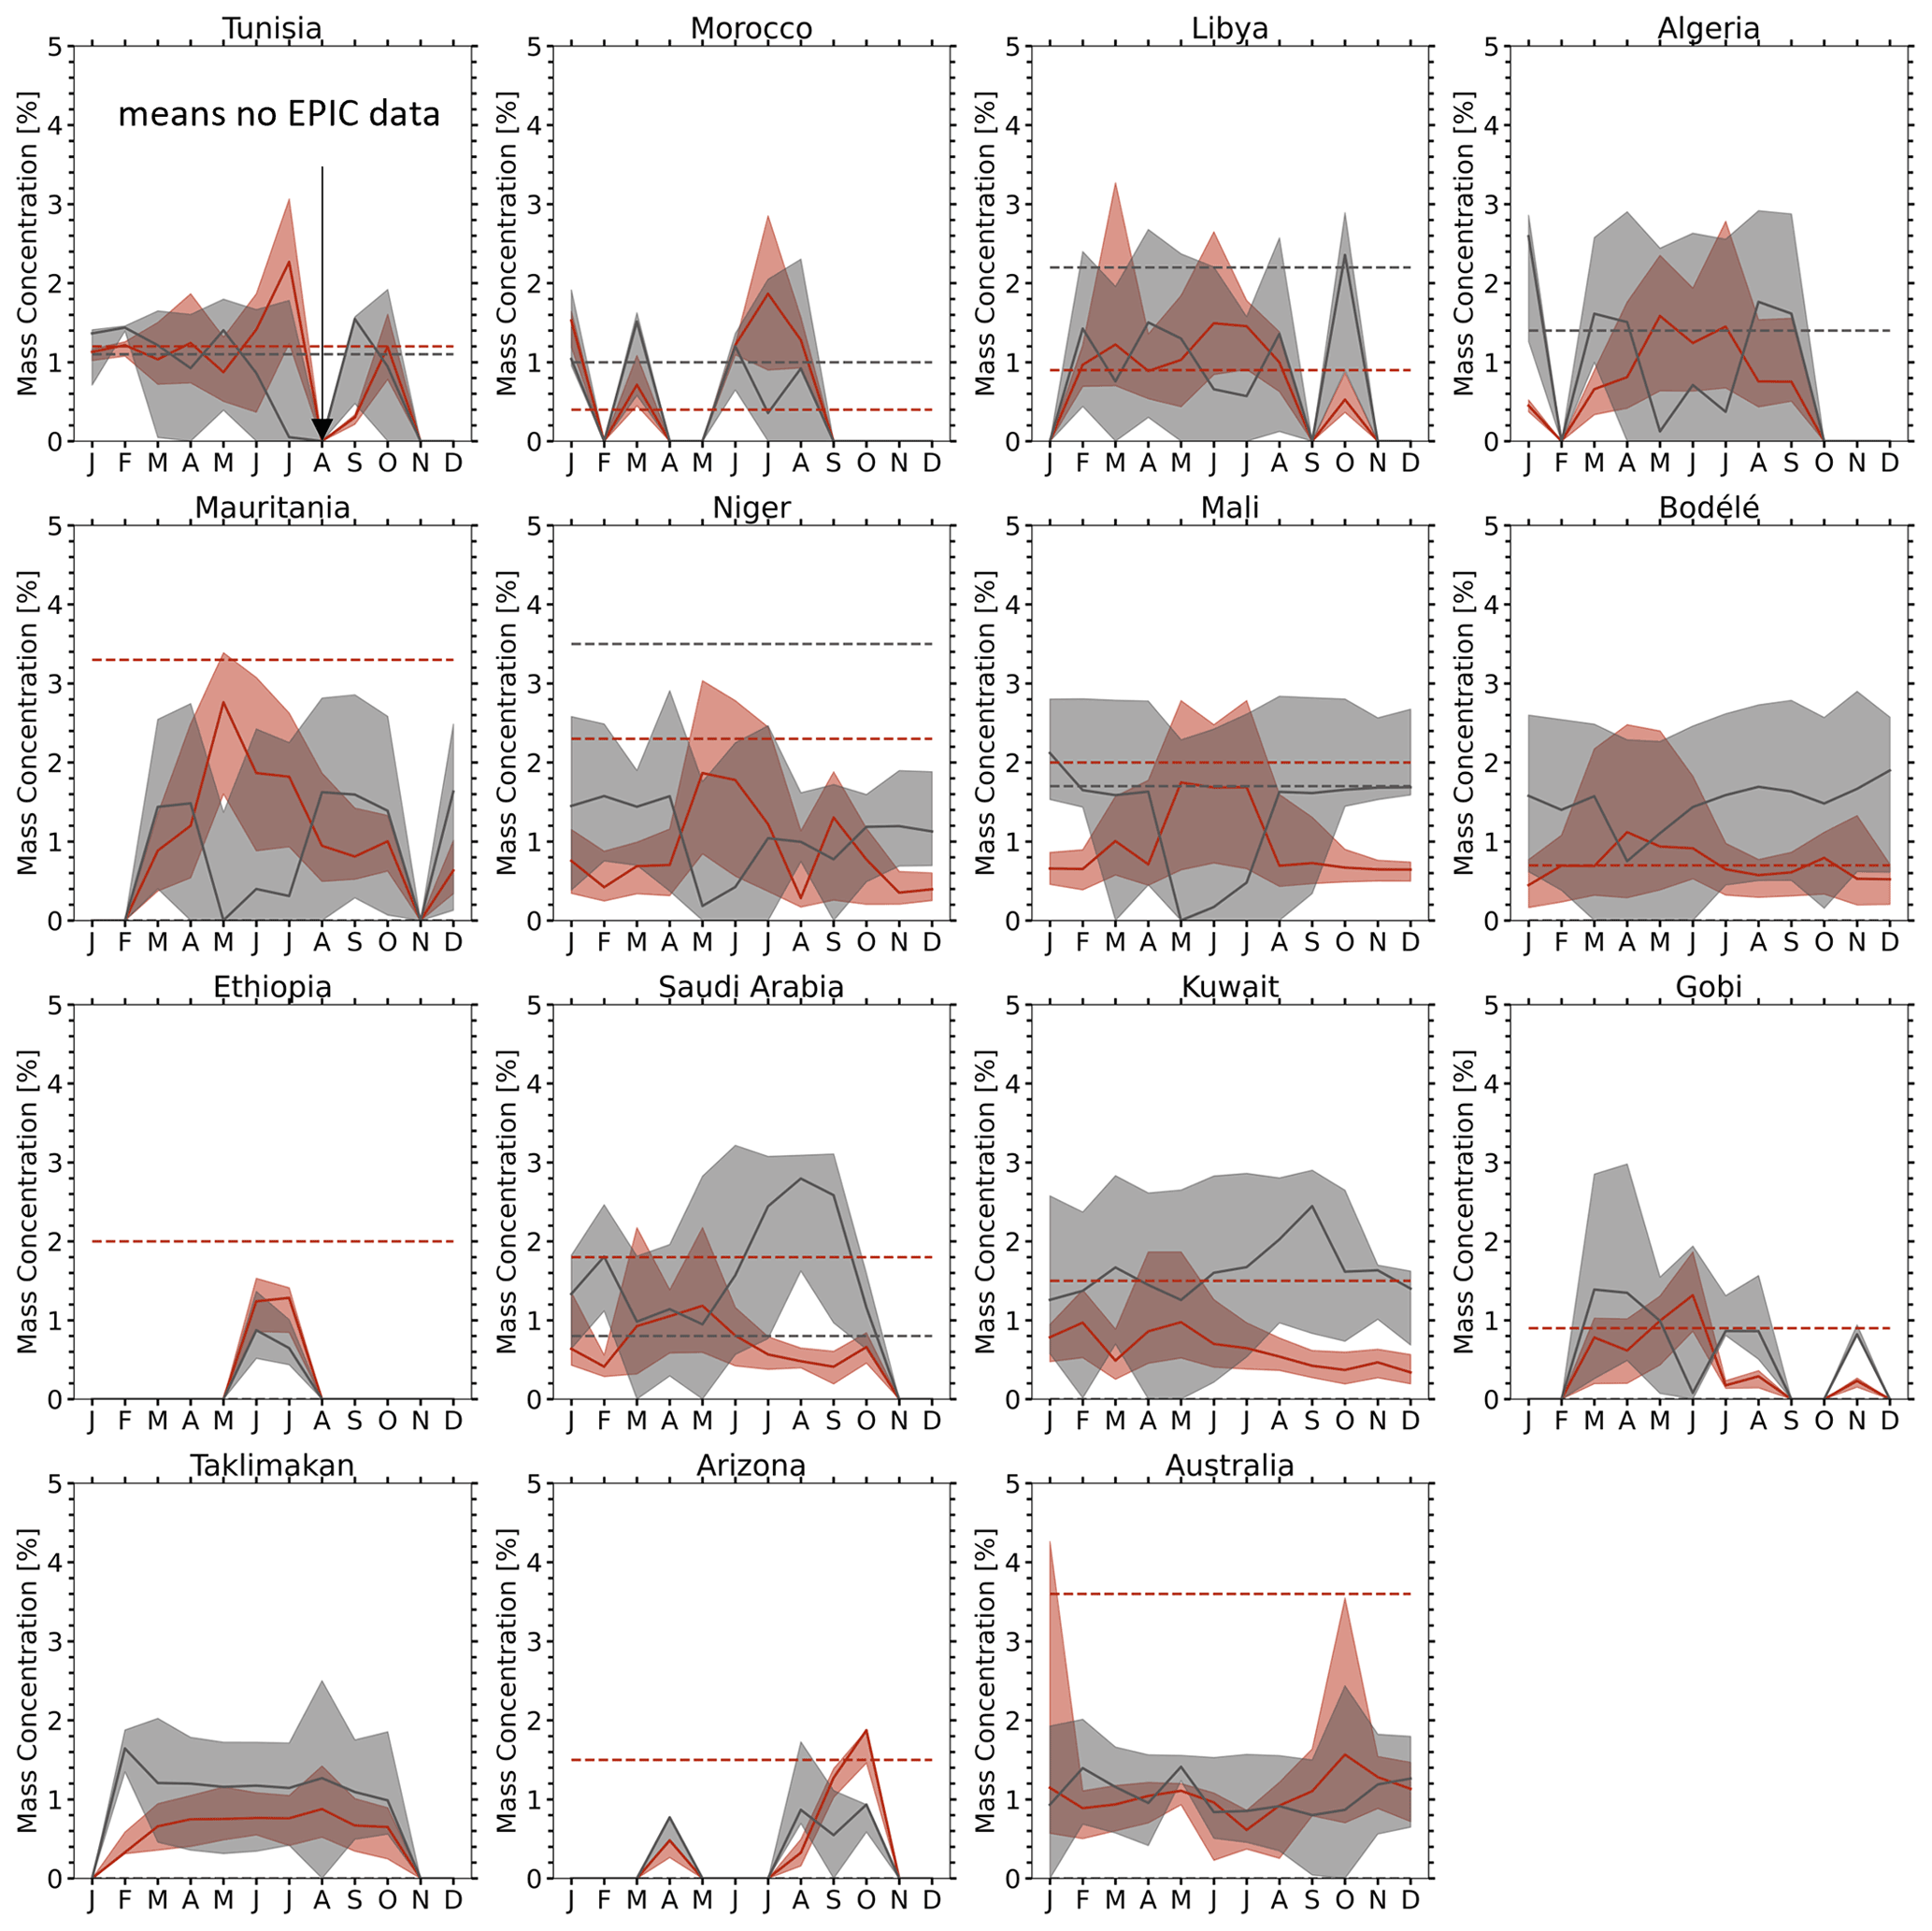
Figure 8Monthly variations (5th, 50th, and 95th percentiles) of hematite (red shading) and goethite (gray shading) mass concentration (wt %) calculated from MAIAC EPIC at each site for 2018. Solid lines at the centers of shaded areas indicate median values for hematite (red) and goethite (black). Each site represents an area of ±1∘ of MAIAC EPIC data (pixel with AOD > 1.0) except for Australia (±3∘). Dashed lines indicate hematite (red) and goethite (black) mass concentrations with ±10 % uncertainty (Di Biagio et al., 2019). At the Algeria site, the two dashed lines coincide (Di Biagio et al., 2019). The invisible dashed lines of goethite (dashed black line) at Mauritania, Bodélé, Ethiopia, Kuwait, the Gobi, Arizona, and Australia indicate zero goethite mass concentration. Di Biagio et al. (2019) do not provide data at the Taklimakan site. Monthly variation statistics are additionally presented in Table S1.
Although Di Biagio et al. (2019) collected data in each origin, the EPIC-retrieved hematite and goethite data may represent both local erosion and transported iron oxides, and these datasets may differ owing to seasonally and spatially varying dust transport from the different sources. Overall, however, our retrieved data tend to cover their entire range of hematite and goethite mass concentrations, except for the Niger site.
3.2.1 Characteristics over northern Africa and the Sahel – Libya, Algeria, Mauritania, Niger, Mali, and Bodélé
Sites in the central Sahara and Sahel, such as Libya, Algeria, Mauritania, Niger, Mali, and Bodélé, and in the Middle East, such as Saudi Arabia and Kuwait, exhibit greater temporal variability than other sites, implying large dynamic dust-source variability in the Sahara, Sahel, and Middle East.
In the Sahara and Sahel, goethite is usually the predominant iron-oxide species by mass (Di Biagio et al., 2019; Lafon et al., 2006; Formenti et al., 2014a, b), as also indicated partially by our results. At four sites (Mauritania, Niger, Mali, and Bodélé) in the Sahel, goethite predominated over hematite during August–April, which included the Harmattan period. However, in early summer (May–July), the median hematite value was higher than that of goethite at these four sites, with higher hematite concentrations in the western Sahel peaking in May (Mauritania ∼ 2.9 wt % > Niger ∼ 2 wt % > Mali ∼ 1.8 wt % > Bodélé ∼ 1.2 wt %). The analysis data of Di Biagio et al. (2019) displayed a similar trend (Mauritania 3.3 wt % > Niger 2.3 wt % > Mali 2.0 wt % > Bodélé 0.7 wt %). Formenti et al. (2011a) and Lazaro et al. (2008) found that hematite is likely to predominate over goethite. Lazaro et al. (2008) detected hematite-to-goethite ratios of 0.5–2.0 in the Canary Islands, sourced from chotts in Tunisia and northern Algeria (PSA NAF-1) and foothills of the Atlas Mountains in the western Sahara and western Mauritania (PSA NAF-2), and the Mali region. Lazaro et al. (2008) also found hematite-to-goethite ratios of > 1.0 in samples from February, March, May, August, September, and December and ratios of < 1.0 in January, February, June, August, and September. Schuster et al. (2016) described a maximum volume percentage of iron oxides associated with hematite (%) of 83 %–93 % (median volume percentage of iron oxides associated with hematite of 38 %–58 %) over western Africa for pure-dust cases, with the calculated percentage depending on the hematite refractive index. The high-hematite dust regions are thus likely to exist in Mauritania, Niger, and Mali in summer.
3.2.2 Tunisia, Morocco
In Tunisia, the median values of monthly composite of hematite and goethite are similar to those of Di Biagio et al. (2019; hematite, 1.2 wt %; goethite, 1.1 wt %) during January–May and in October, with retrieval values of ∼ 1.2 wt % for both. Data for the Morocco sites also agree well with those of Di Biagio et al. (2019) in March (hematite, 0.4 wt %; goethite, 1.0 wt %). However, the hematite concentration (∼ 2 wt %) was overestimated relative to Di Biagio et al. (2019) data during June–August over both Tunisia and Morocco. Li et al. (2021) mentioned that hematite content in soil climatology J2014 (Journet et al., 2014) exhibits strong regional differences with mass fractions predominantly below 1.5 wt % but reaching up to 5.0 wt % in some arid regions such as over northern Africa. Total iron-oxide mass concentrations vary over the range of about 2 wt %–6.5 wt % globally (2–5 wt % of Linke et al., 2006; 2.8 wt %–6.5 wt % of Schuster et al., 2016), meaning that hematite may be dominant in soil over some parts of northern Africa. Our results for Tunisia and Morocco are thus likely to occur in northern Africa.
3.2.3 Niger
Niger, in the central Sahel, lies downwind of some of the most persistent Saharan dust sources, including the Bodélé Depression in Chad; areas in northern Mali and southern Algeria; and also areas of Libya, Egypt, and the Sudan (Formenti et al., 2014a). Our median concentration of hematite (∼ 2 wt %) in May is consistent with that of Di Biagio et al. (2019; 2.3 wt %), but goethite was underestimated (< 1.8 wt %; cf. 3.5 wt % for Di Biagio et al., 2019). The goethite value of Di Biagio et al. (2019) corresponds to our highest value for monthly composite data for January–June (not shown). For Niger, Lafon et al. (2004) found iron-oxide concentrations of 2.8 ± 0.8 wt % during the Harmattan season (November–March), with a major source being Bodélé in the Chad basin, whereas concentrations of 5.0 ± 0.4 wt % were detected during the local erosion season (May–July). Our retrieval was consistent with the 2.8 wt % value for the Harmattan season but underestimated the local-erosion-season value. The Niger soil sites were close to the Banizoumbou AERONET site. MAIAC EPIC retrievals were in good agreement in accuracy with AERONET data for 2018 at this site, with AOD443 (r, 0.8; RMSE, 0.23; MBE, −0.11) and SSA443 within 0.03 for 89 % of samples and all within 0.05. Therefore, it is not likely due to the mixture aerosol type or the MAIAC AOD and SSA retrieval accuracy problem. AERONET direct AOD measurement data at Banizoumbou included only 5 d of measurement data in June, and most AOD values in July were < 0.6 because of the May–October rainy season (with most rain in July–August). Our retrievals might not have detected iron oxides due to the low June–July AOD.
3.2.4 Bodélé
The Bodélé area is known to have low iron-oxide concentrations due to the presence of diatomic sediments (Todd et al., 2007; Moskowitz et al., 2016), and the high incidence of high-aerosol events is associated with the Venturi effect of Harmattan winds passing between the Ennedi and Tibesti mountains (Ginoux et al., 2012). The median hematite concentration was consistently low (< 1.4 wt %) over the whole of 2018, consistent with the value (0.7 wt %) recorded by Di Biagio et al. (2019). Moreover, Moskowitz et al. (2016) concluded that dominant goethite and subordinate hematite together compose about 2 wt % of iron oxides from the Bodélé Depression, which is a similar trend to those of our data throughout the year. Iron-oxide levels over Bodélé (< 2 wt %) are shown later in Fig. 9, highlighting different areas, especially in the winter season, with a consistently high AOD average.
3.2.5 Ethiopia
The Ethiopia sites of Di Biagio et al. (2019) are near the Abijatta–Shalla National Park. We occasionally detected dust over this area in June with 150 pixels and with < 25 pixels in July. In June, the median EPIC hematite value was ∼ 1.2 wt %, below the 2 wt % indicated by Di Biagio et al. (2019) measurement data.
3.2.6 Saudi Arabia, Kuwait
The hematite concentration at Saudi Arabia (median ∼ 1.2 wt % in May) was generally higher than that at Kuwait (∼ 1 wt % in February and May), consistent with the results of Di Biagio et al. (2019), with 1.8 wt % in Saudi Arabia and 1.5 wt % in Kuwait. In Saudi Arabia, the Di Biagio et al. (2019) goethite content was 0.8 wt %, similar to our retrieval during March–May (∼ 1 wt %). Both sites were dominated by goethite during summer–autumn (July–September). Summer and early autumn is the shamal season when northwesterly winds blow over the Arabian Peninsula (Yu et al., 2016), with the Saudi Arabia and Kuwait sites (Fig. 8) lying downwind. Therefore, transported dust by the shamal might have caused the increase in dust goethite content.
3.2.7 Taklimakan, Gobi
Over East Asia, the Gobi Desert dust area was active mainly in April in our retrieval (with ∼ 300 pixels), while the Taklimakan was active throughout the spring, early summer, and September, all with > 500 pixels of retrieval. In April, our hematite retrievals were consistent with data of Di Biagio et al. (2019), ∼ 1 wt % and 0.9 wt %, respectively. Lafon et al. (2004) measured iron-oxide concentrations of ∼ 3.7 wt % downwind of the Gobi Desert, but our median value even in April seems to underestimate that value. However, our retrievals were generally consistent with the hematite-to-goethite ratio by mass (∼ 0.55) found by Shen et al. (2006), who investigated hematite-to-goethite mass-concentration ratios in bulk samples of eolian dust over Dunhuang (40.3∘ N, 94.5∘ E), Yulin (38.2∘ N, 109.4∘ E), and Tongliao (43.1∘ N, 122.1∘ E), yielding values of 0.57 ± 0.26, 0.59 ± 0.16, and 0.46 ± 0.13, respectively.
3.2.8 Arizona and Australia
Both the Arizona and the Australia sites may include significant smoke-event effects, causing the increase in aerosol absorption that was attributed to the hematite content in our retrieval shown in Fig. 8. However, our case studies over North America (cases 18–21) and Australia (case 23) presented in Fig. 6b cover the range suggested by Di Biagio et al. (2019), which is 1.5 wt % (North America) and 3.6 wt % (Australia) of the soil-derived hematite content. Further study is needed to distinguish between smoke and dust in the MAIAC EPIC algorithm.
Our retrievals thus generally follow the trends in hematite data recorded by Di Biagio et al. (2019) with some differences, especially for goethite, likely associated with transport from different sources over the designated sites.
3.3 Global climatology
Seasonal average EPIC data for the Sahara–Sahel and Middle East (Fig. 9) and Asia (Fig. 10) are shown for the period 1 January to 31 December 2018 (for global data, see Figs. S2–S5). As in Fig. 8, pixels of AOD > 1.0 were used to compute the average since some pixels of goethite retrieval with AOD < 1.0 display noise or blob patterns. Currently, MAIAC EPIC cannot differentiate between the smoke and the dust. It is mostly biomass burning smoke in the Indo-Gangetic Plain (in Fig. 10) except during the pre-monsoon season, although there is also dust from the Thar Desert. Also, part of the data over North America and Australia (in Figs. S4, S5) may include some mixed aerosol or smoke cases and thus may be biased relative to pure-dust cases (Figs. 5, A1–A6). Therefore, the results in the aforementioned region should not be considered accurate. Nevertheless, our results display the generally known iron-oxide patterns.
Globally, our iron-oxide mass concentrations were in the range of up to ∼ 6.5 wt %, consistent with the generally accepted range (Di Biagio et al., 2019; Schuster et al., 2016).
The North Africa and Middle East (Fig. 9) areas exhibit increasing AOD throughout by spring and summer (barring the rainy season over the Sahel near Niger), with levels decreasing after autumn. Hematite, on the other hand, is likely prevalent over Africa only during May–July, particularly over the west Sahara near Mauritania where dust storms occur every year, often transporting dust across the Atlantic Ocean to Puerto Rico and northern Brazil. Our visual analysis implies that these high dust hematite concentrations (especially in May) are due to transport from central Algeria, Mali, and sometimes the Sudan, with transport westward across the Sahel line. Otherwise, goethite was more prevalent than hematite over the Sahara and Sahel (Formenti et al., 2014a).
The Bodélé Depression area has a lower iron-oxide concentration of close to ∼ 1 wt % with high AOD throughout the year (Todd et al., 2007; Moskowitz et al., 2016). Higher iron-oxide concentrations are also well documented for the Sahelian area (0–20∘ N) and in the Sahara, particularly in April (not shown). Sahel dust is richer in iron oxide than Saharan and Chinese dust, as found by Claquin et al. (1999) and Lafon et al. (2004).
Over Asia (Fig. 10), Taklimakan dust contained twice as much goethite as hematite during March–October (Shen et al., 2006). The Gobi Desert showed widespread dust activity overall with higher goethite concentrations during March–May and less in summer. India had higher hematite concentrations during the pre-monsoon season, especially in May.
Other well-known dust areas, which have not been extensively used as case studies, occur east of the Aral Sea, in the southeastern coastal region of the Caspian Sea, in eastern Uzbekistan and Turkmenistan, and in the southwestern corner of Afghanistan, all of which are known highly active dust sources (Ginoux et al., 2012), but knowledge of their dust mineral composition is lacking.
The seasonal average EPIC data are based on AOD larger than 1.0, and this may cause the omission of fine-mode dust such as the clay fraction of hematite (Journet et al., 2014; Menut et al., 2020). Journet et al. (2014) mentioned that the hematite content in the clay fraction is usually below 1.5 % but reaches 5 % in some regions, including the longitudinal band from Montana to Texas in the USA, a latitudinal band across southern Russia, and arid regions of northern Africa, while soils in southern Brazil/northern Argentina have high hematite contents exceeding 5 %. The error or uncertainty associated with the omission of the fine-mode dust is beyond the scope of this study and will be provided in the next version of the MAIAC EPIC algorithm.
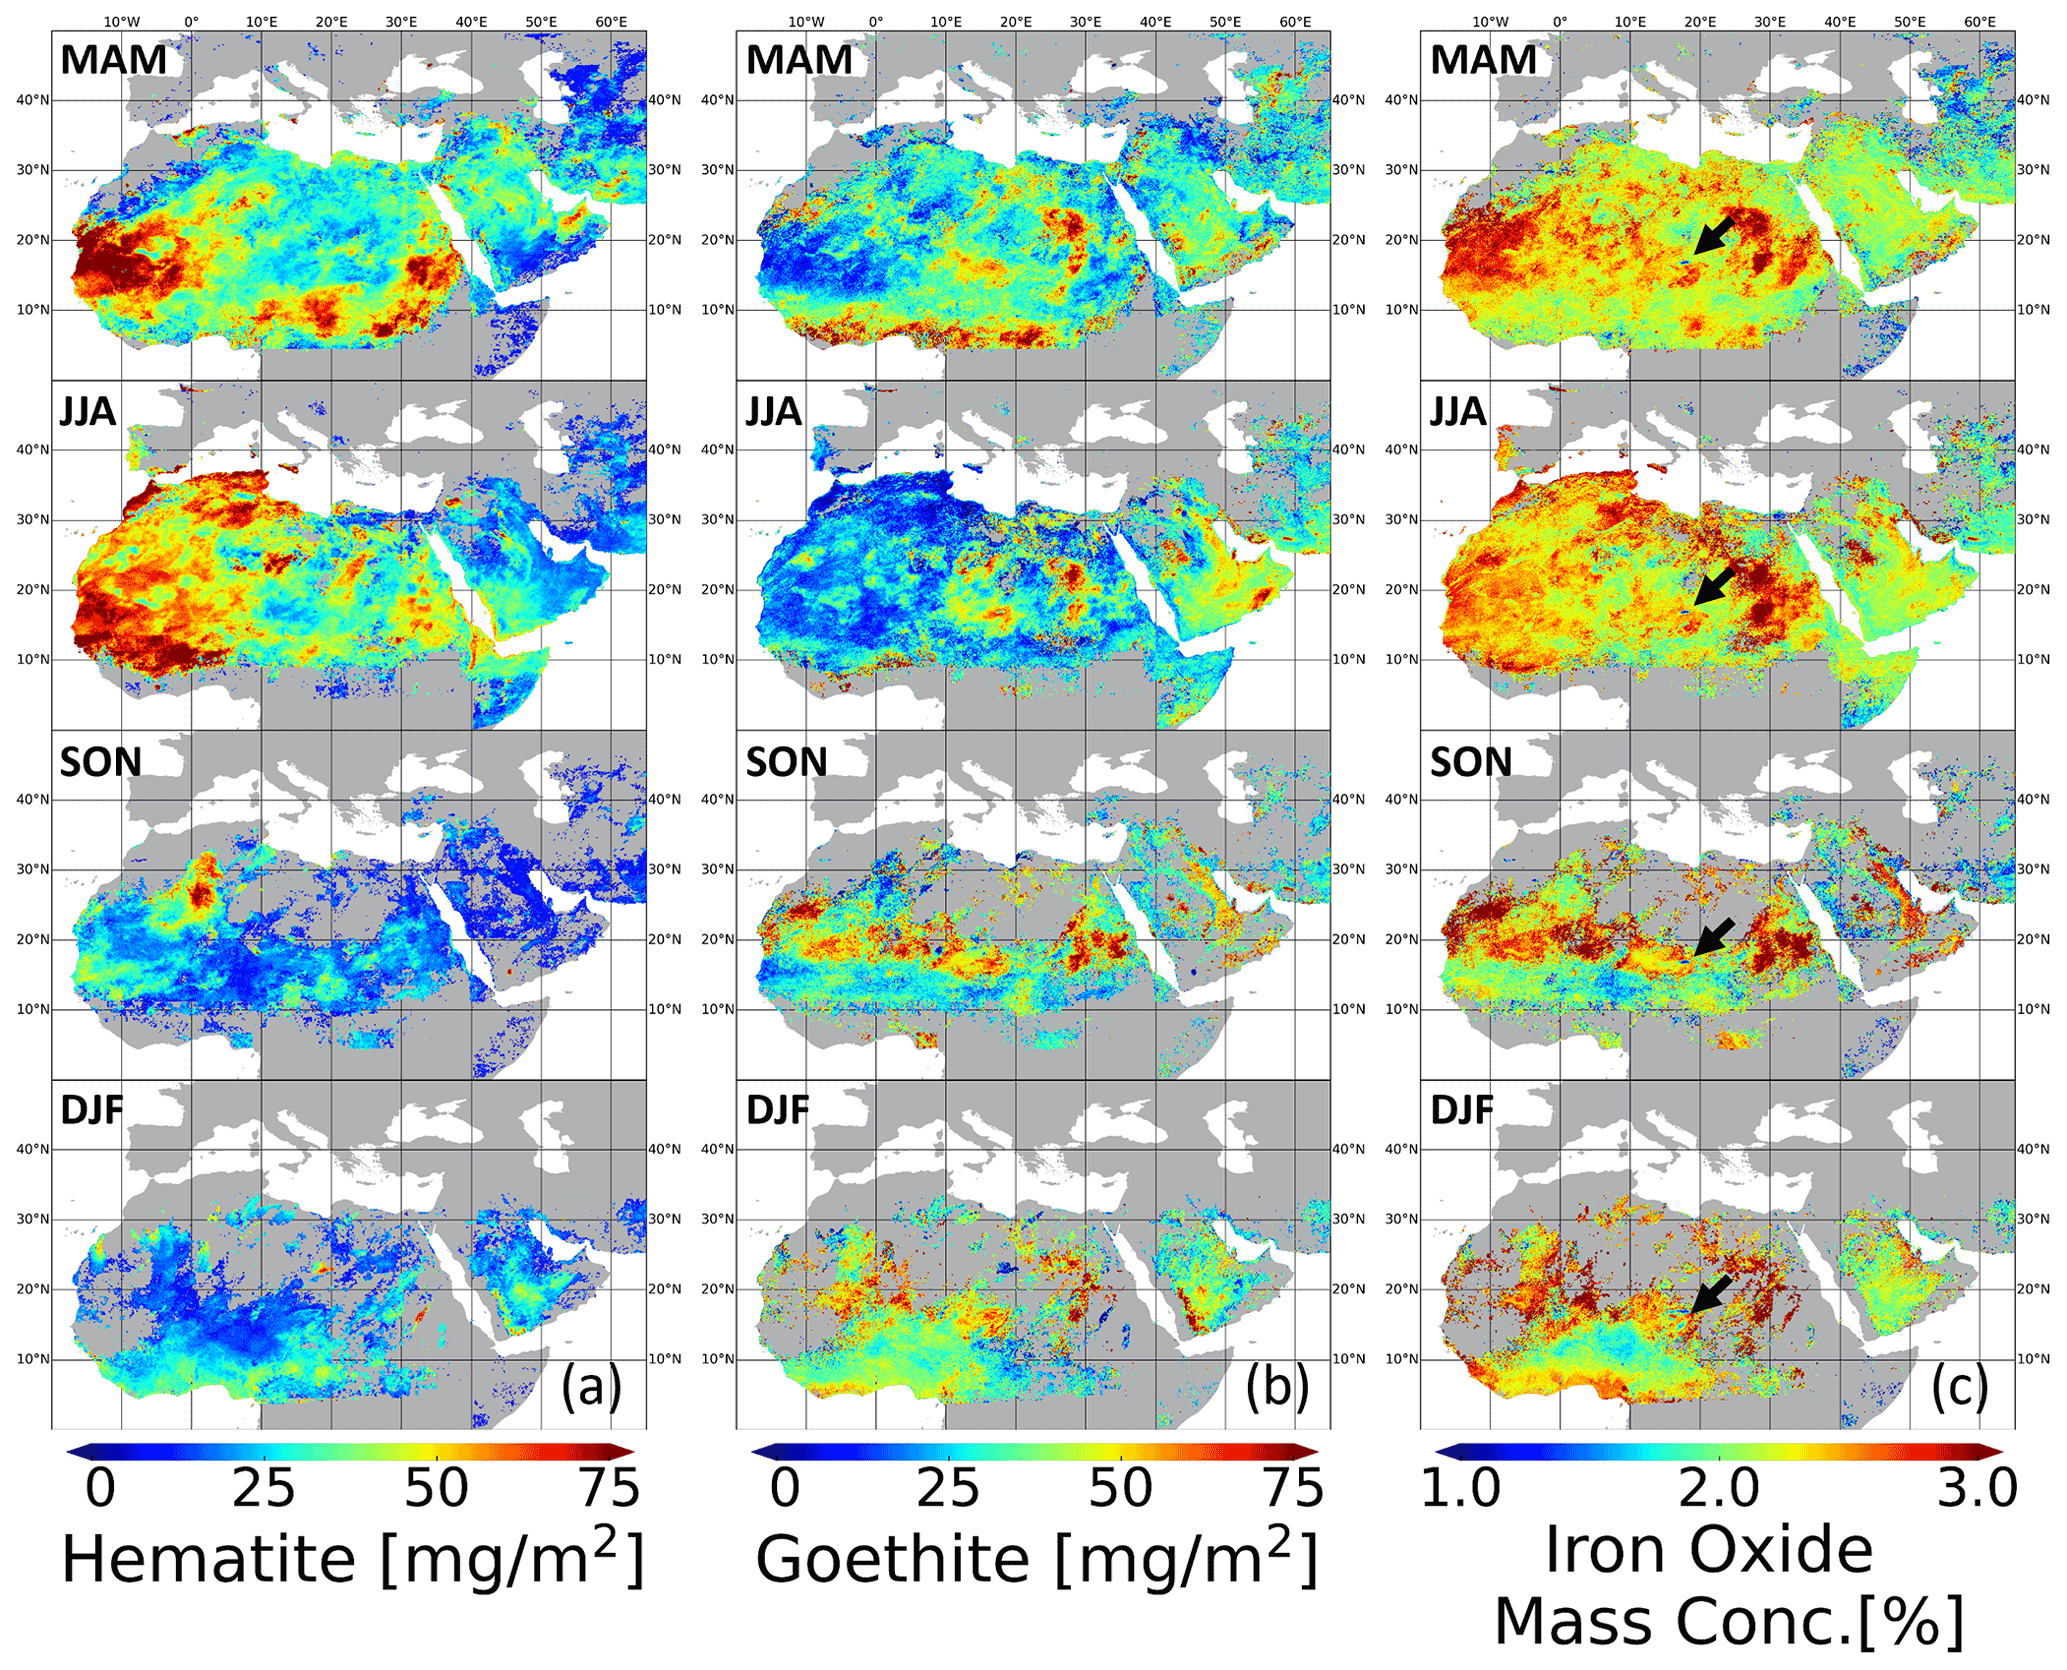
Figure 9Seasonally average data for Sahara–Sahel and Middle East dust-source areas generated from MAIAC EPIC 2018 data (1 January to 31 December): (a) hematite mass concentration (mg m−2), (b) goethite mass concentration (mg m−2), and (c) iron-oxide mass concentration (wt %), with one row per season (row 1 – March, April, and May (MAM); row 2 – June, July, and August (JJA); row 3 – September, October, and November (SON); row 4 – December, January, and February (DJF)). Climatology data may include some mixed aerosol and smoke aerosol cases causing bias relative to pure-dust cases (Figs. 5, A1–A6). The four black arrows over (c) are pointing to the Bodélé Depression area. Additional data for AOD at 443 nm and SSA at 443 nm and the total number of data points used in this figure are provided in Fig. S2.
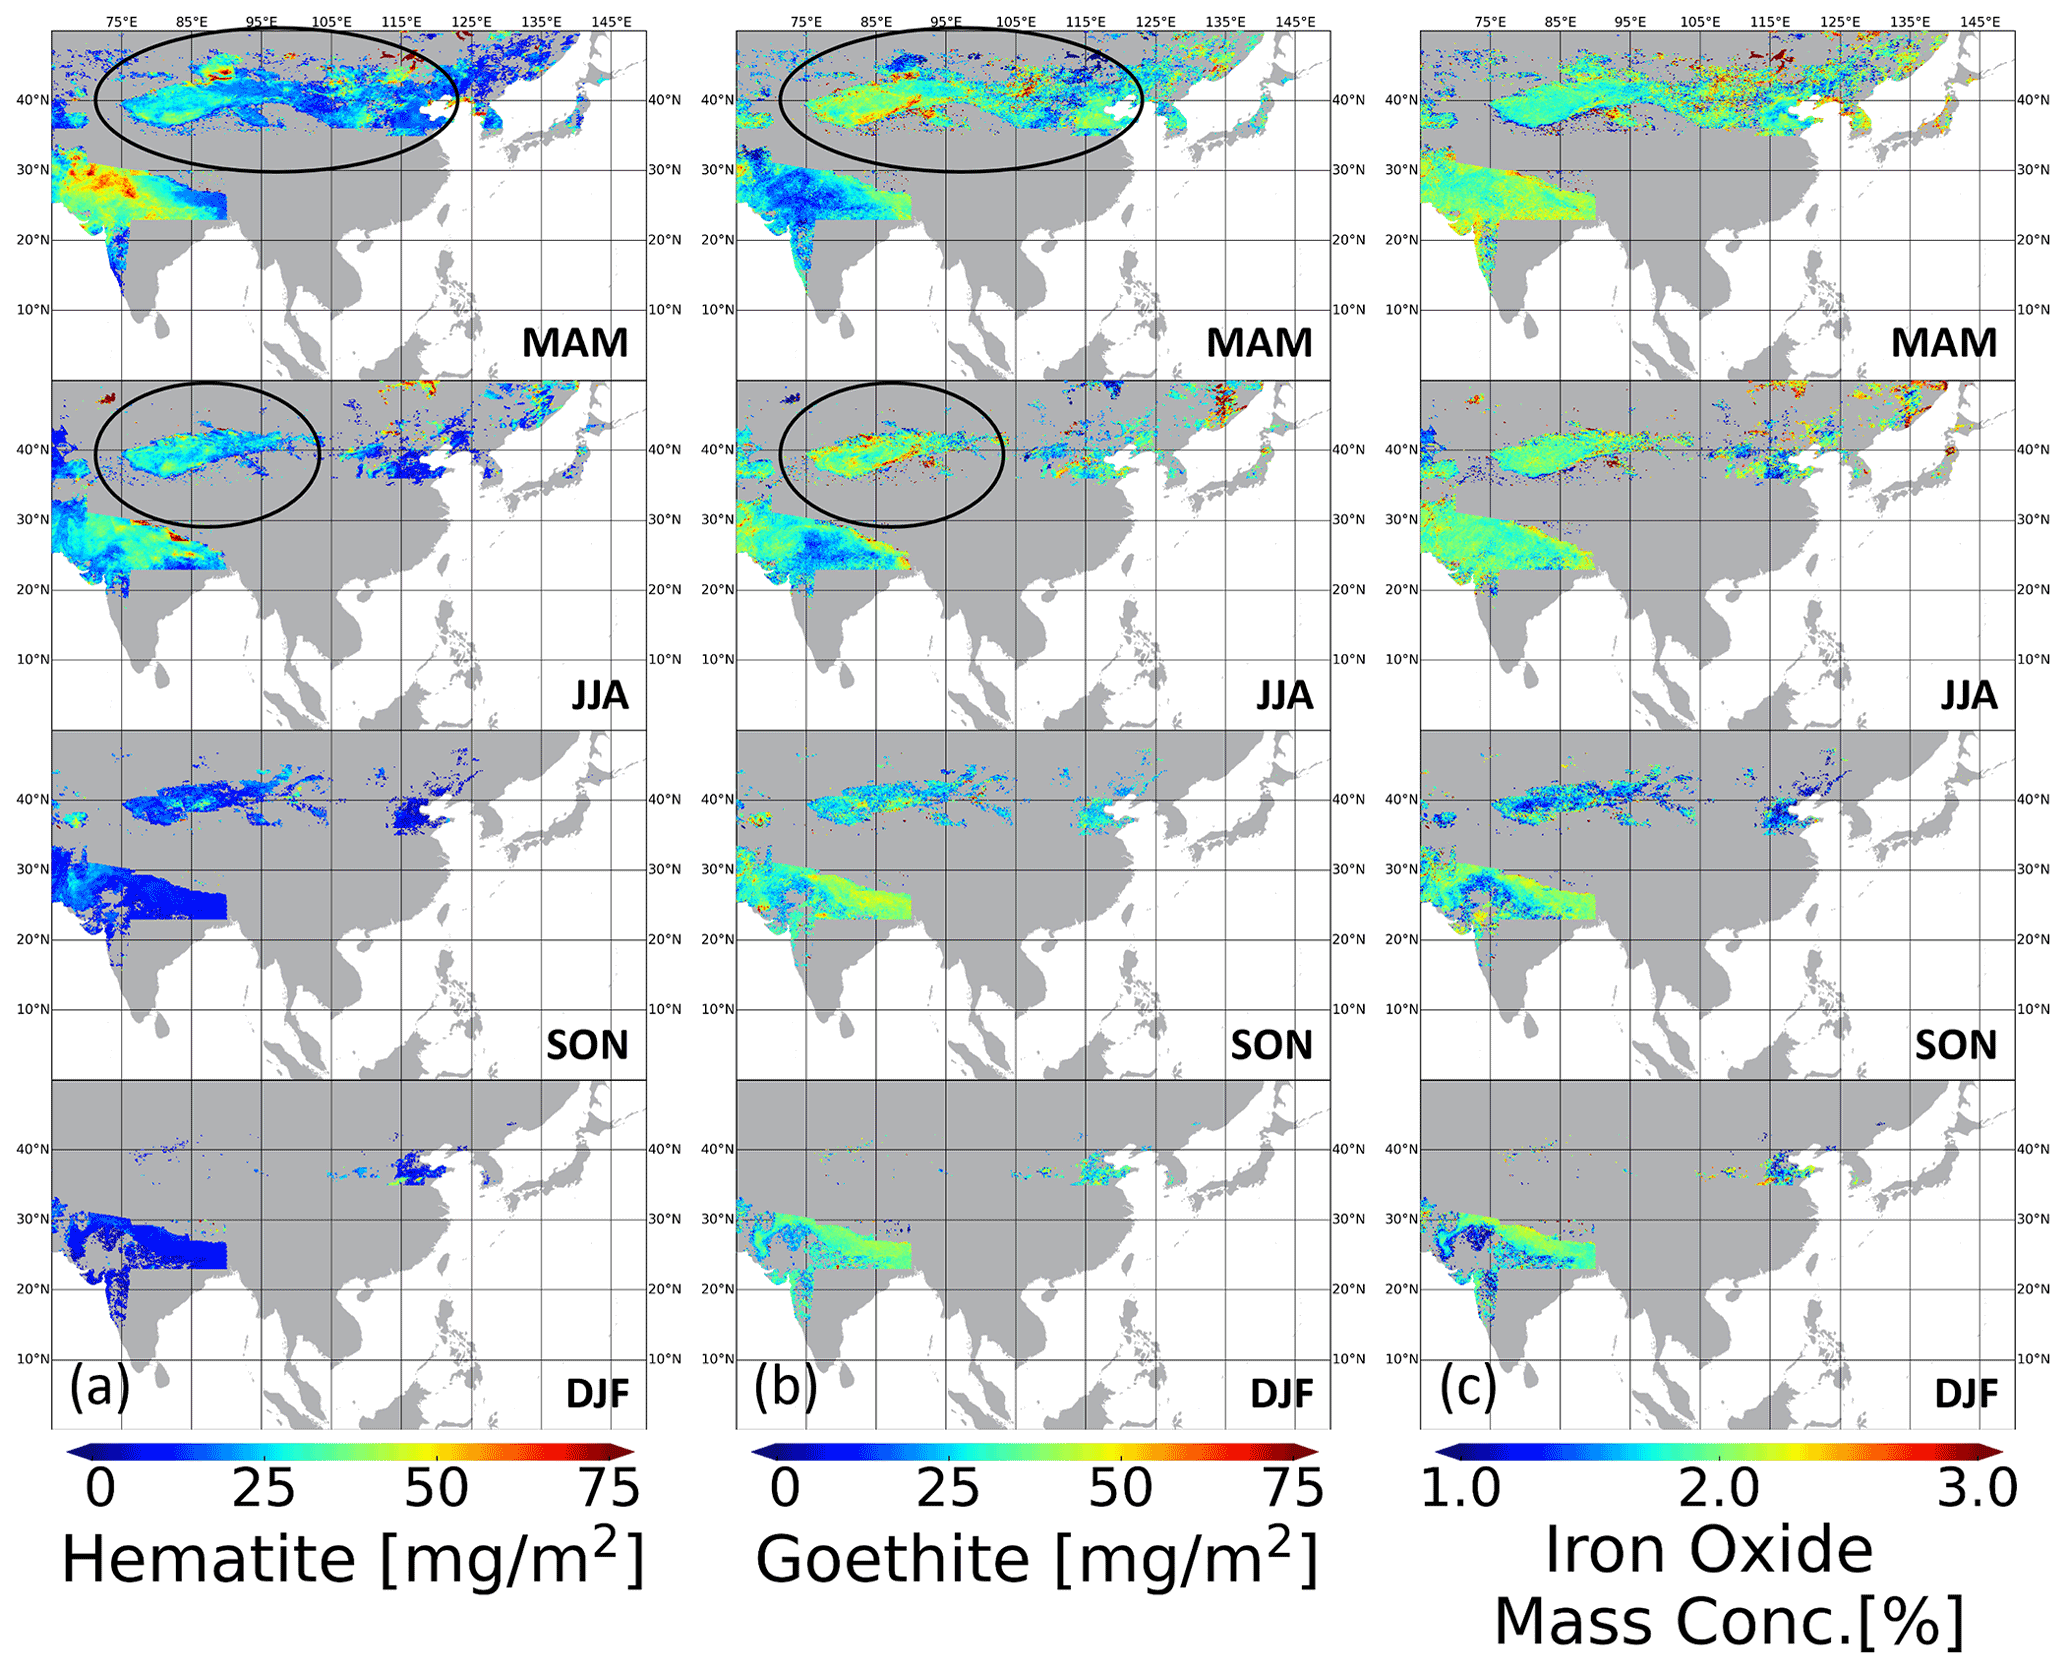
Figure 10The same as in Fig. 9 but for Asia. Additional data of AOD at 443 nm and SSA at 443 nm and the total number of data points used in this figure are provided in Fig. S3.
Hematite refractive indices exhibit a large range in the literature, as introduced in Sect. 2.3 and Fig. 3. This is critical since the retrieved hematite and goethite content vary significantly depending on the a priori refractive index of hematite. To find the most suitable a priori hematite refractive index, we analyzed how much the hematite and goethite content changes quantitatively with respect to our a priori hematite refractive index for the 24 dust cases presented in Sect. 3.1. Note that some of the publications do not include the real part of the refractive index, such as Gillespie and Lindberg (1992), Marusak et al. (1980), and Vernon (1962), so we used the Scanza et al. (2015) real refractive index of hematite as an alternative.

Figure 11Box-and-whisker plot of iron-oxide content by mass (wt %; y axis) for 13 models of the hematite refractive index (x axis, numbers 1–13; see Table 1) for the dust cases 3, 19, 21, 22, and 23 presented in Sect. 3.1. The horizontal dashed red line in each panel shows the maximum expected iron-oxide content (6.5 wt %) based on in situ measurements.
Figure 11 depicts the box-and-whisker plot of iron-oxide content by mass (wt %) with respect to 13 kinds of a priori hematite refractive indices (Fig. 3, Table 1) for the 5 selected dust cases (cases 3, 19, 21, 22, 23; for all 24 dust cases, see Fig. S6). Note that the goethite density varies in the literature (ρgoethite=3800 kg m−3 of Bedidi and Cervelle, 1993; ρgoethite =4280 kg m−3 of Formenti et al., 2014a) but does not affect the calculated iron-oxide content (wt %) significantly, as the retrieved volume fraction of goethite is mostly small (less than 0.03) as opposed to the over 0.9 volume fraction of the host (not shown).
In the literature, the in situ measurement of the maximum of iron-oxide content is about 6.5 wt % (2 wt %–5 wt % of Linke et al., 2006, and Formenti et al., 2014b; 2.8 wt %–5 wt % of Lafon et al., 2004; 2.4 wt %–4.5 wt % of Formenti et al., 2008; 0.7 wt %–5.8 wt % of Di Biagio et al., 2019; 2.8 wt %–6.5 wt % of Lafon et al., 2006). This indicates that the hematite refractive index nos. 3 (Krekov, 1992) and 8 (Bedidi and Cervelle, 1993) are not viable for our approach since the corresponding retrieved iron-oxide contents mostly exceed 6.5 wt %. Specifically, the lower quartile for no. 3 (Krekov, 1992) is always over 10 wt % and therefore not visible in Fig. 11 (also not visible in Fig. S6). The lower quartile for no. 8 (Bedidi and Cervelle, 1993) exceeds 6.5 wt % in 11 of the 24 dust cases (cases 3, 4, 5, 6, 7, 13, 18, 19, 21, 22, 23).
Based on the same logic, the hematite refractive index nos. 4 (Gillespie and Lindberg, 1992), 5 (Hsu and Matijevic, 1985), 7 (Longtin et al., 1988), 10 (Kerker et al., 1979), and 11 (Marusak et al., 1980) do not produce reasonable results. For example, in dust cases 22 and 23 over Australia, the median values of iron-oxide content already exceed 6.5 wt %. In cases 3, 19, and 21, the upper quartile of the iron-oxide content is close to 6.5 wt %.
We exclude index no. 9 (Sokolik and Toon, 1999) from the most suitable hematite refractive index. This index cited Querry (1978) for hematite, but Querry (1978) measured the complex refractive index of limestone, not hematite. It is suspected that index no. 9 (Sokolik and Toon, 1999) misquoted index no. 6 (Querry, 1985) (Zhang et al., 2015), though there are slight differences between the two.
Consequently, our analysis suggests that the remaining hematite refractive index nos. 1 (Chen and Cahan, 1981 – 1), 2 (Chen and Cahan, 1981 – 2), 6 (Querry, 1985), 12 (Vernon, 1962), and 13 (Scanza et al., 2015) are the most plausible (summarized in Fig. S7). These results are in agreement with Schuster et al. (2016) selecting Chen and Cahan (1981) as the baseline refractive index of hematite. The Li et al. (2019) paper used both Scanza et al. (2015) and Longtin et al. (1988) as representative of iron oxides and mentioned the large range of hematite refractive indices but did not search for the most plausible one.
It is worth mentioning that we cannot narrow down the most plausible hematite refractive index with the corresponding cost function only. This is because we fit the exponentially decreasing imaginary refractive index of MAIAC EPIC with wavelengths at 340, 388, 443, and 680 nm derived from Eq. (10) parameterized only with b and k0. Some of the hematite refractive indices, such as nos. 5 (Hsu and Matijevic, 1985), 7 (Longtin et al., 1988), and 10 (Kerker et al., 1979), have an exponentially decreasing imaginary refractive index at 350–400 nm; therefore the minimum cost function is always less than 0.003 (in Fig. S10). On the contrary, hematite refractive indices, such as nos. 1 (Chen and Cahan, 1981 – 1), 2 (Chen and Cahan, 1981 – 2), 6 (Querry, 1985), 9 (Sokolik and Toon, 1999), and 13 (Scanza et al., 2015) (used in this study), have an increasing imaginary refractive index at 350–400 nm; therefore the magnitude of cost function (Fig. S10) is proportional to the hematite volume fraction (Fig. S8).
To our knowledge, this is the first attempt to infer hematite and goethite concentrations, primary components of iron oxides, from single-viewing satellite measurements. Based on the rationale that hematite and goethite are the major components that cause absorption in the UV–Vis region, we used the Maxwell Garnett effective medium approximation method with the EPIC spectral aerosol absorption information k0 and b. Currently, this algorithm uses pure-dust cases and may be biased in regions/seasons where dust aerosol is mixed with biomass burning smoke. Our retrieval patterns were generally consistent in time and space with those of previous studies over the main global dust-source areas.
Sites in the central Sahara and Sahel, such as Libya, Algeria, Mauritania, Niger, Mali, and Bodélé, and in the Middle East, such as Saudi Arabia and Kuwait, exhibit greater temporal variability than other sites, implying large dynamic dust-source variability in the Sahara, Sahel, and Middle East. Over the central Sahara and Sahel regions, goethite was generally prevalent except for during the summer monsoon season of May–July, when hematite was predominant and likely sourced from near Algeria, Mali, and the Sudan. The Bodélé Depression area has distinctive lower iron-oxide concentration on a climatology map (∼ 1 wt %) with high AOD throughout the year. Over the Middle East, goethite was prevalent in the shamal season, whereas hematite was widespread in the atmosphere during March–May. Over India, higher hematite concentrations were detected in 2018 during the pre-monsoon season. The Taklimakan Desert was active except for in winter, with hematite goethite ratios of ∼ 0.55 (near published values). The Gobi Desert also had a ratio of 0.55 but was active only during spring. Over North America and Australia, pure-dust-episode analysis indicated hematite-dominated patterns, consistent with earlier studies. Our results, including the 24 representative dust cases over different continental areas, clearly implied that the composition of hematite in relation to goethite may differ case by case depending on different source regions and meteorological conditions causing transportation, even within a day.
We compared our retrieval data with those of Di Biagio et al. (2019), who undertook only soil analyses. While our retrievals may include both local and long-range-transport contributions of iron oxides, our results cover the range of soil-derived data both qualitatively (relative comparisons site by site) and quantitatively. This implies that our retrieval data are robust. There seemed to be better agreement during seasons of local erosion without long-range transport. Further quantitative comparisons are needed with widespread ground-based data such as those of AERONET if they become available. We also selected the most plausible hematite refractive indices, given that the maximum value of iron-oxide content that we have found in in situ measurement papers is about 6.5 wt %. The narrowed-down hematite refractive indices, such as those of Chen and Cahan (1981), Querry (1985), Vernon (1962), and Scanza et al. (2015), exhibited a similar range and spectral shape and are in agreement with Schuster et al. (2016).
The developed algorithm can be applied to other on-orbit instruments with UV–Vis channels. The reported results from EPIC provide for the first time the global overland climatology of hematite and goethite concentrations in mineral dust and should be useful for the estimation of the SW dust DRE in Earth-system and climate modeling. In the near future, the algorithm will be expanded over the global ocean to support ocean biogeochemical studies (e.g., Tagliabue et al., 2017).
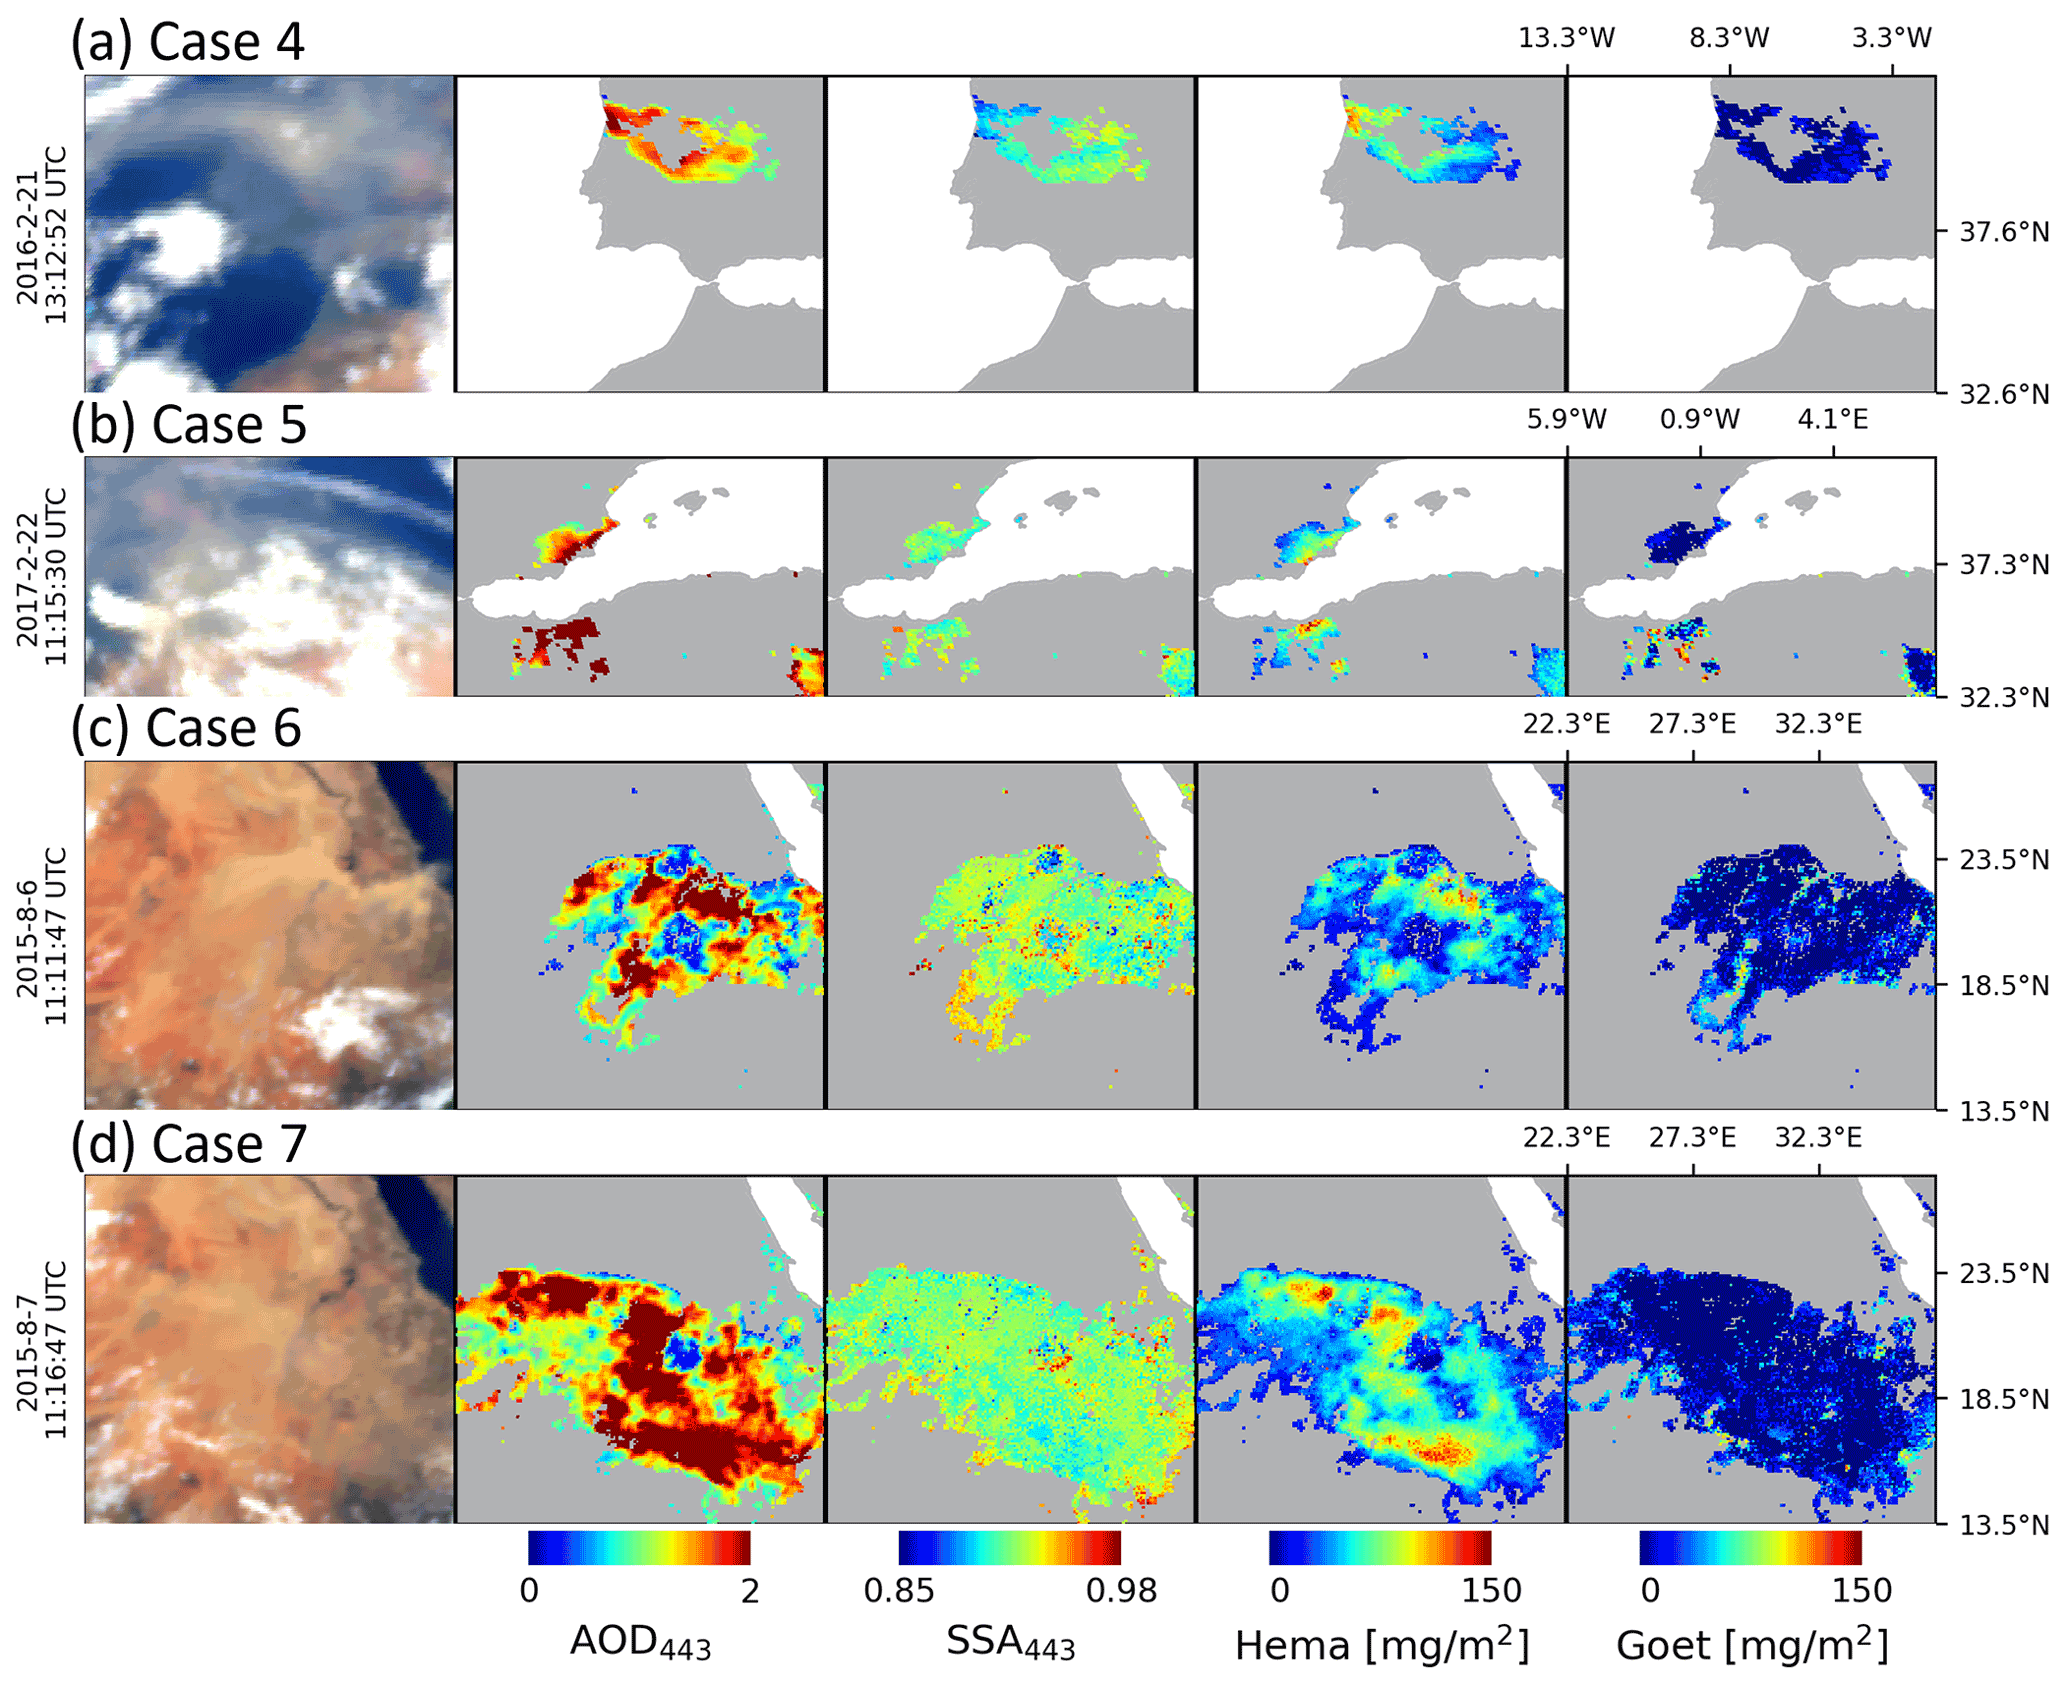
Figure A1Dust episodes over the northern Sahara (rows 1 and 2) and near the Red Sea (rows 3 and 4). From left, RGB TOA image generated from EPIC L1B version 3 data, AOD and SSA at 443 nm, and mass concentration of hematite and goethite for each case: case 4 (row 1), dust episode on 21 February 2016; case 5 (row 2), dust episode on 22 February 2017; case 6 (row 3), dust episodes on 6 August 2015; and case 7 (row 4), dust episodes on 7 August 2015.

Figure A2Dust episodes over the Middle East. From left, RGB TOA image generated from EPIC L1B version 3 data, AOD 443 nm, SSA 443 nm, hematite mass concentration, and goethite mass concentration for each case: case 8 (row 1), dust episode on 1 September 2015; case 9 (row 2), dust episode on 2 September 2015; case 10 (row 3), dust episodes on 7 September 2015; and case 11 (row 4), dust episode on 28 July 2018.
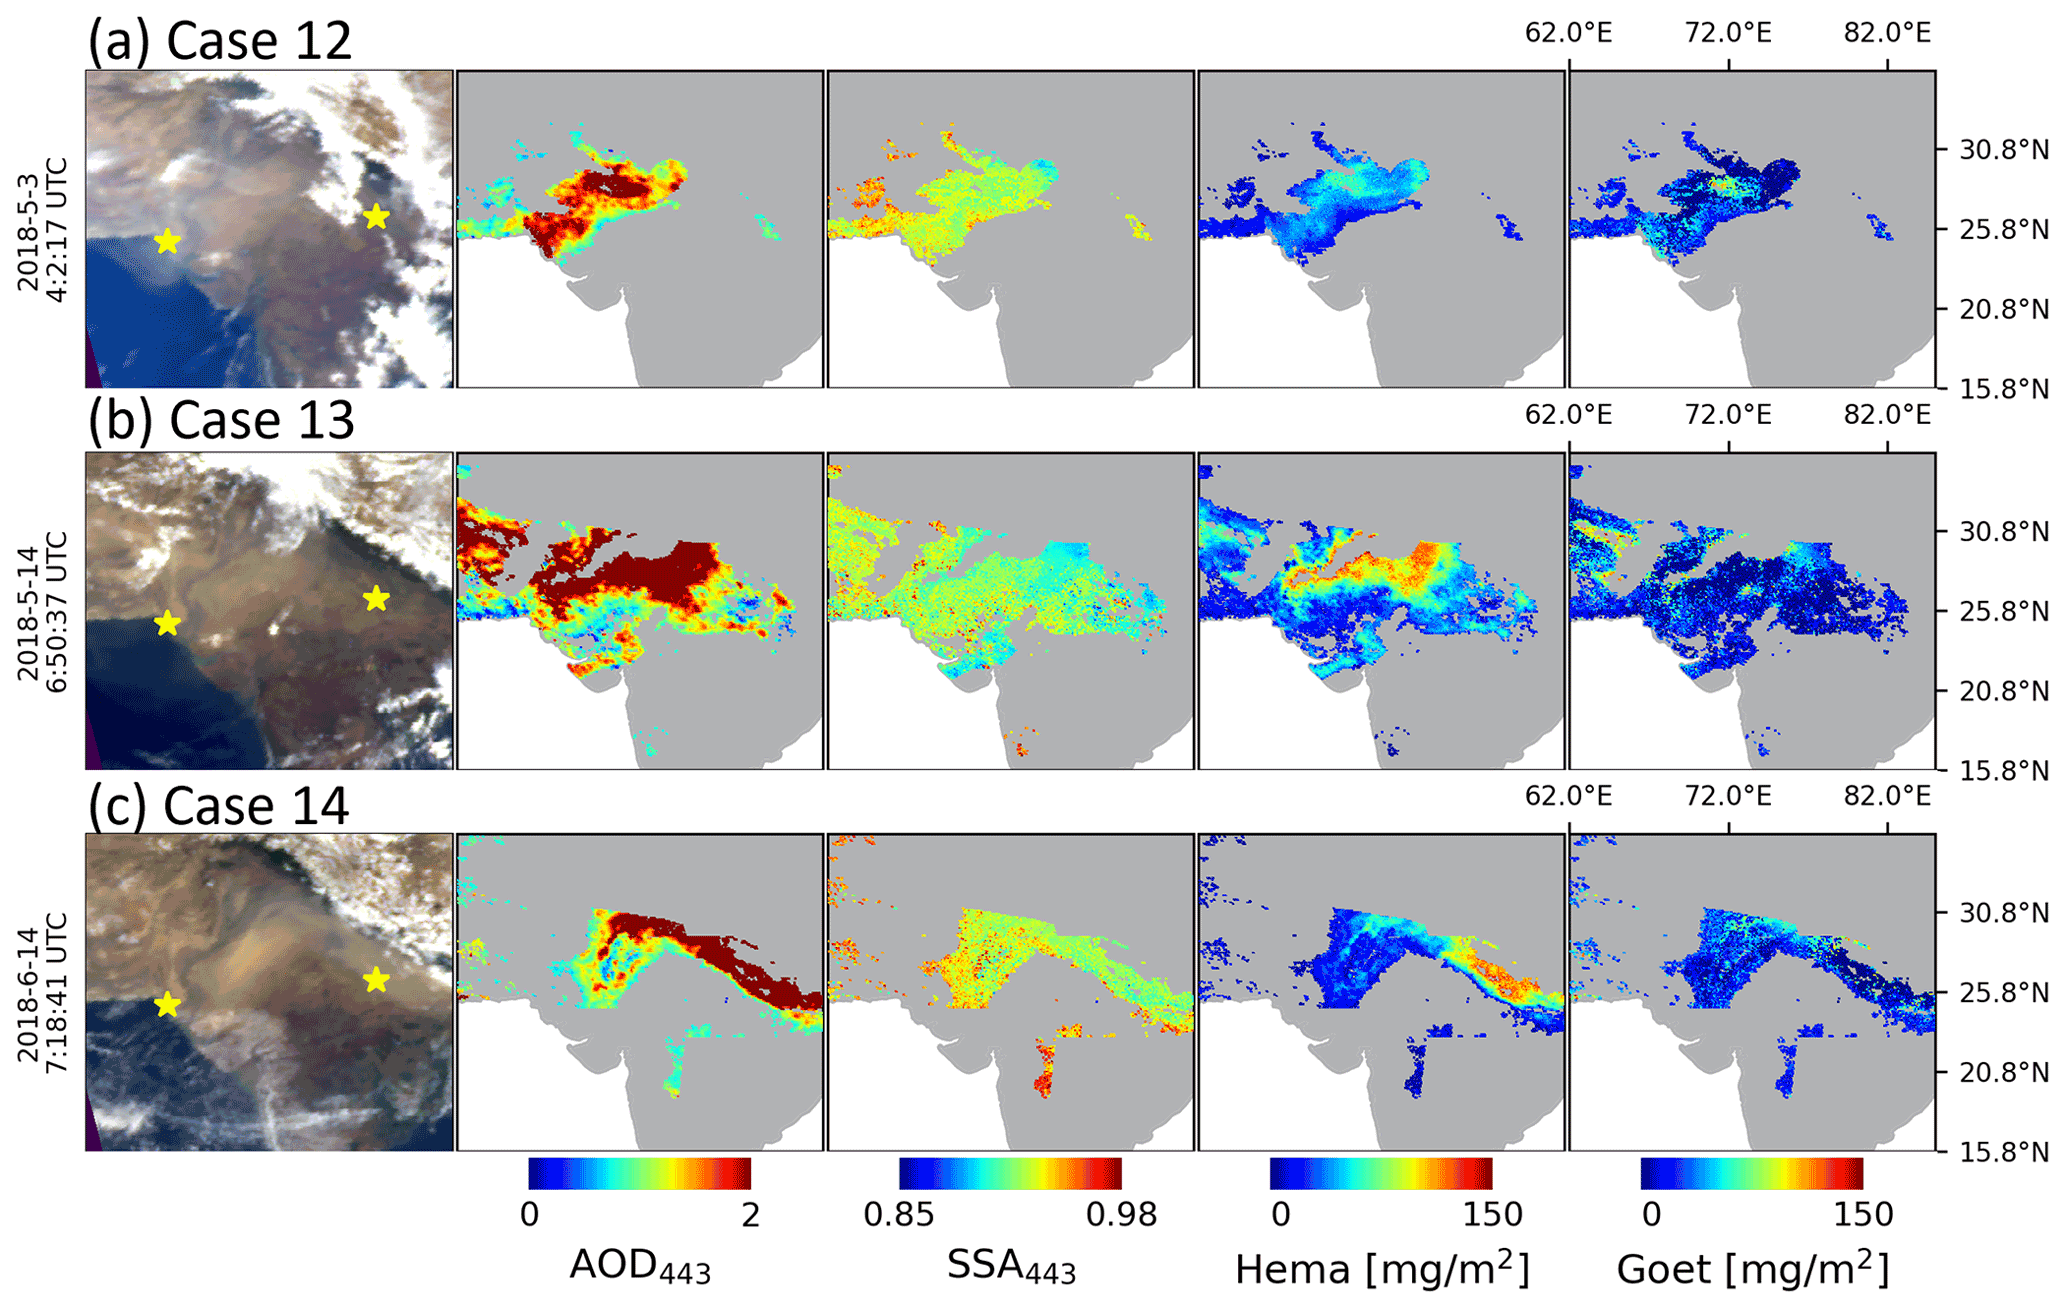
Figure A3Dust episodes over India. From left, RGB TOA image generated from EPIC L1B version 3 data, AOD 443 nm, SSA 443 nm, hematite mass concentration, and goethite mass concentration for each case: case 12 (row 1), dust episode on 3 May 2018; case 13 (row 2), dust episode on 14 May 2018; and case 14 (row 3), dust episode on 14 June 2018. Yellow stars indicate AERONET sites at Karachi (24.946∘ N, 67.136∘ E) and Kanpur (26.513∘ N, 80.232∘ E).

Figure A4Dust episodes over the Taklimakan (rows 1 and 2) and Gobi (row 3) deserts. From left, RGB TOA image generated from EPIC L1B version 3 data, AOD 443 nm, SSA 443 nm, hematite mass concentration, and goethite mass concentration for each case: case 15 (row 1), dust episode on 30 April 2016; case 16 (row 2), dust episode on 1 May 2016; and case 17 (row 3), dust episode on 4 May 2017. Yellow stars over case 17 (row 3) indicate AERONET sites at Beijing (39.977∘ N, 116.381∘ E), Beijing_RADI (40.005∘ N, 116.379∘ E), and XiangHe (39.754∘ N, 116.962∘ E).
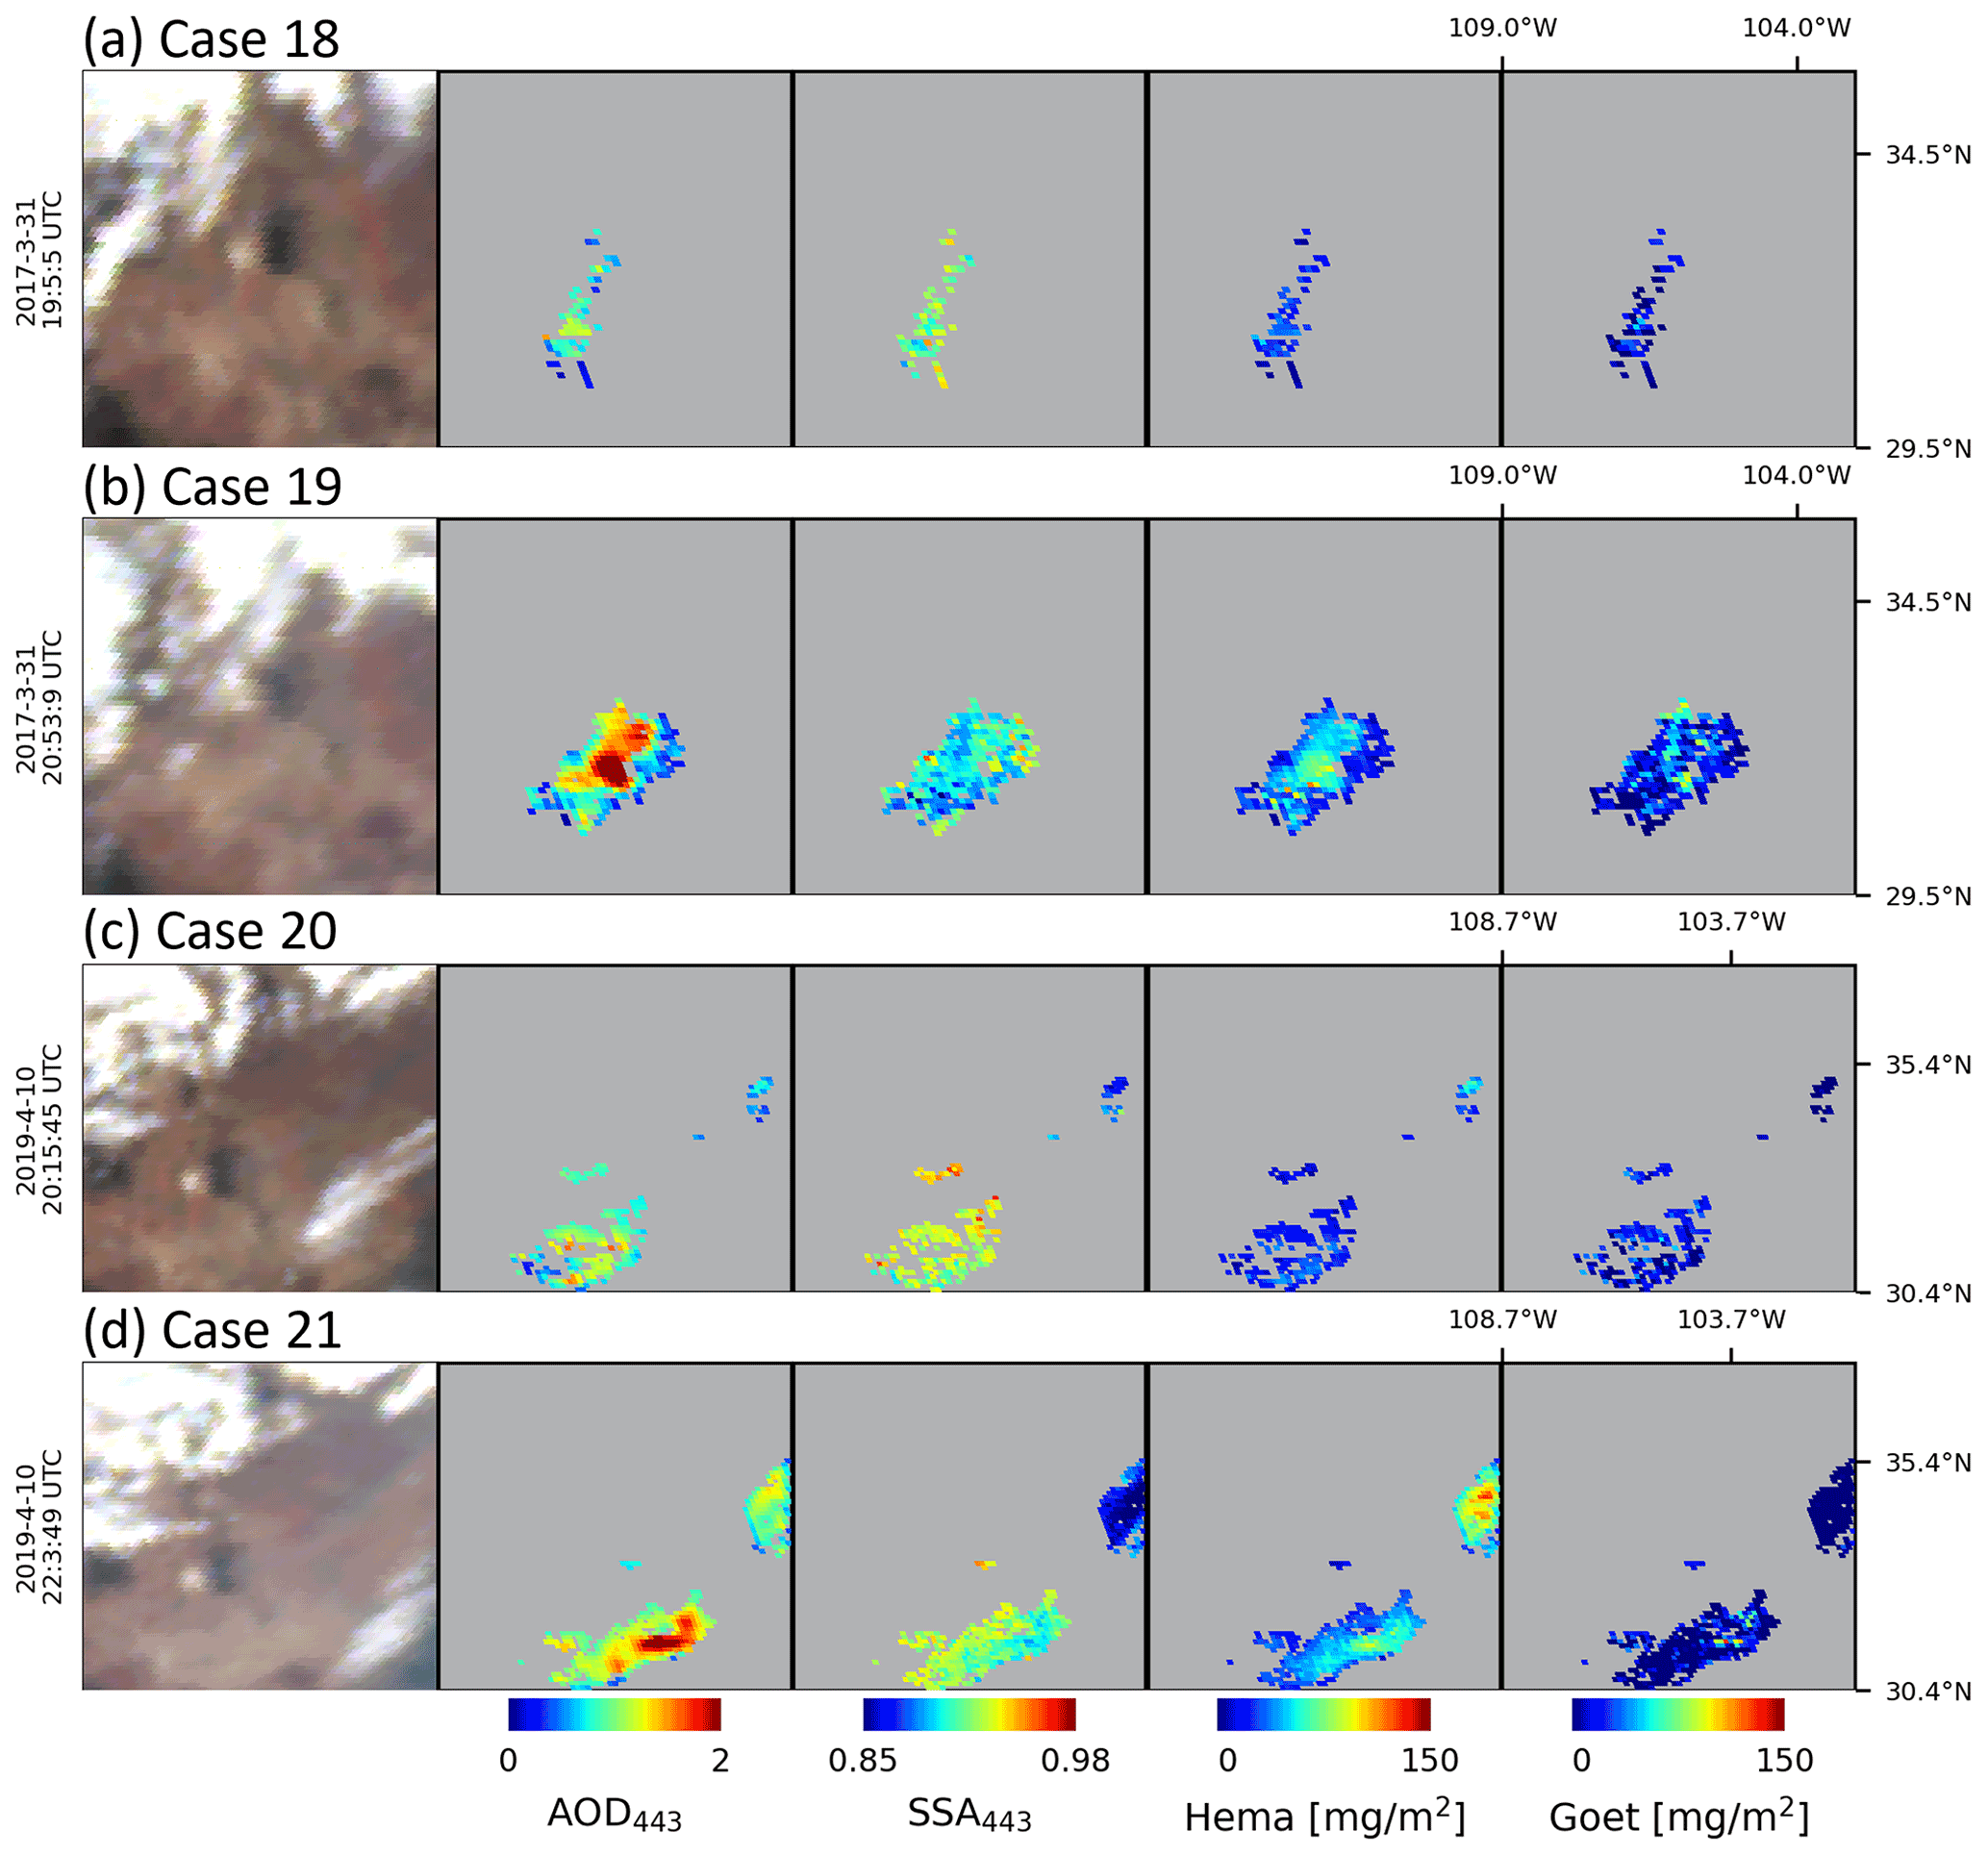
Figure A5Dust episodes over North America near New Mexico, USA. From left, RGB TOA image generated from EPIC L1B version 3 data, AOD 443 nm, SSA 443 nm, hematite mass concentration, and goethite mass concentration for each case: case 18 (row 1), dust episode on 31 March 2017, 19:00 UTC; case 19 (row 2), dust episode on 31 March 2017, 20:00 UTC; case 20 (row 3), dust episode on 10 April 2019, 20:00 UTC; and case 21 (row 4), dust episode on 10 April 2019, 22:00 UTC.
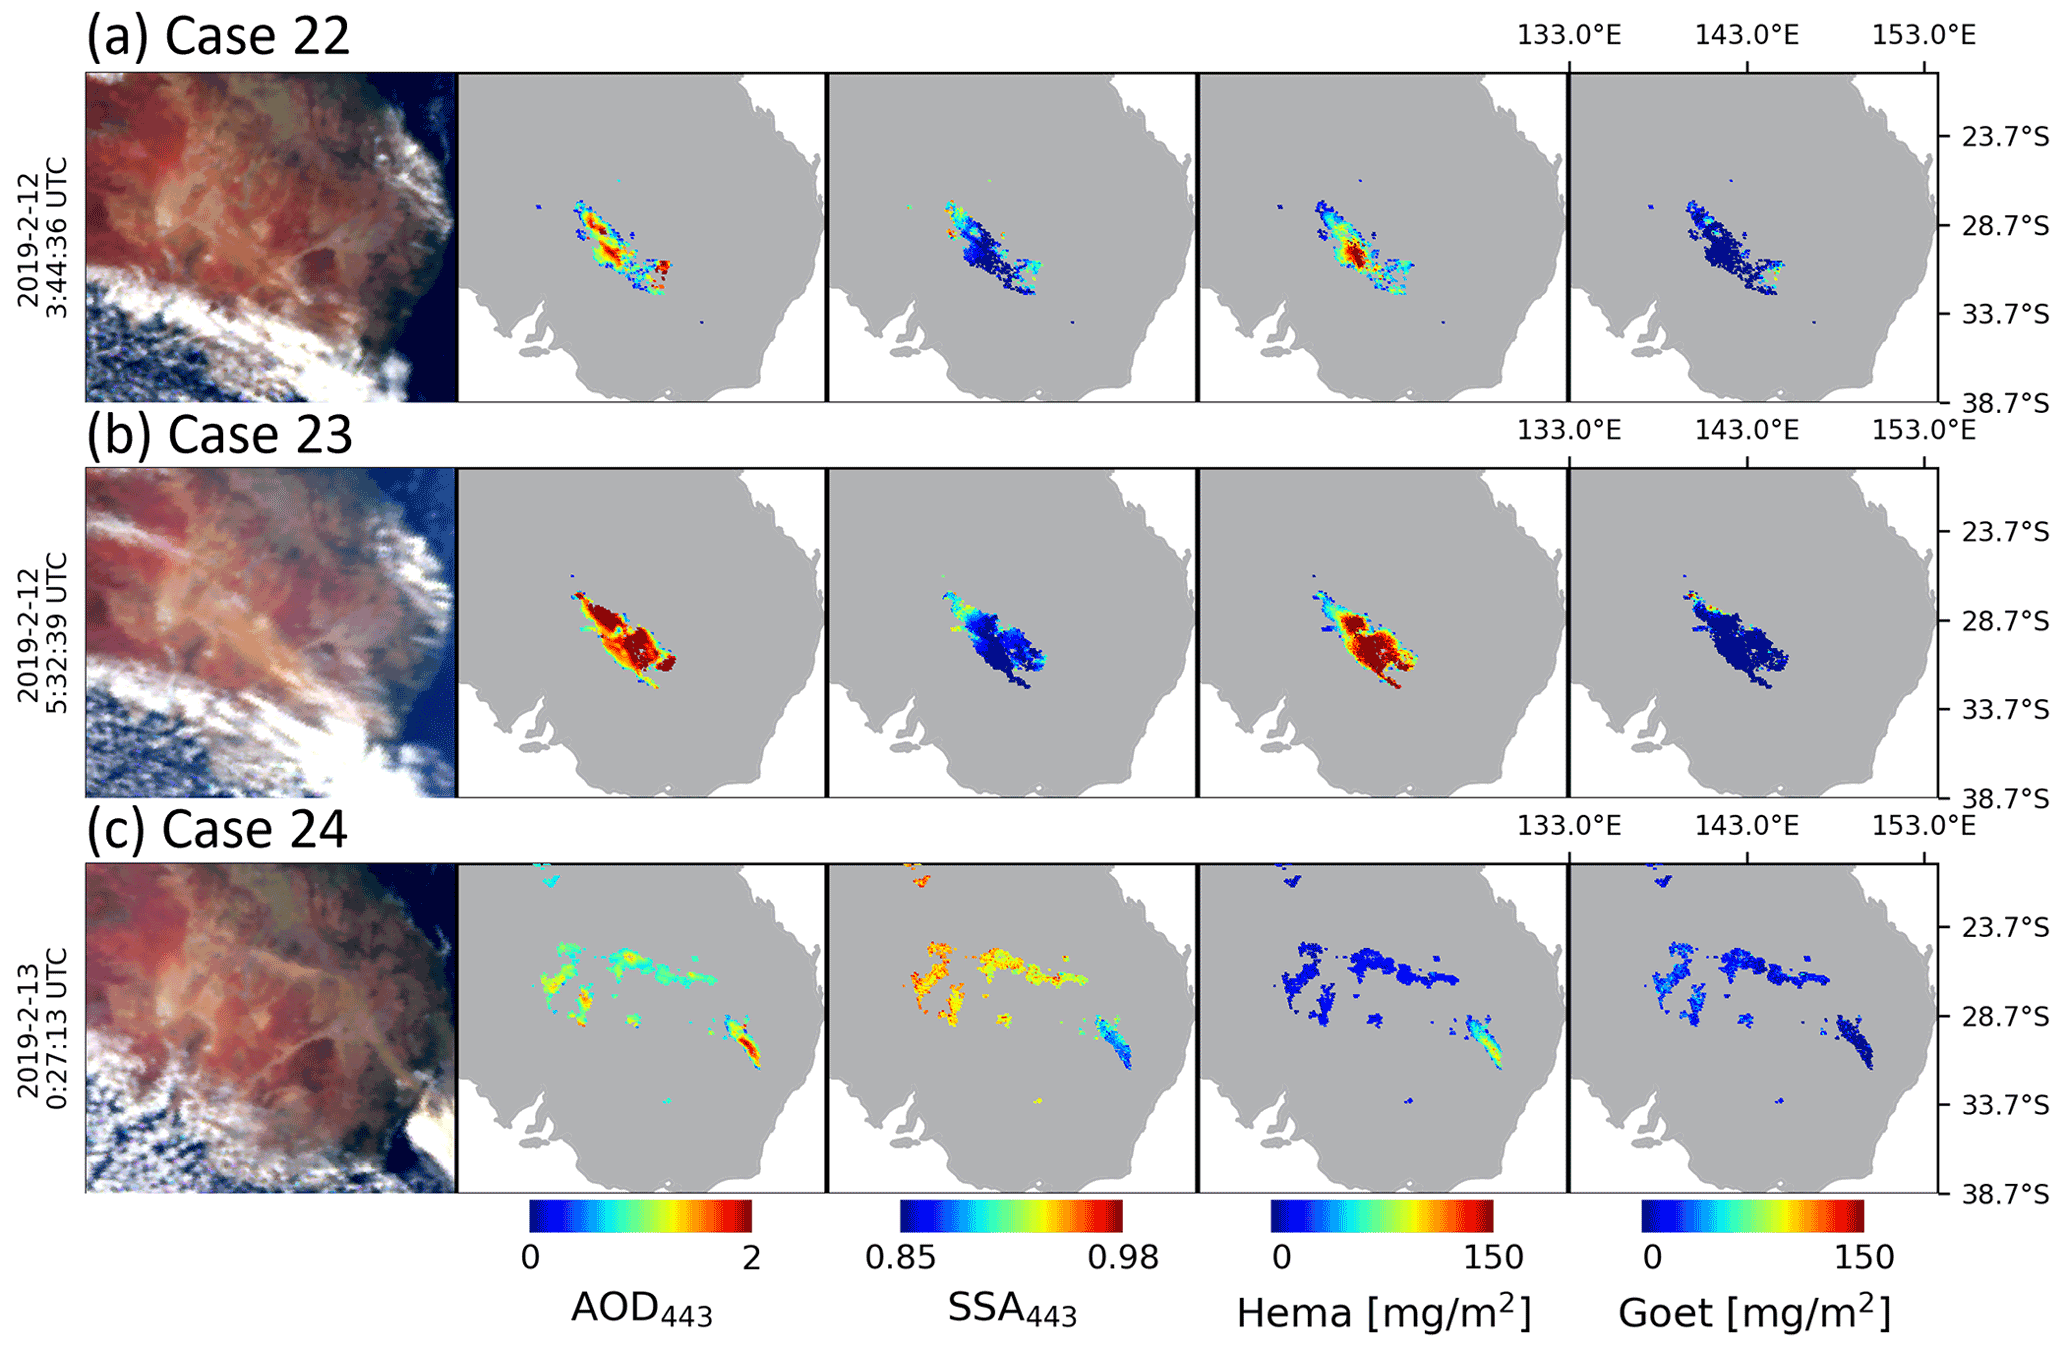
Figure A6Dust episodes over Australia. From left, RGB TOA image generated from EPIC L1B version 3 data, AOD 443 nm, SSA 443 nm, hematite mass concentration, and goethite mass concentration for each case: case 22 (row 1), dust episode on 12 February 2019, 03:00 UTC; case 23 (row 2), dust episode on 12 February 2019, 05:00 UTC; and case 24 (row 3), dust episodes on 13 February 2019.
The retrievals can be requested directly from the corresponding author (sujung.go@nasa.gov or alexei.i.lyapustin@nasa.gov).
The supplement related to this article is available online at: https://doi.org/10.5194/acp-22-1395-2022-supplement.
SG and AL designed the study with discussions with GLS and MC. GLS provided major guidance on the algorithm development and data analysis. AL provided the MAIAC EPIC products. OK participated in the collection of hematite refractive index data. SG, AL, and MC developed the code and performed the retrievals. SG, AL, GLS, and MC analyzed results. SG and AL wrote the manuscript with comments from GLS, MC, PG, MC, OK, OD, JK, ADS, BH, and JSR.
The contact author has declared that neither they nor their co-authors have any competing interests.
Publisher’s note: Copernicus Publications remains neutral with regard to jurisdictional claims in published maps and institutional affiliations.
The work of Alexei Lyapustin, Sujung Go, and Myungje Choi was funded by the NASA DSCOVR program (manager Richard Eckman) and in part by the NASA PACE program (19-PACESAT19-0039). We are grateful to the AERONET team for providing validation data and to the NASA Center for Climate Simulation for providing resources for the EPIC data processing. Co-author Jeffrey S. Reid was supported by the Office of Naval Research Code 322. A portion of this work was supported by the Earth Surface Mineral Dust Source Investigation (EMIT), a NASA Earth Ventures-Instrument (EVI-4) Mission.
This research has been supported by the Earth Sciences Division (grant nos. 18-DSCOVR18-0009 and 19-PACESAT19-0039).
This paper was edited by Yves Balkanski and reviewed by three anonymous referees.
Arimoto, R., Balsam, W., and Schloesslin, C.: Visible spectroscopy of aerosol particles collected on filters: iron-oxide minerals, Atmos. Environ., 36, 89–96, 2002.
Arola, A., Schuster, G., Myhre, G., Kazadzis, S., Dey, S., and Tripathi, S. N.: Inferring absorbing organic carbon content from AERONET data, Atmos. Chem. Phys., 11, 215–225, https://doi.org/10.5194/acp-11-215-2011, 2011.
Balkanski, Y., Schulz, M., Claquin, T., and Guibert, S.: Reevaluation of Mineral aerosol radiative forcings suggests a better agreement with satellite and AERONET data, Atmos. Chem. Phys., 7, 81–95, https://doi.org/10.5194/acp-7-81-2007, 2007.
Bedidi, A. and Cervelle, B.: Light scattering by spherical particles with hematite and goethite like optical properties: Effect of water impregnation, J. Geophys. Res., 98, 11941–11952, 1993.
Bohren, C. and Huffman, D.: Absorption and Scattering of Light by Small Particles, Wiley, New York, NY, USA, 1983.
Boucher, O., Randall, D., Artaxo, P., Bretherton, C., Feingold, G., Forster, P., Kerminen, V.-M., Kondo, Y., Liao, H., Lohman, U., Rasch, P., Satheesh, S., Sherwood, S., Stevens, B., Zhang, X.- Y., Lohmann, U., Rasch, P., Satheesh, S., Sherwood, S., Stevens, B., and Zhang, X.-Y.: Clouds and Aerosols, in: Climate Change 2013: The Physical Science Basis, Contribution of Working Group I to the Fifth Assessment Report of the Intergovernmental Panel on Climate Change, edited by: Stocker, V. B., Qin, T. F. D., Plattner, G.-K., Tignor, M., Allen, S. K., Boschung, J., Nauels, A., Xia, Y., and Midgley, P. M., Cambridge University Press, Cambridge, United Kingdom, 573–657, 2013.
Chen, C. T. and Cahan, B. D.: Visible and ultraviolet optical properties of single-crystal and polycrystalline hematite measured by spectroscopic ellipsometry, J. Opt. Soc. Am., 71, 932–934, 1981.
Claquin, T., Schulz, M., and Balkanski, Y.: Modeling the mineralogy of atmospheric dust sources, J. Geophys. Res., 104, 22222–243256, 1999.
Di Biagio, C., Formenti, P., Balkanski, Y., Caponi, L., Cazaunau, M., Pangui, E., Journet, E., Nowak, S., Caquineau, S., Andreae, M. O., Kandler, K., Saeed, T., Piketh, S., Seibert, D., Williams, E., and Doussin, J.-F.: Global scale variability of the mineral dust long-wave refractive index: a new dataset of in situ measurements for climate modeling and remote sensing, Atmos. Chem. Phys., 17, 1901–1929, https://doi.org/10.5194/acp-17-1901-2017, 2017.
Di Biagio, C., Formenti, P., Balkanski, Y., Caponi, L., Cazaunau, M., Pangui, E., Journet, E., Nowak, S., Andreae, M. O., Kandler, K., Saeed, T., Piketh, S., Seibert, D., Williams, E., and Doussin, J.-F.: Complex refractive indices and single-scattering albedo of global dust aerosols in the shortwave spectrum and relationship to size and iron content, Atmos. Chem. Phys., 19, 15503–15531, https://doi.org/10.5194/acp-19-15503-2019, 2019.
Di Biagio, C., Balkanski, Y., Albani, S., Boucher, O., and Formenti, P.: Direct Radiative Effect by Mineral Dust Aerosols Constrained by New Microphysical and Spectral Optical Data, Geophys. Res. Lett., 47, 1–12, https://doi.org/10.1029/2019GL086186, 2020.
Diner, D. J., Boland, S. W., Brauer, M., Bruegge, C., Burke, K. A., Chipman, R., Di Girolamo, L., Garay, M. J., Hasheminassab, S., Hyer, E., Jerrett, M., Jovanovic, V., Kalashnikova, O. V., Liu, Y., Lyapustin, A. I., Martin, R. V., Nastan, A., Ostro, B. D., Ritz, B., Schwartz, J., Wang, J., and Xu, F.: Advances in multiangle satellite remote sensing of speciated airborne particulate matter and association with adverse health effects: from MISR to MAIA, J. Appl. Remote Sens., 12, 042603, https://doi.org/10.1117/1.JRS.12.042603, 2018.
Dubovik, O., Holben, B., Eck, T. F., Smirnov, A., Kaufmann, Y. J., King, M. D., Tanré, D., and Slutsker, I.: Variability of absorption and optical properties of key aerosol types observed in worldwide locations, J. Atmos. Sci., 59, 590–608, https://doi.org/10.1175/1520-0469(2002)0592.0.CO;2, 2002.
Eck, T. F., Holben, B. N., Sinyuk, A., Pinker, R. T., Goloub, P., Chen, H., Chatenet, B., Li, Z., Singh, R. P., Tripathi, S. N., Reid, J. S., Giles, D. M., Dubovik, O., O'Neill, N. T., Smirnov, A., Wang, P., and Xia, X.: Climatological aspects of the optical properties of fine/coarse mode aerosol mixtures, J. Geophys. Res., 115, D19205, https://doi.org/10.1029/2010JD014002, 2010.
Fitzpatrick, R. W.: Changes in soil and water characteristics of natural, drained and re-flooded soils in the Mesopotamian marshlands: Implications for land management planning, in: CSIRO Land and Water Client Report, 181 pp., available at: http://www.clw.csiro.au/publications/consultancy/2004/Mesopotamian-marshlands-soil.pdf (last access: 13 January 2022), 2004.
Formenti, P., Rajot, J. L., Desboeufs, K., Caquineau, S., Chevaillier, S., Nava, S., Gaudichet, A., Journet, E., Triquet, S., and Alfaro, S.: Regional variability of the composition of mineral dust from western Africa: results from the AMMA SOP0/DABEX and DODO field campaigns, J. Geophys. Res.-Atmos., 113, D00C13, https://doi.org/10.1029/2008JD009903, 2008.
Formenti, P., Schütz, L., Balkanski, Y., Desboeufs, K., Ebert, M., Kandler, K., Petzold, A., Scheuvens, D., Weinbruch, S., and Zhang, D.: Recent progress in understanding physical and chemical properties of African and Asian mineral dust, Atmos. Chem. Phys., 11, 8231–8256, https://doi.org/10.5194/acp-11-8231-2011, 2011a.
Formenti, P., Rajot, J. L., Desboeufs, K., Saïd, F., Grand, N., Chevaillier, S., and Schmechtig, C.: Airborne observations of mineral dust over western Africa in the summer Monsoon season: spatial and vertical variability of physico-chemical and optical properties, Atmos. Chem. Phys., 11, 6387–6410, https://doi.org/10.5194/acp-11-6387-2011, 2011b.
Formenti, P., Caquineau, S., Chevaillier, S., Klaver, A., Desboeufs, K., Rajot, J. L., Belin, S., and Briois, V.: Dominance of goethite over hematite in iron oxides of mineral dust from Western Africa: Quantitative partitioning by X-ray absorption spectroscopy, J. Geophys. Res.-Atmos., 119, 12740–12754, https://doi.org/10.1002/2014JD021668, 2014a.
Formenti, P., Caquineau, S., Desboeufs, K., Klaver, A., Chevaillier, S., Journet, E., and Rajot, J. L.: Mapping the physico-chemical properties of mineral dust in western Africa: mineralogical composition, Atmos. Chem. Phys., 14, 10663–10686, https://doi.org/10.5194/acp-14-10663-2014, 2014b.
Galuza, A., Eremenko, V., and Kirichenko, A.: Analysis of hematite reflection spectrum by the Kramers-Kronig method, Sov. Phys. Sol. State, 21, 654–656, 1979.
Giles, D. M., Sinyuk, A., Sorokin, M. G., Schafer, J. S., Smirnov, A., Slutsker, I., Eck, T. F., Holben, B. N., Lewis, J. R., Campbell, J. R., Welton, E. J., Korkin, S. V., and Lyapustin, A. I.: Advancements in the Aerosol Robotic Network (AERONET) Version 3 database – automated near-real-time quality control algorithm with improved cloud screening for Sun photometer aerosol optical depth (AOD) measurements, Atmos. Meas. Tech., 12, 169–209, https://doi.org/10.5194/amt-12-169-2019, 2019.
Gillespie, J. B. and Lindberg, J. D.: Ultraviolet and visible imaginary refractive index of strongly absorbing atmospheric particulate matter, Appl. Optics, 31, 2112–2115, 1992.
Ginoux, P., Prospero, J., Gill, T. E., Hsu, N. C., and Zhao, M.: Global scale attribution of anthropogenic and natural dust sources and their emission rates based on MODIS deep blue aerosol products, Rev. Geophys., 50, RG3005, https://doi.org/10.1029/2012RG000388, 2012.
Glotch, T. D. and Rossman, G. R.: Mid-infrared reflectance spectra and optical constants of six iron oxide/oxyhydroxide phases, Icarus, 204, 663–671, 2009.
Green, R. O., Mahowald, N., Ung, C., Thompson, D. R., Bator, L., Bennet, M., Bernas, M., Blackway, N., Bradley, C., Cha, J., Clark, P., Clark, R., Cloud, D., Diaz, E., Ben Dor, E., Duren, R., Eastwood, M., Ehlmann, B. L., Fuentes, L., Ginoux, P., Gross, J., He, Y., Kalashnikova, O., Kert, W., Keymeulen, D., Klimesh, M., Ku, D., Kwong-Fu, H., Liggett, E., Li, L., Lundeen, S., Makowski, M. D., Mazer, A., Miller, R., Mouroulis, P., Oaida, B., Okin, G. S., Ortega, A., Oyake, A., Nguyen, H., Pace, T., Painter, T. H., Pempejian, J., Garcia-Pando, C. P., Pham, T., Phillips, B., Pollock, R., Purcell, R., Realmuto, V., Schoolcraft, J., Sen, A., Shin, S., Shaw, L., Soriano, M., Swayze, G., Thingvold, E., Vaid, A., and Zan, J.: The Earth Surface Mineral Dust Source Investigation: An Earth Science Imaging Spectroscopy Mission, in: 2020 IEEE Aerospace Conference, Big Sky, Montana, USA, 7–14 March 2020, 1–15, https://doi.org/10.1109/AERO47225.2020.9172731, 2020.
Hess, M., Kopke, P., and Schult, I.: Optical properties of aerosols and clouds: the software package OPAC, B. Am. Meteorol. Soc., 79, 831–844, 1998.
Holben, B. N., Eck, T. F., Slutsker, I., Tanre, D., Buis, J. P., Setzer, A., Vermote, E., Reagan, J. A., Kaufman, Y. J., Nakajima, T., Lavenu, F., Jankowiak, I., and Smirnov, A.: AERONET – A federated instrument network and data archive for aerosol characterization, Remote Sens. Environ., 66, 1–16, https://doi.org/10.1016/S0034-4257(98)00031-5, 1998.
Hsu, W. P. and Matijevic, E.: Optical properties of monodispersed hematite hydrosols, Appl. Optics, 24, 1623–1630, 1985.
Journet, E., Balkanski, Y., and Harrison, S. P.: A new data set of soil mineralogy for dust-cycle modeling, Atmos. Chem. Phys., 14, 3801–3816, https://doi.org/10.5194/acp-14-3801-2014, 2014.
Kalashnikova, O. V. and Sokolik, I. N.: Modeling the radiative properties of nonspherical soil-derived mineral aerosols, J. Quant. Spectrosc. Ra., 87, 137–166, 2004.
Kerker, M., Scheiner, P., Cooke, D., and Kratohvil, J.: Absorption index and color of colloidal hematite, J. Colloid Interf. Sci., 71, 176–187, 1979.
Knippertz, P. and Stuut, J.-B. W. (Eds.): Mineral Dust: A Key Player in the Earth System, Springer Science & Business Media, Dordrecht, https://doi.org/10.1007/978-94-017-8978-3_1, 2014.
Kok, J. F.: A scaling theory for the size distribution of emitted dust aerosols suggests climate models underestimate the size of the global dust cycle, P. Natl. Acad. Sci. USA, 108, 1016–1021, https://doi.org/10.1073/pnas.1014798108, 2011.
Kok, J. F., Ridley, D. A., Zhou, Q., Miller, R. L., Zhao, C., Heald, C. L., Ward, D. S., Albani, S., and Haustein, K.: Smaller desert dust cooling effect estimated from analysis of dust size and abundance, Nat. Geosci., 10, 274–278, https://doi.org/10.1038/ngeo2912, 2017.
Koven, C. D. and Fung, I.: Inferring dust composition from wavelength-dependent absorption in Aerosol Robotic Network (AERONET) data, J. Geophys. Res., 111, D14205, https://doi.org/10.1029/2005JD006678, 2006.
Krekov, G. M.: Models of atmospheric aerosols, in: Aerosol Effects on Climate, edited by: Jennings, S. G., Univ. of Ariz. Press, Tucson, 9–72, 1992.
Lafon, S., Rajot, J., Alfaro, S., and Gaudichet, A.: Quantification of iron oxides in desert aerosol, Atmos. Environ., 38, 1211–1218, 2004.
Lafon, S., Sokolik, I. N., Rajot, J. L., Caquineau, S., and Gaudichet, A.: Characterization of iron oxides in mineral dust aerosols: Implications for light absorption, J. Geophys. Res., 111, D21207, https://doi.org/10.1029/2005jd007016, 2006.
Lazaro, F. J., Gutierrez, L., Barrón, V., and Gelado, M. D.: The speciation of iron in desert dust collected in Gran Canaria (Canary Islands): Combined chemical, magnetic and optical analysis, Atmos. Environ., 42, 8987–8996, 2008.
Li, L., Dubovik, O., Derimian, Y., Schuster, G. L., Lapyonok, T., Litvinov, P., Ducos, F., Fuertes, D., Chen, C., Li, Z., Lopatin, A., Torres, B., and Che, H.: Retrieval of aerosol components directly from satellite and ground-based measurements, Atmos. Chem. Phys., 19, 13409–13443, https://doi.org/10.5194/acp-19-13409-2019, 2019.
Li, L., Mahowald, N. M., Miller, R. L., Pérez García-Pando, C., Klose, M., Hamilton, D. S., Gonçalves Ageitos, M., Ginoux, P., Balkanski, Y., Green, R. O., Kalashnikova, O., Kok, J. F., Obiso, V., Paynter, D., and Thompson, D. R.: Quantifying the range of the dust direct radiative effect due to source mineralogy uncertainty, Atmos. Chem. Phys., 21, 3973–4005, https://doi.org/10.5194/acp-21-3973-2021, 2021.
Li, Z., Gu, X., Wang, L., Li, D., Xie, Y., Li, K., Dubovik, O., Schuster, G., Goloub, P., Zhang, Y., Li, L., Ma, Y., and Xu, H.: Aerosol physical and chemical properties retrieved from ground-based remote sensing measurements during heavy haze days in Beijing winter, Atmos. Chem. Phys., 13, 10171–10183, https://doi.org/10.5194/acp-13-10171-2013, 2013.
Li, Z., Li, L., Zhang, F., Li, D., Xie, Y., and Xu, H.: Comparison of aerosol properties over Beijing and Kanpur: Optical, physical properties and aerosol component composition retrieved from 12 years ground-based Sun-sky radiometer remote sensing data, J. Geophys. Res.-Atmos., 120, 1520–1535, https://doi.org/10.1002/2014JD022593, 2015.
Linke, C., Möhler, O., Veres, A., Mohácsi, Á., Bozóki, Z., Szabó, G., and Schnaiter, M.: Optical properties and mineralogical composition of different Saharan mineral dust samples: a laboratory study, Atmos. Chem. Phys., 6, 3315–3323, https://doi.org/10.5194/acp-6-3315-2006, 2006.
Liu, X., Easter, R. C., Ghan, S. J., Zaveri, R., Rasch, P., Shi, X., Lamarque, J.-F., Gettelman, A., Morrison, H., Vitt, F., Conley, A., Park, S., Neale, R., Hannay, C., Ekman, A. M. L., Hess, P., Mahowald, N., Collins, W., Iacono, M. J., Bretherton, C. S., Flanner, M. G., and Mitchell, D.: Toward a minimal representation of aerosols in climate models: description and evaluation in the Community Atmosphere Model CAM5, Geosci. Model Dev., 5, 709–739, https://doi.org/10.5194/gmd-5-709-2012, 2012.
Liu, X., Ma, P.-L., Wang, H., Tilmes, S., Singh, B., Easter, R. C., Ghan, S. J., and Rasch, P. J.: Description and evaluation of a new four-mode version of the Modal Aerosol Module (MAM4) within version 5.3 of the Community Atmosphere Model, Geosci. Model Dev., 9, 505–522, https://doi.org/10.5194/gmd-9-505-2016, 2016.
Longtin, D. R., Shettle, E. P., Hummel, J. R., and Pryce, J. D.: A Wind Dependent Desert Aerosol Model: Radiative Properties, Air Force Geophys. Lab., Air Force Syst. Command Hanscom Air Force Base, Mass, AFGL-TR-88-0112, 115, 1988.
Lyapustin, A., Martonchik, J., Wang, Y., Laszlo, I., and Korkin, S.: Multi-Angle Implementation of Atmospheric Correction (MAIAC): 1. Radiative Transfer Basis and Look-Up Tables, J. Geophys. Res., 116, D03210, https://doi.org/10.1029/2010JD014985, 2011.
Lyapustin, A., Wang, Y., Korkin, S., and Huang, D.: MODIS Collection 6 MAIAC algorithm, Atmos. Meas. Tech., 11, 5741–5765, https://doi.org/10.5194/amt-11-5741-2018, 2018.
Lyapustin, A., Go, S., Korkin, S., Wang, Y., Torres, O., Jethva, H. and Marshak, A.: Retrievals of Aerosol Optical Depth and Spectral Absorption from DSCOVR EPIC. Front. Remote Sens., 2, 645794, https://doi.org/10.3389/frsen.2021.645794, 2021.
Marusak, L. A., Messier, R., and White, W. B.: Optical absorption spectrum of hematite, αFe2O3 near IR to UV, J. Phys. Chem. Sol., 41, 981–984, https://doi.org/10.1016/0022-3697(80)90105-5, 1980.
Menut, L., Siour, G., Bessagnet, B., Couvidat, F., Journet, E., Balkanski, Y., and Desboeufs, K.: Modelling the mineralogical composition and solubility of mineral dust in the Mediterranean area with CHIMERE 2017r4, Geosci. Model Dev., 13, 2051–2071, https://doi.org/10.5194/gmd-13-2051-2020, 2020.
Moosmüller, H., Engelbrecht, J. P., Skiba, M., Frey, G., Chakrabarty, R. K., and Arnott, W. P.: Single scattering albedo of fine mineral dust aerosols controlled by iron concentration, J. Geophs. Res., 2006, 2004–2008, https://doi.org/10.1029/2011JD016909, 2012.
Moskowitz, B. M., Reynolds, R. L., Goldstein, H. L., Berquó, T. S., Kokaly, R. F., and Bristow, C. S.: Iron oxide minerals in dust-source sediments from the Bodélé Depression, Chad: Implications for radiative properties and Fe bioavailability of dust plumes from the Sahara, Aeolian Res., 22, 93–106, https://doi.org/10.1016/j.aeolia.2016.07.001, 2016.
Nicholson, S. E.: The ITCZ and the seasonal cycle over equatorial Africa, B. Am. Meteorol. Soc., 99, 337–348, https://doi.org/10.1175/BAMS-D-16-0287.1, 2018.
Onari, S., Arai, T., and Kudo, K.: Infrared lattice vibrations and dielectric dispersion in α-Fe2O3, Phys. Rev. B, 16, 1717–1721, 1977.
Perlwitz, J. P., Pérez García-Pando, C., and Miller, R. L.: Predicting the mineral composition of dust aerosols – Part 1: Representing key processes, Atmos. Chem. Phys., 15, 11593–11627, https://doi.org/10.5194/acp-15-11593-2015, 2015a.
Perlwitz, J. P., Pérez García-Pando, C., and Miller, R. L.: Predicting the mineral composition of dust aerosols – Part 2: Model evaluation and identification of key processes with observations, Atmos. Chem. Phys., 15, 11629–11652, https://doi.org/10.5194/acp-15-11629-2015, 2015b.
Prospero, J. M., Ginoux, P., Torres, O., Nicholson, S. E., and Gill, T. E.: Environmental characterization of global sources of atmospheric soil dust identified with the Nimbus 7 Total Ozone Mapping Spectrometer (TOMS) absorbing aerosol product, Rev. Geophys., 40, 1–31, 2002.
Querry, M. R.: Optical Constants, Contractor report, US Army Chemical Research, Development and Engineering Center (CRDC), Aberdeen Proving Ground, MD, 418 pp., 1985.
Querry, M. R., Osborne, G., Lies, K., Jordon, R., and Coveney Jr., R. M.: Complex refractive index of limestone in the visible and infrared, Appl. Optics, 17, 353–356, 1978.
Samset, B. H., Stjern, C. W., Andrews, E., Kahn, R. A., Myhre, G., Schulz, M., and Schuster, G. L.: Aerosol Absorption: Progress Towards Global and Regional Constraints, Current Climate Change Reports, 4, 65–83, https://doi.org/10.1007/s40641-018- 0091-4, 2018.
Sarkar, S., Chauhan, A., Kumar, R., and Singh, R. P.: Impact of deadly dust storms (May 2018) on air quality, meteorological, and atmospheric parameters over the northern parts of India, GeoHealth, 3, 67–80, https://doi.org/10.1029/2018GH000170, 2019.
Scanza, R. A., Mahowald, N., Ghan, S., Zender, C. S., Kok, J. F., Liu, X., Zhang, Y., and Albani, S.: Modeling dust as component minerals in the Community Atmosphere Model: development of framework and impact on radiative forcing, Atmos. Chem. Phys., 15, 537–561, https://doi.org/10.5194/acp-15-537-2015, 2015.
Schuster, G. L., Dubovik, O., and Arola, A.: Remote sensing of soot carbon – Part 1: Distinguishing different absorbing aerosol species, Atmos. Chem. Phys., 16, 1565–1585, https://doi.org/10.5194/acp-16-1565-2016, 2016.
Schuster, G. L., Dubovik, O., Holben, B. N., and Clothiaux, E. E.: Inferring black carbon content and specific absorption from Aerosol Robotic Network (AERONET) aerosol retrievals, J. Geophys. Res., 110, D10S17, https://doi.org/10.1029/2004JD004548, 2005.
Schwertmann, U.: Transformation of hematite to goethite in soils. Nature, 232, 624–625, https://doi.org/10.1038/232624a0, 1971.
Schwertmann, U.: Relations between iron oxides, soil color, and soil formation, in: Soil Science Society of America, edited by: Bigham, J. M. and Ciolkosz, E. J., Soil Color, Special Pub., Madison, WI, Vol. 31, 51–69, 1993.
Shen, Z., Cao, J., Zhang, X., Arimoto, R., Ji, J., Balsam, W., Wang, Y., Zhang, R., and Li, X.: Spectroscopic analysis of iron-oxide minerals in aerosol particles from northern China, Sci. Total Environ., 367, 899–907, 2006.
Sinyuk, A., Holben, B. N., Eck, T. F., Giles, D. M., Slutsker, I., Korkin, S., Schafer, J. S., Smirnov, A., Sorokin, M., and Lyapustin, A.: The AERONET Version 3 aerosol retrieval algorithm, associated uncertainties and comparisons to Version 2, Atmos. Meas. Tech., 13, 3375–3411, https://doi.org/10.5194/amt-13-3375-2020, 2020.
Sokolik, I. N. and Toon, O. B.: Incorporation of mineralogical composition into models of the radiative properties of mineral aerosol from UV to IR wavelengths, J. Geophys. Res.-Atmos., 104, 9423–9444, 1999.
Steyer, T. R.: Infrared optical properties of some solids of possible interest in astronomy and atmospheric physics, PhD thesis, Dep. of Phys., Univ. of Ariz., Tucson, 1974.
Tagliabue, A., Bowie, A. R., Boyd, P. W., Buck, K. N., Johnson, K. S., and Saito, M. A.: The integral role of iron in ocean biogeochemistry. Nature, 543, 51–59, 2017.
Todd, M. C., Washington, R., Martins, J. V., Dubovik, O., Lizcano, G., M'Bainayel, S., and Engelstaedter, S.: Mineral dust emission from the Bodélé Depression nothern Chad, during BoDEx 2005, J. Geophys. Res.-Atmos., 112, 1–12, https://doi.org/10.1029/2006JD007170, 2007.
Torrent, J., Schwertmann, U., Fechter, H., and Alferez, F.: Quantitative relationships between soil color and hematite content, Soil Sci., 136, 354–358, 1983.
Vernon, R. C.: Extinction Coefficient of Single-Crystal Hematite in the Region 3600–7000 Å, J. Appl. Phys., 33, 2140–2141, 1962.
Viscarra Rossel, R. A., Bui, E. N., De Caritat, P., and McKenzie, N. J.: Mapping iron oxides and the color of Australian soil using visible–near-infrared reflectance spectra, J. Geophys. Res.-Earth, 115, F04031, https://doi.org/10.1029/2009JF001645, 2010.
Volz, F. E.: Infrared optical constants of ammonium sulfate, Sahara dust, volcanic pumice, and flyash, Appl. Optics, 12, 564–568, 1973.
Walker, A. L., Liu, M., Miller, S. D., Richardson, K. A., and Westphal, D. L.: Development of a dust source database for mesoscale forecasting in southwest Asia, J. Geophys. Res., 114, D18207, https://doi.org/10.1029/2008JD011541, 2009.
Wang, L., Li, Z., Tian, Q., Ma, Y., Zhang, F., Zhang, Y., Li, D., Li, K., and Li, L.: Estimate of aerosol absorbing components of black carbon, brown carbon, and dust from ground-based remote sensing data of sun-sky radiometers, J. Geophys. Res.-Atmos., 118, 6534–6543, https://doi.org/10.1002/jgrd.50356, 2013.
Wang, S., Crumeyrolle, S., Zhao, W., Xu, X., Fang, B., Derimian, Y., and Tong, Y.: Real-time retrieval of aerosol chemical composition using effective density and the imaginary part of complex refractive index, Atmos. Environ., 245, 117959, https://doi.org/0.1016/j.atmosenv.2020.117959, 2021.
Yu, Y., Notaro, M., Kalashnikova, O. V., and Garay, M. J.: Climatology of summer Shamal wind in the Middle East, J. Geophys. Res.-Atmos., 121, 289–305, https://doi.org/10.1002/2015JD024063, 2016.
Zhang, X. L., Wu, G. J., Zhang, C. L., Xu, T. L., and Zhou, Q. Q.: What is the real role of iron oxides in the optical properties of dust aerosols?, Atmos. Chem. Phys., 15, 12159–12177, https://doi.org/10.5194/acp-15-12159-2015, 2015.