the Creative Commons Attribution 4.0 License.
the Creative Commons Attribution 4.0 License.
 | 05 Jan 2022
Measurement report: Vehicle-based multi-lidar observational study of the effect of meteorological elements on the three-dimensional distribution of particles in the western Guangdong–Hong Kong–Macao Greater Bay Area
Xinqi Xu
Jielan Xie
Yuman Li
Shengjie Miao
Shaojia Fan
The distribution of meteorological elements has always been an important factor in determining the horizontal and vertical distribution of particles in the atmosphere. To study the effect of meteorological elements on the three-dimensional distribution structure of particles, mobile vehicle lidar and fixed-location observations were collected in the western Guangdong–Hong Kong–Macao Greater Bay Area of China during September and October in 2019 and 2020. Vertical aerosol extinction coefficient, depolarization ratio, and wind and temperature profiles were measured using a micro pulse lidar, a Raman scattering lidar, and a Doppler wind profile lidar installed on a mobile monitoring vehicle. The mechanism of how wind and temperature in the boundary layer affects the horizontal and vertical distribution of particles was analysed. The results show that particles were mostly distributed in downstream areas on days with moderate wind speed in the boundary layer, whereas they were distributed homogeneously on days with weaker wind. There are three typical types of vertical distribution of particles in the western Guangdong–Hong Kong–Macao Greater Bay Area (GBA): surface single layer, elevated single layer, and double layer. Analysis of wind profiles and Hybrid Single-Particle Lagrangian Integrated Trajectory Model (HYSPLIT) backward trajectory reveals different sources of particles for the three types. Particles concentrating near the temperature inversion and multiple inversions could cause more than one peak in the extinction coefficient profile. There were two mechanisms affecting the distribution of particulate matter in the upper and lower boundary layers. Based on this observational study, a general model of meteorological elements affecting the vertical distribution of urban particulate matter is proposed.
- Article
(14728 KB) - Full-text XML
- BibTeX
- EndNote


The Guangdong–Hong Kong–Macao Greater Bay Area (GBA) is one of China's national key economic development regions. It consists of Guangzhou (GZ), Shenzhen (SZ), Zhuhai (ZH), Foshan (FS), Huizhou (HZ), Dongguan (DG), Zhongshan (ZS), Jiangmen (JM), and Zhaoqing (ZQ) in Guangdong province, as well as Hong Kong and Macao, the two special administrative regions. Covering 56 000 km2, the GBA had a vast population of over 70 million at the end of 2018. The GBA plays a significant role in boosting global trade along the land-based Silk Road Economic Belt and the 21st Century Maritime Silk Road. With the rapid development of the regional economy, increasingly more studies on air quality and climate effect in the GBA have also been conducted (Fang et al., 2018; Shao et al., 2020; Zhou et al., 2018).
Anthropogenic particles in the air play an important role in the environment of human living. They not only act as air pollutants posing harmful effects to human health (Liao et al., 2017; Leikauf et al., 2020; Yao et al., 2020; Orru et al., 2017) but also alter the temperature near the ground owing to their ability to absorb and scatter solar radiation (IPCC, 2014; Strawa et al., 2010). As a result of industrialization and urbanization, megacity clusters in China such as the Beijing–Tianjin–Hebei (also called Jing-Jin-Ji (JJJ) in Chinese) area, Yangtze River Delta (YRD), and Guangdong–Hong Kong–Macao GBA have been seriously affected by particulate matter in recent years. Numerous studies on the particulate matter have been conducted in these areas (Xu et al., 2018; J. Liu et al., 2017; Du et al., 2017). Particles in the boundary layer can, directly and indirectly, affect human lives and activities. Therefore, it is essential to study their distribution characteristics.
The distribution of particles is influenced not only by changes in source emissions but also by changes in meteorological factors such as temperature and wind. It has previously been observed that a low boundary layer height and complex vertical distributions of aerosols, temperature, and relative humidity are the main structural characteristics of haze days (Huige et al., 2021). Previous studies have confirmed that different types of temperature inversions have different impacts on particles in the boundary layer (Wallace et al., 2009; Wang et al., 2018). The depth and temperature difference of the inversion region is a key factor for predictions of surface PM2.5 concentrations (Zang et al., 2017). It has been previously observed that wind fields play an important role in transboundary–local-aerosol interactions (Huang et al., 2021a, b). Recent evidence suggests that wind shear is an important factor in terms of PM10 vertical profile modification (Sekuła et al., 2021). The concentration of particulate matter also shows characteristics of wind-dependent spatial distributions in which pollutant transport within the GBA city cluster is significant (Xie et al., 2019). Hence, the issue of how meteorological factors affect the distribution of particles has received considerable critical attention.
Lidar is an active remote sensing device. It emits a laser light beam and receives a backscatter signal, which can be further used to retrieve the vertical distribution of particle optical properties, wind, and temperature. It has been widely applied in the fields of meteorology and environmental science. In most studies, it is used as a ground-based or satellite-based instrument (Tian et al., 2016; Q. Liu et al., 2017; Heese et al., 2017).
In recent years, vehicle-based lidar observation has been gradually developed and become a powerful tool to detect the physical and chemical properties of the boundary layer. Compared with traditional observations, it can carry out continuous mobile observations and obtain the change of vertical profiles of certain factors in its path. Additionally, a mobile lidar system can be used to conduct supplementary observations in areas with no lidar present. In the past few years, several vehicle-based observational experiments have been carried out (Lv et al., 2017, 2020; Lyu et al., 2018; Zhao et al., 2021; Fan et al., 2018), but research aimed at multi-lidar observations and the effect of the vertical structure of meteorological factors on the distribution of particles has largely been an underexplored domain, especially in the GBA. Former research revealed that pollution of particulate matter frequently occurs in the western part of inland regions of GBA (Fang et al., 2019), affecting downstream cities under the northerly wind field. Hence, the authors were motivated to perform observations in the western GBA with a multi-lidar system installed on a vehicle to study the influence of the three-dimensional structure of meteorological elements on the distribution of particles.
2.1 Description of observations
The horizontal distribution of the particles was studied by making mobile vehicle lidar observations over the west bank of the Pearl River estuary. During the mobile vehicle lidar observations experiment, the vehicle was driven clockwise along the west bank of the Pearl River estuary, passing through main cities of the GBA in the route, from as far north as Guangzhou to as far south as Zhuhai. The total length of the route was approximately 320 km, and the experiment was conducted during the daytime. The vehicle-based observation lasted for 7 continuous days, which started on 29 August and ended on 4 September 2020. During most of the mobile observations, the relative humidity of Zhuhai, the closest city to the sea, was below 60 %. Therefore, the influence of hygroscopic growth on the extinction coefficient was negligible. To study the vertical distribution of the particles, we conducted fixed-location lidar observation experiments using the same lidar system from 10 September to 8 October 2019 and from 29 August to 27 October 2020, totalling 89 d. The reason for choosing these periods is that they include the wet season change to the dry season in the GBA area. Therefore, changes in meteorological elements have a significant impact on the three-dimensional distribution of particles. The location of the Haizhu Lake Research Base and the area of the measuring path are shown in Fig. 1. The research area is on the Pearl River Delta plain. This area is bordered by the Nanling Mountains in the north. Mountain obstruction makes the GBA area less susceptible to long-distance transport of pollutants from other areas, and the transport of pollutants mainly occurs between cities in the research area. Observations with the vehicle-based multi-lidar system are listed in Table 1.
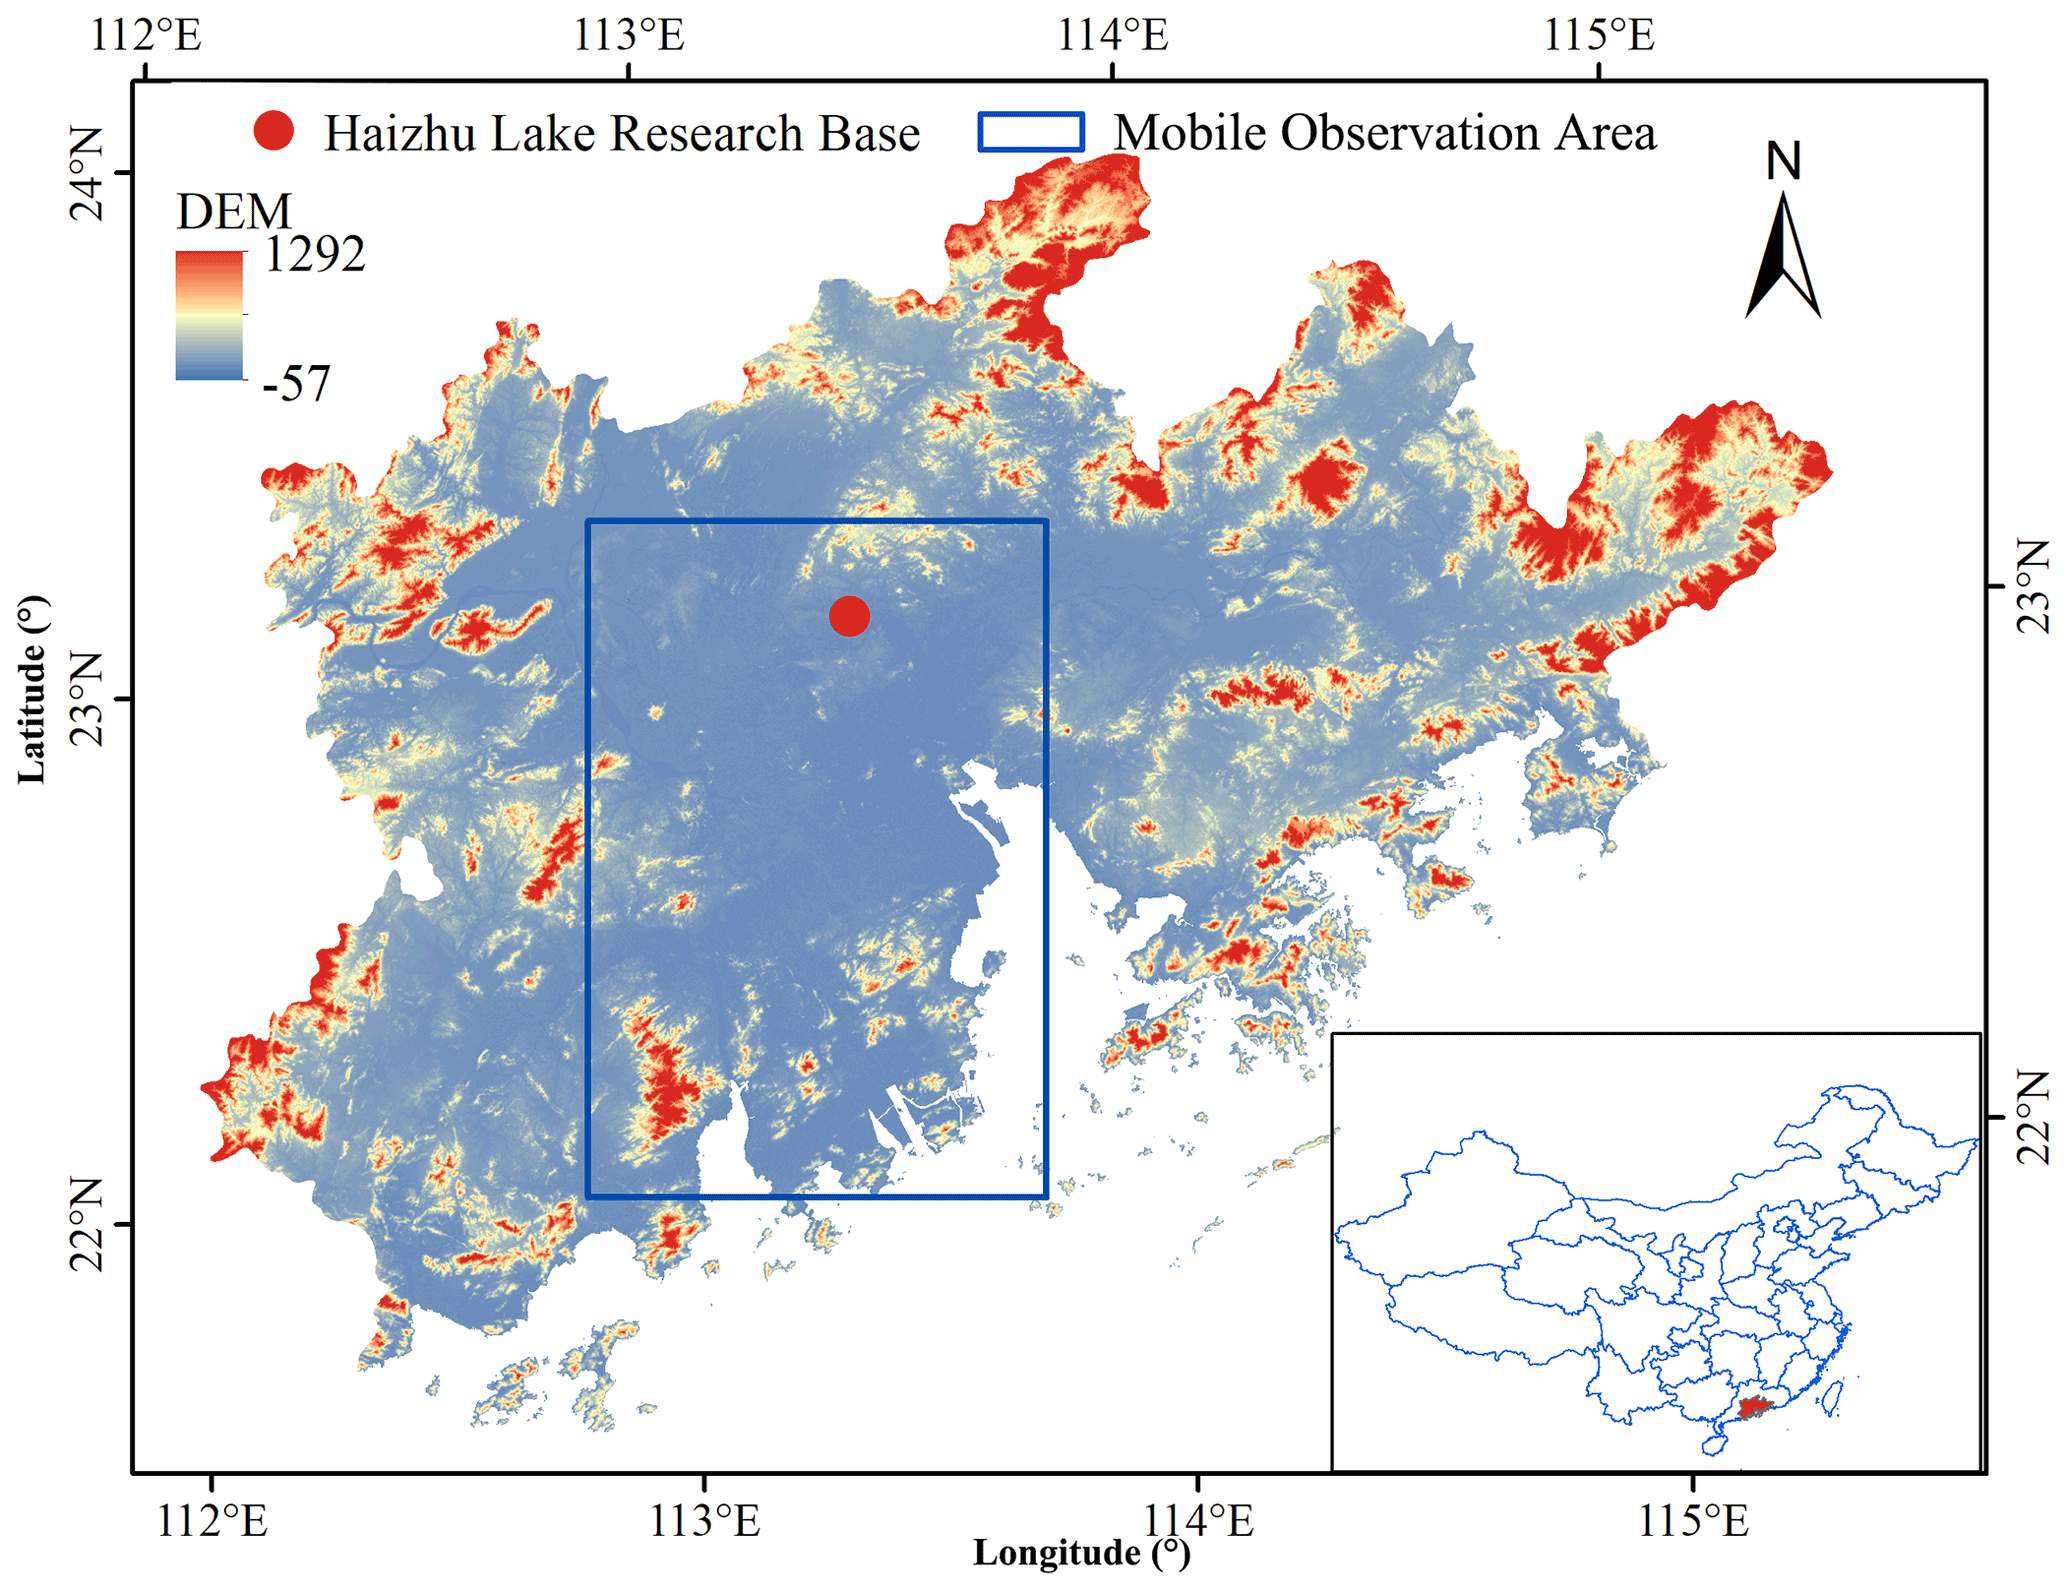
Figure 1Location of the Haizhu Lake Research Base and the mobile observation area.
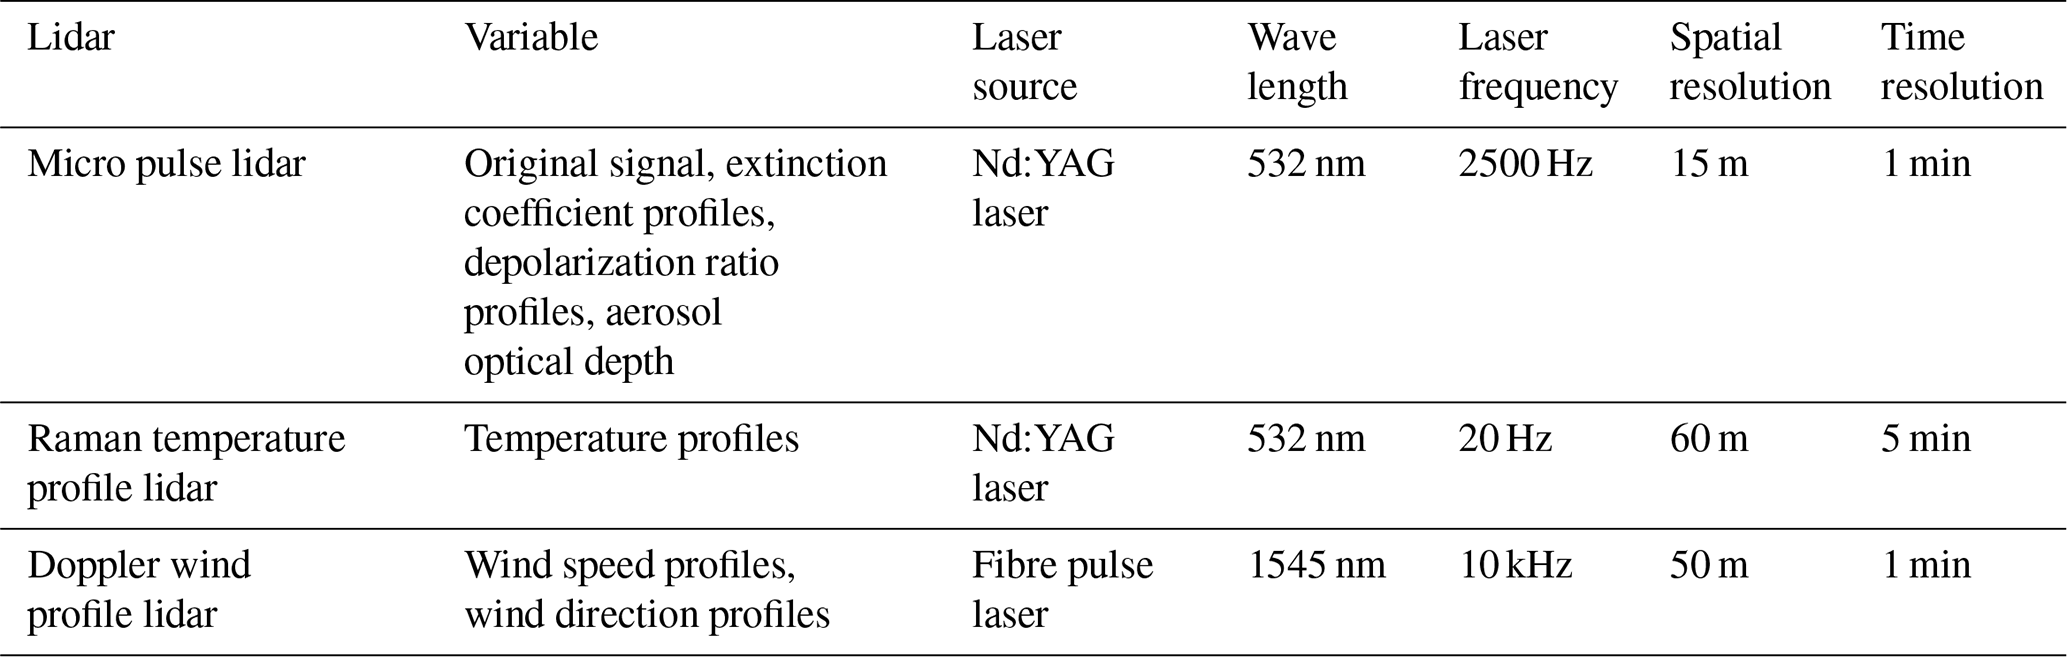
Table 1Observations with the vehicle-based multi-lidar system.

2.2 Multi-lidar system
A multi-lidar system was installed on a vehicle in this experiment. The car used was a modified seven-seater Mercedes-Benz sport utility vehicle. Three lidars were fixed to the rear of the car by steel bars to ensure their stability. To avoid the impact of frequent changes in speed and vehicle bumps during the observation, the routes of mobile observations were basically flat highways, and the driving speed was controlled within 80 km/h. During fixed-location observations, the car was parked in the observation field and connected to a stable power source. The lidar system included a 3D visual scanning micro pulse lidar (EV-Lidar-CAM, Everise Technology Ltd., Beijing, http://www.everisetech.com.cn/products/ygtc/evlidarportable.html, last access: 20 December 2021), a twirling Raman temperature profile lidar (TRL20, Everise Technology Ltd., Beijing, http://www.everisetech.com.cn/products/ygtc/templidar.html, last access: 20 December 2021), a Doppler wind profile lidar (WINDVIEW10, Everise Technology Ltd., Beijing, http://www.everisetech.com.cn/products/ygtc/windview10.html, last access: 20 December 2021), a global positioning system (GPS), and a signal acquisition unit. The three lidars are characterized by high temporal and spatial resolution and can effectively determine the evolution of the vertical distribution of particles, as well as temperature, wind speed, and wind direction over time. Remote sensing observations, such as lidar, are generally considered to be less accurate than direct observations from aircraft and meteorological tower-based sensors. Therefore, the quality of data from the lidar system was checked before using them in our study. Results show that the percentage difference between data provided by the lidar system and data from the Shenzhen meteorological tower was less than 15 %, which indicates a sufficient accuracy of the lidar instrument. We have used this lidar system in our previous research and showed it to be reliable (He et al., 2021a, b). The vehicle setup is shown in Fig. 2. Details of the three lidars are shown in Table 2.

2.3 Calculation of extinction coefficient and depolarization ratio
The aerosol extinction coefficient represents the reduction of radiation in a band owing to scattering and absorption by aerosols (Li et al., 2020). The formula for the extinction coefficient calculation (Fernald, 1984) is as follows:
where P(z) is the power received at altitude z; αa and αm are the particle extinction and molecular extinction, respectively; and Sa= 50 Sr is the particle extinction-to-backscatter ratio, which is the default value given by the manufacturer. This value is consistent with prior work in the GBA area (Li et al., 2020). is the molecular extinction-to-backscatter ratio, and zc is the calibration height of the micro pulse lidar, which is variable, ranging from 10–15 km and depending on the signal intensity.
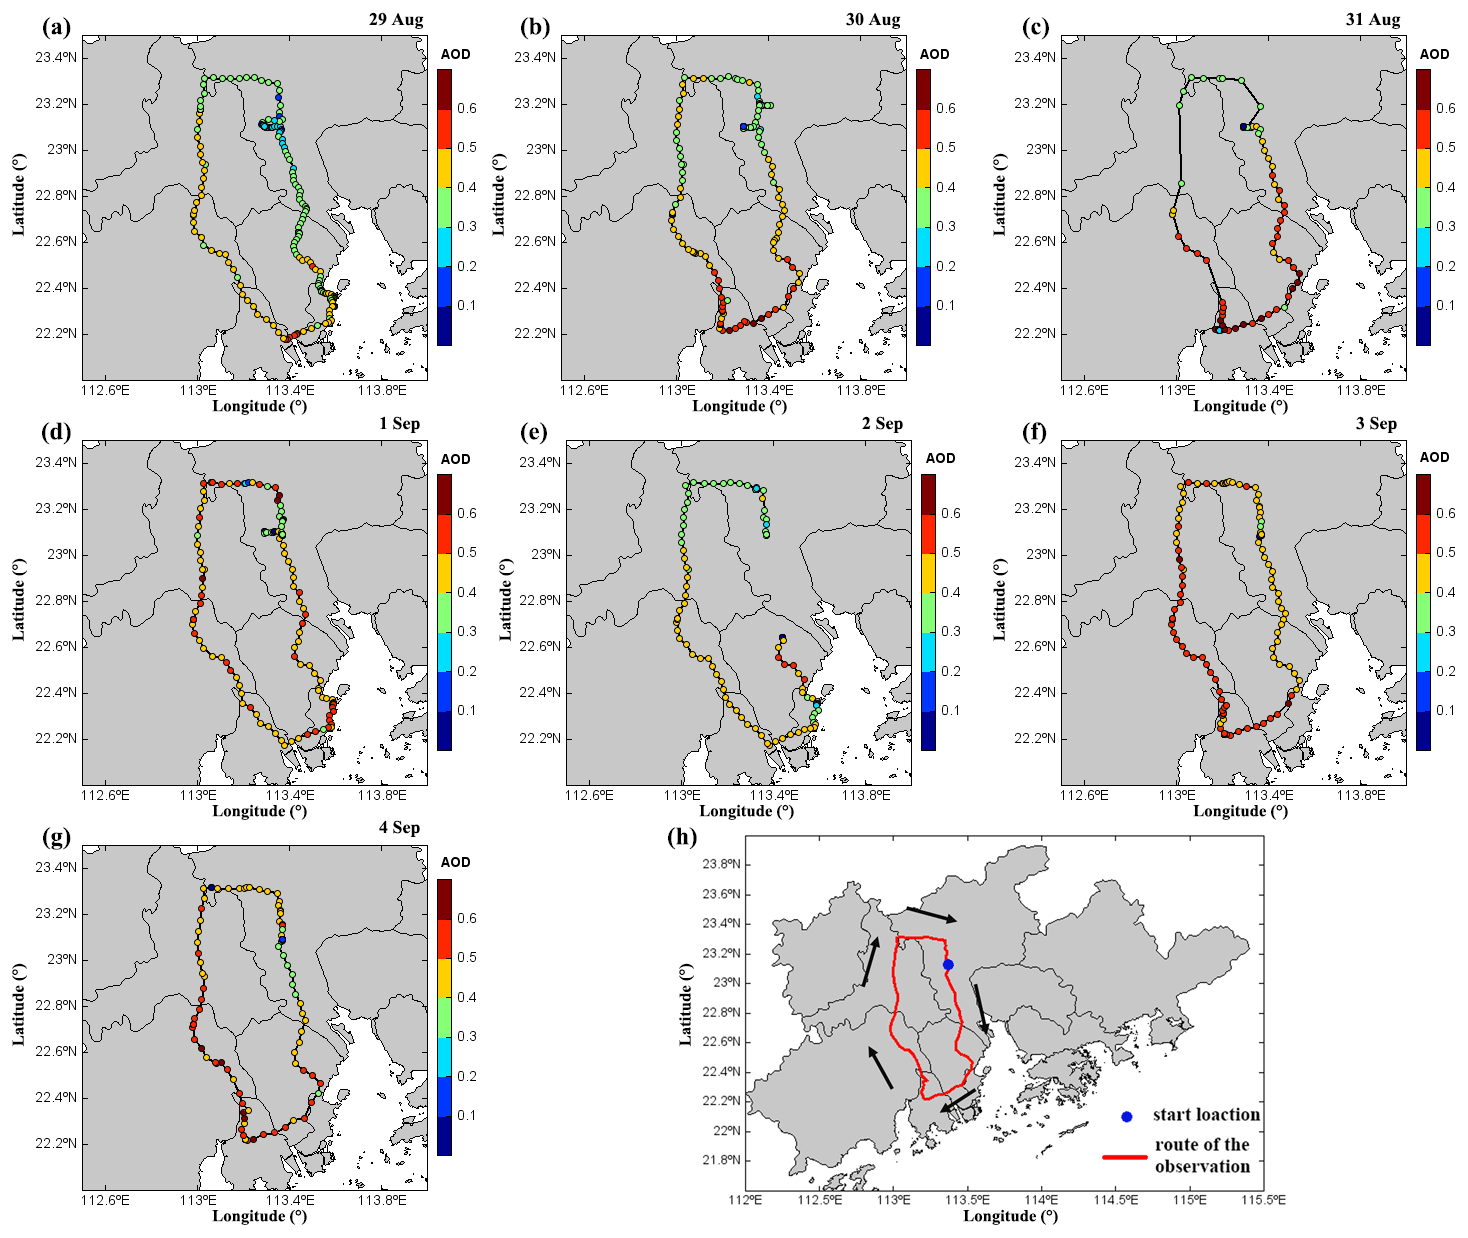
Figure 3(a–g) Aerosol optical depth (AOD) measured at 532 nm with the MPL in the route from 29 August to 4 September 2020, and (h) Guangdong–Hong Kong–Macao Greater Bay Area and route details.
The micro pulse lidar (MPL) system uses the scattering of polarized light to distinguish between spherical and non-spherical particles to ascertain the particle species (Li et al., 2020). The depolarization ratio is calculated with the following formula:
where Pbot and Pparallel represent the cross-polarized and co-polarized signal, respectively. k the depolarization calibration constant, which is the ratio of the gains of the parallel and perpendicular channels (Dai et al., 2018).
2.4 HYSPLIT backward trajectory model
The regional transport of particulate matter was studied using the National Oceanic and Atmospheric Administration Hybrid Single-Particle Lagrangian Integrated Trajectory Model (HYSPLIT) so as to determine the trajectory of air masses. It has been widely used in the field of air masses and pollutant source analysis (Deng et al., 2016; Lu et al., 2018; Kim et al., 2020). In this study, meteorological data of the Global Data Assimilation System (GDAS) at the spatial resolution of 0.25∘ were used. To obtain the sources of particulate matter at different heights, altitudes of 100, 500, and 1000 m were set as the ending points of the trajectories.
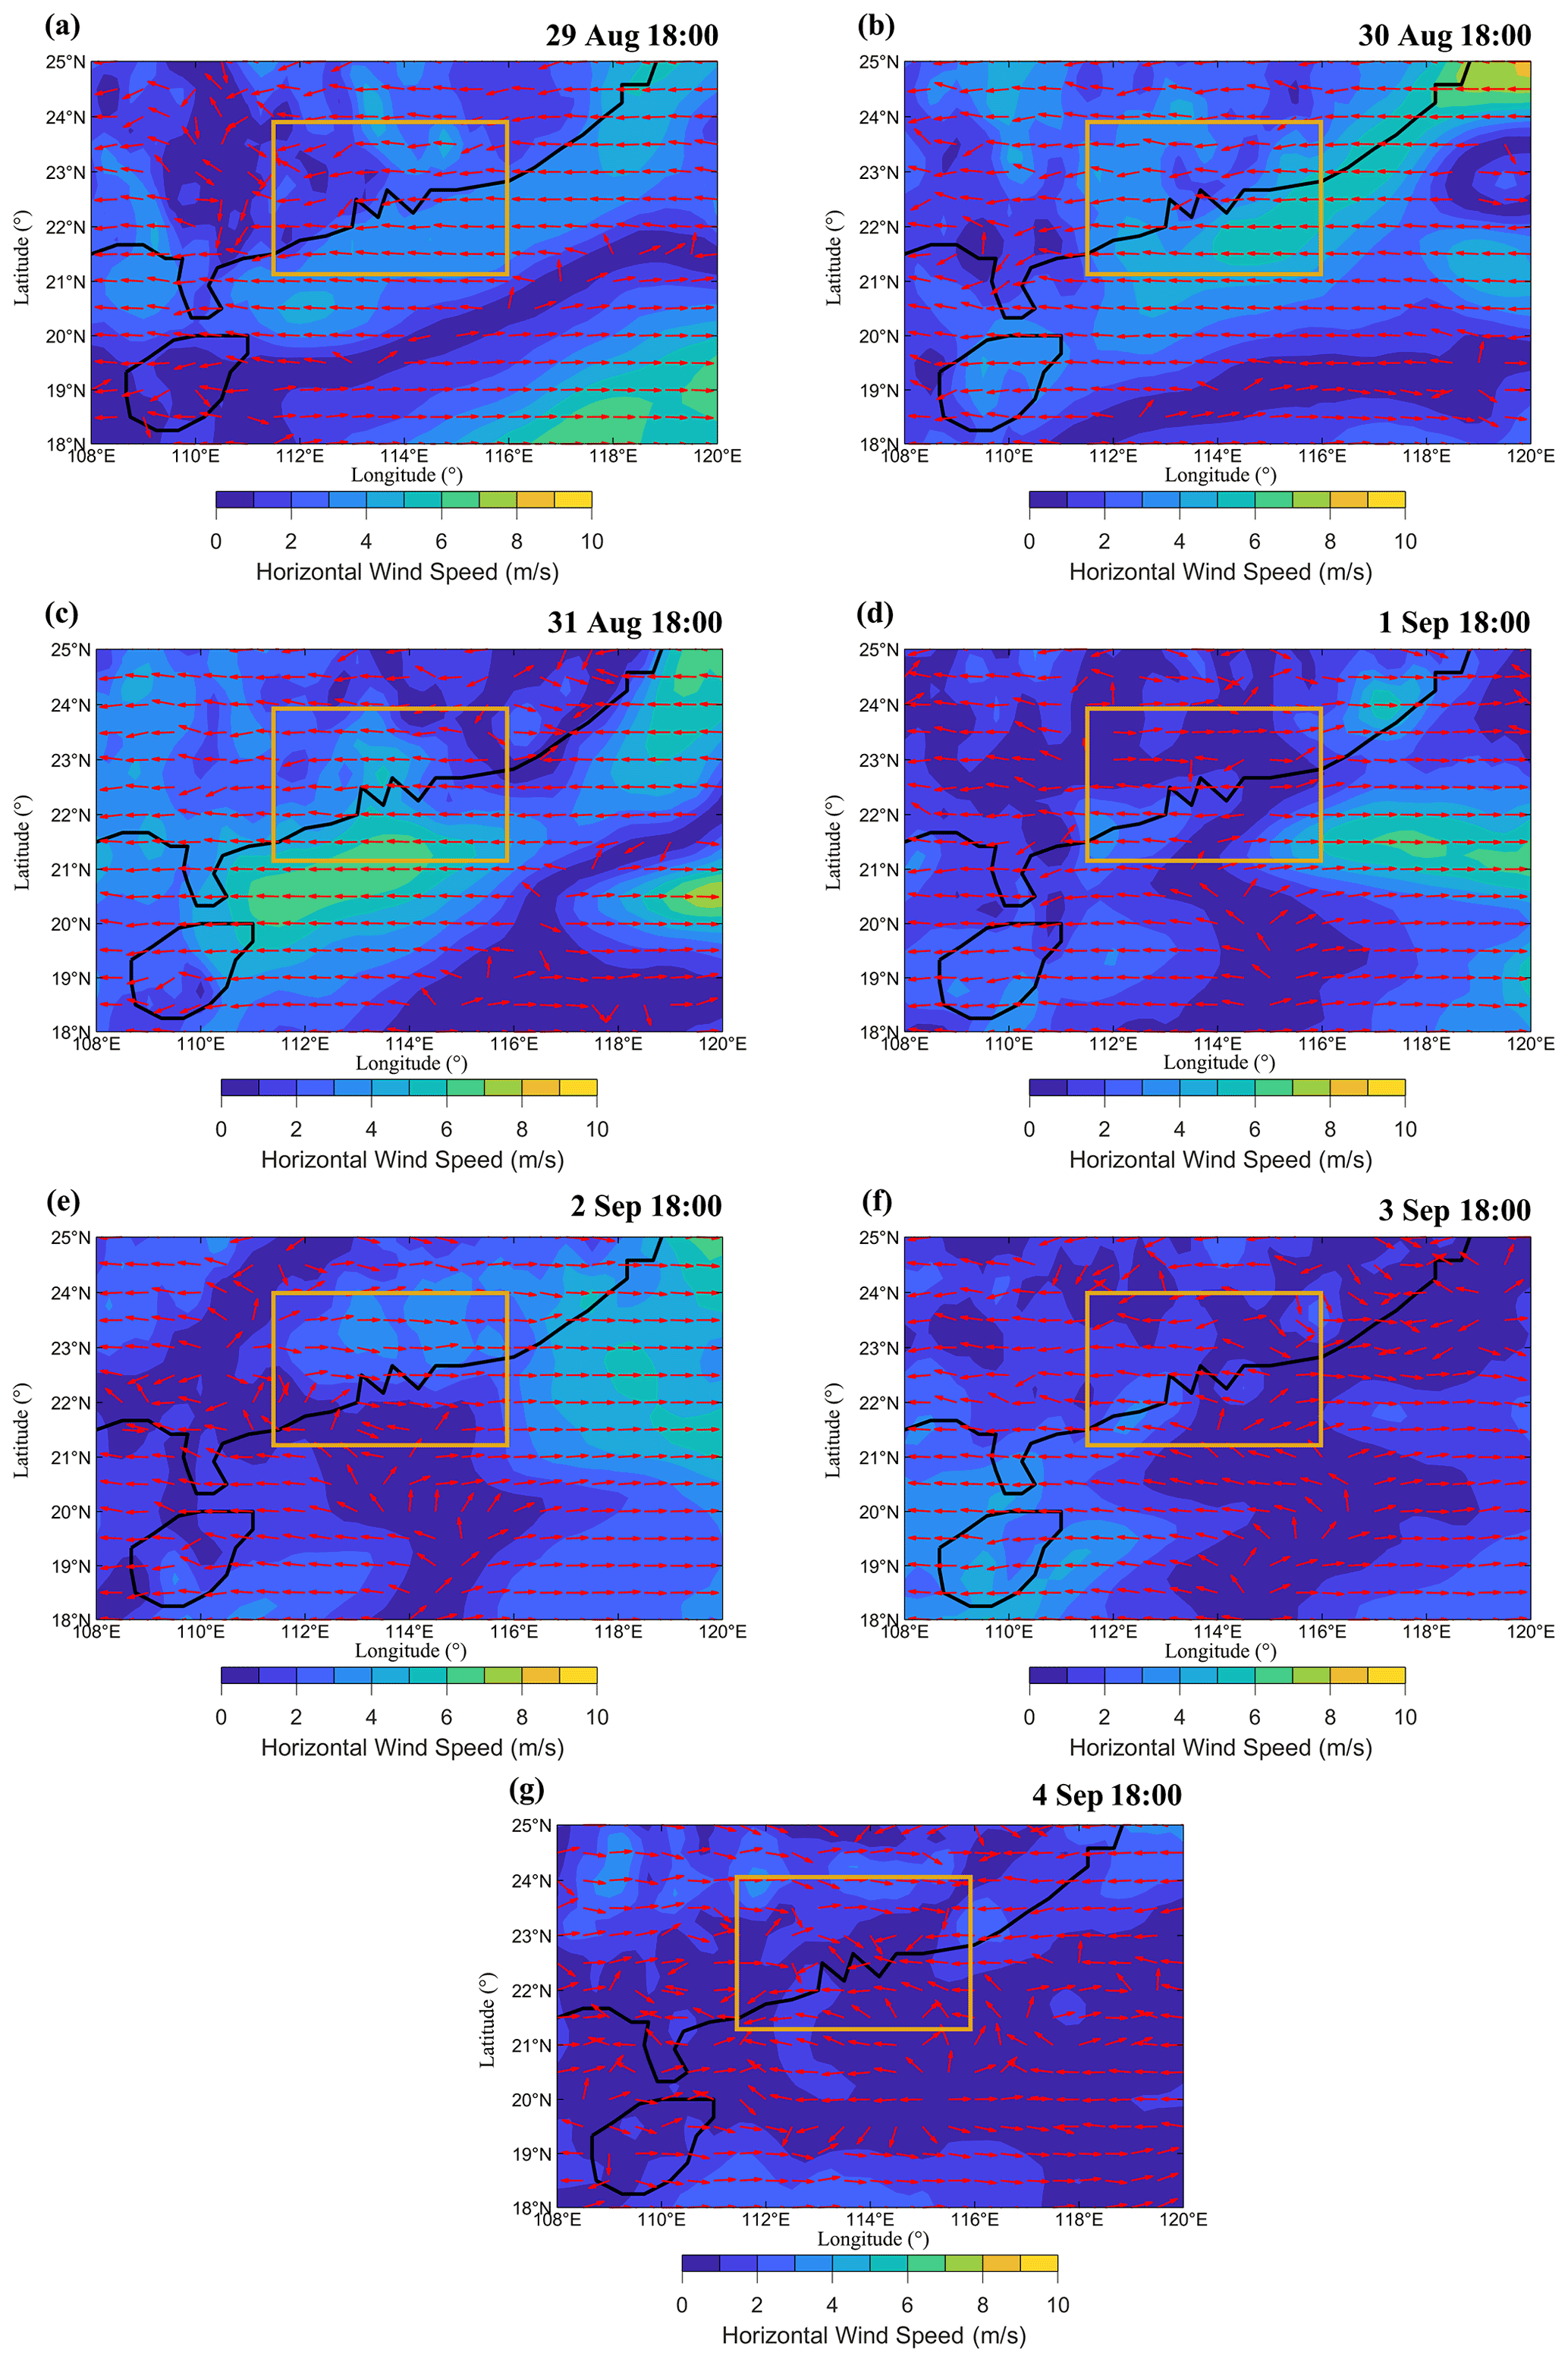
Figure 4(a–g) Wind field of 925 hPa from 29 August to 4 September 2020 from ERA5 reanalysis data. The colour map represents horizontal wind speed (m/s). Red arrows represent the wind direction. The orange box shows the location of the GBA area.
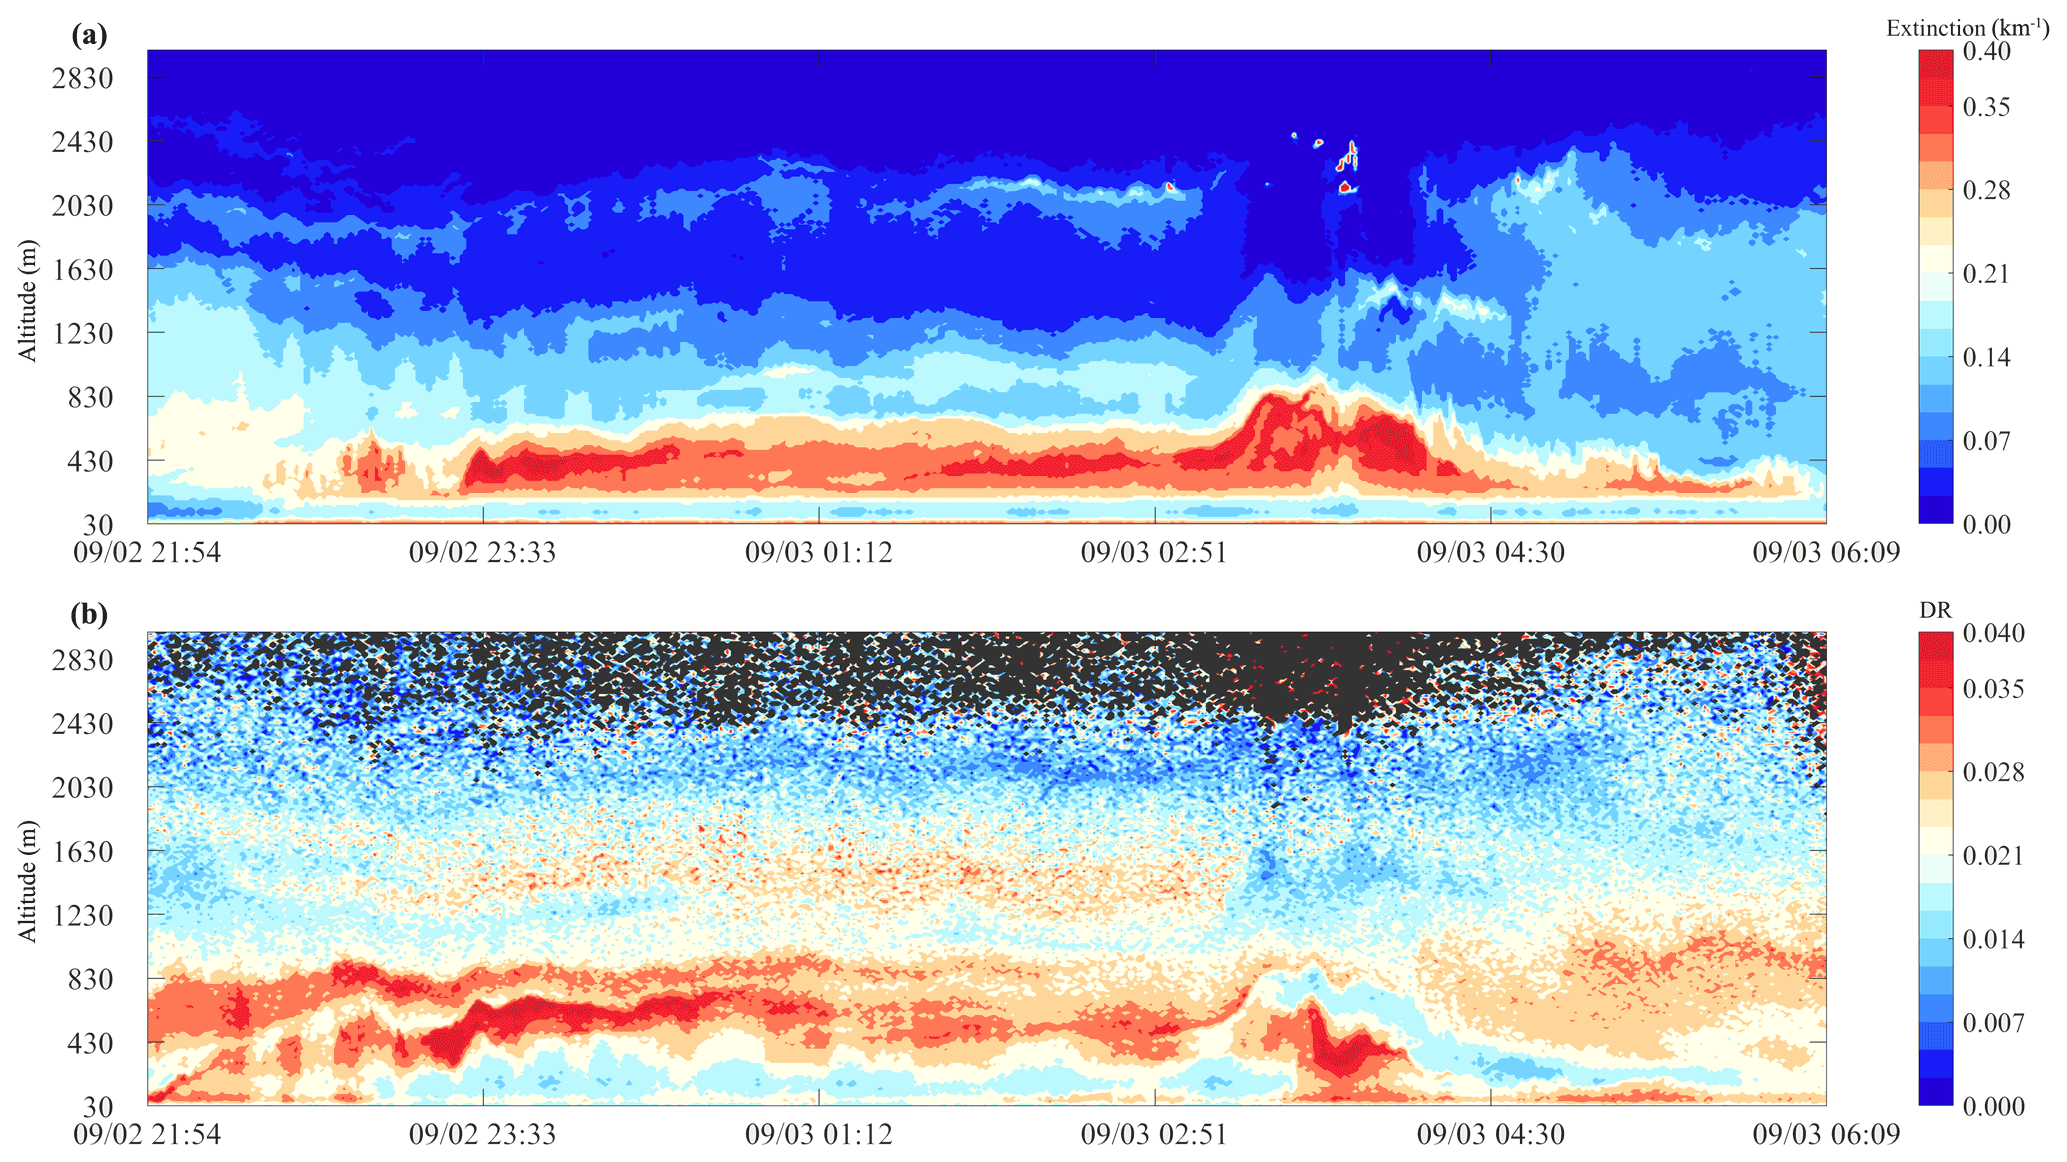
Figure 5Extinction coefficient (a) and depolarization ratio (b) at 532 nm from 21:54 LT on 2 September 2020 to 06:09 LT on 3 September 2020.
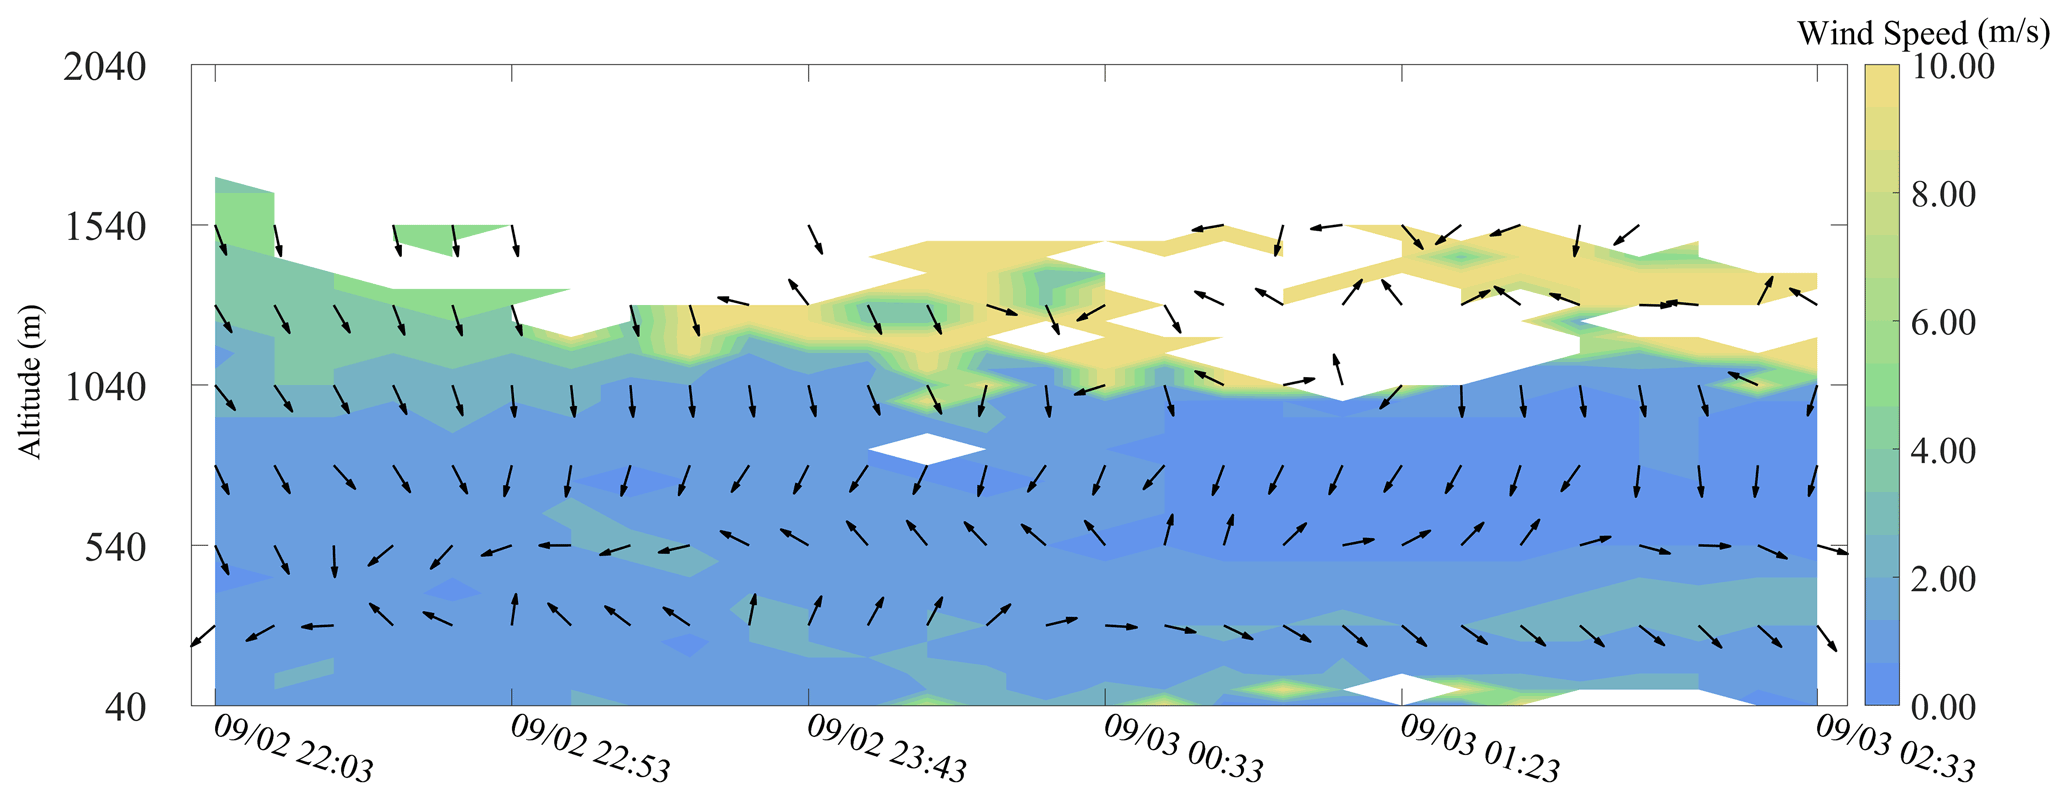
Figure 6Wind speed and wind direction of Type I. Colour map represents horizontal wind speed (m/s). Arrows represents the wind direction.
3.1 Mobile vehicle lidar observations
The horizontal distribution of particles was obtained by conducting mobile vehicle lidar observations in the GBA. The reason for choosing this route is that it covers the major urban agglomerations in the western part of the Guangdong–Hong Kong–Macao Greater Bay Area, which contains a large number of anthropogenic aerosol emission sources. It is representative of the regional distribution of particles in this area. We conducted mobile observations once a day, from 29 August to 4 September 2020. The set off time was at 10:00, and a single measurement circle was completed at around 16:00. Owing to surface heating, convection in the boundary layer develops vigorously during daytime, which allows aerosols to mix well and form a more homogeneous vertical distribution. Therefore, mobile observations during the daytime are more appropriate to study the horizontal distribution of particles in the GBA area. Figure 3 shows the aerosol optical depth (AOD) measured with the MPL in the route. Because of GPS signal interference, some GPS data on 31 August and 2 September were missing. On most days, sections with high AOD values fell geographically into the south and west sides of the observation region. Figure 4 shows low-level horizontal wind fields on 925 hPa over the region based on ERA5 reanalysis data (https://cds.climate.copernicus.eu/cdsapp#/dataset/reanalysis-era5-pressure-levels?tab=overview, last access: 1 November 2020). In the first 3 d, the wind speed over the GBA was generally higher, with an easterly and north-easterly direction. Polluted aerosols were transported along with the wind to the west and south of the study area. They accumulated in the downstream area, resulting in a high value of AOD. On 1, 3, and 4 September, the GBA was in an area of low wind speed, which was not conducive to the regional transport of particulate matter. As a result, the AOD value of the whole GBA reached a higher level, of which the increase in AOD in the northern region was more obvious. AOD values on these days were distributed more homogenously than on days with higher wind speed. On 2 September, the lower winds of the GBA turned westerly when the observation area in the east was downstream, and the highest points of the AOD value also appeared on the eastern route. Such results show that the horizontal distribution of particles in the GBA was closely related to wind speed and wind direction.
3.2 Fixed-location lidar observations
To obtain the vertical distribution of particles, fixed-location lidar observations were conducted at the Haizhu Lake Research Base, which is located in the centre of the metropolis Guangzhou. The research base is representative of the distribution of urban aerosols. Unfortunately, there is no remote sensing device in the base. This motivated us to park the car in the base and conduct a total of 89 d of fixed-location observation. During this period, we found that the hierarchical structure of aerosols occurred more frequently at night, and most of the vertical aerosol distributions are consistent with three distribution types. Therefore, we selected the three most representative processes for analysing the three distribution types. Three different vertical distribution types of particles are given below, as well as the corresponding vertical observation results of temperature and wind in the same period. Altitude values in the following figures refer to the altitude above instrument.
3.2.1 Type I: surface single layer
On 3 September 2020, a clear night in autumn, the lidar system operated from 21:54 to 06:09 local time (LT) the next day. Figure 5a shows the time series of the extinction coefficient of a single aerosol layer on the surface, which was observed with the MPL. Before 03:00 LT, particles accumulated below 800 m. The maximum value of the extinction coefficient near the ground was between 0.3–0.5. During 03:00 and 04:00 LT, there is a significant increase in the maximum height of the particle layer. After 04:30 LT, the maximum height of the particle layer dropped, and the near-ground extinction coefficient fell below 0.3. Figure 5b shows the time series of corresponding depolarization ratio profiles. Most of the depolarization ratios were below 0.1, consistent with previous research on the GBA (Tian et al., 2017). A layer of elevated depolarization ratio was visible near the boundary of the surface single layer in Fig. 5b. It can be seen that during 03:00 and 04:00 LT, there was a significant hierarchical structure with a high depolarization ratio layer near the ground and another layer of high value above. A layer with a lower value of depolarization ratio existed between the two layers with a higher value. This result indicated that there might be local anthropogenic emissions during the period.
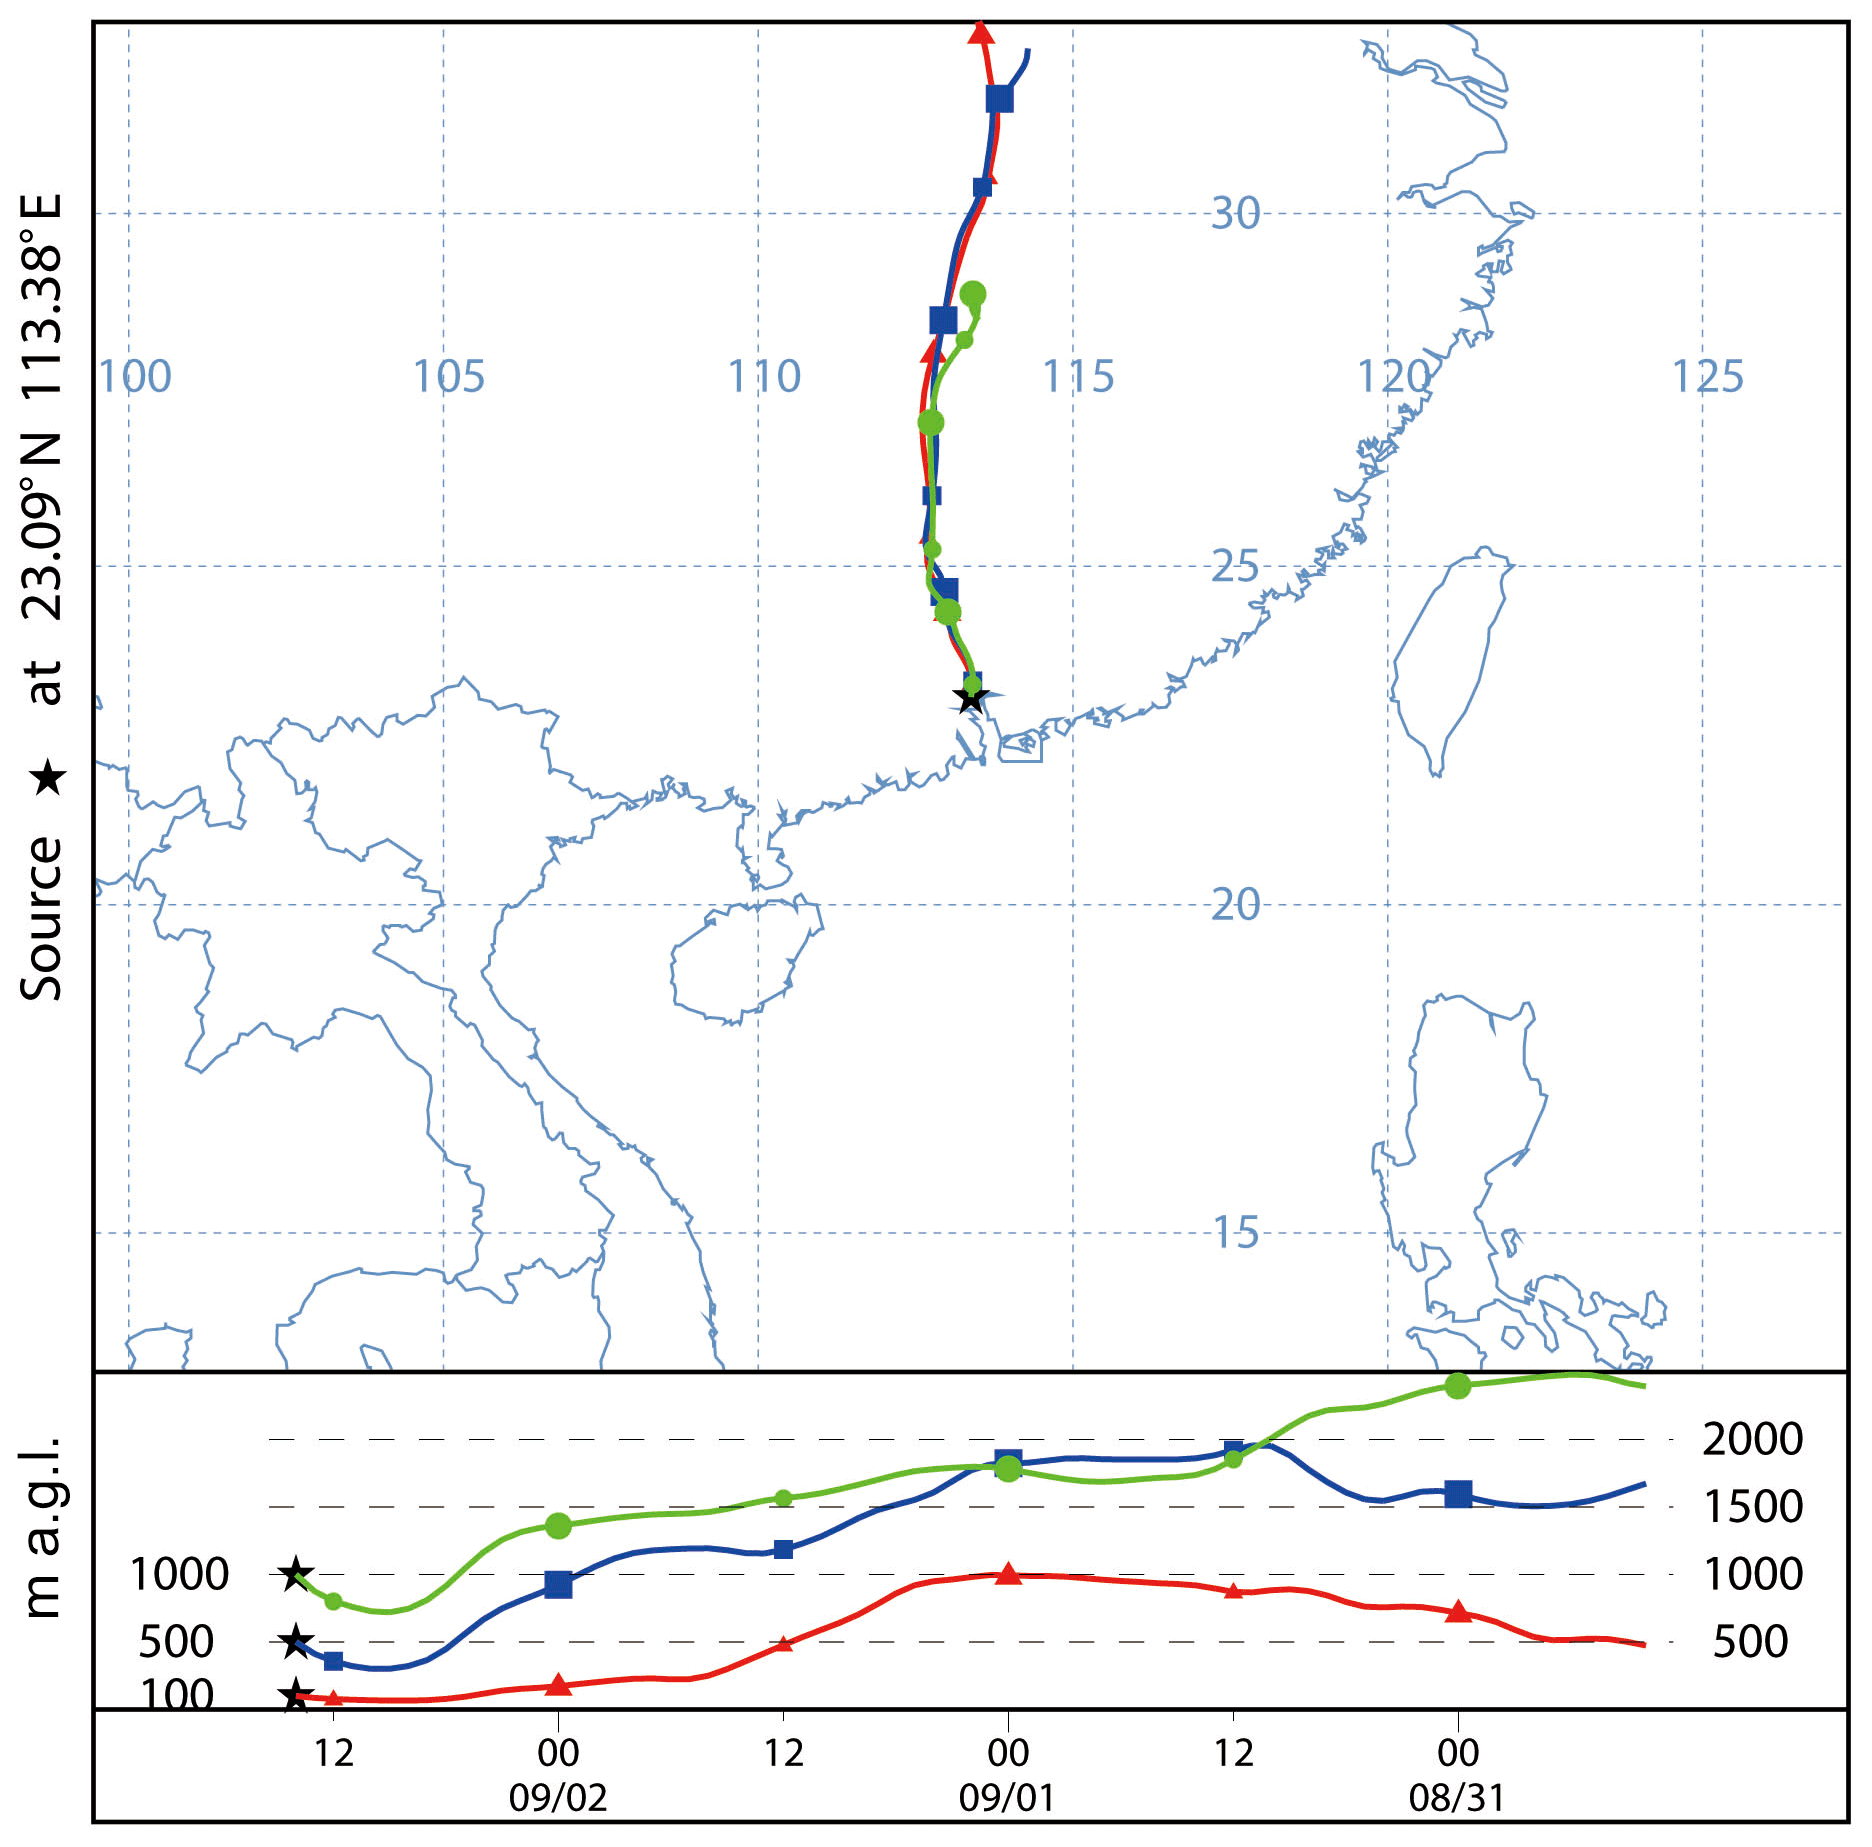
Figure 7Backward trajectories at 100, 500, and 1000 m, ending at 22:00 LT on 2 September 2020, determined by the HYSPLIT model.
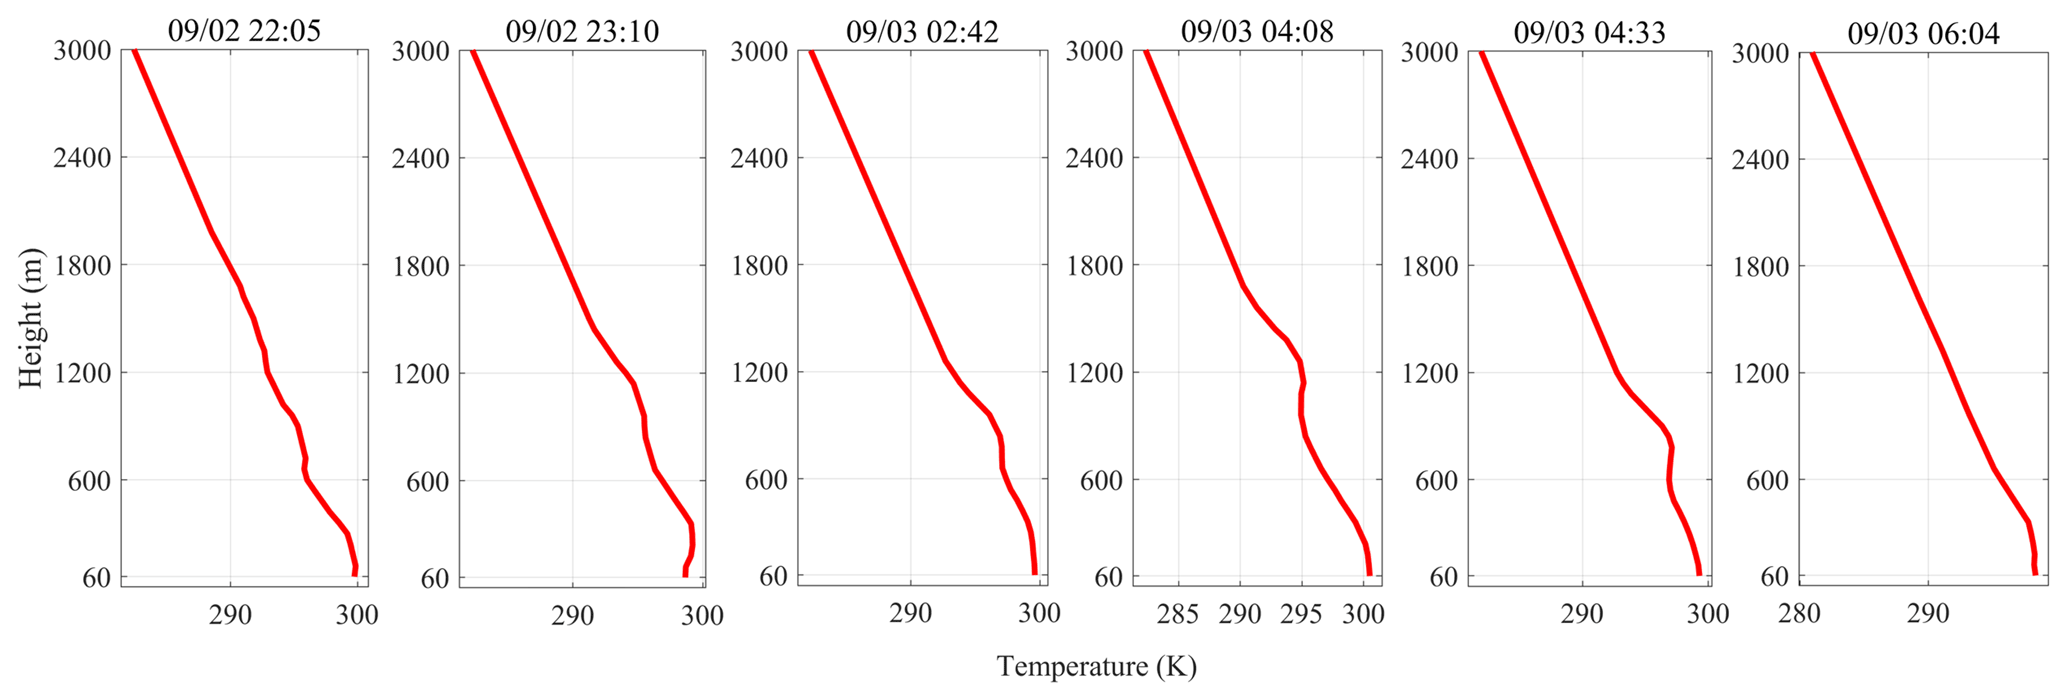
Figure 8Temperature profiles from the evening of 2 September 2020 to the early hours of 3 September 2020.
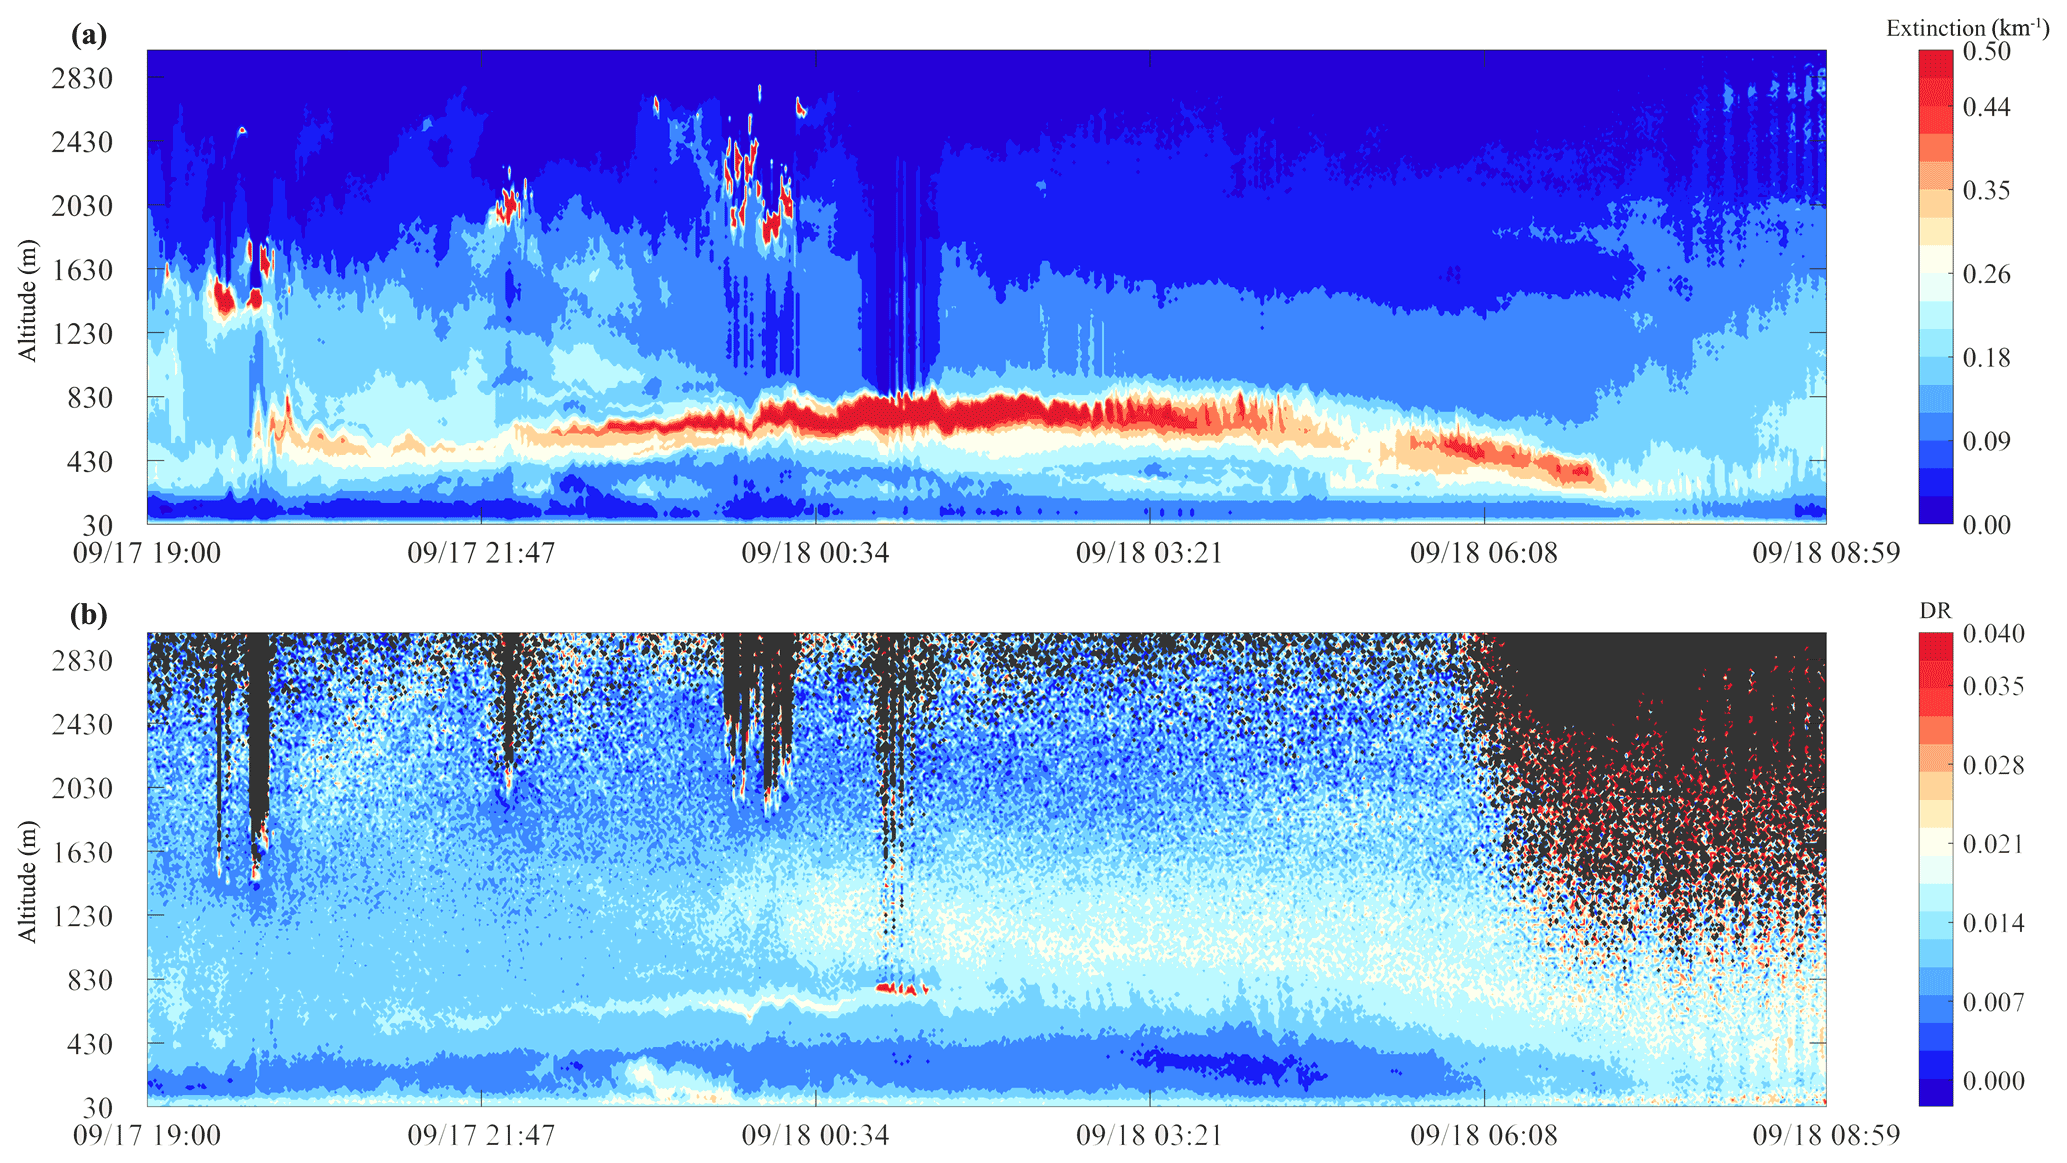
Figure 9Extinction coefficient (a) and depolarization ratio (b) at 532 nm from 19:00 LT on 17 September 2019 to 08:59 LT on 18 September 2019.
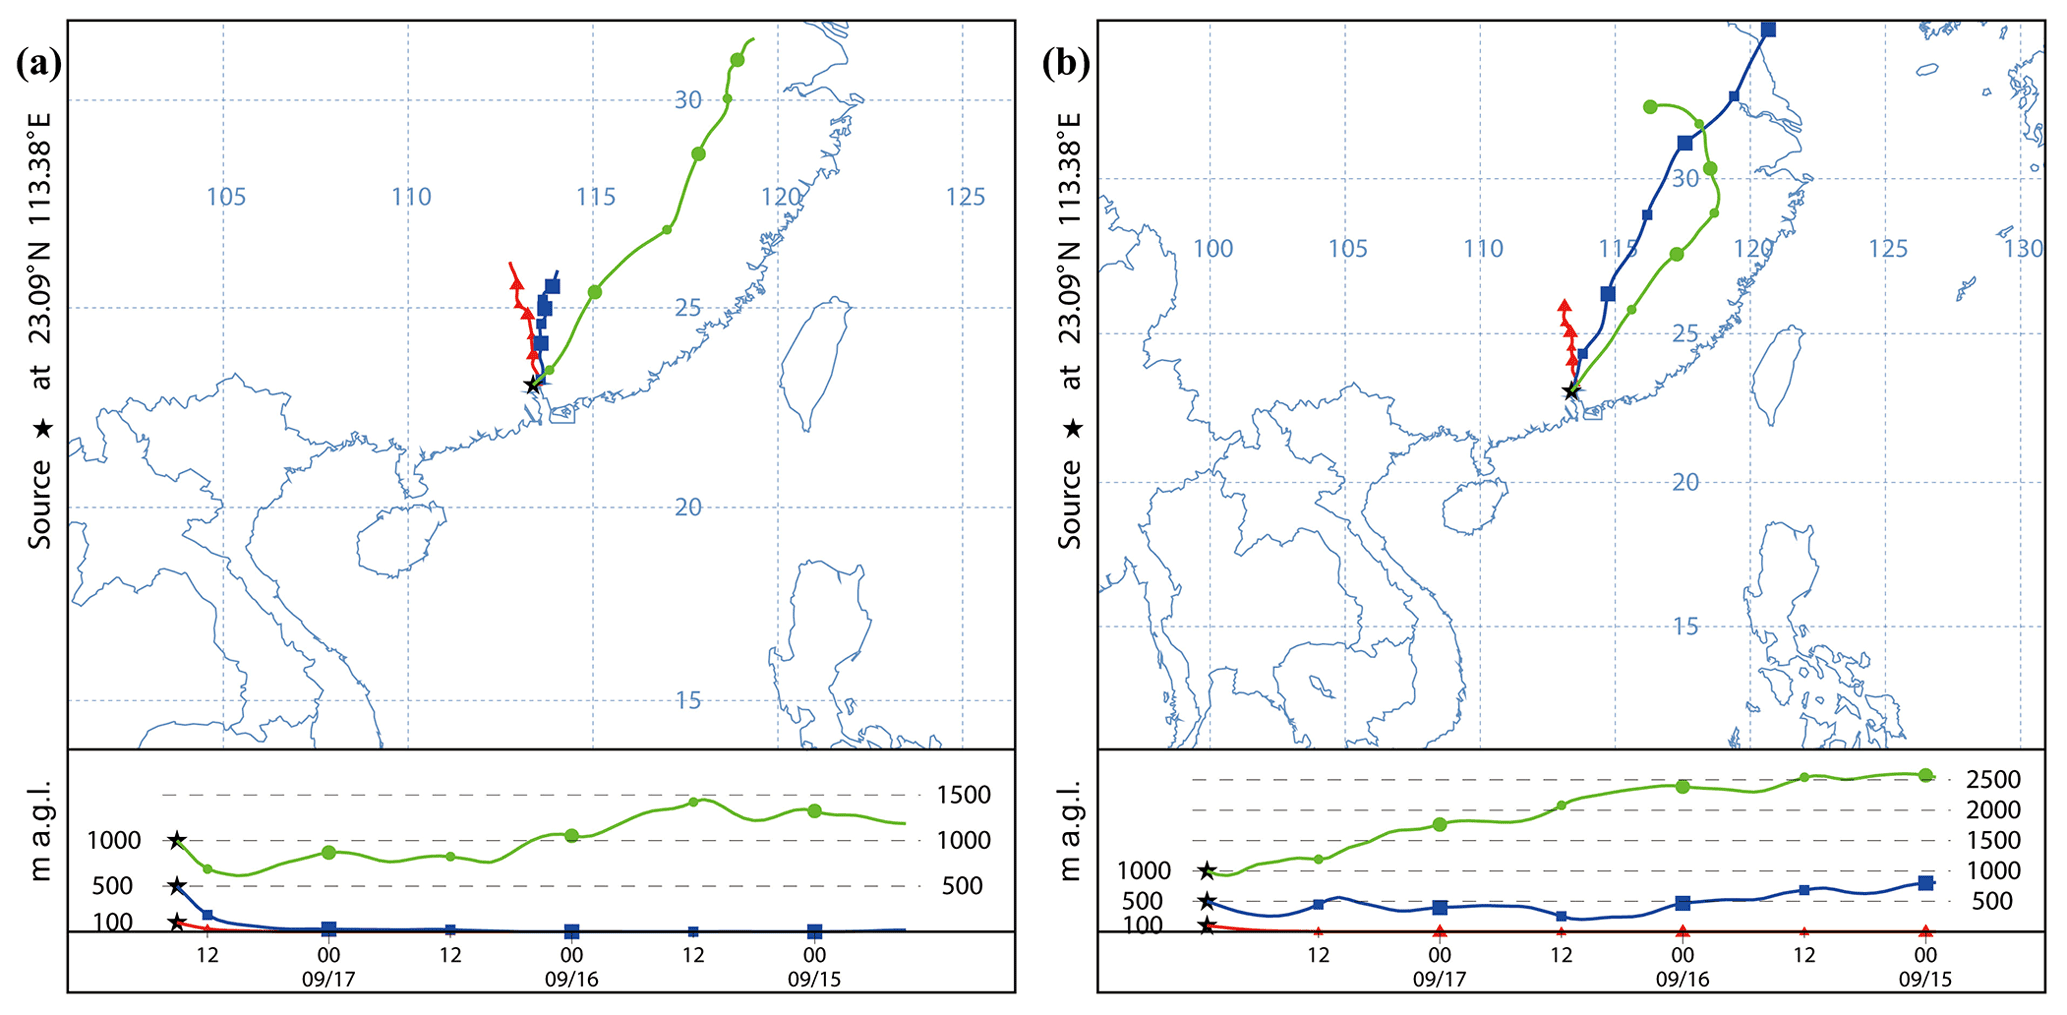
Figure 10Backward trajectories at 100, 500, and 1000 m, ending at 23:00 LT on 17 September 2019 (a) and 07:00 LT on 18 September 2019 (b), determined by the HYSPLIT model.
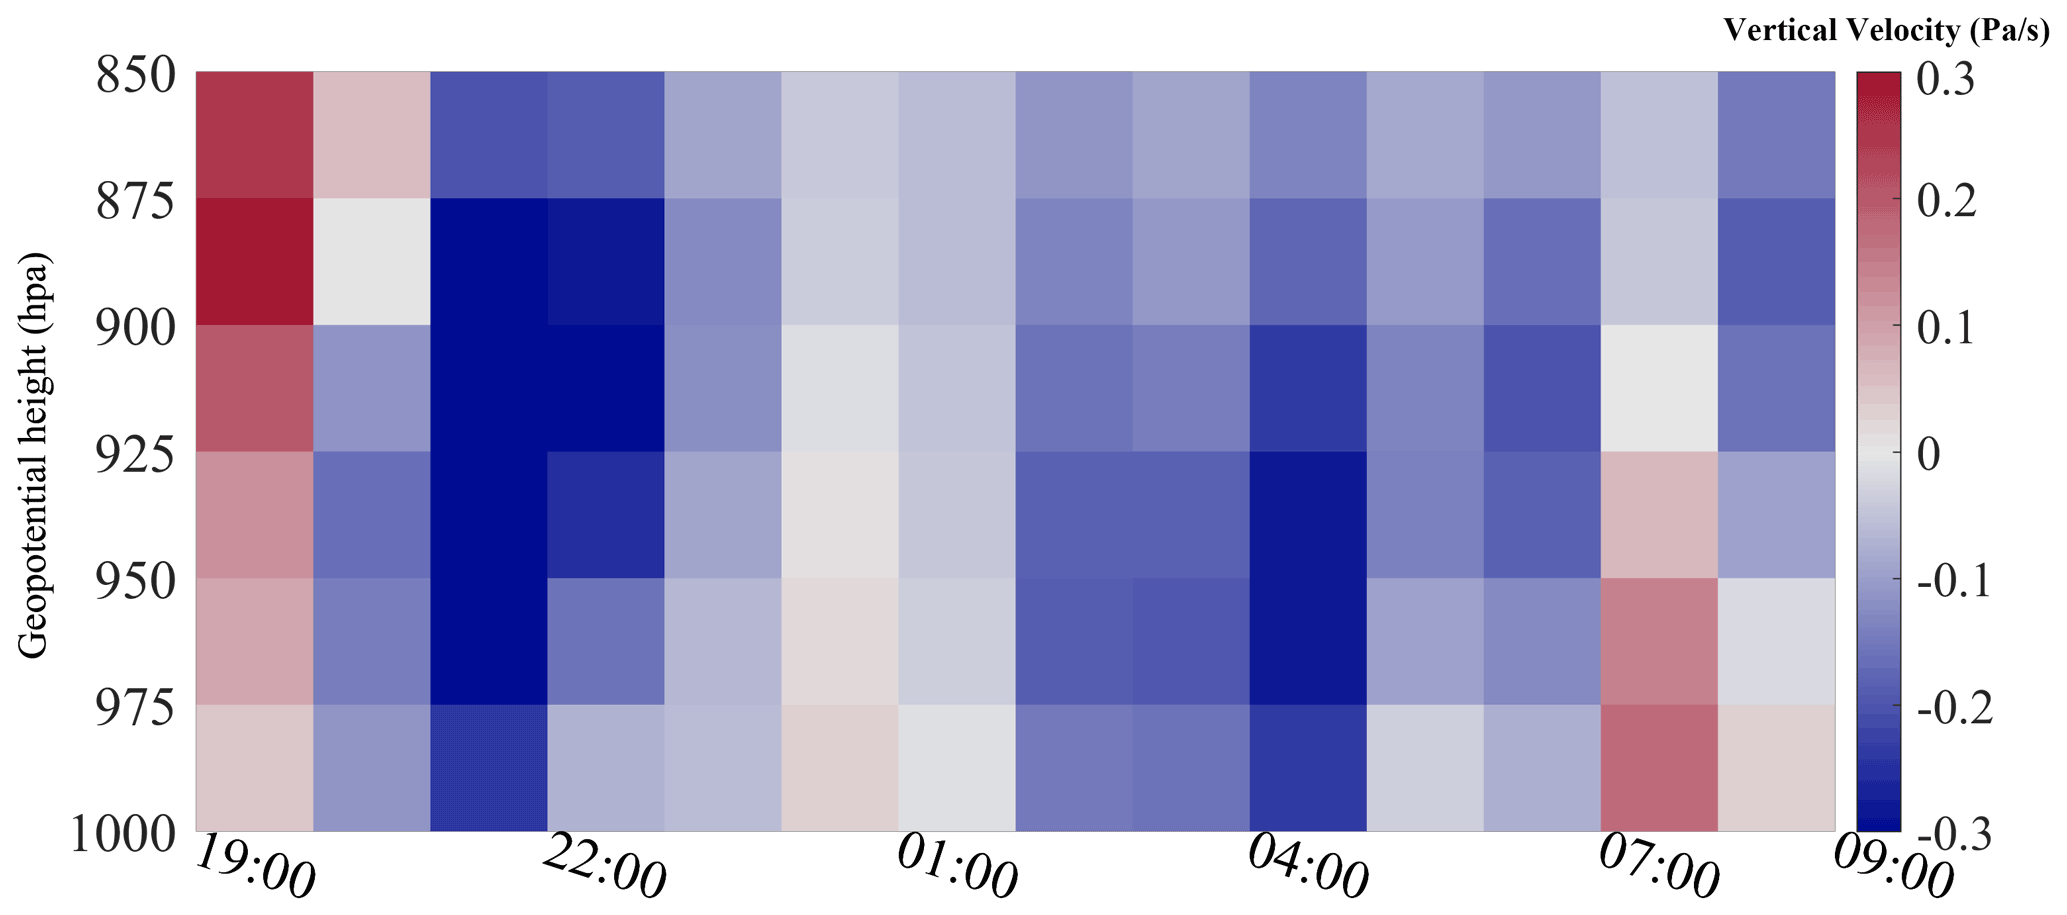
Figure 11ERA5 hourly vertical velocity from 19:00 LT on 17 September 2019 to 09:00 LT on 18 September 2019, at 23.25∘ N, 113.25∘ E. Negative values indicate upward motion.
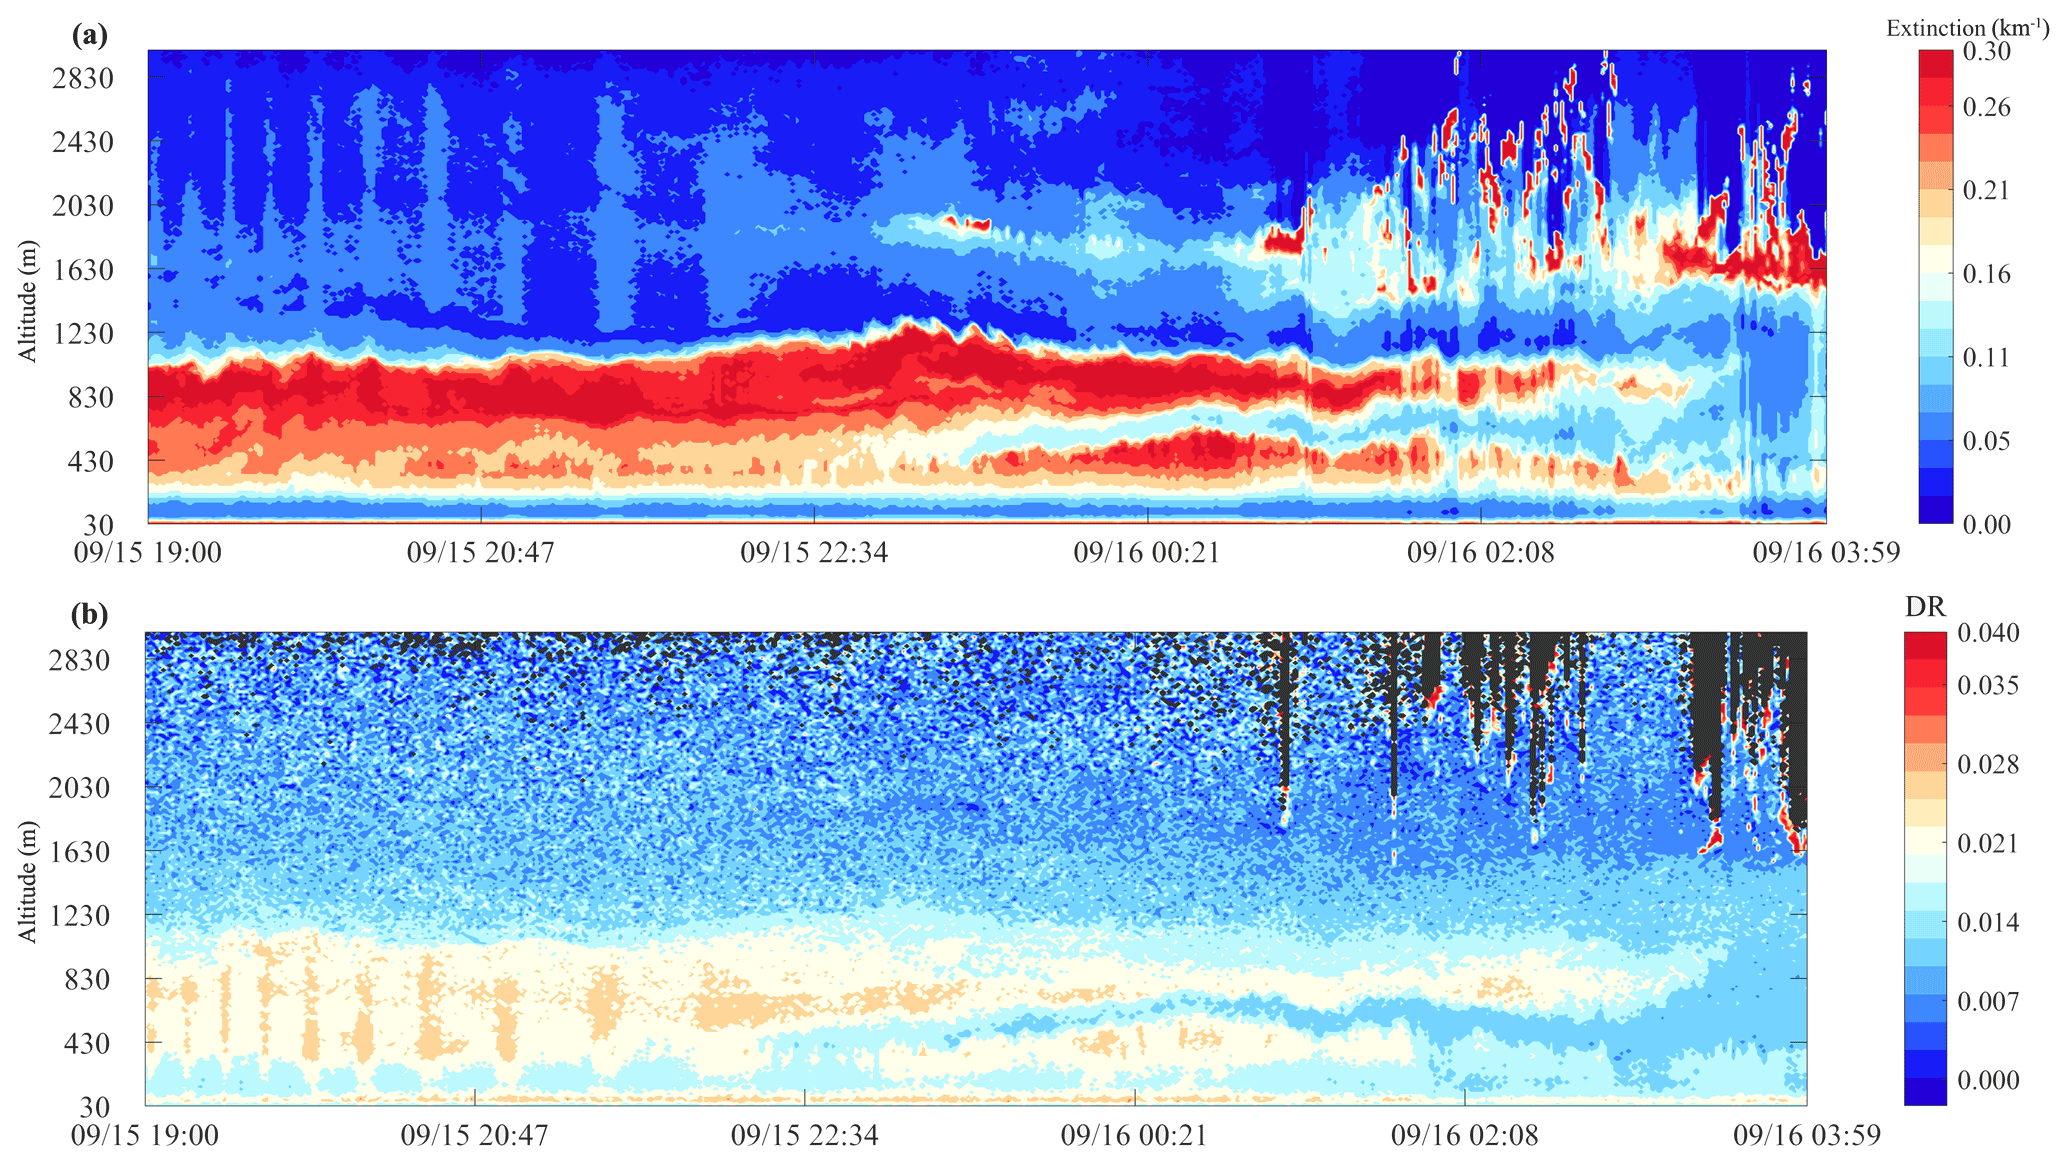
Figure 12Extinction coefficient (a) and depolarization ratio (b) at 532 nm from 19:00 LT on 15 September 2019 to 03:59 LT on 16 September 2019.
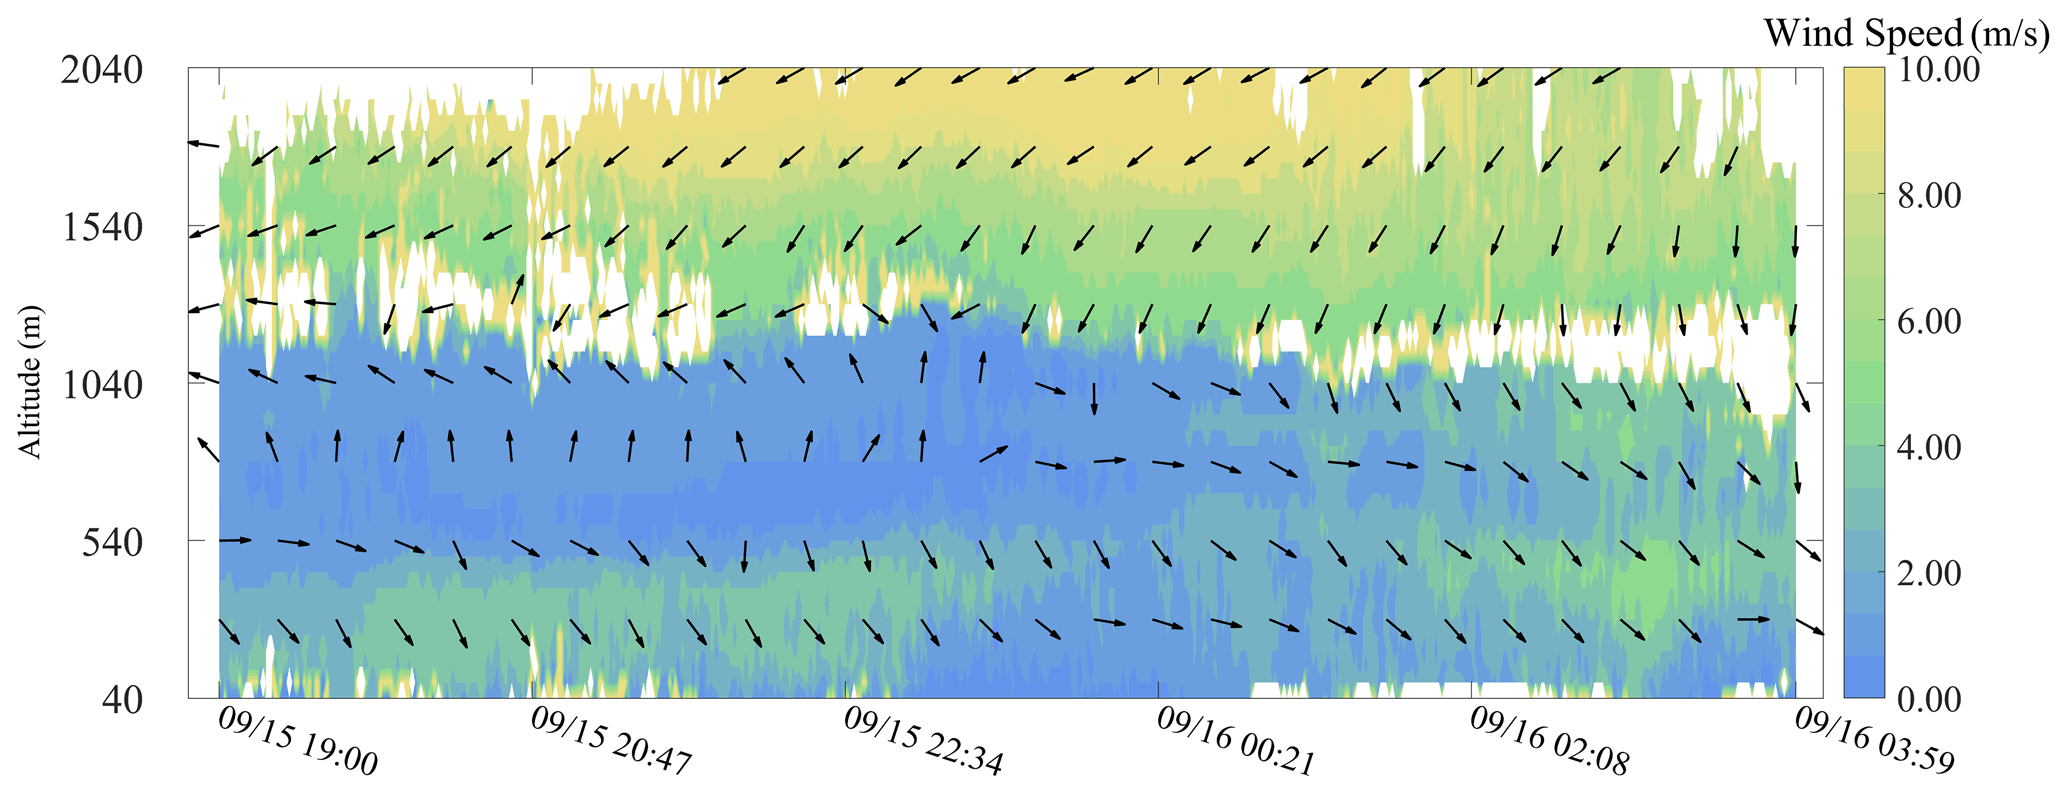
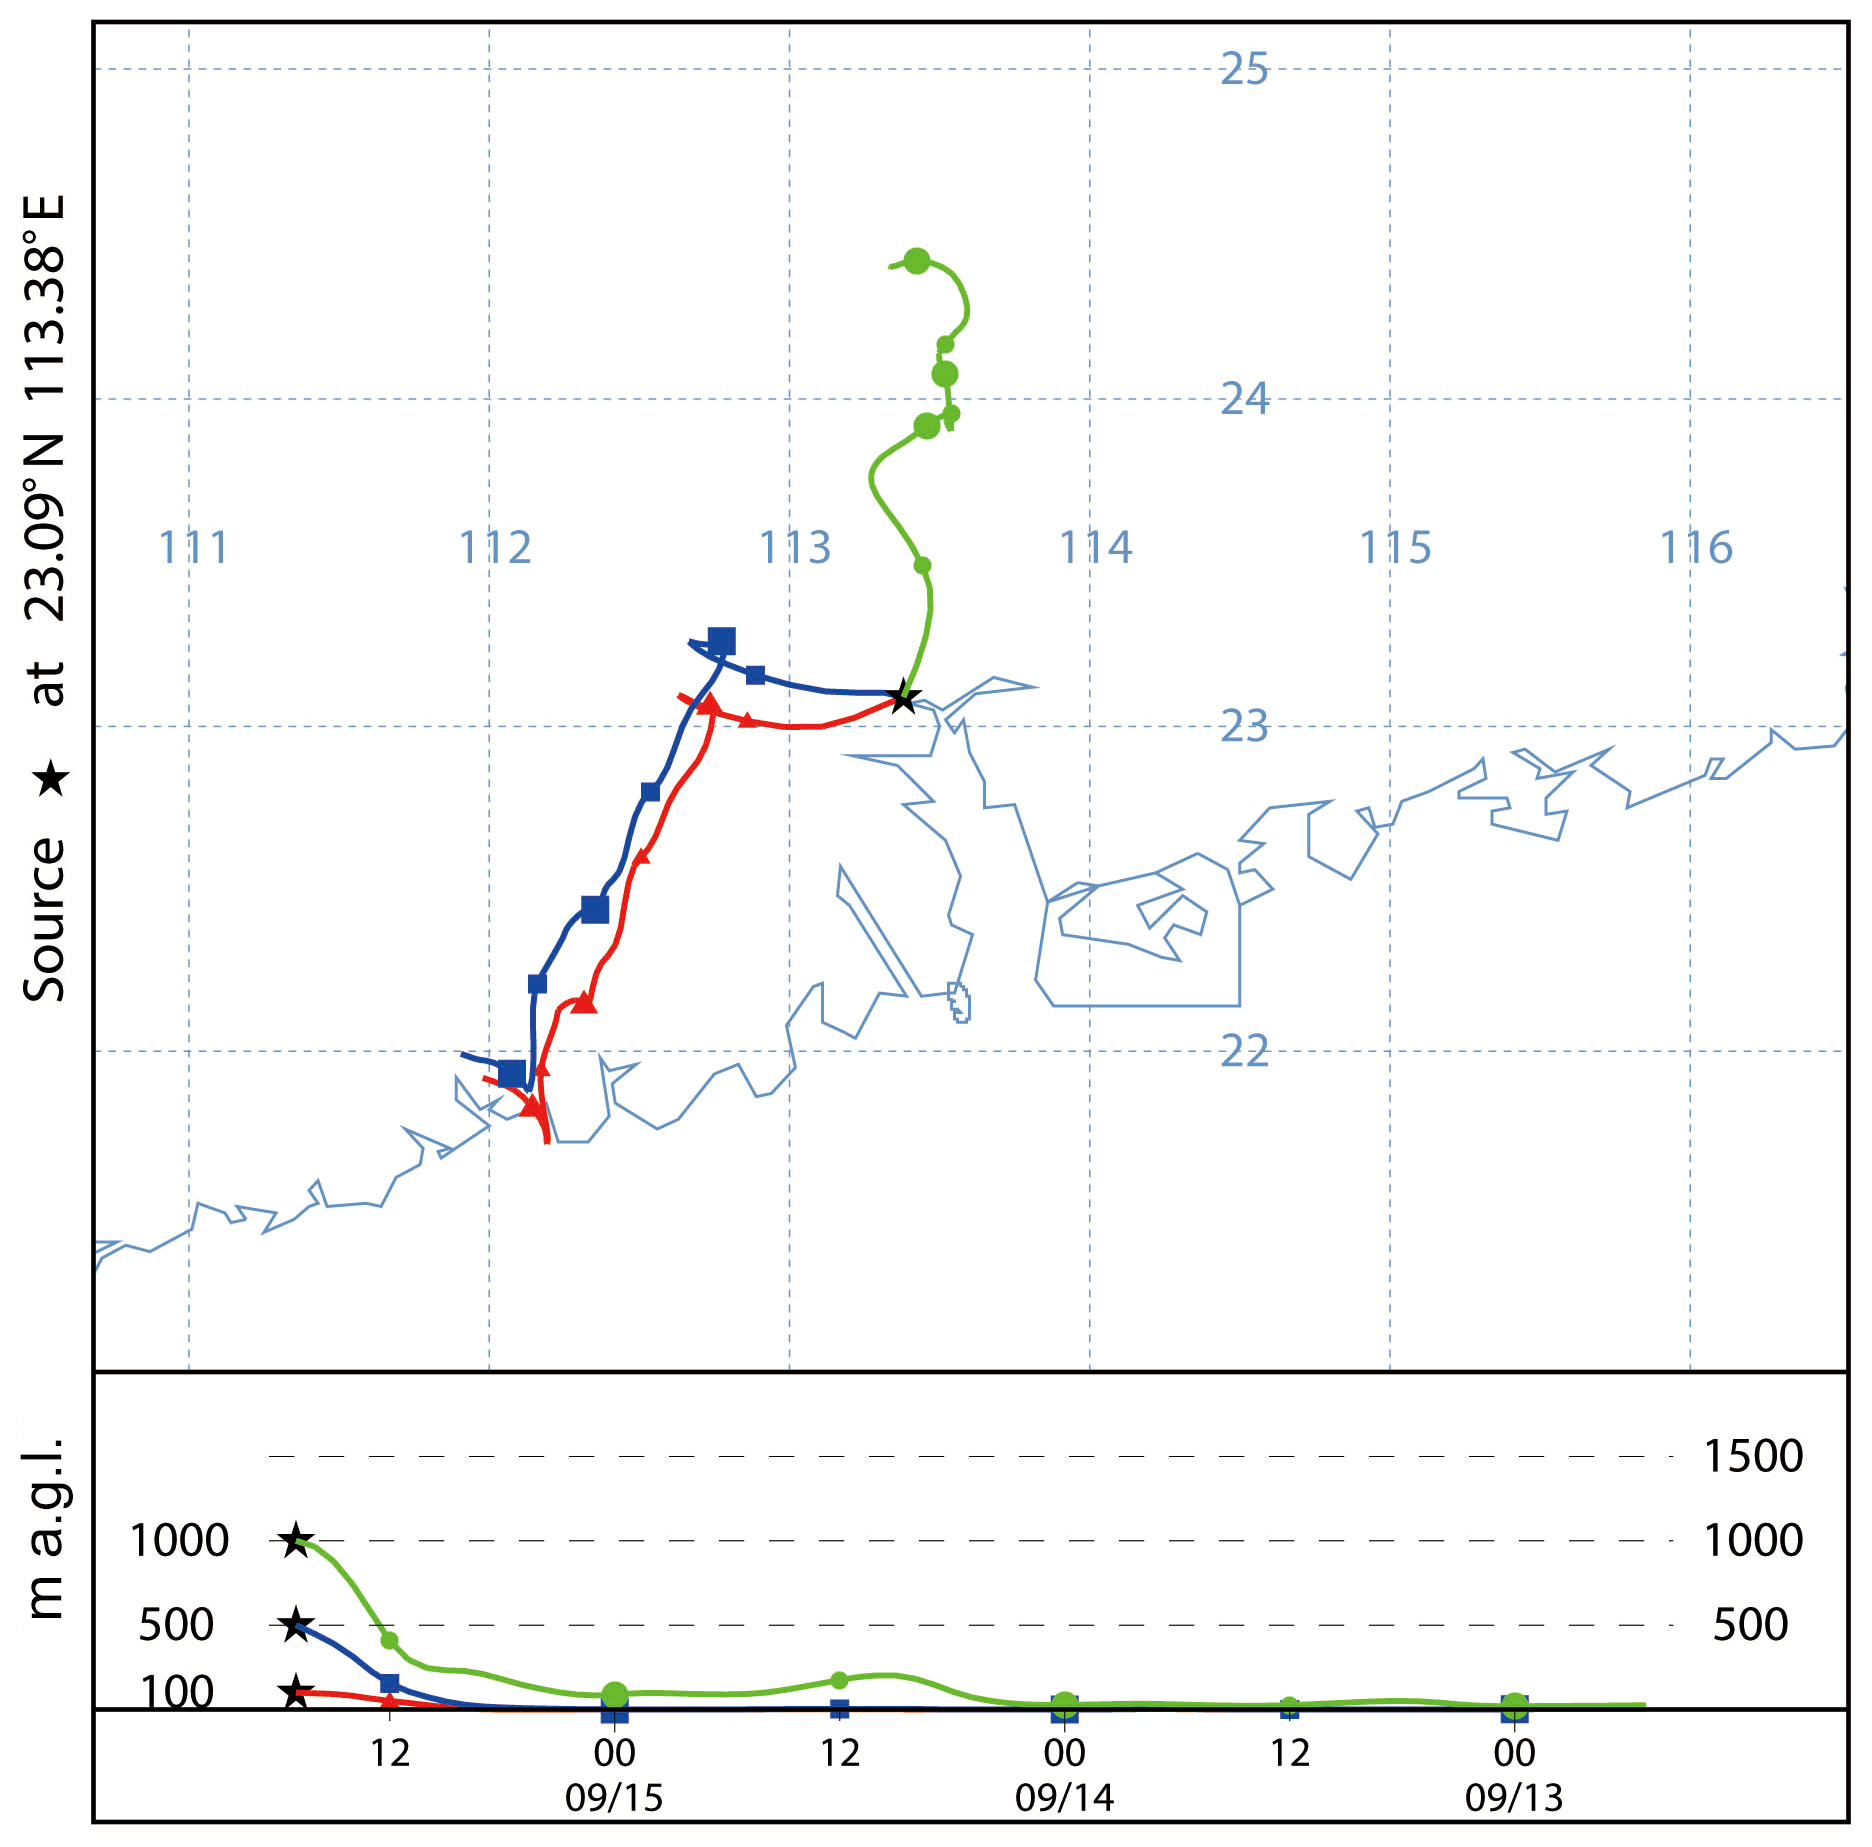
Figure 14Backward trajectories at 100, 500, and 1000 m, ending at 01:00 LT on 16 September 2019, determined by the HYSPLIT model
Figure 6 shows the horizontal wind speed and wind direction of the fixed-location observation in this period. Noticeably, a light wind layer appeared below 1000 m, with horizontal wind speeds of each height maintained below 2 m/s. Such a static and stable condition was advantageous to the accumulation of locally generated particulate matter near the ground. However, light wind at higher altitude (500–1000 m) prevented the regional transport of particulate matter at a higher altitude, because it is difficult for such a low wind speed to blow the particulate matter at the corresponding height to the downstream area. Therefore, when light wind dominated near the ground, the particulate matter was likely to form a single layer on the surface.

Figure 15Temperature profiles from the evening of 15 September 2019 to the early hours of 16 September 2019.
It is worth noting that the wind at an altitude of 540 m at night gradually shifted to southerly wind, whereas the northerly weight of the 290 m altitude wind gradually increased. This shift in the wind was typical of a sea–land breeze in nocturnal coastal areas, which can only be observed when the background wind speed was relatively low.
The backward trajectory analysis of the same period (Fig. 7) shows that on a large scale, the airflow in the boundary layer came from the north. The vertical trajectories of each layer were roughly parallel within 24 h, and all moved from high altitude to low, suggesting that particulate matter emitted near the ground in neighbouring cities was not easily transported by wind to Guangzhou.
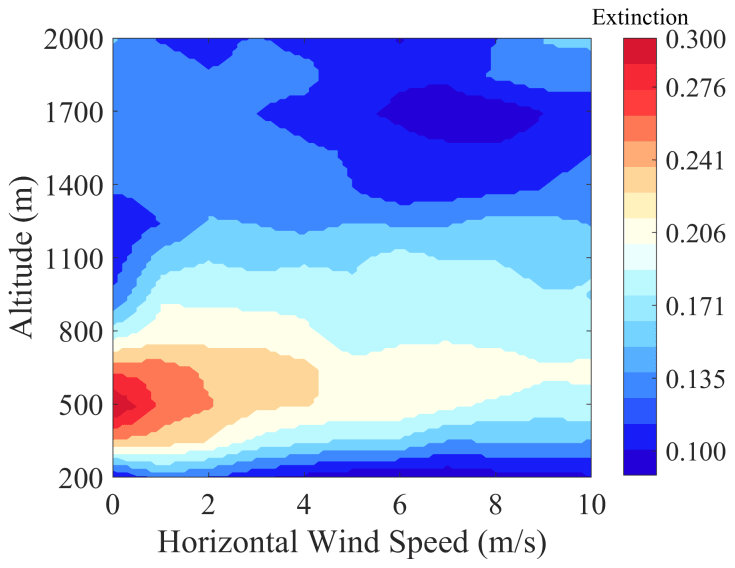
Figure 16Average extinction coefficient at different wind speeds and altitude from fixed-location observations of a total of 89 d at Haizhu Lake Research Base.
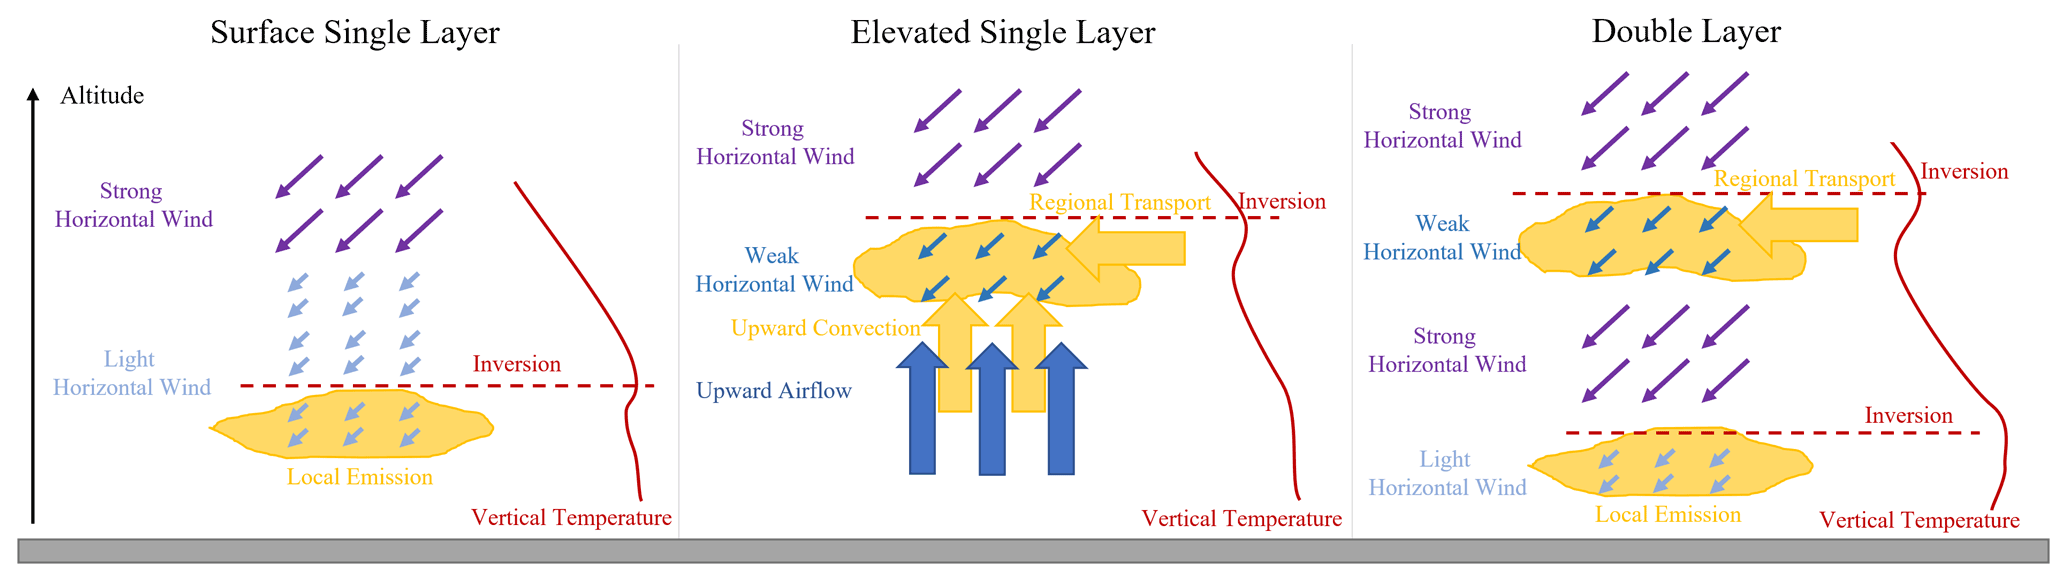
Figure 17Conceptual model of meteorological elements and vertical distribution of particles.
Observations from the Raman temperature profile lidar (Fig. 8) show an inversion between 600–1200 m before 03:00 LT, which then rose to 1200 m and shrank to near the ground. Temperature inversion often exists at the top of the planetary boundary layer, trapping moisture and aerosols (Seibert et al., 2000). Hence, changes in the height of the inversion coincided with the trend of the top of the particulate matter layer on the vertical dimension revealed by MPL.
3.2.2 Type II: elevated single layer
The particle layer was not only distributed near the ground but sometimes suspended at a higher altitude. Figure 9a shows the extinction coefficient time series of an elevated single layer of particulate matter. The low extinction coefficient near the ground suggests that it was clean below 400 m during the night. The height of the high extinction coefficient layer gradually rose from 500–800 m at night, which then dropped below 400 m after dawn. The high value of the extinction coefficient corresponded to a higher depolarization ratio than the lower layer, which was approximately 0.02. However, the depolarization ratio of Type II was significantly lower than the depolarization ratio of the particle layer near the surface of Type I. This differing depolarization ratio was because local emissions dominated in Type I, and the primary pollutant emissions from anthropogenic sources near the surface with a non-spherical character and larger particle size accounted for a larger amount than that of Type II.
Figure 10a indicated that backward trajectories at 500 and 100 m were both from near the ground, elevating particles from lower levels vertically. Meanwhile, lower trajectories also carried particles from the upper reaches of the region over Guangzhou horizontally. The domination of weak wind in the boundary layer was beneficial to inter-city transport of particles. It brought particles from cities located upstream to the location of our observation and allowed particles to stay longer without being blown quickly downstream. In contrast, the trajectory at 1000 m came from a distance in the YRD with a larger wind speed, and the trajectory remained at a high altitude. Particles at 1000 m cannot stay for a long time and were quickly transported downstream by strong winds. Hence, upward airflow near the ground and vertical wind shear at a higher altitude were the causes of particulate matter forming an elevated single layer. Unfortunately, the temperature profile and wind profile data were missing owing to sampling failures. This upward convection of particles was confirmed by the ERA5 vertical velocity reanalysis data of the corresponding time, shown in Fig. 11.
3.2.3 Type III: double layer
Figure 12 presents a thick single layer of particles transforming into a double-layer structure. There was a layer concentrated near the ground after 23:00 LT, along with another layer suspended at the height of 600–1000 m. A cleaner layer with a lower extinction coefficient existed between the two particle layers. The depolarization ratio of the suspending layer was higher than the layer near the surface, especially after 01:00 LT, which indicated that sources of the two layers might be different.
The vertical distribution of particulate matter was closely related to the horizontal wind speed at various heights (Fig. 13). It can be seen that the wind speed of more than 1000 m increased significantly with the altitude, reaching more than 6 m/s. By 23:00 LT, the wind speed below 500 m was approximately 4 m/s, obviously higher than the wind speed between 500–1000 m, and there were significant differences in the wind direction. After 23:00 LT, the wind speed near the ground decreased, and wind direction gradually turned consistent with the upper level. The wind speed at 500 m continued to be high, reaching a 6 m/s maximum. The layer with higher wind speed corresponded to the height of the cleaner layer, which facilitated the transport of particulate matter downstream in a horizontal direction. Figure 14 illustrates the backward trajectories when the double layer appeared. As shown in Fig. 14, the layer of particulate matter below 500 m may have originated in the southwest of the GBA, whereas the layer of particulate matter at 1000 m may have originated from cities north of the GBA area.
The vertical observations of the temperature (Fig. 15) showed that on the night of 15 September 2019, there was an inversion at 1200 m, which grew thicker. At 00:48 LT, like the distribution of the extinction coefficient, the inversion transformed into a double-layer structure, with one remaining at 1200 m and another existing under 600 m. The vertically distributed double inversion, which allowed particulate matter to concentrate at the corresponding height, resulted in a double-layer distribution of particulate matter.
3.3 Effect of meteorological elements on the distribution of particles
3.3.1 Extinction coefficient at different wind speeds
Using data of in situ observations during September and October of 2019 and 2020, statistics of average extinction coefficients at different altitudes and horizontal wind speeds were gathered, as shown in Fig. 16. To eliminate the influence of clouds on the extinction coefficient, observations during cloudy weather were manually screened out based on the original signal of the MPL output and images of the sky above the field taken automatically by a camera. Because the spatial resolutions of the data from the two lidar are different, we interpolated the data to make them match each other vertically. The result shows that 500 m was the height with the highest average extinction coefficient, which indicated that the particle layer was most likely to appear at this height. The horizontal wind speed had different effects on the lower and upper parts of the boundary layer. Below 800 m, the extinction coefficient decreased as the wind speed increased, but it was the opposite above 800 m; i.e. the extinction coefficient increased with the wind speed. This altering of the extinction coefficient was because most of the particulate matter in the lower layer came from local emissions and easily accumulated in the presence of a layer with calm wind near the ground. However, in the upper layer, particulate matter was derived more from the surrounding areas, necessitating a certain minimum horizontal wind speed before it could be transported by the wind.
3.3.2 Conceptual model of meteorological elements and vertical distribution of particles
Based on the observational research above, a conceptual model was developed to summarize the effect of meteorological elements on the three typical vertical distributions of particles in the GBA.
As shown in Fig. 17, the surface single layer occurred when light horizontal wind dominated near the ground, which was not conducive to removing particles from local emissions. An elevated single layer was caused by upward airflow near the ground and vertical wind shear at a higher altitude. In this kind of wind structure, particle layer formation was dominated by upward convection and regional transport. A double layer existed because a layer with stronger horizontal wind existed between two layers with weaker wind, which facilitated the transport of particles from local emission and horizontal transport to downstream areas and resulted in a cleaner layer inside the polluted air mass.
Another key factor that influenced the vertical distribution of particles was temperature inversion, which trapped most anthropogenic emissions from the surface, preventing them from penetrating out of the boundary layer. Furthermore, multiple inversions can cause more than one peak in the concentration of particles vertically.
The results of our study show how meteorological elements affected the three-dimensional distribution of particles in the western Guangdong–Hong Kong–Macao Greater Bay Area. We focused mainly on the periods when the wet season changes to the dry season, as the frequently changing temperature and wind under such conditions have a more significant impact on the distribution of particles. The horizontal distribution of particles in the GBA was closely related to wind speed and wind direction. On days with stronger winds in the boundary layer, high values of AOD were mostly distributed in the downstream areas. On days with weaker winds, the horizontal distribution of particles in the GBA was homogeneous. The vertical distribution of particles in the GBA was classified into three typical types: surface single layer, elevated single layer, and double layer. The surface single layer occurred when wind with very low speed dominated the boundary layer. The elevated single layer was caused by upward airflow near the ground and vertical wind shear at a higher altitude. The double layer existed because a layer with higher horizontal wind speed existed between two layers with weaker wind. Particles were concentrated near the temperature inversion. Multiple inversions can cause more than one peak in the vertical distribution of particulate matter. The mechanisms that affected the distribution of particulate matter in the upper and lower boundary layers are different. Lower horizontal wind speed was conducive to accumulating particulate matter near the ground, whereas higher horizontal wind speed promoted the transport of particles between surrounding areas in the upper boundary layer.
Further studies should be conducted during other seasons in the western Guangdong–Hong Kong–Macao Greater Bay Area to further verify the conceptual model of meteorological elements and vertical distribution of particles proposed in this article. In addition, more vertical observation instruments for meteorological elements, such as a radiometer, could be added to the multi-lidar system to further study the influence of the three-dimensional distribution of humidity, air pressure, and other meteorological elements on the distribution of particles.
All lidar observation data have been uploaded and are available at https://doi.org/10.5281/zenodo.5726855 (Xu et al., 2021). ERA5 reanalysis data are available at https://cds.climate.copernicus.eu/cdsapp#/dataset/reanalysis-era5-pressure-levels?tab=overview (last access: 1 November 2020, Copernicus Climate Change Service, 2017). GDAS data for HYSPLIT are available at https://www.ncei.noaa.gov/products/weather-climate-models/global-data-assimilation (last access: 1 November 2020, National Centers for Environmental Prediction/National Weather Service/NOAA/U.S.Department of Commerce, 2015).
XX, LY, and MS performed the measurements. XX and XJ analysed the data. XX and FS wrote the manuscript. All of the authors contributed to the scientific discussions and revised the manuscript.
The contact author has declared that neither they nor their co-authors have any competing interests.
Publisher's note: Copernicus Publications remains neutral with regard to jurisdictional claims in published maps and institutional affiliations.
This research has been supported by the National Natural Science Foundation of China (grant no. 41630422) and the Guangdong Major Project of Basic and Applied Basic Research (grant no. 2020B0301030004).
This paper was edited by Anne Perring and reviewed by two anonymous referees.
Copernicus Climate Change Service (C3S): ERA5: Fifth generation of ECMWF atmospheric reanalyses of the global climate, [data set], available at: https://cds.climate.copernicus.eu/cdsapp#/dataset/reanalysis-era5-pressure-levels?tab=overview (last access: 1 November 2020), 2017.
Dai, G., Wu, S., and Song, X.: Depolarization ratio profiles calibration and observations of aerosol and cloud in the Tibetan Plateau based on polarization Raman lidar, Remote Sens., 10, 378, https://doi.org/10.3390/rs10030378, 2018.
Deng, T., Deng, X., Li, F., Wang, S., and Wang, G.: Study on aerosol optical properties and radiative effect in cloudy weather in the Guangzhou region, Sci. Total Environ., 568, 147–154, https://doi.org/10.1016/j.scitotenv.2016.05.156, 2016.
Du, W., Zhang, Y., Chen, Y., Xu, L., Chen, J., Deng, J., Hong, Y., and Xiao, H.: Chemical characterization and source apportionment of PM2.5 during spring and winter in the Yangtze River Delta, China, Aerosol Air Qual. Res.,, 17, 2165–2180, https://doi.org/10.4209/aaqr.2017.03.0108, 2017.
Fan, S., Liu, C., Xie, Z., Dong, Y., Hu, Q., Fan, G., Chen, Z., Zhang, T., Duan, J., Zhang, P., and Liu, J.: Scanning vertical distributions of typical aerosols along the Yangtze River using elastic lidar, Sci. Total Environ., 628, 631–641, https://doi.org/10.1016/j.scitotenv.2018.02.099, 2018.
Fang, X., Fan, Q., Li, H., Liao, Z., Xie, J., and Fan, S.: Multi-scale correlations between air quality and meteorology in the Guangdong-Hong Kong-Macau Greater Bay Area of China during 2015–2017, Atmos. Environ., 191, 463–477, https://doi.org/10.1016/j.atmosenv.2018.08.018, 2018.
Fang, X., Fan, Q., Liao, Z., Xie, J., Xu, X., and Fan, S.: Spatial-temporal characteristics of the air quality in the Guangdong-Hong Kong-Macau Greater Bay Area of China during 2015–2017, Atmos. Environ., 210, 14–34, https://doi.org/10.1016/j.atmosenv.2019.04.037, 2019.
Fernald, F. G.: Analysis of atmospheric lidar observations: some comments, Appl. Opt., 23, 652–653, 1984.
He, Y., Wang, H., Wang, H., Xu, X., Li, Y., and Fan, S.: Meteorology and topographic influences on nocturnal ozone increase during the summertime over Shaoguan, China, Atmos. Environ., 256, 118459, https://doi.org/10.1016/j.atmosenv.2021.118459, 2021b.
He, Y., Xu, X., Gu, Z., Chen, X., Li, Y., and Fan, S.: Vertical distribution characteristics of aerosol particles over the Guanzhong Plain, Atmos. Environ., 255, 118444, https://doi.org/10.1016/j.atmosenv.2021.118444, 2021a.
Heese, B., Baars, H., Bohlmann, S., Althausen, D., and Deng, R.: Continuous vertical aerosol profiling with a multi-wavelength Raman polarization lidar over the Pearl River Delta, China, Atmos. Chem. Phys., 17, 6679–6691, https://doi.org/10.5194/acp-17-6679-2017, 2017.
Huang, T., Li Y., Cheng, J. C. H., Haywood, J., Hon, K. K., Lam, D. H. Y., Lee, O. S. M., Lolli, S., O'Connor, E. J., Lee, H. F., Wang, M., and Yim, S. H. L.: Assessing Transboundary-local Aerosols Interaction over Complex Terrain Using a Doppler LiDAR Network, Geophys. Res. Lett., 48, e2021GL093238, https://doi.org/10.1029/2021GL093238, 2021a.
Huang, T., Yang, Y., O'Connor, E. J., Lolli, S., Haywood, J., Osborne, M., Cheng. J. C. H. C., Guo, J., and Yim, S. H. L.: Influence of a weak typhoon on the vertical distribution of air pollution in Hong Kong: A perspective from a Doppler LiDAR network, Environ. Pollut., 276, 116534, https://doi.org/10.1016/j.envpol.2021.116534, 2021b.
Huige, D., Siwen, L., Yun, Y., and Dengxin, H.: Observational study of the vertical aerosol and meteorological factor distributions with respect to particulate pollution in Xi'an, Atmos. Environ., 247, 118215, https://doi.org/10.1016/j.atmosenv.2021.118215, 2021.
Kim, H. C., Chai, T., Stein, A., and Kondragunta, S.: Inverse modeling of fire emissions constrained by smoke plume transport using HYSPLIT dispersion model and geostationary satellite observations, Atmos. Chem. Phys., 20, 10259–10277, https://doi.org/10.5194/acp-20-10259-2020, 2020.
Leikauf, G. D., Kim, S. H., and Jang, A. S.: Mechanisms of ultrafine particle-induced respiratory health effects, Experiment. Molec. Med., 52, 329–337, https://doi.org/10.1038/s12276-020-0394-0, 2020.
Li, Y., Wang, B., Lee, S. Y., Zhang, Z., Wang, Y., and Dong, W.: Micro-Pulse Lidar Cruising Measurements in Northern South China Sea, Remote Sens., 12, 1695, https://doi.org/10.3390/rs12101695, 2020.
Liao, Z., Gao, M., Sun, J., and Fan, S.: The impact of synoptic circulation on air quality and pollution-related human health in the Yangtze River Delta region, Sci. Total Environ., 607, 838–846, https://doi.org/10.1016/j.scitotenv.2017.07.031, 2017.
Liu, J., Wu, D., Fan, S., Mao, X., and Chen, H.: A one-year, on-line, multi-site observational study on water-soluble inorganic ions in PM2.5 over the Pearl River Delta region, China, Sci. Total Environ., 601, 1720–1732, https://doi.org/10.1016/j.scitotenv.2017.06.039, 2017.
Liu, Q., He, Q., Fang, S., Guang, Y., Ma, C., Chen, Y., Kang, Y., Pan, H., Zhang, H., and Yao, Y.: Vertical distribution of ambient aerosol extinctive properties during haze and haze-free periods based on the Micro-Pulse Lidar observation in Shanghai, Sci. Total Environ., 574, 1502–1511, https://doi.org/10.1016/j.scitotenv.2016.08.152, 2017.
Lu, X., Mao, F., Pan, Z., Gong, W., Wang, W., Tian, L., and Fang, S.: Three-dimensional physical and optical characteristics of aerosols over central china from long-term CALIPSO and HYSPLIT data, Remote Sens., 10, 314, https://doi.org/10.3390/rs10020314, 2018.
Lv, L., Liu, W., Zhang, T., Chen, Z., Dong, Y., Fan, G., Xiang, Y., Yao, Y., Yang, N., Chu, B., Teng, M., and Shu, X.: Observations of particle extinction, PM2.5 mass concentration profile and flux in north China based on mobile lidar technique. Atmos. Environ., 164, 360–369, https://doi.org/10.1016/j.atmosenv.2017.06.022, 2017.
Lv, L., Xiang, Y., Zhang, T., Chai, W., and Liu, W.: Comprehensive study of regional haze in the North China Plain with synergistic measurement from multiple mobile vehicle-based lidars and a lidar network, Sci. Total Environ., 721, 137773, https://doi.org/10.1016/j.scitotenv.2020.137773, 2020.
Lyu, L., Dong, Y., Zhang, T., Liu, C., Liu, W., Xie, Z., Xiang, Y., Zhang, Y., Chen, Z., Fan, G., Zhang, L., Liu, Y., Shi, Y., and Shu, X.: Vertical Distribution Characteristics of PM2.5 Observed by a Mobile Vehicle Lidar in Tianjin, China in 2016, J. Meteorol. Res., 32, 60–68, https://doi.org/10.1007/s13351-018-7068-z, 2018.
National Centers for Environmental Prediction/National Weather Service/NOAA/U.S.: Department of Commerce, updated daily: NCEP GDAS/FNL 0.25 Degree Global Tropospheric Analyses and Forecast Grids, available at: https://www.ncei.noaa.gov/products/weather-climate-models/global-data-assimilation, (last access: 1 November 2020), 2015.
Orru, H., Ebi, K. L., and Forsberg, B.: The interplay of climate change and air pollution on health, Current Environmental Health Reports, 4, 504–513, https://doi.org/10.1007/s40572-017-0168-6, 2017.
Seibert, P., Beyrich, F., Gryning, S. E., Joffre, S., Rasmussen, A., and Tercier, P.: Review and intercomparison of operational methods for the determination of the mixing height, Atmos. Environ., 34, 1001–1027, https://doi.org/10.1016/S1352-2310(99)00349-0, 2000.
Sekuła, P., Bokwa, A., Bartyzel, J., Bochenek, B., Chmura, Ł., Gałkowski, M., and Zimnoch, M.: Measurement report: Effect of wind shear on PM10 concentration vertical structure in the urban boundary layer in a complex terrain, Atmos. Chem. Phys., 21, 12113–12139, https://doi.org/10.5194/acp-21-12113-2021, 2021.
Shao, Q., Liu, X., and Zhao, W.: An alternative method for analyzing dimensional interactions of urban carrying capacity: case study of Guangdong-Hong Kong-Macao Greater Bay Area, J. Environ. Manage., 273, 111064, https://doi.org/10.1016/j.jenvman.2020.111064, 2020.
Stocker, T. (Ed.): Climate change 2013: the physical science basis: Working Group I contribution to the Fifth assessment report of the Intergovernmental Panel on Climate Change, Cambridge university press, 571–658, 2014.
Strawa, A. W., Kirchstetter, T. W., Hallar, A. G., Ban-Weiss, G. A., McLaughlin, J. P., Harley, R. A., and Lunden, M. M.: Optical and physical properties of primary on-road vehicle particle emissions and their implications for climate change, J. Aerosol Sci., 41, 36–50, https://doi.org/10.1016/j.jaerosci.2009.08.010, 2010.
Tian, P., Cao, X., Zhang, L., Sun, N., Sun, L., Logan, T., Shi, J., Wang, Y., Ji, Y., Lin, Y., Huang, Z., Zhou, T., Shi, Y., and Zhang, R.: Aerosol vertical distribution and optical properties over China from long-term satellite and ground-based remote sensing, Atmos. Chem. Phys., 17, 2509–2523, https://doi.org/10.5194/acp-17-2509-2017, 2017.
Wallace, J. and Kanaroglou, P.: The effect of temperature inversions on ground-level nitrogen dioxide (NO2) and fine particulate matter (PM2.5) using temperature profiles from the Atmospheric Infrared Sounder (AIRS), Sci. Total Environ., 407, 5085–5095, https://doi.org/10.1016/j.scitotenv.2009.05.050, 2009.
Wang, H., Sun, Z., Li, H., Gao, Y., Wu, J., and Cheng, T.: Vertical-distribution characteristics of atmospheric aerosols under different thermodynamic conditions in Beijing, Aerosol Air Qual. Res., 18, 2775–2787, https://doi.org/10.4209/aaqr.2018.03.0078, 2018.
Xie, J., Liao, Z., Fang, X., Xu, X., Wang, Y., Zhang, Y., Liu, J., Fan, S., and Wang, B.: The characteristics of hourly wind field and its impacts on air quality in the Pearl River Delta region during 2013–2017, Atmos. Res., 227, 112–124, https://doi.org/10.1016/j.atmosres.2019.04.023, 2019.
Xu, Y., Xue, W., Lei, Y., Zhao, Y., Cheng, S., Ren, Z., and Huang, Q.: Impact of meteorological conditions on PM2.5 Pollution in China during winter, Atmosphere, 9, 429, https://doi.org/10.3390/atmos9110429, 2018.
Xu, X., Xie, J., Li, Y., Miao, S., Fan, S.: Data for “Measurement report Vehicle-based multi-lidar observational study on the effect of meteorological elements on the three-dimensional distribution of particles in the western Guangdong–Hong Kong–Macao Greater Bay Area”, Zenodo [data set], https://doi.org/10.5281/zenodo.5726855, 2021.
Yao, L., Zhan, B., Xian, A., Sun, W., Li, Q., and Chen, J.: Contribution of transregional transport to particle pollution and health effects in Shanghai during 2013–2017, Sci. Total Environ., 677, 564–570, https://doi.org/10.1016/j.scitotenv.2019.03.488, 2019.s
Zang, Z., Wang, W., You, W., Li, Y., Ye, F., and Wang, C.: Estimating ground-level PM2.5 concentrations in Beijing, China using aerosol optical depth and parameters of the temperature inversion layer, Sci. Total Environ., 575, 1219–1227, https://doi.org/10.1016/j.scitotenv.2016.09.186, 2017.
Zhao, Y. F., Gao, J., Cai, Y. J., Wang, J. J., and Pan, J.: Real-time tracing VOCs, O3 and PM2.5 emission sources with vehicle-mounted proton transfer reaction mass spectrometry combined differential absorption lidar, Atmos. Pollut. Res., 12, 146–153, https://doi.org/10.1016/j.apr.2021.01.008, 2021.
Zhou, Y., Shan, Y., Liu, G., and Guan, D.: Emissions and low-carbon development in Guangdong-Hong Kong-Macao Greater Bay Area cities and their surroundings, Appl. Energ., 228, 1683–1692, https://doi.org/10.1016/j.apenergy.2018.07.038, 2018.