the Creative Commons Attribution 4.0 License.
the Creative Commons Attribution 4.0 License.
 | 28 Oct 2022
Modelling SO2 conversion into sulfates in the mid-troposphere with a 3D chemistry transport model: the case of Mount Etna's eruption on 12 April 2012
Mathieu Lachatre
Sylvain Mailler
Laurent Menut
Arineh Cholakian
Pasquale Sellitto
Guillaume Siour
Henda Guermazi
Giuseppe Salerno
Salvatore Giammanco
Volcanic activity is an important source of atmospheric sulfur dioxide (SO2), which, after conversion into sulfuric acid, induces impacts on rain acidity, human health, meteorology and the radiative balance of the atmosphere, among others. This work focuses on the conversion of SO2 into sulfates (, S(+VI)) in the mid-tropospheric volcanic plume emitted by the explosive eruption of Mount Etna (Italy) on 12 April 2012, using the CHIMERE chemistry transport model. As the volcanic plume location and composition depend on several often poorly constrained parameters, using a chemistry transport model allows us to study the sensitivity of SO2 oxidation to multiple aspects, such as volcanic water emissions, transition metal emissions, plume diffusion and plume altitude. Our results show that two pathways contribute to sulfate production in the mid-troposphere: (1) the oxidation of SO2 by OH in the gaseous phase (70 %) and (2) aqueous oxidation by O2 catalysed by Mn2+ and Fe3+ ions (25 %). Oxidation in the aqueous phase is the faster process, but liquid water is scarce in the mid-troposphere; therefore, the relative share of gaseous oxidation can be important. After 1 d in the mid-troposphere, about 0.5 % of the volcanic SO2 was converted to sulfates via the gaseous process. Because of the nonlinear dependency of the kinetics in the aqueous phase on the amount of volcanic water emitted and on the availability of transition metals in the aqueous phase, several experiments have been designed to determine the prominence of different parameters. Our simulations show that, during the short time that liquid water remains in the plume, around 0.4 % of sulfates manage to quickly enter the liquid phase. Sensitivity tests regarding the advection scheme have shown that this scheme must be chosen wisely, as dispersion will impact both of the oxidation pathways explained above.
- Article
(4162 KB) - Full-text XML
- Companion paper
- BibTeX
- EndNote


Sulfate aerosols resulting from the conversion of volcanic sulfur dioxide (SO2) have substantial effects on air quality, meteorology, rain acidity and the radiative balance of the Earth's atmosphere at local to global spatial scales, depending on the specific volcanic activity (e.g. Langmann, 2014; Sellitto et al., 2017; Pattantyus et al., 2018; Sellitto et al., 2191). SO2 is emitted from both anthropogenic and natural sources, with volcanic emissions being the major contributors to the natural emissions. Volcanic emissions can be classified as coming from two broad classes of volcanic activity: passive degassing and explosive events. Passive degassing occurs permanently at many volcanoes. For example, Mount Etna emits an estimated 530 kt yr−1 of SO2 annually, making it the eighth largest contributor to SO2 emissions from passive degassing, with the strongest global contributor being Mount Kīlauea (in Hawaii, USA), which emits an estimated 2740 kt yr−1 annually (Itahashi et al., 2021). Explosive eruptions emit massive quantities of SO2 into the atmosphere in a short period of time. Unlike passive degassing, which generates emissions close to the surface, explosive eruptions may emit SO2 high above the volcanic vent, with the possibility of emissions reaching the stratosphere during massive eruptions such as El Chichón in 1982 (Pollack et al., 1983) Mount Pinatubo (Philippines) in 1992 or even the more moderate recent activity of volcanoes such as Raikoke (e.g. Kloss et al., 2021).
While contributing to air quality on a local to regional scale, sulfate aerosols produced as a result of explosive volcanic activity also represent an important natural radiative forcing; therefore, they are significant for climate studies. Pattantyus et al. (2018) give an extensive review of the oxidation processes of SO2 in the marine boundary layer for the case of Mount Kīlauea, and they list two main oxidation paths for this species: (1) oxidation by the hydroxyl radical (OH) in the gas phase and (2) oxidation in the liquid phase (including oxidation by H2O2, O3 and catalytic oxidation via O2). However, the fate of SO2 in volcanic plumes in the free troposphere still remains poorly understood, in part due to the difficulty involved with measuring these events. Multiple efforts have been carried out in order to understand and model sulfate formation within volcanic plumes, mostly during the first phases of eruption events (Hoshyaripour et al., 2014, 2015; Roberts et al., 2019). Heard et al. (2012) modelled the plumes from Kasatochi in 2008, Sarychev Peak in 2009 and Eyjafjallajökull in 2010 using the Numerical Atmospheric-dispersion Modelling Environment (NAME), and they obtained encouraging results with respect to reproducing the observed plumes of SO2 and sulfates. Specific modelling work has also been carried out by Galeazzo et al. (2018) using a 0D model, offering interesting insights into main oxidation pathways of SO2: these authors highlight the potential importance of the catalytic oxidation of SO2 by O2 with transition metals as catalysts. Pianezze et al. (2019) and Sahyoun et al. (2019) explored the role of secondary sulfate aerosols in the volcanic plumes from Mount Etna and Stromboli, showing that these secondary aerosols are initially nucleated with very small diameters but that their size distribution evolves to a coarser distribution as time goes by; thus, these sulfate particles can serve as cloud condensation nuclei (CCN) far from the vent.
Regarding mid-tropospheric eruptions, the issue of aqueous chemistry and the potential contribution of volcanic water emissions to the formation of an aqueous phase needs to be considered, as there is the possibility that these emissions have an impact on sulfate formation for this portion of the atmosphere. In the case of boundary layer eruptions and passive degassing, the quantity of water vapour emitted by the volcano is typically much smaller than the background water vapour at that level; for stratospheric eruptions, in contrast, temperatures are too cold to allow the presence of liquid water. In particular, the question of the sensitivity of sulfate formation to the volcanic emissions of water vapour is unanswered as of yet. In addition, the 0D study of Galeazzo et al. (2018) argues that the aqueous oxidation of SO2 catalysed by transition metals may be a substantial, or even dominant, oxidation pathway and that explosive eruptions themselves emit water vapour (possibly contributing to the formation of an atmospheric liquid phase) and transition metals. Another effect, which is not taken into account in the present study, is the potential depletion of OH radicals due to their consumption by atmospheric halogen. Jourdain et al. (2016) conducted a modelling study on the volcanic plumes of the Ambrym volcano (Vanuatu) and concluded that, when taking halogen emissions into account, the lifetime of SO2 relative to oxidation by OH increases by 36 % compared with the same simulation without halogen emissions; the authors attribute this change to OH depletion.
Various pathways can lead to SO2 [S(+IV)] oxidation to [S(+VI)]. In the gaseous phase, SO2 can react with the OH photochemically produced from ozone and water vapour.
Gas-phase conversion of SO2 by OH follows Reactions (R3)–(R5) (Seinfeld and Pandis, 2006).
Reaction (R3), the limiting step in this mechanism, is relatively slow (the decay rate of SO2 through this mechanism is estimated to be 2.9 ± 2.1 % h−1 during the daytime for the remote marine conditions around Mount Kīlauea); therefore, in the presence of an aqueous phase, liquid-phase conversion tends to dominate gas-phase conversion.
As SO2 is a soluble gas, aqueous-phase oxidation is also a possibility; the balance between liquid-phase and gas-phase concentrations is governed by the Henry law:
Here, is the concentration of dissolved SO2 in the aqueous phase; is the partial pressure of SO2 in the gas phase; and is the Henry law constant for SO2, for which the expression and numerical parameters can be found in publications such as Sander (2015):
Aqueous SO2 solution behaves like a weak acid, known as “sulfurous acid”:
with
with a weak acidity constant of .
For the sake of completeness, it should also be mentioned that sulfurous acid can have a second acidic dissociation:
with ; however, for pH values below 6 usually occurring in the atmosphere, this second dissociation hardly has an impact. Under typical atmospheric conditions (including those found in volcanic plumes) with a pH between 2 and 7, aqueous S(+IV) is seen mainly in the form of (Seinfeld and Pandis, 2006). One pathway for oxidation of S(+IV) to S(+VI) in the aqueous phase is the reaction of with hydrogen peroxide H2O2 (e.g. Shostak et al., 2019).
However, in situations resembling volcanic plumes where SO2 is abundant, the availability of H2O2 is a limiting factor for Reaction (R8); hence, other reaction pathways become dominant (Pattantyus et al., 2018). In such cases, the oxidation of by O3 can become an important pathway (Reaction R10; Lagrange et al., 1994; Seinfeld and Pandis, 2006; Pattantyus et al., 2018).
Finally, oxidation of by O2 with Fe3+ and Mn2+ as catalysts is another process that can be relevant in our case (Reaction R11; Connick and Zhang, 1996).
The aim of this work is to estimate the sensitivity of SO2 conversion via these pathways in a volcanic plume to several parameters that remain poorly constrained.
From a modelling point of view, Lachatre et al. (2020b) has shown that using the Després and Lagoutière (1999) anti-diffusive advection scheme in the vertical direction rather than the classical order-2 Van Leer (1977) scheme substantially reduces plume diffusion, reducing plume volume and increasing its concentration. With this anti-diffusive scheme, the plume volume is reduced by a factor ranging from 1.5 to 6 relative to the Van Leer (1977) scheme (depending on the model configuration; see Lachatre et al. (2020b) for details). Due to the many nonlinearities in the above-described physicochemical mechanisms governing SO2 oxidation, the effect of such a change in numerical diffusion on the way the model represents sulfate formation is not straightforward: too much numerical diffusion in a model may enhance certain oxidation processes (such as oxidation by background tropospheric species including OH or H2O2, which can be limited by the availability of these oxidants when the plume remains concentrated) and reduce others (such as aqueous-phase oxidation of SO2) which can be favoured by the simultaneous presence of large concentrations of volcanic water and volcanic SO2. To examine these effects, it is also relevant to quantify the impact of these advection choices on the various oxidation paths of SO2.
The remainder of this paper is structured as follows: in Sect. 2, we present the data used in the current study and the modelling choices that have been made; Sect. 3 presents the simulation outputs and their interpretation in terms of comparison to observations and in terms of sensitivity to multiple parameters; and, finally, Sect. 4 draws conclusions and examines new perspectives that are not covered by the present study.
2.1 The Infrared Atmospheric Sounding Interferometer (IASI) instrument
The Infrared Atmospheric Sounding Interferometer (IASI; Clarisse et al., 2014) instrument, aboard the Metop-A–C satellite series, orbits 817 km above the surface and provides a daily coverage of the Earth with a pixel resolution of 12 km with respect to diameter. IASI retrievals are widely used to observe and study SO2 in the Earth's atmosphere (Clarisse et al., 2012), including in volcanic plumes (Carboni et al., 2012, 2016). This instrument has also recently been used to measure the aerosol optical depth (AOD) of tropospheric volcanic sulfate particles (Guermazi et al., 2021).
2.2 The CHIMERE model
This modelling work has been performed using the CHIMERE CTM (chemistry transport model) (derived from v2020r1; Mailler et al., 2017; Menut et al., 2021) including new developments for vertical transport presented in Lachatre et al. (2020b) and Mailler et al. (2021). The CHIMERE simulation domain covers the central eastern Mediterranean Basin and contains 874 × 624 cells at 2.25×2.25 km2 horizontal resolution. The geometry of the domain (displayed in Fig. A2 in the Appendix), which has a Lambert conformal projection, was chosen to contain volcanic plume transport for a day, with a sufficiently fine resolution to resolve the volcanic plume during the first hours of its atmospheric advection. At the model resolution, the cell containing the vent has an average altitude of 2900 . The vertical distribution of the domain contains 40 layers, with the top of the domain being at 190 hPa. Horizontal advection in the CHIMERE model has been represented using the classical Van Leer (1977) second-order slope-limited transport scheme.
Anthropogenic emissions are generated using the Hemispheric Transport of Air Pollutants (HTAP) 2010 inventory (Janssens-Maenhout et al., 2015), boundary conditions for dust are calculated from the Georgia Tech/Goddard Global Ozone Chemistry Aerosol Radiation and Transport (GOCART) global model (Ginoux et al., 2001), and boundary conditions for other species are calculated from the LMDZ-INCA (the Laboratoire de Météorologie Dynamique general circulation model with Zoom coupled with the INteraction with Chemistry and Aerosols model) global model (Hauglustaine et al., 2004). The CHIMERE model has been forced using version 3.7.1 of the Weather Research and Forecasting model (WRFv.3.7.1; Skamarock et al., 2008), with an update of the forcing meteorological variables every 20 min using the WRF-CHIMERE online simulation framework (Briant et al., 2017; Menut et al., 2021). The WRF model has been run with 44 vertical levels starting from the surface to 50 hPa with the same horizontal grid as that used for CHIMERE. Large-scale meteorological fields used to force the WRF model at domain boundaries as well as for spectral nudging inside the simulation domain have been taken from the National Centers for Environmental Prediction (NCEP) Global Forecast System (GFS) dataset at a 0.25∘ resolution (NCEP, 2015). The chemical modelling is as described in Mailler et al. (2017), and references therein, including the reduced MELCHIOR2 chemical mechanism for inorganic chemistry, SOx chemistry, OH chemistry and more (Derognat et al., 2003; Menut et al., 2013). Gaseous oxidation pathways and aqueous oxidation through O3 and H2O2 are included in this mechanism, and no modifications have been made on this aspect of the chemistry mechanism. For the present study, retroaction from atmospheric composition onto the WRF simulation is not activated, meaning that all of the chemistry transport simulations are forced by the exact same meteorological fields, which allows one to isolate the physicochemical effects of the volcanic eruption from the complex feedback that it may have on the meteorological fields.
For radiative processes, calculations are done online using the Fast-JX module (version 7.0b; see Bian and Prather, 2002). As described in Mailler et al. (2016), the CHIMERE model includes the feedback of aerosol layers on photolysis rates. The calculation of the aerosol optical depths is also done by the Fast-JX module, using Mie calculations and assuming spherical shape for all particles and external mixing.
Oxidation of SO2 by O2(aq) catalysed by Fe and Mn is also available in the model; the evaluation of [Fe3+] and [Mn2+] has been adapted for the present study, as discussed in Sect. 2.5.
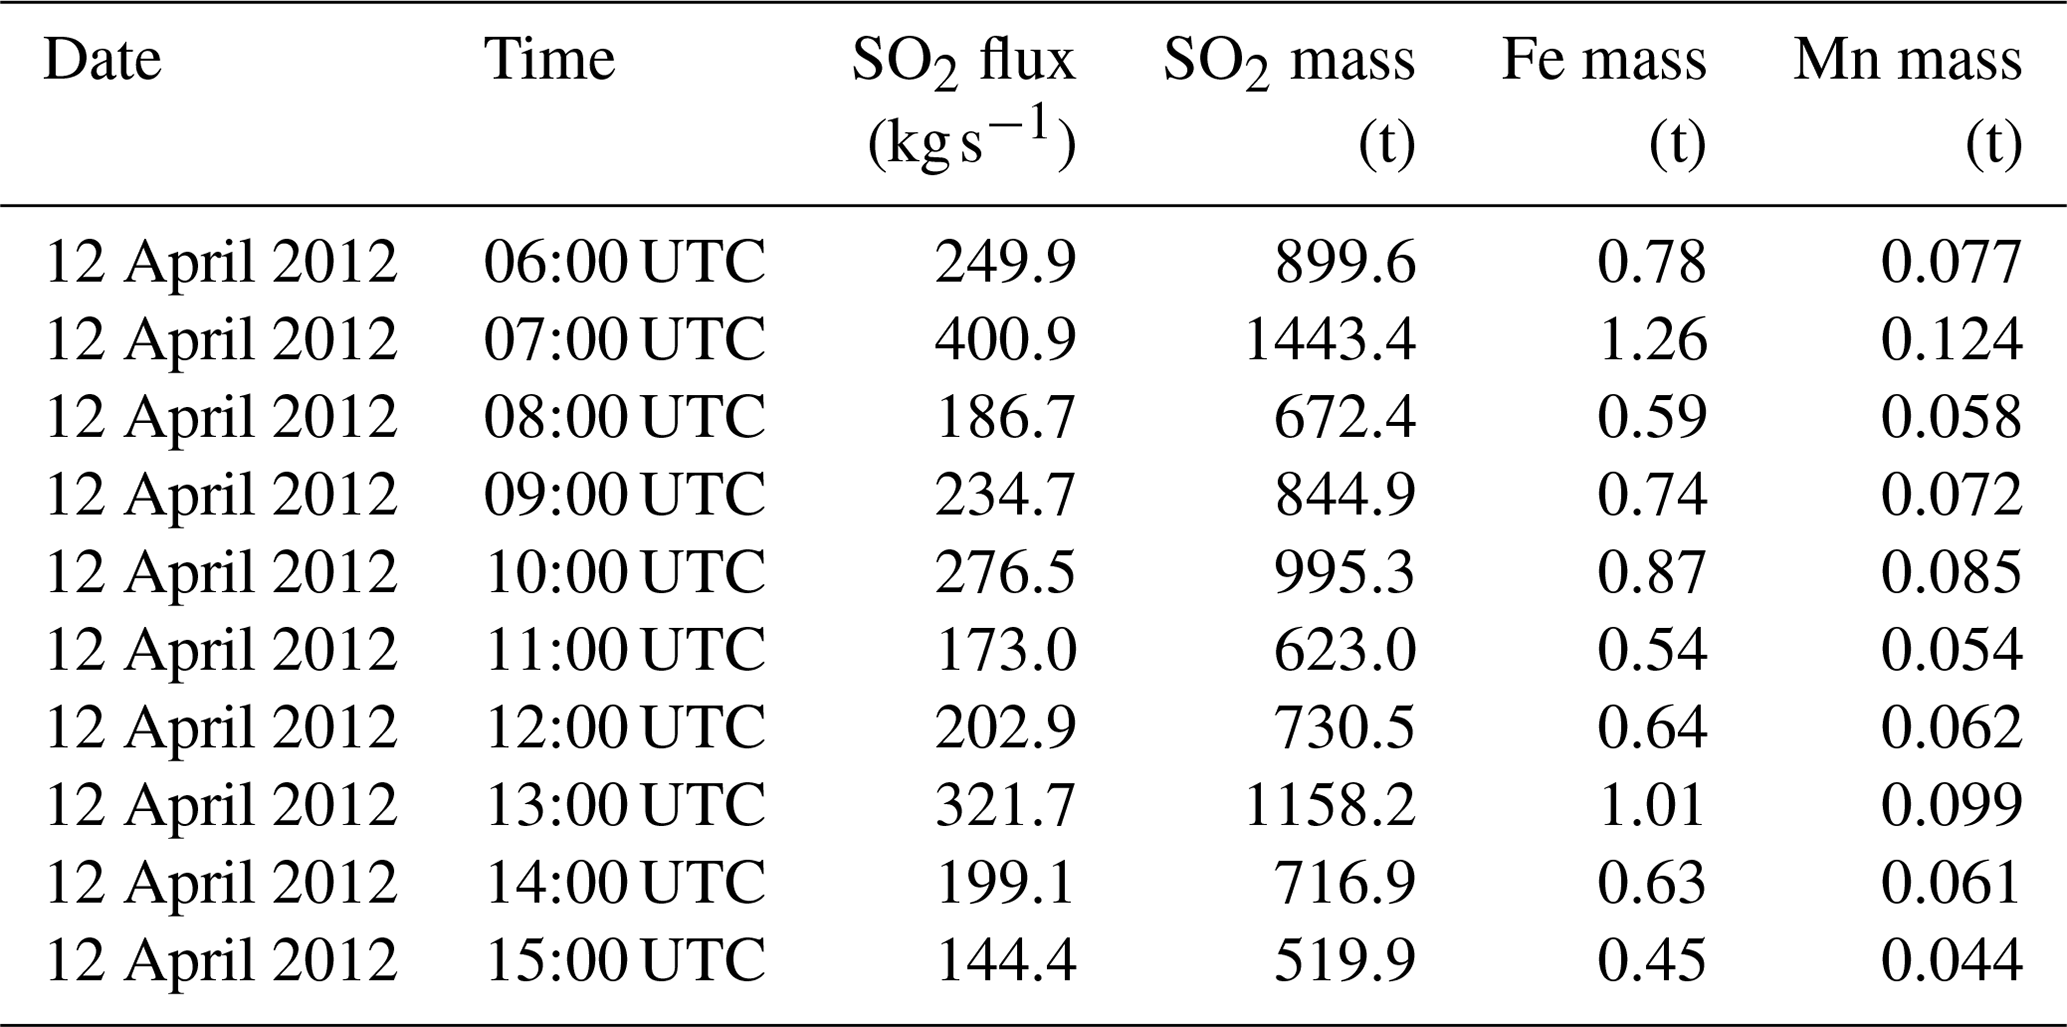
Table 1The SO2 hourly flux (kg s−1) estimates used as input for the CHIMERE model.
2.3 Modelling volcanic eruption emissions
The time and altitude profiles for the injection of SO2 into the atmosphere (Table 1) were obtained using SO2 emission flux rate measurement data from the ground-based differential optical absorption spectroscopy FLux Automatic MEasurements (DOAS FLAME) scanning network (e.g. Salerno et al., 2018). This method measures SO2 fluxes during passive degassing as well as during effusive and explosive eruptive activity using plume height inverted via an empirical relationship between plume height and wind speed (Salerno et al., 2009). In explosive paroxysmal events, such as in our case study, the plume is ejected to higher altitudes, and the linear height–wind relationship explained above cannot be utilised; therefore, mass flux is retrieved in post-processing using the plume height estimated by visual camera and/or satellite observations.
On 12 April 2012, between 06:00 and 16:00 UTC, a total SO2 emission of 8.6 kt was reported using this method. Emissions are localised around 8 . Volcanic SO2 emissions are injected in the CTM with a skewed Gaussian profile (Eckhardt et al., 2008; Mastin et al., 2009). The width of the Gaussian is defined by the full width at half maximum (FWHM, Eq. 5), and it equals 5 % of the centre of the injection's altitude (). The Gaussian profile is constructed with 13 altitude ranges, with widths corresponding to 1 % of the centre of injection altitude.
Volcanic emissions from explosive activity are more likely to be described with a skewed Gaussian profile (Eq. 6). In our case, we have selected a coefficient of skewness of α=0.5 m. The centre of the injection is localised at 8000 . ( value used to calculate the FWHM); thus, the FWHM equals 400 m and σ2 equals 170 m using Eq. (6). The vertical distribution is then constructed within 13 altitude ranges, with a width equal to 80 m (1 % of ). The centre of the injection is the centre of the seventh range. The entry for eruptive material in CHIMERE, before it is adapted to the CHIMERE vertical grid, is displayed in Fig. A1. Water, Fe and Mn are emitted with an identical vertical distribution.
2.4 Volcanic water emissions
Volcanic eruptions inject significant amounts of water into the atmosphere, particularly when considering the ambient humidity in the middle and upper troposphere. In the experiments containing volcanic water emissions, H2O is emitted similarly to SO2 emissions, with identical temporal and vertical profiles, as described in Sect. 2.3; to estimate the specific amount of the emitted H2O, a molecular ratio between SO2 and H2O has been implemented. For passive degassing, Shinohara et al. (2008) estimate the molecular ratio to be around 45 when considering 27 events or around 26 when considering 13 events with the highest quality of data sampling, with a large variability. Nonetheless, explosive episodes eject significantly larger amounts of water, with the molecular ratios likely reaching values of several hundreds, and the ratios associated with these events still carry large uncertainties. To assess the sensitivity of our results to this ratio, we have tested several hypotheses for the ratio. As observational information is scarce for volcanic water emissions during explosive events, a central hypothesis of 300 molecules of H2O per molecule of SO2 has been retained, corresponding to 725.6 kt of H2O.
The addition of volcanic water in the mid-troposphere can imply supersaturation. Consequently, in the model, water is added as water vapour until the partial pressure of water vapour reaches 105 % of the saturation vapour pressure . The remaining water emitted from the eruptive activity is added as liquid water or ice, depending on the ambient temperature. Several studies have focused on the phase state of water in the upper troposphere (Textor et al., 2003; Hu et al., 2010; Kärcher and Seifert, 2016), and it is generally agreed that liquid water is virtually nonexistent below the temperature of ≃ 235 K. Based on Cloud-Aerosol Lidar with Orthogonal Polarization (CALIOP) measurements, Komurcu et al. (2014) evaluated the supercooled liquid water fraction in clouds. Based on their Fig. 7, Eq. (7) gives a parabolic dependance of the supercooled liquid water fraction H2O(s) on temperature, to be used between 235 and 273 K (function is plotted in Fig. A3 in the Appendix):
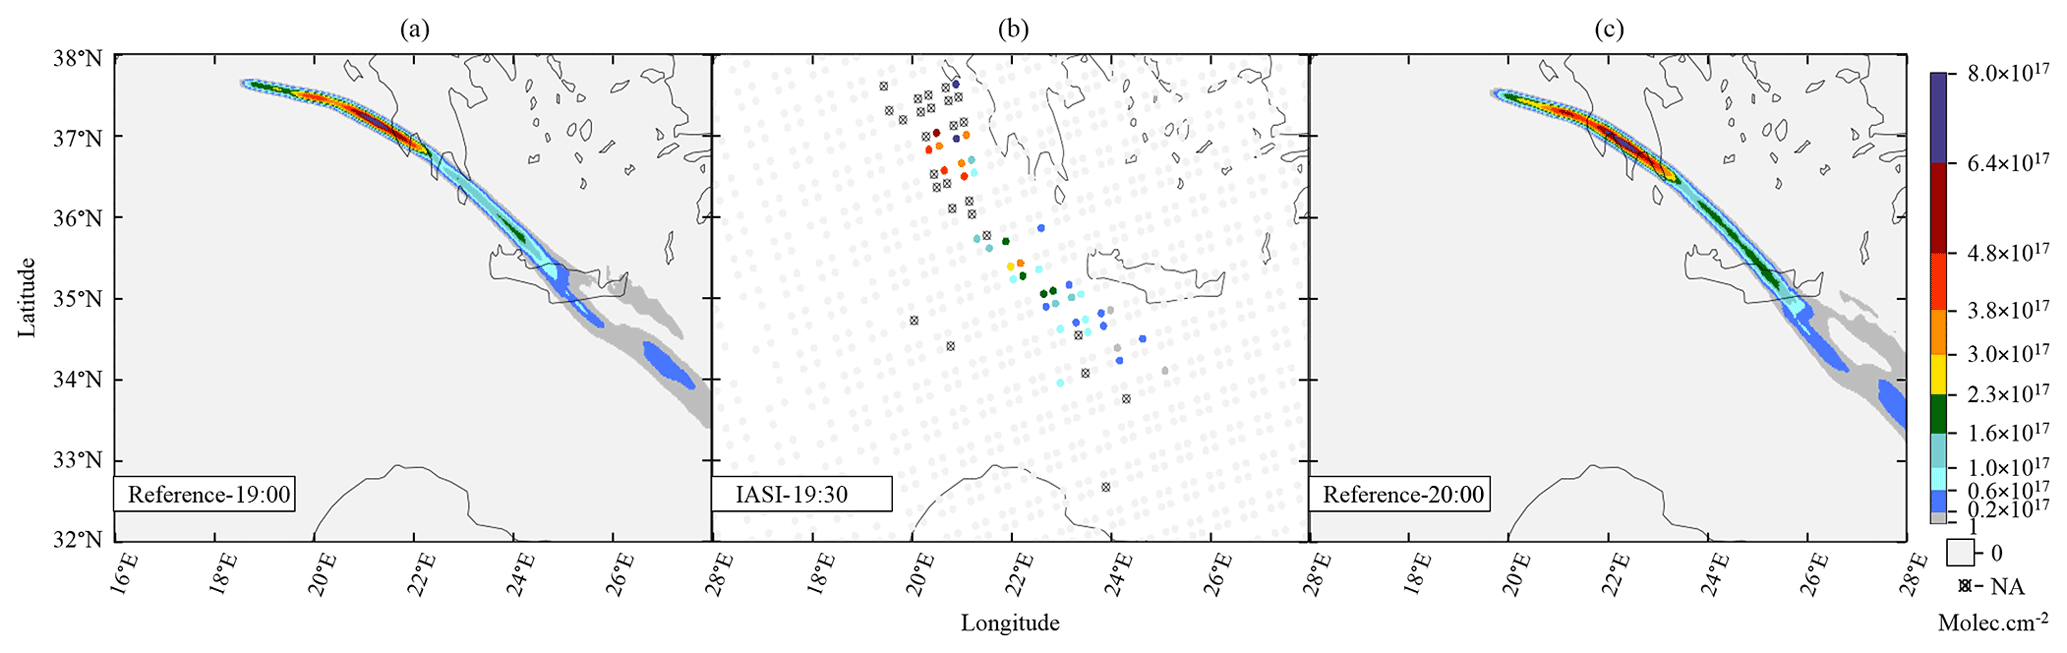
Figure 1Columns of SO2 from CHIMERE simulations and IASI measurements. Unavailable IASI data are shown as crossed circles. Null values are shown in light grey. The IASI sounding corresponds to 19:30 UTC (b). The CHIMERE Reference simulation is displayed for 19:00 UTC (a) and 20:00 UTC (c).
2.5 Transition metal ion (TMI) dissolution into droplets and the [Fe3+](aq) and [Mn2+](aq) threshold
In addition to SO2 and water, volcanic eruptions inject significant amounts of transition metals into the atmosphere, such as Fe and Mn (Calabrese et al., 2011). These trace elements can be contained in the emitted volcanic ash, which is more relevant during volcanic eruptive activity and must be considered in our simulations because of their catalytic role in the aqueous oxidation of SO2 by O2 (Reaction R11). In our simulations, the amount of transition metals emitted by the volcano are defined relative to SO2 emissions, with a molecular ratio of (i.e. 7.5 t) and 000 (i.e. 0.73 t) for Fe and Mn respectively.
The SO2 oxidation to sulfate is catalysed by and ions. The fraction of Fe3+ in cloud droplets and available to the catalytic reaction is a complex matter that depends of several factors, such as the ratio (Hoshyaripour et al., 2014), the halogen content [Cl−] (Maters et al., 2017), the ashes’ surface and bulk compositions. In an ideal situation, up to one-third of the total Fe on the ash surface can dissolve into the liquid-phase coating volcanic particles, mostly in the Fe(II) oxidation state (Galeazzo et al., 2018; Hoshyaripour et al., 2015). In our experiments, we consider 5 % of the total iron and manganese in the plume to be dissolved in the liquid phase (if clouds are produced) and, therefore, to be available as catalysts for Reaction (R11). In the case of liquid water in the plume, the iron concentration in droplets (mol L−1) is calculated as follows:
where i, j, l and t are the cell coordinates and time steps, MFe is the molar mass of iron (µg mol−1), VH2O is the volume of supercooled liquid water (SCLW; L), V is the volume of the cell (m3), [Fe(g)] is the concentration of iron in the atmosphere (µg m−3) and icefrac is the fraction of ice cloud compared with liquid water (cf. Sect. 2.4).
The second parameter that needs to be fixed is the upper limit for [Fe(III)]. Seinfeld and Pandis (2006) indicate a range of iron concentrations from 0.1 to 100 µ mol L−1 in clouds, which is a large range compared with more recent studies that estimate [Fe(III)] from 0.1 to 2 µ mol L−1 (Maters et al., 2016, 2017). Fe3+ is more likely to be dissolved in an acidic cloud droplet (pH below 2; Ayris and Delmelle, 2012); this particular condition can lead to [Fe(III)] going up to 10 µM (Ayris and Delmelle, 2012; Desboeufs et al., 2001). In our experiments, volcanic cloud droplets are particularly acidic, with a pH ranging from 1.5 to 3.5. As a consequence, thresholds of 10 µ mol L−1 for [Fe(III)] and 1 µ mol L−1 for [Mn(II)] were chosen.
2.6 Description of numerical simulations
Simulations have been organised into groups in order to explore various parameters of interest. First, the simulations focused on the significance of gas-phase conversion, aqueous-phase conversion and transition metals as catalysts (Table 2). We then focused on the impact of volcanic water emitted during volcanic activity (Table 3). The next series of simulations focused on evaluating initial parameters, such as the volcanic plume height of injection (Table 4). Finally, we evaluated the plume chemistry sensitivity to transport modelling parameters, comparing two vertical advection schemes. These schemes are described and tested in Lachatre et al. (2020b); however, the aforementioned article did not analyse their impact on the chemistry of the modelled plume.
Simulations emphasised using bold font and labelled “Background” in Tables 2, 3, 4 and 5 are simulations carried out without emissions originating from volcanic events; while they do not appear in the figures themselves, these simulations are necessary to separate background information from our other sensitivity tests. In addition, to better understand the impact of ambient conditions alone on volcanic SO2 and production, “Dry” simulations have been conducted in several cases. These simulations only include SO2 as volcanic emissions: neither volcanic water nor metals are considered in these cases. For better readability of the results, a unique simulation labelled “Reference” is retained in every panel of simulations. A table describing all of the simulation has been added in Appendix (Table A1) along with Fig. A5, which sums up the experimental results.
Table 2Simulation parameters for sensitivity tests on chemistry parameters. Bold items indicate background simulations that are used to retrieve background values. “Volcanic TM” stands for “volcanic transition metals”, “No SCLW stands” for “no supercooled liquid water”, and “No TMaq” stands for “no transition metals in the aqueous phase”. The Reference simulation is the closest to a realistic case.
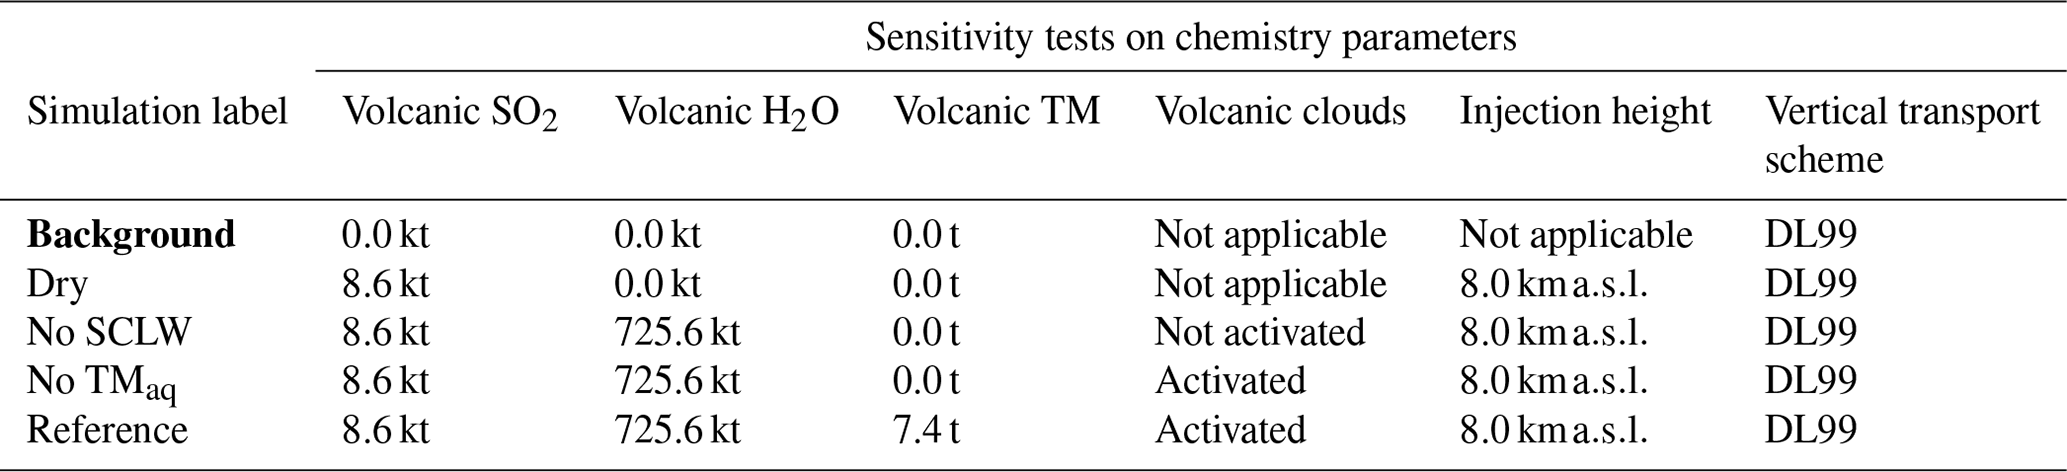
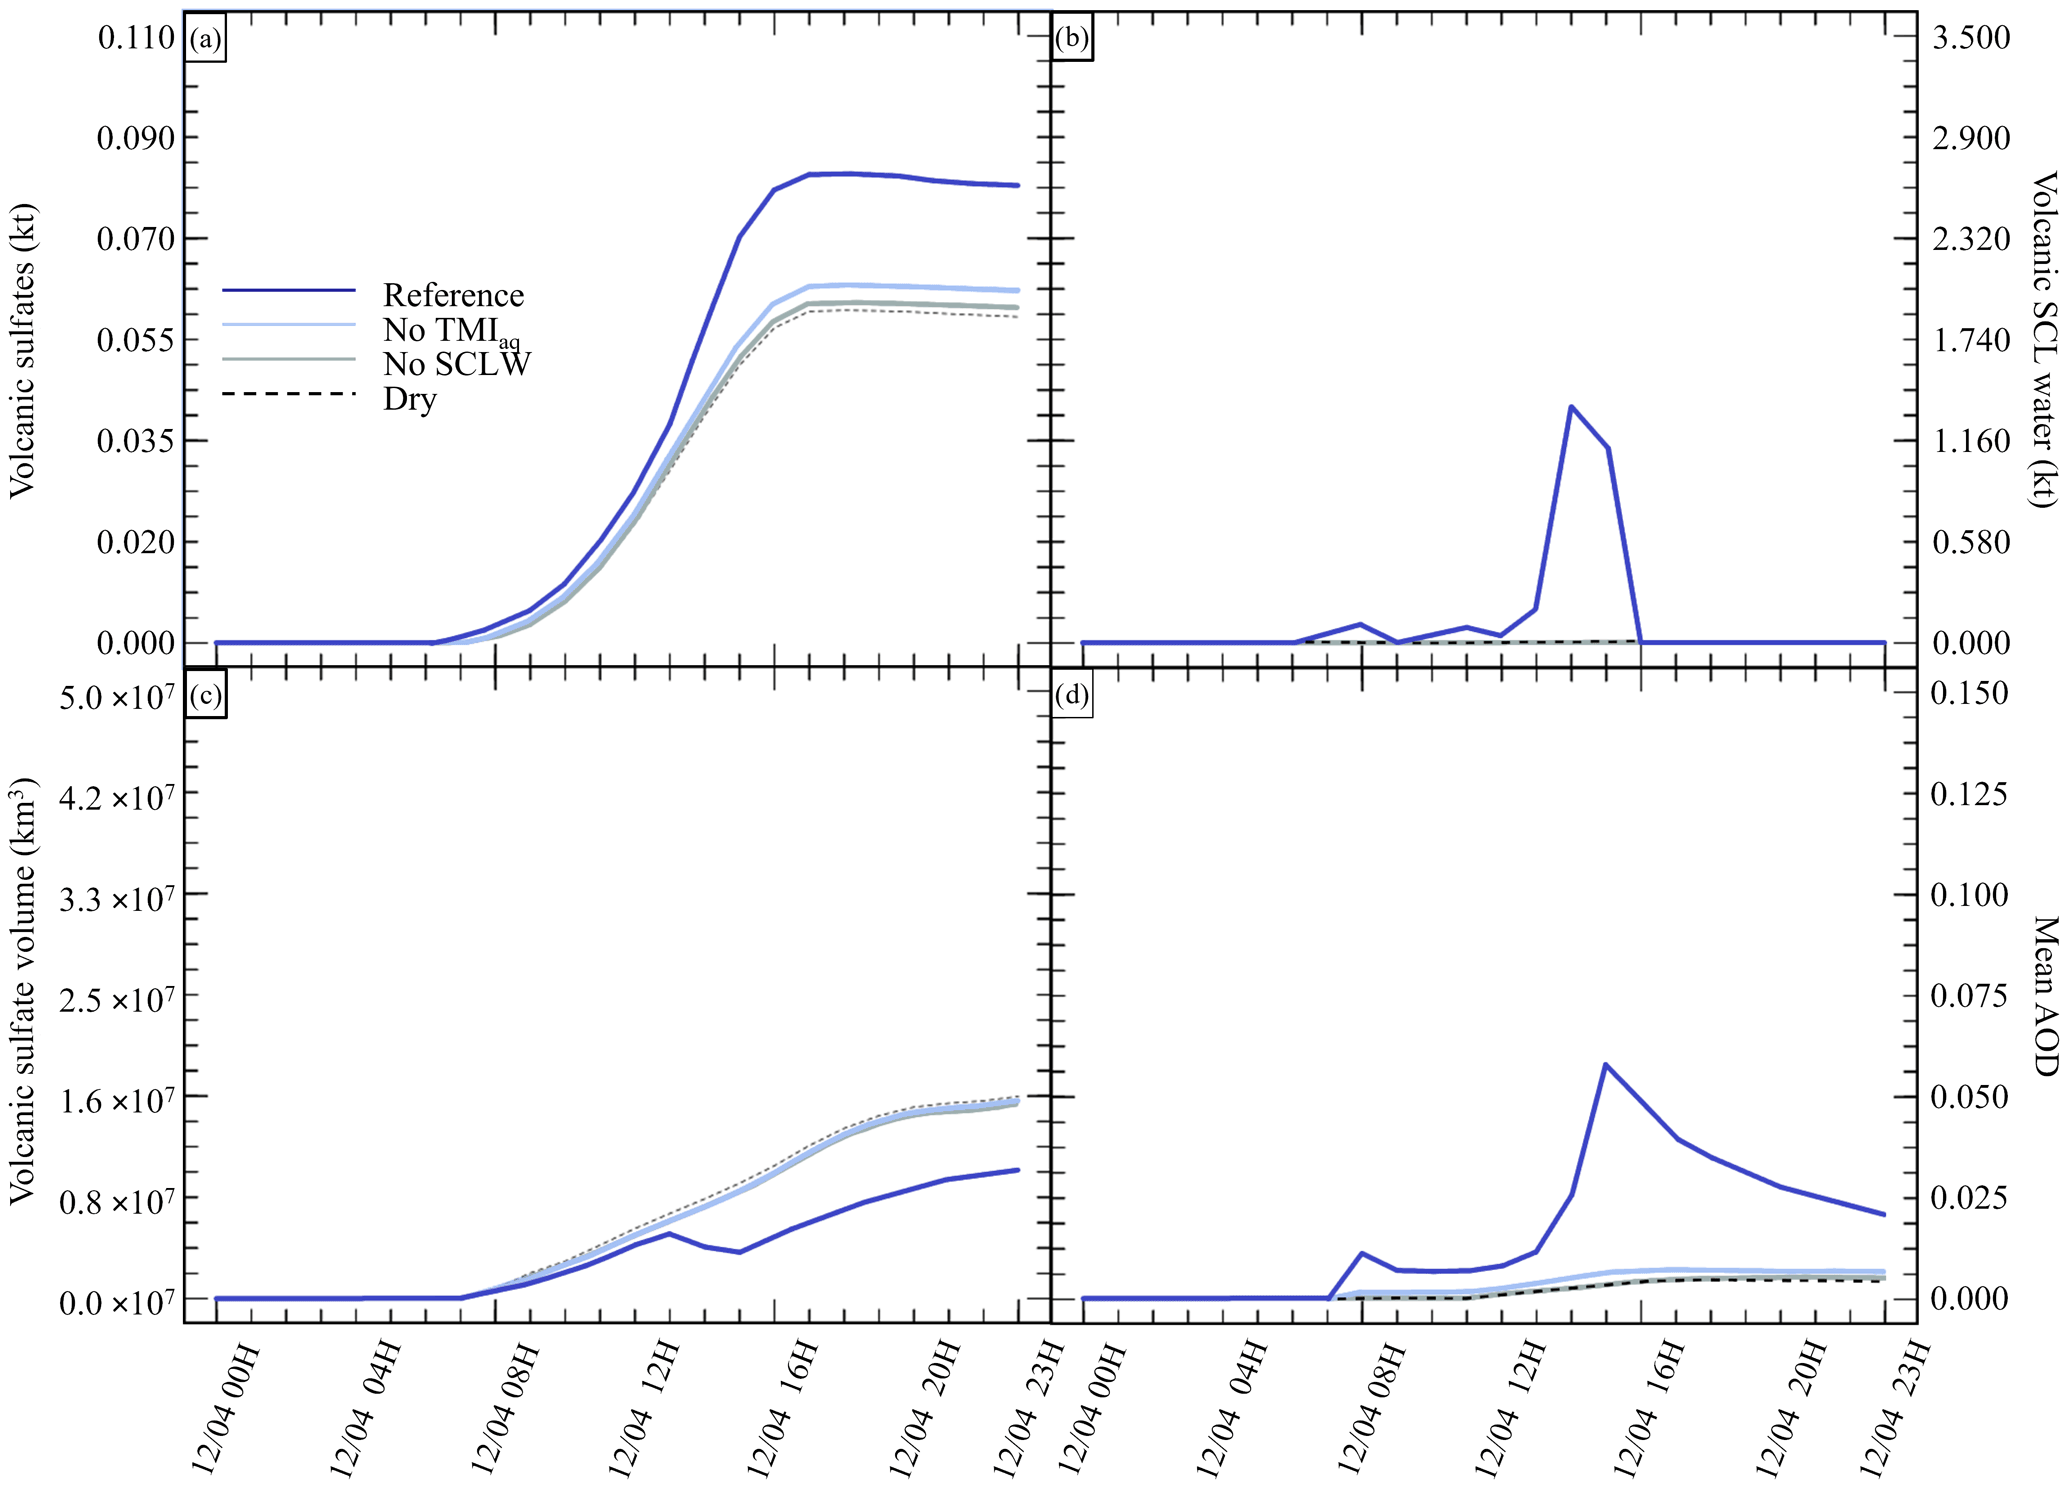
Figure 2Sensitivity tests on chemistry parameters for (a) sulfate aerosols (, kt), (b) supercooled liquid water (kt), (c) the minimum volume (km3) ⊂ 25 % of mass and (d) the AOD for plume ⊂ 25 % of mass. The Reference simulation is the closest to a realistic case. All time series represent differences relative to the Background simulation (the simulation without volcanic emissions).
3.1 Reference simulation compared with the IASI instrument
The background simulation has been used to exclude nonvolcanic information from the Reference simulation and for comparison with the time step surrounding the IASI sounding for SO2 (Fig. 1).
Comparison of model outputs with satellite data from the IASI instrument (Fig. 1) reveals that several aspects of the simulation outputs are consistent with observations. First, the general shape of the plume, with a NW–SE orientation, fits the observations. The range of values for SO2 columns is also consistent, as is their structure, with weaker values (around or below 2×10¹⁷ ) in the southern part of the plume and stronger values (above 5×10¹⁷ ) in the north-eastern part of the plume, south of Greece. Differences are also visible: the plume as represented by CHIMERE is shifted to the north and to the east compared with the plume as observed by IASI, and the modelled plume extends further towards the southwest, which is not visible in the satellite data. Due to the lack of spatial continuity in the IASI data, it seems difficult to estimate a global mass of SO2 in the plume. All in all, comparison with IASI data (Fig. 1) confirms a correct localisation and shape of the plume in CHIMERE (although with a horizontal offset of a few hundred kilometres), which is an indirect indication that the plume injection height in the model is correct: due to substantial wind shear in the troposphere, a large error in the injection height would result in a larger error in the position of the plume.
Table 3Simulation parameters for sensitivity tests on volcanic water emissions. Bold items indicate background simulations that are used to retrieve background values. “Volcanic TM” stands for “volcanic transition metals”. WV200 stands for “water vapour 200” (a mass mixing ratio of 200 / 1 between water vapour and SO2); similar acronyms are used for WV300 and WV400. The Reference simulation is the closest to a realistic case.
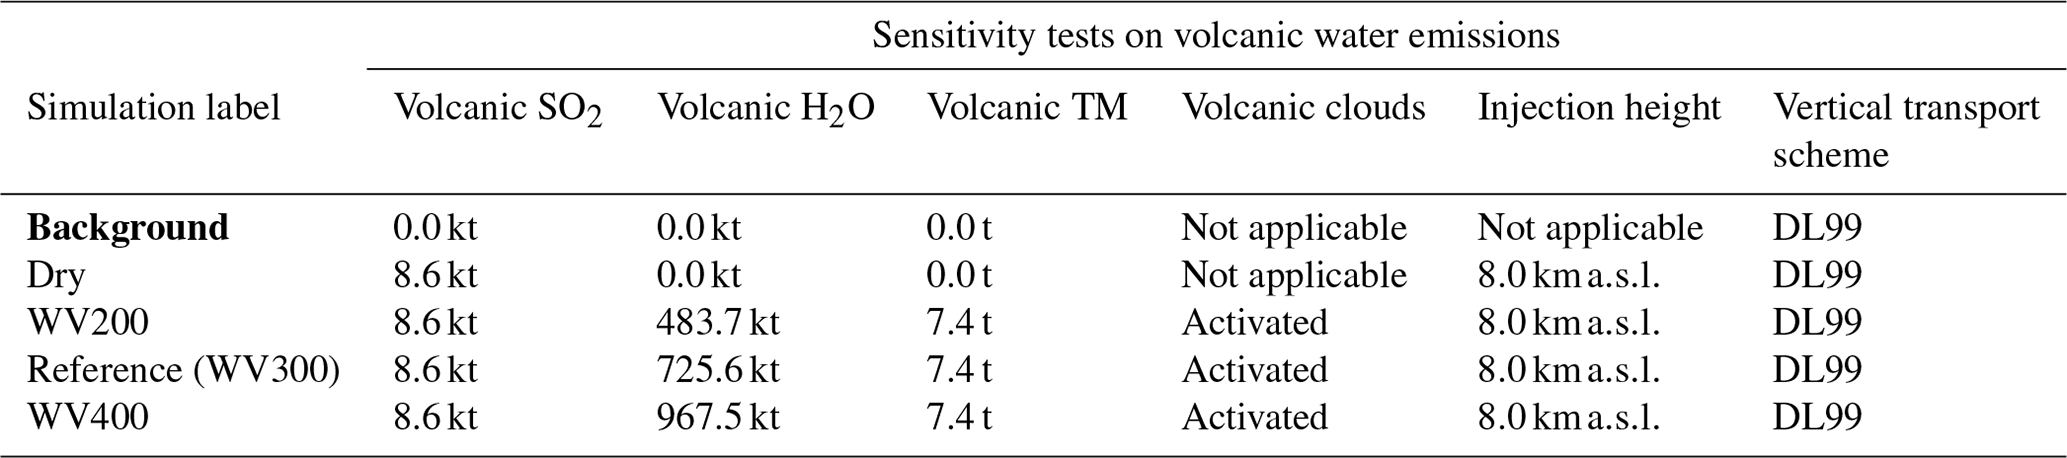
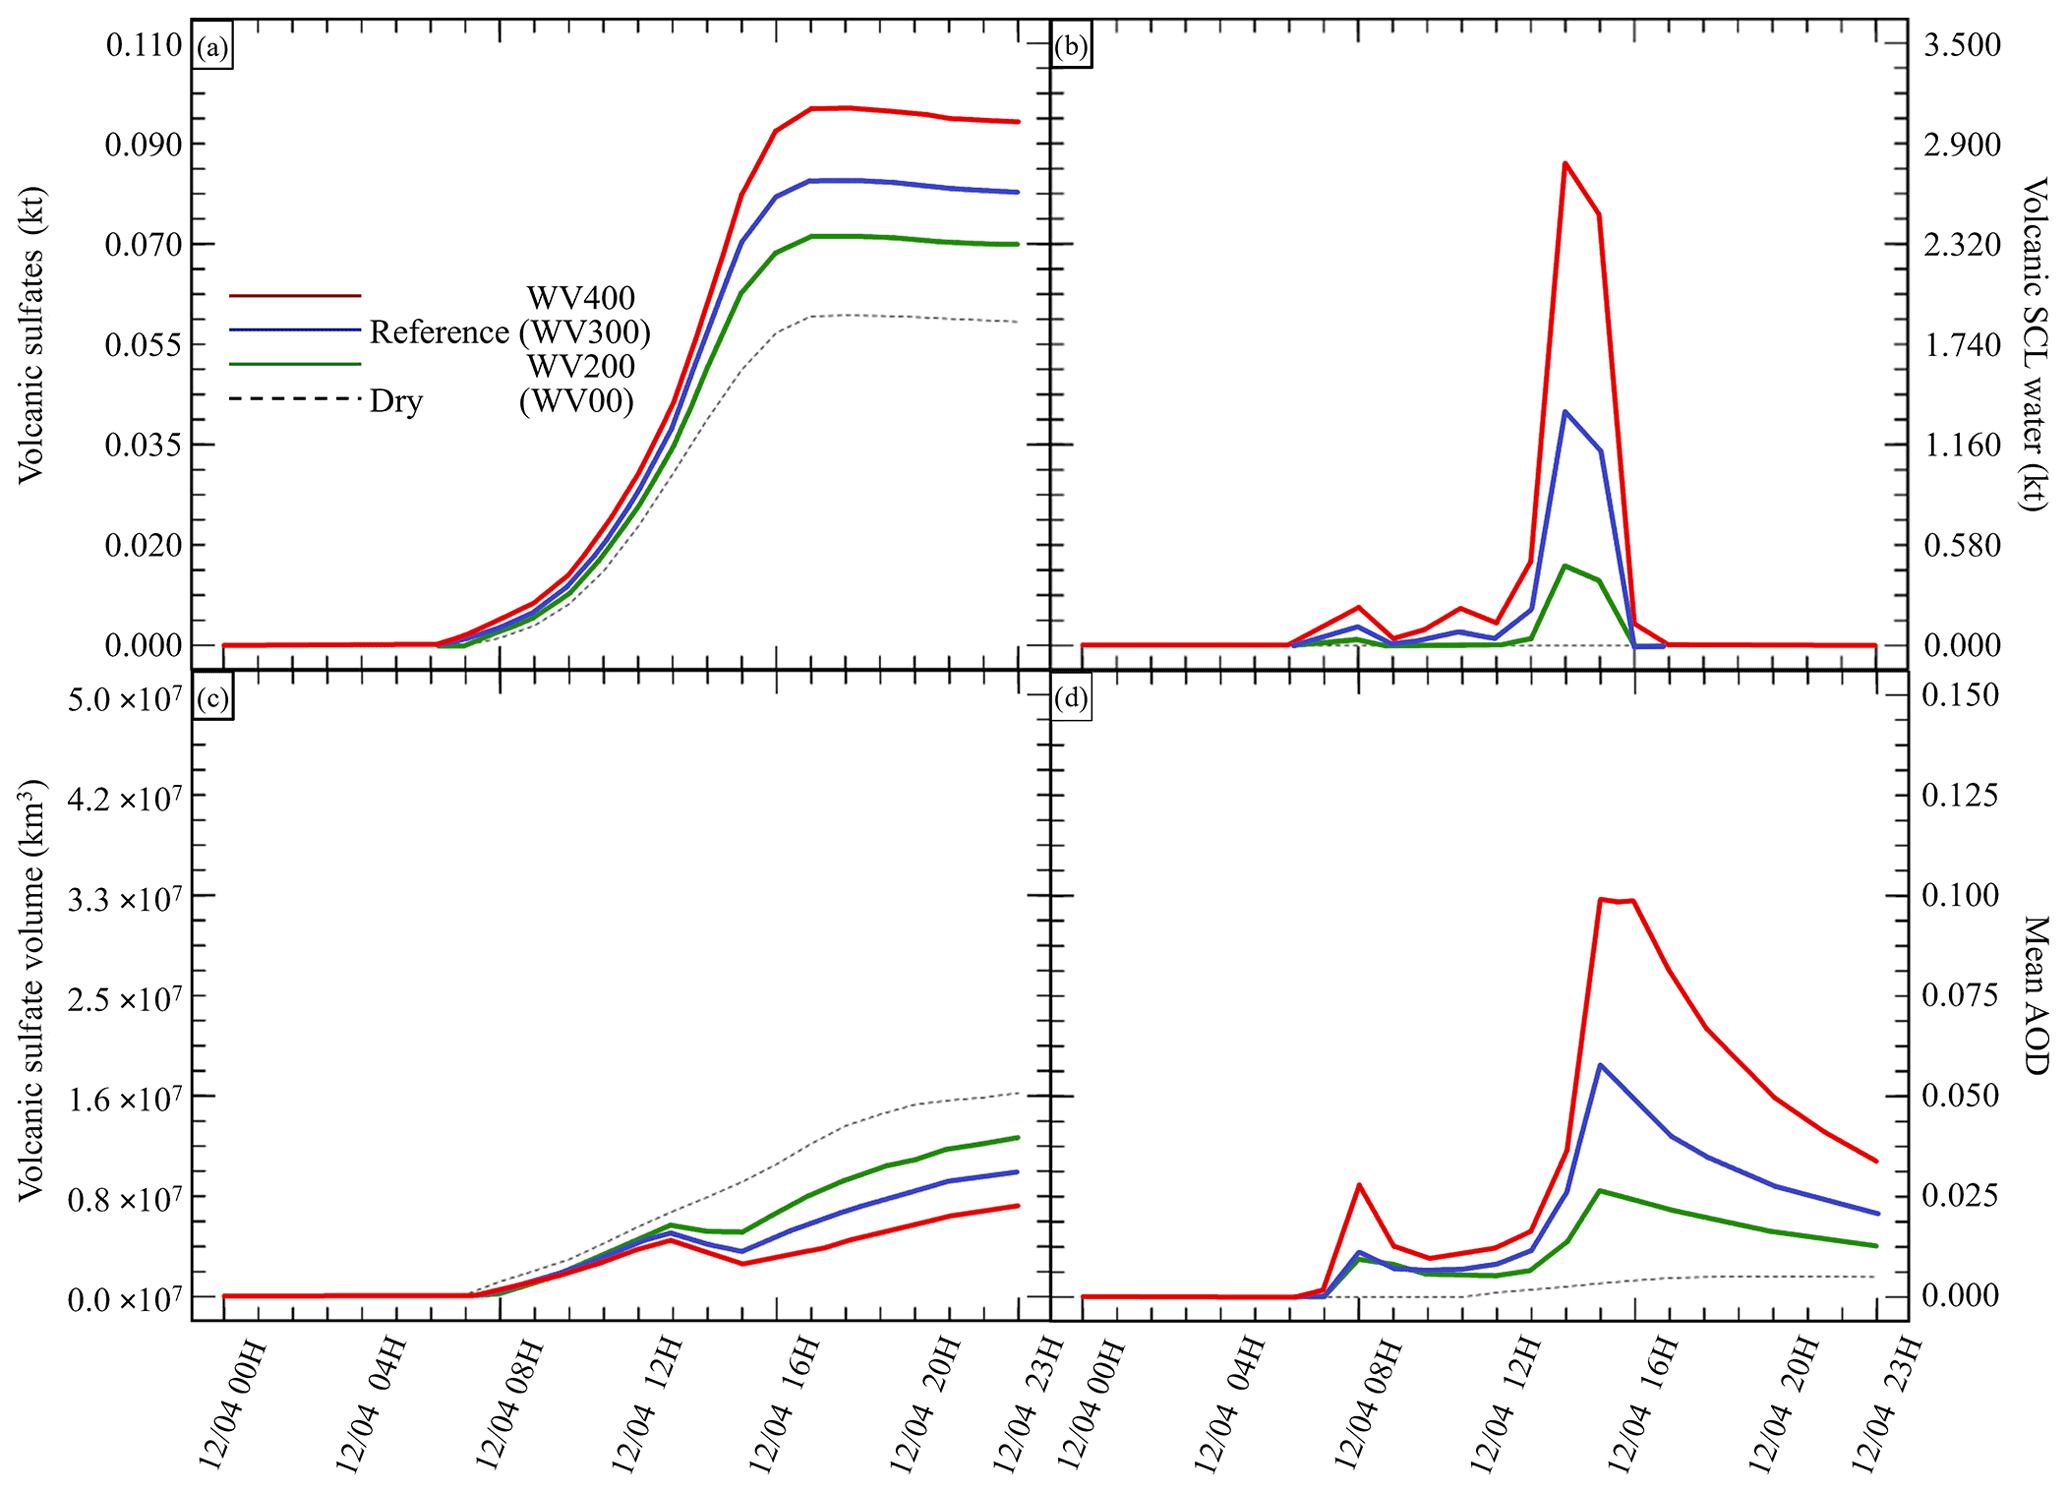
Figure 3Sensitivity tests on volcanic water emissions for (a) sulfate aerosols (, kt), (b) supercooled liquid water (kt), (c) the minimum volume (km3) ⊂ 25 % of mass and (d) the AOD for plume ⊂ 25 % of mass. The Reference simulation is the closest to a realistic case. All time series represent differences relative to the Background simulation (the simulation without volcanic emissions).
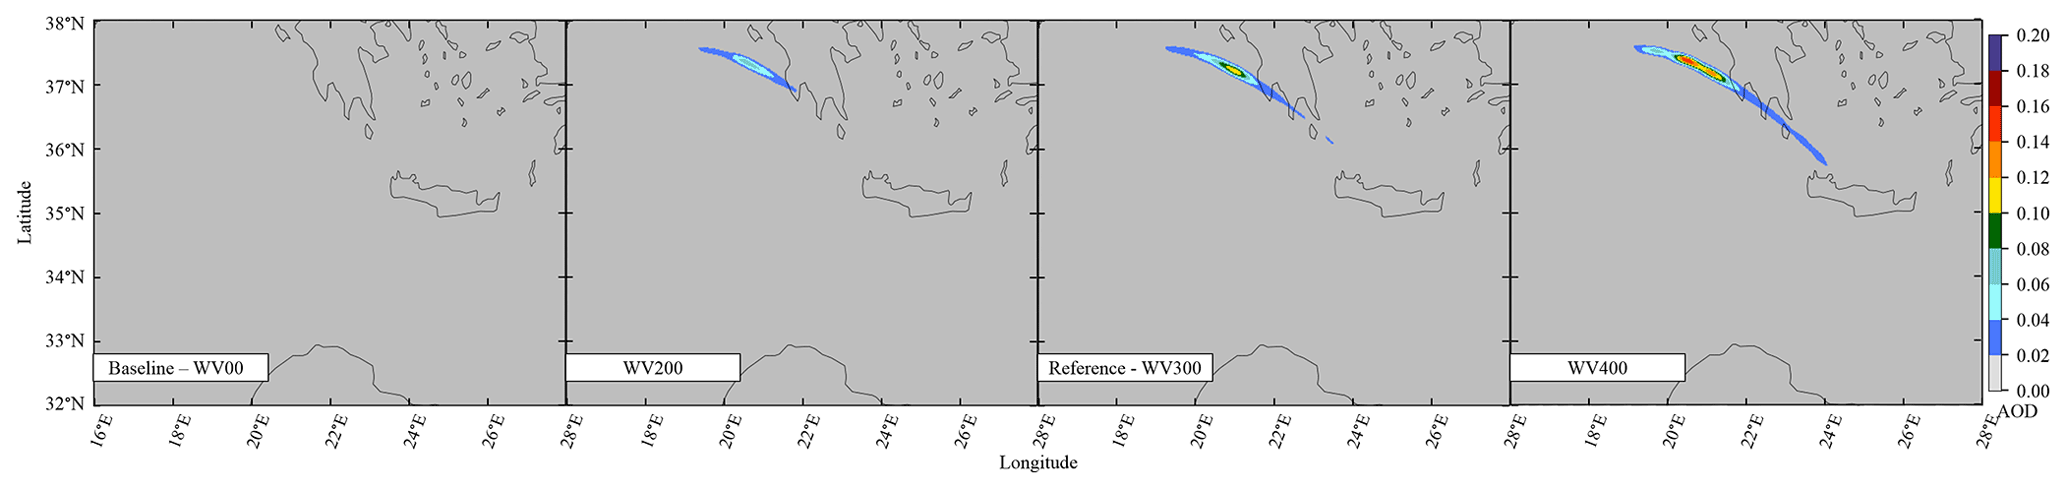
Figure 4The CHIMERE-modelled 200 nm AOD from volcanic sulfates.
3.2 Sensitivity tests for chemistry parameters
In the first group of tests (Table 2), the objective was to estimate the impact of various chemical pathways of SO2 conversion. As mentioned in Sect. 2.6, Background and Dry simulations have also been conducted. For these simulations, as volcanic water is not emitted, supercooled water cannot be formed in the model; therefore, the table has been filled with “Not applicable” for relevant cases (e.g. volcanic clouds). The “No SCLW” simulation is slightly different. In this simulation, volcanic water is emitted, but SCLW is not formed from this water; therefore, only the additional water vapour from the volcanic water is considered in the model chemistry, and only the gaseous pathway is evaluated. The next experiment, labelled “No TMaq” (no transition metals in the aqueous phase) is to evaluate the SO2 conversion into the liquid phase without considering the pathway of oxidation by O2 or catalysation by Fe and Mn; Galeazzo et al. (2018) present this as the main pathway of production. The Reference simulation is considered to be the most realistic simulation performed in this work; in this simulation, SO2 emissions are set to 8.6 kt, H2O emissions are set to 725.6 kt, transition metals emissions are set to 7.4 kt, volcanic supercooled liquid water clouds are activated, the mean injection height is set to 8.0 km and the vertical transport scheme from Després and Lagoutière (1999) is used.
Figure 2 summarises the results of simulations conducted in Table 2. Figure 2 shows the hourly evolution of the volcanic sulfate mass (panel a), the volcanic SCLW (panel b), the minimum volume containing 25 % of mass (panel c) and, consequently, the AOD corresponding to the plume following the volume selection (panel d). It can be seen that, when volcanic water is added (No TM(aq) and Reference simulations), SCLW is formed in the mid-troposphere, which is a necessary element to evaluate aqueous chemistry paths. The Dry simulation allows us to evaluate the production of sulfates from reaction to background OH, which appears to be the main oxidation pathway in our experiment (70 %). The addition of volcanic water vapour without the formation of SCLW did not significantly increase the conversion of SO2 to . The same can be said about the addition of SCLW without transition metals (No TM(aq) simulation). However, the Reference simulation, which includes volcanic transition metals, significantly increases the conversion of SO2 (25 %). This additional formation of is produced in a very small volume containing the volcanic cloud and significantly changes the optical properties of the plume (and eventually the radiative forcing generated), as shown by the evolution of the plume's AOD. The comparison of the simulations conducted to understand the impact of the various chemical pathways has shown that the conversion of SO2 mainly occurs in the gas phase from reaction with ambient OH (70 %) and then as a second pathway from oxidation with O2 catalysed by transition metals in the aqueous phase (25 %).
Our work then focuses on the impact of various volcanic ratios (Table 3). Our Reference case takes a ratio of 1 molecule of SO2 to 300 molecules of H2O emitted, resulting in 725.6 kt of H2O and 8.6 kt of SO2. Two additional cases have been tested with volcanic ratios of and , corresponding to 483.7 and 967.5 kt, and labelled WV200 and WV400 respectively. The aforementioned ratios are considered to be threshold values for paroxysmal eruptions. The water apportionment between its various physical states is displayed in Fig. A4 in the Appendix. Figure 3 summarises the results of simulations conducted in Table 3. As cloud generation is a threshold process, the amount of SCLW from a volcanic eruption is not linearly linked to the volcanic water vapour emissions. In the WV300 scenario, 1.3 kt of SCLW is formed at a peak time interval (around 12 April at 12:00 UTC), compared with 2.9 and 0.5 kt of SCLW in the WV400 and WV200 scenarios respectively. The formation of sulfate with WV400 is 80 % stronger than in the simulation with no volcanic water and 40 % stronger than in the simulation with WV200. This results in an increase in sulfate production; however, this is not a linear process either because the concentrations of SO2 and transition metals are different in the aqueous phase in each of the three cases. Thus, the amount of volcanic water impacts the optical properties of the plume, as the plume's AOD significantly increases following SCLW mass. This aspect is highlighted in the Fig. 4, which displays the AOD spatial distribution and summarises what is shown in Fig. 3c and d for the 200 nm AOD.
Table 4Simulation parameters for sensitivity tests on injection height. Bold items indicate background simulations that are used to retrieve background values. “Volcanic TM” stands for “volcanic transition metals”.
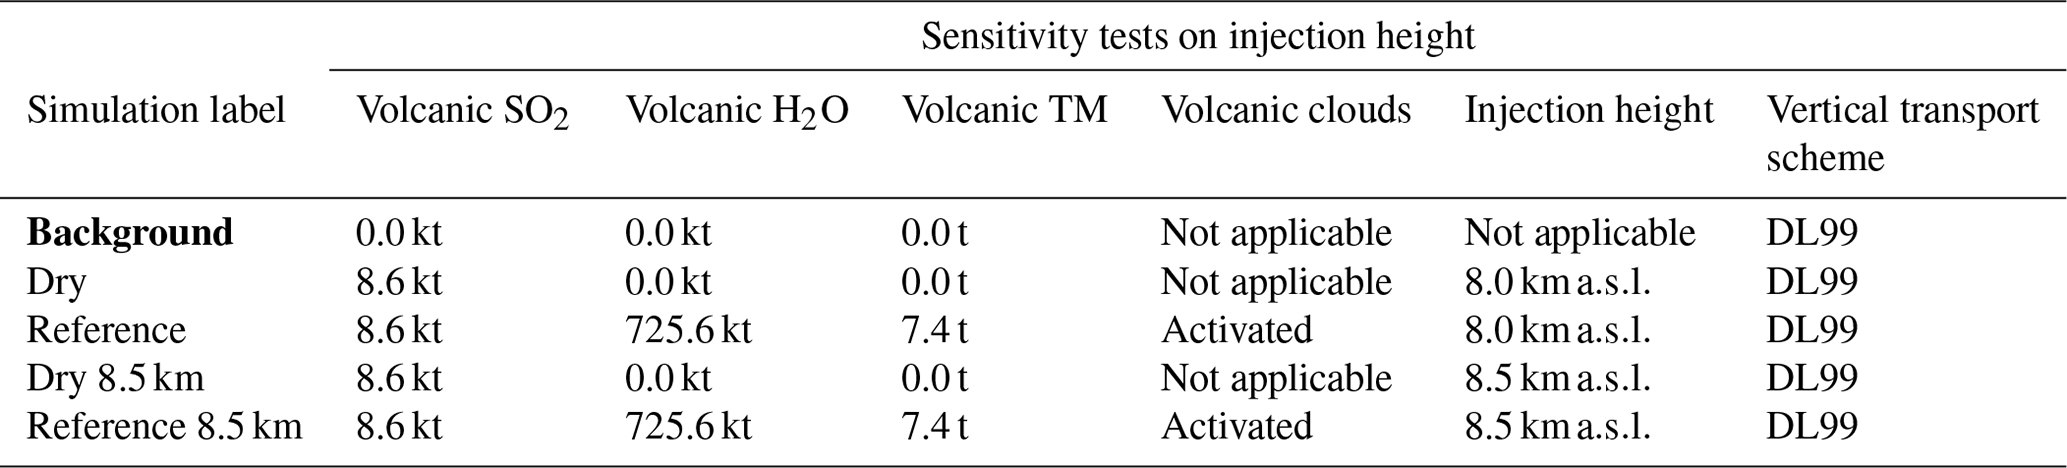
Next, to evaluate the impact of the surrounding environment (Table 4), we have conducted sensitivity tests on the plume's injection height. In our reference simulation, the plume injection is centred around 8.0 . A sensitivity test with the injection centred around 8.5 has been realised. This second test will provide an environment with a lower atmospheric pressure, lower temperature, dryer atmosphere, and different wind speed and direction. Figure 5 summarises the results of the simulations described in Table 4. Comparing the simulations, Dry (8.0 km) and Dry 8.5 km show differences in the results. In the Dry 8.5 km case, less SCLW is generated because of lower humidity, but more SO2 is converted to sulfates. This is explained by the higher diffusion of the plume at higher altitude, as it can be seen that the minimum volume occupied by 25 % of the sulfate mass is bigger than in Dry 8.0 km. Consequently, this higher dispersion allows a more efficient conversion from OH, which is the limiting reactant in the gas-phase oxidation.
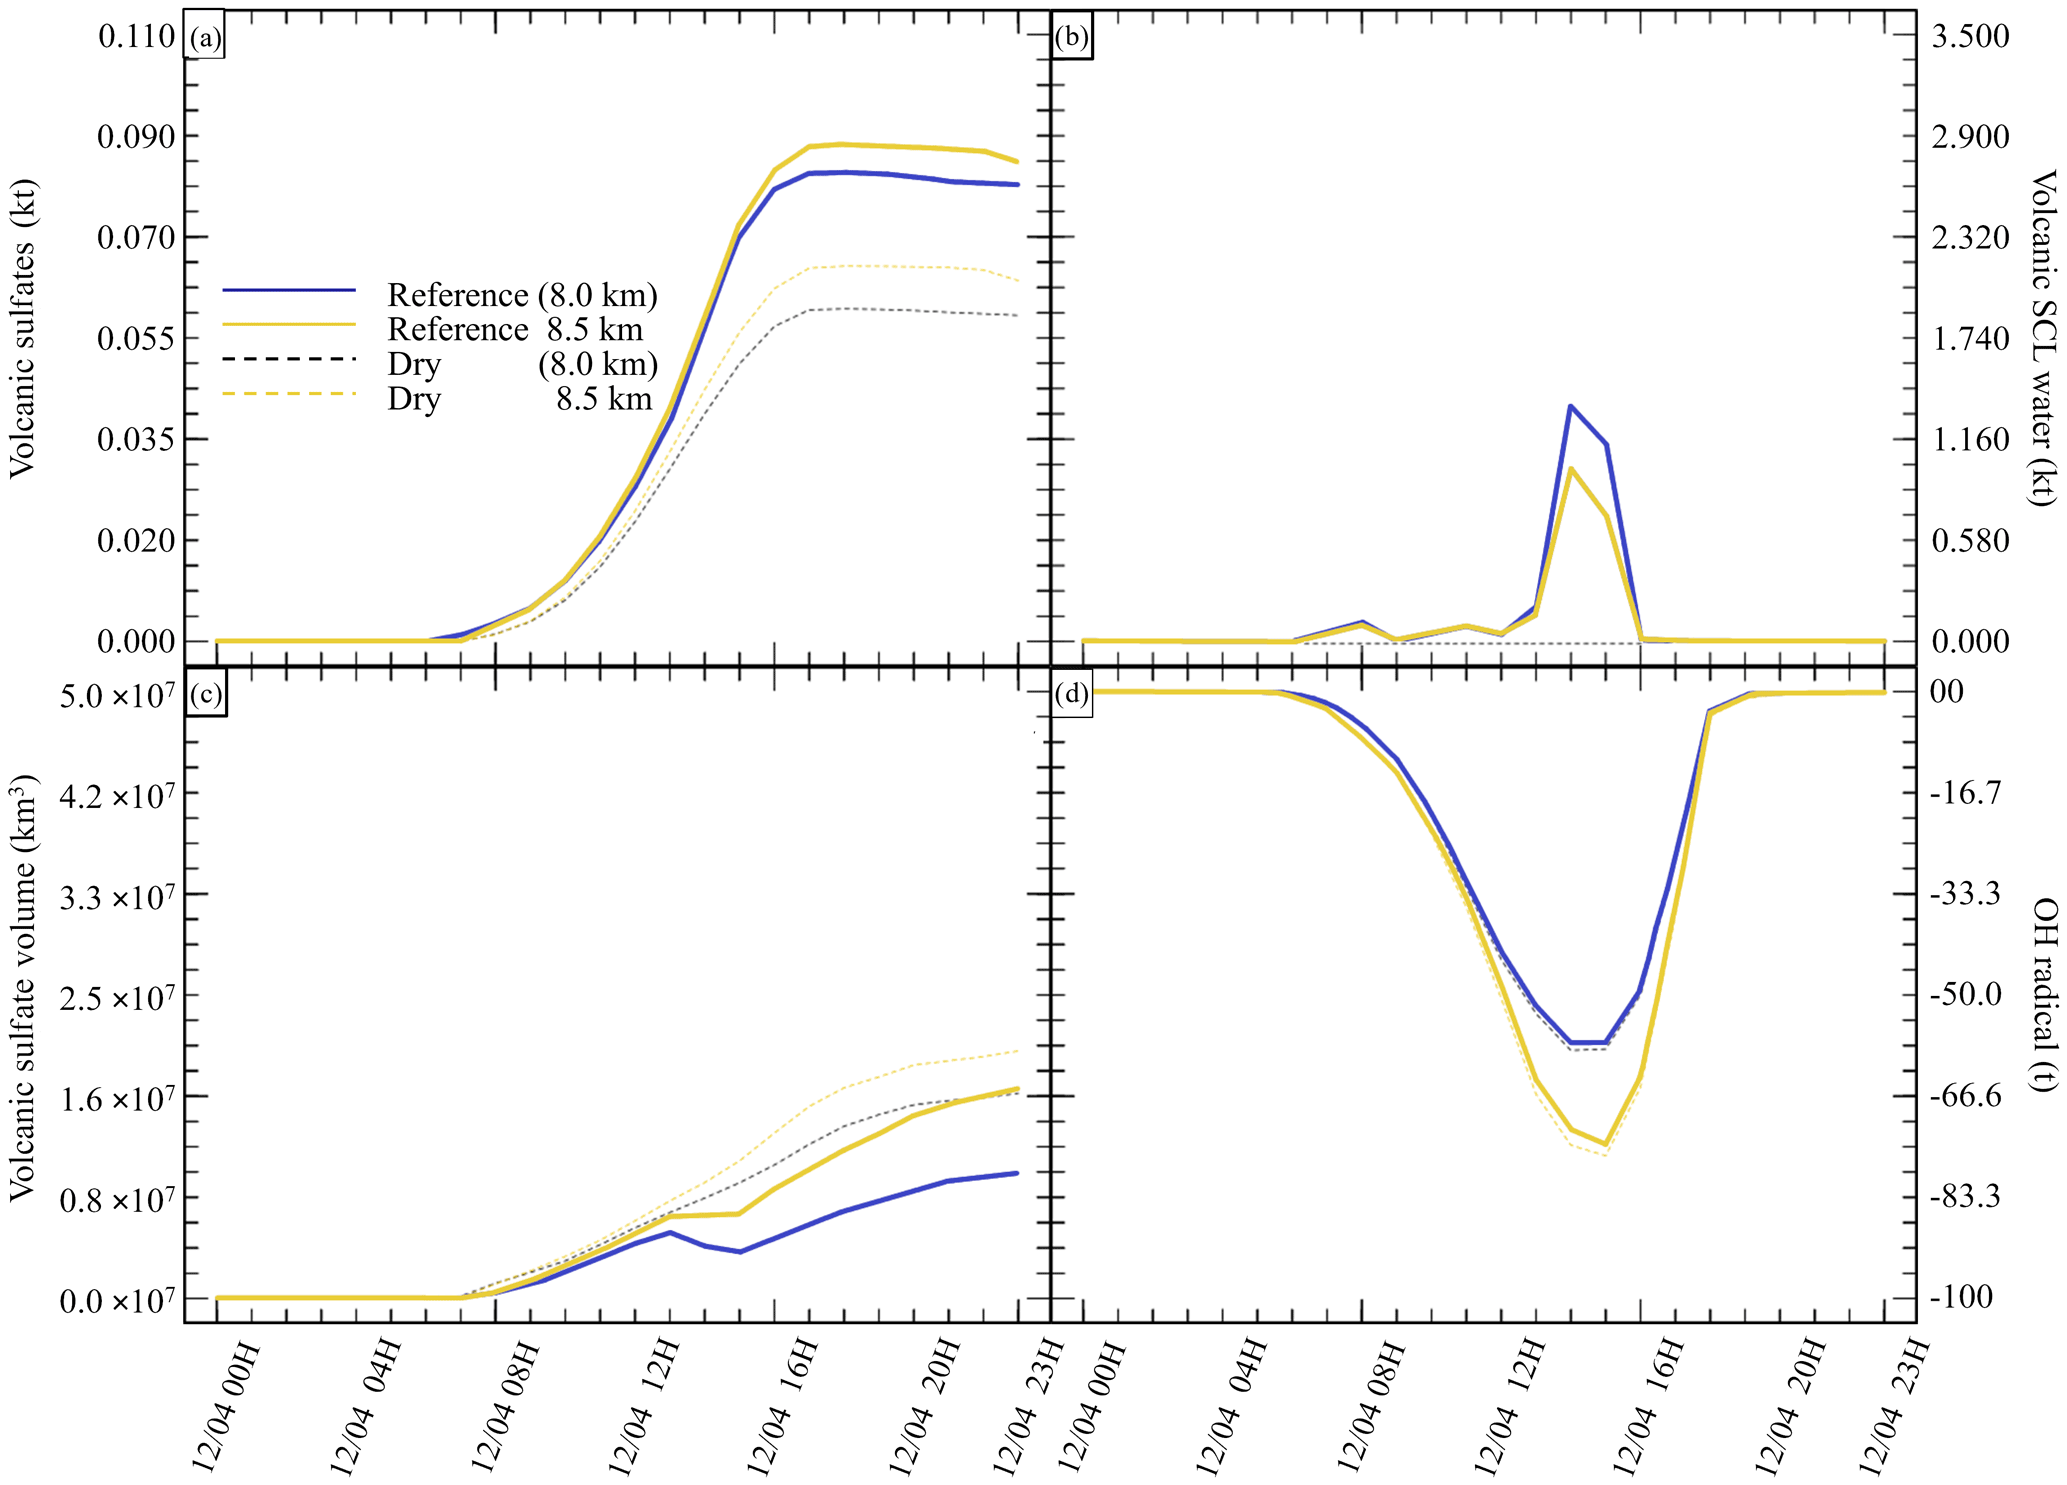
Figure 5Sensitivity tests on injection height for (a) sulfate aerosols (, kt), (b) supercooled liquid water (kt), (c) the minimum volume (km3) ⊂ 25 % of mass and (d) OH radical (t). The Reference simulation is the closest to a realistic case. All time series represent differences relative to the Background simulation (the simulation without volcanic emissions).
Table 5Simulation parameters for sensitivity tests on vertical transport scheme. Bold items indicate background simulations that are used to retrieve background values. “Volcanic TM” stands for “volcanic transition metals”, “Background VL” stands for “background with the Van Leer (1977) advection scheme”, “Dry VL” stands for “dry with the Van Leer (1977) advection scheme”, and “Reference VL” stands for “reference with the Van Leer (1977) advection scheme”.
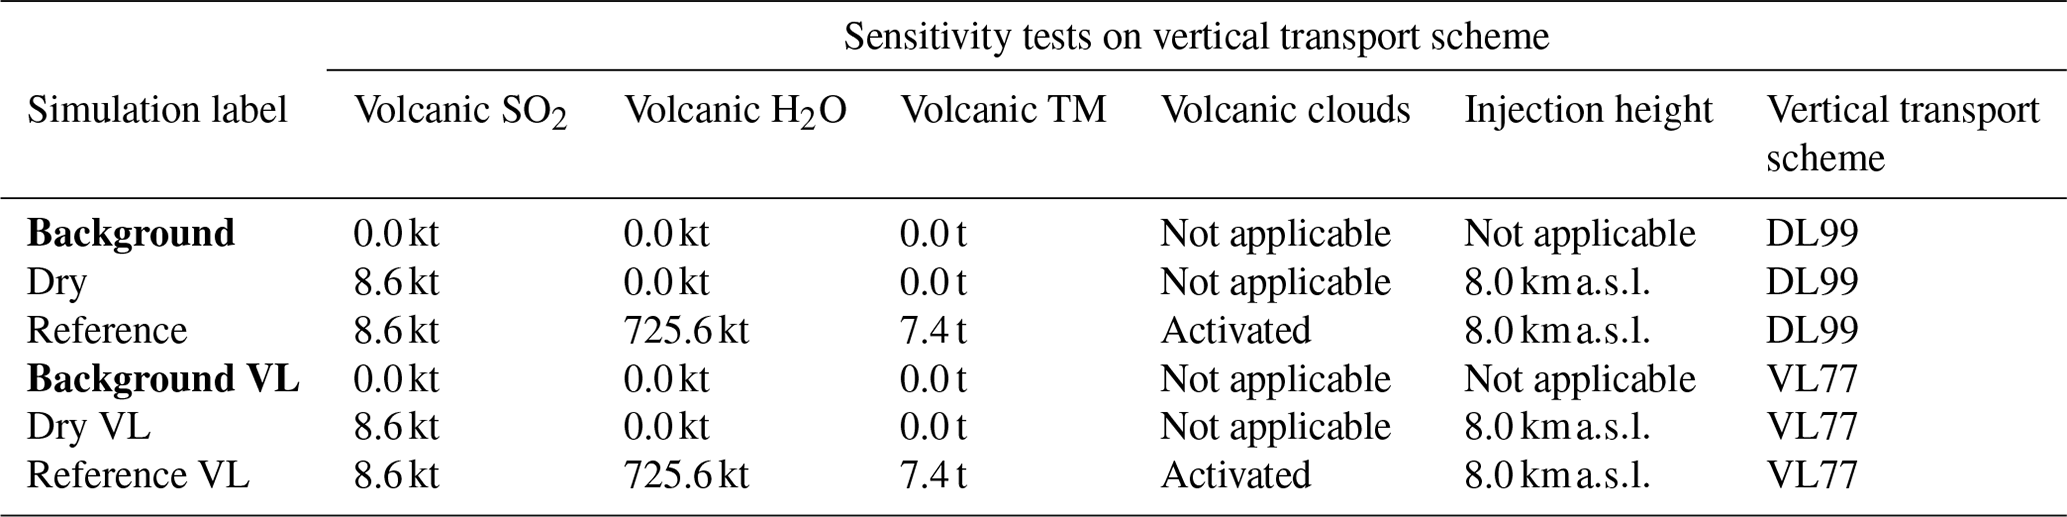

Figure 6Sensitivity tests on injection height for (a) sulfate aerosols (, kt), (b) supercooled liquid water (kt), (c) the minimum volume (km3) ⊂ 25 % of mass and (d) the OH radical (t). The Reference simulation is the closest to a realistic case. All time series represent differences relative to the Background simulation (the simulation without volcanic emissions).
Finally, we investigate the impact of the plume dispersion on the computed chemistry (Table 5). Following the work done in Lachatre et al. (2020b) on different transport schemes, the Reference simulations have been conducted using the Després and Lagoutière (1999) vertical transport scheme (DL99), reducing the excessive plume diffusion that has been observed in previous work (Colette et al., 2011; Boichu et al., 2013; Lachatre et al., 2020a). In comparison, simulations with the Van Leer (1977) (VL77) vertical transport scheme have been conducted; this transport scheme is expected to induce a larger spreading of the volcanic plume. For this last case, it was again necessary to compute a background simulation using the VL77 vertical transport scheme.
Figure 6 summarises the results of the simulations outlined in Table 5. A larger spread of the plume in the sensitivity test with VL77 was expected compared with the Reference simulation using the Després and Lagoutière (1999) vertical advection scheme. Indeed, the volume of the plume significantly increased, as shown in Fig. 6c. Consequently, less SCLW was generated; however, on the other hand, more sulfates were produced. This is due to higher conversion from ambient OH, as it can be seen that more radical has been consumed (Fig. 6d). It can also be noted that the AOD of the Reference VL simulation is lower than that of Reference DL, due to the significantly larger spreading of the Reference VL plume. This result was slightly unexpected, as gaseous oxidation appeared to be linear at first; still, this new observation makes sense because more OH was mobilised to react with the volcanic SO2 in excess.
In this study, we aimed to investigate volcanic plume chemistry in the mid-troposphere region using the CHIMERE CTM. With the assistance of the IASI instrument’s SO2 sounding, we have determined that the CHIMERE model is able to reproduce a realistic structure for the plume as well as a correct intensity in terms of SO2 columns after a number of assumptions were made. Because of these encouraging preliminary observations, we gained confidence in the subsequent results. We have then analysed the impact of various oxidation pathways by selectively shutting down these pathways to evaluate their contribution. For our study case, these sensitivity tests suggest that the main oxidation pathway is gas-phase oxidation by OH (about 70 %), followed by liquid-phase catalysed oxidation by O2 (about 25 %). The fact that liquid-phase oxidation is dominated by transition-metal-catalysed oxidation is in line with the results of Galeazzo et al. (2018), and it confirms that, unlike what typically happens in polluted plumes, the availability of H2O2 in such a volcanic plume rapidly becomes insufficient to substantially contribute to SO2 oxidation. Therefore, our conclusion is that this oxidation pathway should be included in all modelling studies dealing with the aqueous oxidation of volcanic SO2.
We have tested the impact of the ratio using the following four hypotheses: no volcanic water, , and . These tests confirm that, depending on the ratio and on the background atmospheric condition, the presence and quantity of volcanic water vapour potentially has a strong impact on sulfate formation. In our case study, the formation of sulfate with is 80 % stronger than in the simulation with no volcanic water and 40 % stronger than in the simulation with ; therefore, in some cases, such as mid-tropospheric plumes, including volcanic water may be necessary to correctly represent the conversion of volcanic SO2 into sulfate aerosols. Apart from the above-mentioned change in the overall quantity of sulfates formed, the localised formation of a liquid-containing volcanic plume may generate strong maxima in the sulfate AOD (∼ 0.1 in our case study); in contrast, in the case devoid of volcanic water sulfate, the AOD never exceeds ∼ 0.005, which is far from any instrumental detection threshold. These sensitivity tests suggest the strong sensitivity of liquid-phase SO2 oxidation to the injection height of the plume: if the plume is too low, volcanic water input may not be sufficient to reach saturation (due to the warm ambient temperature), but if the plume is too high, temperatures will be too cold to permit the formation of a liquid aqueous phase. Therefore, our conclusion regarding the strong sensitivity of SO2 oxidation to the ratio may hold only for mid-tropospheric plumes, such as the one in our case study. This does not mean that the impact of volcanic water on chemistry is not relevant at higher altitudes; on the contrary, the influence of gas-phase volcanic water vapour may still be of interest in the case of upper-tropospheric or stratospheric plumes, where an additional input of water vapour would enhance the formation of OH.
Apart from the sensitivity to uncertainties concerning the physicochemical processes and the forcings that we have discussed above, representation of SO2 oxidation in volcanic plumes is also sensitive to the discretisation strategies and to the numerical schemes that are used. For example, our sensitivity tests show that reducing excessive numerical diffusion by using an anti-diffusive transport scheme such as Després and Lagoutière (1999) can change the structure of the modelled plume strongly and in a complex way. In our case, reducing diffusion leads to a reduction in total production of sulfates, although with sharper gradients and stronger peaks in concentration and AOD. Due to chemical nonlinearities (e.g. the reduced availability of OH in the plume), reducing numerical diffusion can change the quantitative and qualitative properties of the resulting sulfate plume in a much more subtle way than just spreading the plume over a greater volume, as observed in Lachatre et al. (2020b) for an inert tracer. This confirms that chemistry transport modellers should pay attention to reducing the numerical diffusion in their model, not only because excessive numerical diffusion will affect the spread of the plumes but also, as we have shown here, because it will affect chemistry in a nonlinear way, which in turn affects the AOD and, therefore, the radiative effect of particles.
This study shows the need to better constrain several parameters that we have shown to be crucial in the representation of the chemical behaviour of volcanic plumes in the atmosphere. For example, it is critical to have better observational estimates of the ratio in an eruptive context. We also confirm the box model results of Galeazzo et al. (2018), which suggest that the impact of transition metals in the liquid-phase oxidation of volcanic SO2 is substantial. This highlights the need to better constrain volcanic emissions of Fe(III) and Mn(II) in the atmosphere and their subsequent repartition between volcanic ash and the aqueous phase. As has been shown by Hoshyaripour et al. (2014), emissions of these transition metals can vary greatly among different volcanic environments. Therefore, our results call for better constraints on the quantities of dissolved Fe(III) and Mn(II) in volcanic cloud water via field measurements and further experimental studies. In the case of Mount Etna, this quantification could be performed with more sampling and analyses of their contents in ash and plume samples through the use of passive traps. To be comprehensive, this sampling would have to be done at different distances from the craters, both during passive degassing periods and during eruptions. The present study also highlights the need to find ways to reduce numerical diffusion in chemistry transport models by not only using better numerical strategies, as shown here, but also by examining other approaches such as adaptive mesh refinement in both the horizontal and vertical dimensions.
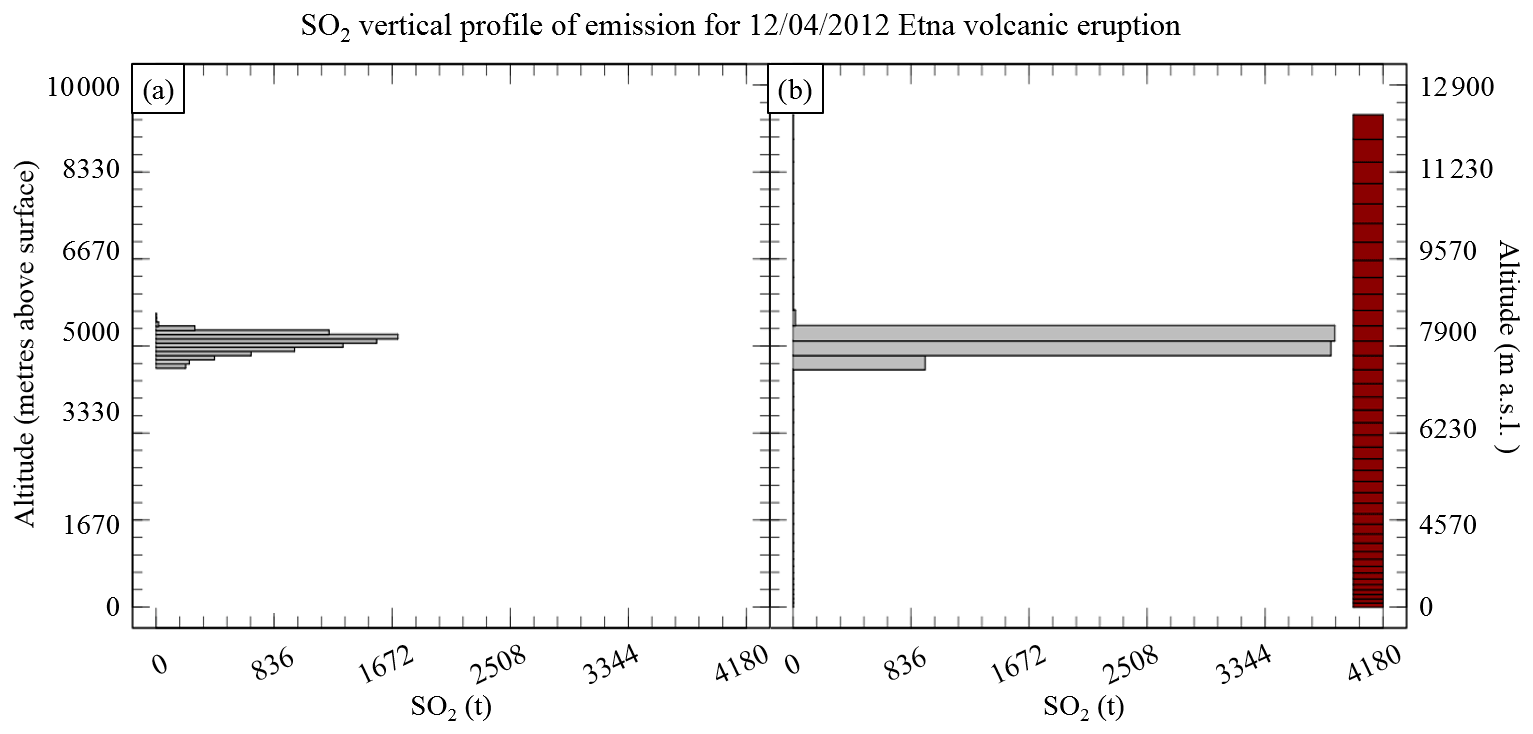
Figure A1The SO2 vertical profile of emission for the 12 April 2012 Mount Etna volcanic eruption showing (a) the emission distribution following a skewed distribution and (b) the emissions in the model after adaptation to the vertical grid used in CHIMERE (shown as red boxes).
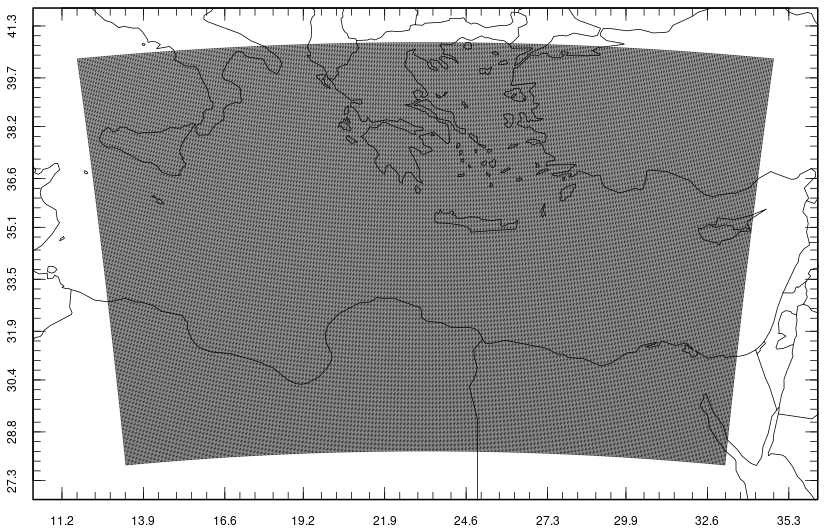
Figure A2The CHIMERE simulation domain contains 874 × 624 cells at a 2.25 km resolution.
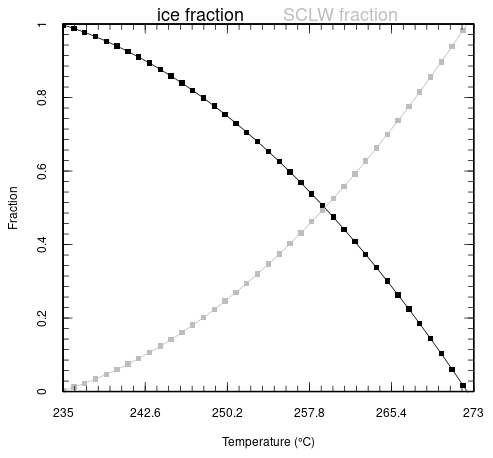
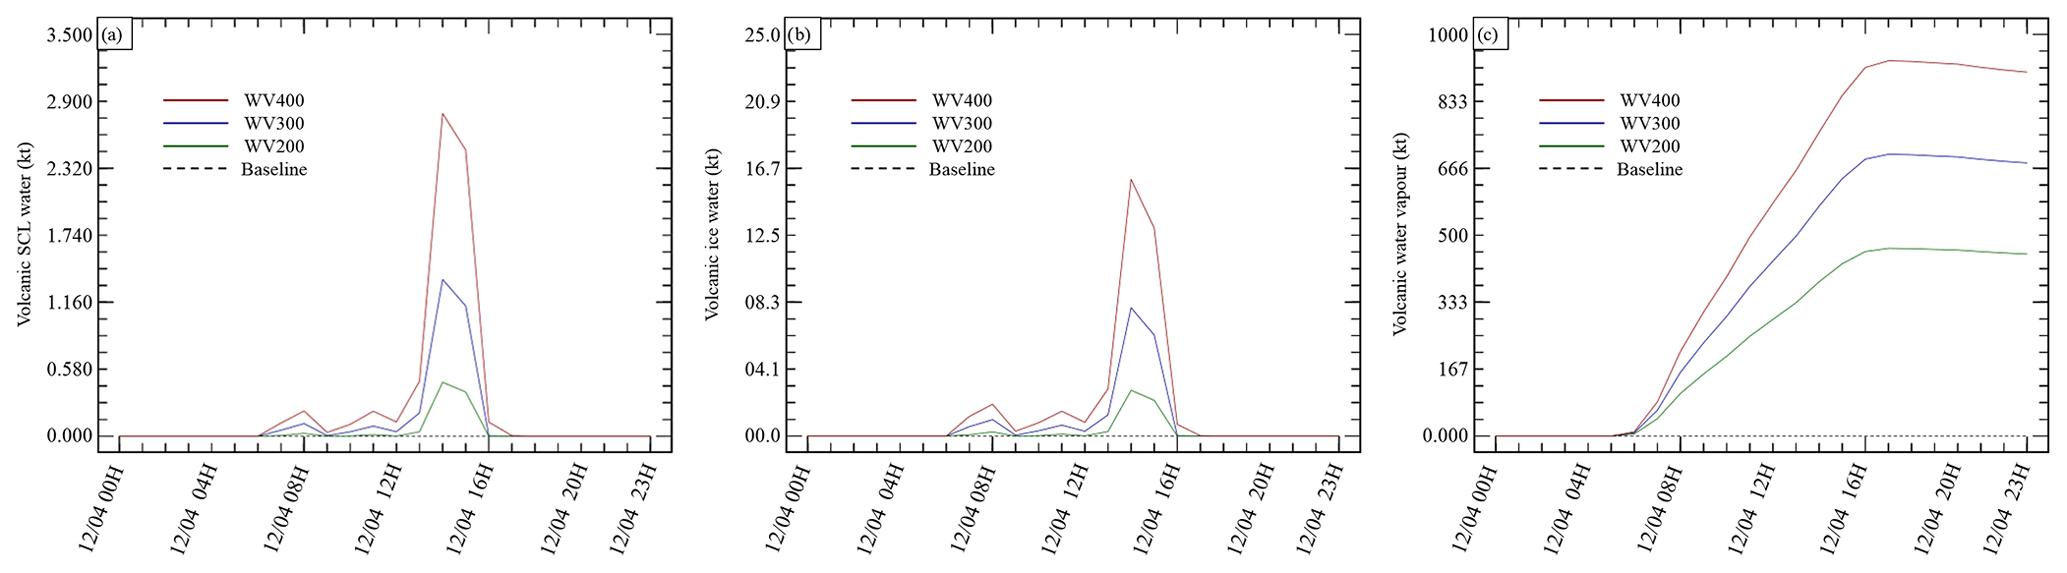
Figure A4Water apportionment between its various states: (a) SCLW, (b) ice and (c) water vapour.
Table A1Synthetic list of the 13 simulations performed in this study and their description.
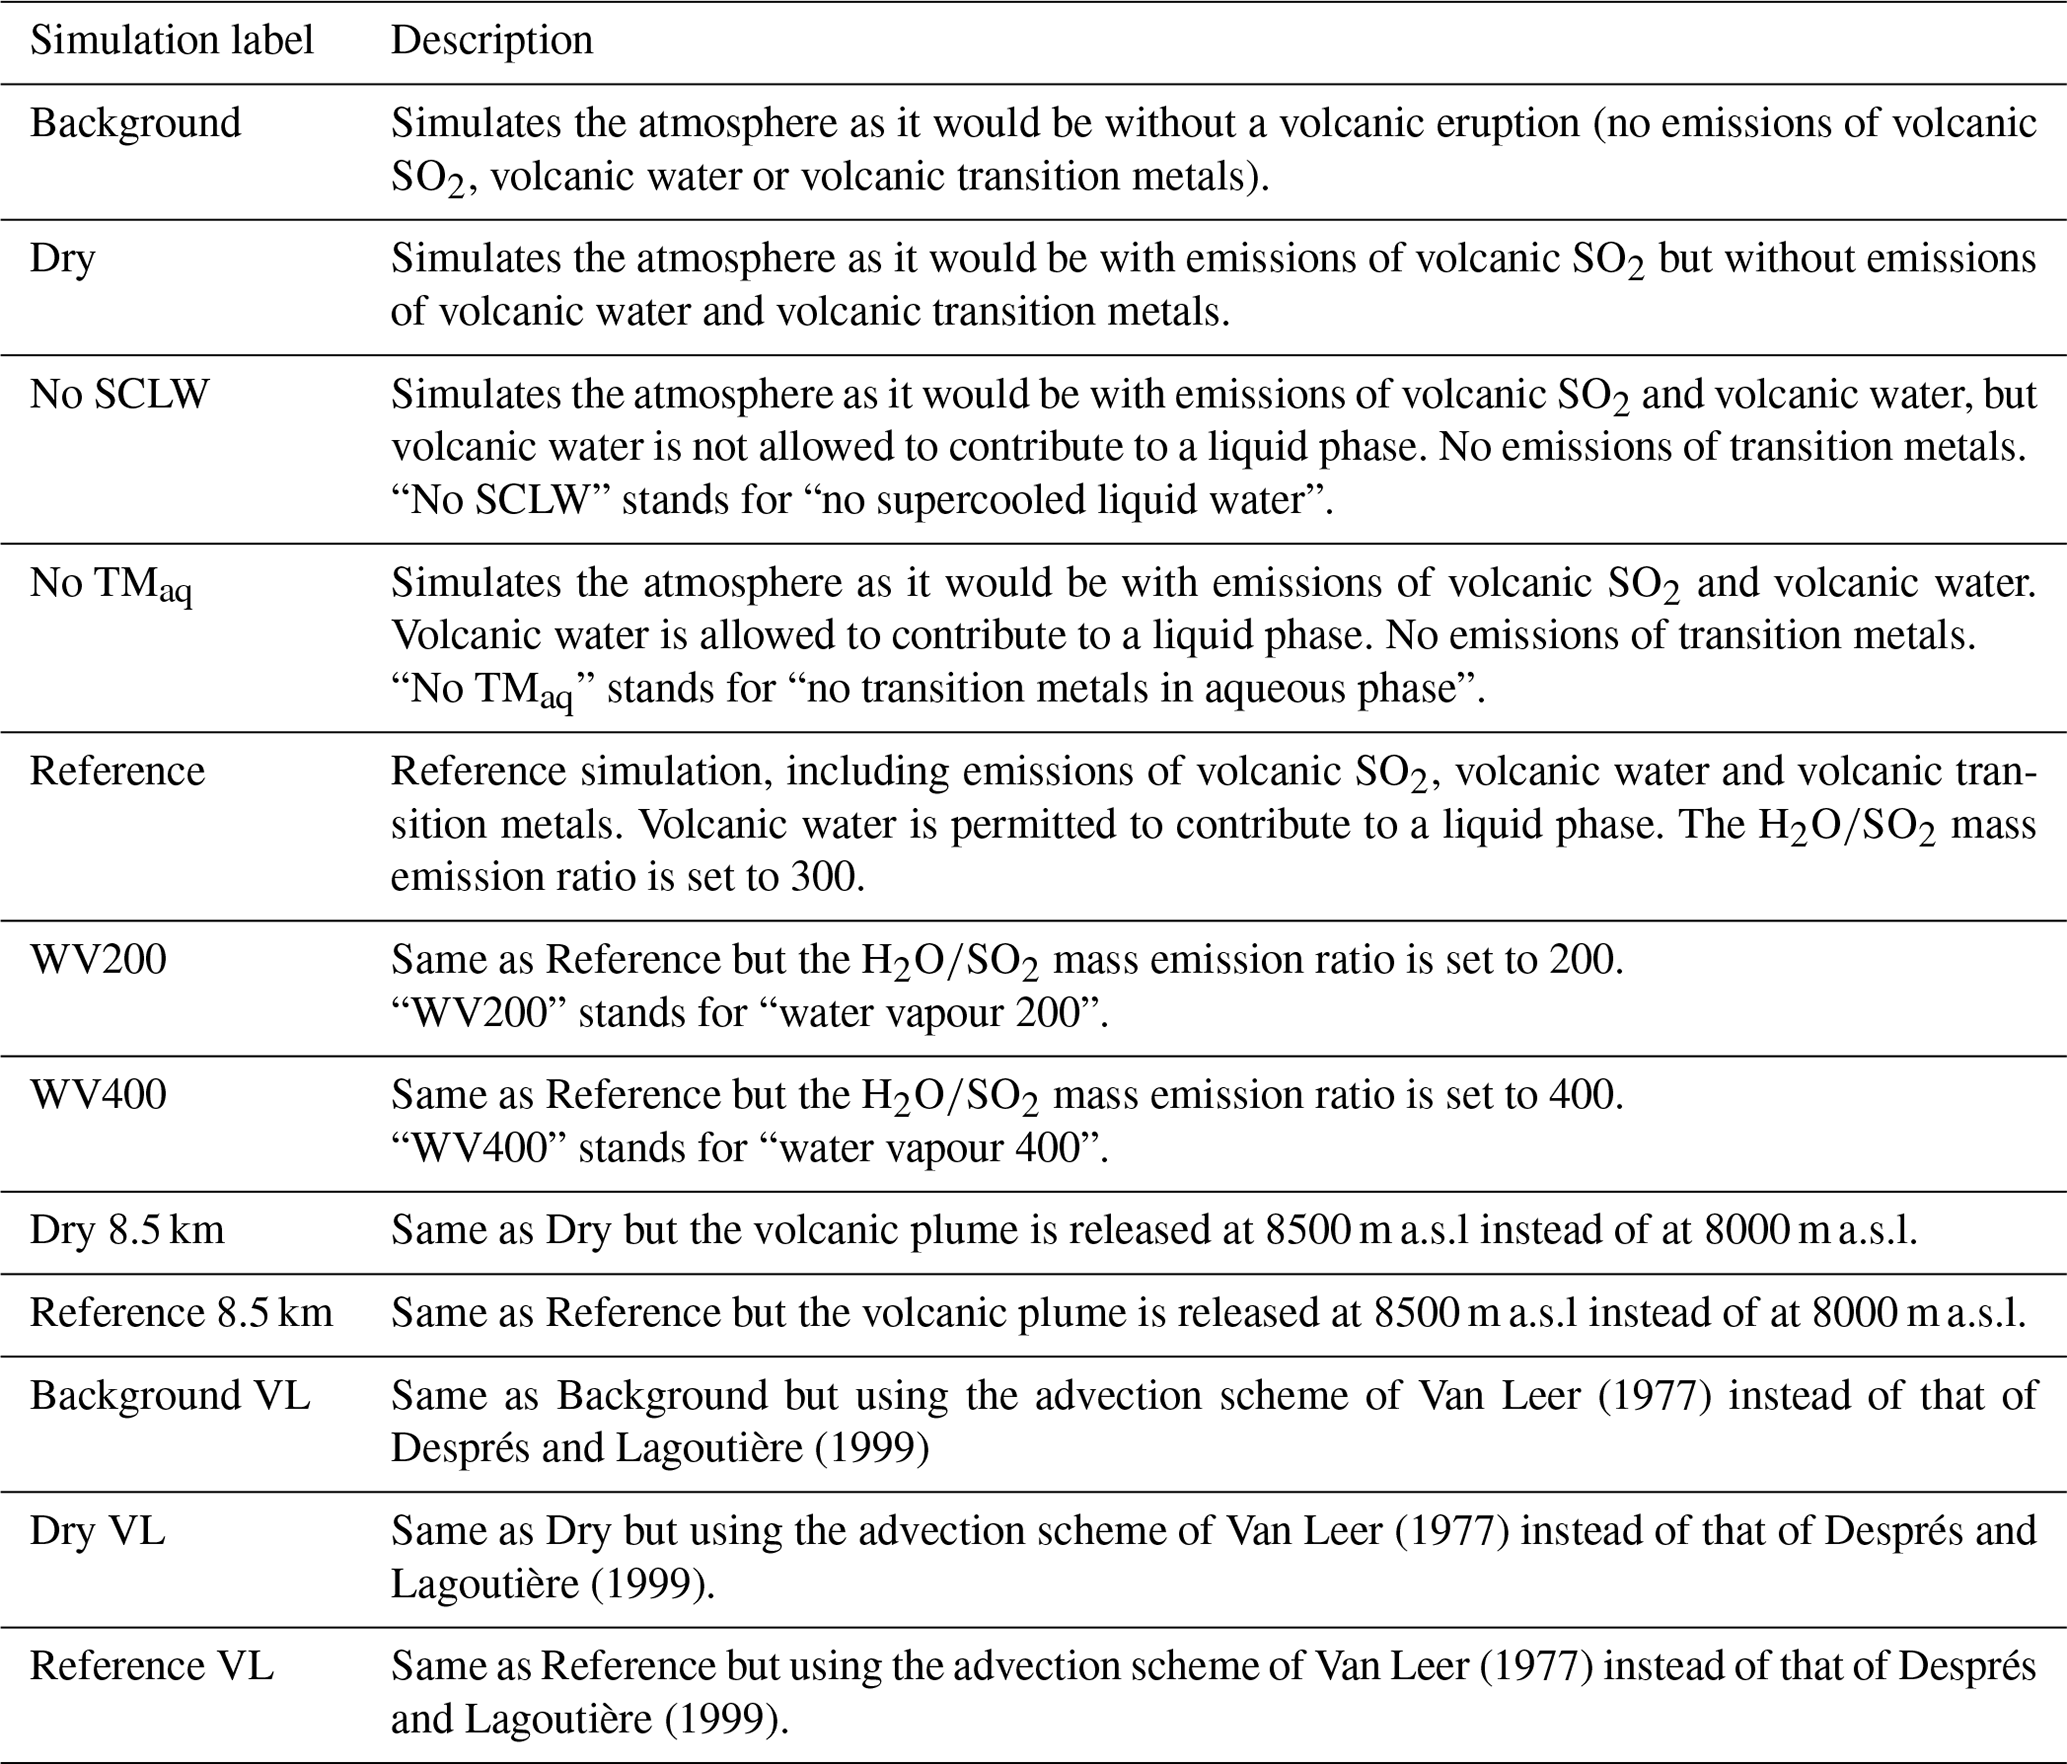
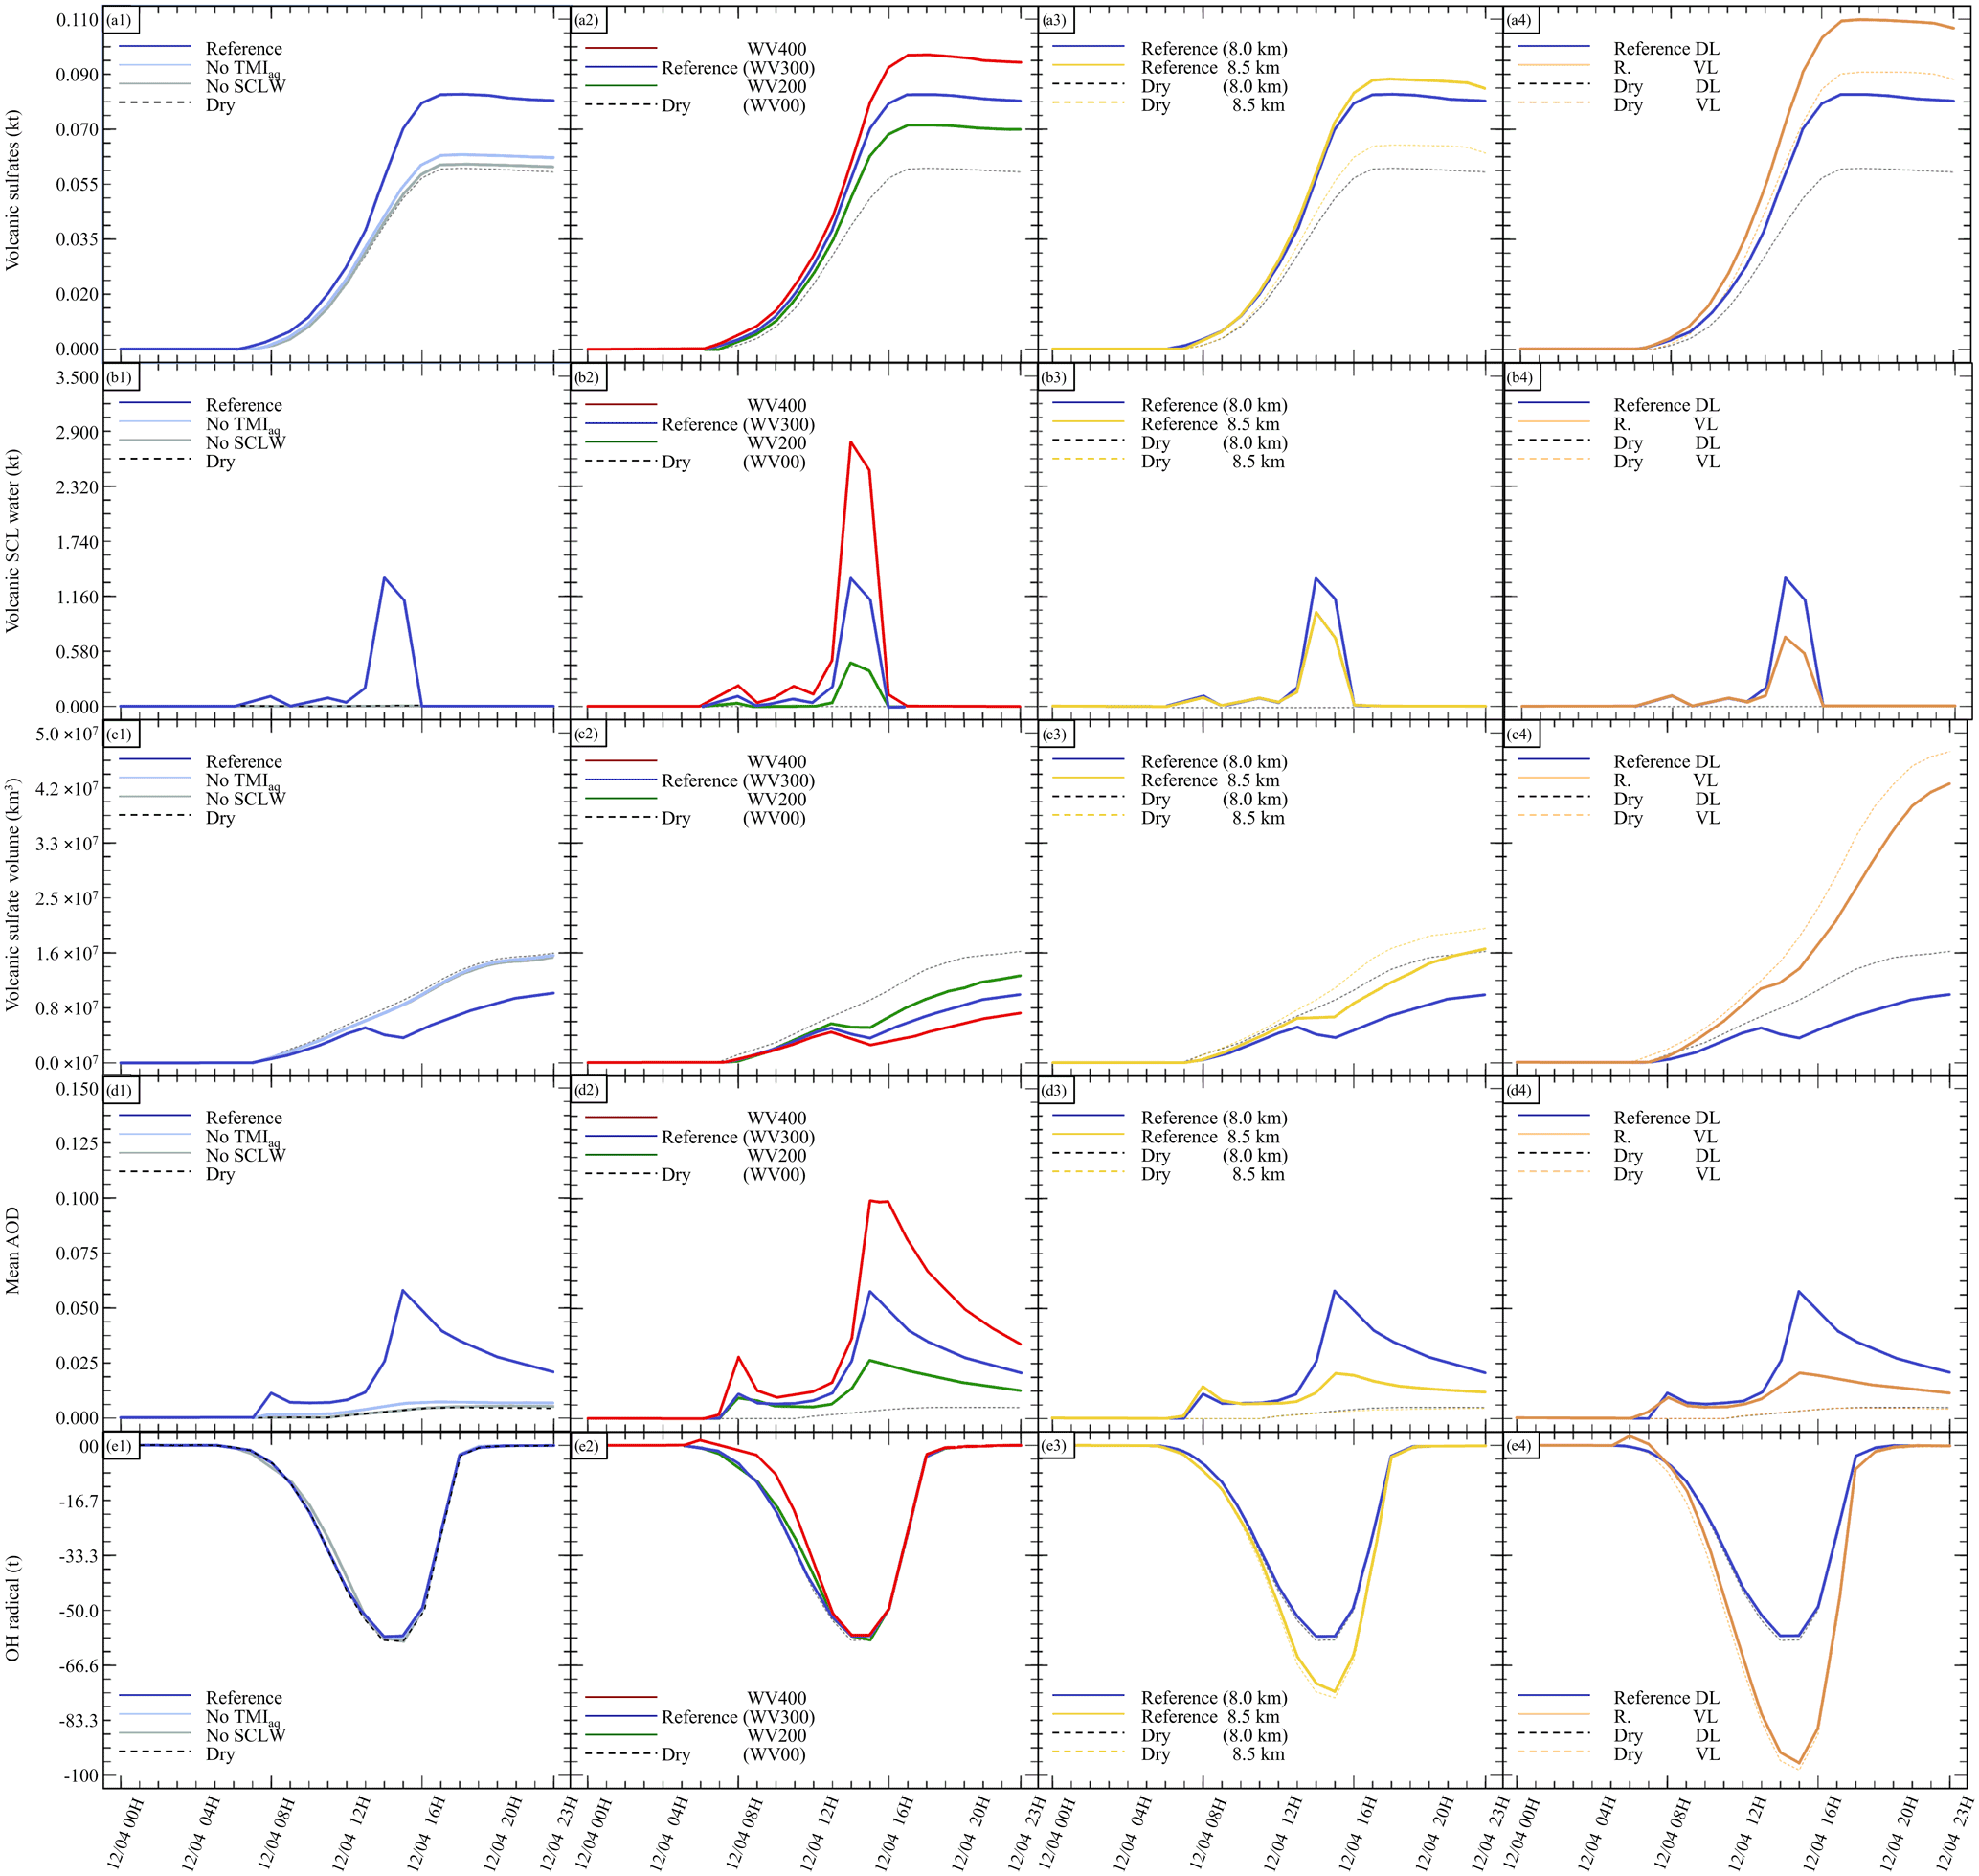
Figure A5Results from the various simulations performed with respect to (a) (kt), (b) supercooled liquid water (kt), (c) the minimum volume (km3) ⊂ 25 % of mass, (d) the AOD for plume ⊂ 25 % of mass and (e) the OH radical (t). The Reference simulation is the closest to a realistic case.
The source code for the CHIMERE model (Mailler et al., 2017) is available from https://www.lmd.polytechnique.fr/chimere/ (last access: 11 October 2022). The WRF source code is available from https://github.com/wrf-model/WRF/ (Skamarock et al., 2008). The daily IASI/Metop-B ULB-LATMOS sulfur dioxide (SO2) L2 product (columns and altitude) are accessible from https://doi.org/10.25326/42 (Clarisse, 2019). SO2 flux measurement data (Salerno et al., 2018) are available from the authors upon request. Simulation outputs are also available from the authors upon request.
All of the authors helped to design the experiments. GS and SG provided the volcanic emissions data. AC prepared the anthropogenic emissions. SM, GS and ML adapted the model. ML carried out the simulations and prepared the results. ML and SM prepared the paper. All authors contributed to the text, the interpretation of the results and reviewed the paper.
The contact author has declared that none of the authors has any competing interests.
Publisher's note: Copernicus Publications remains neutral with regard to jurisdictional claims in published maps and institutional affiliations.
Simulations were performed on the Irene supercomputer within the framework of the GENCI GEN10274 project. This work has been supported by the Programme National de Télédétection Spatiale (PNTS, https://programmes.insu.cnrs.fr/transverse/pnts/, last access: 12 October 2022; grant no. PNTS-2019-9).
This research has been supported by Agence de l'Innovation de Défense (TROMPET grant).
This paper was edited by Joshua Fu and reviewed by two anonymous referees.
Ayris, P. and Delmelle, P.: Volcanic and atmospheric controls on ash iron solubility: A review, Phys. Chem. Earth, 45–46, 103–112, https://doi.org/10.1016/j.pce.2011.04.013, 2012. a, b
Bian, H. and Prather, M. J.: Fast-J2: Accurate Simulation of Stratospheric Photolysis in Global Chemical Models, J. Atmos. Chem., 41, 281–296, https://doi.org/10.1023/A:1014980619462, 2002. a
Boichu, M., Menut, L., Khvorostyanov, D., Clarisse, L., Clerbaux, C., Turquety, S., and Coheur, P.-F.: Inverting for volcanic SO2 flux at high temporal resolution using spaceborne plume imagery and chemistry-transport modelling: the 2010 Eyjafjallajökull eruption case study, Atmos. Chem. Phys., 13, 8569–8584, https://doi.org/10.5194/acp-13-8569-2013, 2013. a
Briant, R., Tuccella, P., Deroubaix, A., Khvorostyanov, D., Menut, L., Mailler, S., and Turquety, S.: Aerosol–radiation interaction modelling using online coupling between the WRF 3.7.1 meteorological model and the CHIMERE 2016 chemistry-transport model, through the OASIS3-MCT coupler, Geosci. Model Dev., 10, 927–944, https://doi.org/10.5194/gmd-10-927-2017, 2017. a
Calabrese, S., Aiuppa, A., Allard, P., Bagnato, E., Bellomo, S., Brusca, L., D’Alessandro, W., and Parello, F.: Atmospheric sources and sinks of volcanogenic elements in a basaltic volcano (Etna, Italy), Geochim. Cosmochim. Ac., 75, 7401–7425, https://doi.org/10.1016/j.gca.2011.09.040, 2011. a
Carboni, E., Grainger, R., Walker, J., Dudhia, A., and Siddans, R.: A new scheme for sulphur dioxide retrieval from IASI measurements: application to the Eyjafjallajökull eruption of April and May 2010, Atmos. Chem. Phys., 12, 11417–11434, https://doi.org/10.5194/acp-12-11417-2012, 2012. a
Carboni, E., Grainger, R. G., Mather, T. A., Pyle, D. M., Thomas, G. E., Siddans, R., Smith, A. J. A., Dudhia, A., Koukouli, M. E., and Balis, D.: The vertical distribution of volcanic SO2 plumes measured by IASI, Atmos. Chem. Phys., 16, 4343–4367, https://doi.org/10.5194/acp-16-4343-2016, 2016. a
Clarisse, L.: The daily IASI/Metop-B ULB-LATMOS sulfur dioxide (SO2) L2 product (columns and altitude), AERIS [data set], https://doi.org/10.25326/42, 2019. a
Clarisse, L., Hurtmans, D., Clerbaux, C., Hadji-Lazaro, J., Ngadi, Y., and Coheur, P.-F.: Retrieval of sulphur dioxide from the infrared atmospheric sounding interferometer (IASI), Atmos. Meas. Tech., 5, 581–594, https://doi.org/10.5194/amt-5-581-2012, 2012. a
Clarisse, L., Coheur, P.-F., Theys, N., Hurtmans, D., and Clerbaux, C.: The 2011 Nabro eruption, a SO2 plume height analysis using IASI measurements, Atmos. Chem. Phys., 14, 3095–3111, https://doi.org/10.5194/acp-14-3095-2014, 2014. a
Colette, A., Favez, O., Meleux, F., Chiappini, L., Haeffelin, M., Morille, Y., Malherbe, L., Papin, A., Bessagnet, B., Menut, L., Leoz, E., and Rouïl, L.: Assessing in near real time the impact of the April 2010 Eyjafjallajokull ash plume on air quality, Atmos. Environ., 45, 1217–1221, https://doi.org/10.1016/j.atmosenv.2010.09.064, 2011. a
Connick, R. E. and Zhang, Y.-X.: Kinetics and Mechanism of the Oxidation of HSO by O2. 2. The Manganese(II)-Catalyzed Reaction, Inorg. Chem., 35, 4613–4621, https://doi.org/10.1021/ic951141i, 1996. a
Derognat, C., Beekmann, M., Baeumle, M., Martin, D., and Schmidt, H.: Effect of biogenic volatile organic compound emissions on tropospheric chemistry during the Atmospheric Pollution Over the Paris Area (ESQUIF) campaign in the Ile-de-France region, J. Geophys. Res.-Atmos., 108, 8560, https://doi.org/10.1029/2001JD001421, 2003. a
Desboeufs, K., Losno, R., and Colin, J.: Factors influencing aerosol solubility during cloud processes, Atmos. Environ., 35, 3529–3537, https://doi.org/10.1016/S1352-2310(00)00472-6, 2001. a
Després, B. and Lagoutière, F.: Un schéma non linéaire anti-dissipatif pour l'équation d'advection linéaire, CR Acad. Sci. I-Math., 328, 939–943, https://doi.org/10.1016/S0764-4442(99)80301-2, 1999. a, b, c, d, e, f, g, h
Eckhardt, S., Prata, A. J., Seibert, P., Stebel, K., and Stohl, A.: Estimation of the vertical profile of sulfur dioxide injection into the atmosphere by a volcanic eruption using satellite column measurements and inverse transport modeling, Atmos. Chem. Phys., 8, 3881–3897, https://doi.org/10.5194/acp-8-3881-2008, 2008. a
Galeazzo, T., Bekki, S., Martin, E., Savarino, J., and Arnold, S. R.: Photochemical box modelling of volcanic SO2 oxidation: isotopic constraints, Atmos. Chem. Phys., 18, 17909–17931, https://doi.org/10.5194/acp-18-17909-2018, 2018. a, b, c, d, e, f
Ginoux, P., Chin, M., Tegen, I., Prospero, J. M., Holben, B., Dubovik, O., and Lin, S.: Sources and distributions of dust aerosols simulated with the GOCART model, J. Geophys. Res.-Atmos., 106, 20255– 20273, https://doi.org/10.1029/2000JD000053, 2001. a
Guermazi, H., Sellitto, P., Cuesta, J., Eremenko, M., Lachatre, M., Mailler, S., Carboni, E., Salerno, G., Caltabiano, T., Menut, L., Serbaji, M. M., Rekhiss, F., and Legras, B.: Quantitative Retrieval of Volcanic Sulphate Aerosols from IASI Observations, Remote Sens., 13, 1808, https://doi.org/10.3390/rs13091808, 2021. a
Hauglustaine, D. A., Hourdin, F., Jourdain, L., Filiberti, M.-A., Walters, S., Lamarque, J.-F., and Holland, E. A.: Interactive chemistry in the Laboratoire de Météorologie Dynamique general circulation model: Description and background tropospheric chemistry evaluation, J. Geophys. Res.-Atmos., 109, D04314, https://doi.org/10.1029/2003JD003957, 2004. a
Heard, I. P. C., Manning, A. J., Haywood, J. M., Witham, C., Redington, A., Jones, A., Clarisse, L., and Bourassa, A.: A comparison of atmospheric dispersion model predictions with observations of SO2 and sulphate aerosol from volcanic eruptions, J. Geophys. Res.-Atmos., 117, D00U22, https://doi.org/10.1029/2011JD016791, 2012. a
Hoshyaripour, G., Hort, M., Langmann, B., and Delmelle, P.: Volcanic controls on ash iron solubility: New insights from high-temperature gas–ash interaction modeling, J. Volcanol. Geoth. Res., 286, 67–77, https://doi.org/10.1016/j.jvolgeores.2014.09.005, 2014. a, b, c
Hoshyaripour, G. A., Hort, M., and Langmann, B.: Ash iron mobilization through physicochemical processing in volcanic eruption plumes: a numerical modeling approach, Atmos. Chem. Phys., 15, 9361–9379, https://doi.org/10.5194/acp-15-9361-2015, 2015. a, b
Hu, Y., Rodier, S., Xu, K., Sun, W., Huang, J., Lin, B., Zhai, P., and Josset, D.: Occurrence, liquid water content, and fraction of supercooled water clouds from combined CALIOP/IIR/MODIS measurements, J. Geophys. Res.-Atmos., 115, D00H34, https://doi.org/10.1029/2009JD012384, 2010. a
Itahashi, S., Mathur, R., Hogrefe, C., Napelenok, S. L., and Zhang, Y.: Incorporation of volcanic SO2 emissions in the Hemispheric CMAQ (H-CMAQ) version 5.2 modeling system and assessing their impacts on sulfate aerosol over the Northern Hemisphere, Geosci. Model Dev., 14, 5751–5768, https://doi.org/10.5194/gmd-14-5751-2021, 2021. a
Janssens-Maenhout, G., Crippa, M., Guizzardi, D., Dentener, F., Muntean, M., Pouliot, G., Keating, T., Zhang, Q., Kurokawa, J., Wankmüller, R., Denier van der Gon, H., Kuenen, J. J. P., Klimont, Z., Frost, G., Darras, S., Koffi, B., and Li, M.: HTAP_v2.2: a mosaic of regional and global emission grid maps for 2008 and 2010 to study hemispheric transport of air pollution, Atmos. Chem. Phys., 15, 11411–11432, https://doi.org/10.5194/acp-15-11411-2015, 2015. a
Jourdain, L., Roberts, T. J., Pirre, M., and Josse, B.: Modeling the reactive halogen plume from Ambrym and its impact on the troposphere with the CCATT-BRAMS mesoscale model, Atmos. Chem. Phys., 16, 12099–12125, https://doi.org/10.5194/acp-16-12099-2016, 2016. a
Kärcher, B. and Seifert, A.: On homogeneous ice formation in liquid clouds, Q. J. Roy. Meteorol. Soc., 142, 1320–1334, https://doi.org/10.1002/qj.2735, 2016. a
Kloss, C., Berthet, G., Sellitto, P., Ploeger, F., Taha, G., Tidiga, M., Eremenko, M., Bossolasco, A., Jégou, F., Renard, J.-B., and Legras, B.: Stratospheric aerosol layer perturbation caused by the 2019 Raikoke and Ulawun eruptions and their radiative forcing, Atmos. Chem. Phys., 21, 535–560, https://doi.org/10.5194/acp-21-535-2021, 2021. a
Komurcu, M., Storelvmo, T., Tan, I., Lohmann, U., Yun, Y., Penner, J. E., Wang, Y., Liu, X., and Takemura, T.: Intercomparison of the cloud water phase among global climate models, J. Geophys. Res.-Atmos., 119, 3372–3400, https://doi.org/10.1002/2013JD021119, 2014. a
Lachatre, M., Foret, G., Laurent, B., Siour, G., Cuesta, J., Dufour, G., Meng, F., Tang, W., Zhang, Q., and Beekmann, M.: Air Quality Degradation by Mineral Dust over Beijing, Chengdu and Shanghai Chinese Megacities, Atmosphere, 11, 708, https://doi.org/10.3390/atmos11070708, 2020a. a
Lachatre, M., Mailler, S., Menut, L., Turquety, S., Sellitto, P., Guermazi, H., Salerno, G., Caltabiano, T., and Carboni, E.: New strategies for vertical transport in chemistry transport models: application to the case of the Mount Etna eruption on 18 March 2012 with CHIMERE v2017r4, Geosci. Model Dev., 13, 5707–5723, https://doi.org/10.5194/gmd-13-5707-2020, 2020b. a, b, c, d, e, f
Lagrange, J., Pallares, C., and Lagrange, P.: Electrolyte effects on aqueous atmospheric oxidation of sulphur dioxide by ozone, J. Geophys. Res.-Atmos., 99, 14595–14600, https://doi.org/10.1029/94JD00573, 1994. a
Langmann, B.: On the Role of Climate Forcing by Volcanic Sulphate and Volcanic Ash, Adv. Meteorol., 2014, 340123, https://doi.org/10.1155/2014/340123, 2014. a
Mailler, S., Menut, L., di Sarra, A. G., Becagli, S., Di Iorio, T., Bessagnet, B., Briant, R., Formenti, P., Doussin, J.-F., Gómez-Amo, J. L., Mallet, M., Rea, G., Siour, G., Sferlazzo, D. M., Traversi, R., Udisti, R., and Turquety, S.: On the radiative impact of aerosols on photolysis rates: comparison of simulations and observations in the Lampedusa island during the ChArMEx/ADRIMED campaign, Atmos. Chem. Phys., 16, 1219–1244, https://doi.org/10.5194/acp-16-1219-2016, 2016. a
Mailler, S., Menut, L., Khvorostyanov, D., Valari, M., Couvidat, F., Siour, G., Turquety, S., Briant, R., Tuccella, P., Bessagnet, B., Colette, A., Létinois, L., Markakis, K., and Meleux, F.: CHIMERE-2017: from urban to hemispheric chemistry-transport modeling, Geosci. Model Dev., 10, 2397–2423, https://doi.org/10.5194/gmd-10-2397-2017, 2017. a, b, c
Mailler, S., Pennel, R., Menut, L., and Lachâtre, M.: Using the Després and Lagoutière (1999) antidiffusive transport scheme: a promising and novel method against excessive vertical diffusion in chemistry-transport models, Geosci. Model Dev., 14, 2221–2233, https://doi.org/10.5194/gmd-14-2221-2021, 2021. a
Mastin, L., Guffanti, M., Servranckx, R., Webley, P., Barsotti, S., Dean, K., Durant, A., Ewert, J., Neri, A., Rose, W., Schneider, D., Siebert, L., Stunder, B., Swanson, G., Tupper, A., Volentik, A., and Waythomas, C.: A multidisciplinary effort to assign realistic source parameters to models of volcanic ash-cloud transport and dispersion during eruptions, J. Volcanol. Geoth. Res., 186, 10–21, https://doi.org/10.1016/j.jvolgeores.2009.01.008, 2009. a
Maters, E. C., Delmelle, P., and Bonneville, S.: Atmospheric Processing of Volcanic Glass: Effects on Iron Solubility and Redox Speciation, Environ. Sci. Technol., 50, 5033–5040, https://doi.org/10.1021/acs.est.5b06281, 2016. a
Maters, E. C., Delmelle, P., and Gunnlaugsson, H. P.: Controls on iron mobilisation from volcanic ash at low pH: Insights from dissolution experiments and Mössbauer spectroscopy, Chem. Geol., 449, 73–81, https://doi.org/10.1016/j.chemgeo.2016.11.036, 2017. a, b
Menut, L., Bessagnet, B., Khvorostyanov, D., Beekmann, M., Blond, N., Colette, A., Coll, I., Curci, G., Foret, G., Hodzic, A., Mailler, S., Meleux, F., Monge, J.-L., Pison, I., Siour, G., Turquety, S., Valari, M., Vautard, R., and Vivanco, M. G.: CHIMERE 2013: a model for regional atmospheric composition modelling, Geosci. Model Dev., 6, 981–1028, https://doi.org/10.5194/gmd-6-981-2013, 2013. a
Menut, L., Bessagnet, B., Briant, R., Cholakian, A., Couvidat, F., Mailler, S., Pennel, R., Siour, G., Tuccella, P., Turquety, S., and Valari, M.: The CHIMERE v2020r1 online chemistry-transport model, Geosci. Model Dev., 14, 6781–6811, https://doi.org/10.5194/gmd-14-6781-2021, 2021. a, b
NCEP: NCEP GFS 0.25 Degree Global Forecast Grids Historical Archive, Research Data Archive at the National Center for Atmospheric Research [data set], https://doi.org/10.5065/D65D8PWK, 2015. a
Pattantyus, A. K., Businger, S., and Howell, S. G.: Review of sulfur dioxide to sulfate aerosol chemistry at Kilauea Volcano, Hawaii, Atmos. Environ., 185, 262–271, https://doi.org/10.1016/j.atmosenv.2018.04.055, 2018. a, b, c, d
Pianezze, J., Tulet, P., Foucart, B., Leriche, M., Liuzzo, M., Salerno, G., Colomb, A., Freney, E., and Sellegri, K.: Volcanic Plume Aging During Passive Degassing and Low Eruptive Events of Etna and Stromboli Volcanoes, J. Geophys. Res.-Atmos., 124, 11389–11405, https://doi.org/10.1029/2019JD031122, 2019. a
Pollack, J. B., Toon, O. B., Danielsen, E. F., Hofmann, D. J., and Rosen, J. M.: The El Chichon volcanic cloud: An introduction, Geophys. Res. Lett., 10, 989–992, https://doi.org/10.1029/GL010i011p00989, 1983. a
Roberts, T., Dayma, G., and Oppenheimer, C.: Reaction Rates Control High-Temperature Chemistry of Volcanic Gases in Air, Front. Earth Sci., 7, 154, https://doi.org/10.3389/feart.2019.00154, 2019. a
Sahyoun, M., Freney, E., Brito, J., Duplissy, J., Gouhier, M., Colomb, A., Dupuy, R., Bourianne, T., Nowak, J. B., Yan, C., Petäjä, T., Kulmala, M., Schwarzenboeck, A., Planche, C., and Sellegri, K.: Evidence of New Particle Formation Within Etna and Stromboli Volcanic Plumes and Its Parameterization From Airborne In Situ Measurements, J. Geophys. Res.-Atmos., 124, 5650–5668, https://doi.org/10.1029/2018JD028882, 2019. a
Salerno, G., Burton, M., Oppenheimer, C., Caltabiano, T., Randazzo, D., Bruno, N., and Longo, V.: Three-years of SO2 flux measurements of Mt. Etna using an automated UV scanner array: Comparison with conventional traverses and uncertainties in flux retrieval, J. Volcanol. Geoth. Res., 183, 76–83, https://doi.org/10.1016/j.jvolgeores.2009.02.013, 2009. a
Salerno, G. G., Burton, M., Di Grazia, G., Caltabiano, T., and Oppenheimer, C.: Coupling Between Magmatic Degassing and Volcanic Tremor in Basaltic Volcanism, Front. Earth Sci., 6, 157, https://doi.org/10.3389/feart.2018.00157, 2018. a, b
Sander, R.: Compilation of Henry's law constants (version 4.0) for water as solvent, Atmos. Chem. Phys., 15, 4399–4981, https://doi.org/10.5194/acp-15-4399-2015, 2015. a
Seinfeld, J. H. and Pandis, S. N.: ATMOSPHERIC From Air Pollution to Climate Change Second Edition, Wiley-interscience publication, https://books.google.fr/books?vid=ISBN978-1-118-94740-1 (last access: 14 October 2022), 2006. a, b, c, d
Sellitto, P., Zanetel, C., di Sarra, A., Salerno, G., Tapparo, A., Meloni, D., Pace, G., Caltabiano, T., Briole, P., and Legras, B.: The impact of Mount Etna sulfur emissions on the atmospheric composition and aerosol properties in the central Mediterranean: A statistical analysis over the period 2000–2013 based on observations and Lagrangian modelling, Atmos. Environ., 148, 77–88, https://doi.org/10.1016/j.atmosenv.2016.10.032, 2017. a
Sellitto, P., Salerno, G., La Spina, A., Caltabiano, T., Scollo, S., Boselli, A., Leto, G., Zanmar Sanchez, R., Crumeyrolle, S., Hanoune, B., and Briole, P.: Small-scale volcanic aerosols variability, processes and direct radiative impact at Mount Etna during the EPL-RADIO campaigns, Sci. Rep., 10, https://doi.org/10.1038/s41598-020-71635-1, 2191. a
Shinohara, H., Aiuppa, A., Giudice, G., Gurrieri, S., and Liuzzo, M.: Variation of H2O/CO2 and CO2/SO2 ratios of volcanic gases discharged by continuous degassing of Mount Etna volcano, Italy, J. Geophys. Res.-Sol. Ea., 113, B09203, https://doi.org/10.1029/2007JB005185, 2008. a
Shostak, S., Kim, K., Horbatenko, Y., and Choi, C. H.: Sulfuric Acid Formation via H2SO3 Oxidation by H2O2 in the Atmosphere, J. Phys. Chem. A, 123, 8385–8390, https://doi.org/10.1021/acs.jpca.9b05444, 2019. a
Skamarock, W. C., Klemp, J. B., Dudhia, J., Gill, D. O., Barker, D. M., Duda, M. G., Huang, X.-Y., Wang, W., and Powers, J. G.: A Description of the Advanced Research WRF Version 3., Tech. rep., NCAR, https://doi.org/10.5065/D68S4MVH, 2008. a, b
Textor, C., Graf, H.-F., Herzog, M., and Oberhuber, J. M.: Injection of gases into the stratosphere by explosive volcanic eruptions, J. Geophys. Res.-Atmos., 108, 4606, https://doi.org/10.1029/2002JD002987, 2003. a
Van Leer, B.: Towards the ultimate conservative difference scheme. IV. A new approach to numerical convection, J. Comput. Phys., 23, 276–299, https://doi.org/10.1016/0021-9991(77)90095-X, 1977. a, b, c, d, e, f, g, h, i, j