the Creative Commons Attribution 4.0 License.
the Creative Commons Attribution 4.0 License.
 | 27 Oct 2022
Long-term trends and drivers of aerosol pH in eastern China
Min Zhou
Guangjie Zheng
Hongli Wang
Liping Qiao
Shuhui Zhu
DanDan Huang
Jingyu An
Shengrong Lou
Shikang Tao
Qian Wang
Rusha Yan
Yingge Ma
Changhong Chen
Yafang Cheng
Cheng Huang
Aerosol acidity plays a key role in regulating the chemistry and toxicity of atmospheric aerosol particles. The trend of aerosol pH and its drivers is crucial in understanding the multiphase formation pathways of aerosols. Here, we reported the first trend analysis of aerosol pH from 2011 to 2019 in eastern China, calculated with the ISORROPIA model based on observed gas and aerosol compositions. The implementation of the Air Pollution Prevention and Control Action Plan led to −35.8 %, −37.6 %, −9.6 %, −81.0 % and 1.2 % changes of PM2.5, , NHx, non-volatile cations (NVCs) and in the Yangtze River Delta (YRD) region during this period. Different from the drastic changes of aerosol compositions due to the implementation of the Air Pollution Prevention and Control Action Plan, aerosol pH showed a minor change of −0.24 over the 9 years. Besides the multiphase buffer effect, the opposite effects from the changes of and non-volatile cations played key roles in determining this minor pH trend, contributing to a change of +0.38 and −0.35, respectively. Seasonal variations in aerosol pH were mainly driven by the temperature, while the diurnal variations were driven by both temperature and relative humidity. In the future, SO2, NOx and NH3 emissions are expected to be further reduced by 86.9 %, 74.9 % and 41.7 % in 2050 according to the best health effect pollution control scenario (SSP1-26-BHE). The corresponding aerosol pH in eastern China is estimated to increase by ∼0.19, resulting in 0.04 less and 0.12 less partitioning ratios, which suggests that NH3 and NOx emission controls are effective in mitigating haze pollution in eastern China.
- Article
(5806 KB) - Full-text XML
-
Supplement
(1962 KB) - BibTeX
- EndNote


Aerosol acidity is an important parameter in atmospheric chemistry. It affects the particle mass and chemical composition by regulating the reactions of aerosols and is closely associated with human health, ecosystems and climate (Li et al., 2017; Nenes et al., 2021; Pye et al., 2020; Su et al., 2020). Aerosol acidity has attracted increasing concern in recent years because of its impacts on the thermodynamics of gas–particle partitioning, pH-dependent condensed phase reactions and trace metal solubility (Cheng et al., 2016; Fang et al., 2017; Guo et al., 2016, 2017b; He et al., 2018; Song et al., 2018; Weber et al., 2016; Su et al., 2020; Tilgner et al., 2021).
Thermodynamic models, such as E-AIM (Clegg et al., 1998) and ISORROPIA II, are commonly used for aerosol pH estimations due to the limitations and difficulties in direct measurements (Fountoukis and Nenes, 2007; Hennigan et al., 2015). Previously reported aerosol pH generally ranged from −1 to 6 on a global scale (Pye et al., 2020; Zheng et al., 2020; Su et al., 2020). In the United States, aerosols were reported to be highly acidic with pH values of approximately 0–2 (Guo et al., 2015; Nah et al., 2018; Pye et al., 2018; Zheng et al., 2020). In comparison, aerosols in mainland China and Europe were generally less acidic with aerosol pH ranging between 2.5 and 6 (Guo et al., 2018; Jia et al., 2018; Masiol et al., 2020; Shi et al., 2019; Tan et al., 2018; Wang et al., 2019; Zheng et al., 2020).
Aerosol pH exhibits notable spatial and temporal variabilities due to changes in factors such as temperature, relative humidity (RH) and aerosol compositions (Pye et al., 2018; Nenes et al., 2020; Tao et al., 2020; Zheng et al., 2020). Very few studies have investigated the trend and spatial variability of aerosol pH and its drivers. Weber et al. (2016) showed that aerosols remained highly acidic upon large (∼70 %) reduction of particulate sulfate () during summertime in the southeastern United States over the past 15 years. Based on the 10-year observations conducted at six Canadian sites, Tao and Murphy (2019) suggested that meteorological parameters were more important than the chemical compositions in controlling aerosol pH. Zheng et al. (2020) found that aerosol liquid water content (ALWC) and temperature were the main factors that contribute to the pH difference observed between the wintertime North China Plain and summertime southeastern United States, whereas the change of chemical composition only played a minor role (15 %). In China, the long-term trend of aerosol pH and its drivers remains poorly understood, especially in recent years when the emissions and aerosol compositions changed substantially.
To tackle severe particulate matter pollution in China, the Chinese government released the Air Pollution Prevention and Control Action Plan (hereinafter referred to as the Action Plan) in September 2013, which is the first plan specifying air quality goals in China (Cai et al., 2017; Liu et al., 2018; Zheng et al., 2018). The implementation of the Action Plan has led to significant changes in the concentrations and chemical compositions of fine particulate matter (PM2.5), thus altering aerosol pH and subsequently feedback to the multiphase formation pathways of aerosols such as sulfate, nitrate and ammonium (Cheng et al., 2016; Vasilakos et al., 2018; Nenes et al., 2020).
In this study, we performed a comprehensive analysis on the long-term trends of aerosol pH and its drivers in Shanghai, China. The thermodynamic model ISORROPIA II (version 2.1) (Fountoukis and Nenes, 2007) was applied to estimate the pH based on 9-year continuous online measurements of PM2.5 compositions at an urban site in Shanghai. The main purposes of this study are to (1) characterize the long-term trend of aerosol pH; (2) investigate the seasonal and diurnal variations of aerosol pH and the main factors that affect these changes and (3) predict future pH under different emission control scenarios. The results presented here can help advance our understanding in aerosol chemistry, providing a scientific basis to the development of effective pollution control strategy in the future.
2.1 Ambient measurements
The observation site in this study is located at the Shanghai Academy of Environmental Sciences (SAES, 31∘10′ N, 121∘25′ E), which sits in the densely populated city center of Shanghai (Fig. S1 in the Supplement). In the absence of significant nearby industrial sources, this sampling site represents a typical urban area of Shanghai affected by emissions from vehicular traffic, and commercial and residential activities (Qiao et al., 2014; Zhou et al., 2016).
Gases and PM2.5 components were continuously sampled by an online analyzer to monitor aerosols and gases (MARGA ADI 2080, Applikon Analytical B.V.) from 2011 to 2019. Hourly mass concentrations of major inorganic components were obtained, including gaseous components, i.e., hydrogen chloride (HCl), nitrous acid (HNO2), sulfur dioxide (SO2), nitric acid (HNO3), ammonia (NH3) and particulate components, i.e., , nitrate (), chloride (Cl−), ammonium (), sodium (Na+), potassium (K+), calcium (Ca2+) and magnesium (Mg2+). Details of measurements have been given in Qiao et al. (2014), and thus are only briefly described here. To better track the changes in retention time of different ion species and ensure their concentrations were measured correctly, an internal standard check was conducted every hour with lithium bromide (LiBr) standard solution (Qiao et al., 2014; Zhou et al., 2016). The sampling system of MARGA was cleaned and multi-point calibrations with the standard solutions were performed every 3 months to ensure the accuracy of measurements. To ensure the data quality, ion balance between the measured charge equivalent concentrations of cation (, Na+, K+, Ca2+ and Mg2+) and anion (, and Cl−) species was examined as shown in Fig. S2. Strong correlation (R2=0.94) was found between the cations and anions, suggesting good data quality during the measurement period. We note that data during 2011–2016 were more scattered than those during 2017–2019, likely due to the significant decreases in Ca2+, K+ and Mg2+ from 2011 to 2019 (Figs. S3–S5). In previous studies, intercomparison experiments between MARGA and filter-based methods have been carried out, and the data measured by MARGA showed acceptable accuracy and precision (Rumsey et al., 2014; Huang et al., 2014; Stieger et al., 2018). A Thermal/Optical Carbon Aerosol Analyzer (model RT-4, Sunset laboratory Inc.) equipped with a PM2.5 cyclone was used for the organic carbon measurement at a time resolution of 1 h. The PM2.5 mass concentrations were measured simultaneously using an on-line beta attenuation PM monitor (FH 62 C14 series, Thermo Fisher Scientific) at a time resolution of 5 min.
Temperature and RH, which are important factors affecting aerosol pH, were also measured at a time resolution of 1 min. Annually averaged temperature and RH from 2011 to 2019 are shown in Fig. S6. The t test results revealed that temperature rose significantly at a rate of 1.2 % yr−1 (p<0.01), while RH changed little.
2.2 Aerosol pH prediction
The aerosol pH was predicted using the ISORROPIA II thermodynamic model (Fountoukis and Nenes, 2007). ISORROPIA II can calculate the equilibrium and aerosol liquid water content of inorganic material (ALWCi) with the input of concentrations of the total (TH2SO4, replaced by observed ), total (TNO3, gas HNO3 plus particle ), total ammonia (NHx, gas NH3 plus particle ), total Cl− (TCl, replaced by observed Cl− due to the low concentration and large measurement uncertainties of HCl) (Fu et al., 2015; Ding et al., 2019), non-volatile cations (NVCs, observed Na+, K+, Ca2+, Mg2+) and meteorological parameters (temperature and RH) (Guo et al., 2016). and ALWCi are then used to obtain the PM2.5 pH by Eq. (1):
where is the H+ concentration in solution (mol L−1), is the H+ loading for an air sample (µg m−3), and ALWCi and ALWCo are the aerosol liquid water contents of inorganic and organic species, respectively (µg m−3). ALWCo is calculated by Eq. (2) (Guo et al., 2015):
where morg is the mass concentration of organic aerosol, ρw is the density of water (ρw=1.0 g cm−3), ρorg is the density of organics (ρorg=1.4 g cm−3) (Guo et al., 2015) and κorg is the hygroscopicity parameter of organic aerosol (κorg=0.087) (Li et al., 2016). The concentration of organic aerosol was estimated by multiplying the measured concentration of organic carbon by a factor of 1.6 (Turpin and Lim, 2001). The average concentrations of ALWCo and ALWCi in Shanghai from 2011 to 2019 were 4.1 (±10.2) and 32.6 (±52.5) µg m−3, respectively. ALWCo only accounted for 11.1 % of the total aerosol liquid water content. The pH predictions in previous studies were insensitive to ALWCo unless the mass fraction of ALWCo to the total aerosol liquid water content was close to unity (Guo et al., 2015). The use of ALWCi to predict pH is therefore fairly accurate and common (Battaglia et al., 2017, 2019; Ding et al., 2019). In this study, ISORROPIA II was run in the forward mode and “metastable” state. Calculations using total (gas and aerosol) measurements in the forward mode are less affected by measurement errors (Hennigan et al., 2015; Song et al., 2018). A detailed description of the pH calculations can be found in previous studies (Guo et al., 2015, 2017a; Song et al., 2018).
Figure S7 compares the predicted vs. measured concentrations of NH3, , and NO3. The results show that the predicted and measured concentrations of NH3, and are in good agreement (R2 values all over 0.89 and slopes close to 1.00), indicating that the thermodynamic analysis accurately represents the aerosol state. However, the predicted and measured concentrations of HNO3 are not well correlated, which is also observed in previous studies (Ding et al., 2019; Guo et al., 2015). The reason for the gap can be attributed to (1) lower concentrations of gas phase NO3 than that of particle phase and (2) MARGA has high uncertainty for HNO3 measurement (Rumsey et al., 2014). The development of an alternative approach is therefore warranted to accurately represent HNO3 in the future.
2.3 Drivers of aerosol pH variations
To investigate the factors that drive changes in aerosol pH, sensitivity tests of different factors on pH variations, including temperature, RH, , TNO3, NHx, Cl− and NVCs, were performed with the one-at-a-time method. That is, assuming the aerosol pH estimated under scenario I (pHI) differs from that under scenario II (pHII), the pH difference, (ΔpH = pHII − pHI), is thus caused by the variations in the factors listed above. To quantify the contributions of individual factors, we varied the factor i from the value in scenario I to the value in scenario II while keeping the other factors constant. The corresponding changes in pH, ΔpHi, were assumed to represent the contribution of the change of this individual factor to the overall aerosol pH variations. Note that because of the nonlinear dependence of pH to different factors, the sum of contributions of individual factors can be slightly different from the overall contributions of all factors. The unresolved contributors to pH differences, i.e., , were attributed to “others” which might represent the contribution of covariations between the factors. This method was used for the results presented in Figs. 1b, 3 and 5, where the corresponding scenarios represented the average conditions in different years (Fig. 1b), seasons (Fig. 3) or diurnal periods (Fig. 5).
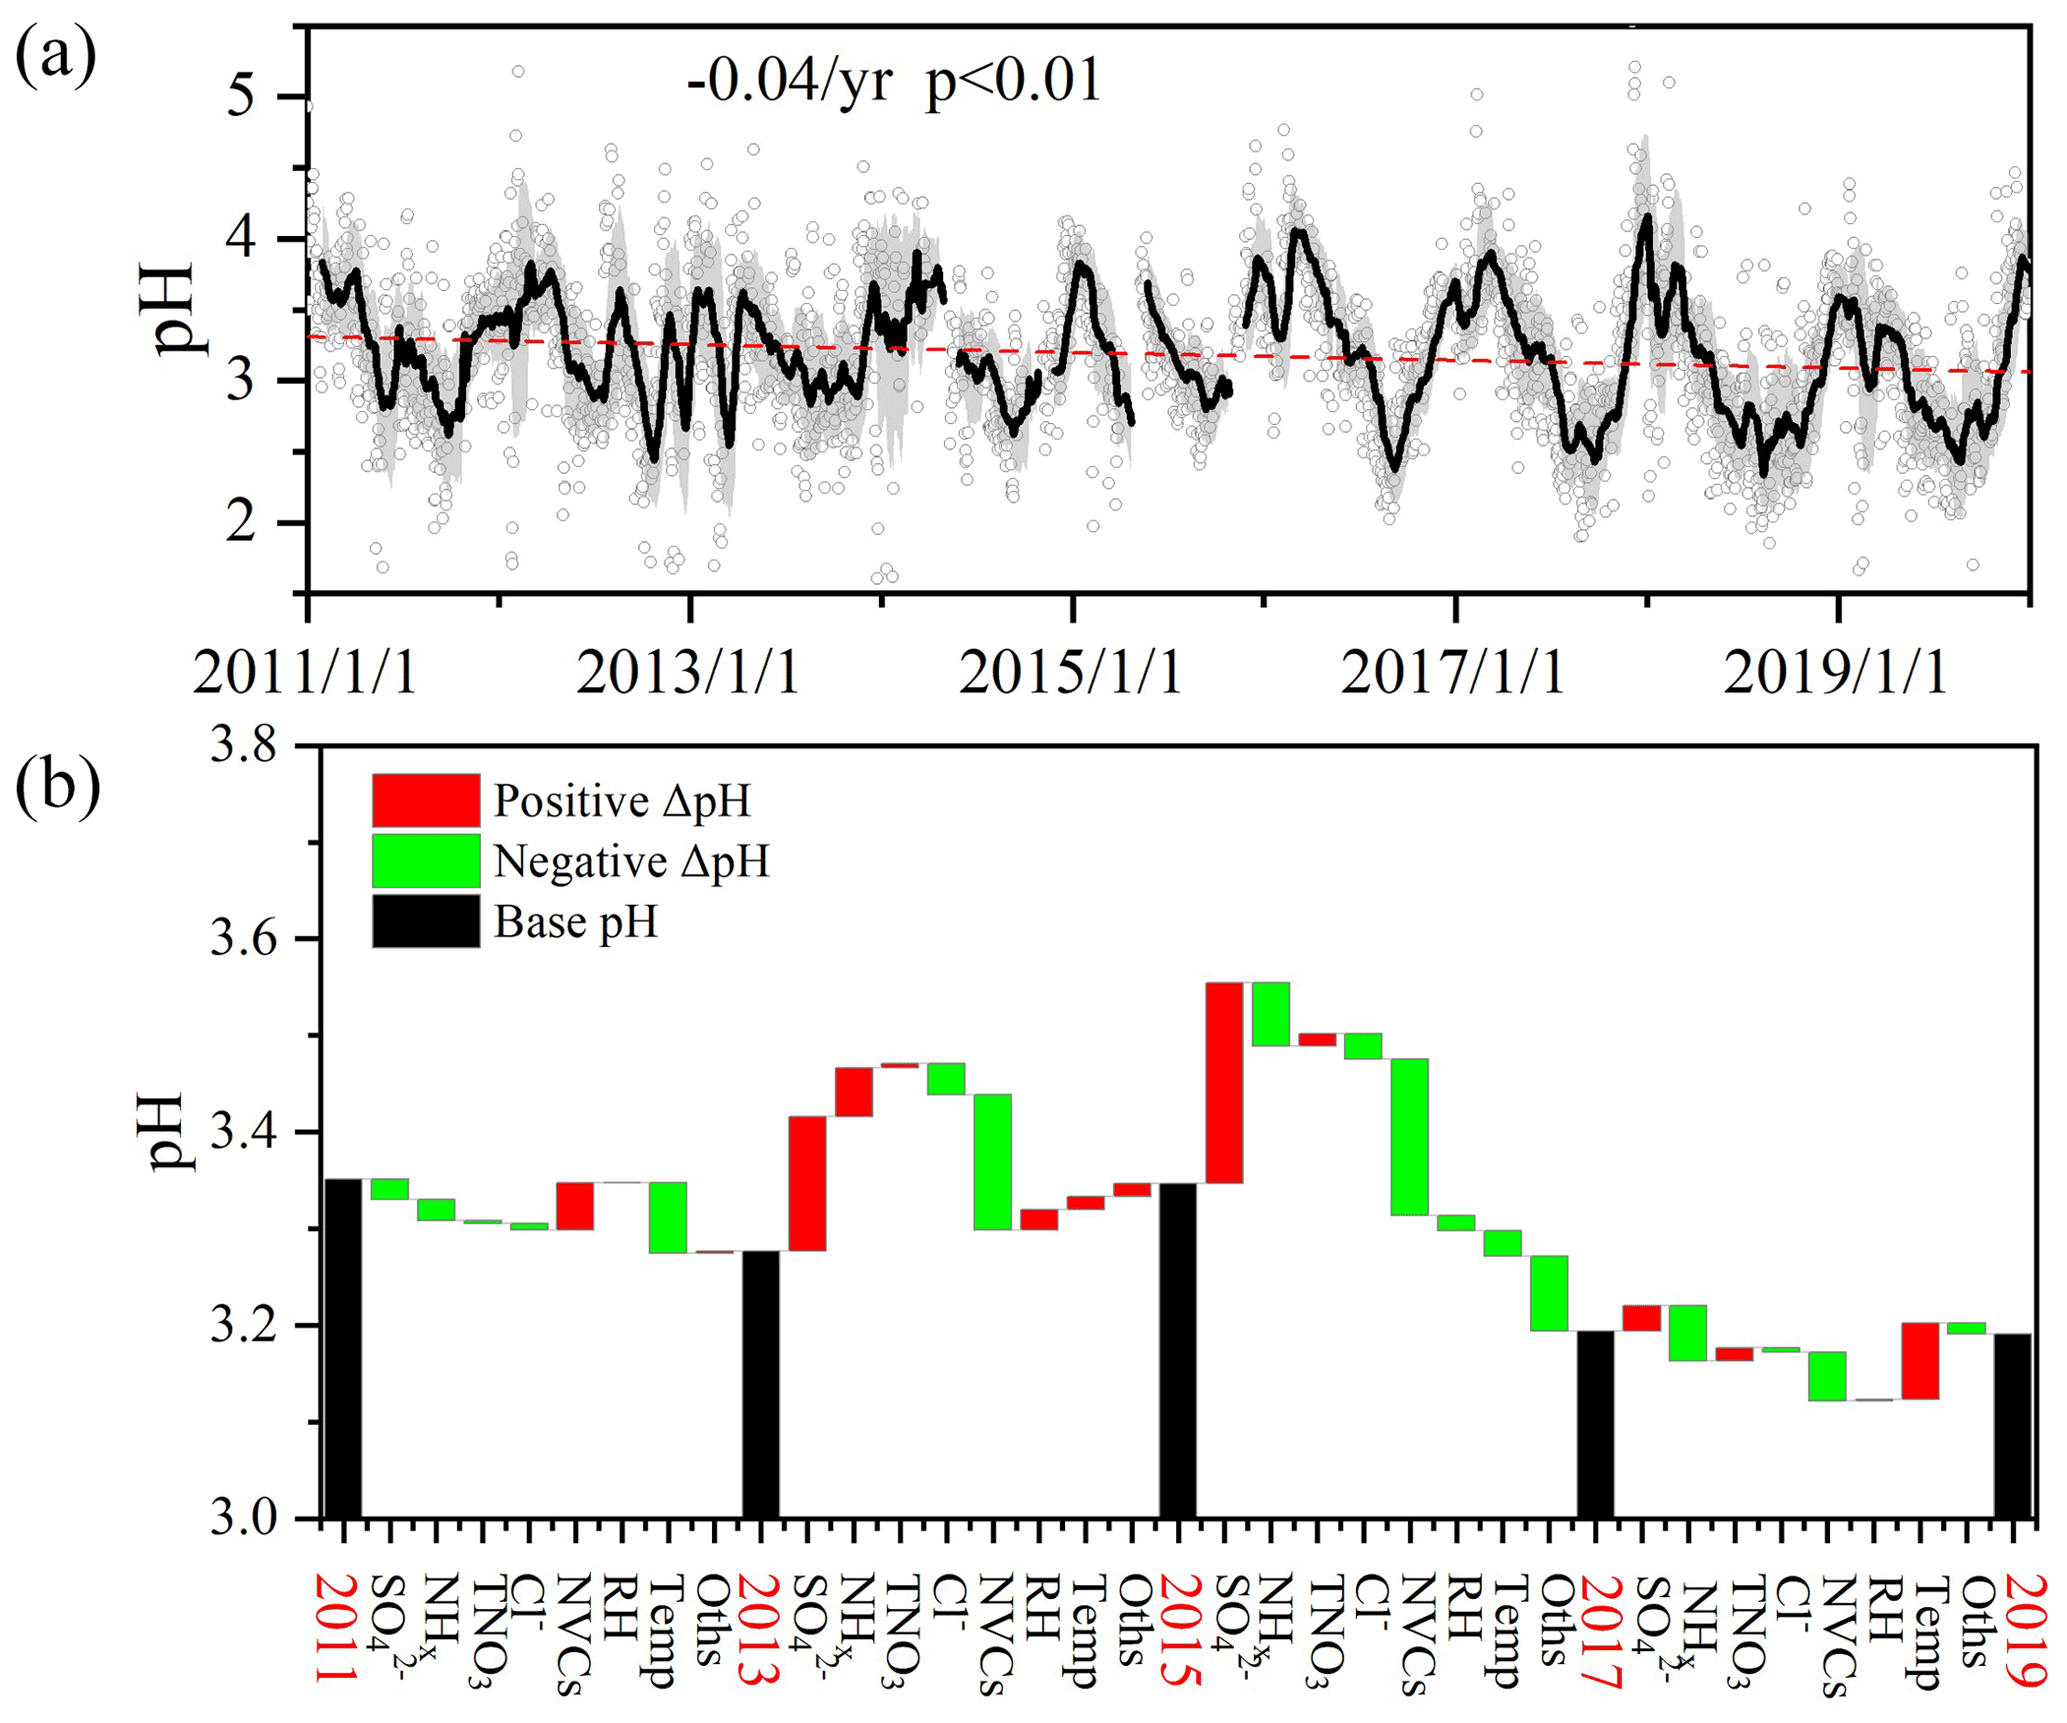
Figure 1(a) Long-term trends in aerosol pH during 2011–2019 in Shanghai. Gray dots and black lines represent the daily pH values and 30 d moving average pH values, respectively. Shaded areas mark the standard deviation of 30-day moving average pH values. (b) Contributions of individual factors to the ΔpH from 2011 to 2019. Here the black bars indicate the mean pH of different years, and the red and green bars represent the positive and negative effects of individual factors on ΔpH between two adjacent scenarios, e.g., 2011 and 2013, respectively. The meanings of the abbreviations: RH, relative humidity; Temp, temperature; NVCs, non-volatile cations; NHx, total ammonia; TNO3, total nitrate; Oths, others.
3.1 Long-term trends of aerosol pH
3.1.1 Trends of aerosol pH
The 9-year time series of aerosol pH calculated by ISORROPIA II is shown in Fig. 1a. A declining trend in PM2.5 pH from 3.30±0.58 in 2011 to 3.06±0.55 in 2019 was observed with the fitted decrease rate of around 0.04 pH per year, which may be related to chemical composition changes (Figs. S8 and S9) due to the pollution control measures taken in the Yangtze River Delta (YRD) region. The Chinese government started to carry out the Action Plan, a series of air pollution control policies, in September 2013, which resulted in declines in PM2.5 and its major components (Cheng et al., 2019; Li et al., 2019). Compared to the concentrations before the implementation of the Action Plan (i.e., average of 2011–2012 averages), PM2.5, , NHx and NVCs during 2018–2019 decreased by 35.8 %, 37.6 %, 9.6 % and 81.0 %, respectively, while increased by 1.2% (Fig. S8). Through the years, , NH and remained the most abundant inorganic water-soluble ions, accounting for 83.4 %–94.1 % of the total ions in PM2.5. While the proportions of and showed continuous increases (increased by 2.2 % and 13.1 % from 2011 to 2019, respectively), those of NVCs and decreased by 6.0 % and 4.6 %, respectively. Despite the substantial changes of aerosol abundance and composition, the aerosol pH only showed a minor change. The effects of changes in PM2.5 chemical composition on the aerosol pH will be detailed in Sect. 3.1.2.
The PM2.5 in Shanghai was moderately acidic with a daily pH averaging 3.18 and ranging from 1.15 to 5.62, similar to those from other cities in China (Shi et al., 2019; Tan et al., 2018). Compared with other countries globally (Table S1 in the Supplement), aerosol pH values of 1.82 to 5.70 in Chinese cities were higher than those of 0.55 to 2.20 in US cities yet similar to those of 2.30 to 3.90 in European cities (Guo et al., 2018; Masiol et al., 2020). Among all of the Chinese cities the aerosol pH was highest in Inner Mongolia, which might be caused by a higher contribution of crustal dust (Wang et al., 2019). The pH values in Shanghai and Guangzhou were lower than those in North China, which may be due to higher concentrations of NH3 and dust emissions over the latter region (Shi et al., 2017; Liu et al., 2019).
3.1.2 Driving factors
Figure 1b shows the contributions of individual factors to the ΔpH from 2011 to 2019. Here the bar plots indicate the factors contributing to the ΔpH between two adjacent scenarios as shown in Fig. 1b, e.g., 2011 and 2013. See Fig. S10a for the factor contribution to the variation from average conditions. Note that in Fig. 1b, the aerosol pH was calculated from the annual averages of input parameters. This is different from Sect. 3.1.1, where the annual pH was the average of hourly values based on hourly observation data. As shown in Fig. 1b, the aerosol pH decreased from 3.35 in 2011 to 3.28 in 2013. The main factors that affected the pH during 2011–2013 (prior to the implementation of the Action Plan) were the temperature and NVCs. The pH value also continuously decreased from 3.28 in 2013 to 3.19 in 2019. Yet, chemical composition showed more prominent effects on the aerosol pH during 2013–2019 compared to that of 2011–2013. As aforementioned, upon implementation of the Action Plan (2013–2019), the concentrations of PM2.5 and its chemical components decreased substantially (Fig. S8). Changes of and NVCs were important determinants in the change of aerosol pH, resulting in ΔpH of +0.38 and −0.35, respectively, from 2013 to 2019. Changes in the NHx and Cl− contributed 0.08 and 0.06 decreases in ΔpH, respectively, whereas TNO3 had little impact on the ΔpH. Hence, besides the effect of reduction in (Fu et al., 2015; Xie et al., 2020), our results suggest that the change in NVCs may also play an important role in determining the trend of aerosol pH. During 2017–2019, temperature and NHx became the main drivers of the ΔpH. The effects of and NVCs on pH were much weaker than those during 2013–2017, consistent with the fact that the declines in pollutant concentrations slowed down in recent years (Fig. S9).
Overall, the changes in and NVCs were the main drivers of the ΔpH upon the implementation of the Action Plan and NHx appeared to play an increasingly important role in determining the aerosol pH through the years.
3.1.3 Seasonal variation
Figure 2 shows the seasonal variations of aerosol pH in Shanghai. The average pH values were 3.33±0.49, 2.89±0.49, 2.99±0.52 and 3.59±0.57 in spring (March–May, MAM), summer (June–August, JJA), fall (September–November, SON) and winter (December–February, DJF), respectively. The highest aerosol pH was found in winter while the lowest pH was found in summer. While the seasonal variations of pH in Shanghai were similar to those observed in Beijing and other cities in the North China Plain (Tan et al., 2018; Ding et al., 2019; Shi et al., 2019; Wang et al., 2020), the absolute values were lower due to the generally lower PM2.5 concentrations in YRD.

Figure 2Seasonal variations of the mass concentrations of major components in PM2.5, relative humidity (RH), temperature (Temp), predicted aerosol liquid water content (ALWC) and aerosol pH during 2011–2019 in Shanghai.
Figure 3 shows the contributions of individual factors to the ΔpH across the four seasons. Here the bar plots indicate the factors contributing to the ΔpH between two adjacent seasons, e.g., spring (MAM) and summer (JJA). See Fig. S10b for the factor contribution to the variation from average conditions. The aerosol pH was calculated from the mean averages of input parameters in four seasons, and the ΔpH was estimated by varying one factor while holding the other factors fixed in different seasons. According to the multiphase buffer theory, the peak buffer pH, , regulates the aerosol pH in a multiphase-buffered system, and temperature can largely drive the seasonal variation of aerosol pH through its impact on (Zheng et al., 2020). This is evidenced by the results in Fig. 3, as temperature showed a dominant role in driving the seasonal variation of aerosol pH. The temperature was associated with a maximum ΔpH of 0.63 from fall to winter. Besides temperature the other two main factors were NHx and (Fig. 3), contributing 16 % and 12 % of the changes, respectively. Our results suggest a central role of temperature in the determination of seasonal variations in aerosol pH, consistent with the results of Tao and Murphy (2019) at six Canadian sites and the prediction by the multiphase buffer theory (Zheng et al., 2020). In comparison some previous studies emphasized the importance of chemical compositions in seasonal variations (Tan et al., 2018; Ding et al., 2019), which is mainly due to the different sensitivity analysis methods applied.
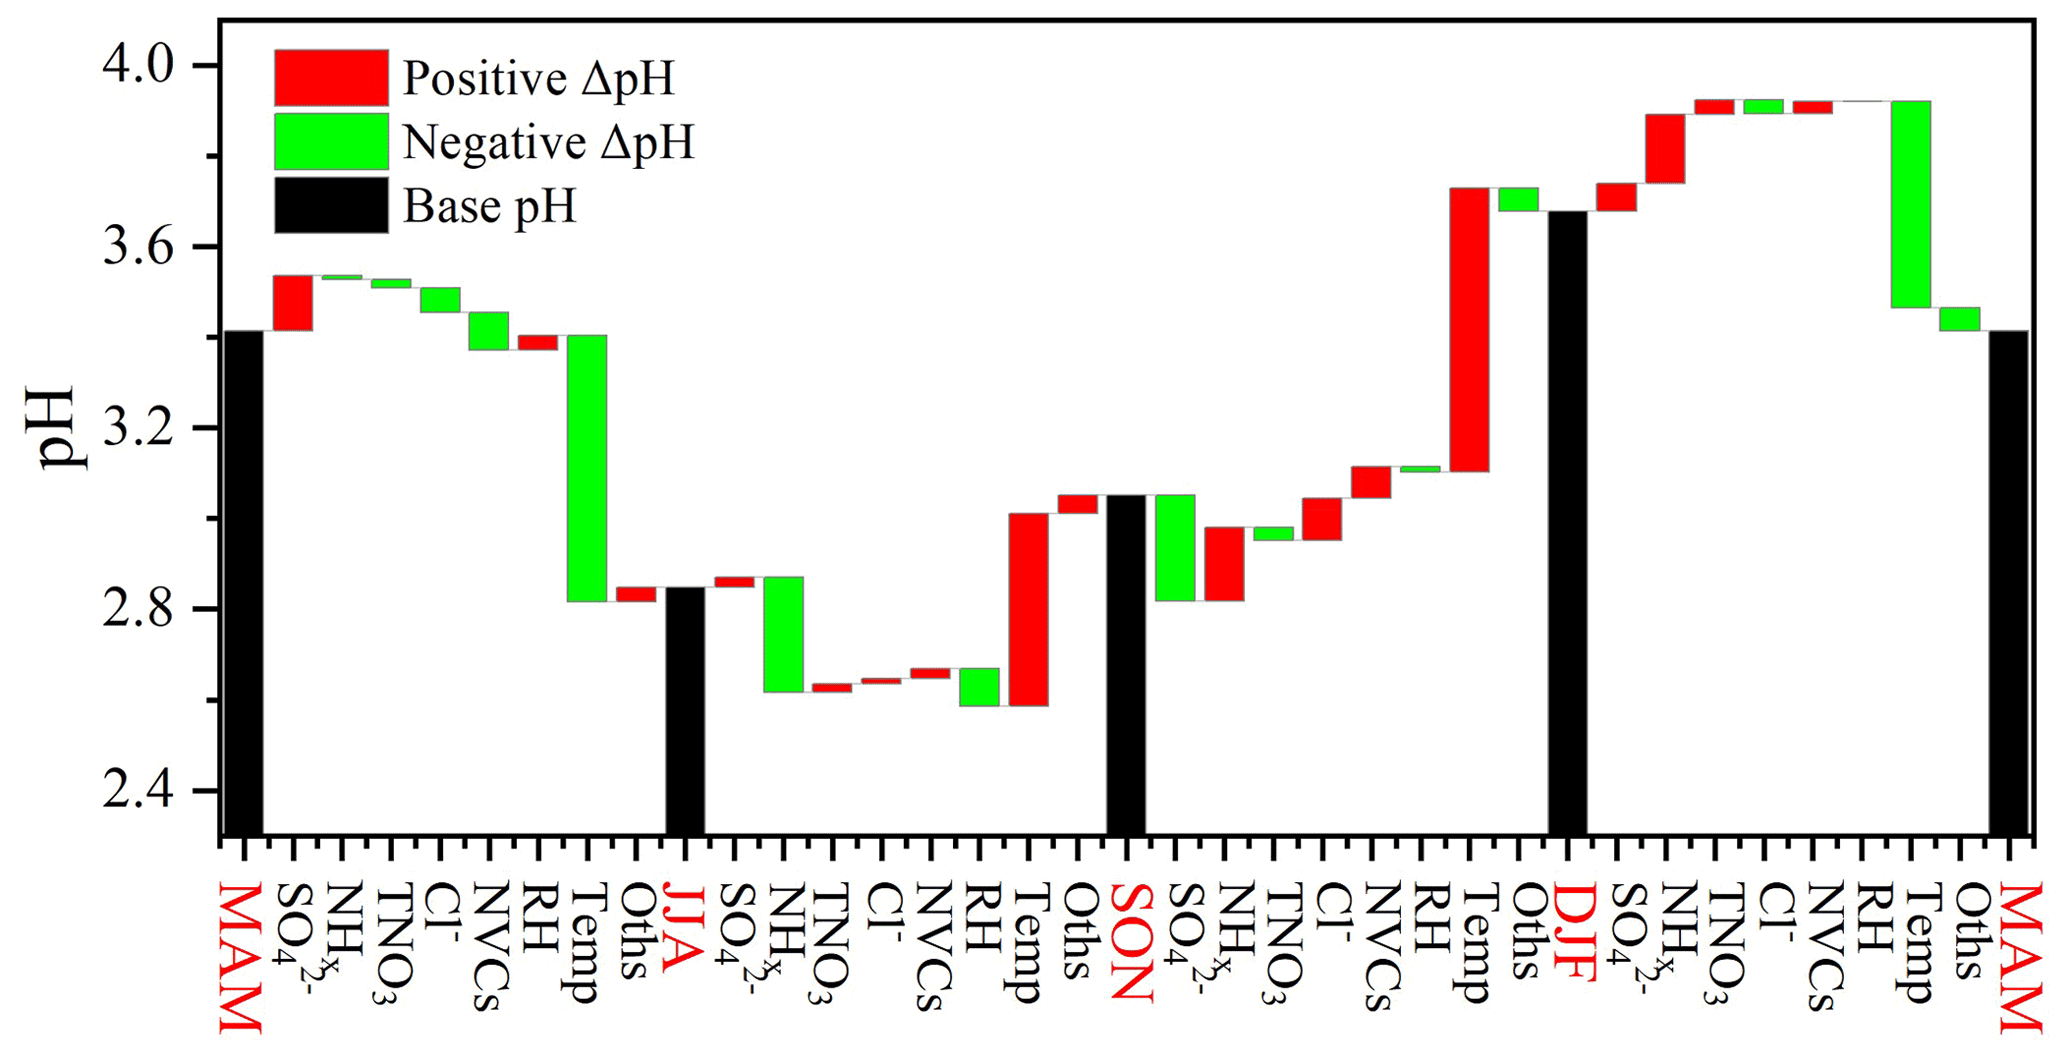
Figure 3Contributions of individual factors to the ΔpH across the four seasons. Here the black bars indicate the mean pH of different seasons, and the red and green bars represent the positive and negative effects of individual factors on ΔpH between two adjacent scenarios, e.g., spring (MAM) and summer (JJA), respectively. The meanings of the abbreviations: RH, relative humidity; Temp, temperature; NVCs, non-volatile cations; NHx, total ammonia; TNO3, total nitrate; Oths, others.
3.2 Diurnal variation
Aerosol pH in Shanghai exhibited notable diurnal variations with higher aerosol acidity observed during daytime. Diurnal variations of aerosol pH as well as those of its potential drivers are depicted in Fig. 4. We further explored the effects of individual factors on the ΔpH between day and night through sensitivity tests.
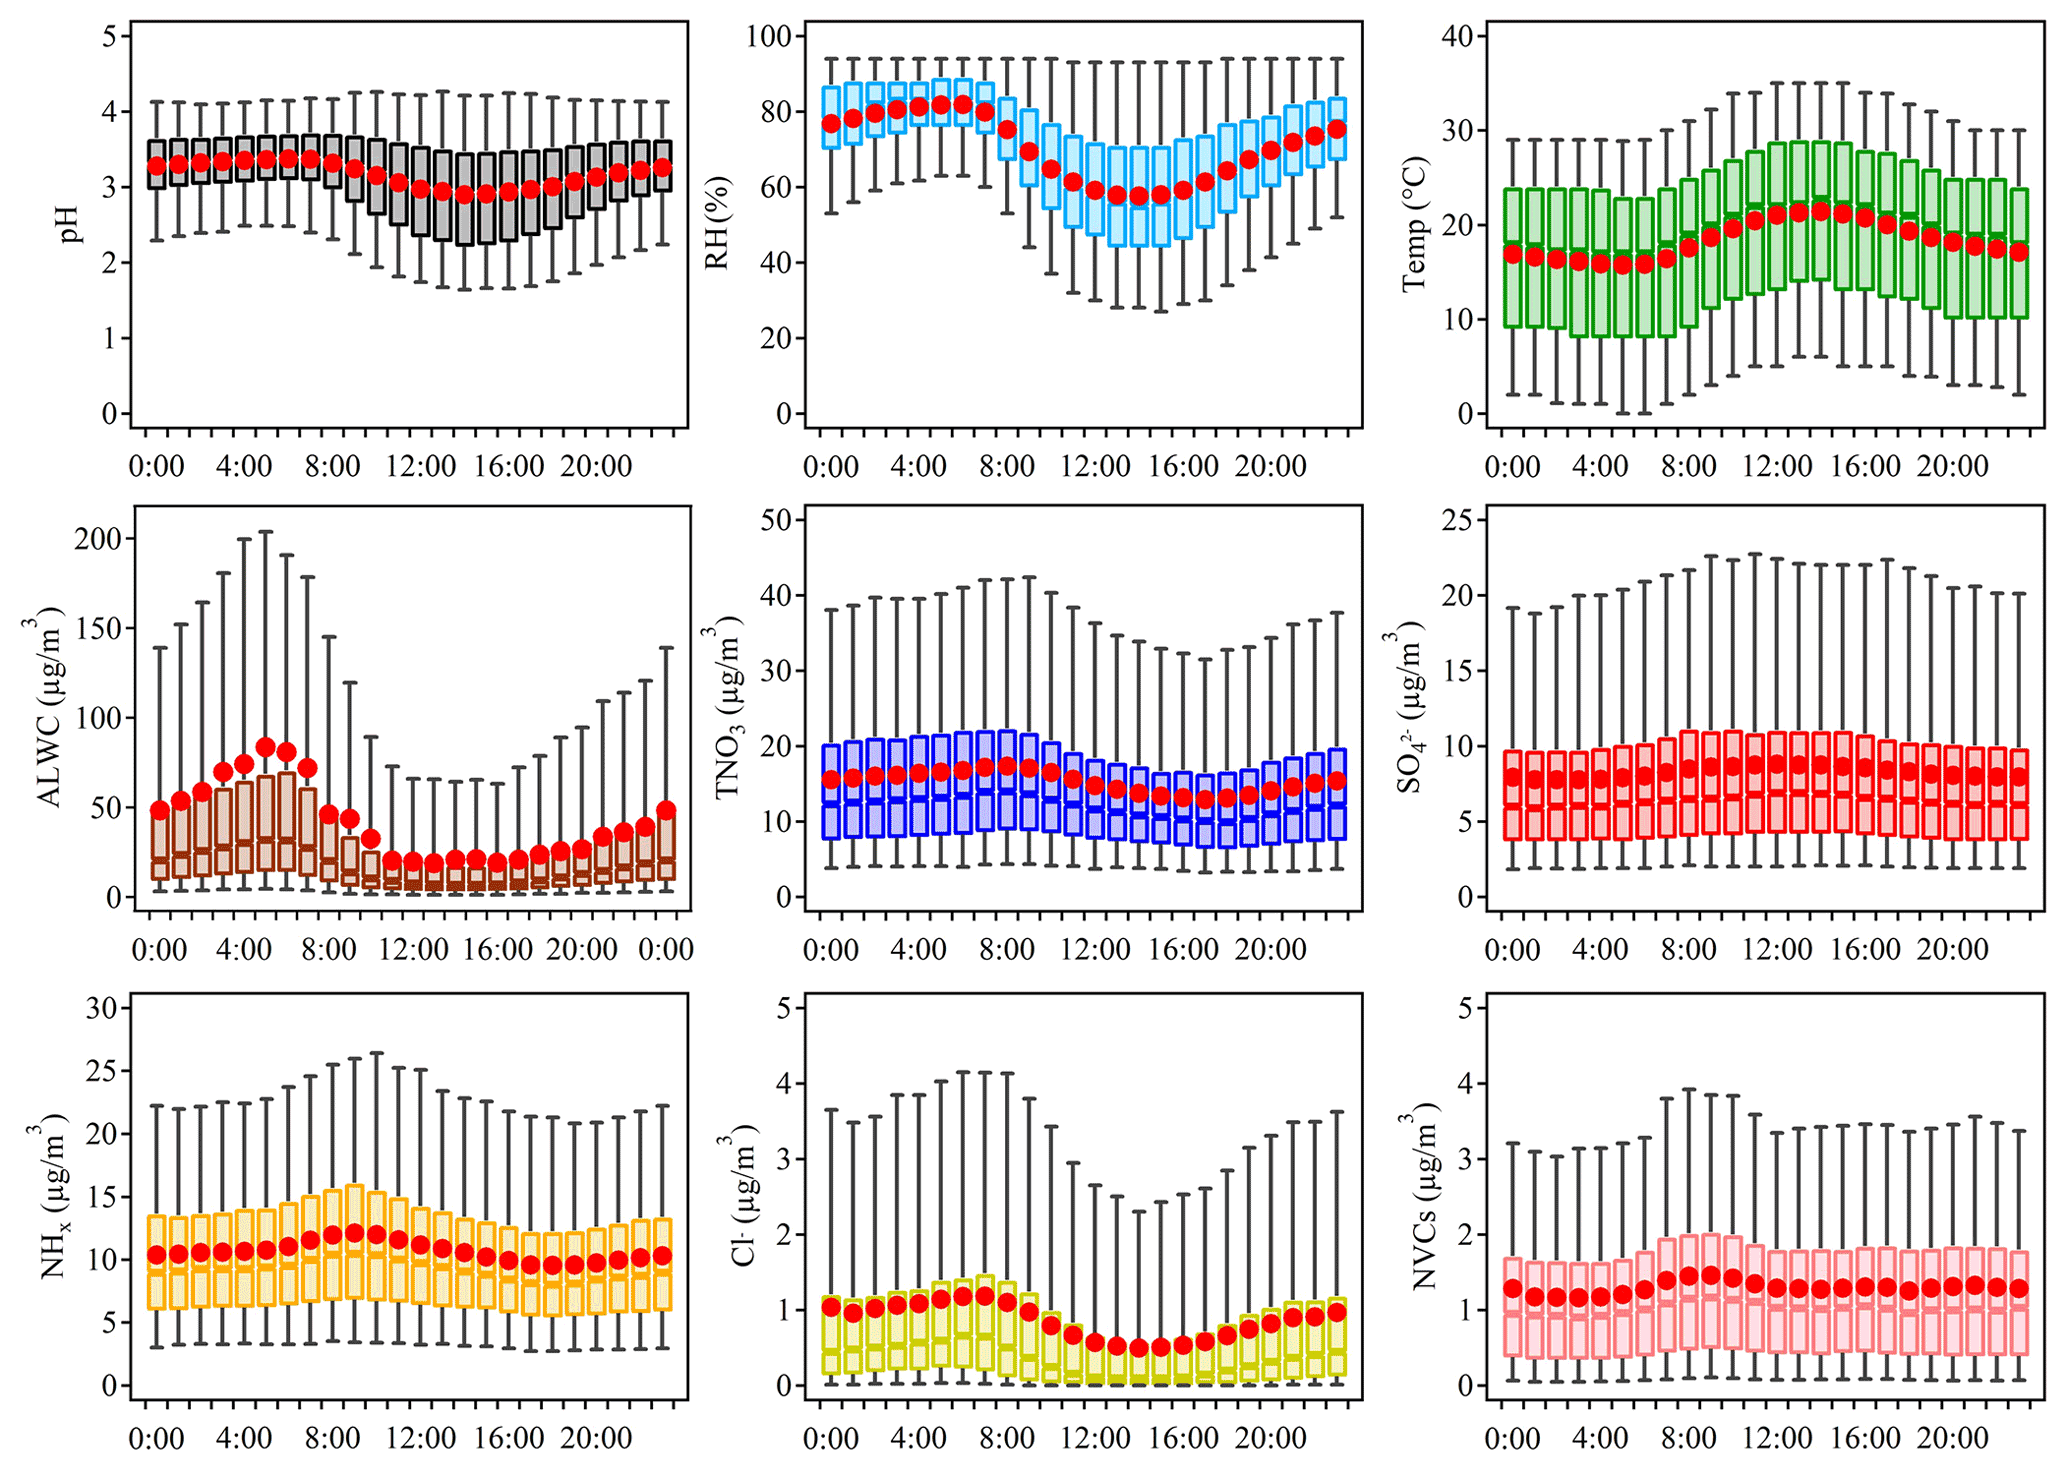
Figure 4Diurnal variations of the mass concentrations of major ions in PM2.5, relative humidity (RH), temperature (Temp), predicted aerosol liquid water content (ALWC) and aerosol pH during 2011–2019 in Shanghai.
The bar plots in Fig. 5 indicate the factors contributing to the ΔpH between two adjacent hour periods, e.g., 00:00 and 06:00 LT. See Fig. S10c for the combined effects of contributions from different factors on the average ΔpH. The aerosol pH was calculated from the averages of input parameters in 00:00, 06:00, 12:00 and 18:00 LT, and ΔpH was estimated by varying one factor while holding the other factors fixed in different hours. Temperature and RH were among the main drivers of the diurnal variation of aerosol pH with a maximum ΔpH of −0.22 and +0.10, respectively. As shown in Fig. 4, the maximum values of RH and ALWC occurred at approximately 05:00 LT. After sunrise, the increase in temperature resulted in an immediate drop of RH with ALWC reaching its lowest level in the afternoon. Accordingly, the minimum aerosol pH (∼2.8) was also found in the afternoon with high temperature and low RH. After sunset, the decreasing temperature and increasing RH led to the highest aerosol pH overnight. Minor changes in pH were found between 00:00 and 06:00 LT when temperature and RH also showed minor changes. The impacts of other factors, such as , on the diurnal variations of pH were notably smaller than those on seasonal variations, which may be attributed to the relatively small variations of chemical profiles during the course of a day. Among the chemical compositions, NHx played the most important role, followed by . Overall, temperature and RH were more important than chemical compositions in regulating the diurnal variations of aerosol pH.
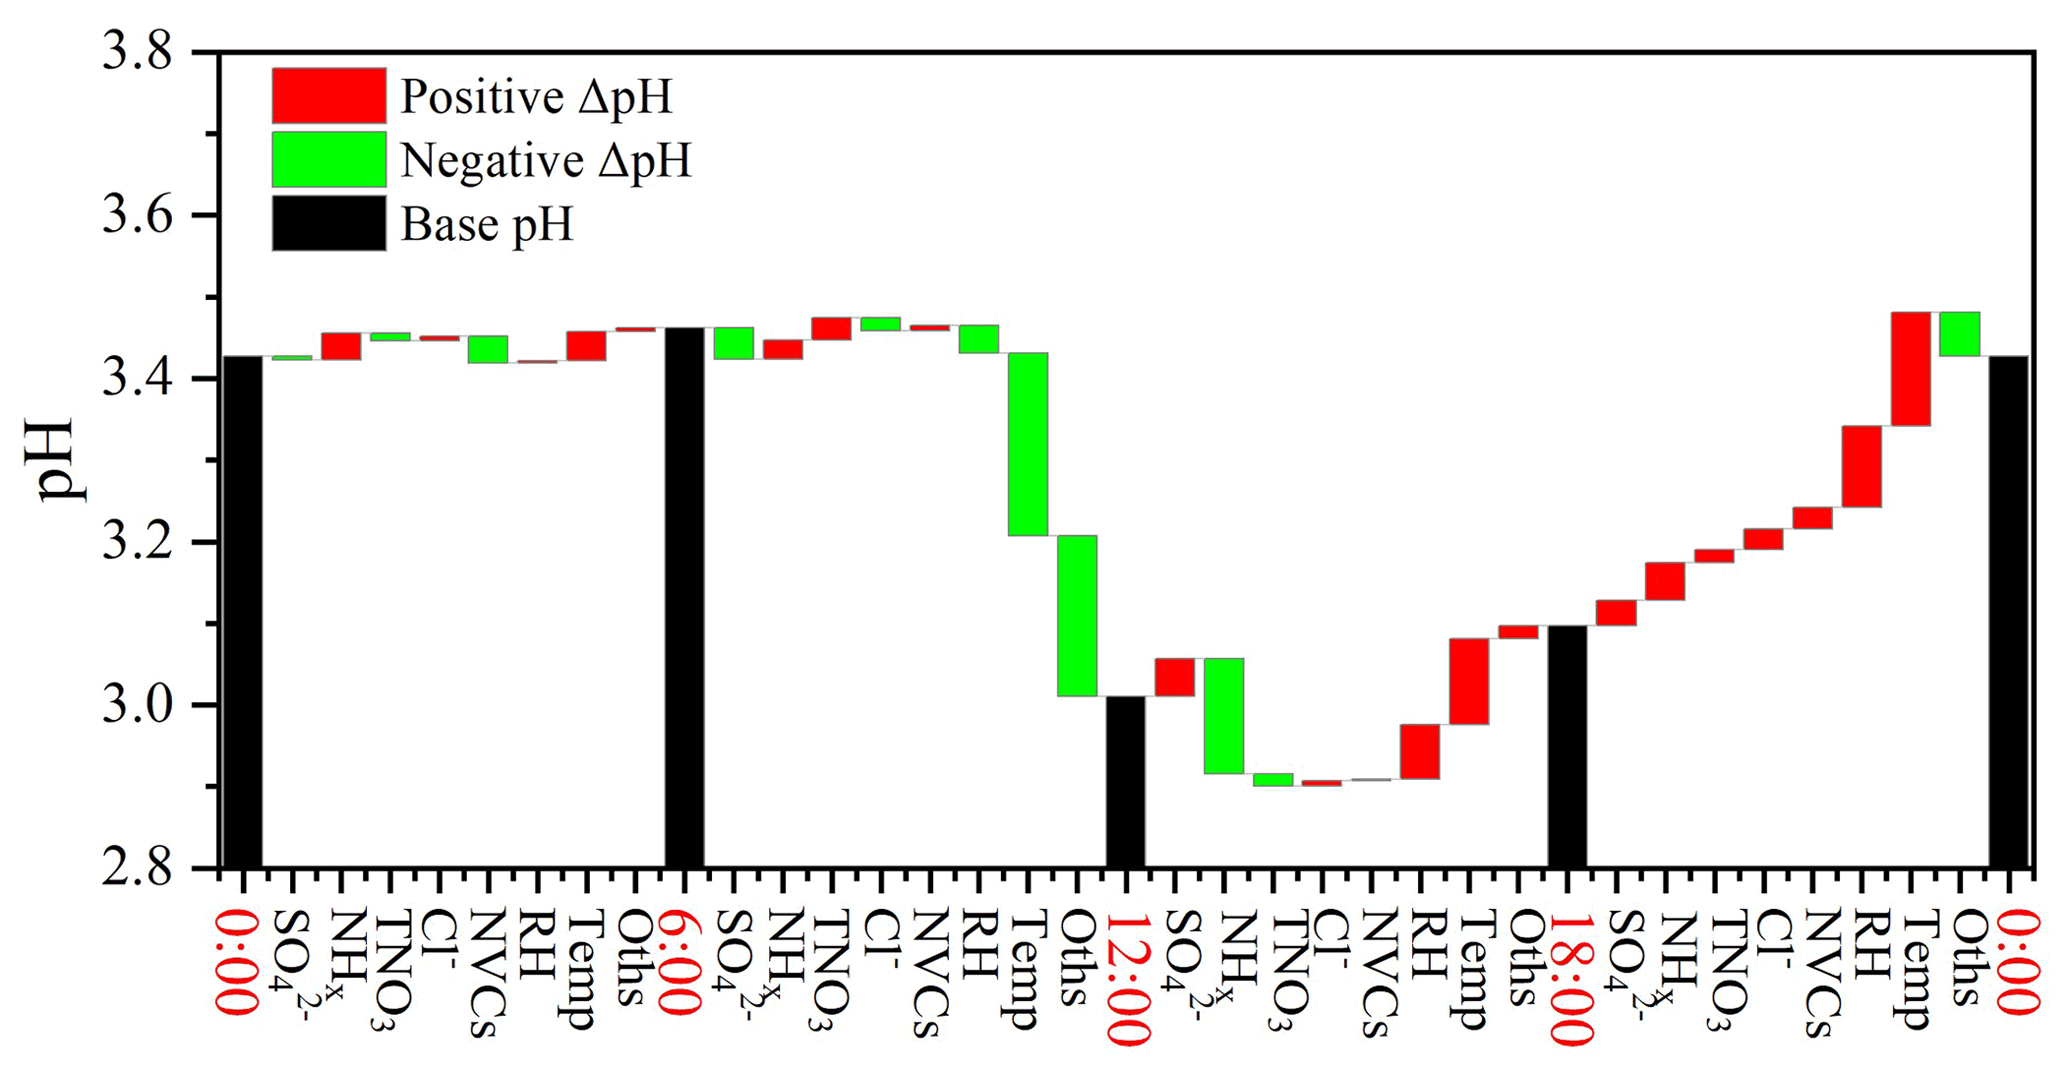
Figure 5Contributions of individual factors to the ΔpH between day and night. Here the black bars indicate the mean pH of different hours, and the red and green bars represent the positive and negative effects of individual factors on ΔpH between two adjacent scenarios, e.g., 00:00 and 06:00 LT, respectively. The meanings of the abbreviations: RH, relative humidity; Temp, temperature; NVCs, non-volatile cations; NHx, total ammonia; TNO3, total nitrate; Oths, others.

Figure 6Emissions of SO2 (a), NOx (b), NH3 (c), predicted pH (d), partitioning () (e) and partitioning () (f) in China from 2015 to 2050 under the three scenarios published in Tong et al. (2020). Predicted contributions of individual factors to the ΔpH under the three scenarios, including SSP3-70-BAU (g), SSP2-45-ECP (h) and SSP1-26-BHE (i). The stacked color bars below the dashed line represent the factors that had negative impacts on ΔpH and the stacked color bars above the dashed line represent the increase in ΔpH. The meanings of the abbreviations: NHx, total ammonia; TNO3, total nitrate; Oths, others.
3.3 Future projections
A series of prevention and control measures have been suggested for continuous improvement in air quality which are expected to affect particulate compositions and subsequently alter aerosol pH in China. To explore China's future anthropogenic emission pathways in 2015–2050, Tong et al. (2020) developed a dynamic projection model based on which different emission scenarios were created by connecting five socio-economic pathway (SSP) scenarios, five representative concentration pathways (RCP) scenarios (RCP8.5, 7.0, 6.0, 4.5 and 2.6) and three pollution control scenarios (business as usual, BAU; enhanced control policy, ECP; and best health effect, BHE). These scenarios provide a better understanding of future trends in pollutant emissions (Tong et al., 2020).
In this study, we chose three different emission reduction scenarios (SSP3-70-BAU, SSP2-45-ECP, and SSP1-26-BHE) as the future anthropogenic emission pathways based on which we tried to project future aerosol pH levels in Shanghai. SSP1-26-BHE, which involves a combination of strong low carbon and air pollution control policy, has the greatest emission reduction followed by SSP2-45-ECP. SSP3-70-BAU is a reference scenario without additional efforts to constrain emissions. We first tested the sensitivity of aerosol abundances to precursor emissions with the historical data (Fig. S11), where the emissions of Shanghai were obtained by the Multi-resolution Emission Inventory for China (MEIC, http://meicmodel.org/, last access: 15 January 2020). We found that the non-volatile sulfate concentrations generally correlated linearly with that of the SO2 emissions. For the volatile TNO3 and NHx the correlations are less linear, likely due to the different deposition velocities of gases and particles (Pye et al., 2020; Weber et al., 2016; Nenes et al., 2021). The historical emission reductions have resulted in a moderate pH decrease (Fig. 1), a moderate increase (0.2 % yr−1) in the partitioning and a decrease (−0.6 % yr−1) in the partitioning (Fig. S12).
For a first-order estimation, we applied the average Δ aerosol/Δ (precursor emissions) in (µg m−3)/(Gg yr−1) as derived from the historical data (Fig. S11a–c) to the future scenario predictions. Figure 6 shows the projected emissions of SO2, NOx, NH3, the predicted pH levels and the effects of major chemical components (NHx, , and TNO3) to the ΔpH in Shanghai from 2015 to 2050 under the three scenarios. Based on this assumption the concentrations of , and are expected to drop to ∼6.3, 5.7 and 2.6 µg m−3, respectively, in 2050 with the SSP1-26-BHE scenario. This is generally in agreement with the predicted PM2.5 levels of ∼15 µg m−3 under a similar scenario (Shi et al., 2021).
Under the reference scenario of SSP3-70-BAU with weak control policy (blue dashed lines in Fig. 6a–f), SO2 and NOx are predicted to increase while the NHx is relatively stable. NHx, and TNO3 have minor effects on ΔpH (Fig. 6g). Correspondingly, there are little changes in aerosol pH and the predicted partitioning ratio (). However, the partitioning ratio () will increase substantially suggesting an enhanced formation of ammonium aerosols.
Under the moderate control policy (SSP2-45-ECP), the emissions of SO2, NOx and NH3 in 2050 will be reduced by 62.7 %, 49.0 % and 25.0 %, respectively, with corresponding decreases in , TNO3 and NHx. The predicted pH will increase by ∼0.13 and the partitioning ratio will decrease by 0.09, indicating that relatively more ammonium will exist in the gas phase as NH3. The partitioning ratios are relatively stable suggesting its general insensitivity in the predicted pH ranges (Nenes et al., 2020). Changes in the , TNO3 and NHx will result in ΔpH of +0.18, −0.05 and −0.02 from 2015 to 2050, respectively (Fig. 6h).
With the strict control policy (SSP1-26-BHE), the emissions of SO2, NOx and NH3 in 2050 will decrease by 86.9 %, 74.9 % and 41.7 %, respectively, and the concentrations of , TNO3 and NHx will decrease substantially. The pH value will increase continuously by ∼0.19 (from 3.36 in 2015 to 3.55 in 2050). Changes in are more important determinants of ΔpH, resulting in ΔpH of +0.28 from 2015 to 2050. Changes in the TNO3 and NHx are associated with 0.04 and 0.09 decreases in ΔpH, respectively. Moreover, the and partitioning ratios will decrease by 0.04 and 0.12, respectively, indicating a benefit of NH3 and NOx emission controls in mitigating haze pollution in eastern China.
We also note that the above analysis based on the historical average Δaerosol (precursor emissions) is subject to uncertainties associated with changes in the atmospheric oxidation capacity, meteorological conditions, etc. It is only a first-order estimation, and a full examination with 3-D chemical transport models is recommended in the future.
The aerosol pH values at an urban site in Shanghai during 2011–2019 were modeled and reported for the first time based on observed gas and aerosol compositions. Although significant variations of aerosol compositions were observed from 2011 to 2019 in the YRD region, the estimated aerosol pH declined only slightly by 0.24. We quantified the contributions from individual factors to the variation of aerosol pH from 2011 to 2019. We found that besides the multiphase buffer effect, and NVC changes are key to regulating the aerosol pH from 2011 to 2019 in Shanghai. and NVCs showed an overall opposite effect on aerosol pH, with a contribution of +0.38 and −0.35, respectively.
Distinct seasonal variations in the aerosol pH were observed with maximum and minimum aerosol pH of 3.59±0.57 in winter and 2.89±0.49 in summer, respectively. Seasonal variations in aerosol pH were mainly driven by the temperature with the maximum ΔpH of 0.63 between fall and winter. The diurnal cycle of aerosol pH was driven by the combined effects of temperature and RH which could result in ΔpH of −0.22 and +0.10, respectively. These results emphasized the importance of meteorological conditions in controlling the seasonal and diurnal variations of aerosol pH.
To explore the effects of China's future anthropogenic emission control pathways on aerosol pH and compositions, we chose three different emission reduction scenarios proposed by Tong et al. (2020) for future haze mitigation, namely SSP3-70-BAU, SSP2-45-ECP and SSP1-26-BHE, as case studies. We found that under the weak control policy (SSP3-70-BAU), the future aerosol pH and partitioning ratio will only have subtle changes. While our results show that future aerosol pH will increase under both strict control policy (SSP1-26-BHE) and moderate control policy (SSP2-45-ECP), the former will result in a more dramatic increase. The significant increase in aerosol pH is mainly associated with the decrease in . In addition, the increase in aerosol pH with strict control policy and moderate control policy will lead to relatively more nitrate and ammonium partitioning in the gas phase, which is beneficial for future PM2.5 pollution control. These results highlight the potential effects of precursor reductions on aerosol pH with future pollution control policy.
The data presented in this paper are available upon request from Hang Su (h.su@mpic.de) and Cheng Huang (huangc@saes.sh.cn).
The supplement related to this article is available online at: https://doi.org/10.5194/acp-22-13833-2022-supplement.
HS, HW and CH conceived and led the study. MZ conducted the field measurements and carried out the data analysis. MZ and GZ performed model simulations. MZ, HS, HW, CH, GZ, LQ, SZ, DH, YC and JA discussed the results. LQ, SZ, DH, SL, ST, QW, RY, YM and CC conducted the measurements at the station. MZ, HS and GZ wrote the manuscript with input from all co-authors.
At least one of the (co-)authors is a member of the editorial board of Atmospheric Chemistry and Physics. The peer review process was guided by an independent editor, and the authors also have no other competing interests to declare.
Publisher's note: Copernicus Publications remains neutral with regard to jurisdictional claims in published maps and institutional affiliations.
We gratefully acknowledge the support from the National Natural Science Foundation of China (grant nos. 42061134008, 42175135 and 21806108), the Science and Technology Commission of Shanghai Municipality Fund Project (grant no. 20dz1204000), the National Key Research and Development Program of China (grant no. 2018YFC0213800), and the Shanghai Rising-Star Program (grant no. 19QB1402900).
This study has been supported by the National Natural Science Foundation of China (grant nos. 42061134008, 42175135 and 21806108), the Science and Technology Commission of Shanghai Municipality Fund Project (grant no. 20dz1204000), the National Key Research and Development Program of China (grant no. 2018YFC0213800), and the Shanghai Rising-Star Program (19QB1402900).
The article processing charges for this open-access publication were covered by the Max Planck Society.
This paper was edited by Urs Baltensperger and reviewed by five anonymous referees.
Battaglia, M. A., Douglas, S., and Hennigan, C. J.: Effect of the Urban Heat Island on Aerosol pH, Environ. Sci. Technol., 51, 13095–13103, https://doi.org/10.1021/acs.est.7b02786, 2017.
Battaglia Jr., M. A., Weber, R. J., Nenes, A., and Hennigan, C. J.: Effects of water-soluble organic carbon on aerosol pH, Atmos. Chem. Phys., 19, 14607–14620, https://doi.org/10.5194/acp-19-14607-2019, 2019.
Cai, S., Wang, Y., Zhao, B., Wang, S., Chang, X., and Hao, J.: The impact of the “Air Pollution Prevention and Control Action Plan” on PM2.5 concentrations in Jing-Jin-Ji region during 2012–2020, Sci. Total Environ., 580, 197–209, https://doi.org/10.1016/j.scitotenv.2016.11.188, 2017.
Cheng, J., Su, J., Cui, T., Li, X., Dong, X., Sun, F., Yang, Y., Tong, D., Zheng, Y., Li, Y., Li, J., Zhang, Q., and He, K.: Dominant role of emission reduction in PM2.5 air quality improvement in Beijing during 2013–2017: a model-based decomposition analysis, Atmos. Chem. Phys., 19, 6125–6146, https://doi.org/10.5194/acp-19-6125-2019, 2019.
Cheng, Y., Zheng, G., Wei, C., Mu, Q., Zheng, B., Wang, Z., Gao, M., Zhang, Q., He, K., Carmichael, G., Poscjl, U., and Su, H.: Reactive nitrogen chemistry in aerosol water as a source of sulfate during haze events in China, Sci. Adv., 2, 1–11, https://doi.org/10.1126/sciadv.1601530, 2016.
Clegg, S. L., Brimblecombe, P., and Wexler, A. S.: Thermodynamic Model of the System H+––Na+––NO3–Cl–H2O at 298.15 K, J. Phys. Chem. A, 102, 2155–2171, https://doi.org/10.1021/jp973043j, 1998.
Ding, J., Zhao, P., Su, J., Dong, Q., Du, X., and Zhang, Y.: Aerosol pH and its driving factors in Beijing, Atmos. Chem. Phys., 19, 7939–7954, https://doi.org/10.5194/acp-19-7939-2019, 2019.
Fang, T., Guo, H., Zeng, L., Verma, V., Nenes, A., and Weber, R. J.: Highly Acidic Ambient Particles, Soluble Metals, and Oxidative Potential: A Link between Sulfate and Aerosol Toxicity, Environ. Sci. Technol., 51, 2611–2620, https://doi.org/10.1021/acs.est.6b06151, 2017.
Fountoukis, C. and Nenes, A.: ISORROPIA II: a computationally efficient thermodynamic equilibrium model for K+–Ca2+–Mg2+––Na+–––Cl−–H2O aerosols, Atmos. Chem. Phys., 7, 4639–4659, https://doi.org/10.5194/acp-7-4639-2007, 2007.
Fu, X., Guo, H., Wang, X., Ding, X., He, Q., Liu, T., and Zhang, Z.: PM2.5 acidity at a background site in the Pearl River Delta region in fall-winter of 2007–2012, J. Hazard Mater., 286, 484–492, https://doi.org/10.1016/j.jhazmat.2015.01.022, 2015.
Guo, H., Xu, L., Bougiatioti, A., Cerully, K. M., Capps, S. L., Hite, J. R., Carlton, A. G., Lee, S. H., Bergin, M. H., Ng, N. L., Nenes, A., and Weber, R. J.: Fine-particle water and pH in the southeastern United States, Atmos. Chem. Phys., 15, 5211–5228, https://doi.org/10.5194/acp-15-5211-2015, 2015.
Guo, H., Sullivan, A. P., Campuzano-Jost, P., Schroder, J. C., Lopez-Hilfiker, F. D., Dibb, J. E., Jimenez, J. L., Thornton, J. A., Brown, S. S., Nenes, A., and Weber, R. J.: Fine particle pH and the partitioning of nitric acid during winter in the northeastern United States, J. Geophys. Res.-Atmos., 121, 10355–10376, https://doi.org/10.1002/2016jd025311, 2016.
Guo, H., Weber, R. J., and Nenes, A.: High levels of ammonia do not raise fine particle pH sufficiently to yield nitrogen oxide-dominated sulfate production, Sci. Rep., 7, 12109, https://doi.org/10.1038/s41598-017-11704-0, 2017a.
Guo, H., Liu, J., Froyd, K. D., Roberts, J. M., Veres, P. R., Hayes, P. L., Jimenez, J. L., Nenes, A., and Weber, R. J.: Fine particle pH and gas–particle phase partitioning of inorganic species in Pasadena, California, during the 2010 CalNex campaign, Atmos. Chem. Phys., 17, 5703–5719, https://doi.org/10.5194/acp-17-5703-2017, 2017b.
Guo, H., Otjes, R., Schlag, P., Kiendler-Scharr, A., Nenes, A., and Weber, R. J.: Effectiveness of ammonia reduction on control of fine particle nitrate, Atmos. Chem. Phys., 18, 12241–12256, https://doi.org/10.5194/acp-18-12241-2018, 2018.
He, P., Alexander, B., Geng, L., Chi, X., Fan, S., Zhan, H., Kang, H., Zheng, G., Cheng, Y., Su, H., Liu, C., and Xie, Z.: Isotopic constraints on heterogeneous sulfate production in Beijing haze, Atmos. Chem. Phys., 18, 5515–5528, https://doi.org/10.5194/acp-18-5515-2018, 2018.
Hennigan, C. J., Izumi, J., Sullivan, A. P., Weber, R. J., and Nenes, A.: A critical evaluation of proxy methods used to estimate the acidity of atmospheric particles, Atmos. Chem. Phys., 15, 2775–2790, https://doi.org/10.5194/acp-15-2775-2015, 2015.
Huang, X. H. H., Bian, Q., Ng, W. M., Louie, P. K. K., and Yu, J. Z.: Characterization of PM2.5 Major Components and Source Investigation in Suburban Hong Kong: A One Year Monitoring Study, Aerosol Air Qual. Res., 14, 237–250, https://doi.org/10.4209/aaqr.2013.01.0020, 2014.
Jia, S., Wang, X., Zhang, Q., Sarkar, S., Wu, L., Huang, M., Zhang, J., and Yang, L.: Technical note: Comparison and interconversion of pH based on different standard states for aerosol acidity characterization, Atmos. Chem. Phys., 18, 11125–11133, https://doi.org/10.5194/acp-18-11125-2018, 2018.
Li, C., Hu, Y., Chen, J., Ma, Z., Ye, X., Yang, X., Wang, L., Wang, X., and Mellouki, A.: Physiochemical properties of carbonaceous aerosol from agricultural residue burning: Density, volatility, and hygroscopicity, Atmos. Environ., 140, 94–105, https://doi.org/10.1016/j.atmosenv.2016.05.052, 2016.
Li, H., Cheng, J., Zhang, Q., Zheng, B., Zhang, Y., Zheng, G., and He, K.: Rapid transition in winter aerosol composition in Beijing from 2014 to 2017: response to clean air actions, Atmos. Chem. Phys., 19, 11485–11499, https://doi.org/10.5194/acp-19-11485-2019, 2019.
Li, W., Xu, L., Liu, X., Zhang, J., Lin, Y., Yao, X., Gao, H., Zhang, D., Chen, J., Wang, W., Harrison, R. M., Zhang, X., Shao, L., Fu, P., Nenes, A., and Shi, Z.: Air pollution–aerosol interactions produce more bioavailable iron for ocean ecosystems, Sci. Adv., 3, e1601749, https://doi.org/10.1126/sciadv.1601749, 2017.
Liu, M., Huang, X., Song, Y., Xu, T., Wang, S., Wu, Z., Hu, M., Zhang, L., Zhang, Q., Pan, Y., Liu, X., and Zhu, T.: Rapid SO2 emission reductions significantly increase tropospheric ammonia concentrations over the North China Plain, Atmos. Chem. Phys., 18, 17933–17943, https://doi.org/10.5194/acp-18-17933-2018, 2018.
Liu, M., Huang, X., Song, Y., Tang, J., Cao, J., Zhang, X., Zhang, Q., Wang, S., Xu, T., Kang, L., Cai, X., Zhang, H., Yang, F., Wang, H., Yu, J. Z., Lau, A. K. H., He, L., Huang, X., Duan, L., Ding, A., Xue, L., Gao, J., Liu, B., and Zhu, T.: Ammonia emission control in China would mitigate haze pollution and nitrogen deposition, but worsen acid rain, P. Natl. Acad. Sci. USA, 116, 7760–7765, https://doi.org/10.1073/pnas.1814880116, 2019.
Masiol, M., Squizzato, S., Formenton, G., Khan, M. B., Hopke, P. K., Nenes, A., Pandis, S. N., Tositti, L., Benetello, F., Visin, F., and Pavoni, B.: Hybrid multiple-site mass closure and source apportionment of PM2.5 and aerosol acidity at major cities in the Po Valley, Sci. Total Environ., 704, 135287, https://doi.org/10.1016/j.scitotenv.2019.135287, 2020.
Nah, T., Guo, H., Sullivan, A. P., Chen, Y., Tanner, D. J., Nenes, A., Russell, A., Ng, N. L., Huey, L. G., and Weber, R. J.: Characterization of aerosol composition, aerosol acidity, and organic acid partitioning at an agriculturally intensive rural southeastern US site, Atmos. Chem. Phys., 18, 11471–11491, https://doi.org/10.5194/acp-18-11471-2018, 2018.
Nenes, A., Pandis, S. N., Weber, R. J., and Russell, A.: Aerosol pH and liquid water content determine when particulate matter is sensitive to ammonia and nitrate availability, Atmos. Chem. Phys., 20, 3249–3258, https://doi.org/10.5194/acp-20-3249-2020, 2020.
Nenes, A., Pandis, S. N., Kanakidou, M., Russell, A. G., Song, S., Vasilakos, P., and Weber, R. J.: Aerosol acidity and liquid water content regulate the dry deposition of inorganic reactive nitrogen, Atmos. Chem. Phys., 21, 6023–6033, https://doi.org/10.5194/acp-21-6023-2021, 2021.
Pye, H. O. T., Zuend, A., Fry, J. L., Isaacman-VanWertz, G., Capps, S. L., Appel, K. W., Foroutan, H., Xu, L., Ng, N. L., and Goldstein, A. H.: Coupling of organic and inorganic aerosol systems and the effect on gas-particle partitioning in the southeastern US, Atmos. Chem. Phys., 18, 357–370, https://doi.org/10.5194/acp-18-357-2018, 2018.
Pye, H. O. T., Nenes, A., Alexander, B., Ault, A. P., Barth, M. C., Clegg, S. L., Collett Jr, J. L., Fahey, K. M., Hennigan, C. J., Herrmann, H., Kanakidou, M., Kelly, J. T., Ku, I. T., McNeill, V. F., Riemer, N., Schaefer, T., Shi, G., Tilgner, A., Walker, J. T., Wang, T., Weber, R., Xing, J., Zaveri, R. A., and Zuend, A.: The acidity of atmospheric particles and clouds, Atmos. Chem. Phys., 20, 4809–4888, https://doi.org/10.5194/acp-20-4809-2020, 2020.
Qiao, L., Cai, J., Wang, H., Wang, W., Zhou, M., Lou, S., Chen, R., Dai, H., Chen, C., and Kan, H.: PM2.5 constituents and hospital emergency-room visits in Shanghai, China, Environ. Sci. Technol., 48, 10406–10414, https://doi.org/10.1021/es501305k, 2014.
Rumsey, I. C., Cowen, K. A., Walker, J. T., Kelly, T. J., Hanft, E. A., Mishoe, K., Rogers, C., Proost, R., Beachley, G. M., Lear, G., Frelink, T., and Otjes, R. P.: An assessment of the performance of the Monitor for AeRosols and GAses in ambient air (MARGA): a semi-continuous method for soluble compounds, Atmos. Chem. Phys., 14, 5639–5658, https://doi.org/10.5194/acp-14-5639-2014, 2014.
Shi, G., Xu, J., Peng, X., Xiao, Z., Chen, K., Tian, Y., Guan, X., Feng, Y., Yu, H., Nenes, A., and Russell, A. G.: pH of Aerosols in a Polluted Atmosphere: Source Contributions to Highly Acidic Aerosol, Environ. Sci. Technol., 51, 4289–4296, https://doi.org/10.1021/acs.est.6b05736, 2017.
Shi, X., Nenes, A., Xiao, Z., Song, S., Yu, H., Shi, G., Zhao, Q., Chen, K., Feng, Y., and Russell, A. G.: High-Resolution Data Sets Unravel the Effects of Sources and Meteorological Conditions on Nitrate and Its Gas-Particle Partitioning, Environ. Sci. Technol., 53, 3048–3057, https://doi.org/10.1021/acs.est.8b06524, 2019.
Shi, X., Zheng, Y., Lei, Y., Xue, W., Yan, G., Liu, X., Cai, B., Tong, D., and Wang, J.: Air quality benefits of achieving carbon neutrality in China, Sci. Total Environ., 795, 148784, https://doi.org/10.1016/j.scitotenv.2021.148784, 2021.
Song, S., Gao, M., Xu, W., Shao, J., Shi, G., Wang, S., Wang, Y., Sun, Y., and McElroy, M. B.: Fine-particle pH for Beijing winter haze as inferred from different thermodynamic equilibrium models, Atmos. Chem. Phys., 18, 7423–7438, https://doi.org/10.5194/acp-18-7423-2018, 2018.
Stieger, B., Spindler, G., Fahlbusch, B., Müller, K., Grüner, A., Poulain, L., Thöni, L., Seitler, E., Wallasch, M., and Herrmann, H.: Measurements of PM10 ions and trace gases with the online system MARGA at the research station Melpitz in Germany – A five-year study, J. Atmos. Chem., 75, 33–70, https://doi.org/10.1007/s10874-017-9361-0, 2018.
Su, H., Cheng, Y., and Poschl, U.: New Multiphase Chemical Processes Influencing Atmospheric Aerosols, Air Quality, and Climate in the Anthropocene, Acc Chem. Res., 53, 2034–2043, https://doi.org/10.1021/acs.accounts.0c00246, 2020.
Tan, T., Hu, M., Li, M., Guo, Q., Wu, Y., Fang, X., Gu, F., Wang, Y., and Wu, Z.: New insight into PM2.5 pollution patterns in Beijing based on one-year measurement of chemical compositions, Sci. Total Environ., 621, 734–743, https://doi.org/10.1016/j.scitotenv.2017.11.208, 2018.
Tao, W., Su, H., Zheng, G., Wang, J., Wei, C., Liu, L., Ma, N., Li, M., Zhang, Q., Pöschl, U., and Cheng, Y.: Aerosol pH and chemical regimes of sulfate formation in aerosol water during winter haze in the North China Plain, Atmos. Chem. Phys., 20, 11729–11746, https://doi.org/10.5194/acp-20-11729-2020, 2020.
Tao, Y. and Murphy, J. G.: The sensitivity of PM2.5 acidity to meteorological parameters and chemical composition changes: 10-year records from six Canadian monitoring sites, Atmos. Chem. Phys., 19, 9309–9320, https://doi.org/10.5194/acp-19-9309-2019, 2019.
Tilgner, A., Schaefer, T., Alexander, B., Barth, M., Collett Jr., J. L., Fahey, K. M., Nenes, A., Pye, H. O. T., Herrmann, H., and McNeill, V. F.: Acidity and the multiphase chemistry of atmospheric aqueous particles and clouds, Atmos. Chem. Phys., 21, 13483–13536, https://doi.org/10.5194/acp-21-13483-2021, 2021.
Tong, D., Cheng, J., Liu, Y., Yu, S., Yan, L., Hong, C., Qin, Y., Zhao, H., Zheng, Y., Geng, G., Li, M., Liu, F., Zhang, Y., Zheng, B., Leon, C., and Zhang, Q.: Dynamic projection of anthropogenic emissions in China: methodology and 2015–2050 emission pathways under a range of socio-economic, climate policy, and pollution control scenarios, Atmos. Chem. Phys., 20, 5729–5757, https://doi.org/10.5194/acp-20-5729-2020, 2020.
Turpin, B. J. and Lim, H.-J.: Species Contributions to PM2.5 Mass Concentrations: Revisiting Common Assumptions for Estimating Organic Mass, Aerosol Sci. Tech., 35, 602–610, https://doi.org/10.1080/02786820119445, 2001.
Vasilakos, P., Russell, A., Weber, R., and Nenes, A.: Understanding nitrate formation in a world with less sulfate, Atmos. Chem. Phys., 18, 12765–12775, https://doi.org/10.5194/acp-18-12765-2018, 2018.
Wang, H., Ding, J., Xu, J., Wen, J., Han, J., Wang, K., Shi, G., Feng, Y., Ivey, C. E., Wang, Y., Nenes, A., Zhao, Q., and Russell, A. G.: Aerosols in an arid environment: The role of aerosol water content, particulate acidity, precursors, and relative humidity on secondary inorganic aerosols, Sci. Total Environ., 646, 564–572, https://doi.org/10.1016/j.scitotenv.2018.07.321, 2019.
Wang, S., Wang, L., Li, Y., Wang, C., Wang, W., Yin, S., and Zhang, R.: Effect of ammonia on fine-particle pH in agricultural regions of China: comparison between urban and rural sites, Atmos. Chem. Phys., 20, 2719–2734, https://doi.org/10.5194/acp-20-2719-2020, 2020.
Weber, R. J., Guo, H., Russell, A. G., and Nenes, A.: High aerosol acidity despite declining atmospheric sulfate concentrations over the past 15 years, Nat. Geosci., 9, 282–285, https://doi.org/10.1038/ngeo2665, 2016.
Xie, Y., Wang, G., Wang, X., Chen, J., Chen, Y., Tang, G., Wang, L., Ge, S., Xue, G., Wang, Y., and Gao, J.: Nitrate-dominated PM2.5 and elevation of particle pH observed in urban Beijing during the winter of 2017, Atmos. Chem. Phys., 20, 5019–5033, https://doi.org/10.5194/acp-20-5019-2020, 2020.
Zheng, B., Tong, D., Li, M., Liu, F., Hong, C., Geng, G., Li, H., Li, X., Peng, L., Qi, J., Yan, L., Zhang, Y., Zhao, H., Zheng, Y., He, K., and Zhang, Q.: Trends in China's anthropogenic emissions since 2010 as the consequence of clean air actions, Atmos. Chem. Phys., 18, 14095–14111, https://doi.org/10.5194/acp-18-14095-2018, 2018.
Zheng, G., Su, H., Wang, S., Andreae, M. O., Poschl, U., and Cheng, Y.: Multiphase buffer theory explains contrasts in atmospheric aerosol acidity, Science, 369, 1374–1377, 2020.
Zhou, M., Qiao, L., Zhu, S., Li, L., Lou, S., Wang, H., Wang, Q., Tao, S., Huang, C., and Chen, C.: Chemical characteristics of fine particles and their impact on visibility impairment in Shanghai based on a 1-year period observation, J. Environ. Sci. (China), 48, 151–160, https://doi.org/10.1016/j.jes.2016.01.022, 2016.