the Creative Commons Attribution 4.0 License.
the Creative Commons Attribution 4.0 License.
 | 01 Nov 2022
Not all types of secondary organic aerosol mix: two phases observed when mixing different secondary organic aerosol types
Fabian Mahrt
Long Peng
Julia Zaks
Yuanzhou Huang
Paul E. Ohno
Natalie R. Smith
Florence K. A. Gregson
Yiming Qin
Celia L. Faiola
Scot T. Martin
Sergey A. Nizkorodov
Markus Ammann
Secondary organic aerosol (SOA) constitutes a large fraction of atmospheric aerosol. To assess its impacts on climate and air pollution, knowledge of the number of phases in internal mixtures of different SOA types is required. Atmospheric models often assume that different SOA types form a single phase when mixed. Here, we present visual observations of the number of phases formed after mixing different anthropogenic and biogenic SOA types. Mixing SOA types generated in environmental chambers with oxygen-to-carbon () ratios between 0.34 and 1.05, we found 6 out of 15 mixtures of two SOA types to result in two phase particles. We demonstrate that the number of phases depends on the difference in the average ratio between the two SOA types (). Using a threshold of 0.47, we can predict the phase behavior of over 90 % of our mixtures, with one- and two-phase particles predicted for and , respectively. This threshold value provides a simple parameter to predict whether mixtures of fresh and aged SOA form one- or two-phase particles in the atmosphere. In addition, we show that phase-separated SOA particles form when mixtures of volatile organic compounds emitted from real trees are oxidized.
- Article
(2932 KB) - Full-text XML
-
Supplement
(11881 KB) - BibTeX
- EndNote


Secondary organic aerosol (SOA) particles make up 30 %–70 % of submicron atmospheric aerosols by mass (Hallquist et al., 2009). SOA particles form through condensed phase processes and by gas-phase oxidation of precursors, such as volatile organic compounds (VOCs), followed by gas–particle partitioning of the lower-volatility reaction products (Hallquist et al., 2009; Ervens et al., 2011).
The importance of SOA in the environment is widely recognized. SOA influences atmospheric chemistry (Pöschl and Shiraiwa, 2015) and affects human health (Baltensperger et al., 2008; Nault et al., 2021). SOA particles also play a key role in climate (Kanakidou et al., 2005; Shrivastava et al., 2017) either directly, through scattering of incoming shortwave radiation, or indirectly, by acting as cloud nuclei (Wolf et al., 2020; Lambe et al., 2011).
Due to the variety of precursors and oxidation pathways involved in SOA formation, atmospheric SOA particles usually contain a multitude of different oxygenated species (Nozière et al., 2015; Goldstein and Galbally, 2007). Owing to this complexity, SOA ranks among the least understood aerosol types (Chung and Seinfeld, 2002; Hallquist et al., 2009). As an important example, the number of phases formed when different SOA types become internally mixed remains poorly understood. Different types of SOA can be internally mixed within individual particles (Fig. 1a) by a range of processes, including coagulation of particles of different SOA types, gas–particle partitioning, multiphase chemical reactions, and cloud processing (Marcolli et al., 2004a; Riemer et al., 2019; Ervens et al., 2008). We refer to these as SOA + SOA particles.
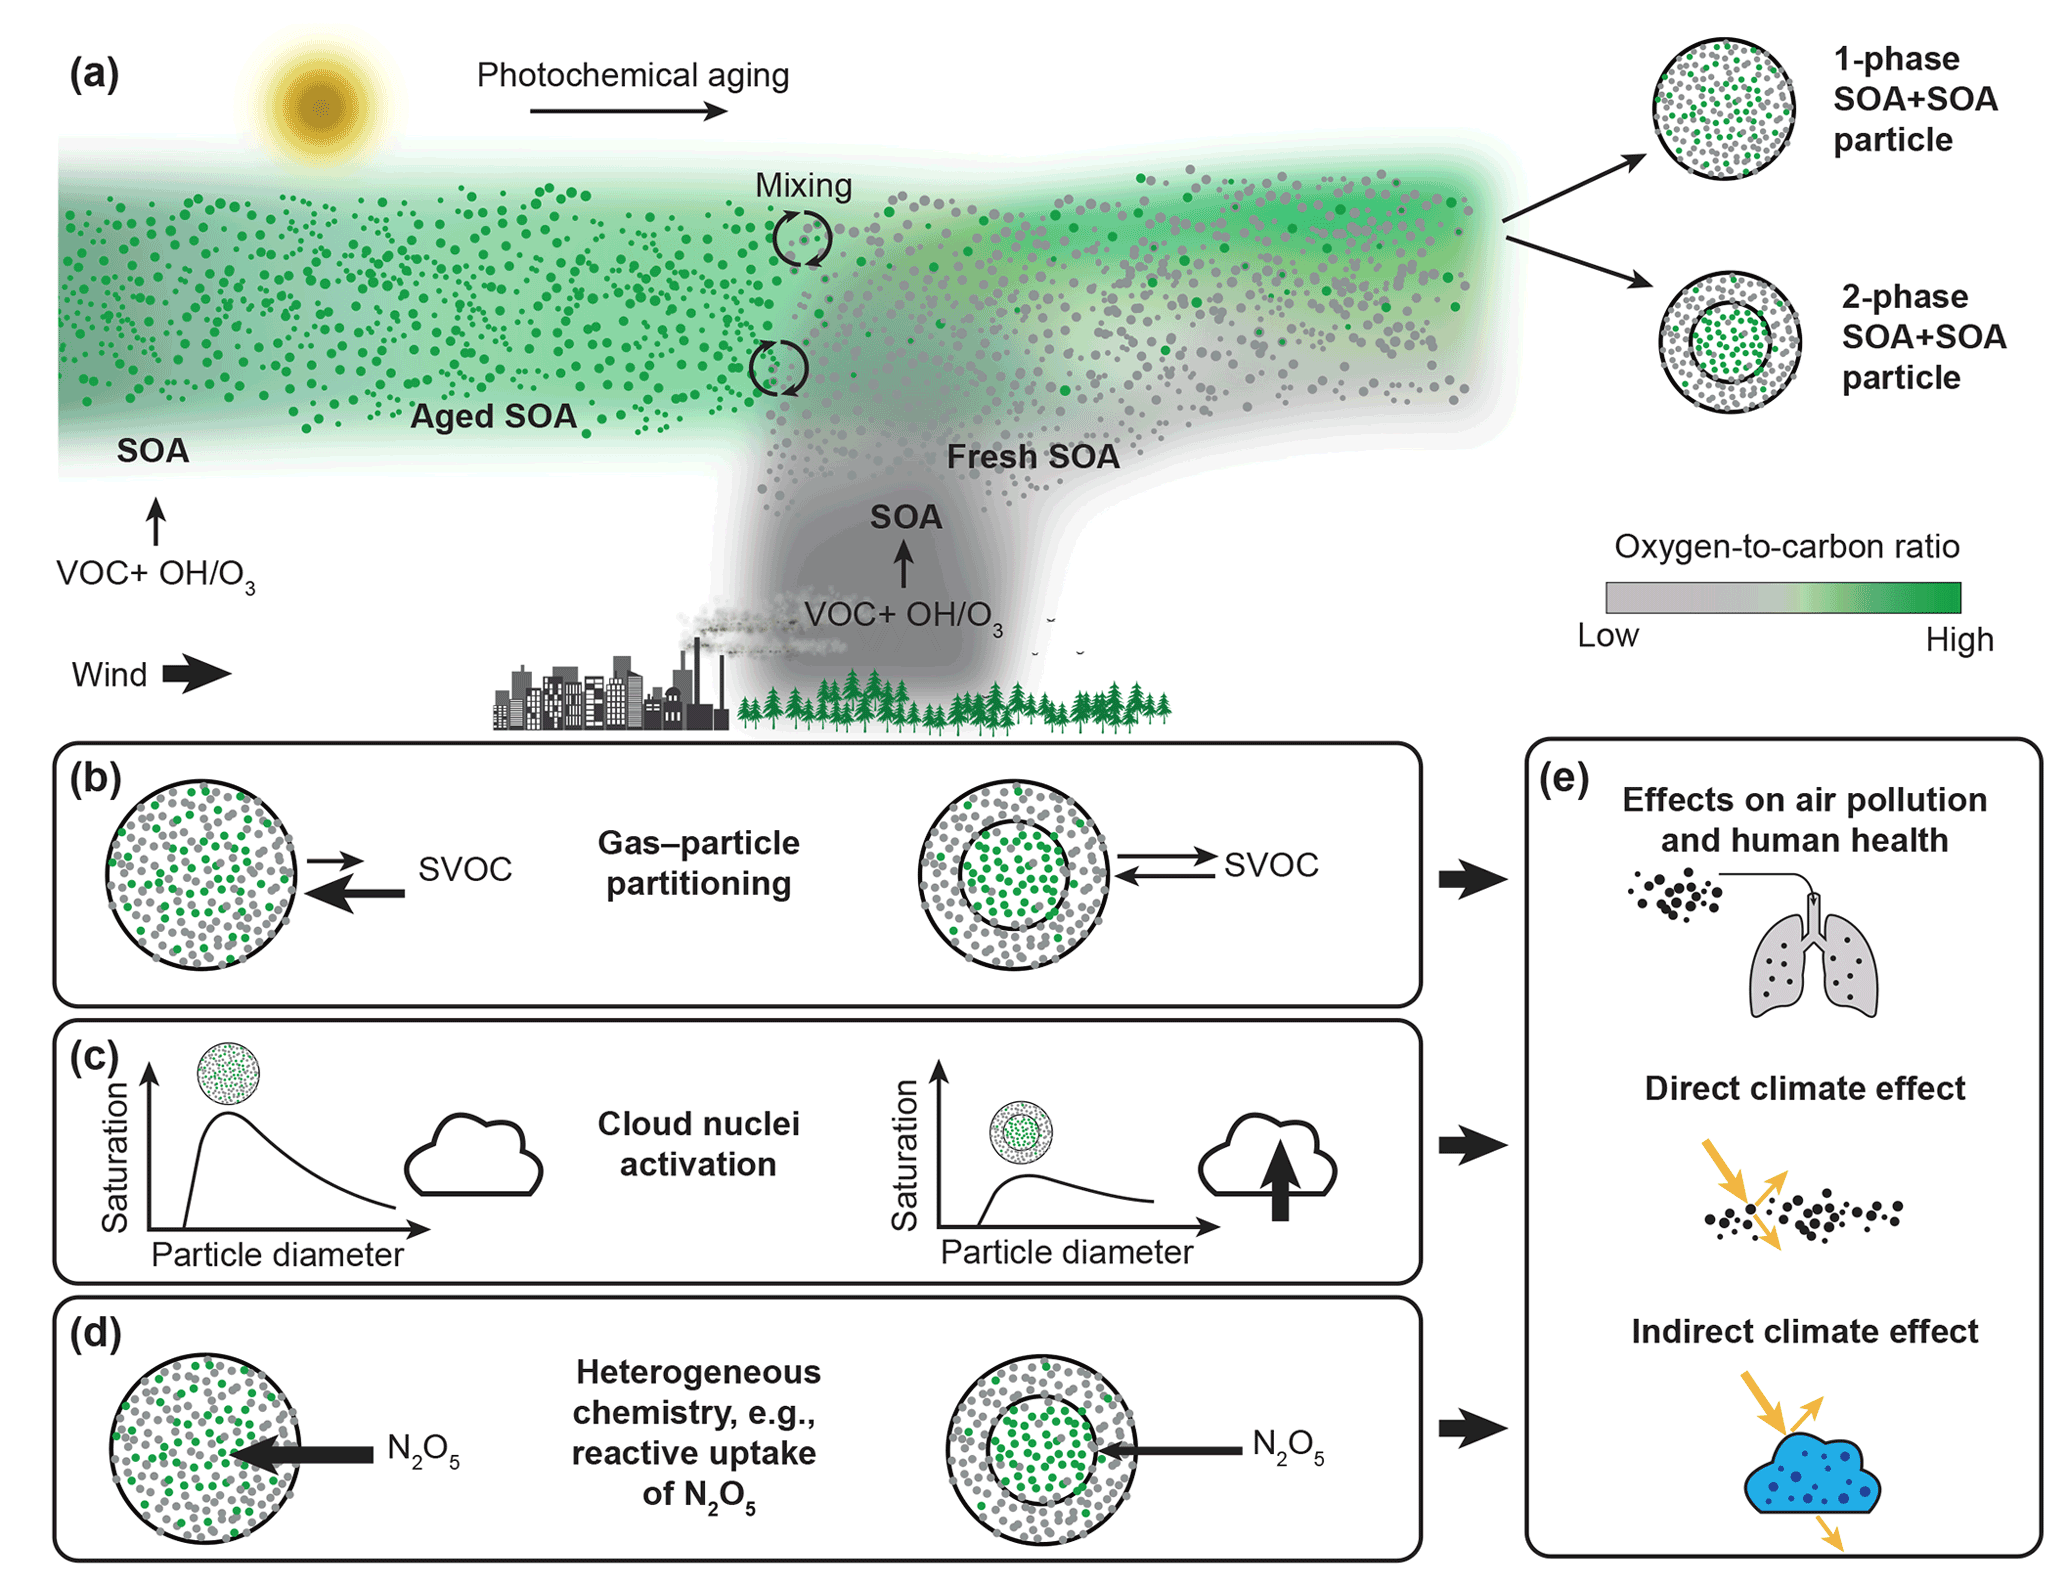
Figure 1Formation of aerosol particles containing internal mixtures of different SOA types and impacts of the resulting number of condensed phases on air quality, human health, and climate. (a) Mixing of air masses containing aged, highly oxidized background SOA material with air masses containing fresh, less oxidized SOA can result in SOA + SOA particles, with either one or two condensed phases, depending on the difference in the average ratio of the aged and fresh SOA types that become internally mixed. (b) Organic molecules in single-phase SOA mixtures have reduced equilibrium partial pressures compared to when the two SOA types form distinct phases, allowing for an enhanced uptake of semi-volatile organic compounds (SVOCs). (c) The presence of a less oxidized organic phase making up the shell of a phase-separated SOA particle can lower the surface tension and thus allow the phase-separated particles to activate into liquid cloud droplets at lower supersaturations compared to SOA particles with a single, homogeneous organic phase. (d) The presence of a less oxidized organic phase of low water content can act as a diffusive barrier for mass transfer and affect heterogeneous chemistry, e.g., by limiting the reactive uptake of N2O5. (e) Altogether, the presence of multiple phases in SOA particles can have important implications for the impact of SOA on air pollution, human health, and climate. Figure based on Reid et al. (2018).
Knowledge of the number and types of phases in SOA + SOA particles is needed to represent SOA formation in atmospheric models and to assess their role in air quality, health, and climate (Fig. 1b–e). For example, predictions of gas–particle partitioning, and ultimately SOA mass, depend on the number and types of phases. SOA formation in models is often represented as absorptive gas–particle partitioning of semi-volatile species (Donahue et al., 2006; Odum et al., 1996; Pankow, 1994; Bowman et al., 1997). In addition, most modeling studies (e.g., Strader et al., 1999; Carlton et al., 2010) assume the formation of a single condensed organic phase when SOA types from different sources mix. In the case of a single phase, the activities of the organic molecules are lowered, in turn lowering their equilibrium partial pressures. Conversely, the equilibrium partial pressure is greater if the different SOA types form separate phases due to repulsive intermolecular forces between immiscible organic molecules. A lower equilibrium partial pressure shifts the thermodynamic gas–particle equilibrium to the condensed phase, enhancing uptake of semi-volatile vapors (Fig. 1b). Such enhancement will be smaller or absent in case of two-phase organic particles, depending on whether the different SOA types are partially or completely immiscible. Thus, models that assume a single organic phase can overpredict particulate organic mass concentrations if SOA mixtures form multiple condensed phases.
The presence of multiple organic phases can further affect the ability of the SOA particles to act as cloud nuclei by impacting the surface composition (Fig. 1c, e.g., Huang et al., 2021; Ovadnevaite et al., 2017), with implications for their direct climate effect. In addition, in phase-separated SOA particles with a core-shell morphology, the shell can shield the core from the surrounding gas phase and can act as a resistor for mass transfer, impacting heterogeneous chemistry. As an example, the presence of a SOA shell phase of low water content could considerably limit the reactive uptake of N2O5 into a SOA core phase that often has higher water content (Fig. 1d, Folkers et al., 2003; Anttila et al., 2007). Based on the discussion above, it is imperative to consider the number of phases in SOA + SOA particles when predicting the impact of SOA on air pollution, health, and climate (Fig. 1e).
Despite the influence on predictions of organic mass concentrations, cloud formation ability, and heterogeneous chemistry, our knowledge of the number of phases in internal SOA mixtures remains uncertain. Several previous studies investigated the miscibility of a single-component oxidized organic compound, which was used as a proxy of atmospheric SOA, with SOA material generated in environmental chambers (Song et al., 2011; Ye et al., 2016a; Gorkowski et al., 2020, 2017; Ye et al., 2018a; Gordon et al., 2016) (Table S1). While complete mixing was observed in some experiments, other experiments reported distinct phases, i.e., no mixing. All of these studies were limited to SOA material generated from α-pinene ozonolysis, while in the atmosphere SOA forms from different precursors.
The miscibility of two SOA types that were both generated in environmental chambers has only been investigated in a few studies (Table S2). In some of these studies (Ye et al., 2016b, 2018b; Robinson et al., 2013) two different SOA populations were independently produced and subsequently mixed. In these studies, some mixing was observed, at least at high relative humidity (RH) conditions when diffusion limitations within the particles were minimal. Nevertheless, these studies were unable to distinguish between single-phase particles (complete miscibility) and two-phase particles (partial or complete miscibility), meaning that the number of phases could not be conclusively constrained. Thus, there is a real need for experiments that directly determine the number of phases visually after mixing two SOA types and to link the properties of the SOA types with the number of SOA phases for predictive purposes.
Here, using microscopy, we observed the number of phases in particles containing SOA mixtures. We produced different SOA types within environmental chambers from oxidation of single precursors, including α-pinene, β-caryophyllene, farnesene, valencene, catechol, and toluene. In addition, we investigated the phase behavior of SOA particles generated from oxidation of real tree emissions. We used the elemental oxygen-to-carbon () ratio to link the SOA properties with the number of phases and show that two-phase SOA + SOA particles can form if the difference in the ratio between the SOA types is sufficiently large.
Before studying SOA mixtures, we determined the phase behavior of the unmixed SOA types between 90 % and 0 % RH. The individual SOA types formed single-phase particles in this RH range (Fig. S5) and were present in an amorphous phase state, since the particles did not have irregular features that would indicate crystalline material. An amorphous state is often the thermodynamic stable phase in multicomponent organics (Marcolli et al., 2004b).
Depicted in Fig. 2 are example fluorescence microscopy images of internally mixed SOA + SOA particles recorded between 90 % and 0 % RH. The absence or presence of multiple phases was determined based on the absence or presence of multiple colors within individual particles (Sect. A2.1). We observed particles with a single phase when SOA from α-pinene ozonolysis was mixed with SOA from β-caryophyllene ozonolysis. By contrast, two phases formed when SOA from β-caryophyllene ozonolysis was mixed with SOA from toluene photooxidation.
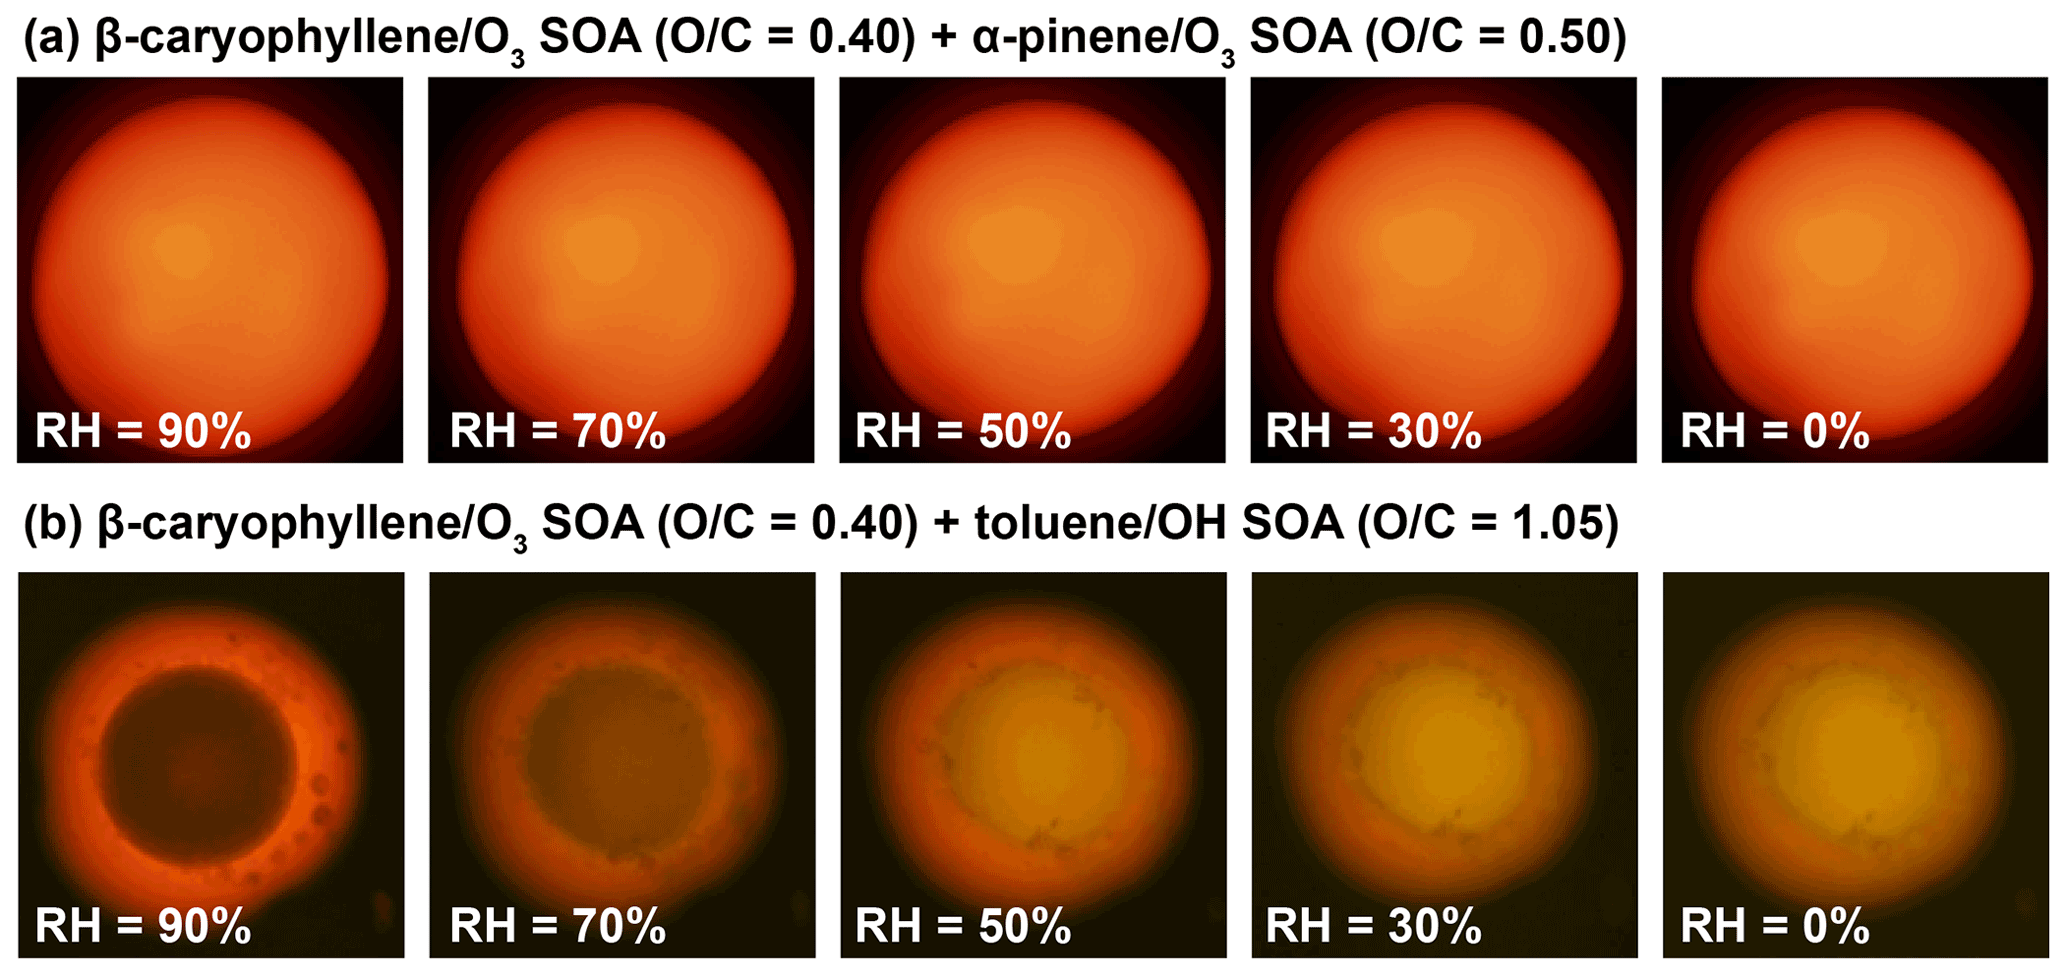
Figure 2Example fluorescence microscopy images of internally mixed particles of two different types of SOA material at different relative humidity (RH) levels. (a) Mixture of SOA materials derived from β-caryophyllene and α-pinene ozonolysis, showing single-phase particles between 90 % and 0 % RH. (b) Mixture of SOA material derived from β-caryophyllene ozonolysis and toluene photooxidation, showing phase-separated particles between 90 % and 0 % RH. The colors result from trace amounts of Nile red within the SOA + SOA particles, and the presence of different colors indicates the presence of multiple phases. Also indicated above each row is the average elemental oxygen-to-carbon () ratio of each SOA type, as determined from aerosol mass spectrometer measurements. Images were recorded for RH values decreasing from high to low values. The small inclusions in the outer phase of the β-caryophyllene SOA and toluene SOA mixture represent an emulsified, transient morphology.
Figures S6–S10 show images of all 15 SOA + SOA mixtures studied. For all mixtures, there was no dependence of the phase behavior on humidity between 90 % and 0 % RH. A summary is presented in Fig. 3. In 9 out of 15 mixtures we observed single-phase particles, i.e., complete miscibility. In six mixtures we observed two-phase particles. In these cases, we could not distinguish whether phase separation resulted in partial- or complete-immiscible phases.

Figure 3Summary of phase behavior of internal mixtures of two different types of SOA materials. (a) Experimental matrix showing the number of (non-crystalline) phases for the SOA + SOA mixtures studied for RHs between 90 % and 0 %. Given along with each SOA type is the average elemental oxygen-to-carbon () ratio, the chemical formula of the precursor gas, and the oxidant used to oxidize the precursor. (b) Number of phases observed for RH between 90 % and 0 % for the SOA + SOA particles as a function of the average ratio of the two SOA types. Error bars indicate the 12 % relative uncertainty of the average ratio of each SOA type (average absolute value of relative error for multi-species organic aerosol, Canagaratna et al., 2015), as determined with the aerosol mass spectrometer (Table S3). The dotted lines indicate isolines of the differences in the average of two SOA types within a mixture, , and are given for intervals of . In all the panels, blue and rose symbols mark internal SOA + SOA mixtures with one and two phases, respectively. See Figs. S6–S10 for fluorescence images of all SOA + SOA mixtures.
To determine whether multiple organic phases also form in more complex SOA, we performed additional phase behavior experiments using SOA particles generated from photooxidation of VOCs emitted by real pine trees. Tree emissions involve complex blends of volatiles, which upon oxidation result in mixtures of different SOA types, thus representing increasingly realistic SOA mixtures. Images from these experiments demonstrate that two SOA phases are present in these particles between 90 % and 0 % RH (Fig. S11). This is consistent with previous observations of multiple organic phases in SOA particles generated by photooxidation of VOC mixtures (Smith et al., 2021; Song et al., 2019). The combined results further emphasize the importance of multiple phases in atmospheric SOA.
In Fig. 3b we show the number of phases as a function of the average ratios of the two SOA types, to link the phase behavior with chemical properties. Phase-separated SOA + SOA particles were observed if the average ratio of one SOA type was high and the average ratio of the other SOA type was low. To further elucidate this dependence, we calculated the absolute difference in the average ratios between the two SOA types, i.e., . Here, SOA1 and SOA2 are the average ratios of SOA1 and SOA2, respectively. Figure 4 shows the number of phases within our SOA + SOA particles as a function of the value. One- and two-phase SOA + SOA particles are associated with low and high values, respectively, as described by
Equation (1), with a threshold value of , describes 14 out of the 15 mixtures studied (Fig. 4). The value of the real tree SOA is not well defined because the molecules making up the real tree SOA particles are formed from different VOCs and reaction pathways, each yielding molecules with a different ratio. Nonetheless, we expect molecules with a wide range of ratios in the real tree SOA. Thus, the observation of multiple phases in these particles is consistent with our results from the SOA + SOA mixtures.
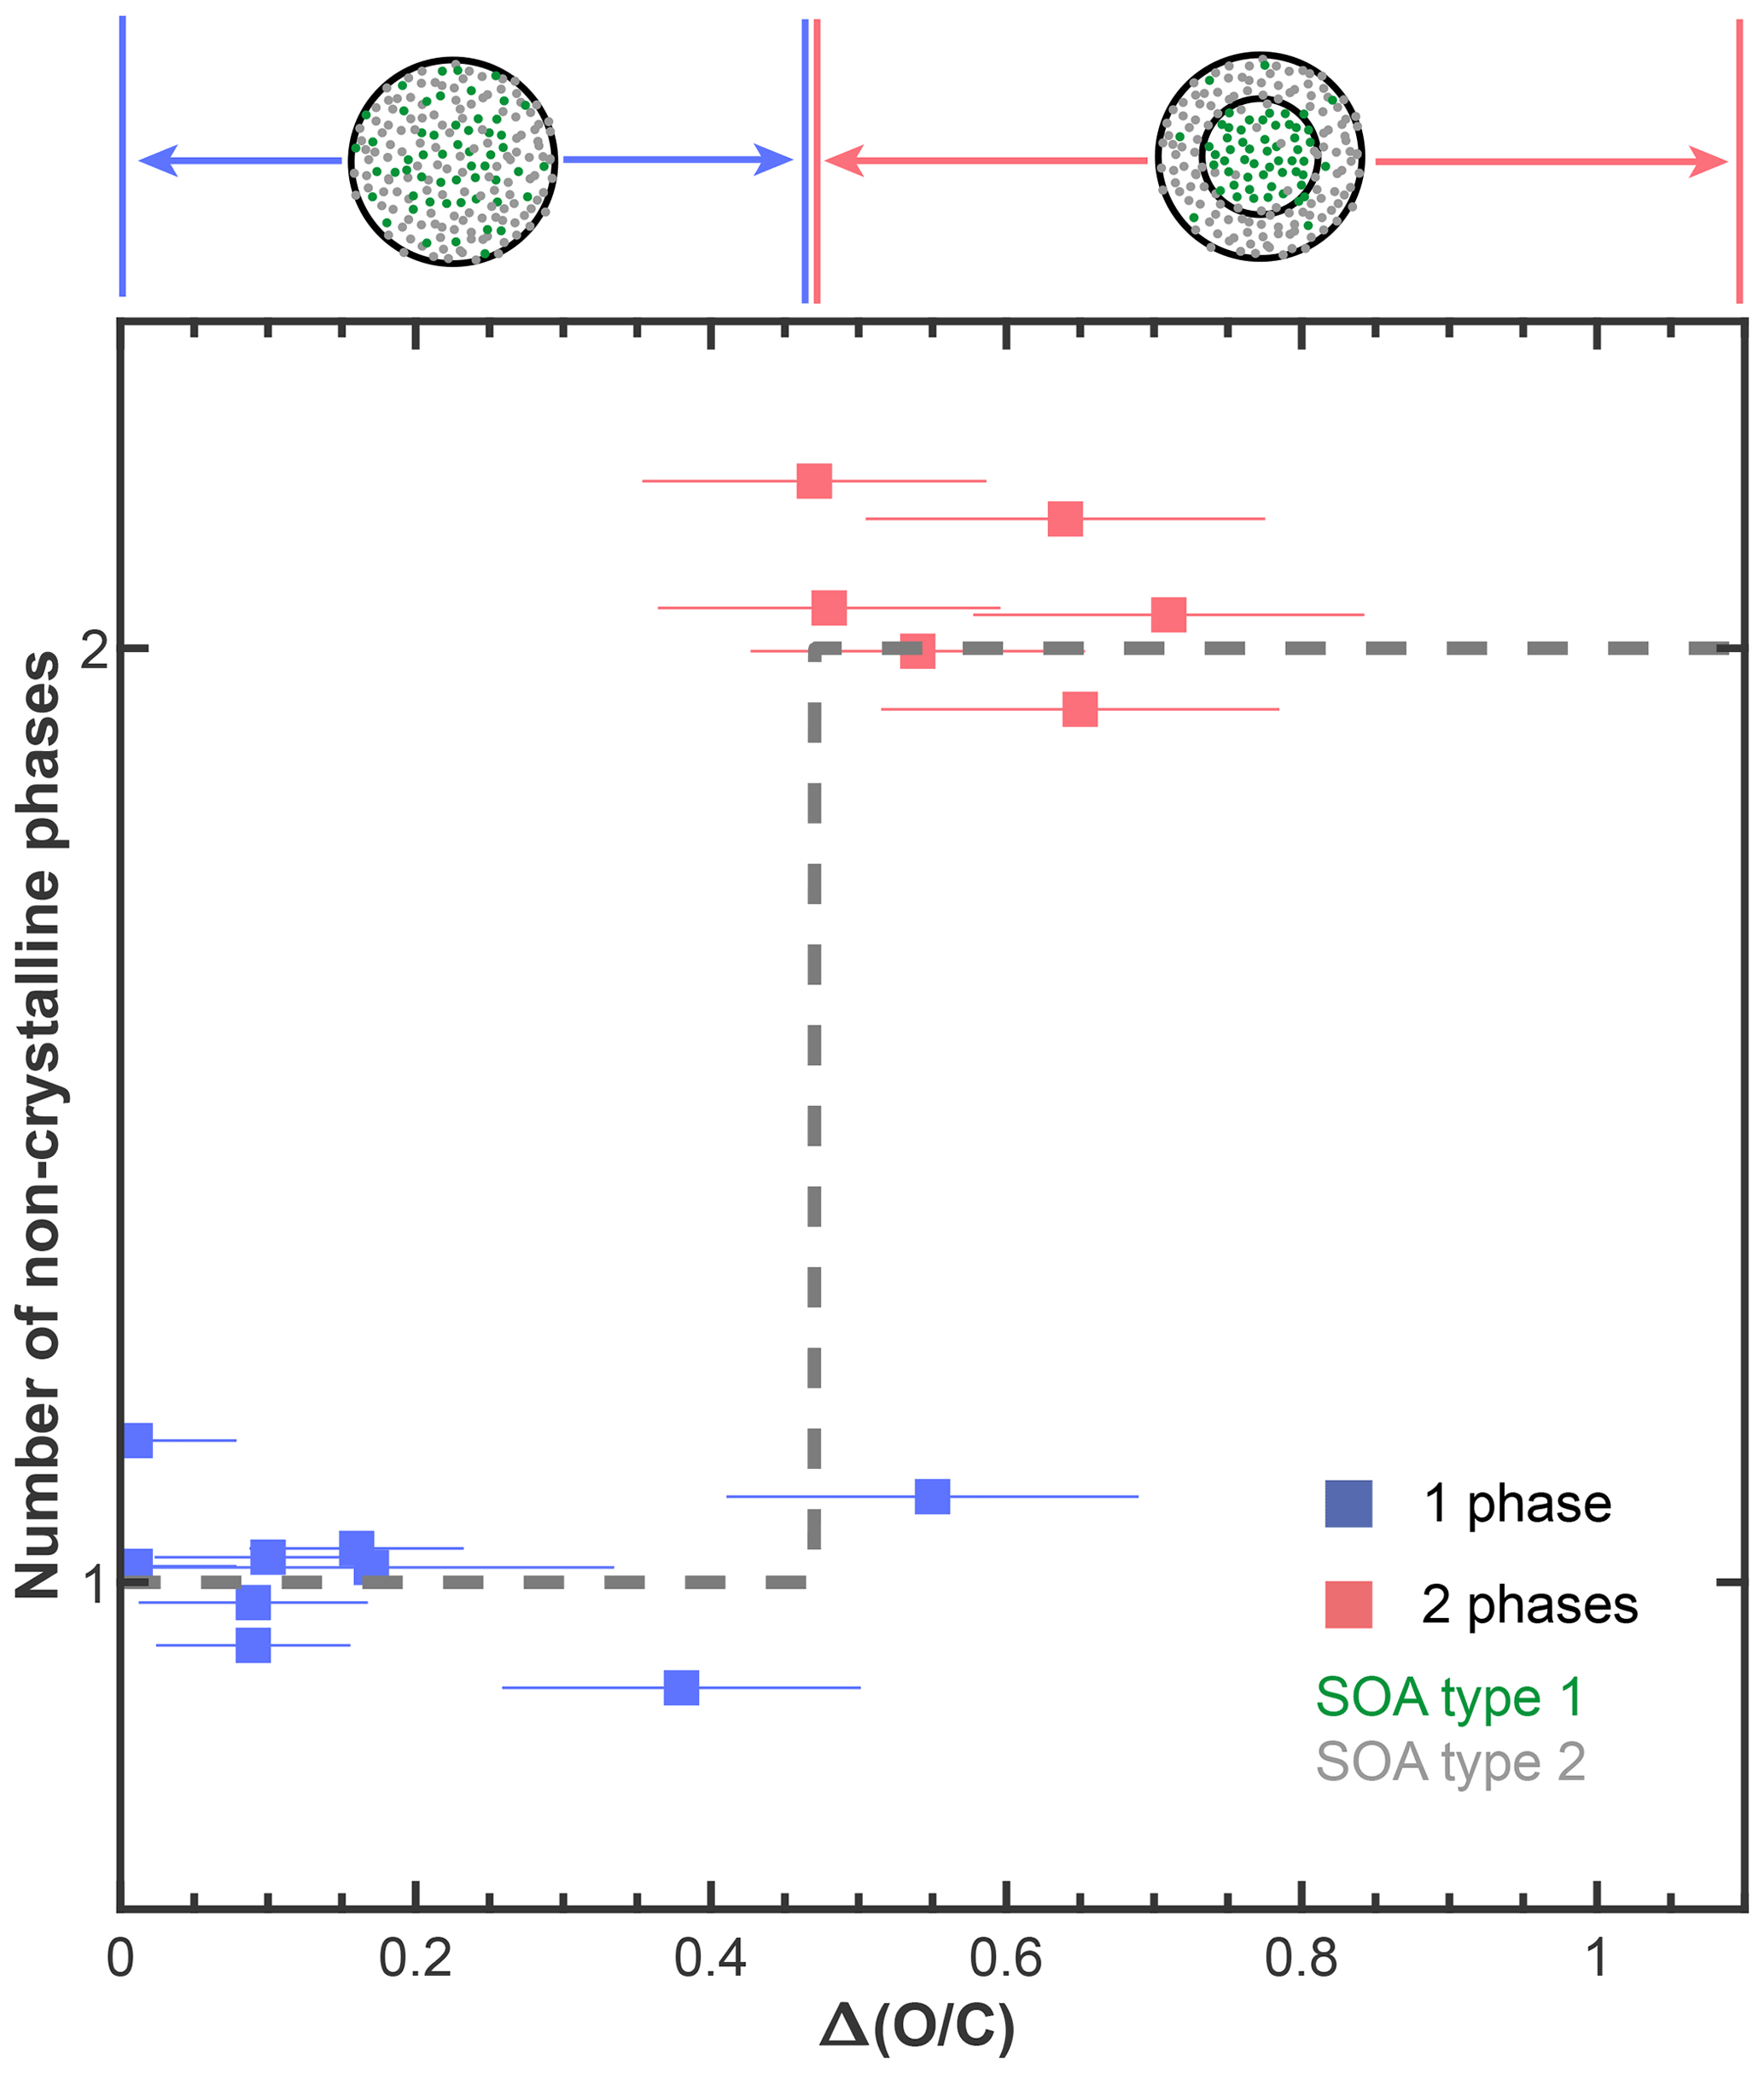
Figure 4Summary of the number of phases observed in our internally mixed SOA + SOA particles as a function of the absolute difference in the average ratios between the two SOA types within a mixture, . The horizontal error bars indicate the propagated error from the 12 % relative uncertainty of the ratios determined for each SOA type (average absolute value of relative error for multi-species organic aerosol; Table S3; Canagaratna et al., 2015). The black, dashed line shows an empirical classification of the form of Eq. (1) to our phase behavior data. The data points are randomly vertically offset around values of 1 and 2 for clarity and to reduce the overlap between the data points.
A trend of the SOA + SOA phase behavior depending on the is expected, because the average ratios are related to the polarities and hydrophilicities of the SOA types that in turn determine the phase behavior (Zuend et al., 2010; Ye et al., 2018a; Gorkowski et al., 2020, 2019). While information on the more molecular interactions of oxidized molecules that drive the phase behavior as well as other SOA properties beyond the ratio of the organics could further benefit description of the phase behavior (Sect. S9), the ratio of organics has been shown to be a reasonable indicator of the phase behavior of inorganic–organic mixtures (e.g., Song et al., 2012; You et al., 2012, 2013) and organic–organic mixtures (e.g., Gorkowski et al., 2020; Song et al., 2020). If the of a SOA + SOA mixture is low, the polarities of the molecules within the mixture are often similar to each other. Following the principle of “like dissolves like”, the SOA compounds in such cases are often similar enough to mix completely. Conversely, if the of a SOA + SOA mixture is large, the polarities of the SOA compounds are often different from each other, causing them to more likely form different polarity phases or mix only partially.
For phase-separated SOA + SOA particles, we cannot resolve partial miscibility and complete immiscibility. The ratios used here denote the arithmetic means of the distributions of ratios of the individual molecules making up either SOA type. For sufficient contrast in the average ratios and non-overlapping ratio distributions of the two SOA types, complete immiscibility is expected to prevail. By contrast, if the two SOA types have overlapping ratio distributions, partial miscibility between the two SOA types is expected to prevail. In this case, the more oxidized organics likely partition into a high-polarity organic phase, predominantly formed by the SOA type with the higher average ratio. By comparison, the less oxidized organics likely partition into a medium-polarity organic phase that is predominantly formed by the SOA type with the lower average ratio. Thus, in addition to the average ratios of the SOA types, the widths of their ratio distributions of the condensed products as well as the overlap of the distributions likely play a role in the phase behavior of SOA + SOA particles. Providing such detailed information together with phase behavior data is an important topic for future studies.
In the atmosphere, different air masses often contain SOA with different degrees of oxidation that can become mixed during transport. For instance, if air masses containing aged SOA are transported over urban or rural environments, particles containing internal mixtures of fresh and aged SOA can form (Fig. 1a) by a range of processes, including coagulation, gas–particle partitioning, and multiphase chemical reactions and cloud processing (Marcolli et al., 2004a; Riemer et al., 2019; Ervens et al., 2008). Modeling studies typically assume that the fresh and aged SOA form a single condensed phase (e.g., Pankow, 1994). The observations herein challenge that approach, suggesting that two organic phases of different polarities will form when internally mixing fresh and aged SOA if their difference in the average ratio is larger than or equal to 0.47 (Fig. 4). For these cases, atmospheric models that assume a single organic phase and absorptive gas–particle partitioning of semi-volatile species might overpredict condensed-phase organic mass concentrations, with implications for air quality and climate projections (Fig. 1).
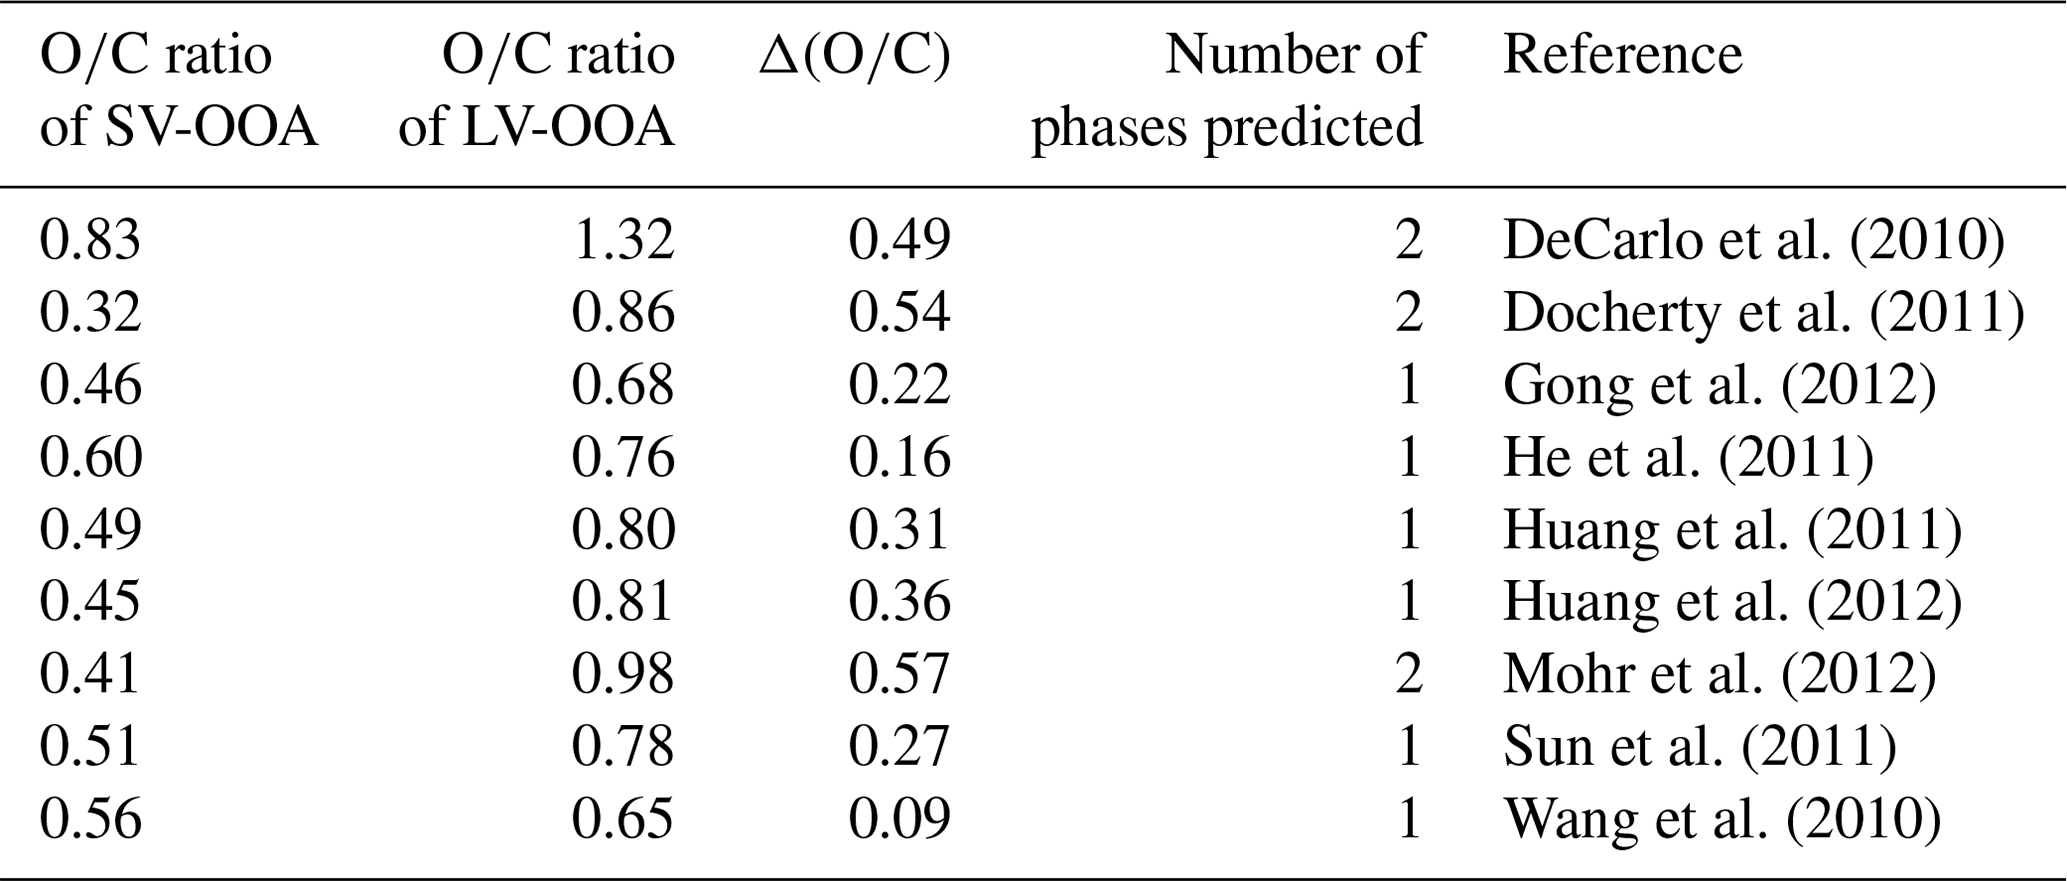
Two main subclasses of ambient SOA types have been identified from aerosol mass spectrometer (AMS) measurements: semi-volatile oxygenated organic aerosol (SV-OOA) and low-volatility oxygenated organic aerosol (LV-OOA, Jimenez et al., 2009). SV-OOA and LV-OOA have average ratios between approximately 0.32 and 0.83 and between 0.68 and 1.32, respectively (Canagaratna et al., 2015). SV-OOA represents fresh, less oxidized SOA, whereas LV-OOA represents aged, more oxidized SOA (Jimenez et al., 2009). In the troposphere, SV-OOA and LV-OOA often co-exist. Table 2 lists the ratios of SV-OOA and LV-OOA observed in several field studies along with the between these subclasses. Assuming our threshold of 0.47 applies to these subclasses, two phases are predicted in three out of nine cases. Taken together, the overall picture that emerges from our results and those reported previously is that it is imperative to consider the presence of multiple SOA phases when predicting SOA formation and its environmental impacts. Nonetheless, further experimental and modeling studies are needed to fully explore and quantify associated environmental implications and address the uncertainties remaining from our study.
One of the uncertainties when extrapolating our results to the atmosphere is that all our experiments were limited to supermicron particles. Previous studies have shown that phase separation can become volume-restricted for particles with diameters below 40 nm (Kucinski et al., 2019). Thus, we anticipate that our results will apply to particles larger than 40 nm, but note that further measurements on this topic are needed. In addition, our experiments were limited to average SOA-to-SOA mixing ratios between approximately 0.06 and 1.08. The dependence of the number of phases on the mass mixing ratio of the SOA types warrants additional studies. Further experiments are also needed to establish a better understanding of the impacts of other SOA properties such as viscosity or molecular weight on the number of phases in SOA + SOA particles. Studies with additional SOA types would also be useful for increasing the size of the data set used to develop the framework, and confirming the framework applies to a wide range of molecular weights and functional groups of the condensed-phase SOA products. In addition, experiments with ternary mixtures of different SOA types would also be interesting. Lastly, there is a need to better understand how the distributions of the condensed products within the SOA types impact the phase behavior.
A1 Methods of generating internally mixed SOA + SOA particles
Six different SOA types were investigated. Each SOA type was generated from oxidation of a commercial precursor by either ozonolysis or photooxidation of the corresponding vapor in different environmental chambers. The chambers used for SOA generation in this study were an environmental chamber at the University of British Columbia (UBC-EC), an oxidation flow reactor available at UBC (UBC-OFR), and an oxidation flow reactor at Harvard University (HU-OFR), which are described in detail in Sect. S2. Here, we refer to mixtures of two distinct SOA types as SOA + SOA particles to emphasize their nature of combining two different SOA types that were each generated from oxidation of single precursors in environmental chambers and to distinguish these experiments from the more complex SOA mixtures generated from real tree emissions. To generate the internally mixed SOA + SOA particles, we used two different approaches that are described in more detail below.
A1.1 Consecutive generation and impaction
In the first approach, one SOA type was produced and collected onto hydrophobic glass slides by inertial impaction. Subsequently, another SOA type was produced and impacted onto the same glass slides, where the particles of the first SOA type had already been collected. We refer to this approach as the consecutive generation and impaction method. In total, the consecutive generation and impaction method was used in 12 out of the 15 SOA mixtures studied (Table 1). For this method, the different SOA types were generated in the UBC-EC, the UBC-OFR, or the HU-OFR. In Sect. S2.1 we describe each experimental setup in more detail along with the conditions used to generate the different SOA types for the consecutive generation and impaction experiments (Table S3).
Table A1List of phase behavior experiments of internally mixed particles containing two different types of secondary organic aerosol (SOA) material. Tabulated are the experiment number and the collection method, where “sim” denotes simultaneous generation and impaction and “con” denotes consecutive generation and impaction. Also listed are the average ratios for the individual SOA types, as measured when only one VOC was present within the chamber (Table S3). The associated uncertainty in the calculated average ratios is 12 % (average absolute value of the relative error for multi-species organic aerosol; Canagaratna et al., 2015). The values of denote the difference in the average ratios of the two SOA types within a mixture.
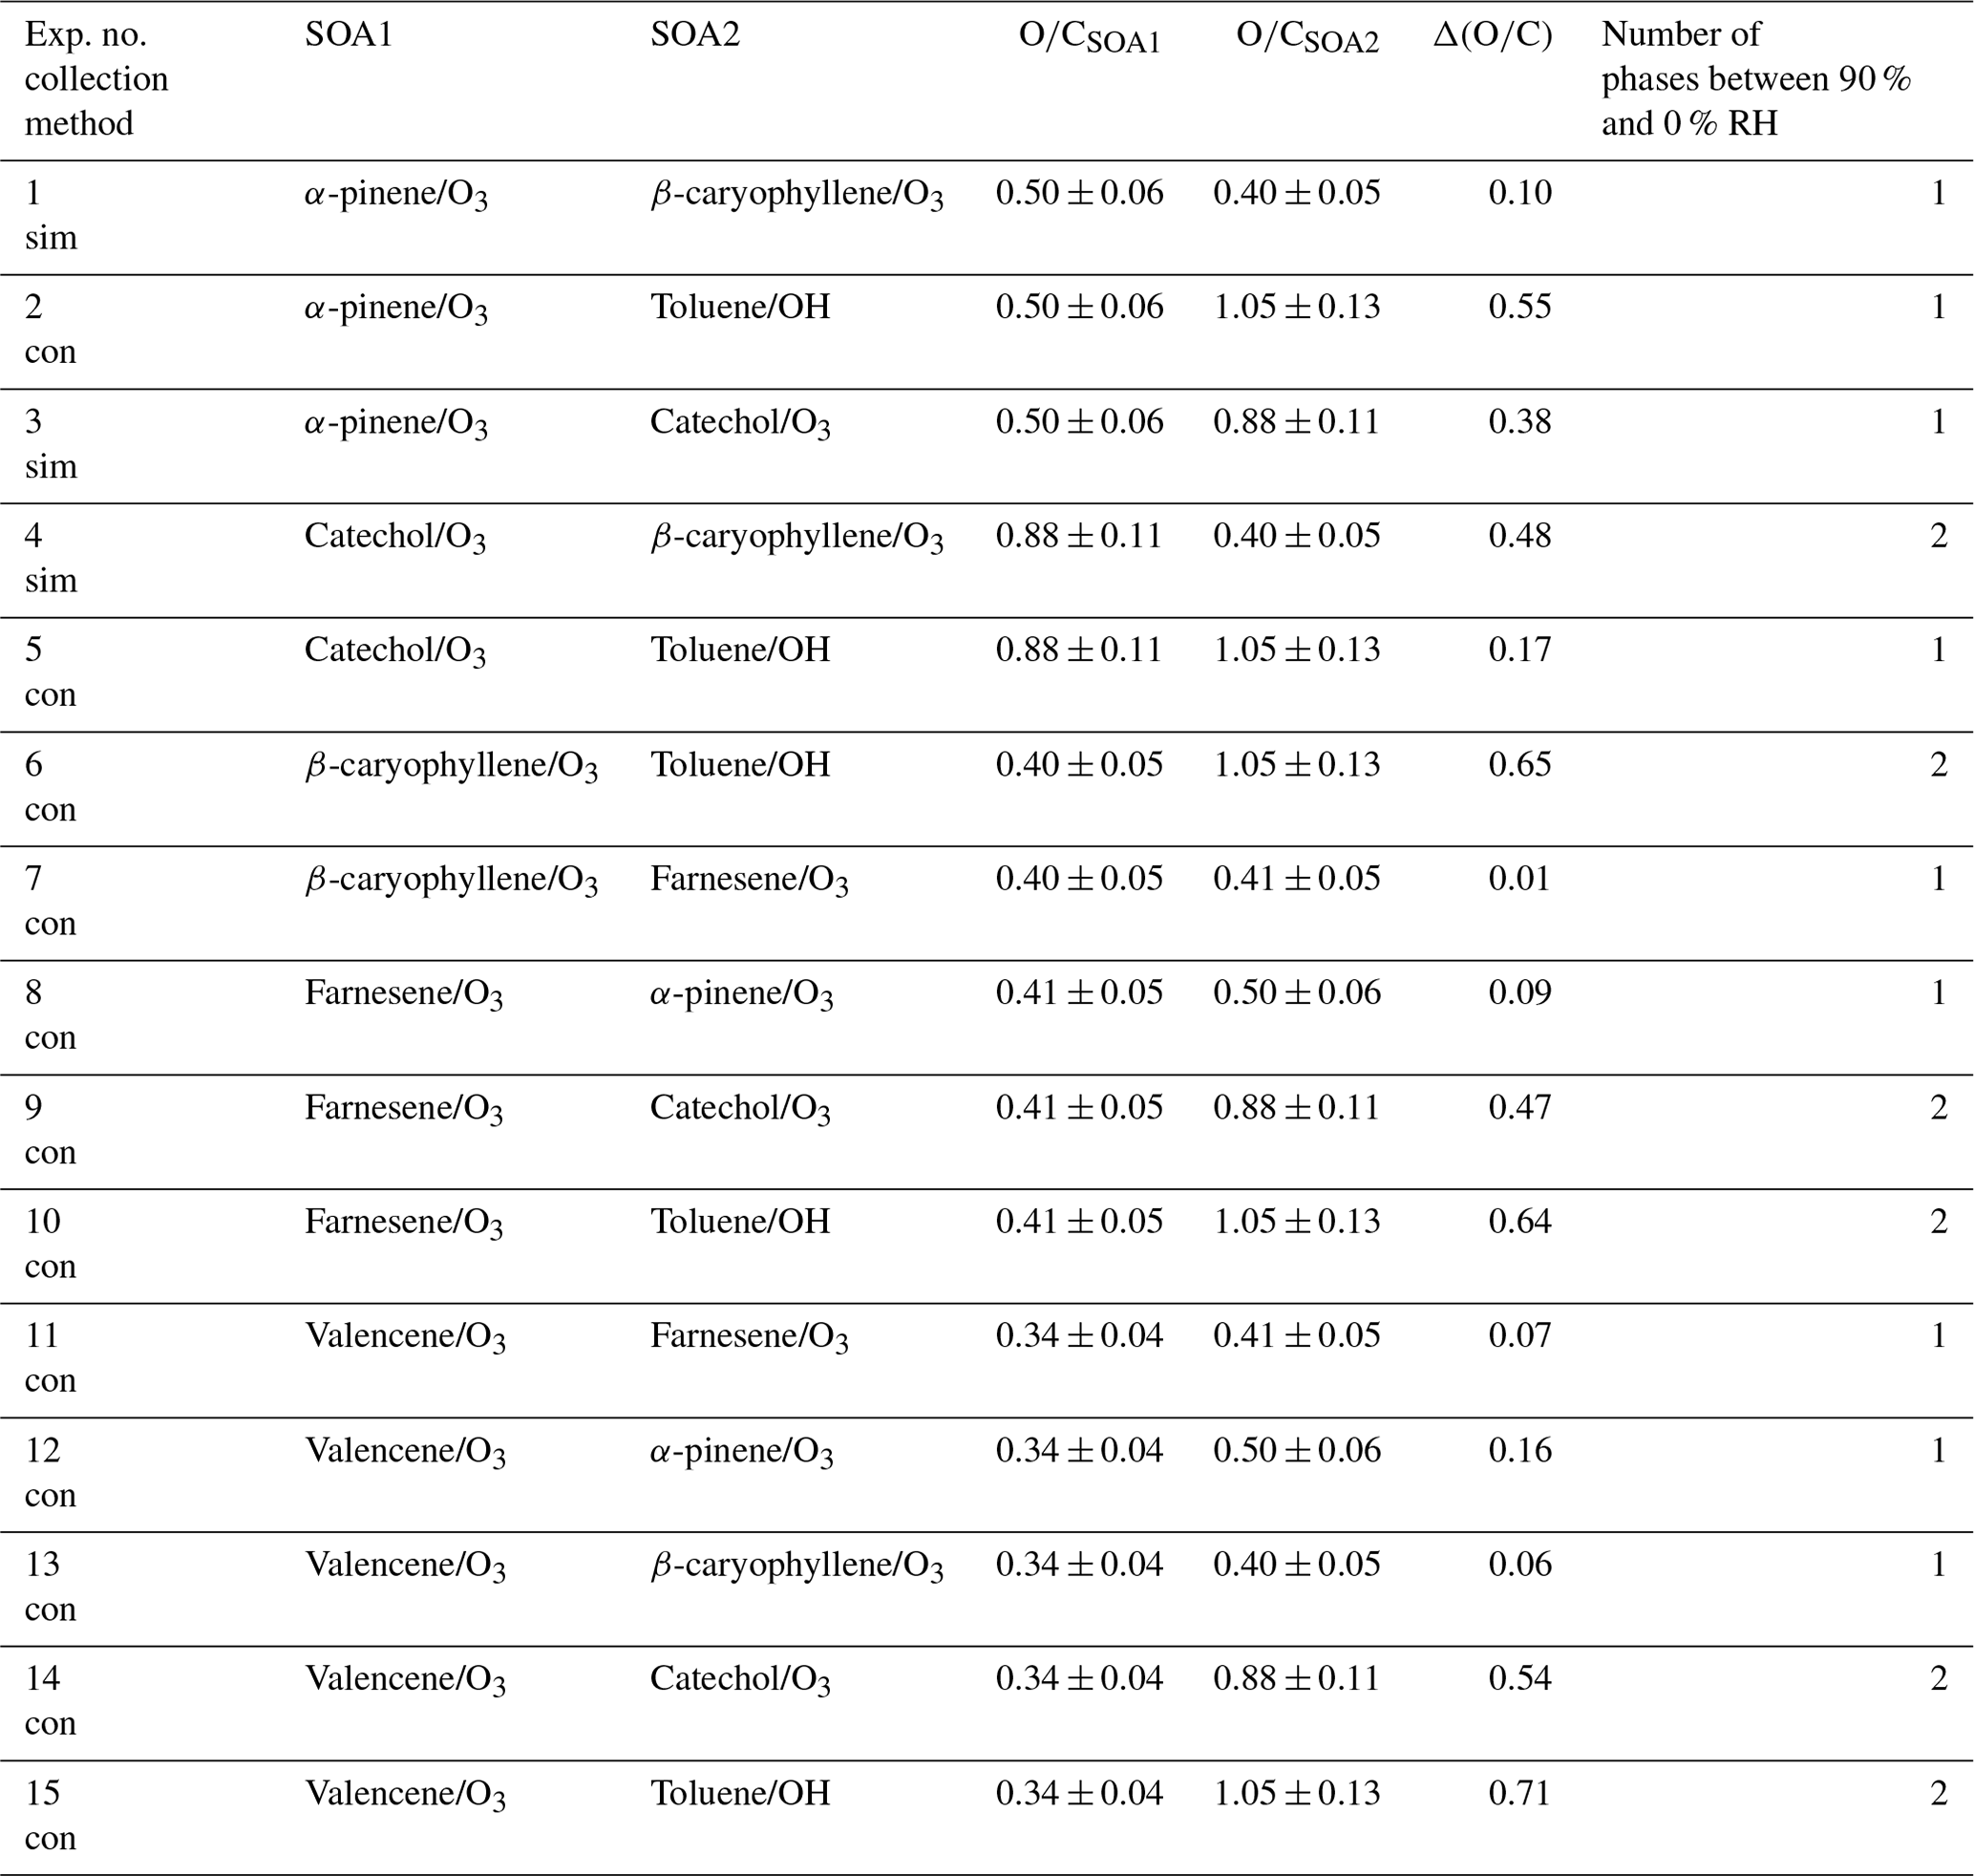
Table A2Overview of ratios reported for SV-OOA and LV-OOA components when sampling ambient organic aerosol. Elemental ratios were calculated using the improved ambient method and data taken from Canagaratna et al. (2015). Also indicated is the value between the SV-OOA and LV-OOA components and the number of phases predicted using a threshold value of 0.47 (Fig. 4).
A1.2 Simultaneous generation and impaction
In the second approach, two different SOA types were simultaneously generated by simultaneously oxidizing two precursor gases in the UBC-EC and collecting the SOA material by inertial impaction. We refer to this method as simultaneous generation and impaction. The phase behavior of the SOA + SOA particles was independent of the method used to generate and collect the particles (Sect. S3). Therefore, we performed most of our experiments using the consecutive generation and impaction method due to the ability to combine SOA types generated from two different oxidants. In Sect. S2.2 we describe the experimental setup for the simultaneous generation and impaction experiments in more detail along with the conditions used to generate the different SOA types (Table S4).
A2 Microscopy analysis of particle-phase behavior
The phase behavior of the particles containing SOA mixtures was investigated as a function of RH using a combination of fluorescence and optical microscopy techniques.
A2.1 Fluorescence microscopy phase behavior experiments
For phase behavior analysis using fluorescence microscopy, the hydrophobic glass slides with the SOA + SOA particles were collected from the impactor, and solutions of trace amounts of Nile red (9-diethylamino-5H-benzo[α]phenoxazine-5-one; concentration ≤10 mg L−1) in ethyl acetate (Sigma-Aldrich, purity >99 %) were nebulized (Meinhard, model: TR-30-C0.5) onto the SOA + SOA particles to make them fluorescent. High-purity nitrogen (Linde, grade 5.0) was used as a carrier gas during nebulization of the ethyl acetate solutions. The nebulization of Nile red onto the slides resulted in droplets on the hydrophobic glass slides containing the different SOA types, ethyl acetate, and trace amounts of Nile red. Previous work has shown that SOA is largely soluble in ethyl acetate (Matsunaga and Ziemann, 2009). To allow the ethyl acetate to evaporate, the glass slides were placed in a fume hood for 1–3 min, resulting in Nile red infused SOA + SOA particles with typical diameters between 40 and 120 µm that were used for phase behavior analysis. The nebulization step followed by evaporation of ethyl acetate resulted in coalescence of the SOA particles present on the glass slides, further enhancing the formation of internal mixtures and leading to an overall increase in SOA + SOA particle size.
For phase behavior analysis, the slides with the Nile red-containing SOA + SOA particles were mounted into a flow cell (BioSurface Technologies Corp., model: FC 81) that was coupled to a fluorescence microscope (Olympus, model: XI70, U-MNIB filter cube with excitation wavelengths 470–490 nm and an emission wavelength >515 nm). Photons emitted from the Nile red-infused SOA + SOA particles were detected with a color charge-coupled device camera (Olympus, model DP80). Nile red is a solvatochromic dye that fluoresces at different wavelengths when embedded in chemically different aerosol phases (Greenspan et al., 1985; Teo et al., 2021). The fluorescence color (emission wavelengths) of Nile red preliminarily depends on the polarity of the aerosol phase (Huang et al., 2021; Greenspan et al., 1985) but also on other factors, such as the pH value of the organic phase (Hekmat et al., 2008) and aggregation of the solvatochromic dye (Kurniasih et al., 2015; Ray et al., 2019). In our analysis, we use the presence of multiple distinct colors to indicate the presence of multiple phases in the internally mixed SOA + SOA particles, following our previous approach (Huang et al., 2021; Ohno et al., 2021; Mahrt et al., 2021, 2022). During the phase behavior experiments, a flow (∼ 1.3 L min−1) of nitrogen gas (Linde, grade 5.0) was continuously passed over the particles. The RH of the nitrogen gas was controlled by first passing it through a bubbler system mounted in a temperature-controlled refrigerated bath (Thermo Fisher, model RTE-140) upstream of the flow cell. The temperature of the flow cell was equilibrated to room temperature (293 ± 2 K) and continuously measured by a thermocouple mounted on the flow cell (T-type, Omega, model: FF-T-20-100). The RH that the SOA + SOA particles were exposed to was calculated from the temperature of the flow cell and the dew point temperature of the nitrogen gas, measured in-line using a chilled mirror hygrometer (General Eastern, model: M4/E4).
A2.2 Optical microscopy phase behavior experiments
For phase behavior analysis using optical microscopy, a similar approach was used. In these cases, the glass slides with the SOA + SOA particles were taken from the impactor and placed in a custom-built flow cell, which was coupled to an optical microscope (Zeiss, model: Axiotech). The stainless-steel body making up the base of the flow cell, where the hydrophobic glass slide containing the SOA + SOA particles was mounted, was held at a constant temperature of 293 K for all our optical microscopy experiments, as measured with a thermocouple (T-type, Omega, model FF-T-20-100). The temperature was held constant by circulating a coolant through the stainless-steel body, using a refrigerated bath (ThermoScientific, model: RTE-740). A stream (∼ 1.2 L min−1) of nitrogen gas (Linde, grade 5.0) was continuously passed over the particles. The RH of the nitrogen stream was controlled by passing the flow through a bubbler system, mounted in a refrigerated bath (ThermoScientific, model: RTE-140), and the RH was changed by adjusting the temperature of the coolant. The dew point temperature of the nitrogen stream exiting the cell was measured in-line using a humidity sensor (Vaisala, model: HMT330). The RH the particles were exposed to was calculated from the dew point temperature of the nitrogen stream and the temperature of the flow cell. Phase behavior analysis by optical microscopy was used for the experiments of the real tree samples. In addition, the optical microscopy setup was used to cross-check results of selected fluorescence microscopy phase behavior experiments.
At the start of all our phase behavior experiments, the particles were allowed to equilibrate at 90 % RH for a period of ∼ 3 min. The RH was then decreased at a rate of around 0.5 % RH per minute. During the RH ramps, images were captured with a digital camera coupled to the microscope at values of 90 %, 70 %, 50 %, 30 %, and 0 % RH. In both the fluorescence and optical microscopy setups, the humidity accuracy was ±2.5 % RH, determined from measuring the deliquescence RH of pure ammonium sulfate particles (Sigma-Aldrich, purity >99 %) and comparing against deliquescence RH values reported in the literature (Cziczo and Abbatt, 1999; Wise et al., 2003).
A3 Mixing ratios of SOA types within internally mixed SOA + SOA particles
The mixing ratio of the different SOA types within internally mixed SOA + SOA particles can depend on the method used to generate the SOA mixtures and can impact the phase behavior. Here, we used two different approaches to constrain the SOA-to-SOA mixing ratio for experiments performed using the simultaneous generation and impaction method and experiments using the consecutive generation and impaction method.
For experiments performed by the consecutive generation and impaction method, the hydrophobic glass slides contained particles that were mixtures of both SOA types (internally mixed SOA + SOA particles) as well as particles that contained only one of the two SOA types (externally mixed particles). To constrain the mixing ratios of the two SOA types within the internally mixed SOA + SOA particles, we estimated the SOA-to-SOA volume ratios for individual phase-separated particles. This was achieved from three-dimensional particle profiles derived from confocal microscopy analysis of phase-separated SOA + SOA particles, following our previous approach (Mahrt et al., 2022). Details are given in Sect. S4.1. Based on this analysis, the overall average SOA-to-SOA volume ratio for consecutive generation and impaction was approximately 0.39, with the average value ranging from 0.07 to 0.56 for the different SOA + SOA particle types. Furthermore, the SOA-to-SOA volume ratio ranges from 0.01 to 0.96 in the individual SOA + SOA particles (Table S5).
For experiments performed by the simultaneous generation and impaction method, the two types of SOA either became internally mixed during the generation step within the UBC-EC or became internally mixed within individual particles during the impaction step onto the hydrophobic glass slide. This allowed us to estimate the SOA-to-SOA mixing ratio of the deposited particles from the optical particle counter (OPC)-based mass concentrations measured when the two SOA types were generated separately within the UBC-EC but using identical experimental conditions as for the simultaneous generation and impaction experiments. Details are provided in Sect. S4.2. We estimated the average SOA-to-SOA volume ratios to range approximately from 1.08 to 0.78 for our experimental conditions (Table S6).
A4 Particle measurements with a high-resolution time-of-flight aerosol mass spectrometer
The elemental ratios of the individual SOA types were determined using a high-resolution time-of-flight aerosol mass spectrometer (HR-ToF-AMS, Aerodyne Inc., Canagaratna et al., 2015; Aiken et al., 2008, 2007; DeCarlo et al., 2006; Jayne et al., 2000), hereafter referred to as AMS. Within the AMS, SOA particles are impacted onto a heated (∼ 600 ∘C) filament, causing the nonrefractory constituents of the particles to vaporize. Electron impact ionization (∼ 70 eV) was used to ionize the resulting vapors, which were then extracted by a time-of-flight mass spectrometer. The AMS measured the bulk chemical composition by collecting mass spectra using the MS mode. To correct for air interferences, particle-filtered (Whatman, 1851-047, grade QM-A) air from the chambers was periodically sampled with the AMS. To determine the average elemental ratios of the individual SOA types, the ion-optical V-mode (V-shaped ion flight paths, single ion reflection; resolution of ∼ 2400 m/Δm) AMS data were used and processed using standard techniques (Canagaratna et al., 2015; Aiken et al., 2008; Allan et al., 2003). Specifically, the ratios were determined by analyzing the AMS mass spectra in Igor Pro 8 (Wavemetrics Inc.), using the PIKA v1.23 and SQUIRREL 1.631 (Aerodyne Inc.) software packages, and applying the improved ambient method (Canagaratna et al., 2015).
For the individual SOA types generated in the UBC-EC and UBC-OFR, the individual SOA types were sampled directly from the environmental chambers using the AMS. For the toluene SOA material generated in the HU-OFR, the SOA was first collected onto hydrophobic glass slides at Harvard University. After shipping the samples to the University of British Columbia, the SOA was washed off from the glass slides with 3 mL of high-purity liquid chromatography grade water, and the ratio was determined by sampling the re-aerosolized solution with the same AMS instrument that was used to determine the ratios of the SOA types generated directly at UBC. The elemental ratios for the toluene SOA determined from the washed-off and atomized SOA material are within the range of values reported in the literature for SOA from toluene photooxidation (Song et al., 2016; Hildebrandt Ruiz et al., 2015). The wash-off method was validated using SOA generated from catechol ozonolysis in the UBC-EC as described in Sect. S5.
Shown in Table A1 are the ratios of the individual SOA types used in our experiments as determined with the AMS (Table S3). The elemental ratios are in reasonable agreement with values reported previously for similar experimental conditions (Shilling et al., 2009; Kundu et al., 2017; Chen et al., 2012, 2011; Lambe et al., 2015).
All data are documented and available in the Supplement.
The supplement related to this article is available online at: https://doi.org/10.5194/acp-22-13783-2022-supplement.
FM prepared all figures and wrote the original draft of the manuscript, with contributions from AKB. LP, YH, and FM conducted phase behavior experiments and analyzed data. LP performed confocal microscopy experiments and analyzed data. PEO and YQ prepared toluene SOA samples. NRS prepared real tree SOA samples. FKAG performed SOA wash-off experiments. JZ sampled and analyzed AMS data. All the authors discussed and interpreted data and contributed to revising the original manuscript draft. AKB, STM, SAN, CLF, and MA supervised the project.
The contact author has declared that none of the authors has any competing interests.
Publisher’s note: Copernicus Publications remains neutral with regard to jurisdictional claims in published maps and institutional affiliations.
The authors were granted access to the biological services laboratory at the UBC and thank Elena Polishchuk for coordinating instrument usage. The authors were also granted access to the LASIR facility at UBC. We thank Claudia Marcolli for helpful scientific discussions. We thank Milan Coschizza, Benny Ng, Des Lovrity, and Pritesh Padhiar for technical support and for machining parts of the setup. We further thank David Tonkin for technical support with the AMS and Donna Sueper for support with AMS data analysis. We thank the reviewers for helpful and constructive comments on our work.
This work is part of a project that has received funding from the European Union's Horizon 2020 research and innovation program under Marie Skłodowska-Curie grant agreement no. 890200 (Fabian Mahrt). Allan K. Bertram, Yuanzhou Huang, Julia Zaks, and Florence K. A. Gregson were funded by the Natural Sciences and Engineering Research Council of Canada (NSERC) through grant RGPIN/04441-2016. Long Peng received funding from the National Natural Science Foundation of China (grant no. 42105102). Paul E. Ohno received funding from the Harvard University Center for the Environment through the Environmental Fellows program. Scot T. Martin was funded by Environmental Chemical Sciences of the Division of Chemistry of the US National Science Foundation (NSF, grant no. ECS-2003368). Celia L. Faiola received funding by the National Science Foundation, Division of Atmospheric and Geospace Sciences (award no. 2035125). Natalie R. Smith and Sergey A. Nizkorodov were funded by the US NSF (grant no. AGS-1853639).
This paper was edited by James Allan and Yafang Cheng and reviewed by two anonymous referees.
Aiken, A. C., DeCarlo, P. F., and Jimenez, J. L.: Elemental Analysis of Organic Species with Electron Ionization High-Resolution Mass Spectrometry, Anal. Chem., 79, 8350–8358, https://doi.org/10.1021/ac071150w, 2007.
Aiken, A. C., Decarlo, P. F., Kroll, J. H., Worsnop, D. R., Huffman, J. A., Docherty, K. S., Ulbrich, I. M., Mohr, C., Kimmel, J. R., Sueper, D., Sun, Y., Zhang, Q., Trimborn, A., Northway, M., Ziemann, P. J., Canagaratna, M. R., Onasch, T. B., Alfarra, M. R., Prevot, A. S. H., Dommen, J., Duplissy, J., Metzger, A., Baltensperger, U., and Jimenez, J. L.: and OM/OC ratios of primary, secondary, and ambient organic aerosols with high-resolution time-of-flight aerosol mass spectrometry, Environ. Sci. Technol., 42, 4478–4485, https://doi.org/10.1021/es703009q, 2008.
Allan, J. D., Jimenez, J. L., Williams, P. I., Alfarra, M. R., Bower, K. N., Jayne, J. T., Coe, H., and Worsnop, D. R.: Quantitative sampling using an Aerodyne aerosol mass spectrometer 1. Techniques of data interpretation and error analysis, J. Geophys. Res.-Atmos., 108, 4090, https://doi.org/10.1029/2002JD002358, 2003.
Anttila, T., Kiendler-Scharr, A., Mentel, T. F., and Tillmann, R.: Size dependent partitioning of organic material: evidence for the formation of organic coatings on aqueous aerosols, J. Atmos. Chem., 57, 215–237, https://doi.org/10.1007/s10874-007-9067-9, 2007.
Baltensperger, U., Dommen, J., Alfarra, R., Duplissy, J., Gaeggeler, K., Metzger, A., Facchini, M. C., Decesari, S., Finessi, E., Reinnig, C., Schott, M., Warnke, J., Hoffmann, T., Klatzer, B., Puxbaum, H., Geiser, M., Savi, M., Lang, D., Kalberer, M., and Geiser, T.: Combined determination of the chemical composition and of health effects of secondary organic aerosols: The POLYSOA project, J. Aerosol Med. Pulm. D., 21, 145–154, https://doi.org/10.1089/jamp.2007.0655, 2008.
Bowman, F. M., Odum, J. R., Seinfeld, J. H., and Pandis, S. N.: Mathematical model for gas-particle partitioning of secondary organic aerosols, Atmos. Environ., 31, 3921–3931, https://doi.org/10.1016/S1352-2310(97)00245-8, 1997.
Canagaratna, M. R., Jimenez, J. L., Kroll, J. H., Chen, Q., Kessler, S. H., Massoli, P., Hildebrandt Ruiz, L., Fortner, E., Williams, L. R., Wilson, K. R., Surratt, J. D., Donahue, N. M., Jayne, J. T., and Worsnop, D. R.: Elemental ratio measurements of organic compounds using aerosol mass spectrometry: characterization, improved calibration, and implications, Atmos. Chem. Phys., 15, 253–272, https://doi.org/10.5194/acp-15-253-2015, 2015.
Carlton, A. G., Bhave, P. V., Napelenok, S. L., Edney, E. O., Sarwar, G., Pinder, R. W., Pouliot, G. A., and Houyoux, M.: Model Representation of Secondary Organic Aerosol in CMAQv4.7, Environ. Sci. Technol., 44, 8553–8560, https://doi.org/10.1021/es100636q, 2010.
Chen, Q., Liu, Y. J., Donahue, N. M., Shilling, J. E., and Martin, S. T.: Particle-Phase Chemistry of Secondary Organic Material: Modeled Compared to Measured O:C and H:C Elemental Ratios Provide Constraints, Environ. Sci. Technol., 45, 4763–4770, https://doi.org/10.1021/es104398s, 2011.
Chen, Q., Li, Y. L., McKinney, K. A., Kuwata, M., and Martin, S. T.: Particle mass yield from β-caryophyllene ozonolysis, Atmos. Chem. Phys., 12, 3165–3179, https://doi.org/10.5194/acp-12-3165-2012, 2012.
Chung, S. H. and Seinfeld, J. H.: Global distribution and climate forcing of carbonaceous aerosols, J. Geophys. Res.-Atmos., 107, 4407, https://doi.org/10.1029/2001JD001397, 2002.
Cziczo, D. J. and Abbatt, J. P. D.: Deliquescence, efflorescence, and supercooling of ammonium sulfate aerosols at low temperature: Implications for cirrus cloud formation and aerosol phase in the atmosphere, J. Geophys. Res.-Atmos., 104, 13781–13790, https://doi.org/10.1029/1999jd900112, 1999.
DeCarlo, P. F., Kimmel, J. R., Trimborn, A., Northway, M. J., Jayne, J. T., Aiken, A. C., Gonin, M., Fuhrer, K., Horvath, T., Docherty, K. S., Worsnop, D. R., and Jimenez, J. L.: Field-Deployable, High-Resolution, Time-of-Flight Aerosol Mass Spectrometer, Anal. Chem., 78, 8281–8289, https://doi.org/10.1021/ac061249n, 2006.
DeCarlo, P. F., Ulbrich, I. M., Crounse, J., de Foy, B., Dunlea, E. J., Aiken, A. C., Knapp, D., Weinheimer, A. J., Campos, T., Wennberg, P. O., and Jimenez, J. L.: Investigation of the sources and processing of organic aerosol over the Central Mexican Plateau from aircraft measurements during MILAGRO, Atmos. Chem. Phys., 10, 5257–5280, https://doi.org/10.5194/acp-10-5257-2010, 2010.
Docherty, K. S., Aiken, A. C., Huffman, J. A., Ulbrich, I. M., DeCarlo, P. F., Sueper, D., Worsnop, D. R., Snyder, D. C., Peltier, R. E., Weber, R. J., Grover, B. D., Eatough, D. J., Williams, B. J., Goldstein, A. H., Ziemann, P. J., and Jimenez, J. L.: The 2005 Study of Organic Aerosols at Riverside (SOAR-1): instrumental intercomparisons and fine particle composition, Atmos. Chem. Phys., 11, 12387–12420, https://doi.org/10.5194/acp-11-12387-2011, 2011.
Donahue, N. M., Robinson, A. L., Stanier, C. O., and Pandis, S. N.: Coupled Partitioning, Dilution, and Chemical Aging of Semivolatile Organics, Environ. Sci. Technol., 40, 2635–2643, https://doi.org/10.1021/es052297c, 2006.
Ervens, B., Carlton, A. G., Turpin, B. J., Altieri, K. E., Kreidenweis, S. M., and Feingold, G.: Secondary organic aerosol yields from cloud-processing of isoprene oxidation products, Geophys. Res. Lett., 35, L02816, https://doi.org/10.1029/2007GL031828, 2008.
Ervens, B., Turpin, B. J., and Weber, R. J.: Secondary organic aerosol formation in cloud droplets and aqueous particles (aqSOA): a review of laboratory, field and model studies, Atmos. Chem. Phys., 11, 11069–11102, https://doi.org/10.5194/acp-11-11069-2011, 2011.
Folkers, M., Mentel, T. F., and Wahner, A.: Influence of an organic coating on the reactivity of aqueous aerosols probed by the heterogeneous hydrolysis of N2O5, Geophys. Res. Lett., 30, 1644, https://doi.org/10.1029/2003GL017168, 2003.
Goldstein, A. H. and Galbally, I. E.: Known and Unexplored Organic Constituents in the Earth's Atmosphere, Environ. Sci. Technol., 41, 1514–1521, https://doi.org/10.1021/es072476p, 2007.
Gong, Z., Lan, Z., Xue, L., Zeng, L., He, L., and Huang, X.: Characterization of submicron aerosols in the urban outflow of the central Pearl River Delta region of China, Front. Environ. Sci. Eng., 6, 725–733, https://doi.org/10.1007/s11783-012-0441-8, 2012.
Gordon, C. A., Ye, J., and Arthur W.H., C.: Secondary Organic Aerosol Formation Enhanced by Organic Seeds of Similar Polarity at Atmospherically Relative Humidity, STEM Fellowship Journal, 1, 1–5, https://doi.org/10.17975/sfj-2015-009, 2016.
Gorkowski, K., Donahue, N. M., and Sullivan, R. C.: Emulsified and Liquid–Liquid Phase-Separated States of α-Pinene Secondary Organic Aerosol Determined Using Aerosol Optical Tweezers, Environ. Sci. Technol., 51, 12154–12163, https://doi.org/10.1021/acs.est.7b03250, 2017.
Gorkowski, K., Preston, T. C., and Zuend, A.: Relative-humidity-dependent organic aerosol thermodynamics via an efficient reduced-complexity model, Atmos. Chem. Phys., 19, 13383–13407, https://doi.org/10.5194/acp-19-13383-2019, 2019.
Gorkowski, K., Donahue, N. M., and Sullivan, R. C.: Aerosol Optical Tweezers Constrain the Morphology Evolution of Liquid-Liquid Phase-Separated Atmospheric Particles, Chem, 6, 204–220, https://doi.org/10.1016/j.chempr.2019.10.018, 2020.
Greenspan, P., Mayer, E., and Fowler, S.: Nile Red – a Selective Fluorescent Stain for Intracellular Lipid Droplets, J. Cell Biol., 100, 965–973, https://doi.org/10.1083/jcb.100.3.965, 1985.
Hallquist, M., Wenger, J. C., Baltensperger, U., Rudich, Y., Simpson, D., Claeys, M., Dommen, J., Donahue, N. M., George, C., Goldstein, A. H., Hamilton, J. F., Herrmann, H., Hoffmann, T., Iinuma, Y., Jang, M., Jenkin, M. E., Jimenez, J. L., Kiendler-Scharr, A., Maenhaut, W., McFiggans, G., Mentel, Th. F., Monod, A., Prévôt, A. S. H., Seinfeld, J. H., Surratt, J. D., Szmigielski, R., and Wildt, J.: The formation, properties and impact of secondary organic aerosol: current and emerging issues, Atmos. Chem. Phys., 9, 5155–5236, https://doi.org/10.5194/acp-9-5155-2009, 2009.
He, L.-Y., Huang, X.-F., Xue, L., Hu, M., Lin, Y., Zheng, J., Zhang, R., and Zhang, Y.-H.: Submicron aerosol analysis and organic source apportionment in an urban atmosphere in Pearl River Delta of China using high-resolution aerosol mass spectrometry, J. Geophys. Res.-Atmos., 116, D12304, https://doi.org/10.1029/2010JD014566, 2011.
Hekmat, A., Saboury, A. A., Divsalar, A., and Khanmohammadi, M.: Conformational and Structural Changes of Choline Oxidase from Alcaligenes Species by Changing pH Values, B. Kor. Chem. Soc., 29, 1510–1518, https://doi.org/10.5012/bkcs.2008.29.8.1510, 2008.
Hildebrandt Ruiz, L., Paciga, A. L., Cerully, K. M., Nenes, A., Donahue, N. M., and Pandis, S. N.: Formation and aging of secondary organic aerosol from toluene: changes in chemical composition, volatility, and hygroscopicity, Atmos. Chem. Phys., 15, 8301–8313, https://doi.org/10.5194/acp-15-8301-2015, 2015.
Huang, X.-F., He, L.-Y., Hu, M., Canagaratna, M. R., Kroll, J. H., Ng, N. L., Zhang, Y.-H., Lin, Y., Xue, L., Sun, T.-L., Liu, X.-G., Shao, M., Jayne, J. T., and Worsnop, D. R.: Characterization of submicron aerosols at a rural site in Pearl River Delta of China using an Aerodyne High-Resolution Aerosol Mass Spectrometer, Atmos. Chem. Phys., 11, 1865–1877, https://doi.org/10.5194/acp-11-1865-2011, 2011.
Huang, X.-F., He, L.-Y., Xue, L., Sun, T.-L., Zeng, L.-W., Gong, Z.-H., Hu, M., and Zhu, T.: Highly time-resolved chemical characterization of atmospheric fine particles during 2010 Shanghai World Expo, Atmos. Chem. Phys., 12, 4897–4907, https://doi.org/10.5194/acp-12-4897-2012, 2012.
Huang, Y., Mahrt, F., Xu, S., Shiraiwa, M., Zuend, A., and Bertram, A. K.: Coexistence of three liquid phases in individual atmospheric aerosol particles, P. Natl. Acad. Sci. USA, 118, e2102512118, https://doi.org/10.1073/pnas.2102512118, 2021.
Jayne, J. T., Leard, D. C., Zhang, X., Davidovits, P., Smith, K. A., Kolb, C. E., and Worsnop, D. R.: Development of an Aerosol Mass Spectrometer for Size and Composition Analysis of Submicron Particles, Aerosol Sci. Tech., 33, 49–70, https://doi.org/10.1080/027868200410840, 2000.
Jimenez, J. L., Canagaratna, M. R., Donahue, N. M., Prevot, A. S. H., Zhang, Q., Kroll, J. H., DeCarlo, P. F., Allan, J. D., Coe, H., Ng, N. L., Aiken, A. C., Docherty, K. S., Ulbrich, I. M., Grieshop, A. P., Robinson, A. L., Duplissy, J., Smith, J. D., Wilson, K. R., Lanz, V. A., Hueglin, C., Sun, Y. L., Tian, J., Laaksonen, A., Raatikainen, T., Rautiainen, J., Vaattovaara, P., Ehn, M., Kulmala, M., Tomlinson, J. M., Collins, D. R., Cubison, M. J., Dunlea, J., Huffman, J. A., Onasch, T. B., Alfarra, M. R., Williams, P. I., Bower, K., Kondo, Y., Schneider, J., Drewnick, F., Borrmann, S., Weimer, S., Demerjian, K., Salcedo, D., Cottrell, L., Griffin, R., Takami, A., Miyoshi, T., Hatakeyama, S., Shimono, A., Sun, J. Y., Zhang, Y. M., Dzepina, K., Kimmel, J. R., Sueper, D., Jayne, J. T., Herndon, S. C., Trimborn, A. M., Williams, L. R., Wood, E. C., Middlebrook, A. M., Kolb, C. E., Baltensperger, U., and Worsnop, D. R.: Evolution of Organic Aerosols in the Atmosphere, Science, 326, 1525–1529, https://doi.org/10.1126/science.1180353, 2009.
Kanakidou, M., Seinfeld, J. H., Pandis, S. N., Barnes, I., Dentener, F. J., Facchini, M. C., Van Dingenen, R., Ervens, B., Nenes, A., Nielsen, C. J., Swietlicki, E., Putaud, J. P., Balkanski, Y., Fuzzi, S., Horth, J., Moortgat, G. K., Winterhalter, R., Myhre, C. E. L., Tsigaridis, K., Vignati, E., Stephanou, E. G., and Wilson, J.: Organic aerosol and global climate modelling: a review, Atmos. Chem. Phys., 5, 1053–1123, https://doi.org/10.5194/acp-5-1053-2005, 2005.
Kucinski, T. M., Dawson, J. N., and Freedman, M. A.: Size-Dependent Liquid–Liquid Phase Separation in Atmospherically Relevant Complex Systems, J. Phys. Chem. Lett., 10, 6915–6920, https://doi.org/10.1021/acs.jpclett.9b02532, 2019.
Kundu, S., Fisseha, R., Putman, A. L., Rahn, T. A., and Mazzoleni, L. R.: Molecular formula composition of β-caryophyllene ozonolysis SOA formed in humid and dry conditions, Atmos. Environ., 154, 70–81, https://doi.org/10.1016/j.atmosenv.2016.12.031, 2017.
Kurniasih, I. N., Liang, H., Mohr, P. C., Khot, G., Rabe, J. P., and Mohr, A.: Nile Red Dye in Aqueous Surfactant and Micellar Solution, Langmuir, 31, 2639–2648, https://doi.org/10.1021/la504378m, 2015.
Lambe, A. T., Onasch, T. B., Massoli, P., Croasdale, D. R., Wright, J. P., Ahern, A. T., Williams, L. R., Worsnop, D. R., Brune, W. H., and Davidovits, P.: Laboratory studies of the chemical composition and cloud condensation nuclei (CCN) activity of secondary organic aerosol (SOA) and oxidized primary organic aerosol (OPOA), Atmos. Chem. Phys., 11, 8913–8928, https://doi.org/10.5194/acp-11-8913-2011, 2011.
Lambe, A. T., Chhabra, P. S., Onasch, T. B., Brune, W. H., Hunter, J. F., Kroll, J. H., Cummings, M. J., Brogan, J. F., Parmar, Y., Worsnop, D. R., Kolb, C. E., and Davidovits, P.: Effect of oxidant concentration, exposure time, and seed particles on secondary organic aerosol chemical composition and yield, Atmos. Chem. Phys., 15, 3063–3075, https://doi.org/10.5194/acp-15-3063-2015, 2015.
Mahrt, F., Newman, E., Huang, Y., Ammann, M., and Bertram, A. K.: Phase Behavior of Hydrocarbon-like Primary Organic Aerosol and Secondary Organic Aerosol Proxies Based on Their Elemental Oxygen-to-Carbon Ratio, Environ. Sci. Technol., 55, 12202–12214, https://doi.org/10.1021/acs.est.1c02697, 2021.
Mahrt, F., Huang, Y., Zaks, J., Devi, A., Peng, L., Ohno, P. E., Qin, Y. M., Martin, S. T., Ammann, M., and Bertram, A. K.: Phase Behavior of Internal Mixtures of Hydrocarbon-like Primary Organic Aerosol and Secondary Aerosol Based on Their Differences in Oxygen-to-Carbon Ratios, Environ. Sci. Technol., 56, 3960–3973, https://doi.org/10.1021/acs.est.1c07691, 2022.
Marcolli, C., Luo, B. P., Peter, Th., and Wienhold, F. G.: Internal mixing of the organic aerosol by gas phase diffusion of semivolatile organic compounds, Atmos. Chem. Phys., 4, 2593–2599, https://doi.org/10.5194/acp-4-2593-2004, 2004a.
Marcolli, C., Luo, B. P., and Peter, T.: Mixing of the organic aerosol fractions: Liquids as the thermodynamically stable phases, J. Phys. Chem. A, 108, 2216–2224, https://doi.org/10.1021/jp036080l, 2004b.
Matsunaga, A. and Ziemann, P. J.: Yields of β-Hydroxynitrates and Dihydroxynitrates in Aerosol Formed from OH Radical-Initiated Reactions of Linear Alkenes in the Presence of NOx, J. Phys. Chem. A, 113, 599–606, https://doi.org/10.1021/jp807764d, 2009.
Mohr, C., DeCarlo, P. F., Heringa, M. F., Chirico, R., Slowik, J. G., Richter, R., Reche, C., Alastuey, A., Querol, X., Seco, R., Peñuelas, J., Jiménez, J. L., Crippa, M., Zimmermann, R., Baltensperger, U., and Prévôt, A. S. H.: Identification and quantification of organic aerosol from cooking and other sources in Barcelona using aerosol mass spectrometer data, Atmos. Chem. Phys., 12, 1649–1665, https://doi.org/10.5194/acp-12-1649-2012, 2012.
Nault, B. A., Jo, D. S., McDonald, B. C., Campuzano-Jost, P., Day, D. A., Hu, W., Schroder, J. C., Allan, J., Blake, D. R., Canagaratna, M. R., Coe, H., Coggon, M. M., DeCarlo, P. F., Diskin, G. S., Dunmore, R., Flocke, F., Fried, A., Gilman, J. B., Gkatzelis, G., Hamilton, J. F., Hanisco, T. F., Hayes, P. L., Henze, D. K., Hodzic, A., Hopkins, J., Hu, M., Huey, L. G., Jobson, B. T., Kuster, W. C., Lewis, A., Li, M., Liao, J., Nawaz, M. O., Pollack, I. B., Peischl, J., Rappenglück, B., Reeves, C. E., Richter, D., Roberts, J. M., Ryerson, T. B., Shao, M., Sommers, J. M., Walega, J., Warneke, C., Weibring, P., Wolfe, G. M., Young, D. E., Yuan, B., Zhang, Q., de Gouw, J. A., and Jimenez, J. L.: Secondary organic aerosols from anthropogenic volatile organic compounds contribute substantially to air pollution mortality, Atmos. Chem. Phys., 21, 11201–11224, https://doi.org/10.5194/acp-21-11201-2021, 2021.
Nozière, B., Kalberer, M., Claeys, M., Allan, J., D'Anna, B., Decesari, S., Finessi, E., Glasius, M., Grgić, I., Hamilton, J. F., Hoffmann, T., Iinuma, Y., Jaoui, M., Kahnt, A., Kampf, C. J., Kourtchev, I., Maenhaut, W., Marsden, N., Saarikoski, S., Schnelle-Kreis, J., Surratt, J. D., Szidat, S., Szmigielski, R., and Wisthaler, A.: The Molecular Identification of Organic Compounds in the Atmosphere: State of the Art and Challenges, Chem. Rev., 115, 3919–3983, https://doi.org/10.1021/cr5003485, 2015.
Odum, J. R., Hoffmann, T., Bowman, F., Collins, D., Flagan, R. C., and Seinfeld, J. H.: Gas/Particle Partitioning and Secondary Organic Aerosol Yields, Environ. Sci. Technol., 30, 2580–2585, https://doi.org/10.1021/es950943+, 1996.
Ohno, P. E., Qin, Y., Ye, J., Wang, J., Bertram, A. K., and Martin, S. T.: Fluorescence Aerosol Flow Tube Spectroscopy to Detect Liquid–Liquid Phase Separation, ACS Earth Space Chem., 5, 1223–1232, https://doi.org/10.1021/acsearthspacechem.1c00061, 2021.
Ovadnevaite, J., Zuend, A., Laaksonen, A., Sanchez, K. J., Roberts, G., Ceburnis, D., Decesari, S., Rinaldi, M., Hodas, N., Facchini, M. C., Seinfeld, J. H., and Dowd, C. O.: Surface tension prevails over solute effect in organic-influenced cloud droplet activation, Nature, 546, 637–641, https://doi.org/10.1038/nature22806, 2017.
Pankow, J.: An Absorption-Model of Gas-Particle Partitioning of Organic-Compounds in the Atmosphere, Atmos. Environ., 28, 185–188, https://doi.org/10.1016/1352-2310(94)90093-0, 1994.
Pöschl, U. and Shiraiwa, M.: Multiphase Chemistry at the Atmosphere–Biosphere Interface Influencing Climate and Public Health in the Anthropocene, Chem. Rev., 115, 4440–4475, https://doi.org/10.1021/cr500487s, 2015.
Ray, A., Das, S., and Chattopadhyay, N.: Aggregation of Nile Red in Water: Prevention through Encapsulation in β-Cyclodextrin, ACS Omega, 4, 15–24, https://doi.org/10.1021/acsomega.8b02503, 2019.
Reid, J. P., Bertram, A. K., Topping, D. O., Laskin, A., Martin, S. T., Petters, M. D., Pope, F. D., and Rovelli, G.: The viscosity of atmospherically relevant organic particles, Nat. Commun., 9, 956, https://doi.org/10.1038/s41467-018-03027-z, 2018.
Riemer, N., Ault, A. P., West, M., Craig, R. L., and Curtis, J. H.: Aerosol Mixing State: Measurements, Modeling, and Impacts, Rev. Geophys., 57, 187–249, https://doi.org/10.1029/2018RG000615, 2019.
Robinson, E. S., Saleh, R., and Donahue, N. M.: Organic Aerosol Mixing Observed by Single-Particle Mass Spectrometry, J. Phys. Chem. A, 117, 13935–13945, https://doi.org/10.1021/jp405789t, 2013.
Shilling, J. E., Chen, Q., King, S. M., Rosenoern, T., Kroll, J. H., Worsnop, D. R., DeCarlo, P. F., Aiken, A. C., Sueper, D., Jimenez, J. L., and Martin, S. T.: Loading-dependent elemental composition of α-pinene SOA particles, Atmos. Chem. Phys., 9, 771–782, https://doi.org/10.5194/acp-9-771-2009, 2009.
Shrivastava, M., Cappa, C. D., Fan, J. W., Goldstein, A. H., Guenther, A. B., Jimenez, J. L., Kuang, C., Laskin, A., Martin, S. T., Ng, N. L., Petaja, T., Pierce, J. R., Rasch, P. J., Roldin, P., Seinfeld, J. H., Shilling, J., Smith, J. N., Thornton, J. A., Volkamer, R., Wang, J., Worsnop, D. R., Zaveri, R. A., Zelenyuk, A., and Zhang, Q.: Recent advances in understanding secondary organic aerosol: Implications for global climate forcing, Rev. Geophys., 55, 509–559, https://doi.org/10.1002/2016rg000540, 2017.
Smith, N. R., Crescenzo, G. V., Huang, Y., Hettiyadura, A. P. S., Siemens, K., Li, Y., Faiola, C. F., Laskin, A., Shiraiwa, M., Bertram, A. K., and Nizkorodov, S. A.: Viscosity and liquid–liquid phase separation in healthy and stressed plant SOA, Environmental Science: Atmospheres, 1, 140–153, https://doi.org/10.1039/D0EA00020E, 2021.
Song, C., Zaveri, R. A., Shilling, J. E., Alexander, M. L., and Newburn, M.: Effect of Hydrophilic Organic Seed Aerosols on Secondary Organic Aerosol Formation from Ozonolysis of α-Pinene, Environ. Sci. Technol., 45, 7323–7329, https://doi.org/10.1021/es201225c, 2011.
Song, M., Marcolli, C., Krieger, U. K., Zuend, A., and Peter, T.: Liquid-liquid phase separation in aerosol particles: Dependence on O:C, organic functionalities, and compositional complexity, Geophys. Res. Lett., 39, L19801, https://doi.org/10.1029/2012GL052807, 2012.
Song, M., Liu, P. F., Hanna, S. J., Zaveri, R. A., Potter, K., You, Y., Martin, S. T., and Bertram, A. K.: Relative humidity-dependent viscosity of secondary organic material from toluene photo-oxidation and possible implications for organic particulate matter over megacities, Atmos. Chem. Phys., 16, 8817–8830, https://doi.org/10.5194/acp-16-8817-2016, 2016.
Song, M., Maclean, A. M., Huang, Y., Smith, N. R., Blair, S. L., Laskin, J., Laskin, A., DeRieux, W.-S. W., Li, Y., Shiraiwa, M., Nizkorodov, S. A., and Bertram, A. K.: Liquid–liquid phase separation and viscosity within secondary organic aerosol generated from diesel fuel vapors, Atmos. Chem. Phys., 19, 12515–12529, https://doi.org/10.5194/acp-19-12515-2019, 2019.
Song, Y.-C., Bé, A. G., Martin, S. T., Geiger, F. M., Bertram, A. K., Thomson, R. J., and Song, M.: Liquid–liquid phase separation and morphologies in organic particles consisting of α-pinene and β-caryophyllene ozonolysis products and mixtures with commercially available organic compounds, Atmos. Chem. Phys., 20, 11263–11273, https://doi.org/10.5194/acp-20-11263-2020, 2020.
Strader, R., Lurmann, F., and Pandis, S. N.: Evaluation of secondary organic aerosol formation in winter, Atmos. Environ., 33, 4849–4863, https://doi.org/10.1016/S1352-2310(99)00310-6, 1999.
Sun, Y.-L., Zhang, Q., Schwab, J. J., Demerjian, K. L., Chen, W.-N., Bae, M.-S., Hung, H.-M., Hogrefe, O., Frank, B., Rattigan, O. V., and Lin, Y.-C.: Characterization of the sources and processes of organic and inorganic aerosols in New York city with a high-resolution time-of-flight aerosol mass apectrometer, Atmos. Chem. Phys., 11, 1581–1602, https://doi.org/10.5194/acp-11-1581-2011, 2011.
Teo, W., Caprariello, A. V., Morgan, M. L., Luchicchi, A., Schenk, G. J., Joseph, J. T., Geurts, J. J. G., and Stys, P. K.: Nile Red fluorescence spectroscopy reports early physicochemical changes in myelin with high sensitivity, P. Natl. Acad. Sci. USA, 118, e2016897118, https://doi.org/10.1073/pnas.2016897118, 2021.
Wang, X., Gao, S., Yang, X., Chen, H., Chen, J., Zhuang, G., Surratt, J. D., Chan, M. N., and Seinfeld, J. H.: Evidence for High Molecular Weight Nitrogen-Containing Organic Salts in Urban Aerosols, Environ. Sci. Technol., 44, 4441–4446, https://doi.org/10.1021/es1001117, 2010.
Wise, M. E., Surratt, J. D., Curtis, D. B., Shilling, J. E., and Tolbert, M. A.: Hygroscopic growth of ammonium sulfate/dicarboxylic acids, J. Geophys. Res.-Atmos., 108, 4638, https://doi.org/10.1029/2003JD003775, 2003.
Wolf, M. J., Zhang, Y., Zawadowicz, M. A., Goodell, M., Froyd, K., Freney, E., Sellegri, K., Rösch, M., Cui, T., Winter, M., Lacher, L., Axisa, D., DeMott, P. J., Levin, E. J. T., Gute, E., Abbatt, J., Koss, A., Kroll, J. H., Surratt, J. D., and Cziczo, D. J.: A biogenic secondary organic aerosol source of cirrus ice nucleating particles, Nat. Commun., 11, 4834, https://doi.org/10.1038/s41467-020-18424-6, 2020.
Ye, J., Gordon, C. A., and Chan, A. W. H.: Enhancement in Secondary Organic Aerosol Formation in the Presence of Preexisting Organic Particle, Environ. Sci. Technol., 50, 3572–3579, https://doi.org/10.1021/acs.est.5b05512, 2016a.
Ye, Q., Robinson, E. S., Ding, X., Ye, P. L., Sullivan, R. C., and Donahue, N. M.: Mixing of secondary organic aerosols versus relative humidity, P. Natl. Acad. Sci. USA, 113, 12649–12654, https://doi.org/10.1073/pnas.1604536113, 2016b.
Ye, J., Van Rooy, P., Adam, C. H., Jeong, C.-H., Urch, B., Cocker, D. R., Evans, G. J., and Chan, A. W. H.: Predicting Secondary Organic Aerosol Enhancement in the Presence of Atmospherically Relevant Organic Particles, ACS Earth Space Chem., 2, 1035–1046, https://doi.org/10.1021/acsearthspacechem.8b00093, 2018a.
Ye, Q., Upshur, M. A., Robinson, E. S., Geiger, F. M., Sullivan, R. C., Thomson, R. J., and Donahue, N. M.: Following Particle-Particle Mixing in Atmospheric Secondary Organic Aerosols by Using Isotopically Labeled Terpenes, Chem, 4, 318–333, https://doi.org/10.1016/j.chempr.2017.12.008, 2018b.
You, Y., Renbaum-Wolff, L., Carreras-Sospedra, M., Hanna, S. J., Hiranuma, N., Kamal, S., Smith, M. L., Zhang, X., Weber, R. J., Shilling, J. E., Dabdub, D., Martin, S. T., and Bertram, A. K.: Images reveal that atmospheric particles can undergo liquid–liquid phase separations, P. Natl. Acad. Sci. USA, 109, 13188–13193, https://doi.org/10.1073/pnas.1206414109, 2012.
You, Y., Renbaum-Wolff, L., and Bertram, A. K.: Liquid–liquid phase separation in particles containing organics mixed with ammonium sulfate, ammonium bisulfate, ammonium nitrate or sodium chloride, Atmos. Chem. Phys., 13, 11723–11734, https://doi.org/10.5194/acp-13-11723-2013, 2013.
Zuend, A., Marcolli, C., Peter, T., and Seinfeld, J. H.: Computation of liquid-liquid equilibria and phase stabilities: implications for RH-dependent gas/particle partitioning of organic-inorganic aerosols, Atmos. Chem. Phys., 10, 7795–7820, https://doi.org/10.5194/acp-10-7795-2010, 2010.