the Creative Commons Attribution 4.0 License.
the Creative Commons Attribution 4.0 License.
 | 18 Oct 2022
Technical note: Northern midlatitude baseline ozone – long-term changes and the COVID-19 impact
David D. Parrish
Richard G. Derwent
Ian C. Faloona
Charles A. Mims
A nonlinear change in baseline ozone concentrations at northern midlatitudes has been quantified over preceding decades. During the past few years, several studies, using linear trend analyses, report relatively small trends over selected time periods – results inconsistent with the earlier developed picture. We show that reported COVID-19-related ozone changes in the background troposphere based on the linear analysis are significantly larger than those derived considering recent long-term decreases in background ozone, which the linear trend analyses do not quantify. We further point out that the extensive loss of lower stratospheric ozone in the unprecedented 2020 springtime Arctic stratospheric ozone depletion event likely reduced the natural source to the troposphere, rendering the background anomalously low that year. Consideration of these two issues indicates that the COVID-19 restrictions had a much smaller impact on background tropospheric ozone in 2020 than previously reported. A consensus understanding of baseline ozone changes and their causes is important for formulating policies to improve ozone air quality; cooperative, international emission control efforts aimed at continuing or even accelerating the ongoing decrease in hemisphere-wide background ozone concentrations may be the most effective approach to further reducing urban and rural ozone in the more developed northern midlatitude countries, as well as improving ozone air quality in all countries within these latitudes. Analysis of baseline ozone measurements over several years following the COVID-19 impact is expected to provide a firm basis for resolving the inconsistencies between the two views of long-term northern midlatitude ozone changes and better quantifying the COVID-19 impact.
- Article
(1926 KB) - Full-text XML
-
Supplement
(1716 KB) - BibTeX
- EndNote


Ozone is a species of central importance in the troposphere. Ozone itself is an air pollutant of concern throughout the world and is also a greenhouse gas contributing to climate change. Its photolysis in the presence of water vapor is the dominant source of hydroxyl radicals, which initiate complex radical chain chemistry that removes many air pollutants from the atmosphere but also produces a wide range of secondary photochemical products, some of which are important pollutants themselves. Fully understanding the temporal and spatial distribution of ozone within the troposphere is difficult because it is directly injected from the stratosphere and also is produced within the troposphere from photochemical reactions of precursors emitted by numerous, widely distributed natural and anthropogenic sources.
By about 10 years ago, a broad understanding of the ozone distribution in the background troposphere at northern midlatitudes had been established; that understanding includes, among others, three important quantified features:
-
In response to increasing ozone precursor emissions accompanying industrial development, ozone had increased markedly over the last half of the 20th century. Quite early, Crutzen (1988) realized that “at more remote background stations substantial ozone increases have taken place.” Logan et al. (2012) gave a quantification of these changes over Europe, and Parrish et al. (2012, 2014) determined that increase amounted to a factor of approximately 2 between 1950 and 2000.
-
Due to the long lifetime of ozone in the free troposphere combined with the dominant zonal atmospheric transport at midlatitudes, a high degree of zonal similarity exists in the average midlatitude ozone distribution. This was realized quite early by Junge (1962): “With respect to ozone the (northern midlatitude) troposphere can be considered a well-mixed reservoir”. Parrish et al. (2012, 2014) demonstrated that long-term changes were zonally similar within statistical uncertainties. There is one documented, statistically significant spatial gradient in average background ozone; as summarized by Crutzen et al. (1999) there is a “tendency for O3 mixing ratios to increase with height, … due to influx from the stratosphere and some net ozone production in the upper troposphere, along with uptake of ozone at the surface”.
-
Effective efforts to reduce precursor emissions in North America, Europe and later in China ended the increase and had even reversed the trend in background ozone concentrations. Consequently, long-term ozone changes have been highly nonlinear. Logan et al. (2012) found “that the ozone increased by 6.5–10 ppb in 1978–1989 and 2.5–4.5 ppb in the 1990s and decreased by 4 ppb in the 2000s in summer with no significant changes in other seasons”.
In the following discussion we refer to this understanding as the “conventional wisdom”.
In the past few years, several published papers with a common group of lead authors have reached conclusions inconsistent with all three elements of this conventional wisdom:
-
Tarasick et al. (2019) critically reviewed historical ozone measurements and concluded that ozone had increased to a significantly smaller extent than a factor of 2 during industrial development: “there is robust evidence for increases in the temperate and polar regions of the Northern Hemisphere of 30 %–70 %.”
-
Gaudel et al. (2018, 2020), Cooper et al. (2020) and Chang et al. (2022) reported substantial spatial differences in derived long-term ozone changes at northern midlatitudes.
-
These same papers (Gaudel et al., 2018, 2020; Cooper et al., 2020; Chang et al., 2022) utilized linear trend analysis approaches and found only small, positive or negative mean trends over the past 2 to 3 decades throughout northern midlatitudes; these results were interpreted as indicating that only small changes had occurred.
In the following discussion we refer to the picture developed in these recent papers as the “linear trend view”. Confusion remains regarding these issues because none of the recently published papers assessed the origins of, or the reasons for, the inconsistencies between their analyses and the earlier conventional wisdom.
Authors of this paper have been involved in several recent efforts to resolve the inconsistencies between the conventional wisdom and the linear trend view:
-
Parrish et al. (2021a) identified several biases in the Tarasick et al. (2019) ozone trend determination and concluded that “northern mid-latitude tropospheric baseline ozone concentrations … increased by a factor of 2.1 ± 0.2 over the 1950–2000 period.” The biases in the Tarasick et al. (2019) analysis primarily arose from the comparison of historical data generally collected at baseline representative sites with modern data collected at different, rural sites within the European continental boundary layer. This analysis in the present paper is based on measurement data collected at carefully selected baseline sites.
-
Parrish et al. (2020) quantified the degree of zonal similarity of ozone at northern midlatitudes by selecting the longest, high-quality, baseline ozone data sets available at northern midlatitudes; they found no statistically significant differences in either long-term changes or seasonal cycles among eight in situ data sets collected at surface sites within the marine boundary layer and higher-elevation mountain sites and from aircraft and sondes in the free troposphere.
-
Parrish et al. (2021b) synthesized multiple published linear trend analyses of western US baseline ozone and showed that all results are consistent with an overall, nonlinear change – a rapid increase (∼ 5 ppb per decade) during the 1980s that slowed in the 1990s and maximized in the mid-2000s and was followed by a slow decrease (∼ 1 ppb per decade) thereafter.
These efforts support the conventional wisdom quantification of all three features of the northern midlatitude ozone distribution.
The decrease of anthropogenic emissions associated with the COVID-19 pandemic provides an additional opportunity to investigate the inconsistencies between these two views of the northern midlatitude ozone distribution. The reduction in societal activity associated with efforts to stem the COVID-19 pandemic significantly reduced anthropogenic precursor emissions, thereby perturbing ozone photochemical production. Consequently, there has been great interest in investigating the effect of this perturbation on the ozone distribution based on observations, both within polluted continental regions (Gkatzelis et al., 2021, and Sokhi et al., 2021, provide reviews) and within the global background troposphere. Our goal is to examine the reported quantifications of COVID-19-related ozone changes in the background troposphere at northern midlatitudes within the context of the established long-term changes in baseline ozone that have occurred over the past 4 decades. In this work the term “baseline” is used to refer to measurements that have been made at locations that are free of recent continental influences and thus directly reflect ozone in the background troposphere.
Steinbrecht et al. (2021) point out that during 2020, ozone concentrations observed in the Northern Hemisphere free troposphere were lower than in any previous year since at least 2000 and use those observations to estimate the COVID-19 impact on ozone concentrations outside of polluted regions. They conclude that from April to August 2020 and from 1 to 8 km altitude, ozone was on average 7 % (≈ 4 ppb, i.e., nmol mol−1) smaller than the 2000–2020 climatological mean and that the major cause for this difference is COVID-19-related emission reductions during 2020. Cristofanelli et al. (2021) report negative ozone anomalies at a high mountain site in northern Italy that are consistent with the findings of Steinbrecht et al. (2021). Clark et al. (2021) utilize In-service Aircraft for a Global Observing System (IAGOS) to document a slightly negative ozone anomaly in the free troposphere above Frankfurt, Germany; this anomaly lies just outside of the range of interannual variability based on their 1994–2019 climatology. Chang et al. (2022) focus on the free troposphere over western North America and Europe; they document negative ozone anomalies in 2020 in the free troposphere that are the most profound since their reference year of 1994.
In this work we investigate an additional question not considered in these reports but one that must be answered to accurately estimate the reduction of tropospheric ozone associated with COVID-19 impacts: what baseline ozone concentrations would have been expected in 2020 in the absence of the COVID-19 pandemic? As discussed earlier, there are conflicting treatments of the pre-pandemic trends. The conventional wisdom holds that following a decades-long increase of ozone at northern midlatitudes associated with industrial development, baseline ozone has decreased throughout northern midlatitudes since the mid-2000s (Logan et al., 2012; Parrish et al., 2017, 2020, 2021a). This decrease has been plausibly attributed to decreasing precursor emissions in Europe, North America and, more recently, China (e.g., Jiang et al., 2020). Additionally, stratosphere-to-troposphere exchange (STE) of ozone may also have played an important role (Polvani et al., 2018; Griffiths et al., 2020; Abalos et al., 2020). The Arctic ozone depletion in 2020 was the largest observed to date (Wohltmann et al., 2020; Weber et al., 2021) and was especially pronounced in the lower stratosphere (Ardra et al., 2022). This depletion likely reduced the STE of ozone coincident with, but independent of, the reduction of precursor emissions due to COVID-19.
Both of these impacts, the long-term changes in baseline ozone and the interannual fluctuations in STE, must be quantitatively considered before it is possible to accurately estimate the extent to which COVID-19-related precursor emission reductions actually perturbed baseline ozone concentrations. In this work, we quantitatively address the impact of the long-term changes. We do not attempt to accurately quantify the impact of reduced STE but do note that the impact from its anomalously large perturbation from the average Northern Hemisphere stratospheric contribution would serve to further diminish the quantified role of COVID-19 restrictions in determining the 2020 tropospheric ozone levels.
The observational data and most analysis results discussed here are taken from the published literature, as referenced herein; no new measurement data are required, although we do include some recent supporting data in the Supplement. Our goal is to put disparate analyses and discussions into a common context in order to answer as fully as possible the question posed above and to help further resolve the inconsistencies between the conventional wisdom and the linear trend view of the northern midlatitude ozone distribution.
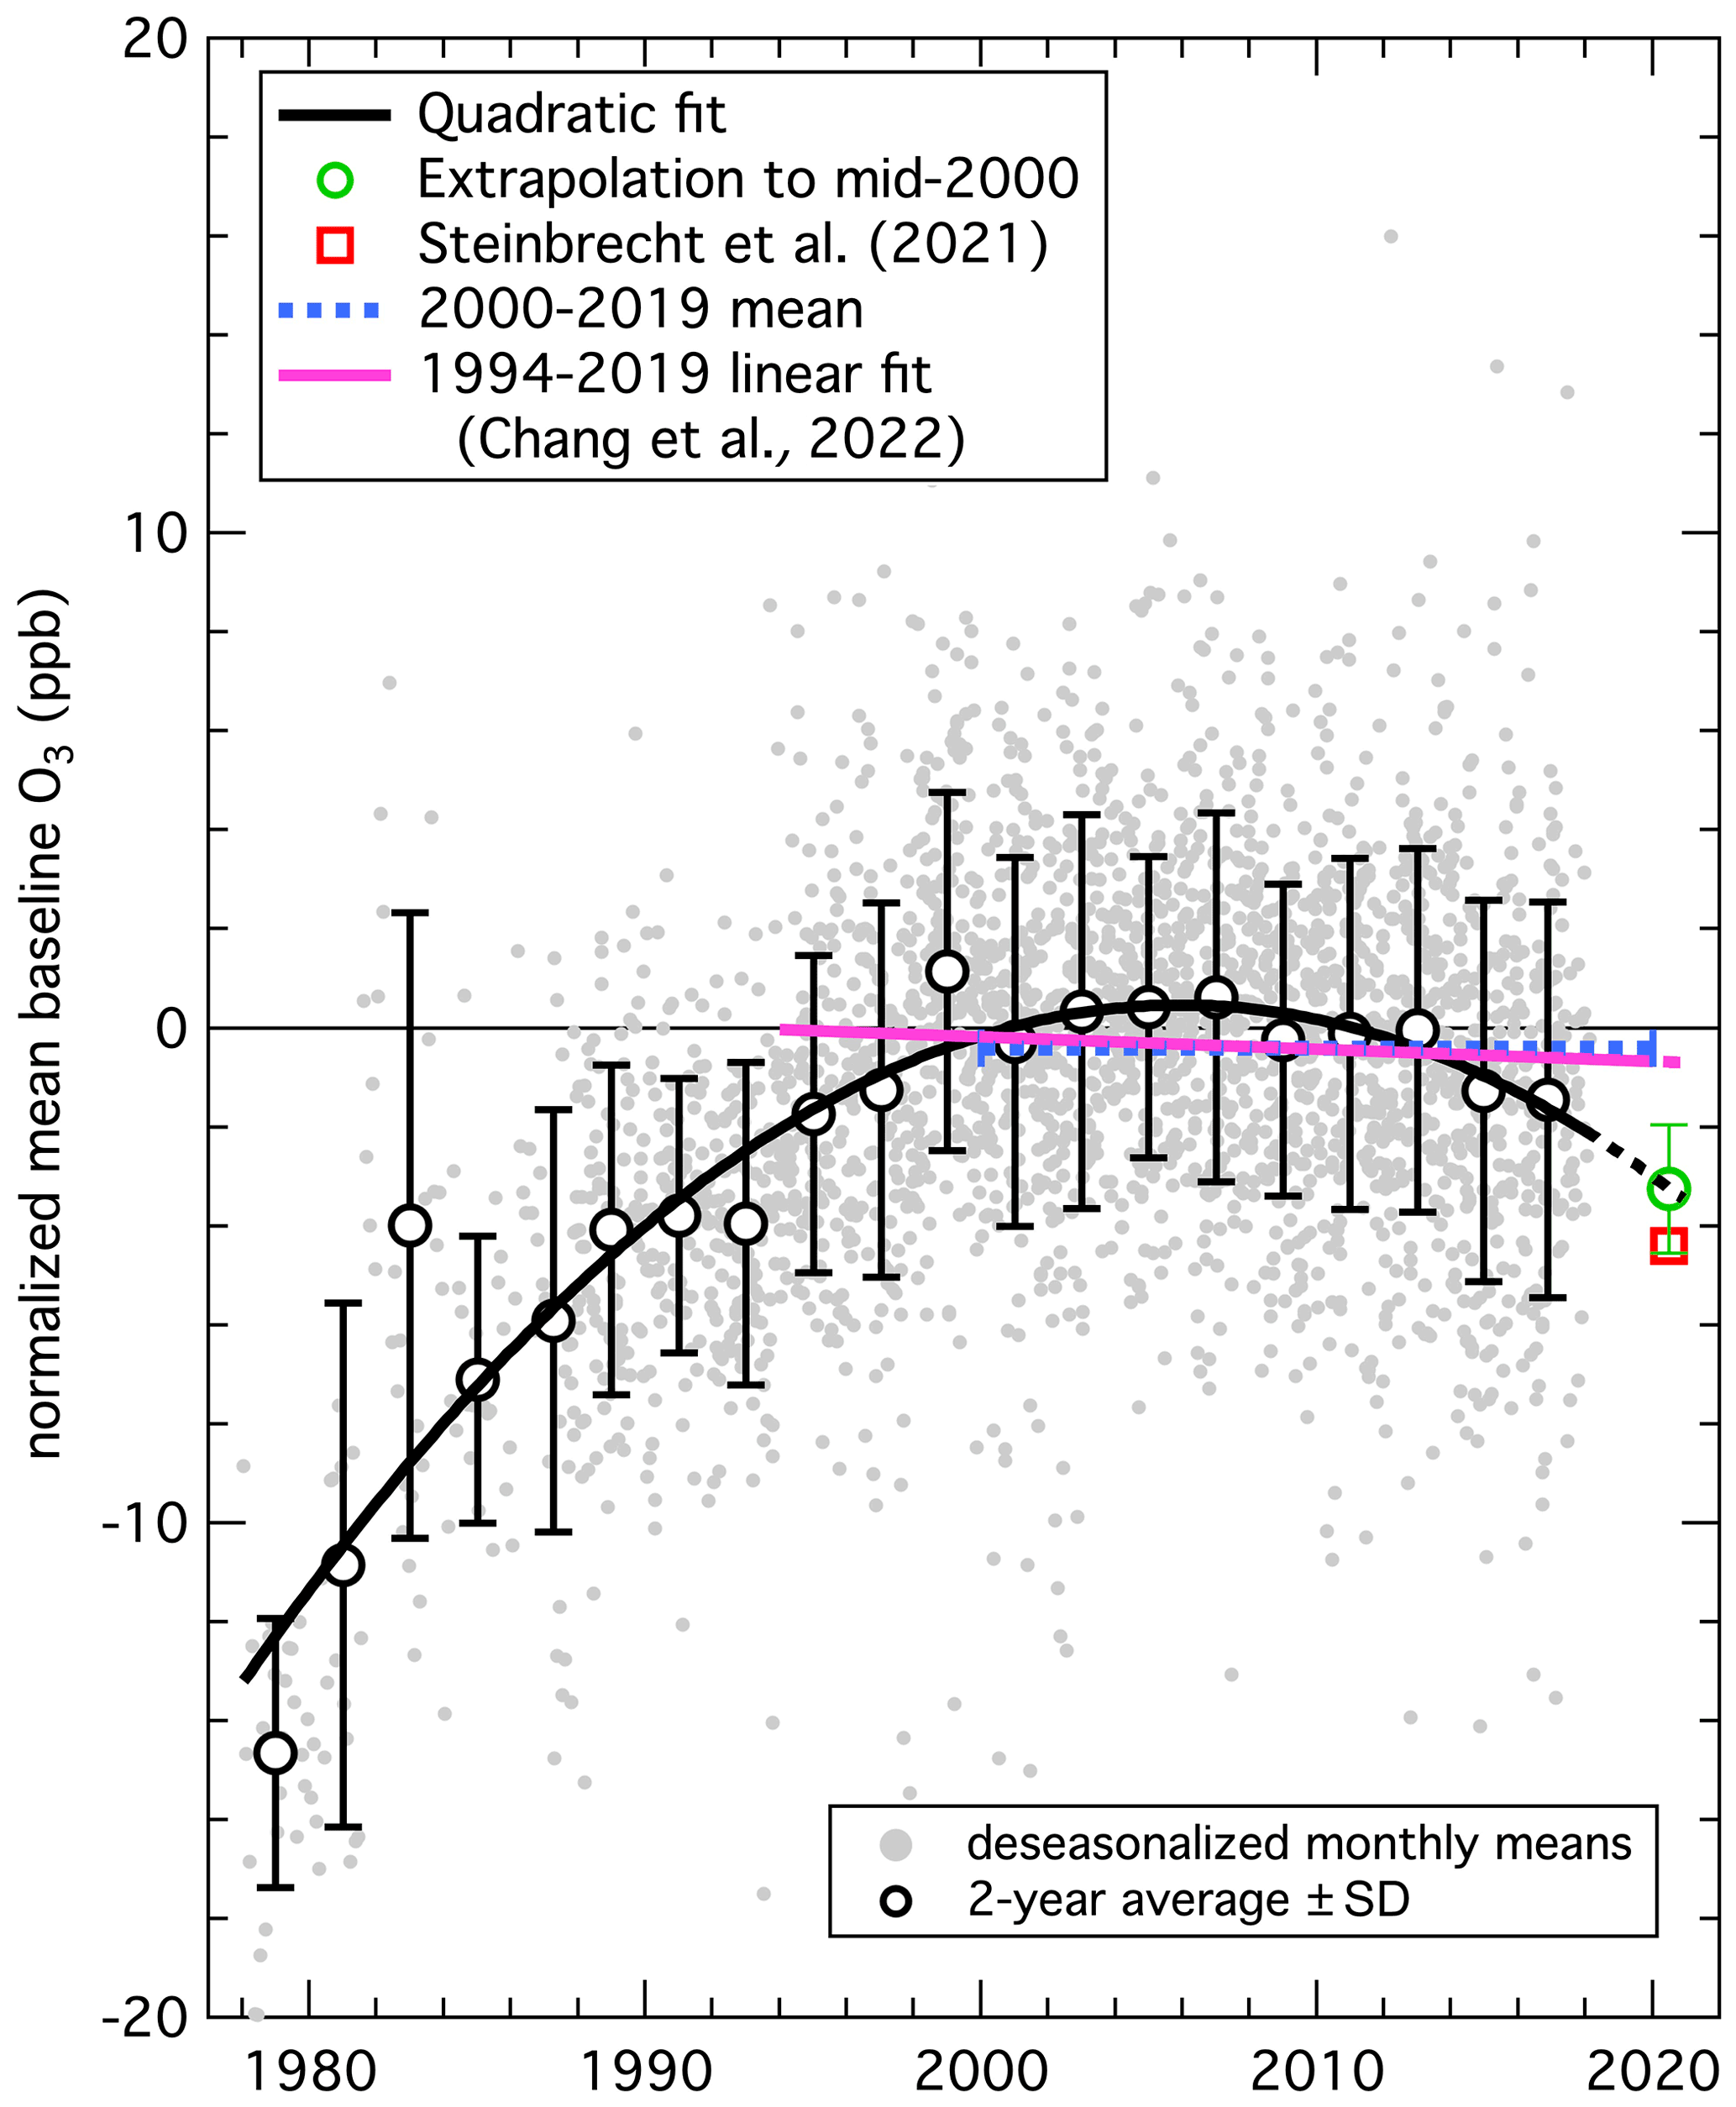
Figure 1Baseline ozone concentrations at northern midlatitudes over 4 decades. Gray points are normalized, deseasonalized monthly mean northern midlatitude data, open circles with error bars are 2-year means with standard deviations of the gray points, and the solid black curve is a quadratic polynomial fit to the gray points (Parrish et al., 2020). The dashed black line extrapolates the quadratic fit to mid-2020. The red square and green circle indicate estimates of the year 2020 annual mean from Steinbrecht et al. (2021) and the extrapolation of the quadratic fit, respectively; the error bars on the green circle indicate the estimated 95 % confidence limit of the extrapolation. The dotted blue bar indicates the 2000 to 2020 mean normalized baseline ozone derived from integration of the quadratic fit. The violet line segment has a slope equal to the weighted mean of the northern midlatitude linear trends for 1994–2019 given in Table 2 of Chang et al. (2022), normalized to the 1994–2018 2-year means.
Parrish et al. (2020) analyzed eight baseline data sets collected in western North America and western Europe; these observations and the derived long-term baseline ozone changes are plotted in Fig. 1, which is modified from Figs. 9 and 10 of Parrish et al. (2020). These data include the longest available time series of high quality measurements conducted at surface sites (from the marine boundary layer up to mountain tops) and airborne (sonde and aircraft) platforms. The conventional wisdom implies that the long lifetime of ozone in the free troposphere (longer than circum-global transport times at these latitudes) ensures that mean ozone concentrations exhibit a high degree of zonal similarity. Parrish et al. (2020) show that, as expected, there are no statistically significant differences in the long-term ozone changes derived from these eight independent data sets; thus the relatively small number of locations (12 included in the eight data sets) serves to accurately characterize the mean long-term baseline ozone changes throughout northern midlatitudes. These data clearly show the nonlinear behavior described above with a decreasing trend in the recent past; the average ozone levels observed in the pre-COVID years (2014–2018) were already lower than any previous year since 2000. Moreover, Parrish et al. (2021b) show that the quadratic fit used to describe this nonlinearity in these to the long-term ozone changes shown in Fig. 1 is consistent, within the estimated errors, with all other reported trends in baseline ozone across the western United States. Power series analysis showed that these baseline ozone changes are quantified to the limit of statistical significance by the quadratic polynomial fit (solid curve in Fig. 1) to the monthly mean data defined by
where the derived coefficient values are .2 ± 0.2 ppb, b=0.21 ± 0.06 ppb yr−1 and (18 ± 6) × 10−3 ppb yr−2, with t = year − 2000, which is the time in years referenced to the beginning of year 2000. The deseasonalized monthly mean data from each data set were normalized to zero at that reference time, which is consistent with the derived a parameter value near zero. Section S1 in the Supplement discusses additional aspects of this fit. The data from which the quadratic curve fit is derived extend only up to 2018, and although we acknowledge that extension of a parametric, nonlinear regression is not always advisable, a modest 3-year extrapolation of Eq. (1) (dotted black curve in Fig. 1) provides a reasonable estimate of −3.2 ± 1.3 ppb (green circular symbol in Fig. 1) for the normalized baseline ozone in mid-2020. This extrapolation thus provides an estimate of the expected baseline ozone concentrations in 2020 had the COVID-19 pandemic not occurred. Extrapolations of other plausible fits to the ozone decrease following the mid-2000s maximum generally pass within the 2σ confidence interval indicated by the error bars.
Steinbrecht et al. (2021) compare ozone measured in the year 2020 with the 20-year 2000–2020 climatological mean and find that 2020 was on average ≈ 4 ppb lower. The 2000–2020 mean baseline ozone can be derived from integration of the quadratic fit given by Eq. (1); the result is indicated by the blue line segment in Fig. 1. Since the 2000 to 2020 period includes both the baseline ozone maximum in the 2000s and lower concentrations in the 2010s, that average is −0.4 ppb, i.e., similar to, but slightly smaller than, the year 2000 normalization of 0 ppb. The result of Steinbrecht et al. (2021) implies that 2020 mean baseline ozone is ≈ 4.4 ppb below the year 2000 value, as indicated by the red square in Fig. 1.
Chang et al. (2022) apply a multiple linear regression model to estimate trends and associated uncertainties for 15 northern midlatitude ozone data sets of ozone profiles in the free troposphere (see their Table 2). The mean of the derived trends (each trend weighted by the inverse of the square of its uncertainty) over the 1994–2019 period is −0.025 ± 0.015 ppb yr−1, which corresponds to a small net change (−0.6 ± 0.4 ppb) over that 26-year period. This result is included in Fig. 1 as the violet line, which has the above slope and is normalized to the 12 2-year means included within that period. An extrapolation of that line to mid-2020 (indicated by a single dot in the figure) gives an estimate of −0.7 ppb for 2020 northern midlatitude baseline ozone had the COVID-19 pandemic not occurred. Importantly, the slope of the net change over the 1994–2019 period can also be calculated from the quadratic fit of Eq. (1):
This slope evaluated at 2007 (i.e., the midpoint of the 1994–2019 period) is −0.042 ± 0.006 ppb yr−1 based on the quadratic fit parameters given above. These estimated slopes are small because the midpoint of this period is close to the maximum of the quadratic fit in 2006 ± 3 years (Parrish et al., 2020). The slope derived from Eq. (2) corresponds to a net change of −1.1 ± 0.2 ppb over the 1994–2019 period. This comparison indicates that the net ozone change values over the 26-year period derived in the analyses of Parrish et al. (2020) and Chang et al. (2022) agree closely, −1.1 ± 0.2 and −0.6 ± 0.4 ppb, respectively, although the latter analysis does not attempt to quantify the nonlinear character of the long-term change that results in that small net change. Chang et al. (2022) present other averaging approaches over differing time periods; there are small differences in the derived trends, but all give a trend of zero within ±0.1 ppb yr−1, indicating small overall changes similar to the violet straight line segment in Fig. 1. Table S1 and Fig. S1 in the Supplement compare all of these Chang et al. (2020) fits with fits derived from Eq. (2).
The two different approaches to characterizing the underlying long-term changes give two significantly different values of the baseline ozone concentrations expected at northern midlatitudes in 2020 in the absence of the COVID-19 pandemic. As illustrated in Fig. 1, the conventional wisdom (i.e., extrapolation of the nonlinear changes derived over the past 4 decades as quantified by Parrish et al., 2020) gives the expectation that even without the pandemic in 2020, baseline ozone would have decreased to 3.2 ± 1.3 ppb (green circular symbol in Fig. 1) below the reference year 2000. In contrast, the linear trend view (i.e., using either the 2000–2020 climatological mean (Steinbrecht et al., 2021) or extrapolation of the small mean linear trend derived by Chang et al., 2022) gives significantly larger expected 2020 baseline ozone, only 0.4 ppb (blue line segment) or 0.7 ppb (extrapolation of the violet line) below the reference year 2000, respectively. These differing expectations then lead to different conclusions regarding the impact of the COVID-19 emission reductions: −1.2 ± 1.3 ppb from the conventional wisdom versus −4 ppb (Steinbrecht et al., 2021) or −3.7 ppb (Chang et al., 2022) from the linear trend view.
Several studies have emphasized the more qualitative observation that 2020 baseline ozone was anomalously low. Steinbrecht et al. (2021) note that “monthly means in spring and summer 2020 were actually the lowest, or close to the lowest, since 2000” in several ozonesonde data sets. Cristofanelli et al. (2021) report that “Low O3 monthly anomalies were observed during spring (MAM) and summer (JJA), when periods of low O3 intertwined with periods with higher O3, within climatological ranges” at Mt. Cimone in Italy. Chang et al. (2022) find “that free tropospheric ozone negative anomalies in 2020 are the most profound since the benchmark year of 1994 for both Europe and western North America.” Clark et al. (2021) note that the ozone “anomaly in the free troposphere above 2000 m is negative, lying just outside of the range of interannual variability based on the 26-year (IAGOS) time series (at Frankfurt, Germany).” Importantly, the conventional wisdom view would have predicted these qualitative findings, even in the absence of the COVID-19 impact; the quadratic fit illustrated in Fig. 1 indicates that the continuing baseline ozone decrease would have been expected to lower average northern midlatitude baseline ozone below that in any previous year since 1990. A further complication is also important. As Steinbrecht et al. (2021) note, the largest Arctic ozone depletion event on record occurred in the spring of 2020. That depletion was more significant than past events, particularly at lower altitudes (13–18 km), as illustrated in Wohltmann et al. (2020), Manney et al. (2020) and Ardra et al. (2022). Thus in comparing 2011 and 2020, as was done by Steinbrecht et al. (2021), the reduction in tropospheric mean ozone due to a diminished stratospheric influx was likely smaller in 2011. This difference between the 2 years is clearly illustrated by Fig. 3a and b in Steinbrecht et al. (2021), which show an average decrease of ∼ 2.5 % in ozone measured by sondes between 8–15 km in 2011, whereas the depletion is 10 % in the same layer in 2020. It is clear that ozone in the lower stratosphere was significantly less during 2020 than in 2011. Influx of stratospheric ozone into the troposphere occurs predominantly by quasi-horizontal isentropic mixing in the extratropics and is strongest in the springtime Northern Hemisphere (Holton et al., 1995). While quantifying the exact impact that this extreme Arctic ozone depletion event had on tropospheric ozone in 2020 is difficult, an approximate estimate can be made. If we assume that the 10 % ozone depletion in the lower stratosphere in 2020 implies a 10 % reduction in STE, and if we assume that 25 % of the ozone in the free troposphere at northern midlatitudes is of stratospheric origin (see Plate 6 of Lelieveld and Dentener, 2000), then a 2.5 % decrease of ozone in the free troposphere at northern midlatitudes is expected beyond that due to the long-term downward trend illustrated in Fig. 1. This estimate is in accord with a recent simulation (Bouarar et al., 2021), which found that the impact of the springtime Arctic stratospheric ozone depletion on the northern hemispheric tropospheric ozone burden in April–August 2020 was 2 %–3 % (approximately 1–2 ppb).
In summary, Steinbrecht et al. (2021) demonstrate that average 2020 free tropospheric ozone across the Northern Hemisphere decreased from the 2000–2020 climatological mean by ≈ 7 % (≈ 4 ppb). They attribute this difference to the COVID-19 crisis. However, here we compare 2020 ozone to that extrapolated from the nonlinear long-term ozone changes that have occurred over the last 4 decades and quantify a COVID-19 impact of significantly smaller magnitude (decrease of 1.2 ± 1.3 ppb); considering the 95 % confidence limit of the result, the 2020 expectation is even consistent with no COVID-19 impact on baseline ozone at northern midlatitudes. Indeed, the estimated 1–2 ppb baseline O3 decrease from the 2020 Arctic depletion event (Bouarar et al., 2021) combined with the conventional wisdom estimate is sufficient to explain all of the 2020 ozone decrease without any impact from COVID-19 emission reductions.
Importantly, 2 or 3 years of data collected after the impact of the COVID-19 pandemic on ozone precursor emissions has ended will allow a more accurate and precise determination of the magnitude of that COVID-19 impact and will allow us to determine whether the conventional wisdom or the linear trend view provides a more realistic and accurate characterization of long-term baseline ozone changes at northern midlatitudes. One future investigation will be illuminating; the long-term record of baseline-sorted ozone measurements at Mace Head (Derwent et al., 2018) can be extended. Figure 2 compares the unsorted monthly mean ozone concentrations measured at the Mace Head Atmospheric Research Station on the North Atlantic Ocean coastline of Ireland. Three consecutive 10-year climatologies are represented showing the rise in baseline ozone from the end of the 20th century, with the peak in the early 21st century. Also shown are the ±2 standard deviations for the entire 30 years and the monthly averages during the year of 2020 impacted by COVID-19. According to the northern hemispheric baseline concentrations shown in Fig. 1, the baseline ozone of 2020 is expected to be similar to that of the 1987–1996 interval. Comparing these curves shows how the deviations in 2020, outside of the month of July, are inconsequential with respect to those expected. Furthermore, the 2020 fluctuations remain within the 30-year climatological ±2 standard deviations envelope. These comparisons suggest that the COVID-19 impact on baseline ozone at northern midlatitudes is small enough that it will be difficult to extract a quantification that is statistically significantly different from zero. Additionally, a preliminary analysis of a 32-year (1990–2021) time series of annual means of maximum daily 8 h average ozone measured at seven isolated rural sites of the Clean Air Status and Trends Network (CASTNET; https://www.epa.gov/castnet, last access: 29 August 2022) in the western United States is described in Sect. S3 of the Supplement; this analysis finds a small COVID-19 impact (−0.5 ± 1.2 ppb) in the year 2020, consistent with that derived from the extrapolation of the quadratic baseline ozone change discussed above.
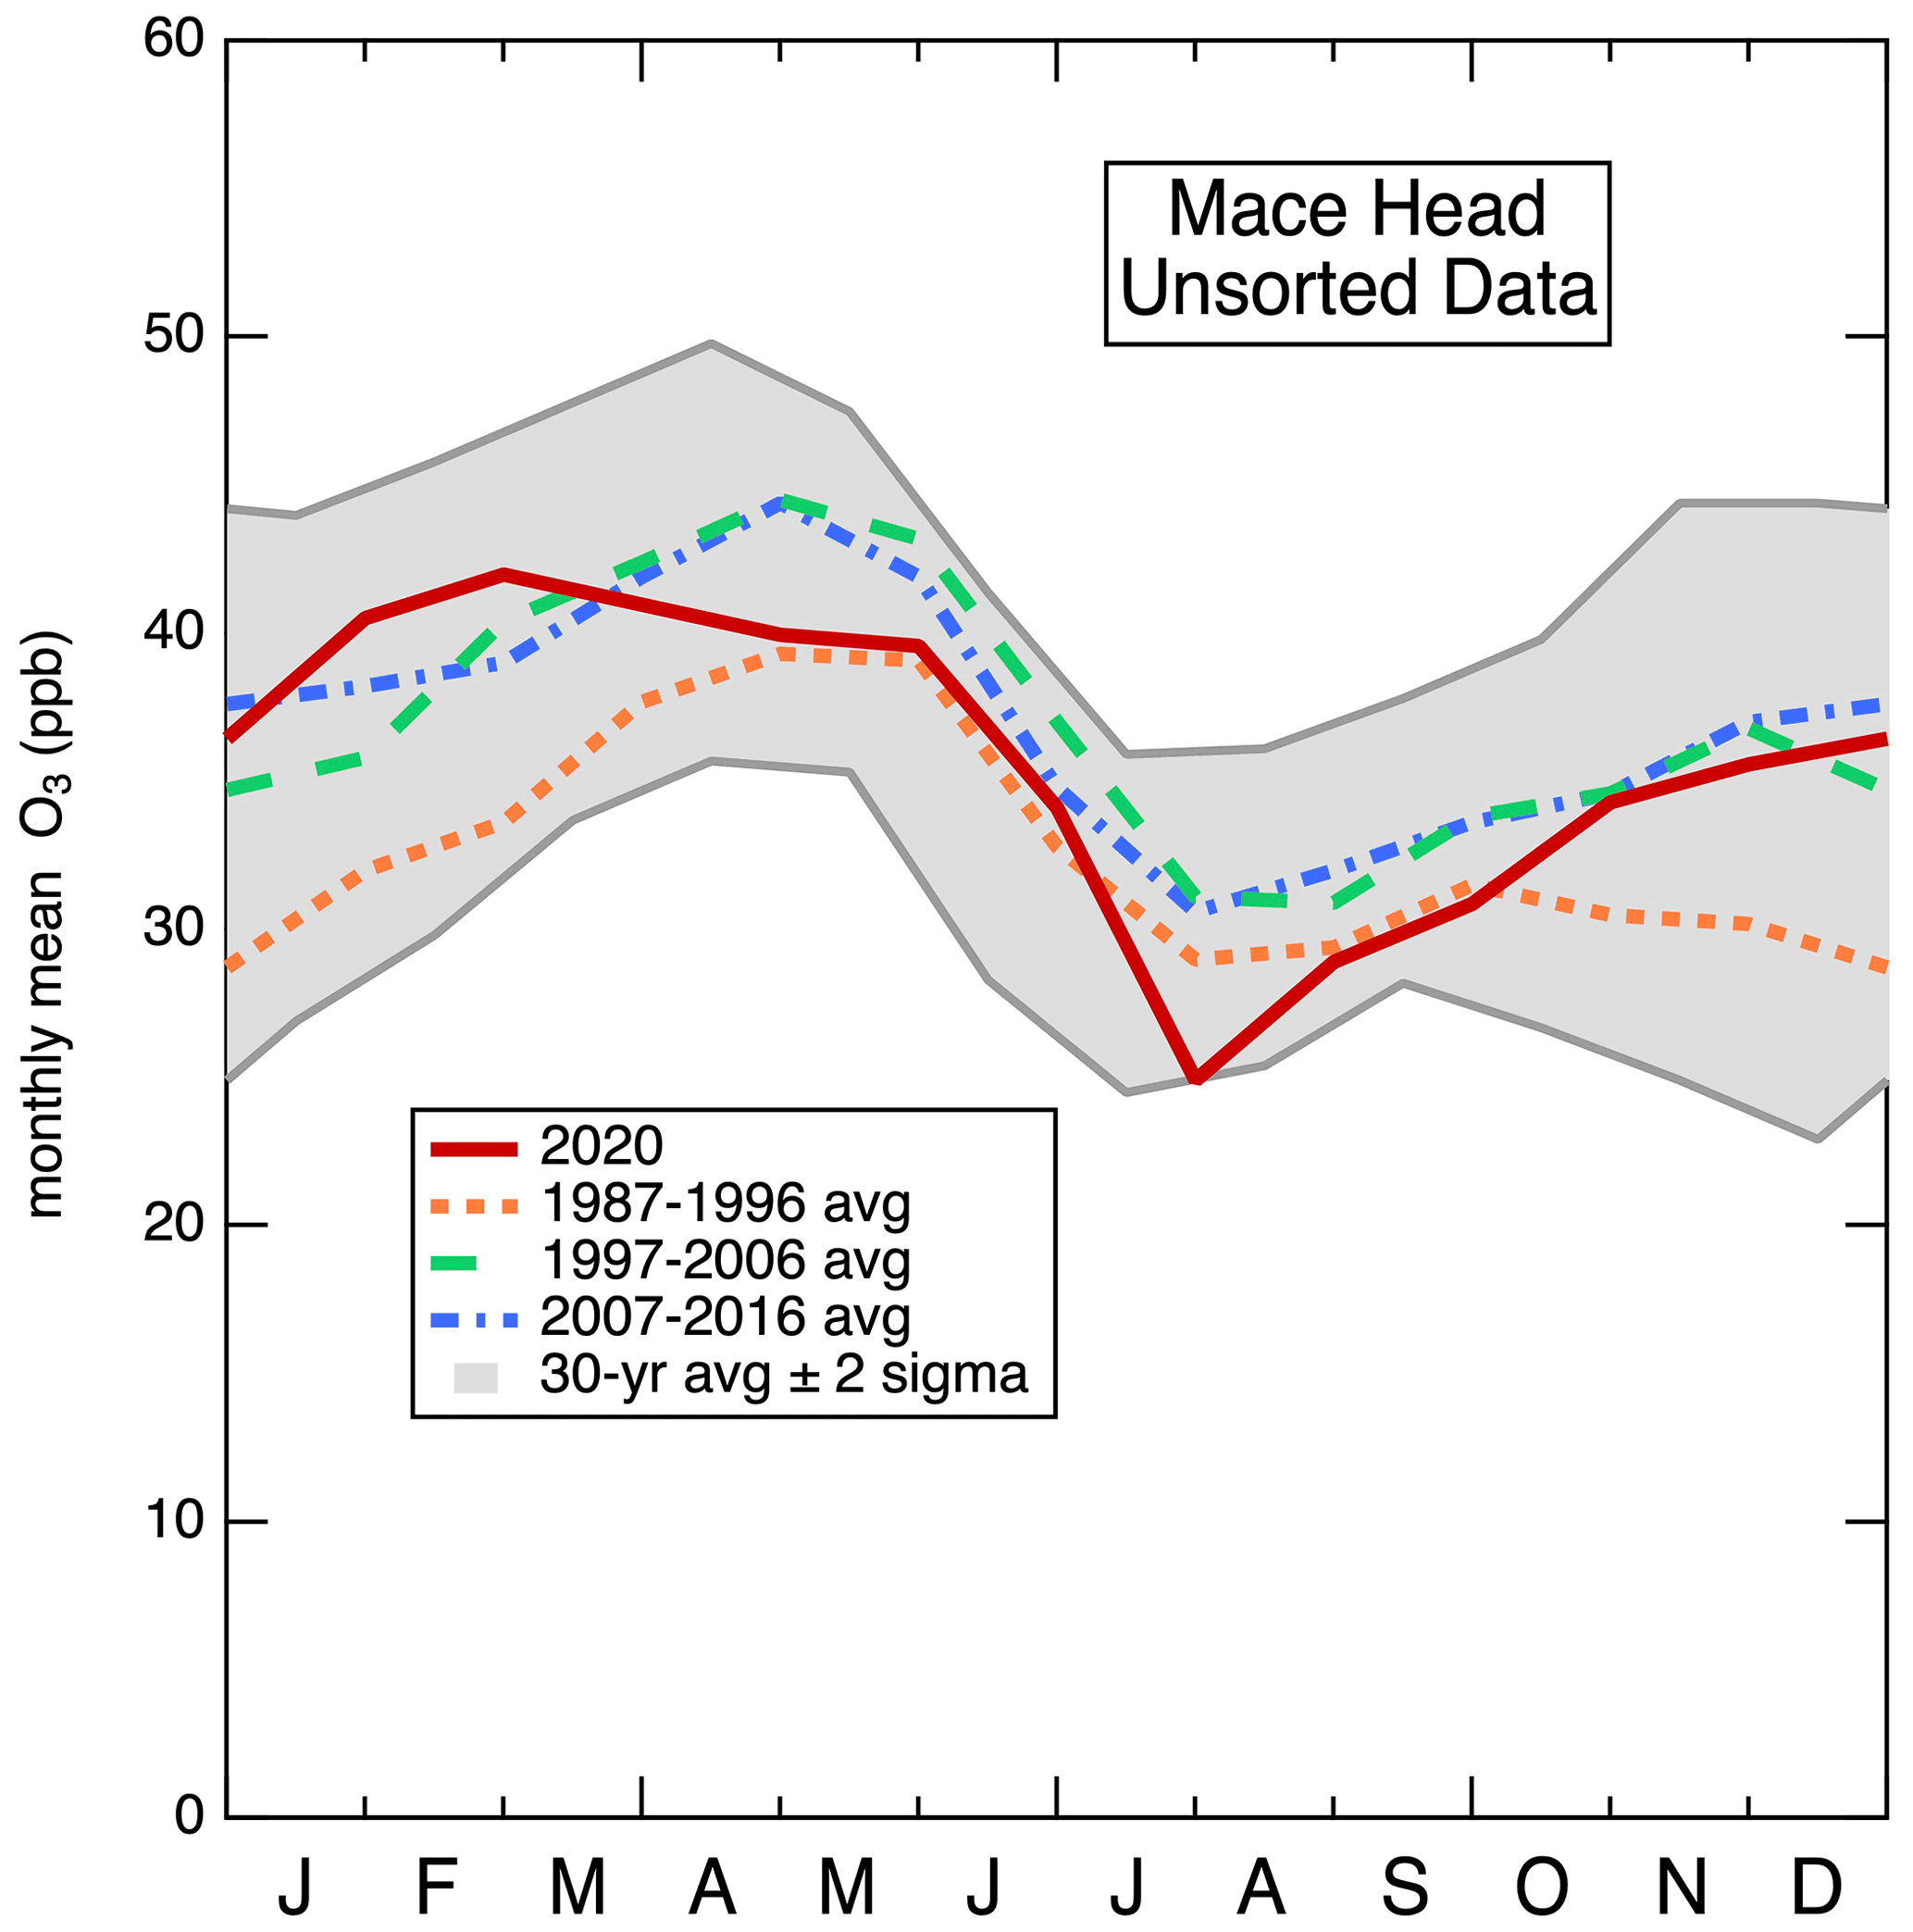
Figure 2Time series of monthly mean ozone mixing ratios measured at the Mace Head Atmospheric Research Station on the North Atlantic Ocean coastline of Ireland. These data have not been sorted for baseline conditions. The broken curves show the three consecutive decadal averages: 1987–1996 (dotted orange), 1997–2006 (dashed green) and 2007–2016 (dotted–dashed blue). The shaded region represents the ±2σ of the 30-year averages, and the solid dark red line plots the 2020 data.
In closing, we note that a clear resolution of the inconsistencies between the conventional wisdom and the linear trend view is important for designing air quality improvement strategies for local and regional ozone air quality in the earlier developing economies (i.e., in North America and western Europe). In these countries, local and regional emission control efforts have reduced domestic ozone production by large factors, leaving relatively little opportunity for further ozone air quality improvement through domestic emission controls alone (Parrish et al., 2022; Derwent et al., 2022 and references therein). Consequently, cooperative, international emission control efforts aimed at continuing or even accelerating the ongoing decrease in northern midlatitude baseline ozone concentrations may be the most effective approach to further ozone reductions in these earlier developing countries. As quantified by Steinbrecht et al. (2021) and illustrated in Fig. 1, northern midlatitude baseline ozone concentrations in 2020 were ∼ 8 % below those in 2000, which were in turn 47 % to 57 % above the 1950 concentrations according to the analysis of Parrish et al. (2021a); this difference implies there may be a large potential for additional reductions in northern midlatitude baseline ozone concentrations before they approach preindustrial levels. Complicating this picture is mounting evidence that the STE source of ozone will increase in coming decades due to acceleration of the Brewer–Dobson circulation driven by the changing climate (e.g., Meul et al., 2018; Abalos et al., 2020); this additional issue emphasizes the importance of understanding, from first principles, the distribution of tropospheric background ozone and the causes of its long-term changes.
All of the data utilized in this paper are available from the public CASTNET data archive (https://www.epa.gov/castnet, EPA, 2022), in Derwent at al. (2018) and in publications cited in the caption of Fig. 1.
The supplement related to this article is available online at: https://doi.org/10.5194/acp-22-13423-2022-supplement.
DDP conceptualized the study. All four authors contributed analysis and figures to the paper and the Supplement. DDP wrote the original draft manuscript. All four authors edited the manuscript and provided feedback on the interpretation of the results.
David D. Parrish also works as an atmospheric chemistry consultant (David D. Parrish, LLC); he has had contracts funded by several state and federal agencies and industrial coalitions, although they did not support the work reported in this paper. The authors have no other competing interests to declare.
Publisher's note: Copernicus Publications remains neutral with regard to jurisdictional claims in published maps and institutional affiliations.
The 2020 ozone observations from the Mace Head station were taken from the EBAS database (https://ebas-data.nilu.no) and were provided by T. Gerard Spain of the Department of Physics, National University of Ireland – Galway, and Peter G. Simmonds of the School of Chemistry, University of Bristol.
Ian C. Faloona's effort on this work was supported by the USDA National Institute of Food and Agriculture (Hatch project CA-D-LAW-2481-H, “Understanding Background Atmospheric Composition, Regional Emissions, and Transport Patterns Across California”).
This paper was edited by Jianzhong Ma and reviewed by three anonymous referees.
Abalos, M., Orbe, C., Kinnison, D. E., Plummer, D., Oman, L. D., Jöckel, P., Morgenstern, O., Garcia, R. R., Zeng, G., Stone, K. A., and Dameris, M.: Future trends in stratosphere-to-troposphere transport in CCMI models, Atmos. Chem. Phys., 20, 6883–6901, https://doi.org/10.5194/acp-20-6883-2020, 2020.
Ardra, D., Kuttippurath, J., Roy, R., Kumar, P., Raj, S., Müller, R., and Feng, W.: The Unprecedented Ozone Loss in the Arctic Winter and Spring of 2010/2011 and 2019/2020, ACS Earth Space Chem., 6, 683–693, 2022.
Bouarar, I., Gaubert, B., Brasseur, G. P., Steinbrecht, W., Doumbia, T., Tilmes, S., and Wang, T.: Ozone anomalies in the free troposphere during the COVID-19 pandemic, Geophys. Res. Lett., 48, e2021GL094204, https://doi.org/10.1029/2021GL094204, 2021.
Chang, K.-L., Cooper, O. R., Gaudel, A., Allaart, M., Ancellet, G., Clark, H., Godin-Beekmann, S., Leblanc, T., Van Malderen, R., Nédélec, P., Petropavlovskikh, I., Steinbrecht, W., Stübi, R., Tarasick D. W., and Torres, C.: Impact of the COVID-19 economic downturn on tropospheric ozone trends: An uncertainty weighted data synthesis for quantifying regional anomalies above western North America and Europe, AGU Adv., 3, e2021AV000542, https://doi.org/10.1029/2021AV000542, 2022.
Clark, H., Bennouna, Y., Tsivlidou, M., Wolff, P., Sauvage, B., Barret, B., Le Flochmoën, E., Blot, R., Boulanger, D., Cousin, J.-M., Nédélec, P., Petzold, A., and Thouret, V.: The effects of the COVID-19 lockdowns on the composition of the troposphere as seen by In-service Aircraft for a Global Observing System (IAGOS) at Frankfurt, Atmos. Chem. Phys., 21, 16237–16256, https://doi.org/10.5194/acp-21-16237-2021, 2021.
Cooper, O. R., Schultz, M. G., Schröder, S., Chang, K.-L., Gaudel, A., Benítez, G. C., Cuevas, E., Fröhlich, M., Galbally, I. E., Molloy, S., Kubistin, D., Lu, X., McClure-Begley, A., Nédélec, P., O'Brien, J., Oltmans, S. J., Petropavlovskikh, I., Ries, L., Senik, I., Sjöberg, K., Solberg, S., Spain, G. T., Spangl, W., Steinbacher, M., Tarasick, D., Thouret, V., and Xu, X.: Multi-decadal surface ozone trends at globally distributed remote locations, Elem. Sci. Anth., 8, 23, doi.org/10.1525/elementa.420, 2020.
Cristofanelli, P., Arduni, J., Serva, F., Calzolari, F., Bonasoni, P., Busetto, M., Maione, M., Sprenger, M., Trisolino, P., and Putero, D.: Negative ozone anomalies at a high mountain site in northern Italy during 2020: a possible role of COVID-19 lockdowns?, Environ. Res. Lett., 16, 074029, https://doi.org/10.1088/1748-9326/ac0b6a, 2021.
Crutzen, P. J.: Tropospheric ozone: an overview, in: Tropospheric Ozone, edited by, Isksen, I. S. A., D. Reidel, Dordrecht, 3–32, 1988.
Crutzen, P. J., Lawrence, M. G., and Pöschl, U.: On the background photochemistry of tropospheric ozone, Tellus A, 51, 123–146, https://doi.org/10.3402/tellusa.v51i1.12310, 1999.
Derwent, R. G. and Parrish, D. D.: Analysis and assessment of the observed long-term changes over three decades in ground-level ozone across north-west Europe from 1989–2018, Atmos. Environ., 286, 119222, https://doi.org/10.1016/j.atmosenv.2022.119222, 2022.
Derwent, R. G., Manning, A. J., Simmonds, P. G., Spain, T. G., and O'Doherty, S.: Long-term trends in ozone in baseline and European regionally-polluted air at Mace Head, Ireland over a 30-year period, Atmos. Environ., 179, 279–287, https://doi.org/10.1016/j.atmosenv.2018.02.024, 2018.
EPA: CASTNET data archive, https://www.epa.gov/castnet, last access: 29 August 2022.
Gaudel, A., Cooper, O. R., Ancellet, G., Barret, B., Boynard, A., Burrows, J. P., Clerbaux, C., Coheur, P.-F., Cuesta, J., Cuevas, E., Doniki, S., Dufour, G., Ebojie, F., Foret, G., Garcia, O., Granados Muños, M. J., Hannigan, J. W., Hase, F., Huang, G., Hassler, B., Hurtmans, D., Jaffe, D., Jones, N., Kalabokas, P., Kerridge, B., Kulawik, S. S., Latter, B., Leblanc, T., Le Flochmoën, E., Lin, W., Liu, J., Liu, X., Mahieu, E., McClure-Begley, A., Neu, J. L., Osman, M., Palm, M., Petetin, H., Petropavlovskikh, I., Querel, R., Rahpoe, N., Rozanov, A., Schultz, M. G., Schwab, J., Siddans, R., Smale, D., Steinbacher, M., Tanimoto, H., Tarasick, D. W., Thouret, V., Thompson, A. M., Trickl, T., Weatherhead, E., Wespes, C.,Worden, H. M., Vigouroux, C., Xu, X., Zeng, G., and Ziemke, J.: Tropospheric Ozone Assessment Report: Present-day distribution and trends of tropospheric ozone relevant to climate and global atmospheric chemistry model evaluation, Elem. Sci. Anth., 6, 39, https://doi.org/10.1525/elementa.291, 2018.
Gaudel, A., Cooper, O. R., Chang, K.-L., Bourgeois, I., Ziemke, J. R., Strode, S. A., Oman, L. D., Sellitto, P., Nédélec, P., and Blot, R.: Aircraft observations since the 1990s reveal increases of tropospheric ozone at multiple locations across the Northern Hemisphere, Sci. Adv., 6, eaba8272, https://doi.org/10.1126/sciadv.aba8272, 2020.
Gkatzelis, G. I., Gilman, J. B., Brown, S. S., Eskes, H., Gomes, A. R., Lange, A. C., and Kiendler-Scharr, A.: The global impacts of COVID-19 lockdowns on urban air pollution: A critical review and recommendations. Elem. Sci. Anth., 9, 1, https://doi.org/10.1525/elementa.2021.00176, 2021.
Griffiths, P. T., Keeble, J., Shin, Y. M., Abraham, N. L., Archibald, A. T., and Pyle, J. A.: On the changing role of the stratosphere on the tropospheric ozone budget: 1979–2010, Geophys. Res. Lett., 46, e2019GL086901, https://doi.org/10.1029/2019GL086901, 2020.
Holton, J. R., Haynes, P. H., McIntyre, M. E., Douglass, A. R., Rood, R. B., and Pfister, L.: Stratosphere-troposphere exchange, Rev. Geophys., 33, 4: 403–439, 1995.
Jiang, L., Chen, Y., Zhou, H., and He, S.: NOx emissions in China: Temporal variations, spatial patterns and reduction potentials, Atmos. Pollut. Res., 11, 1473–1480, 2020.
Junge, C. E.: Global ozone budget and exchange between stratosphere and troposphere, Tellus, XIV, 363–377, 1962.
Lelieveld, J. and Dentener, F. J.: What controls tropospheric ozone?, J. Geophys. Res., 105, 3531–3551, 2000.
Logan, J. A., Staehelin, J., Megretskaia, I. A., Cammas, J.-P., Thouret, V., Claude, H., De Backer, H., Steinbacher, M., Scheel, H. E., Stübi, R., Fröhlich, M., and Derwent, R.: Changes in ozone over Europe: analysis of ozone measurements from sondes, regular aircraft (MOZAIC) and alpine surface sites, J. Geophys. Res., 117, D09301, https://doi.org/10.1029/2011JD016952, 2012.
Manney, G. L., Livesey, N. J., Santee, M. L., Froidevaux, L., Lambert, A., Lawrence, Z. D., Millán, L. F., Neu, J. L., Read, W. G., Schwartz, M. J., and Fuller, R. A.: Record-low Arctic stratospheric ozone in 2020: MLS observations of chemical processes and comparisons with previous extreme winters, Geophys. Res. Lett., 47, e2020GL089063, https://doi.org/10.1029/2020GL089063, 2020.
Meul, S., Langematz, U., Kröger, P., Oberländer-Hayn, S., and Jöckel, P.: Future changes in the stratosphere-to-troposphere ozone mass flux and the contribution from climate change and ozone recovery, Atmos. Chem. Phys., 18, 7721–7738, https://doi.org/10.5194/acp-18-7721-2018, 2018.
Parrish, D. D., Law, K. S., Staehelin, J., Derwent, R., Cooper, O. R., Tanimoto, H., Volz-Thomas, A., Gilge, S., Scheel, H.-E., Steinbacher, M., and Chan, E.: Long-term changes in lower tropospheric baseline ozone concentrations at northern mid-latitudes, Atmos. Chem. Phys., 12, 11485–11504, https://doi.org/10.5194/acp-12-11485-2012, 2012.
Parrish, D. D., Lamarque, J. F., Naik, V., Horowitz, L., Shindell, D. T., Staehelin, J., Derwent, R., Cooper, O. R., Tanimoto, H., Volz-Thomas, A., Gilge, S., Scheel, H.-E., Steinbacher, M., and Fröhlich, M.: Long-term changes in lower tropospheric baseline ozone concentrations: Comparing chemistry-climate models and observations at northern midlatitudes, J. Geophys. Res.-Atmos., 119, 5719–5736, https://doi.org/10.1002/2013JD021435, 2014.
Parrish, D. D., Petropavlovskikh, I., and Oltmans, S. J.: Reversal of long-term trend in baseline ozone concentrations at the North American west coast, Geophys. Res. Lett., 44, 10675–10681, https://doi.org/10.1002/2017GL074960, 2017.
Parrish, D. D., Derwent, R. G., Steinbrecht, W., Stübi, R., VanMalderen, R., Steinbacher, M., Trickl, T., Ries, L., and Xu, X.: Zonal similarity of long-term changes and seasonal cycles of baseline ozone at northern midlatitudes, J. Geophys. Res.-Atmos., 125, e2019JD031908, https://doi.org/10.1029/2019JD031908, 2020.
Parrish, D. D., Derwent, R. G., and Staehelin, J.: Long-term changes in northern mid-latitude tropospheric ozone concentrations: Synthesis of two recent analyses, Atmos. Environ., 248, 118227, https://doi.org/10.1016/j.atmosenv.2021.118227, 2021a.
Parrish, D. D., Derwent, R. G., and Faloona, I. C.: Long-term baseline ozone changes in the Western US: A synthesis of analyses, J. Air Waste Manage., 72, 434–454, https://doi.org/10.1080/10962247.2021.1945706, 2021b.
Parrish, D. D., Faloona, I. C., and Derwent, R. G.: Observational-based Assessment of Contributions to Maximum Ozone Concentrations in the western United States, J. Air Waste Manage., 72, 434–454, https://doi.org/10.1080/10962247.2022.2050962, 2022.
Polvani, L. M., Abalos, M., Garcia, R., Kinnison, D., and Randel, W. J.: Significant weakening of Brewer-Dobson circulation trends over the 21st century as a consequence of the Montreal Protocol, Geophys. Res. Lett., 45, 401–409, 2018.
Sokhi, R. S., Singh, V., Querol, X., Finardi, S., Targino, A. C., de Fatima Andrade, M., et al.: A global observational analysis to understand changes in air quality during exceptionally low anthropogenic emission conditions, Environ. Int., 157, 106818, https://doi.org/10.1016/j.envint.2021.106818, 2021.
Steinbrecht, W., Kubistin, D., Plass-Dülmer, C., Davies, J., Tarasick, D. W., von der Gathen, P., Deckelmann, H., Jepsen, N., Kivi, R., Lyall, N., Palm, M., Notholt, J., Kois, B., Oelsner, P., Allaart, M., Piters, A., Gill, M., Van Malderen, R., Delcloo, A. W., Sussmann, R., Mahieu, E., Servais, C., Romanens, G., Stübi, R., Ancellet, G., Godin-Beekmann, S., Yamanouchi, S., Strong, K., Johnson, B., Cullis, P., Petropavlovskikh, I., Hannigan, J. W., Hernandez, J.-L., Rodriguez, A. D., Nakano, T., Chouza, F., Leblanc, T., Torres, C., Garcia, O., Röhling, A. N., Schneider, M., Blumenstock, T., Tully, M., Paton-Walsh, C., Jones, N., Querel, R., Strahan, S., Stauffer, R. M., Thompson, A. M., Inness, A., Engelen, R., Chang, K.-L., and Cooper, O. R.: COVID-19 Crisis Reduces Free Tropospheric Ozone across the Northern Hemisphere, Geophys. Res. Lett., 48, e2020GL091987, https://doi.org/10.1029/2020GL091987, 2021.
Tarasick, D., Galbally, I. E., Cooper, O. R., Schultz, M. G., Ancellet, G., Leblanc, T., Wallington, T. J., Ziemke, J., Liu, X., Steinbacher, M., Staehelin, J., Vigouroux, C., Hannigan, J. W., García, O., Foret, G., Zanis, P., Weatherhead, E., Petropavlovskikh, I., Worden, H., Osman, M., Liu, J., Chang, K.-L., Gaudel, A., Lin, M., Granados-Muñoz, M., Thompson, A. M., Oltmans, S. J., Cuesta, J., Dufour, G., Thouret, V., Hassler, B., Trickl, T., and Neu, J. L.: Tropospheric ozone from 1877 to 2016, observed levels, trends and uncertainties, Elem. Sci. Anth., 7, 39, https://doi.org/10.1525/elementa.376, 2019.
Weber, M., Arosio, C., Feng, W., Dhomse, S. S., Chipperfield, M. P., Meier, A., Burrows, J. P., Eichmann, K.-U., Richter, A., and Rozanov, A.: The unusual stratospheric Arctic winter 2019/20: Chemical ozone loss from satellite observations and TOMCAT chemical transport model, J. Geophys. Res.-Atmos., 126, e2020JD034386, https://doi.org/10.1029/2020GL090326, 2021.
Wohltmann, I., von der Gathen, P., Lehmann, R., Maturilli, M., Deckelmann, H., Manney, G. L., Davies, J., Tarasick, D., Jepsen, N., Kivi, R., Lyall, N., and Rex, M.: Near-complete local reduction of Arctic stratospheric ozone by severe chemical loss in spring 2020, Geophys. Res. Lett., 47, e2020GL089547, https://doi.org/10.1029/2020GL089547, 2020.