the Creative Commons Attribution 4.0 License.
the Creative Commons Attribution 4.0 License.
 | 10 Oct 2022
Source apportionment and evolution of N-containing aerosols at a rural cloud forest in Taiwan by isotope analysis
Ting-Yu Chen
Chia-Li Chen
Yi-Chi Chen
Charles C.-K. Chou
Haojia Ren
Ammonium and nitrate are major N-containing aerosol components. The deposition of N-containing aerosols has impacts on regional ecology and the biogeochemical cycle. In this study, aerosols in a rural cloud forest (Xitou in Taiwan) were studied using 15N and 18O isotope analysis to assess the sources and formation pathways of the local N-containing aerosols linking to a metropolitan. Aerosol samples of different size ranges were collected using a micro-orifice uniform deposit impactor (MOUDI) on a half-day basis in December 2018. The chemical functional groups were analyzed using a Fourier-transform infrared spectroscopy with attenuated total reflection (FTIR-ATR) technique, while the isotope analysis was performed using a gas chromatography–isotope ratio mass spectrometer (GC–IRMS). The average measured aerosol concentration (PM10) was 0.98 (ranging from 0.15 to 3.31) and 0.25 (ranging from 0.00 to 1.51) µg m−3 for and , respectively. In general, a higher concentration than nighttime was observed during the daytime by a factor of 1.5–6, likely due to the transportation of pollutants from upper-stream urban and industrial regions through the local sea breeze combined with valley wind. The presence of fog can further elevate the concentration by a factor of 2–3, resulting from the stronger inversion and lower boundary layer height. The higher concentration in fine particles under foggy conditions corresponds to submicron-sized formation via aqueous-phase dissolution with neutralization. Furthermore, the higher RH during fog events shifted the mass distribution of aerosol functional groups to a larger mode size. By comparing the δ15N value directly or through the analysis using a statistical isotope mixing model, MixSIAR, probably originated from the industries, coal-fired power plants (CFPPs), or fertilizer plants, while might be contributed from the CFPP, industrial or urban sources. The overall δ18O of is +72.66 ‰ ± 3.42 ‰, similar to that in other winter Asian studies, suggesting the major formation pathway via O3 oxidation ( ‰ to 101.67 ‰). However, a lower δ18O ( ‰) for particles less than 0.56 µm during foggy daytime suggests the local contribution via the peroxyl radical oxidation before partitioning into aerosol phase under foggy conditions. Overall, the δ15N and δ18O distribution profiles as a function of particle size in the studied rural forest site reveal the evolution of aerosol composition from remote coastal regions with chemical processes along the transport process, which can be further affected by weather conditions such as fog events.
- Article
(849 KB) - Full-text XML
-
Supplement
(1358 KB) - BibTeX
- EndNote


Aerosols play an essential role in weather, climate, ecology and human health (Poschl, 2005; Seinfeld and Pandis, 2006) and are mainly composed of sulfate, nitrate, ammonium and other organic species. Nitrogen is one of the significant elements of aerosol in various forms, such as ammonium, nitrate, organic nitrogen, etc. Ammonium and nitrate are the primary N-containing cation and anion species, respectively, and the balance of the ions can influence aerosol acidity. Also, the local weather, such as fog formation, can be affected by the aerosol characteristics via the hygroscopicity of aerosols (Petters and Kreidenweis, 2007). Furthermore, the N-containing aerosols not only affect human health and climate but also play an important role in the regional and global nitrogen biogeochemical cycles. The long-range transport of N-containing aerosols from human activities may result in additional nutrient input at deposition sites, affecting local plant growth and ecology (Bobbink et al., 2010). Therefore, the amount of the N-containing aerosols formed and transported to the rural area and their potential sources should be investigated to evaluate the origin of the N-containing species and their impacts.
Ammonium in aerosols could form from gaseous ammonia, mainly generated from agricultural activities (Behera et al., 2013). Besides, NH3 from fossil fuel exhaust and slipping during selective catalytic reduction (SCR) processes also contribute to in aerosols (Cape et al., 2004). Nitrate in aerosols is produced by oxidation of its precursors, nitrogen oxides (NOx), emitted from fossil fuel combustion, biomass burning, lightening and biogenic soil emission. The formation pathway of aerosol varies with conditions. During the daytime, NO can be oxidized by O3 or peroxyl radicals to form NO2, which could be photolyzed back to NO or further react with OH radicals to generate nitric acid, forming the nitrate aerosols. At night, NO2 may further be oxidized to NO3, reacting with other NO2 to form N2O5. The hydrolysis of N2O5 gives another pathway to form nitrate aerosols (Jacob, 1999; Seinfeld and Pandis, 2006).
The stable nitrogen isotope in aerosols provides a clue about the probable sources of nitrogen content. Since the abundance of 15N and 14N in gaseous precursors of and varies in different emission sources, the δ15N, defined as (‰), can act as an indicator of the associated nitrogen species (Felix et al., 2012, 2014; Walters et al., 2015; Pan et al., 2016, 2018a; Chang et al., 2016; Savard et al., 2017; Zhang et al., 2020). For nitrate, not only the δ15N can be an index of sources, but the δ18O, defined as (‰), where VSMOW stands for Vienna Standard Mean Ocean Water, can also reveal the oxidation pathway (Fig. 1) of nitrate formation due to the δ18O difference between its oxidants: O3, OH, RO2 (including hydrogen peroxyl and organic peroxyl radicals) and H2O (Hastings et al., 2003; Fang et al., 2011; Gobel et al., 2013).
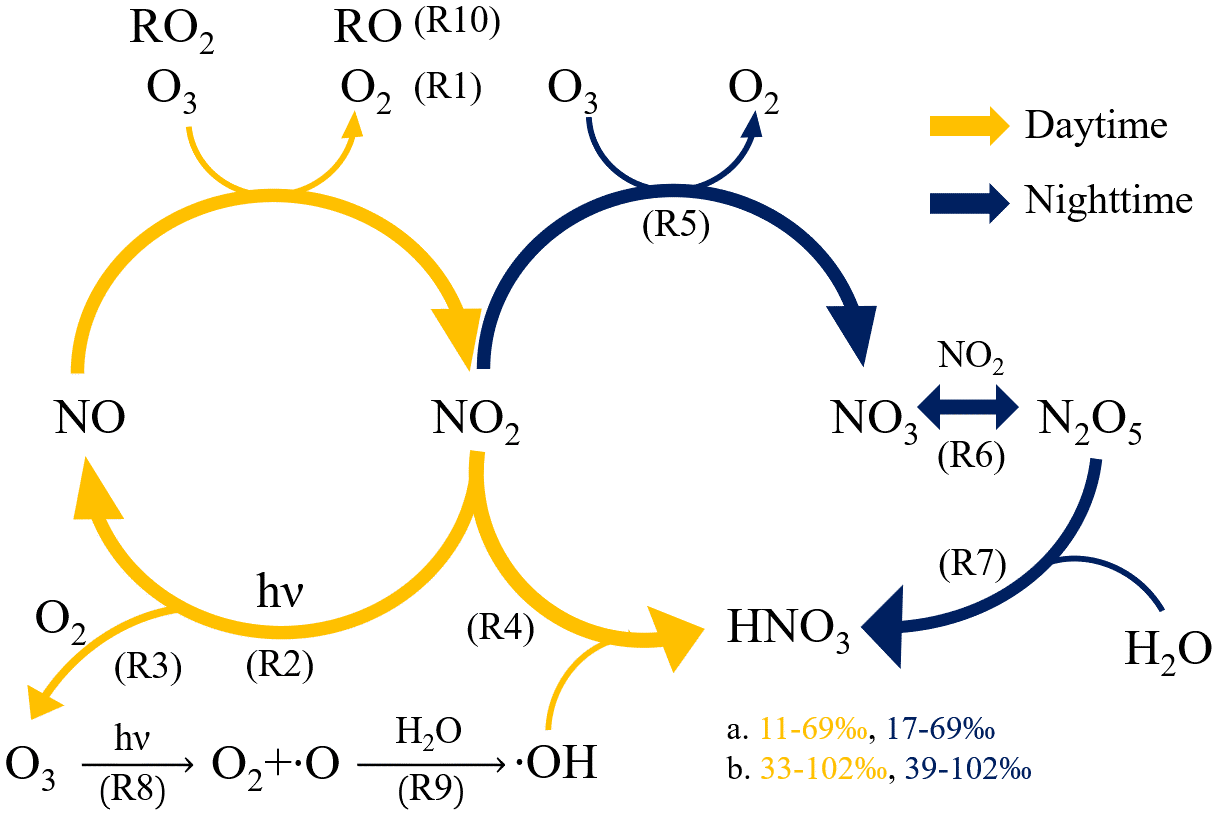
Figure 1The formation pathway of nitric acid to form aerosol nitrate during the daytime (orange color) and nighttime (blue color) with the predicted δ18O range of based on (a) freshly emitted NO and (b) NO cycled from NO2, fully reacted with O3 detail can be found in Figs. S6 and S7).
Xitou, an experimental forest of the National Taiwan University, is a planted forest located in central Taiwan. As the origin of Beishih brook, Xitou is in the position of a river valley topography towards the northwest, connecting to the Taichung City metropolitan. Due to the topography, the sea breeze combined with mountain–valley wind dominates the diurnal local circulation, bringing air mass from different regions between daytime and nighttime. During the daytime, the sea breeze combined with valley wind can bring pollutants along the transporting path from coastal areas passing through the coal-fired power plants (CFPPs), industrial sites and cities. As the wind direction reverses during nighttime, the pollutant concentration decreases (Chen et al., 2021). Besides, the afternoon upslope fog occurs frequently in the Xitou forest due to the boundary layer inversion and the sea breeze combined with valley wind (Hsieh, 2019). Therefore, the fog might affect aqueous chemical processes locally.
The analysis of δ15N and δ18O for nitrogen-associated species as a function of particle size might provide the origin of the N-containing species and the evolution of transport and chemical processes. This study aims to investigate the following: (1) the interaction between local circulation and the aerosol composition in a rural forest area linking to a city, (2) how the weather affects the aerosol composition in different sizes, and (3) the source apportionment of rural N-containing aerosols by isotopic analysis.
A field campaign was conducted over the Xitou experimental forest ( N, E, 1179 m a.s.l.) in a valley from 1 to 24 December 2018 to investigate the interaction between air quality, local circulation and human activities in central Taiwan. To dig into the link between local circulation and aerosol concentration and composition, aerosol samples in different sizes were collected separately for daytime and nighttime using a cascade impactor, and underwent an analysis using Fourier-transform infrared spectroscopy (FTIR) for the functional group concentration (Coury and Dillner, 2008; Hung et al., 2016). Furthermore, δ15N and δ18O of N-containing species were measured using the denitrifier method (Sigman et al., 2001; Casciotti et al., 2002). The period mass-averaged δ15N values were further analyzed using a mixed stable isotope analysis in R package (MixSIAR) (Stock et al., 2018) to resolve the potential sources of aerosol, while δ18O acts as an indicator of the oxidation pathway for nitrate formation in aerosols.
2.1 Sample collection
Ambient aerosol samples were collected using a 13-stage MOUDI (micro-orifice uniform deposit impactors, Model 125R, MSP Corporation, Shoreview, Minnesota, USA) with 46.2 mm polytetrafluoroethylene (PTFE) membrane filters (Whatman 7592-104). The cut-off size of MOUDI was 0.01, 0.018, 0.032, 0.056, 0.1, 0.18, 0.32, 0.56, 1.0, 1.8, 3.2, 5.6 and 10 µm, respectively, and the flow rate of sampling air was 10 L min−1. The samples were categorized into daytime and nighttime to investigate the impact of daily mountain/valley-breeze circulation on aerosols. Daytime samples were collected from ∼09:00 to ∼17:00 LT (local time), and nighttime samples were from ∼18:00 to ∼06:00 LT the next day to represent the valley and mountain breeze, respectively. Twenty sets of filter samples were collected from 2 to 22 December 2018, including 4 foggy samples (181207D, 181213N, 181214D, 181215D, YYMMDD Daytime/Nighttime) and 16 non-foggy samples (181202D/N, 181207N, 181208D/N, 181209D/N, 181214N, 181215N, 181216D/N, 181220N, 181221D/N, 181222D/N). The collected filter samples were sealed, covered by aluminum foil, and preserved under 4 ∘C till the laboratory analysis to prevent contamination.
2.2 FTIR-ATR analysis
The concentrations of functional groups such as , and were determined via a FTIR measurement (Nicolet 6700, Thermo Fisher Scientific, USA) equipped with a single-reflectance attenuated total reflectance (ATR) monolithic diamond accessory (GladiATR™, PIKE Technologies, USA). Filter samples were pressure-pressed onto the ATR crystal to ensure closed contact with the crystal. The infrared spectra were scanned at wavenumbers from 4000 to 500 cm−1 with a resolution of 1 cm−1. The selected spectrum for a given wavenumber range was fitted with one or multiple Lorentzian curves to derive the peak absorbance (I) of each functional group as shown in Fig. S1 in the Supplement. The curve fitting function can be written as follows:
where A(ν) is the distribution of a specific absorption curve as a function of wavenumber (ν), and σ is the scale parameter (half-width at half-maximum) associated with the width of the absorption curve. For a mixture, the observed spectrum is a superposition of each substance i:
The fitted peaks includes ∼1350 cm−1 for nitrate and ∼1417 cm−1 for ammonium (Fig. S2); besides, the absorbance peak at ∼1080 cm−1 for was applied in a 3-curve fitting to differentiate the contribution by the nearby absorbance of the PTFE filter (Fig. S3). Therefore, the calibration of absorbance to concentration was based on the previous analysis using the correlation of absorbance of FTIR functional groups to the water-soluble ions measured by ion chromatography (Huang, 2016). As to black carbon (BC) concentration, the absolute absorbance at 3950 ± 5 cm−1 is applied to quantify the BC concentration based on the calibration done by Huang (2016) with the elemental carbon concentration determined using a DRI2001A carbonaceous aerosol analyzer, following the IMPROVE thermo-optical reflectance (TOR) protocol (Chow et al., 2001), as detailed in Chou et al. (2010).
2.3 Isotope analysis
2.3.1 Sample analysis
The isotope analysis requires at least 5 nmol of equivalent N in 5 mL solution (i.e., the molar concentration of µM N), so the FTIR measurements provide a quantitative reference to infer the concentration of dissolved N-containing species. Ten sets of aerosol samples with higher N-containing functional group concentration under distinct weather conditions were selected for the δ15N and δ18O isotope analysis of N-containing species (181202D/N, 181213N, 181214D/N, 181215D, 181220N, 181221D, 181222D, 181222N). If the predicted concentration of one filter was too low, two to four filters collected on the same day with adjacent size bins were put together in a bottle during the rinsing process to ensure sufficient concentration for isotope analysis. Filter samples were cut in half and soaked into 30 mL Milli-Q water (resistivity=18.2 MΩ at 25 ∘C) and underwent a 30 min ultrasonication to dissolve the water-soluble ions into the solution. Afterward, the extracted solution was filtered through a 0.22 µm Millipore syringe filter and then preserved in a high-density polyethylene (HDPE) bottle. The samples were analyzed for the δ15N of total nitrogen (TN) and nitrate + nitrite (NN), and the δ18O of NN by the bacterial “denitrifier method” as stated by Sigman et al. (2001), Casciotti et al. (2002), and updated by Weigand et al. (2016). For the TN analysis, the oxidation process of adding potassium persulfate in NaOH solution was to oxidize and other N-containing species in a reduced state into before bacterial digestion. The isotope and was measured using a gas chromatography–isotope ratio mass spectrometer (GC–IRMS) composed of a GC column system coupled with Thermo MAT 253 Plus 10 kV IRMS. The international standard IAEA-NO3 (δ15N=4.7 ‰, ‰) and USGS 34 ( ‰, ‰) were applied for δ15N and δ18O calibration (Bohlke et al., 2003). In each batch of measurement, three to five duplicates of standards and bacteria blank were used to ensure the efficiency of bacterial conversion and the stability of mass spectroscopy. The detail of isotope ratio measurement is described in the Supplement.
Ammonium is a major N-containing component in aerosols as part of TN. Since the concentration of water-soluble TN minus NN correlates well (R2=0.7764) with the measured concentration from FTIR (slope is close to 1 with a small interception as shown in Fig. S4), the water-soluble TN minus NN can be regarded as . Therefore, the δ15N of ammonium can be derived by assuming the collected aerosol mainly comprised of nitrate, nitrite and ammonium with negligible other N forms such as organic nitrogen (Wu et al., 2021). The δ15N of can be calculated using Eq. (3) as follows:
where MTN and MNN are the molarities of total nitrogen (TN) and nitrate plus nitrite (NN) of the sample solution, respectively. If organic nitrogen is considered, a slightly higher δ15N of than the current reported values can be expected because organic nitrogen might be related to NOx and was reported as a lower δ15N ( ‰) than nitrate (Wu et al., 2021). Additionally, since the aerosol nitrite concentration is mostly negligible based on ion-chromatography (IC) analysis of PM10, NN is assumed to be in form, i.e., δ15N of .
2.3.2 Bayesian mixing model application
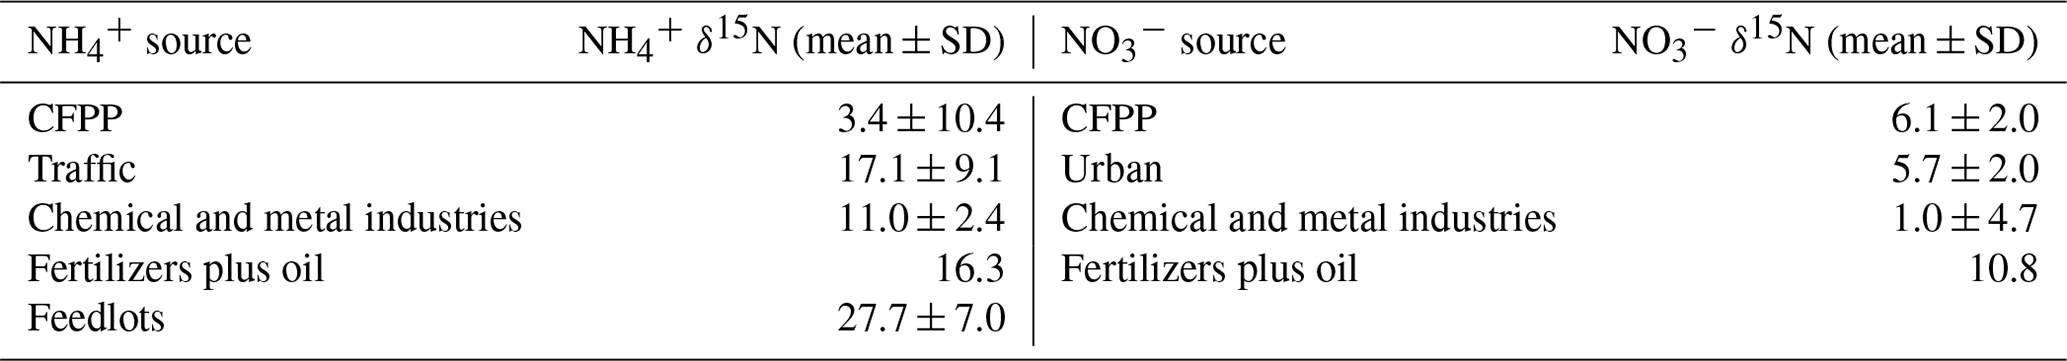
A Bayesian mixing model, MixSIAR (Stock and Semmens, 2016), was applied to assess the contribution of multiple aerosol sources. The MixSIAR is a statistical model applying Bayesian inference to infer the posterior probability of mixture sources by analyzing its tracer composition, such as stable isotope or fatty acids (Stock et al., 2018). The studied tracers are assumed to transfer from sources to the mixture through a conserved mixing process integrating the observed variability. In this study, the observed mass-weighted δ15N of and for each sampling period was used as prior information of the mixture. For simplification, the source data adopted the results of Savard et al. (2017) as summarized in Table 1 by assuming that the δ15N of and was directly related to their emission sources, either single source or mixture from those sources. The source data for the MixSIAR analysis include δ15N of from traffic, chemical and metal industries, feedlots, fertilizer plants, and coal-fired power plants (CFPPs), and δ15N of from traffic, chemical and metal industries, fertilizer plants and oil refinery, and CFPPs. The source of the gas compressors was not considered in this study.
Table 1Aerosol δ15N values of different sources used in this study (Savard et al., 2017).
3.1 Functional group concentration by FTIR-ATR
The averaged functional group concentration measured using FTIR-ATR of collected 0.01 to 10 µm samples was : 0.98 µg m−3, : 0.25 µg m−3, : 5.16 µg m−3, and black carbon (BC): 0.81 µg m−3, as summarized in Table 2. The mass concentration distribution of and as a function of aerosol size is shown in Fig. 2. The is mainly distributed in submicron mode, with the most significant mass concentration in 0.32–0.56 µm size bin. The during the non-foggy period mostly appears in sizes larger than 1 µm and peaks at 3.2–5.6 µm. The mass distribution pattern of mainly in the submicron mode is consistent with that of (Fig. S5), which suggests that most ammonium is in the form of sulfate-associated salts. On the contrary, in the aerosol is formed from the substitution reaction of sea-salt aerosol or dust in the larger size (>1 µm) aerosols by HNO3 (Evans et al., 2004). The non-observed nitrate in submicron particles during non-foggy days is likely due to the thermodynamic equilibrium under ammonia-limited conditions (Seinfeld and Pandis, 2006). Generally, the concentration during daytime was higher than that at nighttime (Table 2). Foggy weather also promoted a higher concentration with further discussion in the following subsections.
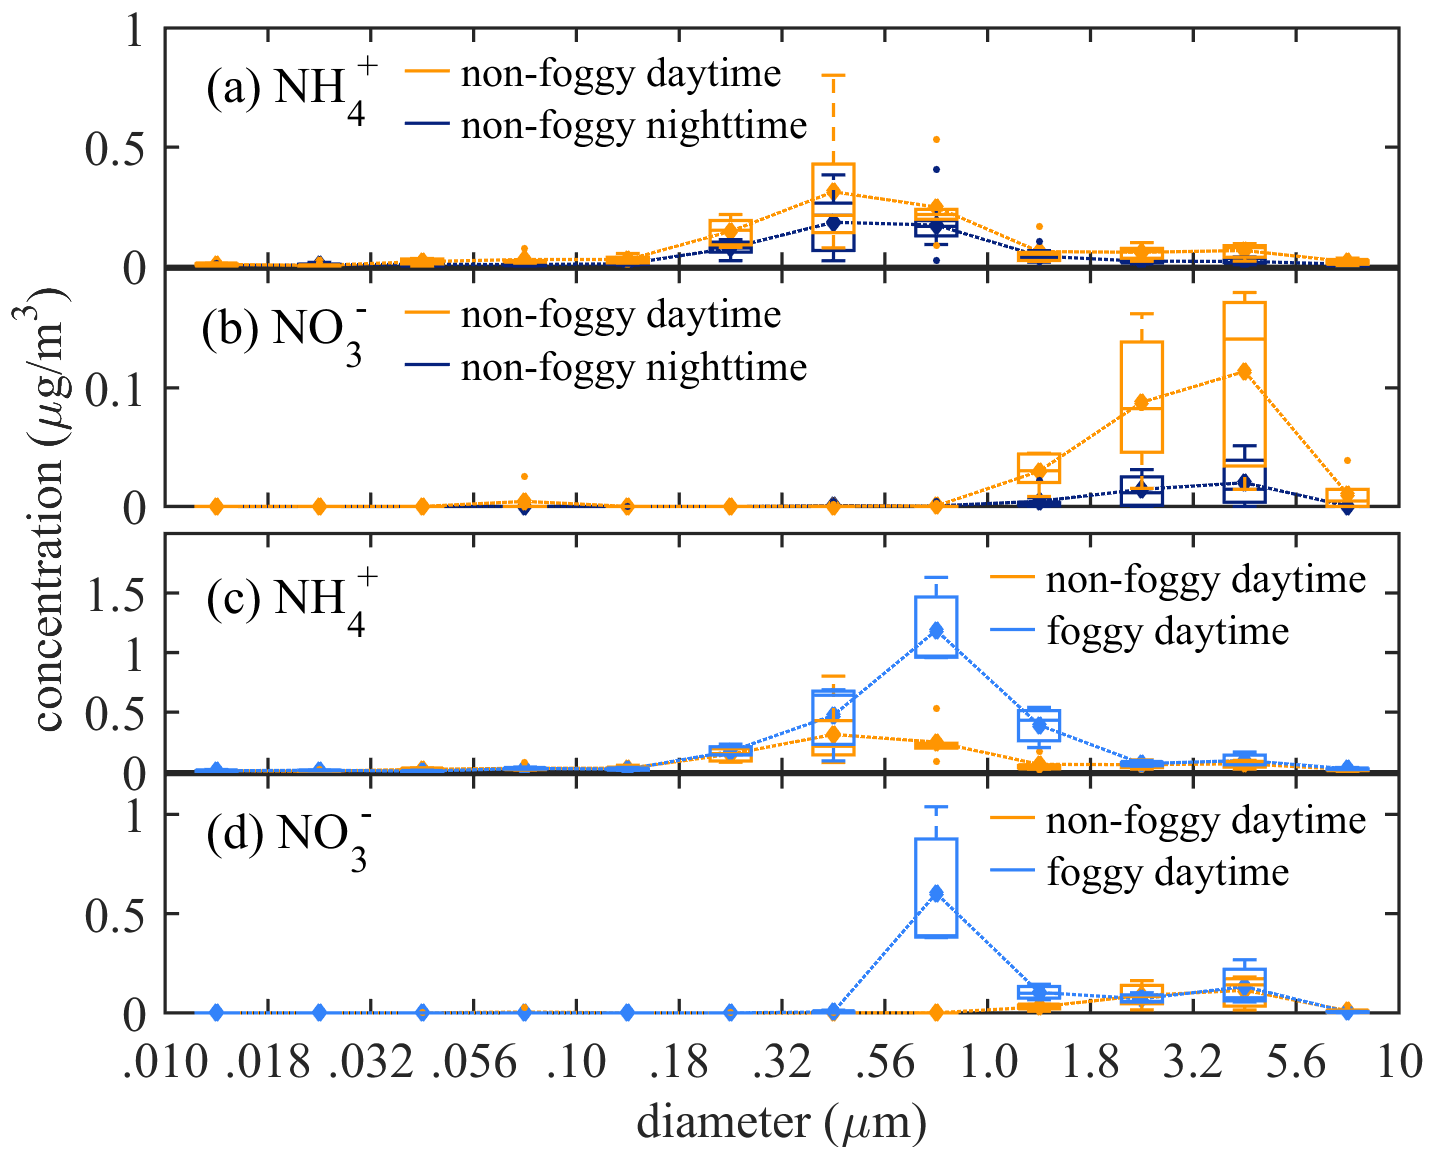
Figure 2The statistical box plot of concentrations as a function of size bin at non-foggy daytime and nighttime for (a) , and (b) , and at foggy and non-foggy daytime for (c) and (d) . (diamond: mean value; outliers: <1st quartile Q1−1.5 interquartile range (IQR) or >3rd quartile Q3+1.5 IQR).
3.1.1 Difference between daytime and nighttime
The functional group concentration of (1.00 µg m−3) and (0.25 µg m−3) during non-foggy daytime was higher than that in non-foggy nighttime (0.56 and 0.04 µg m−3, respectively) as shown in Table 2, and and BC also have approximately 1.5 times higher concentration during non-foggy daytime. The greater daytime concentration might link to the upstream transportation of urban pollutants by valley wind combined with the sea breeze (Chen et al., 2021). The sampling site is mostly below the boundary layer height during daytime and above the boundary layer height during nighttime. Once the wind direction changes into mountain wind accompanying land breeze, the cleaner upper-stream air dilutes the pollutants in the Xitou forest area.
3.1.2 The influence of fog
The daytime concentration of and was 2 to 4 times higher in the foggy period than that in the non-foggy period (Table 2). The mass distribution seems to shift to a larger size bin (0.56–1.8 µm) for as shown in Fig. 2c, while in Fig. 2d also has a significantly high concentration for the 0.56–1.8 µm size bin during the foggy period. Higher ammonium nitrate concentration might result from the stronger boundary layer inversion on foggy days. When the boundary inversion gets stronger in the Xitou area, the moisture transportation by upwelling turbulence is weakened. Therefore, water vapor could accumulate in the lower atmosphere, promoting fog formation and prolonging fog lifetime (Hsieh, 2019). Furthermore, the weakened upward transport could also accumulate pollutants in the lower boundary layer, causing a higher observed concentration. The enhanced concentration of black carbon (BC), a primary aerosol component with limited chemical reactions in the atmosphere, during foggy periods (Table 2 and Fig. S5) can further reveal the inference of the boundary layer on aerosol concentration.
The observed mass distribution of shifting slightly to a larger size mode on foggy days is likely due to the hygroscopic growth of aerosols. According to a previous calculation with the observed dry and wet aerosol size distribution in Xitou, -containing aerosol has a hygroscopicity parameter of 0.21 ± 0.01 (Chen et al., 2021). The hygroscopic growth of aerosol from averaged RH of 80 % under non-foggy circumstances to over 99 % during the foggy period could lead to a larger wet aerosol size. Extra-high concentration of 0.56–1 µm aerosol was observed during foggy periods accompanied by the high concentration in that size bin (Fig. 2d). In foggy periods, the higher water content of aerosol promotes an aqueous phase reaction of HNO3 uptake on aerosols, and the higher concentration of , more than , gives extra neutralizing cation to stabilize the as suggested by Chen et al. (2021).
3.2 Isotope analysis of N-containing species
The δ15N of and discussed in this section infers the probable aerosol sources, while the measured δ18O of infers the photo-oxidation processes of NOx. The isotope value of each sample is shown in Fig. 3, and the period mass-weighted averaged δ15N and δ18O are summarized in Fig. 4 and Table S1 in the Supplement.
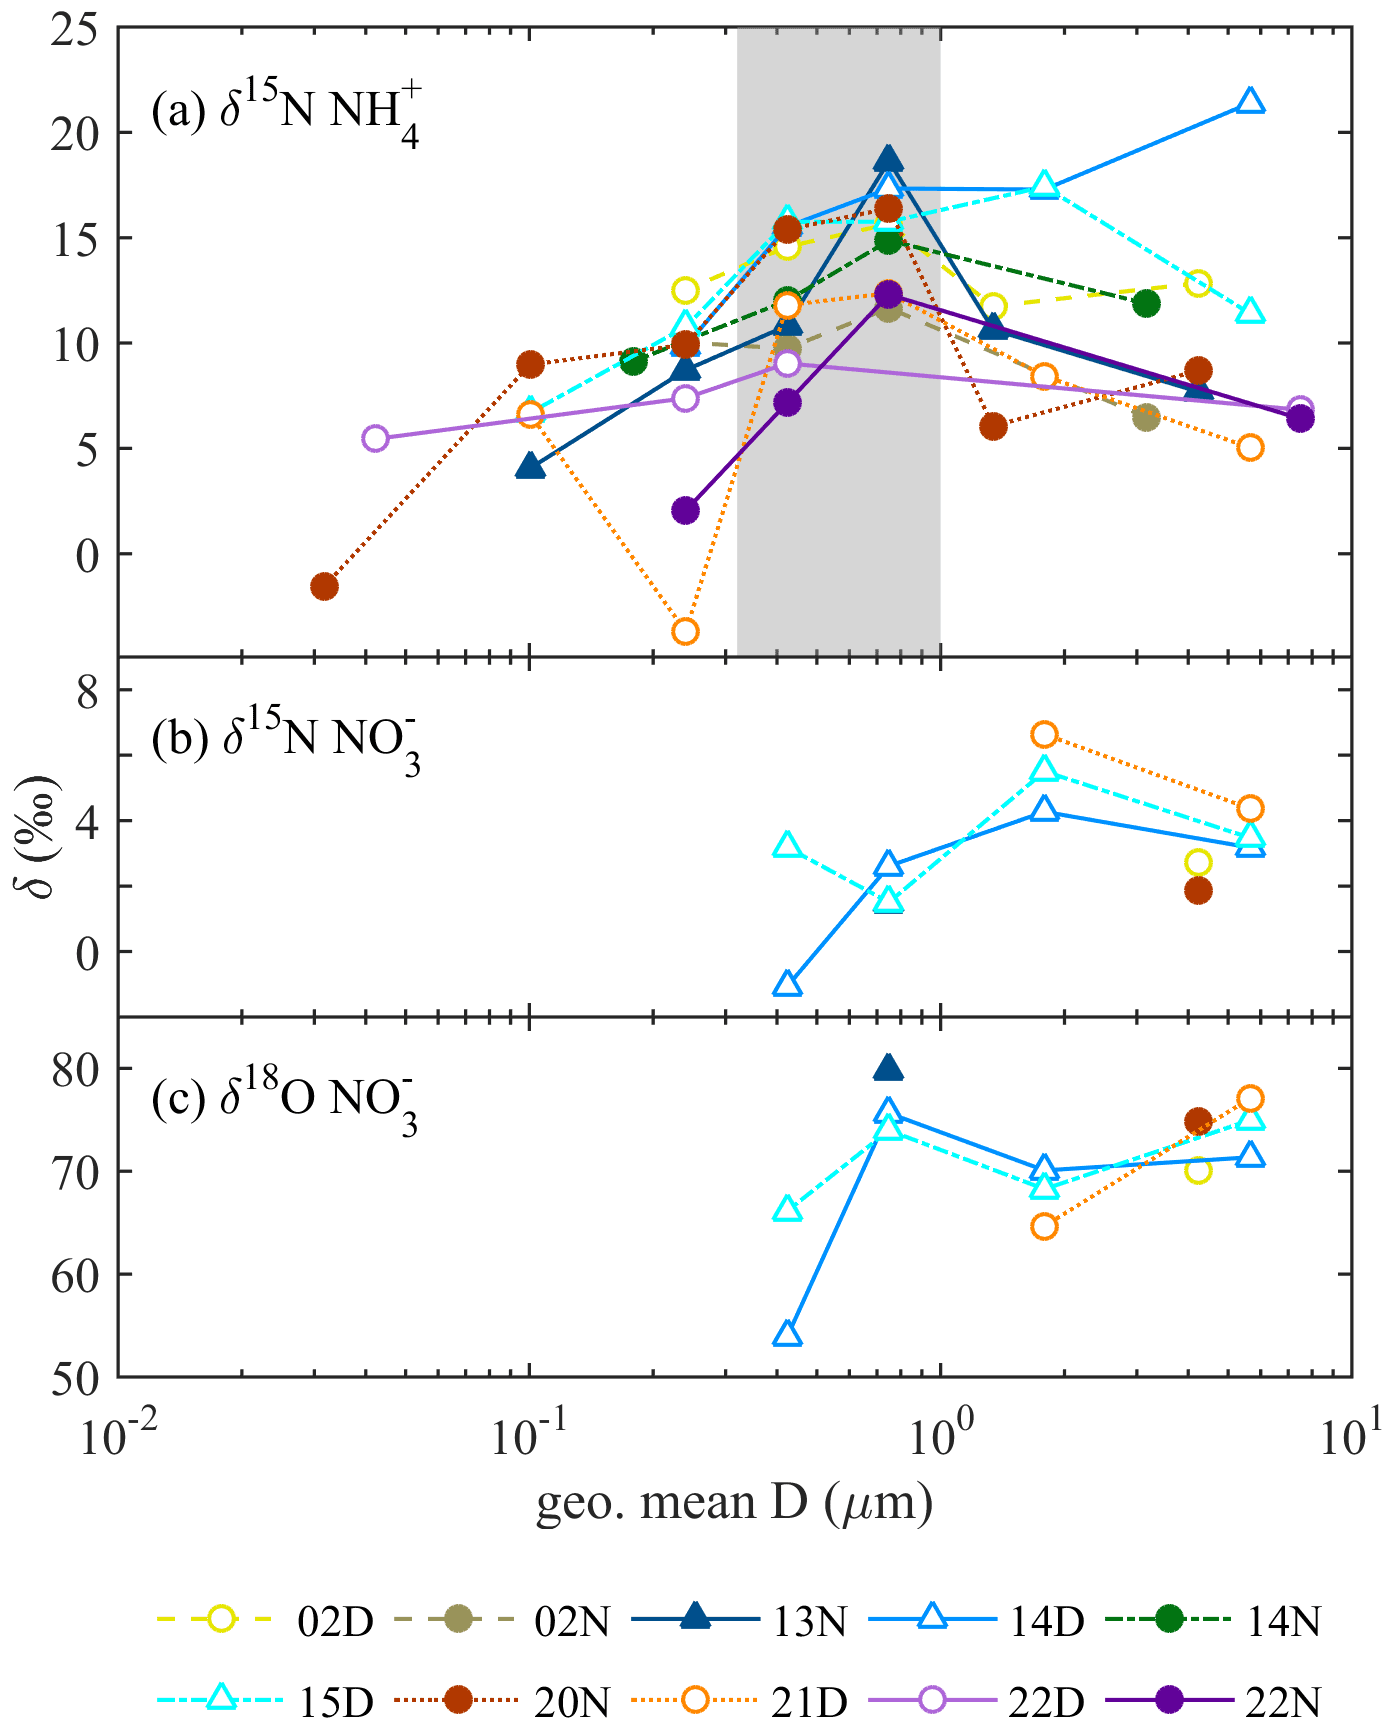
Figure 3The isotope values as a function of collected aerosol geometric mean diameter (D) (a) δ15N , (b) δ15N , and (c) δ18O . Symbol conditions: hollow for daytime, filled for nighttime, and triangle for foggy events.
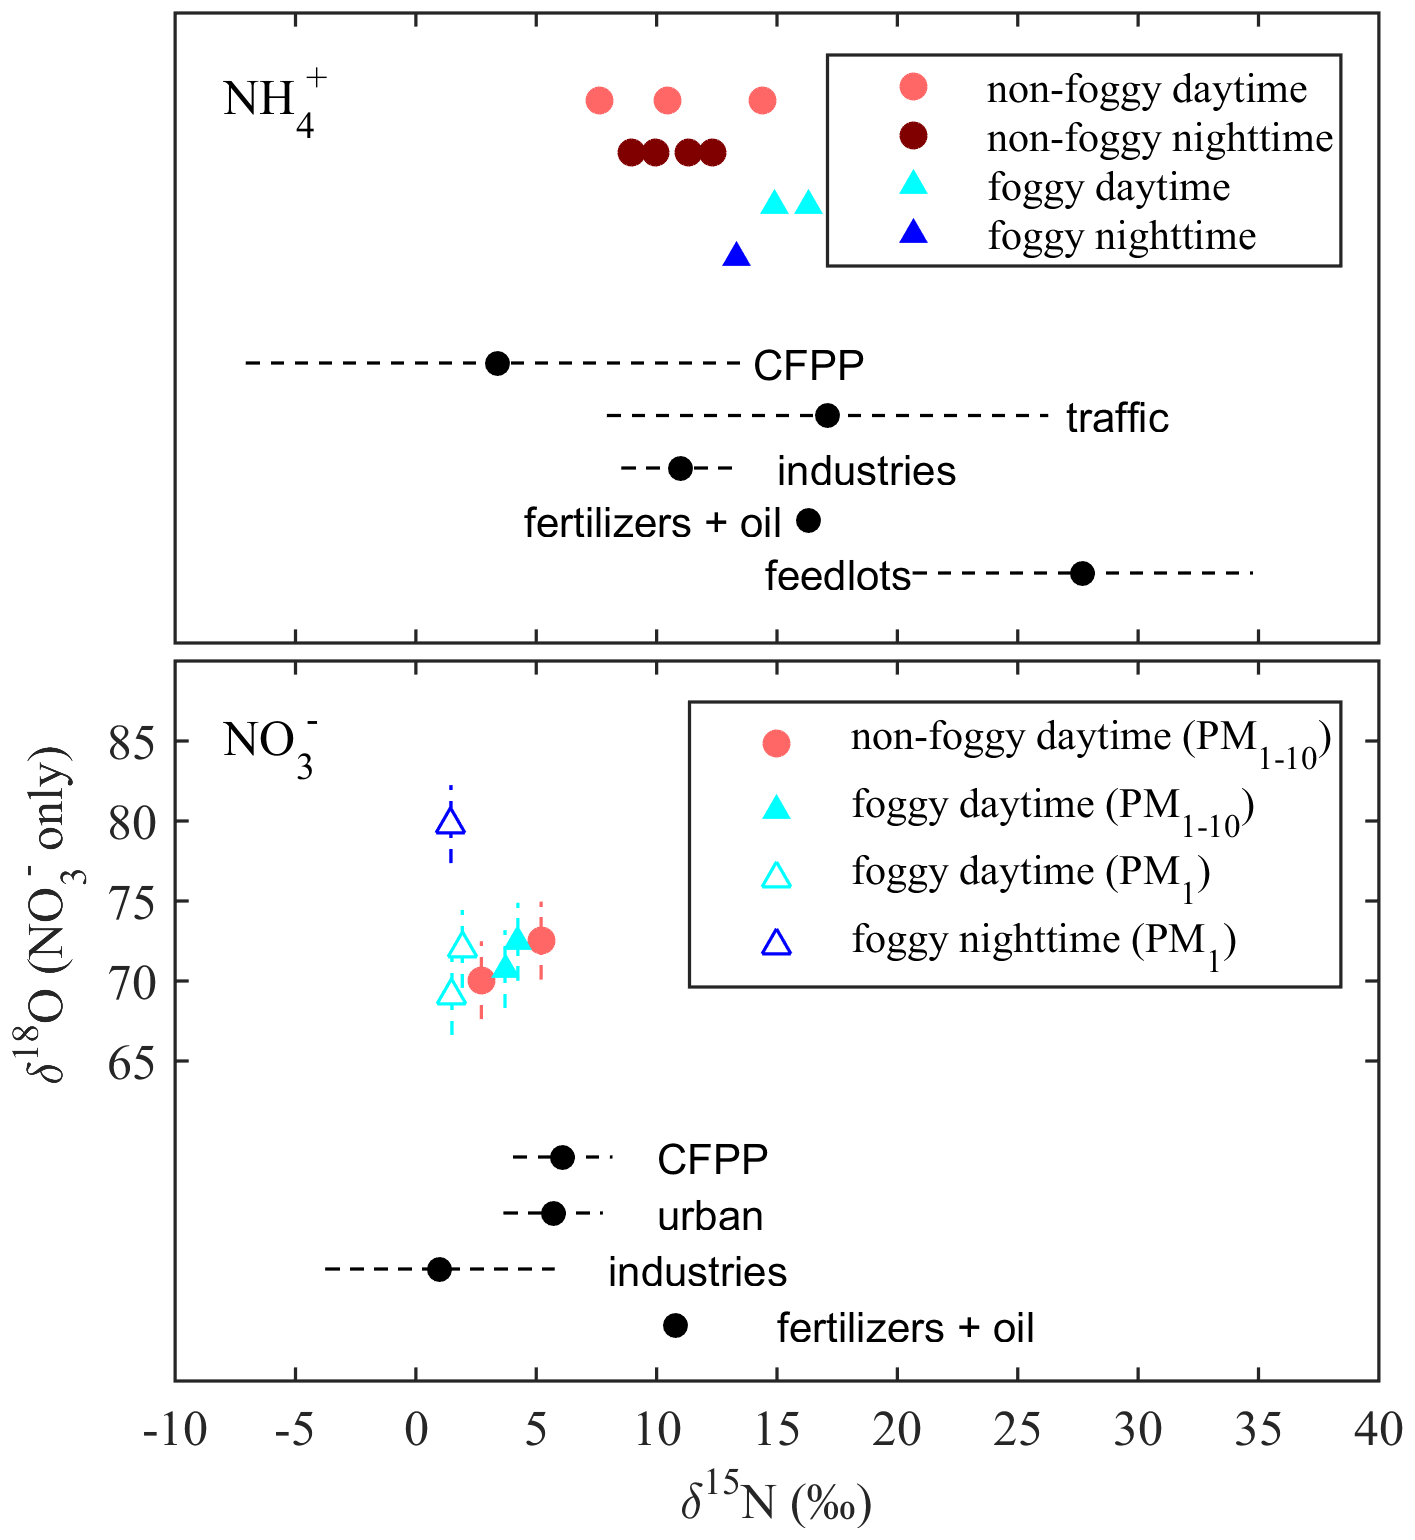
Figure 4Comparison between the period mass-averaged isotope values (δ15N and δ18O) and the mean δ15N value (black dots) by Savard et al. (2017) for different sources. The dashed lines are the standard deviation (SD) of the measurements. The batch SD of international standards' duplicates was 0.04 ‰–0.11 ‰ for δ15N (not observable in this figure), and 2.20 ‰–2.33 ‰ for δ18O as shown at each data point.
3.2.1 δ15N of
Figure 3a shows the δ15N value of aerosol as a function of geometric-averaged particle diameter. The δ15N varies from −3.70 ‰ to +21.39 ‰, and the average mass-weighted δ15N value is +11.95 ‰ with a standard deviation of 2.65 ‰. The δ15N of 0.32–1 µm aerosols is in the range of +7.16 ‰ to +18.64 ‰, relatively higher than that of the larger and smaller size bins. The increasing and then decreasing trend of δ15N with aerosol size was also observed in Beijing (Pan et al., 2016, 2018b) but was approximately 12 ‰ lower. This offset probably results from the different emission sources or the partitioning processes. Overall, the processes forming aerosol may lead to the size-differentiated δ15N.
The daytime δ15N of is mostly greater than the nighttime one as summarized in Table 3, likely resulting from the different sources, such as transportation of high δ15N NH3 from urban rush-hour traffic or industrial sources by sea breeze combined with the valley wind. As the mountain wind dominates after sunset, available NH3 might be attributed to the daytime residual (having lower δ15N due to the fractionation that happened during daytime) or the local biogenic sources having a lower δ15N.
Table 2The average concentration of collected PM10 using IR functional group analysis under different weather conditions (mean, [min,max] at the unit of µg m−3).
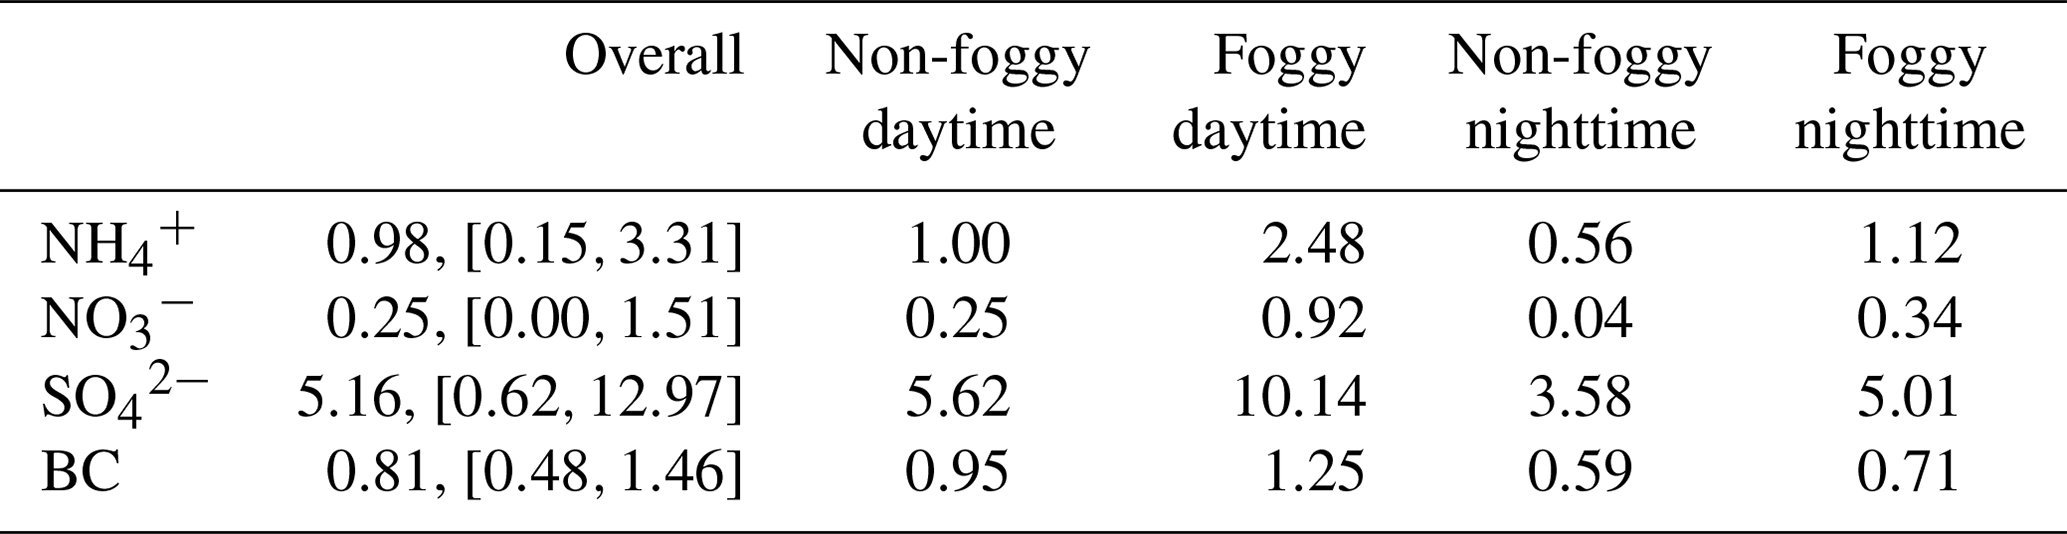
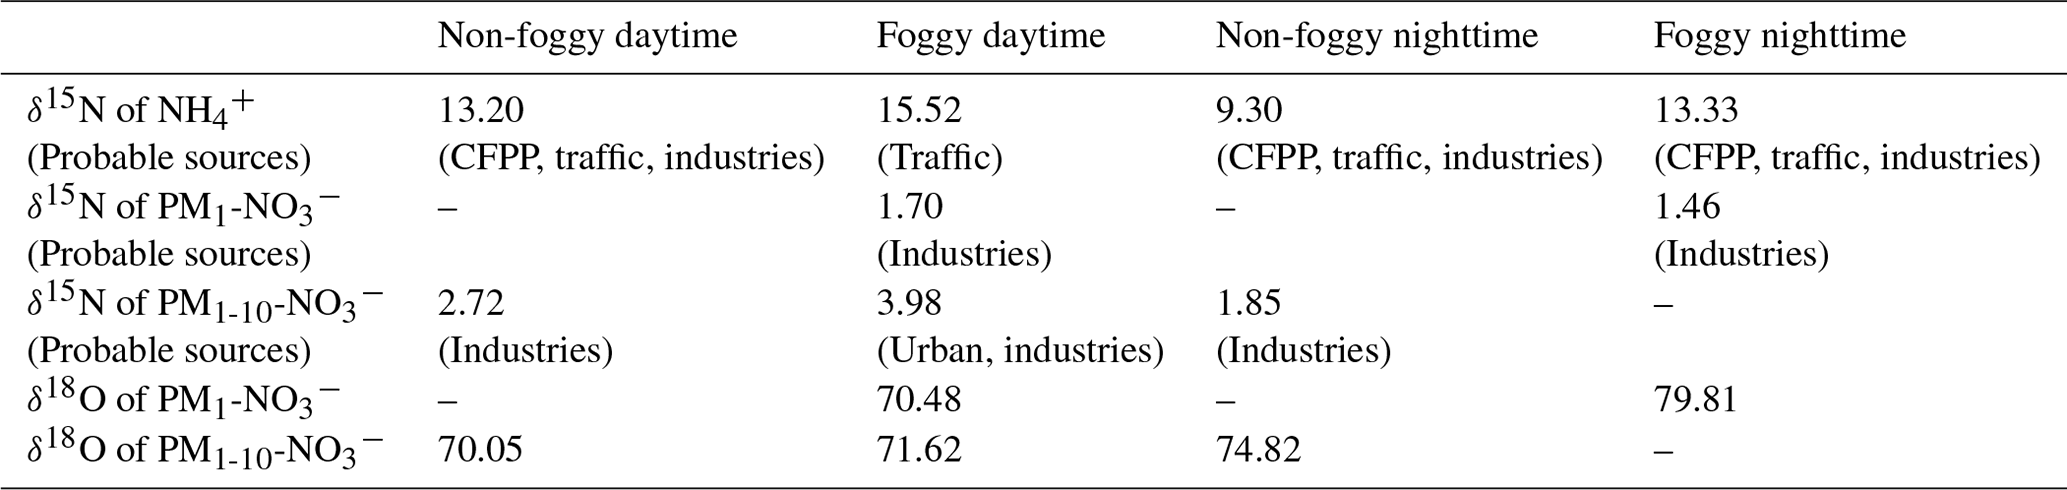
Table 3Mass-weighted isotope value (‰) and probable single source under distinct weather circumstances.
Fog varies the mass size distribution among components and can affect the isotopic ratio. Under foggy daytime conditions, the δ15N value of larger size aerosols (PM1-10-) was more likely to be the extension of 0.56–1 µm with a value up to 21.39 ‰, higher than that of non-foggy days. As stated in Sect. 3.1, high NH3 concentration can promote the partition of HNO3 under foggy conditions. The observed flat trend of δ15N at diameter ≥0.56 µm might result from the hygroscopic particle growth of from the 0.56–1 µm size bin aerosols. As is likely to deliquesce to the liquid phase under high RH conditions, the gas–liquid phase transition could accompany isotope equilibrium fractionation for most aqueous particles (Walters et al., 2018). The NH3-rich and high RH conditions might cause the NH3 partition to condensed phase and favor higher δ15N during equilibrium-fractionation processes (Pan et al., 2018b). On non-foggy days, having a relatively lower concentration with more acidic properties (indicating NH3 limited), a higher portion of NH3 might participate in the aerosol phase to lead to a lower δ15N- toward the original δ15N-NH3.
3.2.2 δ15N of
The δ15N value of as a function of size bin shown in Fig. 3b ranges from −1.07 ‰ to +6.64 ‰, with a mass-weighted mean value of +2.98 ‰ and a standard deviation of 1.20 ‰. This value agrees with other studies measured in Asia or the Pacific Ocean in the winter to spring period (−1 ‰ ± 3 ‰ in spring by Guha et al., 2017; 2.0 ‰ ± 0.4 ‰ in spring and 8.6 ‰ ± 0.4 ‰ in winter by Kim et al., 2019; 3.1 ‰ ± 1.1 ‰ in winter by Kawashima, 2019). As stated in Sect. 3.1.2, nitrate significantly contributes to the submicrometer particles during foggy daytime in addition to the usual peak over the supermicrometer particles for all conditions (Fig. 2). The nitrate can be divided into two groups, PM1-10- for particle size in the range of 1 to 10 µm and PM1- for particle diameter less than 1 µm, for further discussion. For a given sampling period, PM1- has lower δ15N (−1.07 ‰ to +3.19 ‰) than PM1-10- (+1.85 ‰ and +6.64 ‰), likely due to different formation processes. The PM1-10- might be formed through the reaction of HNO3 or NO2 with the coarse particles comprising NaCl or dust (Evans et al., 2004; Hoffman et al., 2004) during the transport from the coast through the urban region and further to Xitou. Therefore, a higher δ15N participates in the aerosol phase through isotopic equilibrium fractionation with lower δ15N HNO3(g) or NO2 gas molecules remaining in the air (Walters and Michalski, 2015). In contrast, PM1- occurs only on foggy days, probably forming in the mountain region with high water content and available NH3. The available HNO3(g) for PM1 is from the residual NOx (after reacting with coarse-mode particles at the upper stream) and has lower δ15N than PM1-10-. The PM1- formed through the aqueous-phase reaction under high with effective gas-phase HNO3 uptake might have a limited isotopic selection leading to a low δ15N of under foggy conditions.
The sample of 181221D is a special case with higher δ15N values. It might result from the recorded agricultural activities nearby, including fertilizing and mowing. The fertilizer generates NOx with higher δ15N (Savard et al., 2017), which indicates that the agricultural activities might cause higher δ15N values than on other days.
3.2.3 δ18O of
The δ18O of ranged from +53.90 ‰ to +79.81 ‰ (Fig. 3c), with a half-day period mass-weighted average of +72.66 ‰ and a standard deviation of 3.42 ‰. The results are within the observed δ18O range in cool seasons over the Mount Lulin site in Taiwan (69 ‰ ± 15 ‰ reported by Guha et al., 2017) and in the typical range of other studies (averaged value from 70.9 ‰ to 83.8 ‰) (Savarino et al., 2007; Wankel et al., 2010; Fan et al., 2020; Sun et al., 2020). The relatively higher δ18O compared to summer samples (32 ‰ ± 13 ‰ reported by Guha et al., 2017) indicates that more precursors (i.e., NOx) were formed by O3 oxidation whether it was further oxidized through OH oxidation of NO2 or N2O5 hydrolysis pathways (from +72.5 ‰ to +101.67 ‰, detailed description in the Supplement). The slightly lower daytime δ18O (+69.67 ‰ to +72.52 ‰ based on half-day average) compared to nighttime samples (+74.82 ‰ to +79.81 ‰) as shown in Table S1 indicates that peroxyl radicals might partially participate in the daytime photo-oxidation processes or relatively lower δ18O of OH, leading to a lower δ18O in nitrate aerosols during daytime as stated in other studies (Gobel et al., 2013; Hastings et al., 2003; Fang et al., 2011).
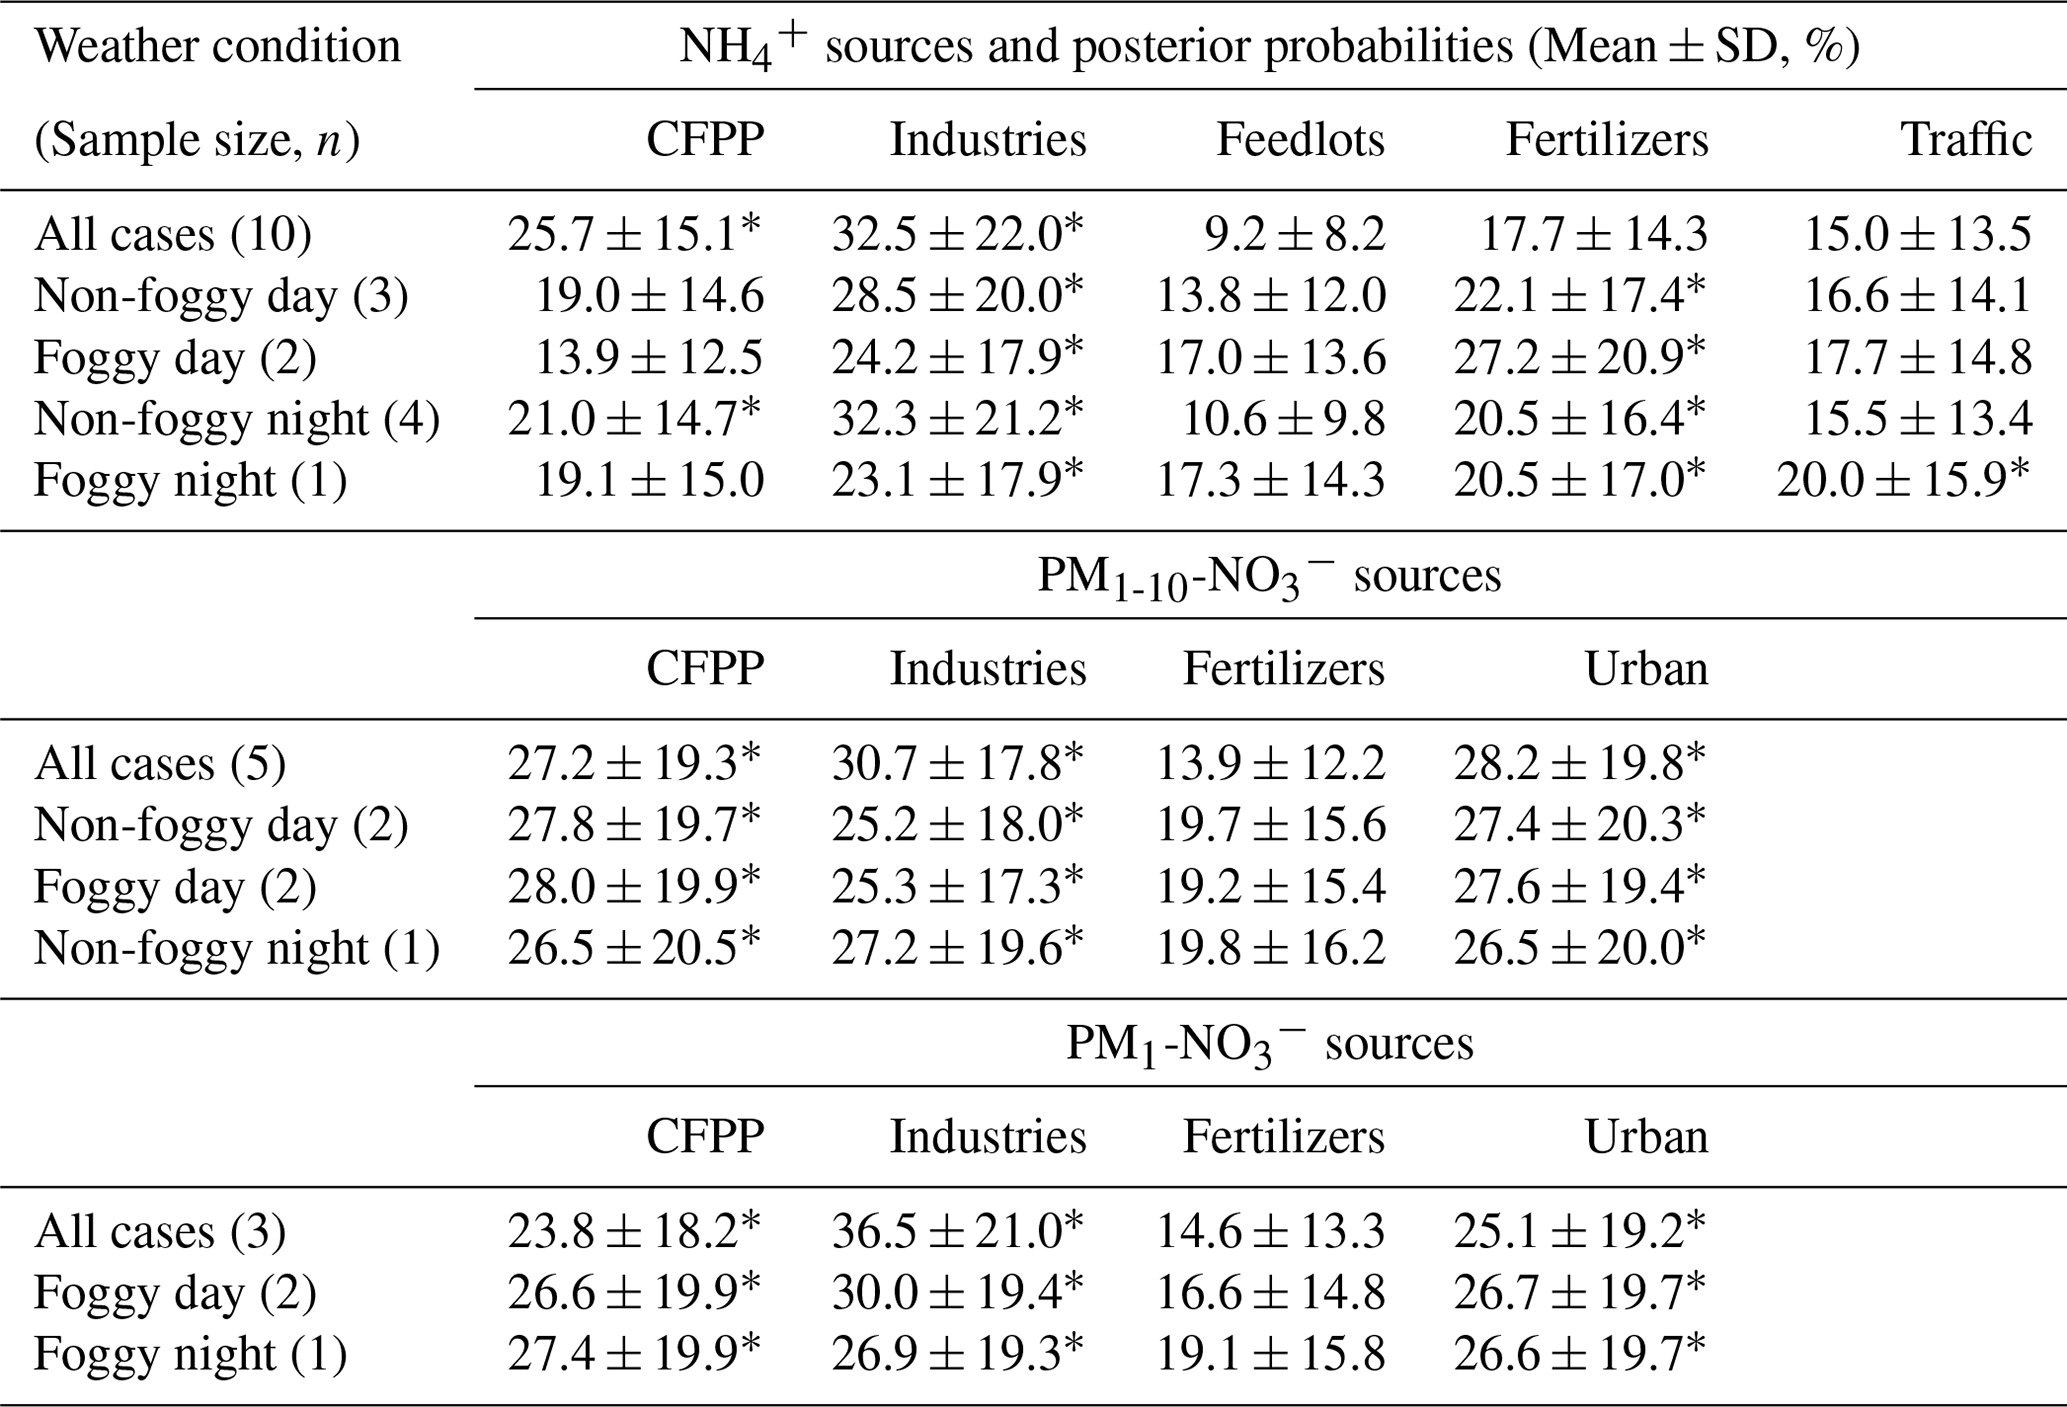
Table 4The posterior probabilities of aerosol sources inferred by MixSIAR (starred for the mean posterior probability greater than 20 %).
For PM1, the δ18O of 0.32–0.56 µm under foggy conditions (+53.90 ‰ and +66.13 ‰ for 14 and 15 December daytime samples, respectively) is relatively lower than that over larger sizes (e.g., +75.65 ‰ and +73.98 ‰ of 0.56–1 µm), suggesting the formation pathway difference. The concentration of 0.32–0.56 µm is relatively lower than that of 0.56–1 µm or PM1-10, and it might be attributed to ambient air mass near the observation site. Because the fine particles are more acidic (Chen et al., 2021), can frequently exchange with gas-phase HNO3 to reveal the local δ18O of . The peroxyl radicals derived from the photo-oxidation of biogenic volatile organic compounds (BVOCs) at the Xitou forest area might be active oxidants locally for fine-mode organic nitrate (RONO2 or ROONO2) and HNO3 from and oxidation to have a lower δ18O of (description in the Supplement). On the other hand, the higher δ18O of 0.56–1 µm is likely formed from the growth of smaller particles and aqueous-phase reactions such as HNO3 partition, which could be neutralized by excess at an earlier stage to be less influenced by peroxyl radicals. Furthermore, the PM1-10- are mainly produced near the urban regions via the reactions of HNO3 or NOx with sea salt, i.e., or (X = Cl or Br, (p) represents particle phase), which may also produce with a higher δ18O because most O atoms of might be from O3 during the fast NO↔NO2 conversion processes (Gobel et al., 2013).
3.3 Source apportionment by isotope analysis
The δ15N of collected and is applied for source apportionment since δ15N in N-containing aerosol is dependent on the precursor sources (Felix and Elliott, 2014; Walters et al., 2015; Chang et al., 2016; Pan et al., 2016, 2018b; Savard et al., 2017; Fan et al., 2019). Figure 4 shows the averaged δ15N under distinct weather conditions and the isotope value of single-source based on the observation by Savard et al. (2017). By assuming that the mass-weighted average isotope represents the possible source contribution with a single source having similar δ15N as reported by Savard et al. (2017) for simplification, the probable aerosol-N sources are summarized in Table 3. Due to the similar δ15N among sources, might be originated from several sources such as CFPPs, traffic or industries, but least likely from feedlots. The urban sources or CFPPs might contribute to PM1-10-, while industries contribute to the lower δ15N of PM1- under foggy conditions. In contrast, the significant difference of δ15N between measurement and fertilizer plants (+10.8 ‰) suggests the limited contribution of fertilizer production-related . Overall, the probable sources of and were anthropogenically originated, such as CFPPs, industries and urban traffic. The sea breeze could transport the precursor gases or aerosol-phase pollutants from CFPPs, industrial sources or urban emissions to the forest area by upslope wind (Chen et al., 2021). During the transportation, the chemical reactions might further promote PM formation, having the measured δ15N of collected samples close to that of the available gas-phase species.
As PM is a mixture attributed from various sources, the mass-weighted average δ15N of and was analyzed using the MixSIAR model to distinguish the posterior probability of aerosol sources as summarized in Table 4. The samples of 181221D were excluded in this analysis due to the interference from the agricultural activities nearby. The similar posterior probabilities among some sources are due to the comparable source isotope values as stated above. However, with the source and sample variability, the results of MixSIAR provide a broader probability for source contribution, which reflects the uncertainty of the ambient conditions simply by using the mixing rule. The possible differentiation among the similar δ15N sources might require the integration of the back trajectory and chemical transport model simulation with the known emission sources.
Taking account of all weather conditions, the order of possible sources from the highest to the lowest probability is {industries, CFPPs, fertilizers, traffic and feedlots}. The first two sources have a higher likelihood, >20 %. As the conditions were divided by different weather patterns, fertilizer plants have increased the importance, especially for foggy daytime. Feedlots remain the lowest. The model results agree with the direct comparison, indicating that the anthropogenic sources contribute significantly to aerosol-. The larger δ15N during foggy daytime suggests a higher probability of fertilizer production, indicating the likelihood of locally produced ammonium from the fertilizer manufacturers near the agricultural area because of the lower wind speed and lower boundary layer height.
Though the δ15N of might seem alike (Fig. 4), some trends could be revealed from the MixSIAR model analysis. The MixSIAR results show that industries, urban sources and CFPPs are the major sources for both PM1- and PM1-10-, whereas fertilizer plants have the lowest probability. The difference in posterior probability between PM1 and PM1-10 nitrate sources is not significant: the PM1-10 was more likely from CFPPs, industries or urban sources, while industries had the majority of PM1- formation. However, the inferred source difference might suggest that the coarse-mode aerosols came from the coastal sea-salt particles mixing with the emission of CFPPs or the Taichung–Changhua metropolitan during the inland transport. On the other hand, PM1- is likely formed locally and might have a higher portion of nearby sources. For both PM1 and PM1-10 nitrate, fertilizer industry was the minority in the sources for the Xitou forest area, different from the result of . The discrepancy might result from the type of nitrogen fertilizers produced in the nearby area vs. the higher contribution of from the power plant or urban sources through sea breeze and valley wind transport.
The mass distribution of aerosol and concentration and the associated isotope analysis were analyzed to investigate the evolution of nitrogen species before reaching the studied site. In the Xitou forest, the average concentration of aerosol components is 0.98 µg m−3 for and 0.25 µg m−3 for . The 1.5 to 6 times higher concentration of and in the daytime indicates that the local circulation combining land–sea breeze with mountain–valley wind could bring urban and industrial pollutants into the Xitou forests, further proved by the δ15N analysis. The δ15N of was from −3.70 ‰ to +21.39 ‰ with higher δ15N values of the 0.32–1 µm aerosols, where a higher concentration was measured. The δ15N of was from −1.07 ‰ to +6.64 ‰, with a mean value of 2.98 ‰ and a standard deviation of 1.20 ‰. Though the similar range of among sources made it difficult to distinguish the origin of directly, the statistical model still provided some hints: industries, urban sources and CFPPs are the significant sources of particulate . The stronger boundary layer inversion during foggy days led to weaker upward transportation of air mass, causing a 2–3 times higher aerosol concentration. The mass distribution difference and the discrepancy of δ15N of between foggy and non-foggy conditions suggest that the additional PM1- for foggy days was formed locally with excess NH3 in the aqueous phase. The difference in analyzed nitrogen sources between PM1-10 and PM1 revealed the impacts of fog on aerosol formation: PM1-10 was more likely produced by CFPP and urban areas, whereas PM1, existing only in the foggy period, had more local contributors such as a higher portion of industries. The inferred source difference might suggest that the nitrogen atoms of coarse-mode aerosols might be formed through the mixing of the coastal sea-salt particles with the emission of CFPPs or metropolitan during the inland transport. On the other hand, PM1- is likely formed locally and might have a higher portion of nitrogen from nearby sources. However, the fractionation during the aerosol transportation under higher RH and high gaseous precursors can enlarge the isotope value in aerosol phases (Chang et al., 2018), which might affect the source apportionment results and should be appropriately assessed in the future. The observed δ18O of in this study, consistent with former studies conducted in a similar season (Guha et al., 2017), suggests that O3 is the primary oxidant for NOx as a precursor of . The lower δ18O value at 0.32–0.56 µm under foggy daytime conditions indicates the participation of locally produced RO2 in formation. Overall, the measured composition combined with the weather observation suggests the effects of local circulation and boundary layer on air quality, and the isotope analysis further proved the influence of the inland transport from anthropogenic sources.
Data are available upon request.
The supplement related to this article is available online at: https://doi.org/10.5194/acp-22-13001-2022-supplement.
TYC and CLC carried out the field studies and aerosol composition analysis. TYC performed data analysis and MixSIAR model for N-source apportionment and prepared the manuscript draft and editing. YCC and HR developed and conducted the isotope analysis. CCKC provided MOUDI instrumentation support and IC analysis of PM2.5 and PM10. HMH supervised the project, including data discussion and manuscript editing.
The contact author has declared that none of the authors has any competing interests.
Publisher's note: Copernicus Publications remains neutral with regard to jurisdictional claims in published maps and institutional affiliations.
We acknowledge the local site support from the Administration of the Xitou Experimental Forest, College of Bio-Resources and Agriculture at National Taiwan University. The comments from Andrius Garbaras and the anonymous reviewer are highly appreciated.
This research has been supported by the Ministry of Science and Technology, Taiwan (grant nos. 108-2111-M-002-003, 109-2111-M-002-003, and 110-2111-M-002-010) and the National Taiwan University (grant no. 110L892001).
This paper was edited by Rupert Holzinger and reviewed by Andrius Garbaras and one anonymous referee.
Behera, S. N., Sharma, M., Aneja, V. P., and Balasubramanian, R.: Ammonia in the atmosphere: a review on emission sources, atmospheric chemistry and deposition on terrestrial bodies, Environ. Sci. Pollut. R. Int., 20, 8092–8131, https://doi.org/10.1007/s11356-013-2051-9, 2013.
Bobbink, R., Hicks, K., Galloway, J., Spranger, T., Alkemade, R., Ashmore, M., Bustamante, M., Cinderby, S., Davidson, E., Dentener, F., Emmett, B., Erisman, J. W., Fenn, M., Gilliam, F., Nordin, A., Pardo, L., and De Vries, W.: Global assessment of nitrogen deposition effects on terrestrial plant diversity: a synthesis, Ecol. Appl., 20, 30–59, https://doi.org/10.1890/08-1140.1, 2010.
Bohlke, J. K., Mroczkowski, S. J., and Coplen, T. B.: Oxygen isotopes in nitrate: new reference materials for measurements and observations on nitrate-water equilibration, Rapid Commun. Mass Sp., 17, 1835–1846, https://doi.org/10.1002/rcm.1123, 2003.
Cape, J. N., Tang, Y. S., van Dijk, N., Love, L., Sutton, M. A., and Palmer, S. C.: Concentrations of ammonia and nitrogen dioxide at roadside verges, and their contribution to nitrogen deposition, Environ. Pollut., 132, 469–478, https://doi.org/10.1016/j.envpol.2004.05.009, 2004.
Casciotti, K. L., Sigman, D. M., Hastings, M. G., Bohlke, J. K., and Hilkert, A.: Measurement of the oxygen isotopic composition of nitrate in seawater and freshwater using the denitrifier method, Anal. Chem., 74, 4905–4912, https://doi.org/10.1021/ac020113w, 2002.
Chang, Y., Liu, X., Deng, C., Dore, A. J., and Zhuang, G.: Source apportionment of atmospheric ammonia before, during, and after the 2014 APEC summit in Beijing using stable nitrogen isotope signatures, Atmos. Chem. Phys., 16, 11635–11647, https://doi.org/10.5194/acp-16-11635-2016, 2016.
Chang, Y., Zhang, Y., Tian, C., Zhang, S., Ma, X., Cao, F., Liu, X., Zhang, W., Kuhn, T., and Lehmann, M. F.: Nitrogen isotope fractionation during gas-to-particle conversion of NOx to in the atmosphere – implications for isotope-based NOx source apportionment, Atmos. Chem. Phys., 18, 11647–11661, https://doi.org/10.5194/acp-18-11647-2018, 2018.
Chen, C.-L., Chen, T.-Y., Hung, H.-M., Tsai, P.-W., Chou, C. C. K., and Chen, W.-N.: The influence of upslope fog on hygroscopicity and chemical composition of aerosols at a forest site in Taiwan, Atmos. Environ., 246, 118150, https://doi.org/10.1016/j.atmosenv.2020.118150, 2021.
Chou, C. C.-K., Lee, C. T., Cheng, M. T., Yuan, C. S., Chen, S. J., Wu, Y. L., Hsu, W. C., Lung, S. C., Hsu, S. C., Lin, C. Y., and Liu, S. C.: Seasonal variation and spatial distribution of carbonaceous aerosols in Taiwan, Atmos. Chem. Phys., 10, 9563–9578, https://doi.org/10.5194/acp-10-9563-2010, 2010.
Chow, J. C., Watson, J. G., Crow, D., Lowenthal, D. H., and Merrifield, T.: Comparison of IMPROVE and NIOSH Carbon Measurements, Aerosol Sci. Tech., 34, 23–34, https://doi.org/10.1080/02786820119073, 2001.
Coury, C. and Dillner, A. M.: A method to quantify organic functional groups and inorganic compounds in ambient aerosols using attenuated total reflectance FTIR spectroscopy and multivariate chemometric techniques, Atmos. Environ., 42, 5923–5932, https://doi.org/10.1016/j.atmosenv.2008.03.026, 2008.
Evans, M. C., Campbell, S. W., Bhethanabotla, V., and Poor, N. D.: Effect of sea salt and calcium carbonate interactions with nitric acid on the direct dry deposition of nitrogen to Tampa Bay, Florida, Atmos. Environ., 38, 4847–4858, https://doi.org/10.1016/j.atmosenv.2004.05.046, 2004.
Fan, M.-Y., Zhang, Y.-L., Lin, Y.-C., Chang, Y.-H., Cao, F., Zhang, W.-Q., Hu, Y.-B., Bao, M.-Y., Liu, X.-Y., Zhai, X.-Y., Lin, X., Zhao, Z.-Y., and Song, W.-H.: Isotope-based source apportionment of nitrogen-containing aerosols: A case study in an industrial city in China, Atmos. Environ., 212, 96–105, https://doi.org/10.1016/j.atmosenv.2019.05.020, 2019.
Fan, M. Y., Zhang, Y. L., Lin, Y. C., Cao, F., Zhao, Z. Y., Sun, Y., Qiu, Y., Fu, P., and Wang, Y.: Changes of Emission Sources to Nitrate Aerosols in Beijing After the Clean Air Actions: Evidence From Dual Isotope Compositions, J. Geophys. Res.-Atmos., 125, e2019JD031998, https://doi.org/10.1029/2019jd031998, 2020.
Fang, Y. T., Koba, K., Wang, X. M., Wen, D. Z., Li, J., Takebayashi, Y., Liu, X. Y., and Yoh, M.: Anthropogenic imprints on nitrogen and oxygen isotopic composition of precipitation nitrate in a nitrogen-polluted city in southern China, Atmos. Chem. Phys., 11, 1313–1325, https://doi.org/10.5194/acp-11-1313-2011, 2011.
Felix, J. D. and Elliott, E. M.: Isotopic composition of passively collected nitrogen dioxide emissions: Vehicle, soil and livestock source signatures, Atmos. Environ., 92, 359–366, https://doi.org/10.1016/j.atmosenv.2014.04.005, 2014.
Felix, J. D., Elliott, E. M., and Shaw, S. L.: Nitrogen isotopic composition of coal-fired power plant NOx: influence of emission controls and implications for global emission inventories, Environ. Sci. Technol., 46, 3528–3535, https://doi.org/10.1021/es203355v, 2012.
Felix, J. D., Elliott, E. M., Gish, T., Maghirang, R., Cambal, L., and Clougherty, J.: Examining the transport of ammonia emissions across landscapes using nitrogen isotope ratios, Atmos. Environ., 95, 563–570, https://doi.org/10.1016/j.atmosenv.2014.06.061, 2014.
Gobel, A. R., Altieri, K. E., Peters, A. J., Hastings, M. G., and Sigman, D. M.: Insights into anthropogenic nitrogen deposition to the North Atlantic investigated using the isotopic composition of aerosol and rainwater nitrate, Geophys. Res. Lett., 40, 5977–5982, https://doi.org/10.1002/2013gl058167, 2013.
Guha, T., Lin, C. T., Bhattacharya, S. K., Mahajan, A. S., Ou-Yang, C.-F., Lan, Y.-P., Hsu, S. C., and Liang, M.-C.: Isotopic ratios of nitrate in aerosol samples from Mt. Lulin, a high-altitude station in Central Taiwan, Atmos. Environ., 154, 53–69, https://doi.org/10.1016/j.atmosenv.2017.01.036, 2017.
Hastings, M. G., Sigman, D. M., and Lipschultz, F.: Isotopic evidence for source changes of nitrate in rain at Bermuda, J. Geophys. Res.-Atmos., 108, 4790, https://doi.org/10.1029/2003jd003789, 2003.
Hoffman, R. C., Laskin, A., and Finlayson-Pitts, B. J.: Sodium nitrate particles: physical and chemical properties during hydration and dehydration, and implications for aged sea salt aerosols, J. Aerosol Sci., 35, 869–887, https://doi.org/10.1016/j.jaerosci.2004.02.003, 2004.
Hsieh, M.-K.: Effects of orographically induced low-level moisture convergence and inversion strength on upslope fog: a case study at Xitou, Graduate Institute of Atmospheric Sciences, National Taiwan University, Taipei, Taiwan, https://doi.org/10.6342/NTU201900872, 2019.
Huang, R.-T.: A study of aerosol hygroscopicity in Kinmen, Graduate Institute of Atmospheric Sciences, National Taiwan University, Taipei, Taiwan, https://doi.org/10.6342/NTU201603559, 2016.
Hung, H.-M., Hsu, C.-H., Lin, W.-T., and Chen, Y.-Q.: A case study of single hygroscopicity parameter and its link to the functional groups and phase transition for urban aerosols in Taipei City, Atmos. Environ., 132, 240–248, https://doi.org/10.1016/j.atmosenv.2016.03.008, 2016.
Jacob, D. J.: Introduction to atmospheric chemistry, Princeton University Press, ISBN 9780691001852, 1999.
Kawashima, H.: Seasonal trends of the stable nitrogen isotope ratio in particulate nitrogen compounds and their gaseous precursors in Akita, Japan, Tellus B, 71, 1627846, https://doi.org/10.1080/16000889.2019.1627846, 2019.
Kim, H., Park, G.-H., Lee, S.-E., Kim, Y.-I., Lee, K., Kim, Y.-H., and Kim, T.-W.: Stable isotope ratio of atmospheric and seawater nitrate in the East Sea in the northwestern Pacific ocean, Mar. Pollut. Bull., 149, 110610, https://doi.org/10.1016/j.marpolbul.2019.110610, 2019.
Pan, Y., Tian, S., Liu, D., Fang, Y., Zhu, X., Zhang, Q., Zheng, B., Michalski, G., and Wang, Y.: Fossil Fuel Combustion-Related Emissions Dominate Atmospheric Ammonia Sources during Severe Haze Episodes: Evidence from (15)N-Stable Isotope in Size-Resolved Aerosol Ammonium, Environ. Sci. Technol., 50, 8049–8056, https://doi.org/10.1021/acs.est.6b00634, 2016.
Pan, Y., Tian, S., Liu, D., Fang, Y., Zhu, X., Gao, M., Gao, J., Michalski, G., and Wang, Y.: Isotopic evidence for enhanced fossil fuel sources of aerosol ammonium in the urban atmosphere, Environ. Pollut., 238, 942–947, https://doi.org/10.1016/j.envpol.2018.03.038, 2018a.
Pan, Y., Tian, S., Liu, D., Fang, Y., Zhu, X., Gao, M., Wentworth, G. R., Michalski, G., Huang, X., and Wang, Y.: Source Apportionment of Aerosol Ammonium in an Ammonia-Rich Atmosphere: An Isotopic Study of Summer Clean and Hazy Days in Urban Beijing, J. Geophys. Res.-Atmos., 123, 5681–5689, https://doi.org/10.1029/2017jd028095, 2018b.
Petters, M. D. and Kreidenweis, S. M.: A single parameter representation of hygroscopic growth and cloud condensation nucleus activity, Atmos. Chem. Phys., 7, 1961–1971, https://doi.org/10.5194/acp-7-1961-2007, 2007.
Poschl, U.: Atmospheric aerosols: composition, transformation, climate and health effects, Angew. Chem. Int. Edit., 44, 7520–7540, https://doi.org/10.1002/anie.200501122, 2005.
Savard, M. M., Cole, A., Smirnoff, A., and Vet, R.: δ15N values of atmospheric N species simultaneously collected using sector-based samplers distant from sources – Isotopic inheritance and fractionation, Atmos. Environ., 162, 11–22, https://doi.org/10.1016/j.atmosenv.2017.05.010, 2017.
Savarino, J., Kaiser, J., Morin, S., Sigman, D. M., and Thiemens, M. H.: Nitrogen and oxygen isotopic constraints on the origin of atmospheric nitrate in coastal Antarctica, Atmos. Chem. Phys., 7, 1925–1945, https://doi.org/10.5194/acp-7-1925-2007, 2007.
Seinfeld, J. H. and Pandis, S. N.: Atmospheric Chemistry and Physics: From Air Pollution to Climate Change, 2nd edn., John Wiley & Sons, Inc., ISBN 9780471720188, 2006.
Sigman, D. M., Casciotti, K. L., Andreani, M., Barford, C., Galanter, M., and Böhlke, J. K.: A Bacterial Method for the Nitrogen Isotopic Analysis of Nitrate in Seawater and Freshwater, Anal. Chem., 73, 4145–4153, https://doi.org/10.1021/ac010088e, 2001.
Stock, B. C. and Semmens, B. X.: MixSIAR GUI User Manual, Version 3.1, Zenodo [code], https://doi.org/10.5281/zenodo.1209993, 2016.
Stock, B. C., Jackson, A. L., Ward, E. J., Parnell, A. C., Phillips, D. L., and Semmens, B. X.: Analyzing mixing systems using a new generation of Bayesian tracer mixing models, PeerJ, 6, e5096, https://doi.org/10.7717/peerj.5096, 2018.
Sun, X., Zong, Z., Wang, K., Li, B., Fu, D., Shi, X., Tang, B., Lu, L., Thapa, S., Qi, H., and Tian, C.: The importance of coal combustion and heterogeneous reaction for atmospheric nitrate pollution in a cold metropolis in China: Insights from isotope fractionation and Bayesian mixing model, Atmos. Environ., 243, 117730, https://doi.org/10.1016/j.atmosenv.2020.117730, 2020.
Walters, W. W. and Michalski, G.: Theoretical calculation of nitrogen isotope equilibrium exchange fractionation factors for various NOy molecules, Geochim. Cosmochim. Ac., 164, 284–297, https://doi.org/10.1016/j.gca.2015.05.029, 2015.
Walters, W. W., Tharp, B. D., Fang, H., Kozak, B. J., and Michalski, G.: Nitrogen Isotope Composition of Thermally Produced NOx from Various Fossil-Fuel Combustion Sources, Environ. Sci. Technol., 49, 11363–11371, https://doi.org/10.1021/acs.est.5b02769, 2015.
Walters, W. W., Chai, J., and Hastings, M. G.: Theoretical Phase Resolved Ammonia–Ammonium Nitrogen Equilibrium Isotope Exchange Fractionations: Applications for Tracking Atmospheric Ammonia Gas-to-Particle Conversion, ACS Earth and Space Chemistry, 3, 79–89, https://doi.org/10.1021/acsearthspacechem.8b00140, 2018.
Wankel, S. D., Chen, Y., Kendall, C., Post, A. F., and Paytan, A.: Sources of aerosol nitrate to the Gulf of Aqaba: Evidence from δ15N and δ18O of nitrate and trace metal chemistry, Mar. Chem., 120, 90–99, https://doi.org/10.1016/j.marchem.2009.01.013, 2010.
Weigand, M. A., Foriel, J., Barnett, B., Oleynik, S., and Sigman, D. M.: Updates to instrumentation and protocols for isotopic analysis of nitrate by the denitrifier method, Rapid Commun. Mass Sp., 30, 1365–1383, https://doi.org/10.1002/rcm.7570, 2016.
Wu, L., Yue, S., Shi, Z., Hu, W., Chen, J., Ren, H., Deng, J., Ren, L., Fang, Y., Yan, H., Li, W., Harrison, R. M., and Fu, P.: Source forensics of inorganic and organic nitrogen using δ15N for tropospheric aerosols over Mt. Tai, npj Climate and Atmospheric Science, 4, 8, https://doi.org/10.1038/s41612-021-00163-0, 2021.
Zhang, Z., Zeng, Y., Zheng, N., Luo, L., Xiao, H., and Xiao, H.: Fossil fuel-related emissions were the major source of NH3 pollution in urban cities of northern China in the autumn of 2017, Environ. Pollut., 256, 113428, https://doi.org/10.1016/j.envpol.2019.113428, 2020.