the Creative Commons Attribution 4.0 License.
the Creative Commons Attribution 4.0 License.
 | 24 Jan 2022
Tropospheric ozone changes and ozone sensitivity from the present day to the future under shared socio-economic pathways
Ruth M. Doherty
Oliver Wild
Fiona M. O'Connor
Steven T. Turnock
Tropospheric ozone is important to future air quality and climate. We investigate ozone changes and ozone sensitivity to changing emissions in the context of climate change from the present day (2004–2014) to the future (2045–2055) under a range of shared socio-economic pathways (SSPs). We apply the United Kingdom Earth System Model, UKESM1, with an extended chemistry scheme including more reactive volatile organic compounds (VOCs) to quantify ozone burdens as well as ozone sensitivities globally and regionally based on nitrogen oxide (NOx) and VOC mixing ratios. We show that the tropospheric ozone burden increases by 4 % under a development pathway with higher NOx and VOC emissions (SSP3-7.0) but decreases by 7 % under the same pathway if NOx and VOC emissions are reduced (SSP3-7.0-lowNTCF) and by 5 % if atmospheric methane (CH4) mixing ratios are reduced (SSP3-7.0-lowCH4). Global mean surface ozone mixing ratios are reduced by 3–5 ppb under SSP3-7.0-lowNTCF and by 2–3 ppb under SSP3-7.0-lowCH4. However, surface ozone changes vary substantially by season in high-emission regions under future pathways, with decreased ozone mixing ratios in summer and increased ozone mixing ratios in winter when NOx emissions are reduced. VOC-limited areas are more extensive in winter (7 %) than in summer (3 %) across the globe. North America, Europe, and East Asia are the dominant VOC-limited regions in the present day, but North America and Europe become more NOx-limited in the future mainly due to reductions in NOx emissions. The impacts of VOC emissions on ozone sensitivity are limited in North America and Europe because reduced anthropogenic VOC emissions are partly offset by higher biogenic VOC emissions. Ozone sensitivity is not greatly influenced by changing CH4 mixing ratios. South Asia becomes the dominant VOC-limited region under future pathways. We highlight that reductions in NOx emissions are required to transform ozone production from VOC to NOx limitation, but that these lead to increased ozone mixing ratios in high-emission regions, and hence emission controls on VOC and CH4 are also necessary.
- Article
(8721 KB) - Full-text XML
- BibTeX
- EndNote


Ozone (O3) is a chemically reactive component in the atmosphere that is produced from natural and anthropogenic sources. Emissions of O3 precursors including nitrogen oxides (NOx), volatile organic compounds (VOCs), methane (CH4), and carbon monoxide (CO) lead to the formation of O3 by a series of photochemical reactions in the presence of sunlight. O3 has important impacts on human health, ecosystems, and climate change (Lefohn et al., 2018; Zhang et al., 2019; Agathokleous et al., 2020). O3 mixing ratios are largely governed by the magnitudes of O3 precursor emissions, transport, deposition, and transport from the stratosphere. O3 exerts a positive radiative forcing (Stevenson et al., 2013; O'Connor et al., 2021; Thornhill et al., 2021a), and changes in climate in turn influence ozone (Fiore et al., 2012; Doherty et al., 2013). Climate change can alter natural emissions of biogenic VOCs (BVOCs), lightning NOx, and CH4, along with temperature, humidity, convection, and clouds, which further influence O3 mixing ratios (Thornhill et al., 2021b). The interactions between air quality and climate play an important role in the coupled Earth system, and we focus on the impacts of future emissions in the context of climate change on tropospheric O3 in this study.
The tropospheric O3 burden is controlled by the amount of O3 production, O3 destruction, O3 deposition, and the O3 transport from the stratosphere (Lelieveld and Dentener, 2000; Wild, 2007). From pre-industrial times to the present day, the tropospheric O3 burden has increased from approximately 240 to 350 Tg mainly due to substantial increases in anthropogenic O3 precursor emissions (Lamarque et al., 2010; Young et al., 2013; Griffiths et al., 2021). However, regional surface O3 changes between the pre-industrial and present day vary substantially due to different regional emission changes (Turnock et al., 2020) and to differences in O3 sensitivity to NOx and VOC emissions. In recent decades, there has been a decrease in surface O3 mixing ratios in North America and Europe due to emission controls (Simon et al., 2015; Colette et al., 2016; Tarasick et al., 2019). In contrast, increases in surface O3 levels are observed in South Asia and East Asia due to industrialisation, urbanisation, and social development (Hakim et al., 2019; Lu et al., 2020). Furthermore, while emission controls have been implemented across industrial regions of China in recent years, these have focused on emissions of NOx and particulate matter and have led to increased O3 pollution in some places (Wang et al., 2017; Silver et al., 2018).
It is important to investigate O3 sensitivity to understand how O3 chemical regimes might change in different parts of the world and to guide suitable emission control strategies. O3 sensitivity is typically characterised by NOx- or VOC-limited regimes for O3 production, and this determines the effectiveness of different emission control strategies. It is dependent on the relative abundances of NOx and VOC (Sillman, 1999) or of their oxidation products, nitric acid (HNO3) and hydrogen peroxide (H2O2) (Kleinman, 1994; Sillman, 1995). VOC-limited regimes typically occur in highly urbanised regions with high NOx mixing ratios in which decreases in NOx emissions increase O3 mixing ratios, and O3 production increases with higher VOC emissions. In contrast, changes in NOx mixing ratios dominate O3 changes in NOx-limited regimes such that decreases in NOx emissions decrease O3 mixing ratios, and O3 mixing ratios are less sensitive to VOC emissions. O3 sensitivity indicators such as the ratios of and allow us to identify O3 sensitivity regimes relatively easily. However, most studies focus on O3 sensitivity in specific regions and for short time periods (Dunker et al., 2002; Sillman and West, 2009; Ye et al., 2016), leading to inconsistency in the critical indicator values that distinguish O3 sensitivity regimes. To address this, we generalise the approach by quantifying O3 sensitivity using a consistent indicator across the globe. This is the first time that the full range of surface chemical environments across the globe has been explored with a global chemistry–climate model, as far as we are aware. We quantify O3 sensitivity based on the ratio of NOx and VOC mixing ratios and investigate how regional O3 sensitivity might change in the future.
The shared socio-economic pathways (SSPs) are future emission and climate scenarios accounting for future social, economic, and environmental developments (O'Neill et al., 2014; van Vuuren et al., 2014). The SSPs represent a range of levels of policy strength (weak, medium, and strong) to control emissions of near-term climate forcers (NTCFs) that include tropospheric O3, O3 precursors, and aerosols (Rao et al., 2017). Our study is based on simulations using historical and future SSP emissions and climate undertaken as part of the Aerosol Chemistry Model Intercomparison Project (AerChemMIP; Collins et al., 2017) and the wider Coupled-Model Intercomparison Project Phase 6 (CMIP6; Eyring et al., 2016). The aim of AerChemMIP is to quantify the effects of chemistry and aerosols on air quality and climate in CMIP6 by conducting historical and future experiments using chemistry–climate models with specified climate and emission trajectories.
We examine tropospheric O3 and surface O3 sensitivity under present-day (2004–2014) and future conditions (2045–2055). Model development and application are described in Sect. 2 along with descriptions of the emission and climate scenarios used. We compare and evaluate the present-day tropospheric O3 burden and surface O3 mixing ratios with two different chemistry schemes in Sect. 3. We then investigate the seasonal, daytime, and nighttime differences in O3 changes in the future compared to the present day for different regions in Sect. 4. Analysis of O3 mixing ratios and production is used to quantify O3 sensitivity and to explain contrasting regional O3 changes in Sect. 5. We then show the changes in O3 sensitivity between different seasons and scenarios in Sect. 6 and present our conclusions in Sect. 7.
2.1 Model description, development, and application
We use version 1 of the United Kingdom Earth System Model, UKESM1 (Sellar et al., 2019), to reproduce present-day (2004–2014) O3 mixing ratios and to predict O3 responses to emissions and climate in the future (2045–2055). UKESM1 consists of a physical climate model, the Hadley Centre Global Environment Model version 3 (HadGEM-GC3.1), configured with the Global Atmosphere 7.1 and Global Land 7.0 (GA7.1/GL7.0) components (Walters et al., 2019), to which Earth system (ES) processes have been coupled (Sellar et al., 2019). Atmospheric composition is modelled using a state-of-the-art chemistry and aerosol module, the United Kingdom Chemistry and Aerosol model (UKCA; Morgenstern et al., 2009; O'Connor et al., 2014). UKCA includes a stratosphere–troposphere gas-phase chemistry scheme (StratTrop; Archibald et al., 2020a) coupled to the aerosol scheme GLOMAP-mode (Mann et al., 2010; Mulcahy et al., 2020). The model resolution is N96L85 in the atmosphere, with 1.875∘ in longitude by 1.25∘ in latitude, 85 terrain-following hybrid height layers, and a model top at 85 km.
While the UKESM1 configuration for CMIP6 used the UKCA StratTrop mechanism, this study also uses an extended gas-phase chemistry scheme that incorporates more reactive VOC species to permit a more realistic representation of O3 production in polluted environments. The extended chemistry scheme (denoted as Ext_StratTrop hereafter) is based on the StratTrop scheme and includes oxidation of the additional chemical components propene (C3H6), butane (C4H10), and toluene (C7H8) to represent alkenes, alkanes, and aromatic VOC classes, as described in Liu et al. (2021). The extended chemistry scheme includes 101 species, 244 bimolecular reactions, 26 uni- and termolecular reactions, 70 photolytic reactions, 5 heterogeneous reactions, and 3 aqueous-phase reactions for the sulfur cycle.
The atmosphere-only configuration of UKESM1 is used with prescribed sea surface temperatures and sea ice to show the transient impacts of emissions under present-day and future climates. These are prescribed using monthly mean time-evolving fields from the fully coupled UKESM1. Greenhouse gas concentrations are prescribed as in historical and future simulations conducted by UKESM1 as part of CMIP6 (Meinshausen et al., 2017, 2020).
2.2 Emissions and experiments
Present-day CMIP6 anthropogenic and biomass burning emissions are taken from Hoesly et al. (2018) and van Marle et al. (2017), respectively. Biogenic VOC emissions are calculated interactively within the iBVOC emissions scheme (Pacifico et al., 2011) in the Joint UK Land Environmental Simulator (JULES) land-surface scheme, which is coupled to UKCA. Other aspects of the emissions used here are the same as described in Turnock et al. (2020). Anthropogenic emissions are categorised into five sectors (industry, power plants, transport, residences, and agriculture) as inputs to the model, with independent diurnal and vertical emission profiles applied for each sector (Bieser et al., 2011; Mailler et al., 2013; Liu et al., 2021).
Three CMIP6 SSP scenarios are used for future simulations: SSP3-7.0, SSP3-7.0-lowNTCF, and SSP3-7.0-lowCH4. The SSP3-7.0 pathway has a large anthropogenic climate forcing signal (a radiative forcing of 7.0 W m−2 at 2100) and weak emission controls on O3 precursors and aerosols and rapidly increasing CH4 mixing ratios (Fujimori et al., 2017; Rao et al., 2017). SSP3-7.0-lowNTCF and SSP3-7.0-lowCH4 are additional pathways which use the same underlying climate policies as SSP3-7.0. SSP3-7.0-lowNTCF has strong controls on all NTCF emissions. SSP3-7.0-lowCH4 follows SSP3-7.0 but assumes strong mitigation of CH4 emissions in the future, with 24 % decreases in surface CH4 mixing ratios from 1802 to 1364 ppb. The last time that historical surface CH4 mixing ratios were this low was more than 50 years ago, in the late 1960s (Prather et al., 2014). BVOC emissions increase under all these pathways due to a warmer climate. We perform four model experiments in this study to investigate tropospheric O3 for the present day (2004–2014) and three future pathways (SSP3-7.0, SSP3-7.0-lowNTCF, and SSP3-7.0-lowCH4; 2045–2055). Table 1 shows the model configuration for the four simulations. Table 2 lists the CMIP6 global mean NTCF total surface emissions and surface CH4 mixing ratios for the four scenarios.
Table 1Model configurations for present-day and future simulations. “Emissions” refers to emissions of O3 precursors and aerosols. “CH4” refers to prescribed surface CH4 mixing ratios. “” refers to prescribed sea surface temperature and sea ice concentrations. “Historical” means that the emissions, CH4 mixing ratios or evolve as for the CMIP6 historical simulations, and “Reference” means that they evolve as for SSP3-7.0. “Low” emissions or CH4 mixing ratios evolve following SSP3-7.0 but with lower emissions or CH4 mixing ratios.
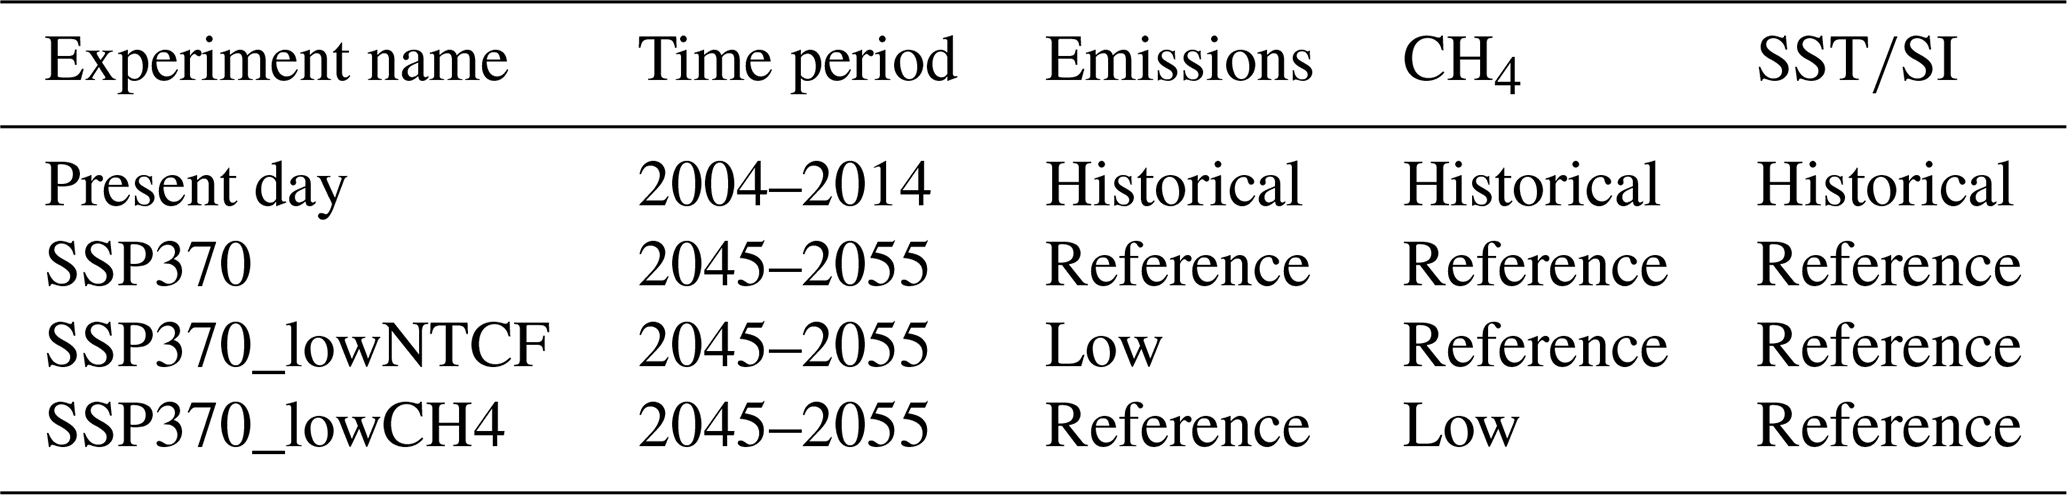
Table 2Overview of global annual mean time-varying surface emissions of NOx, VOCs, CO, sulfur dioxide (SO2), black carbon (BC), and organic carbon (OC) from anthropogenic (ANT), biomass burning (BB), and biogenic (BIO) sources for the present day (2004–2014) and future (2045–2055) SSP3-7.0, SSP3-7.0-lowNTCF, and SSP3-7.0-lowCH4. Annual mean surface CH4 mixing ratios (ppb) are also shown.

2.3 O3 sensitivity indicators
A number of different indicators have been used to distinguish O3 sensitivity regimes, and typical indicators are the ratios of mixing ratios or emissions and the ratio of mixing ratios (Kleinman, 1994; Sillman, 1999). For the ratio, it is often more appropriate to use mixing ratios than emissions because this accounts for emissions, transport, chemical reactions, and deposition. Indicators based on ratios also account for differences in photochemical conditions and VOC reactivity. In a previous study we found that O3 sensitivity regimes diagnosed with and ratios were similar (Liu et al., 2021). However, the indicator is more sensitive to uncertainties in the chemical mechanism, and studies have shown that there are errors in the simulation of short-lived radicals in polluted areas (Whalley et al., 2021). The ratio also does not account for gas–aerosol conversion as a termination route for NOx, a mechanism that is included in many chemistry–climate models. We hence choose the ratio between NOx and VOC mixing ratios as a simple indicator of O3 sensitivity in this study.
We quantify the sensitivity of O3 to NOx and VOC mixing ratios by examining monthly mean O3 mixing ratios and O3 net production in each UKESM1 surface grid cell in each of the scenarios in turn. This provides a global overview of the dependence of O3 and its production on NOx and VOC across different environments. It also allows us to determine a globally averaged critical threshold value distinguishing NOx-limited and VOC-limited regimes.
We note that dilution of short-lived NOx over coarse-resolution model grid cells may lead to the underestimation of local NOx mixing ratios in high-emission regions. This results in underestimation of ratios in these conditions and the regimes may thus be more VOC-limited in reality than we are able to simulate in a global model.
3.1 Comparison of StratTrop and extended chemistry schemes
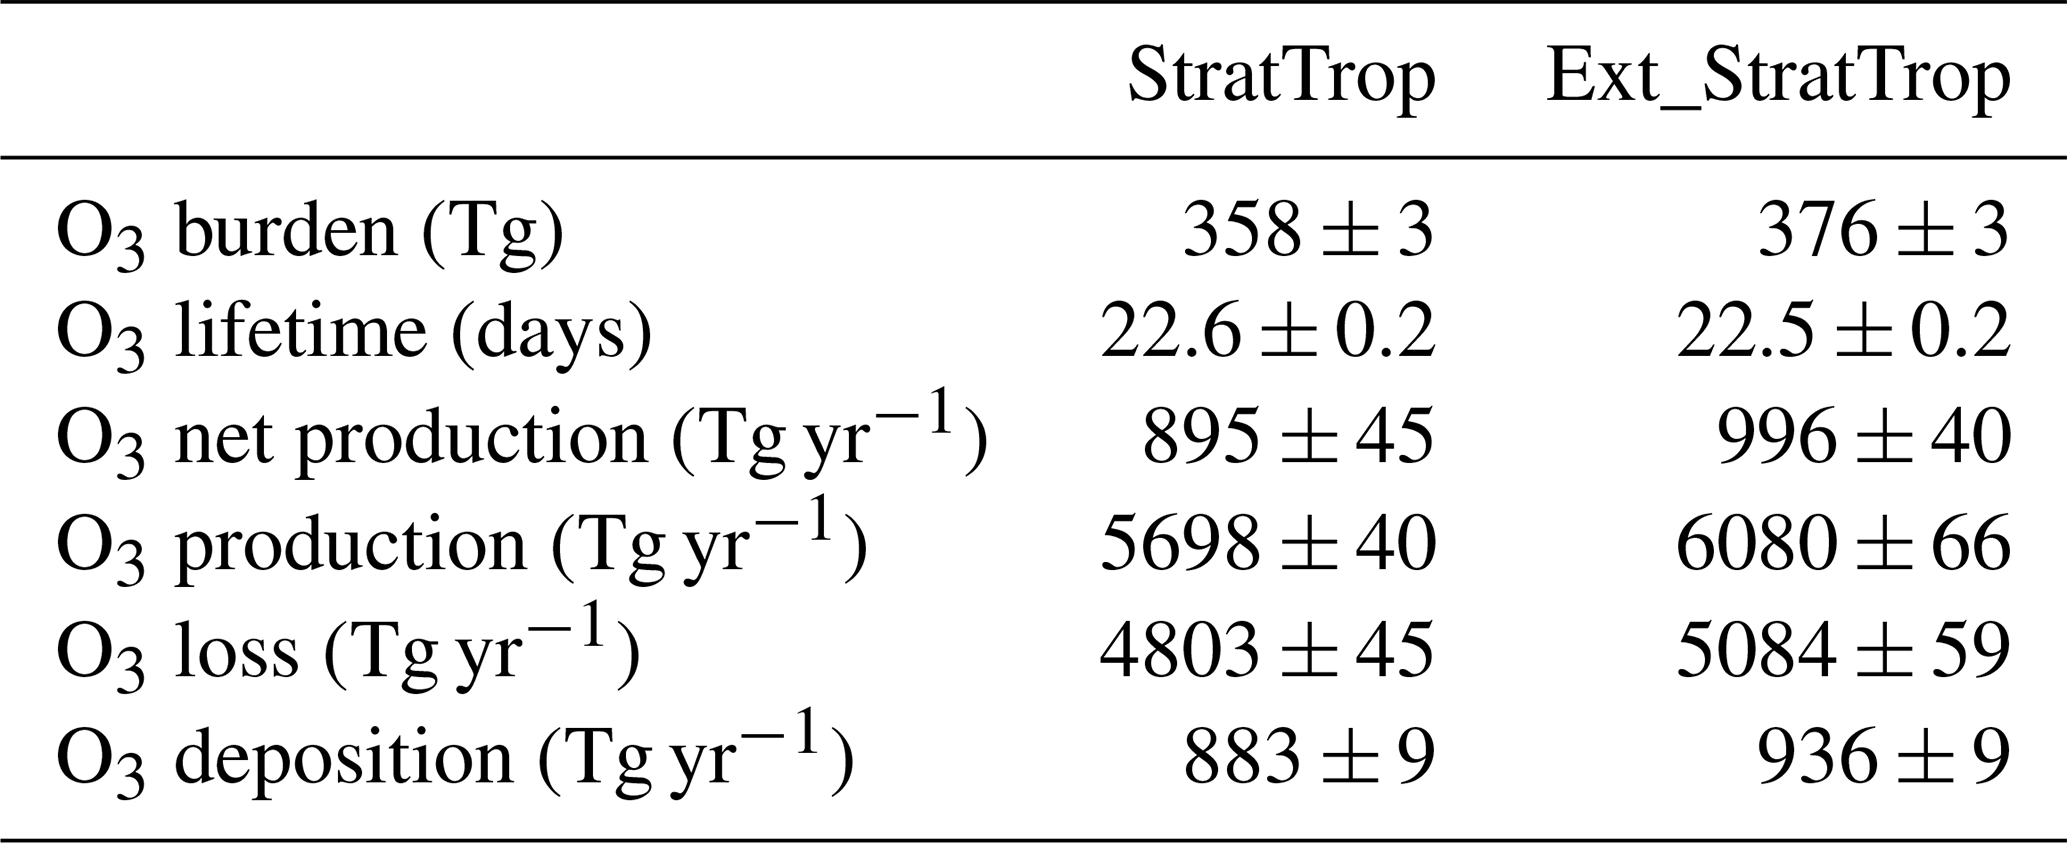
We first compare averaged tropospheric O3 burdens, chemical lifetime, chemical production, chemical loss, and deposition during 2004–2014 from the extended chemistry scheme (Ext_StratTrop) with those from the StratTrop chemistry scheme used in AerChemMIP simulations (Table 3). We define the O3 production rate as the sum of reactions fluxes through and the O3 loss rate as the sum of O(1D)+H2O and . The O3 burden with the extended chemistry scheme (376 Tg) lies at the upper end of the uncertainty range for the observed burden: 340±34 Tg for 2000 (Archibald et al., 2020b). The magnitude of the O3 burden is also consistent with the CMIP6 multi-model mean burden of 356±31 Tg for 2005–2014 (Griffiths et al., 2021). The extended chemistry scheme produces a 5 % higher tropospheric O3 burden than that of StratTrop (358 Tg), demonstrating a more reactive environment for net O3 formation throughout the troposphere due to reactive VOCs. This is also reflected in the higher rates of chemical O3 production (11 %), loss (6 %), and deposition (6 %) with the extended chemistry scheme. However, the higher O3 production is offset by greater O3 destruction and by faster O3 deposition, and hence the mean O3 chemical lifetime remains very similar at about 22 d, which is consistent with previous multi-model estimates of the mean lifetime of 22.2±2.2 d (Stevenson et al., 2006).
Table 3Comparison of tropospheric O3 burden and budget terms during 2004–2014 simulated with StratTrop and Ext_StratTrop chemistry schemes in UKCA. One standard deviation in the annual terms over the 2004–2014 period is shown. We define the tropopause based on the highest layer with an O3 mixing ratio of less than 150 ppb.
Simulated surface O3 mixing ratios during 2004–2014 with the two chemistry schemes are compared in Fig. 1. Using the extended chemistry scheme, the spatial distribution of surface O3 is similar to that using StratTrop in both winter and summer but shows a general increase in global O3 levels of about 2 ppb (Fig. 1a–d) due to the inclusion of the additional reactive VOCs. The O3 increases (Fig. 1e–f) are most notable for South Asia and East Asia due to the relatively high VOC emissions in these regions (Janssens-Maenhout et al., 2015; Huang et al., 2017; Feng et al., 2020). There is a much larger O3 increase in South Asia in winter than in summer (Fig. 1e), mainly due to greater transport of O3 precursors during the summer monsoon in South Asia (Lu et al., 2018). This leads to higher O3 mixing ratios in winter than in summer, consistent with Gao et al. (2020), and demonstrates a larger seasonal variation in O3 mixing ratios with the Ext_StratTrop chemistry scheme than with the StratTrop chemistry scheme. In addition, there are substantial O3 increases in East Asia and in other polluted continents in summer (Fig. 1f) when using the extended chemistry scheme. This is not seen in winter (Fig. 1e) because titration of O3 by nitric oxide (NO) remains strong, despite high VOC emissions. The relatively small influence of the additional VOCs on O3 in winter is also seen in other heavily populated regions that have high NOx emissions such as North America and Europe.
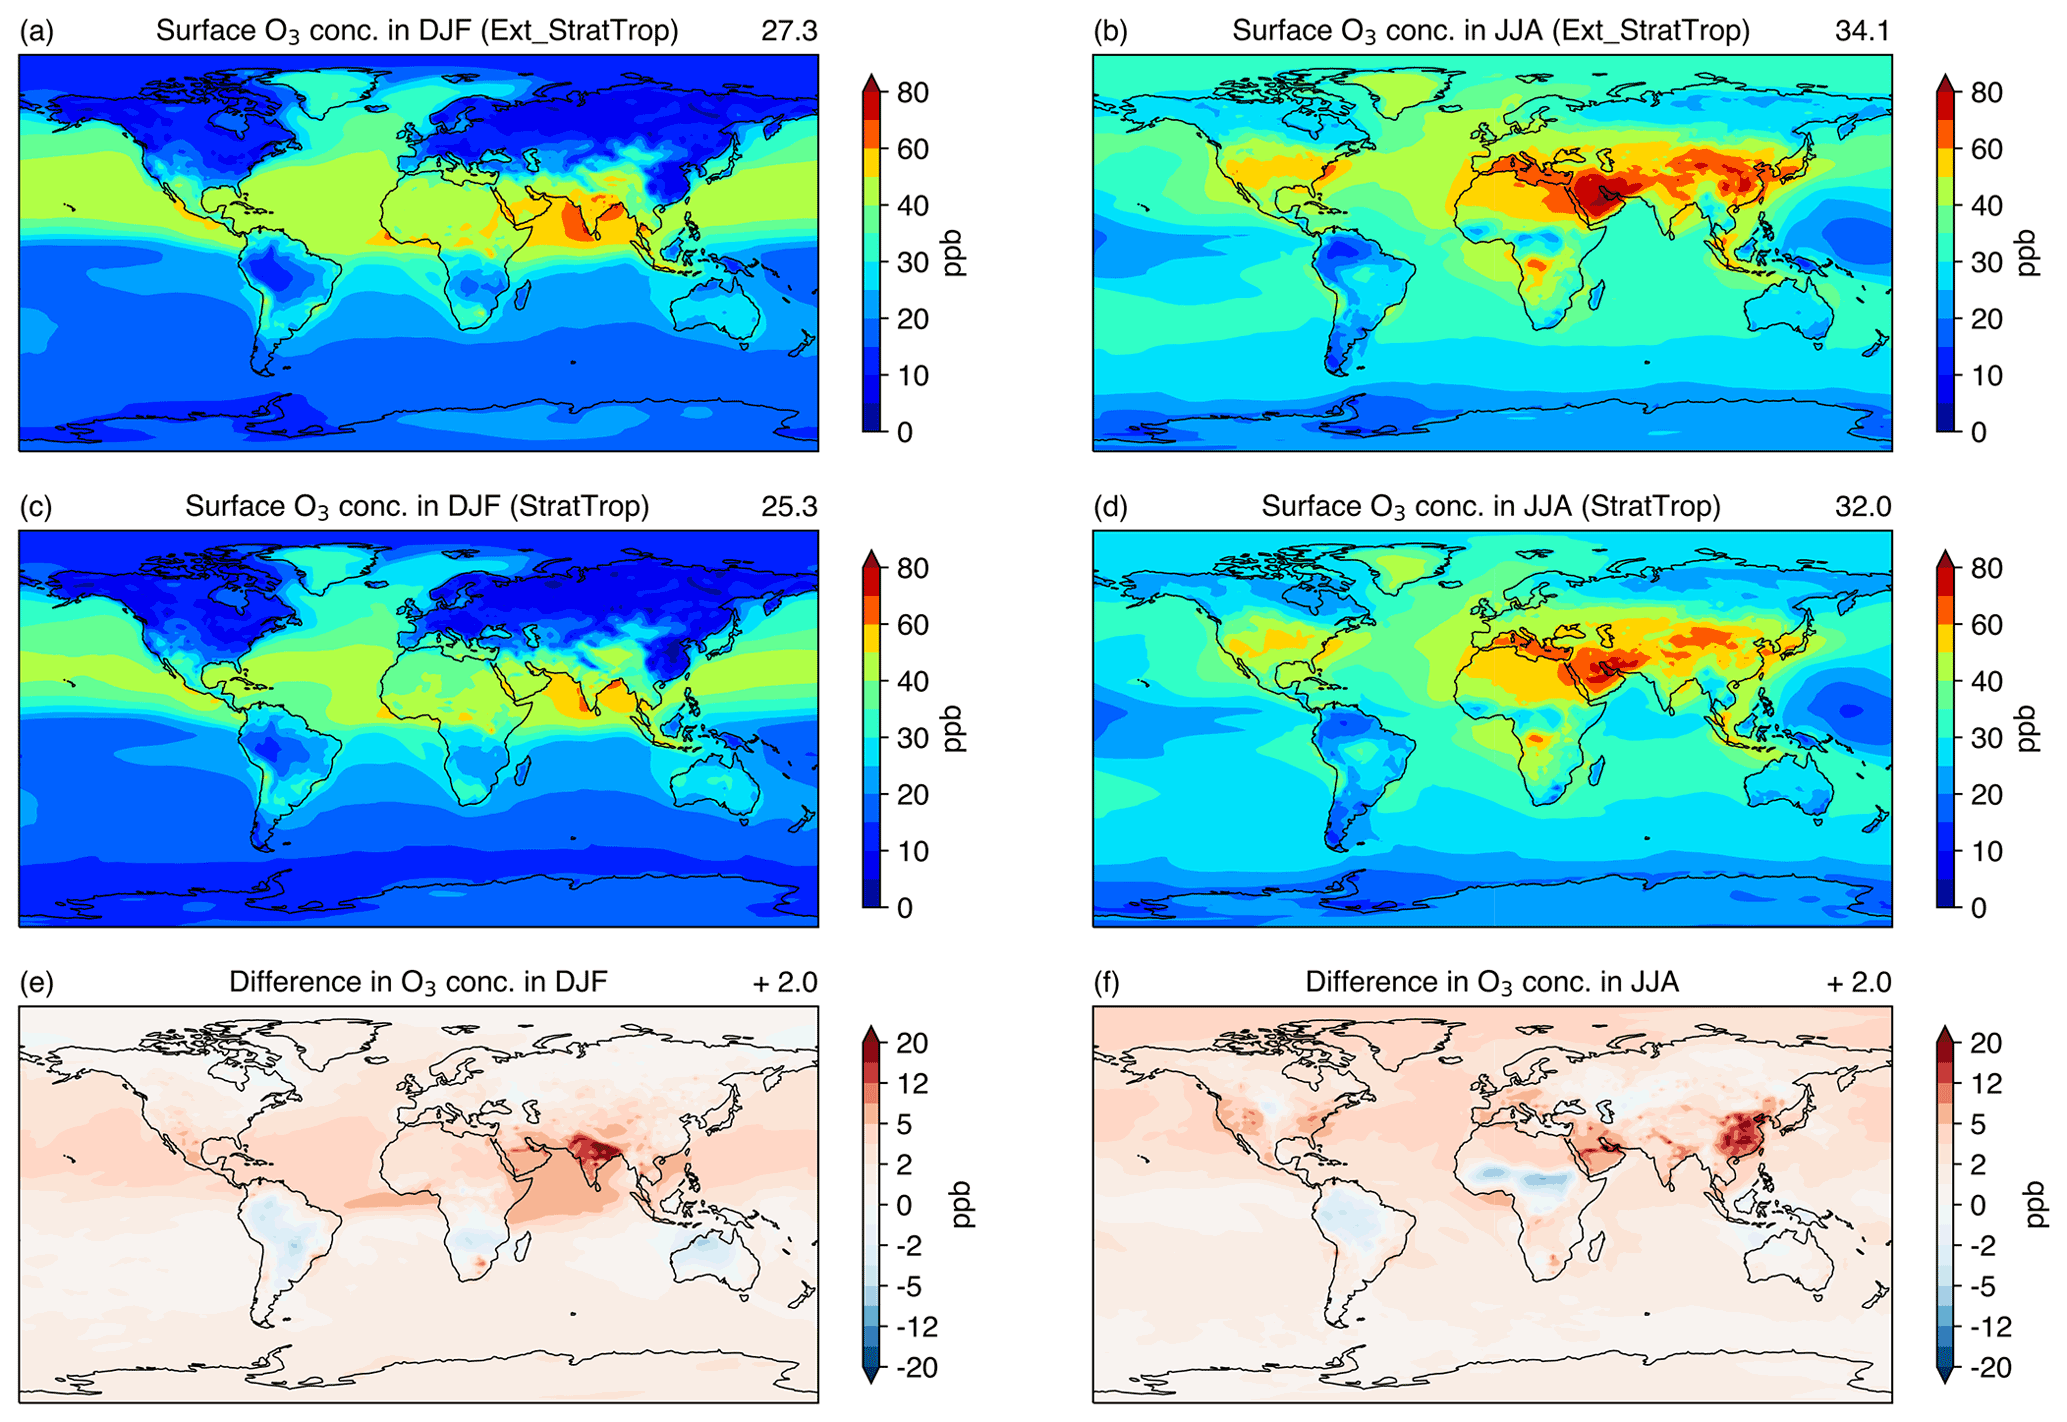
Figure 1Comparison of present-day seasonal mean surface O3 mixing ratios (2004–2014) between the Ext_StratTrop chemistry scheme (a, b) and the StratTrop chemistry scheme (c, d). Winter time (December–January–February, DJF) and summer time (June–July–August, JJA) global mean O3 mixing ratios are shown. Seasonal differences in surface O3 mixing ratios between the two chemistry schemes are shown in (e) and (f).
3.2 Evaluation of surface O3 mixing ratios
We now evaluate surface O3 mixing ratios simulated with the Ext_StratTrop chemistry scheme against gridded monthly mean rural observations from the TOAR dataset over the 2004–2014 period (Schultz et al., 2017a, b). Surface O3 mixing ratios for winter (DJF) and summer (JJA) during 2004–2014 are shown in Fig. 2. We find that global mean surface O3 mixing ratios are underestimated in winter (−7.3 ppb) and overestimated in summer (+13.5 ppb), with relatively small biases in spring and autumn. The positive biases in summer and negative biases in winter for O3 mixing ratios are also seen in results using the StratTrop chemistry scheme (Archibald et al., 2020a; Turnock et al., 2020). The model seasonality with both schemes (19.4–45.5 ppb; DJF-JJA) is rather stronger than that observed (26.7–32 ppb; DJF-JJA), but the Ext_StratTrop chemistry scheme improves the model performance slightly in DJF for surface O3 (Fig. 2b) despite larger biases in summer (Fig. 2d). Numerical diffusion of O3 precursor emissions due to coarse model horizontal resolution may explain the biases (Wild and Prather, 2006; Stock et al., 2014; Fenech et al., 2018), and we note that these seasonal O3 biases are also evident in other chemistry–climate models (Young et al., 2018; Turnock et al., 2020). Insufficient turbulent mixing in the planetary boundary layer may also contribute to the bias (O'Connor et al., 2014), as accumulation of NOx at the surface leads to greater O3 production in summer and greater titration by NO in winter. However, we note that a much more comprehensive chemistry scheme applied in UKCA, the Common Representative Intermediates Mechanism (CRI-Strat), shows similar systematic biases in surface O3 mixing ratios: −4.6 ppb in DJF and +12.0 ppb in JJA for the 2010–2018 period (Archer-Nicholls et al., 2020). This suggests that other biases in the model are primarily responsible for the biases in surface O3. We choose to apply the extended chemistry scheme as it permits representation of a more appropriate chemical environment for O3 production in high-emission areas and is thus more suitable to investigate O3 sensitivity.
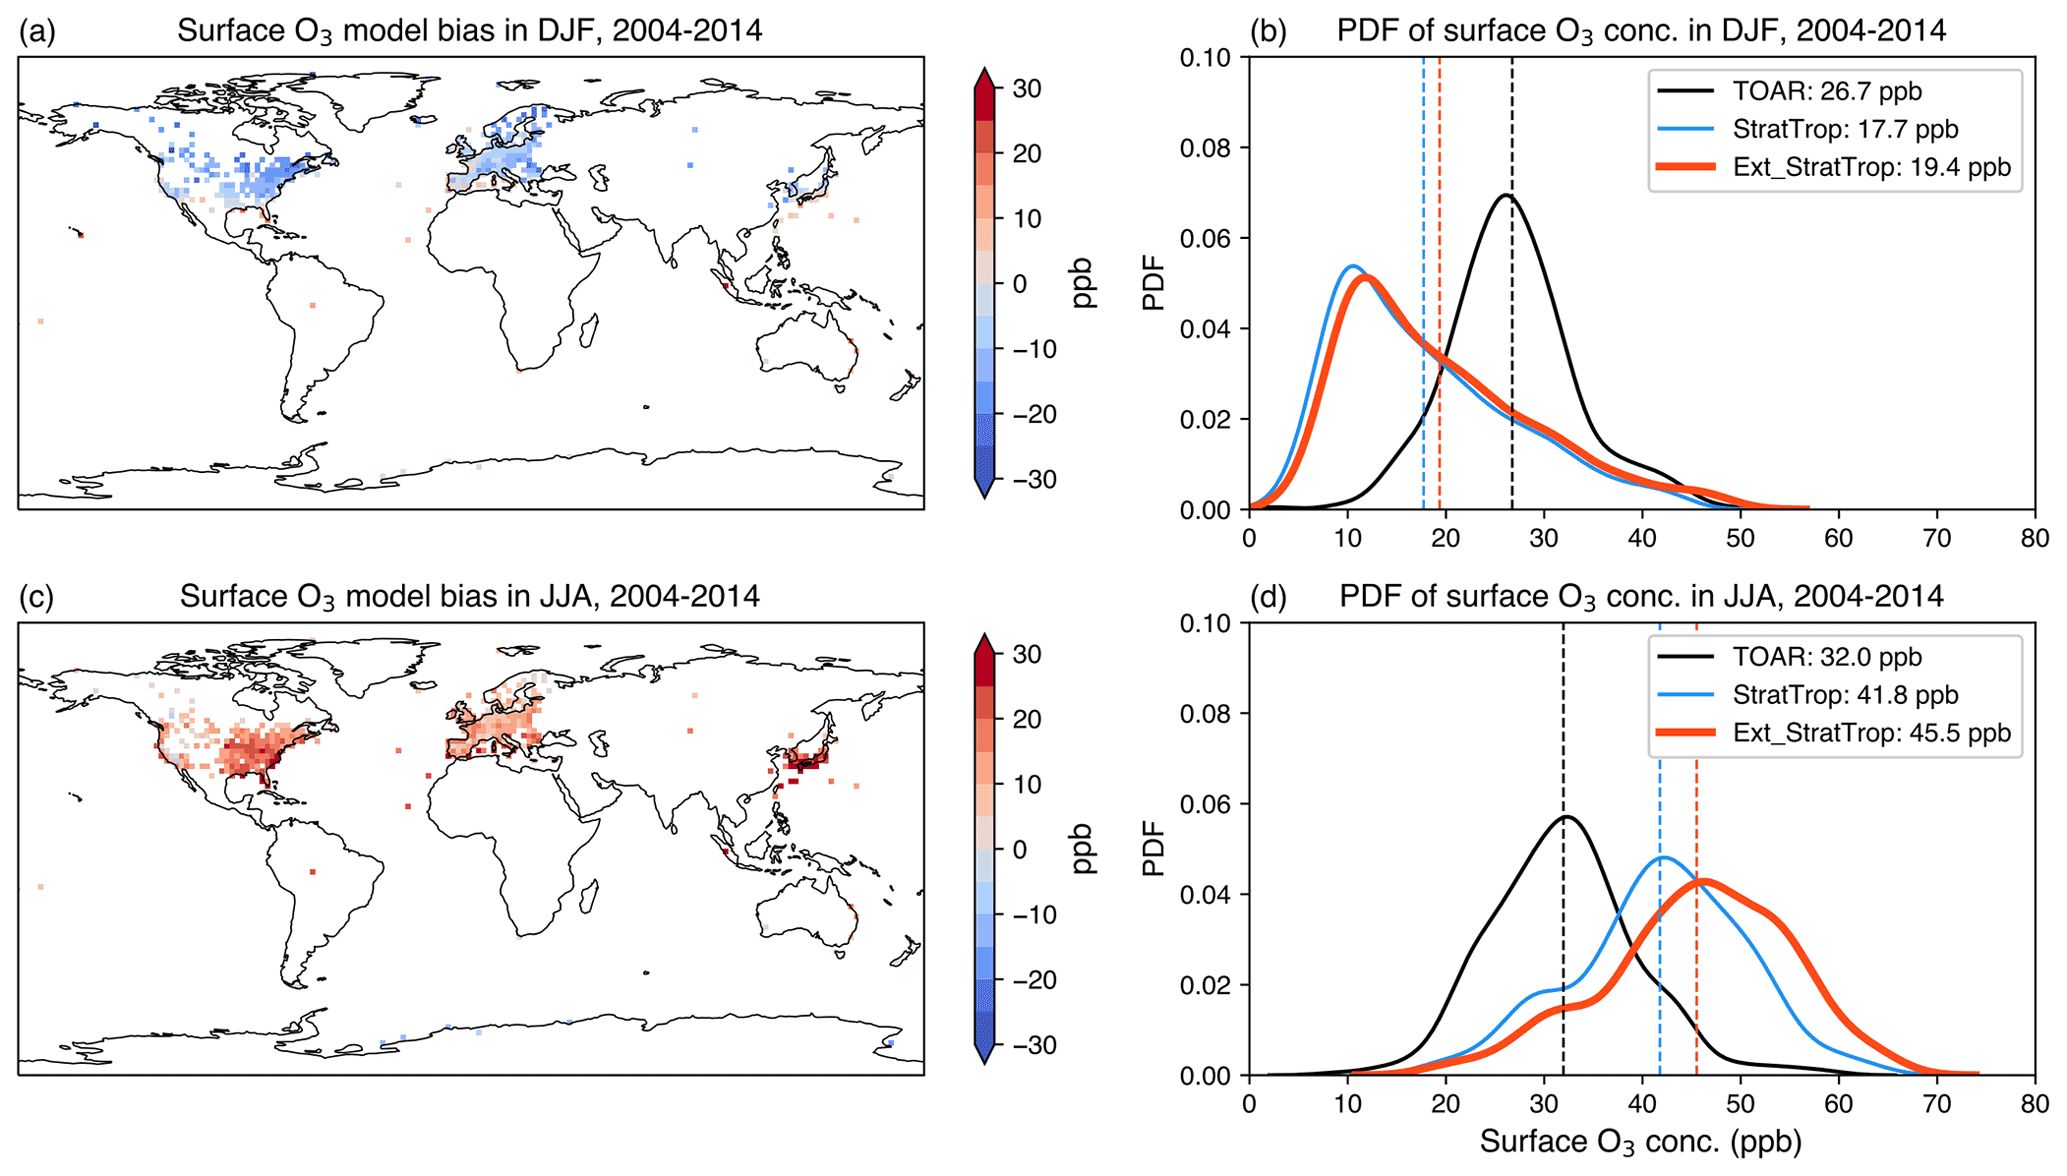
Figure 2Modelled surface O3 biases with the Ext_StratTrop chemistry scheme for winter (DJF) and summer (JJA) over 2004–2014 (a, c). Probability distribution function (PDF) of seasonal mean O3 mixing ratios between observations, StratTrop, and Ext_StratTrop chemistry schemes (b, d). Vertical dashed lines indicate seasonal mean surface O3 mixing ratios. Observations from the Tropospheric Ozone Assessment Report (TOAR) dataset (Schultz et al., 2017a) are used for comparison.
4.1 Emission changes
The SSP3-7.0 pathway is characterised by relatively strong emission controls in some parts of the world such as North America and Europe but weaker controls or emission increases elsewhere. Increases in NOx and VOC emissions from anthropogenic and biomass burning sources are seen in Central and South America, North Africa, the Middle East, and South and East Asia (Fig. 3a, c). SSP3-7.0-lowCH4 has the same NTCF emissions as SSP3-7.0 but lower CH4 emissions that lead to lower CH4 mixing ratios (Table 2). SSP3-7.0-lowNTCF represents strong emission controls across the globe, with reductions in emissions in most major high-emission regions except for South Asia (Fig. 3b, d). Total BVOC emission changes are driven by changes in land use, vegetation, and temperature. Figure 3e and f show general increases in total BVOC emissions in most parts of the Northern Hemisphere except for South Asia in the future, which partly offset the decreased anthropogenic and biomass burning VOC emissions in North America and Europe. Similar BVOC emission changes are found under SSP3-7.0 and SSP3-7.0-lowNTCF relative to the present day as the climate change signal and carbon dioxide concentrations under future pathways are the same.
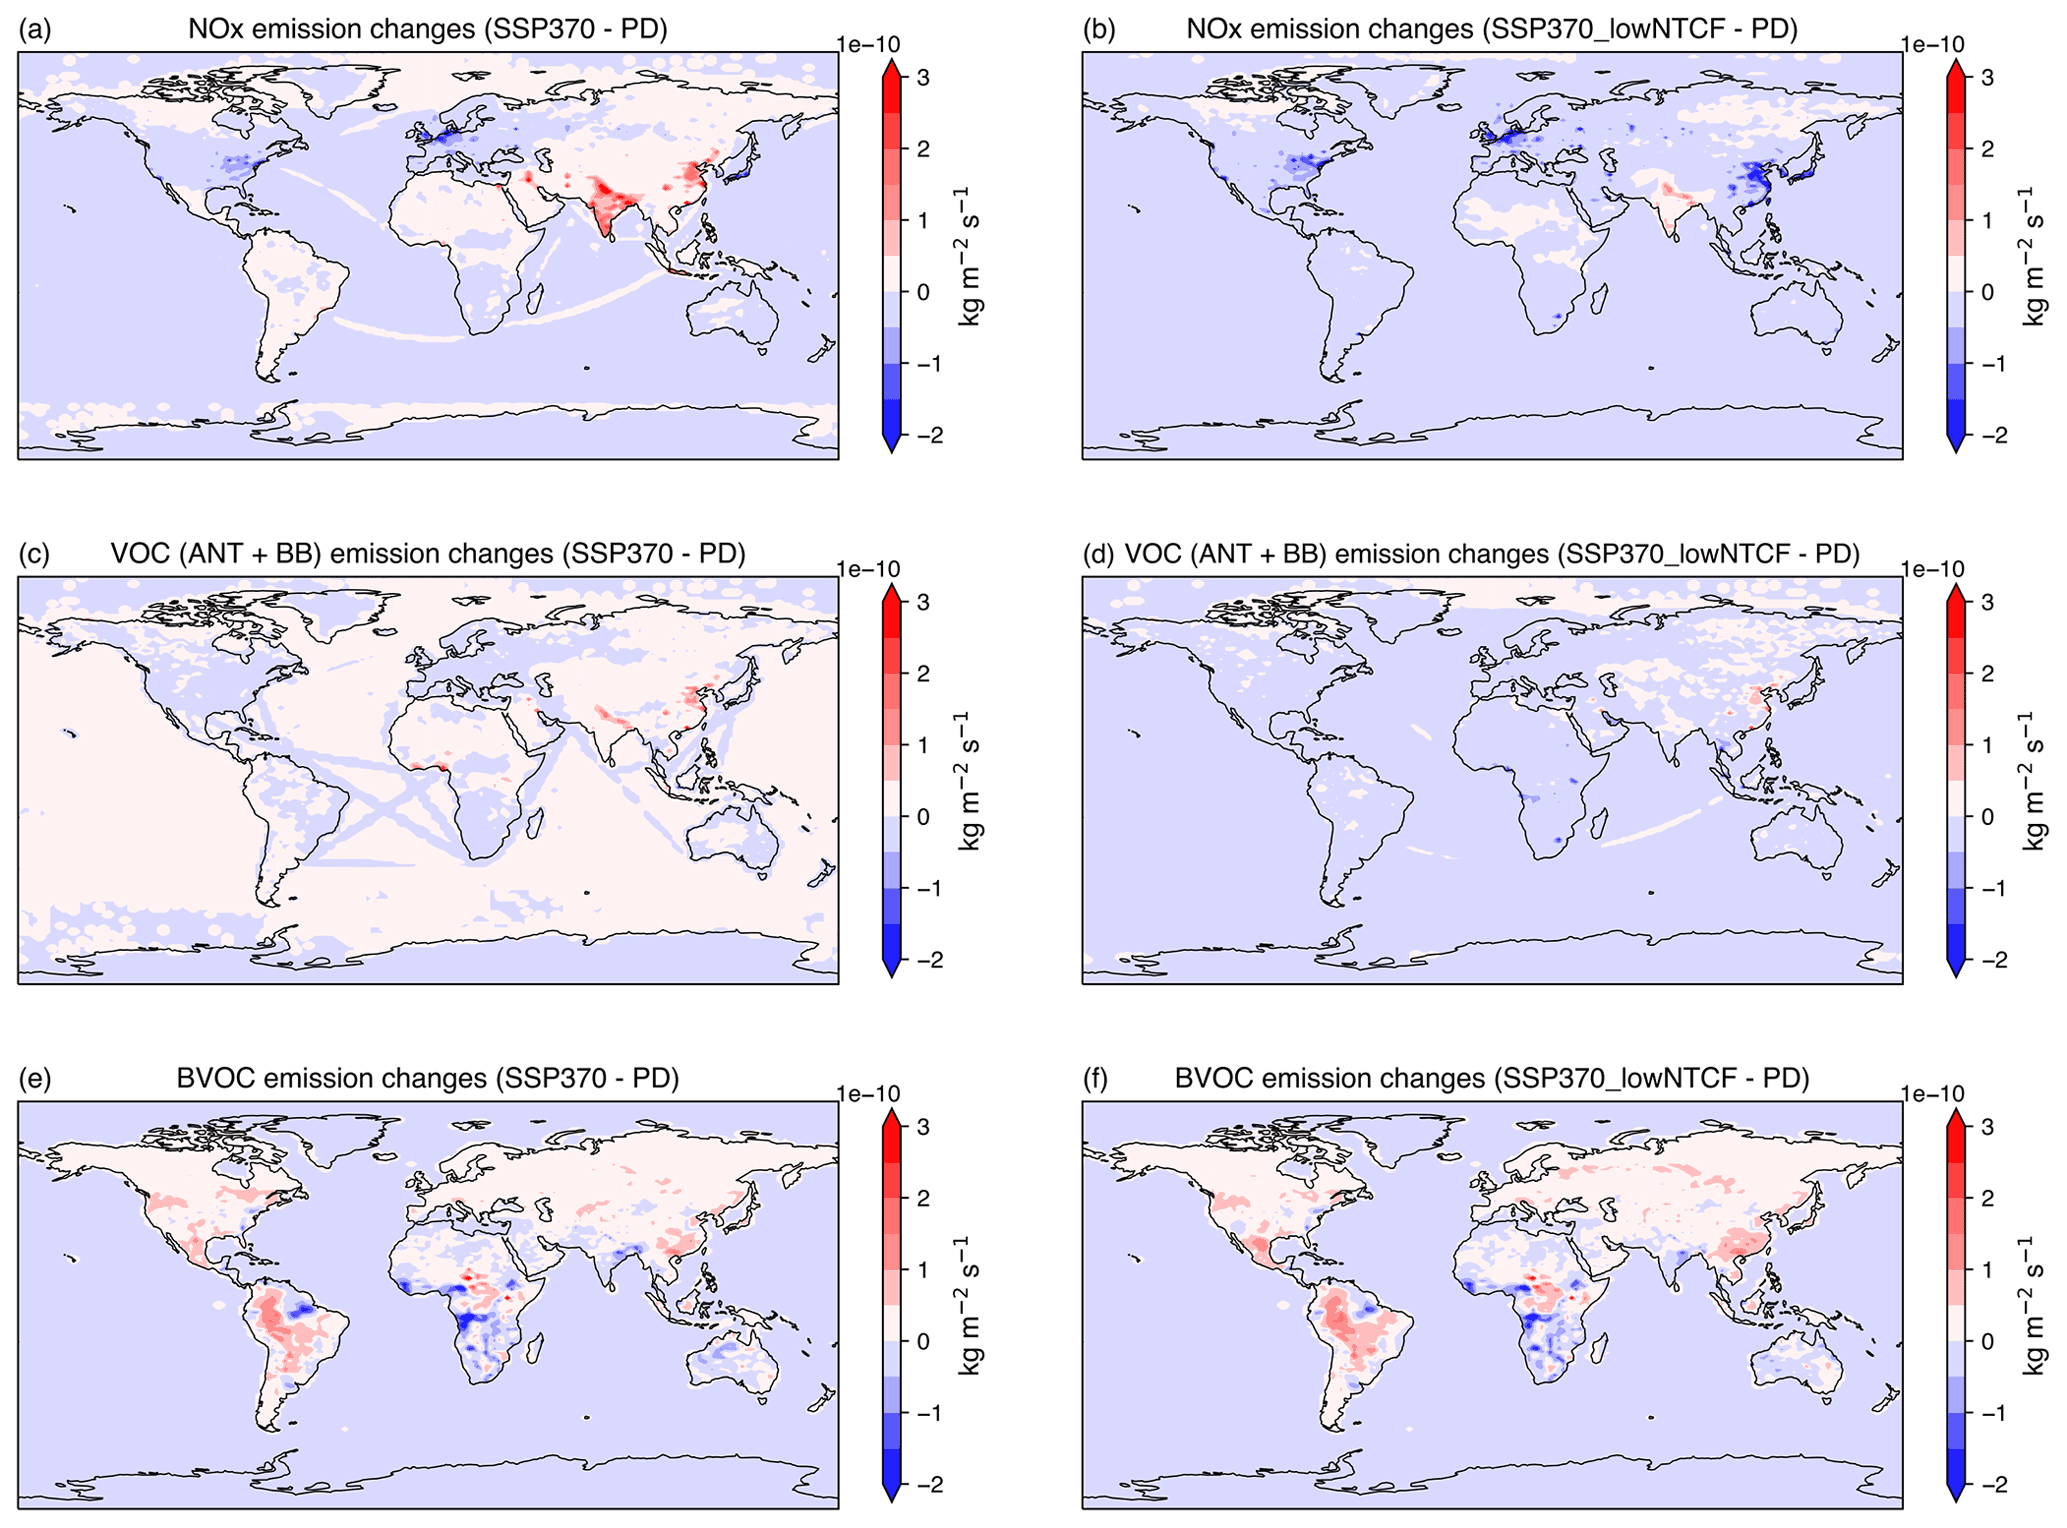
Figure 3Differences in annual mean surface emissions of NOx (a, b), anthropogenic and biomass burning VOCs (c, d) and total biogenic VOCs (e, f) between the present day (PD; 2004–2014) and SSP3-7.0 and SSP3-7.0-lowNTCF (2045–2055).
4.2 Tropospheric O3 changes
Changes in tropospheric O3 from the present day to the future are shown in Table 4. Changes in NTCF emissions control O3 burden changes with a 4 % increase in the O3 burden under SSP3-7.0 and a 7 % decrease under SSP3-7.0-lowNTCF relative to the present day. Changes in O3 production rates are also controlled by changes in NTCF emissions, and there is higher O3 production under SSP3-7.0 and lower O3 production under SSP3-7.0-lowNTCF. The decrease in the O3 burden (5 %) under SSP3-7.0-lowCH4 is slightly less than that under SSP3-7.0-lowNTCF (7 %) and shows that reductions in CH4 mixing ratios effectively reduce the tropospheric O3 burden despite high NTCF emissions under SSP3-7.0-lowCH4. O3 production rates under SSP3-7.0-lowCH4 are slightly higher than in the present day partly due to higher hydroxyl radical (OH) concentrations that promote O3 production. However, these higher O3 production rates are offset by higher O3 loss rates and result in lower O3 net production under SSP3-7.0 and SSP3-7.0-lowCH4. We find that the O3 chemical lifetime decreases slightly by 0.4–1.6 d under future pathways partly due to decreased O3 net production and partly due to increased O3 loss associated with higher temperature and humidity in a warmer climate (Young et al., 2018). Changes in O3 dry-deposition rates principally reflect changes in surface O3 mixing ratios, although high temperatures under a warmer climate may reduce O3 deposition rates due to vegetation stress (Lin et al., 2020).
Table 4Comparison of the tropospheric O3 budget under present-day (2004–2014) and future conditions (2045–2055).

4.3 Surface seasonal O3 changes
Seasonal differences in simulated surface O3 mixing ratios between the present day (2004–2014) and future pathways (2045–2055) are shown in Fig. 4a–f, along with a comparison between SSP3-7.0 and SSP3-7.0-lowCH4 (Fig. 4g, h). SSP3-7.0 represents less stringent emission control policies and has slightly higher global mean O3 mixing ratios (0.7–0.9 ppb; Fig. 4a, b) than the present day. In contrast, tightened emission controls under SSP3-7.0-lowNTCF reduce surface O3 mixing ratios substantially across many parts of the world (3.3–5.2 ppb; Fig. 4c, d). The reduction in CH4 mixing ratios from 1803 to 1364 ppb under SSP3-7.0-lowCH4 relative to the present day successfully reduces O3 mixing ratios (2.7–3.5 ppb; Fig. 4e, f) for regions that show O3 increases under SSP3-7.0. SSP3-7.0-lowCH4 with reduced CH4 mixing ratios alone shows uniform O3 decreases across the globe (3.4–4.4 ppb; Fig. 4g, h) compared with SSP3-7.0, where mean CH4 mixing ratios are 2472 ppb, and this offsets high O3 levels in regions with high NTCF emissions. This demonstrates the importance of CH4 in governing surface O3 mixing ratios and the need to account for CH4 in mitigating O3 pollution in future (Fiore et al., 2008; Allen et al., 2021). We highlight that O3 changes vary by season. From Fig. 4a and c we can see that O3 mixing ratios generally increase in winter in continental areas such as North America and Europe under SSP3-7.0 and SSP3-7.0-lowNTCF. These regions have large reductions in NTCF emissions under future pathways, and thus there is less O3 titration due to lower NOx emissions in these regions. Since NOx emissions decrease in East Asia under SSP3-7.0-lowNTCF, we also see O3 increases in winter in this region. This highlights that NOx emission reductions are not beneficial for reducing surface O3 mixing ratios in winter. Conversely, NOx emission increases under SSP3-7.0 lead to O3 decreases in winter in South and East Asia for the same reason. The situation is different in summer, with O3 decreases in North America and Europe but O3 increases in South and East Asia under SSP3-7.0 (Fig. 4b). This demonstrates a shift in O3 sensitivity from VOC limitation in winter to NOx limitation in summer. O3 changes in summer and winter are generally consistent in South America and Africa and reflect NOx limitation in these regions throughout the year. For regions that are projected to have lower NOx emissions in SSP3-7.0-lowNTCF, such as eastern China, we note that O3 mixing ratios increase in both winter and summer. The industrial regions of China are in VOC-limited regimes throughout the year, and thus decreased NOx emissions increase O3 mixing ratios (Jin and Holloway, 2015; Wang et al., 2021; Liu et al., 2021). This suggests that reductions in both NOx and VOC emissions may be needed to reduce O3 in these regions.
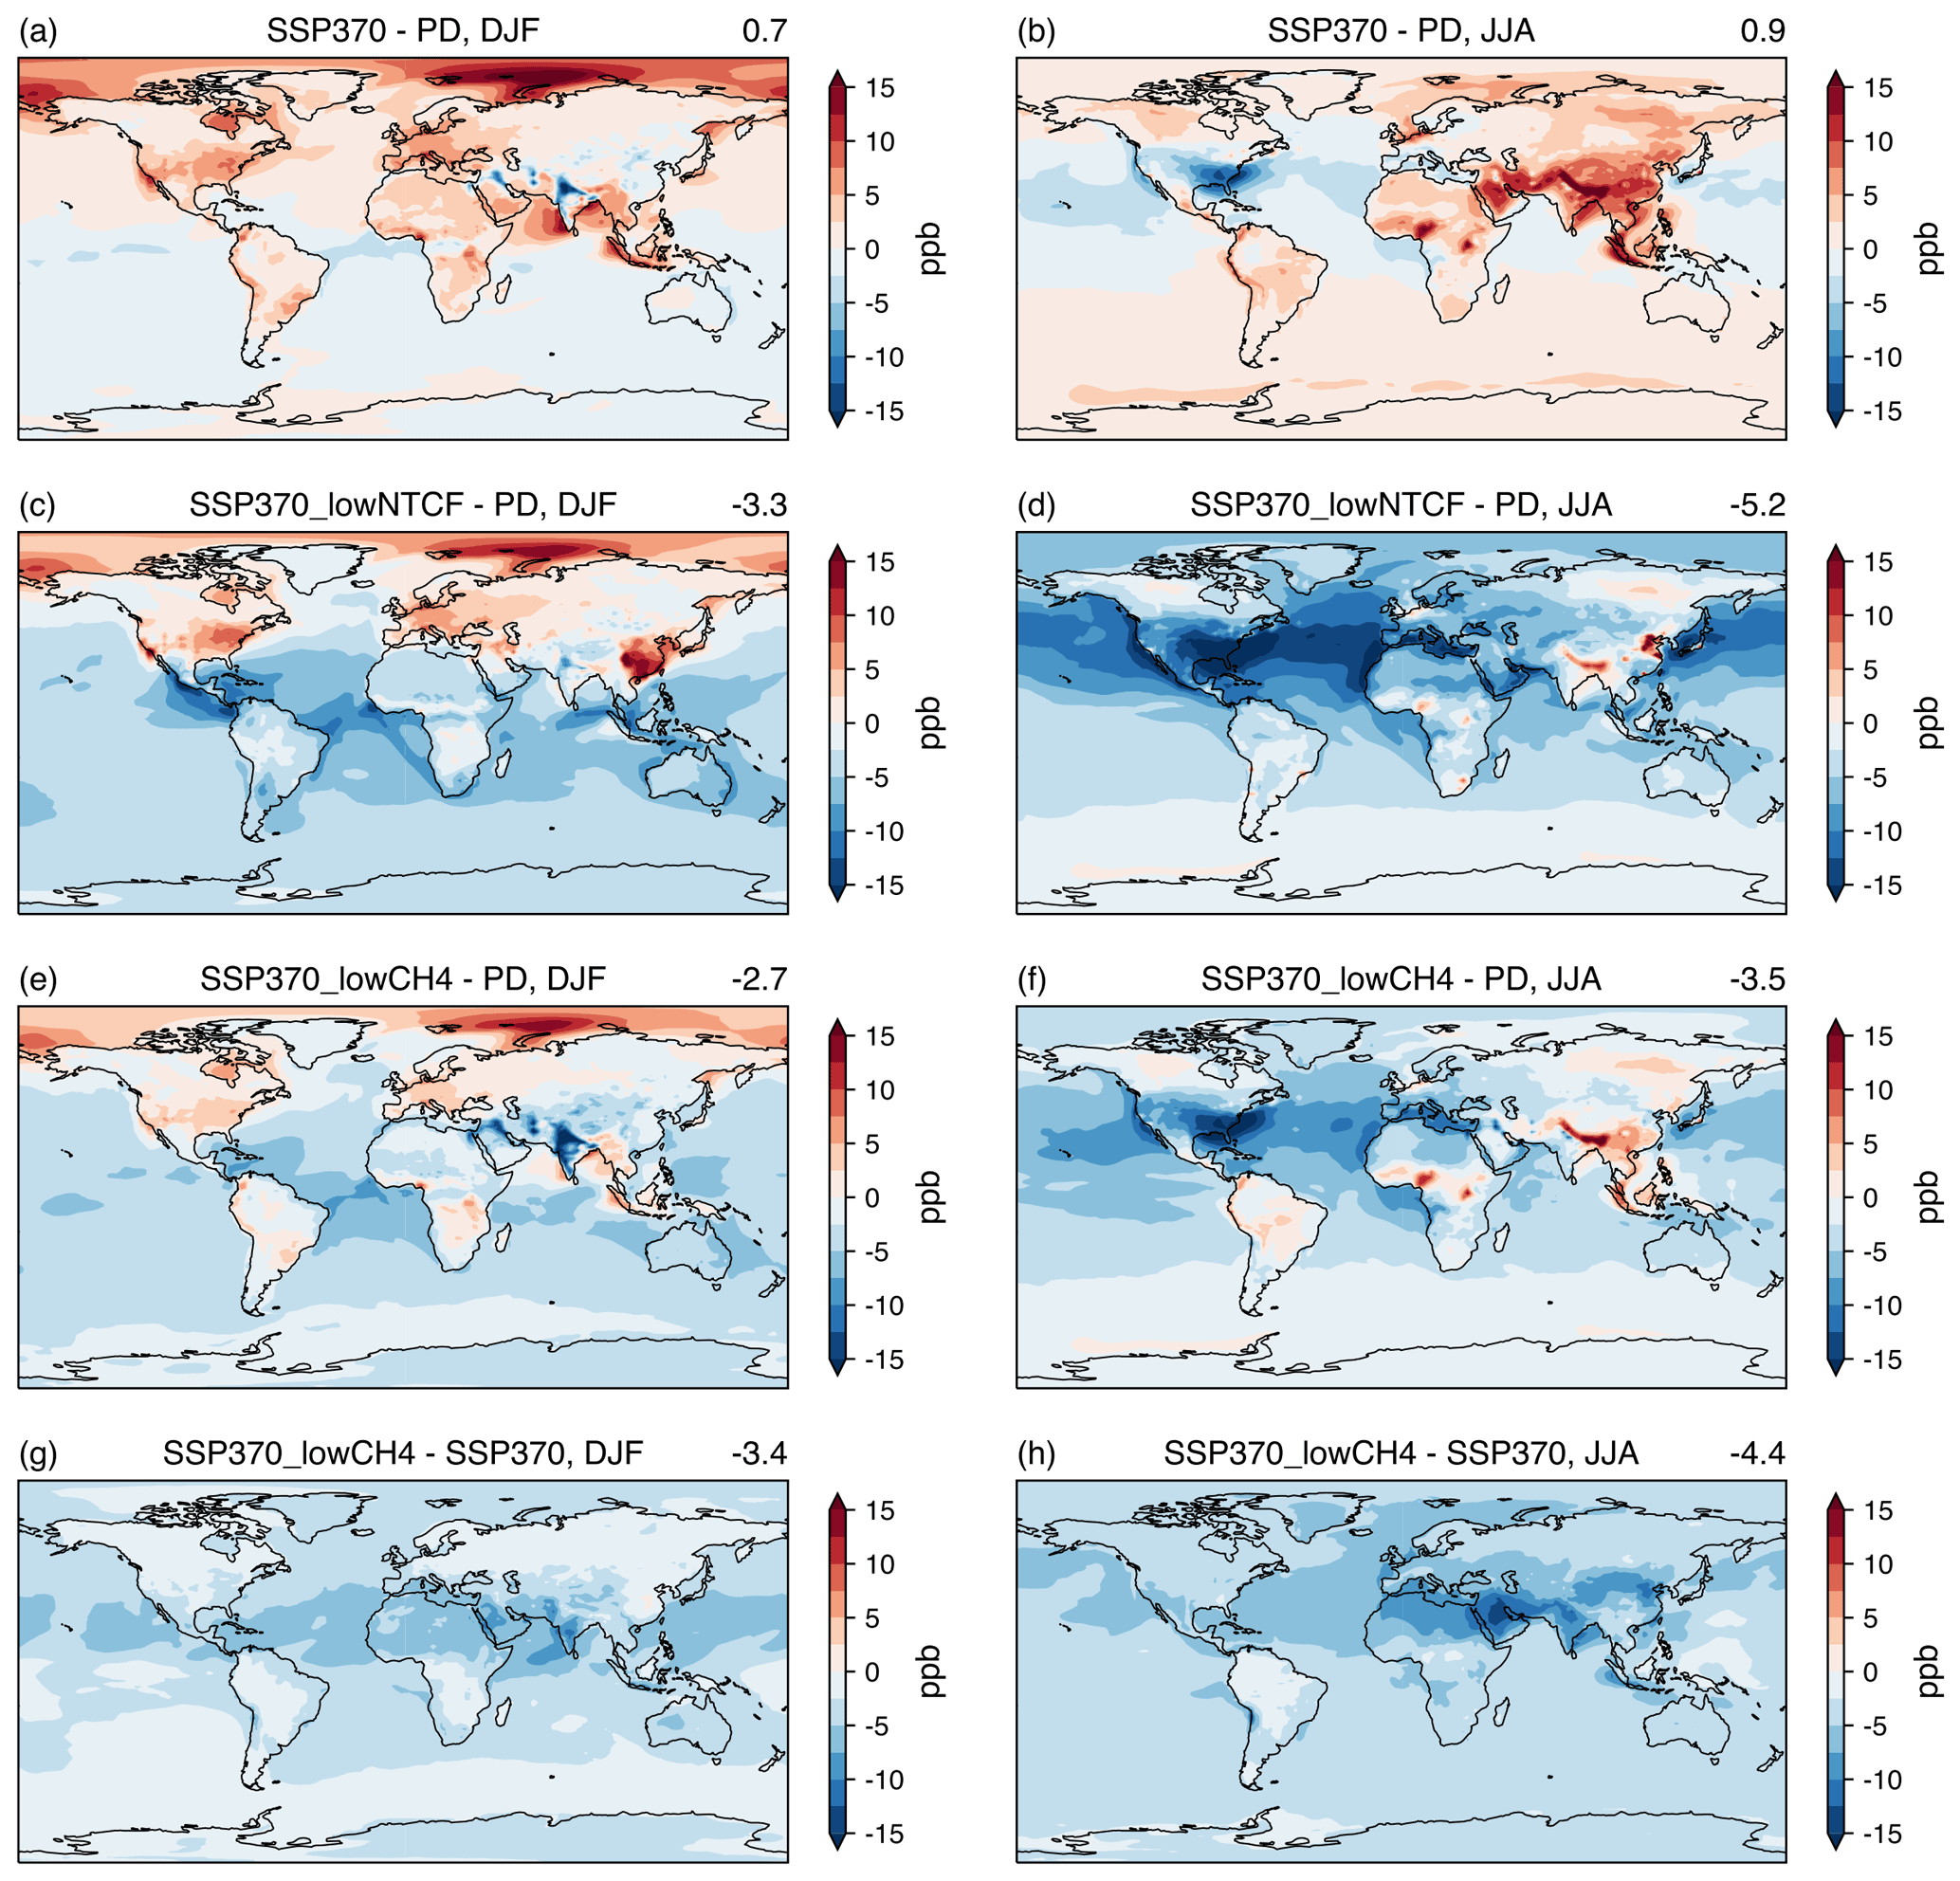
Figure 4Differences in seasonal mean surface O3 mixing ratios between the present day (PD; 2004–2014) and the future SSP3-7.0 (a, b), SSP3-7.0-lowNTCF (c, d), and SSP3-7.0-lowCH4 (e, f) (2045–2055) in winter (DJF) and summer (JJA). Differences between SSP3-7.0 and SSP3-7.0-lowCH4 are shown (g, f) to isolate the impacts of reduced CH4 mixing ratios. Absolute global mean O3 changes (ppb) are shown at the top right of each panel.
Surface O3 mixing ratios are also influenced by climate change, reflecting changing natural emissions, O3 production and destruction rates, and O3 deposition rates (Doherty et al., 2013, 2017). Global annual mean surface O3 mixing ratios decrease by 1 ppb with a 1.5 ∘C temperature rise but show little change in continental areas (Naik et al., 2021). This is principally due to increased humidity and greater O3 destruction in oceanic areas, but in continental areas these effects may be offset by O3 increases due to higher soil NOx (Romer et al., 2018) and BVOC emissions and by decreased O3 deposition rates (Lin et al., 2020). O3 mixing ratios can also be impacted by more frequent and intense heat waves under a warmer climate (Schnell and Prather, 2017; Ma et al., 2019). We find that the resulting changes in surface O3 mixing ratios in continental regions due to climate change are relatively small, and a reduction in anthropogenic emissions is the dominant factor governing surface O3 mixing ratios in the near future.
We also examine daytime and nighttime O3 changes for different regions under future pathways because daytime O3 mixing ratios are typically more relevant for human health. For daytime O3 we consider the maximum daily average 8 h O3 mixing ratio (MDA8), an important metric used to evaluate O3 impacts on human health. Nighttime O3 mixing ratios are correspondingly given by the minimum daily average 8 h O3 mixing ratio (MIN8). We show a comparison of the changes in these metrics in Fig. 5.
In general, differences in global mean O3 changes are relatively small in both daytime and nighttime under all pathways. However, in South and East Asia with increased NOx emissions under SSP3-7.0 and SSP3-7.0-lowCH4, O3 mixing ratios tend to increase in daytime but show smaller increases or reduction at night. This demonstrates the impact of O3 titration by NO at nighttime in high-NOx environments. In North America and Europe, which have lower NOx emissions in the future, daytime O3 mixing ratios decrease greatly in summer, but daytime and nighttime changes are similar in winter, demonstrating the large influence of NOx emissions on summer daytime O3 mixing ratios. The substantial differences between daytime and nighttime O3 changes suggest that the underlying impacts of O3 changes on human health are likely to be larger than those estimated using seasonal mean O3 mixing ratios, and this is particularly important for high-emission areas with increased NOx emissions in the future.

Figure 5Seasonal mean maximum daily average 8 h (MDA8) and minimum daily average 8 h (MIN8) surface O3 changes for North America, Europe, South Asia, East Asia, and the globe from the present day (PD; 2004–2014) to SSP3-7.0 (a), SSP3-7.0-lowNTCF (b), and SSP3-7.0-lowCH4 (c) (2045–2055). DJF and JJA situations are shown with blue and red bars, respectively.
Non-linearity in chemical O3 formation can result in differences in the effectiveness of emission control strategies regionally and may aggravate O3 pollution issues. We therefore investigate O3 sensitivity for the present day and the future, as it is important to understand how O3 mixing ratios will respond to changing emissions. Ratios of NOx and VOC mixing ratios provide a useful indicator of regional O3 sensitivity regimes. Here we quantify the critical ratio that distinguishes VOC-limited and NOx-limited regimes by examining monthly mean surface O3 mixing ratios and net chemical production rates as a function of monthly mean NOx and VOC mixing ratios; see Fig. 6. Monthly mean O3 mixing ratios and net production rates in the lowest model layer from all months and all scenarios are used to plot the figure. For NOx we use the sum of NO and NO2 mixing ratios, and for total VOC we use the sum of the mixing ratios of primary emitted VOC species. CO and CH4 are not included due to their relatively low reactivity. We classify NOx and VOC mixing ratios in each model grid cell into 150 bins on a logarithmic scale ranging from 0.01 ppb to 100 ppb and calculate mean O3 mixing ratios and mean O3 net chemical production rates in each NOx–VOC bin. Approximate thresholds of monthly mean ratios for O3 sensitivity are shown in Fig. 6, ranging from 0.6 to 1 with a central value of 0.8. We hence apply a threshold value of 0.8 to distinguish O3 sensitivity regimes hereafter. Areas above the threshold represent VOC-limited regimes in which increased NOx emissions reduce O3 mixing ratios and O3 production rates, and areas below the threshold represent NOx-limited regimes. We find the highest O3 mixing ratios and O3 production close to the threshold line, demonstrating that the threshold values are consistent and that the approach is robust.
We further investigate O3 sensitivity for different regions. The regions considered here are those defined for the Task Force on Hemispheric Transport of Air Pollutants Phase 2 (TF HTAP2; Janssens-Maenhout et al., 2015); see Fig. 7a. The regions dominating each part of the NOxVOC mixing ratio space are shown in Fig. 7b and c. We determine the dominant region contributing to each bin in NOx–VOC space based on the region contributing the greatest number of model grid cells to that bin. This approach reveals differences in regional O3 sensitivity. We also show the shift in O3 sensitivity in different regions between the present day (Fig. 7b) and the future (SSP3-7.0-lowNTCF; Fig. 7c) to demonstrate the impacts of decreased NTCF emissions on the evolution of O3 sensitivity on a regional basis.
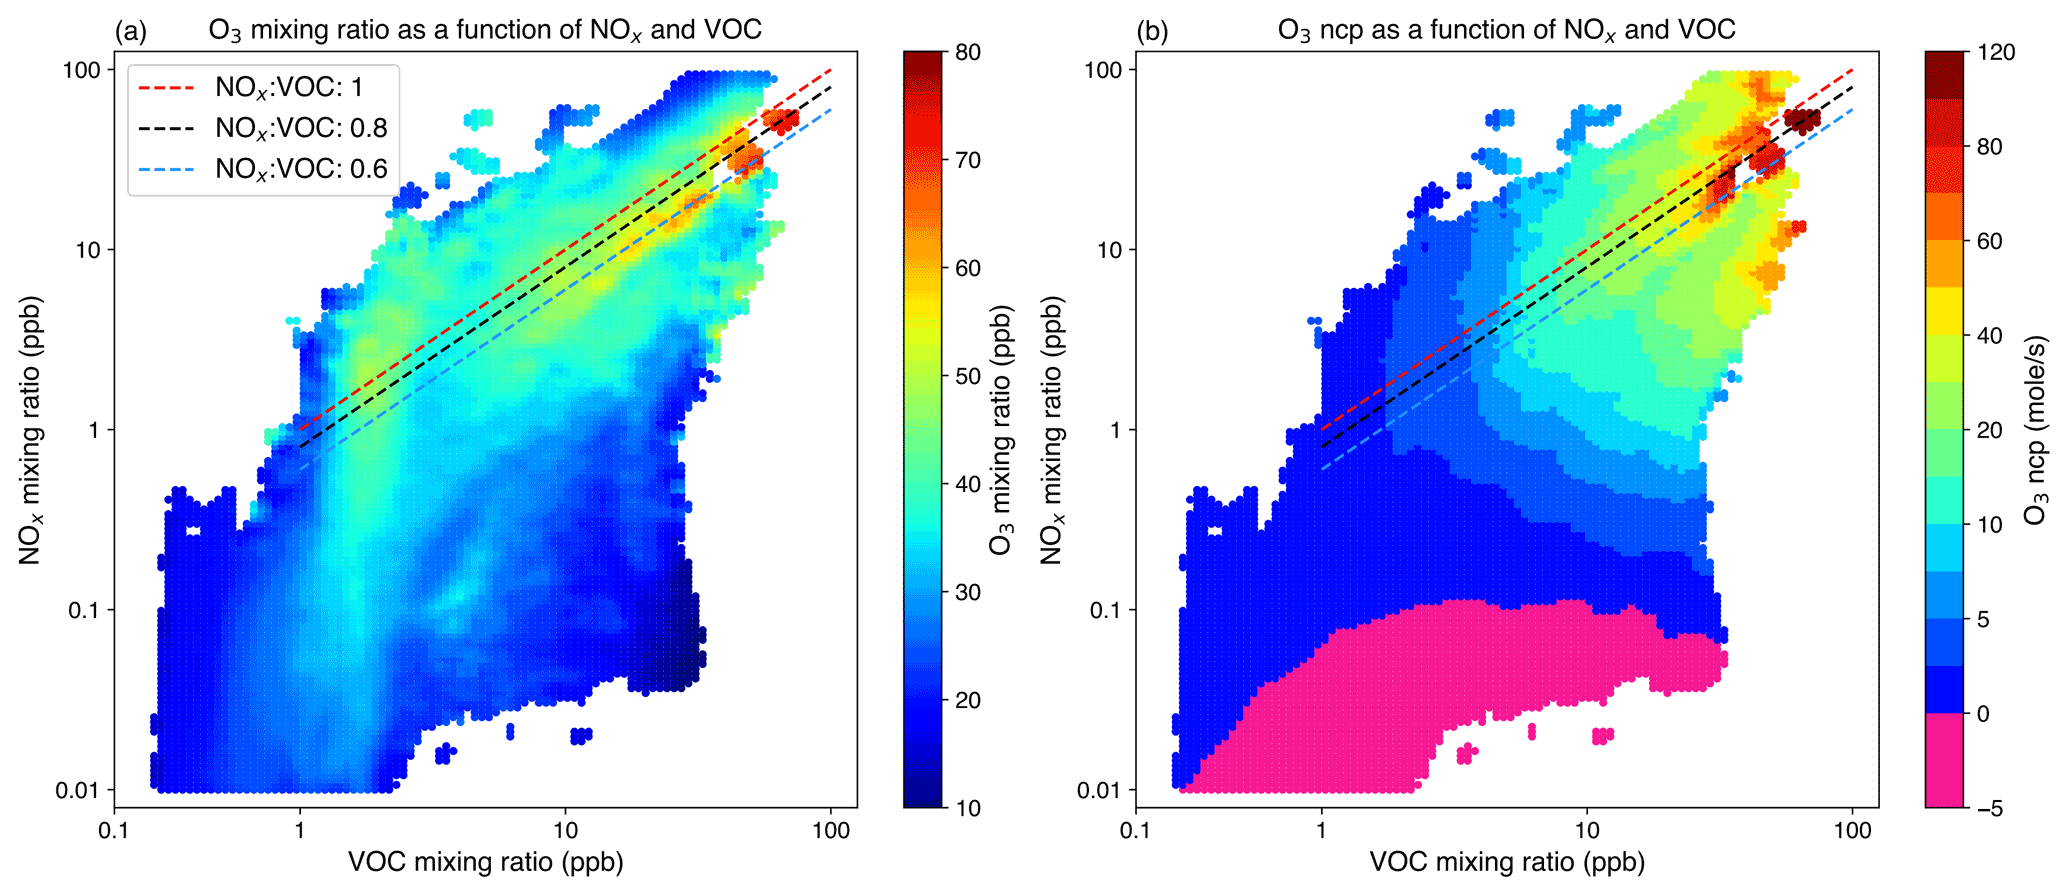
Figure 6Surface O3 mixing ratios (a) and O3 net chemical production (ncp) rates (b) as a function of monthly mean NOx and VOC mixing ratios. Monthly mean data for all months and all scenarios are used. The straight lines show the approximate thresholds of to distinguish VOC-limited (above the line) and NOx-limited (below the line) regimes.
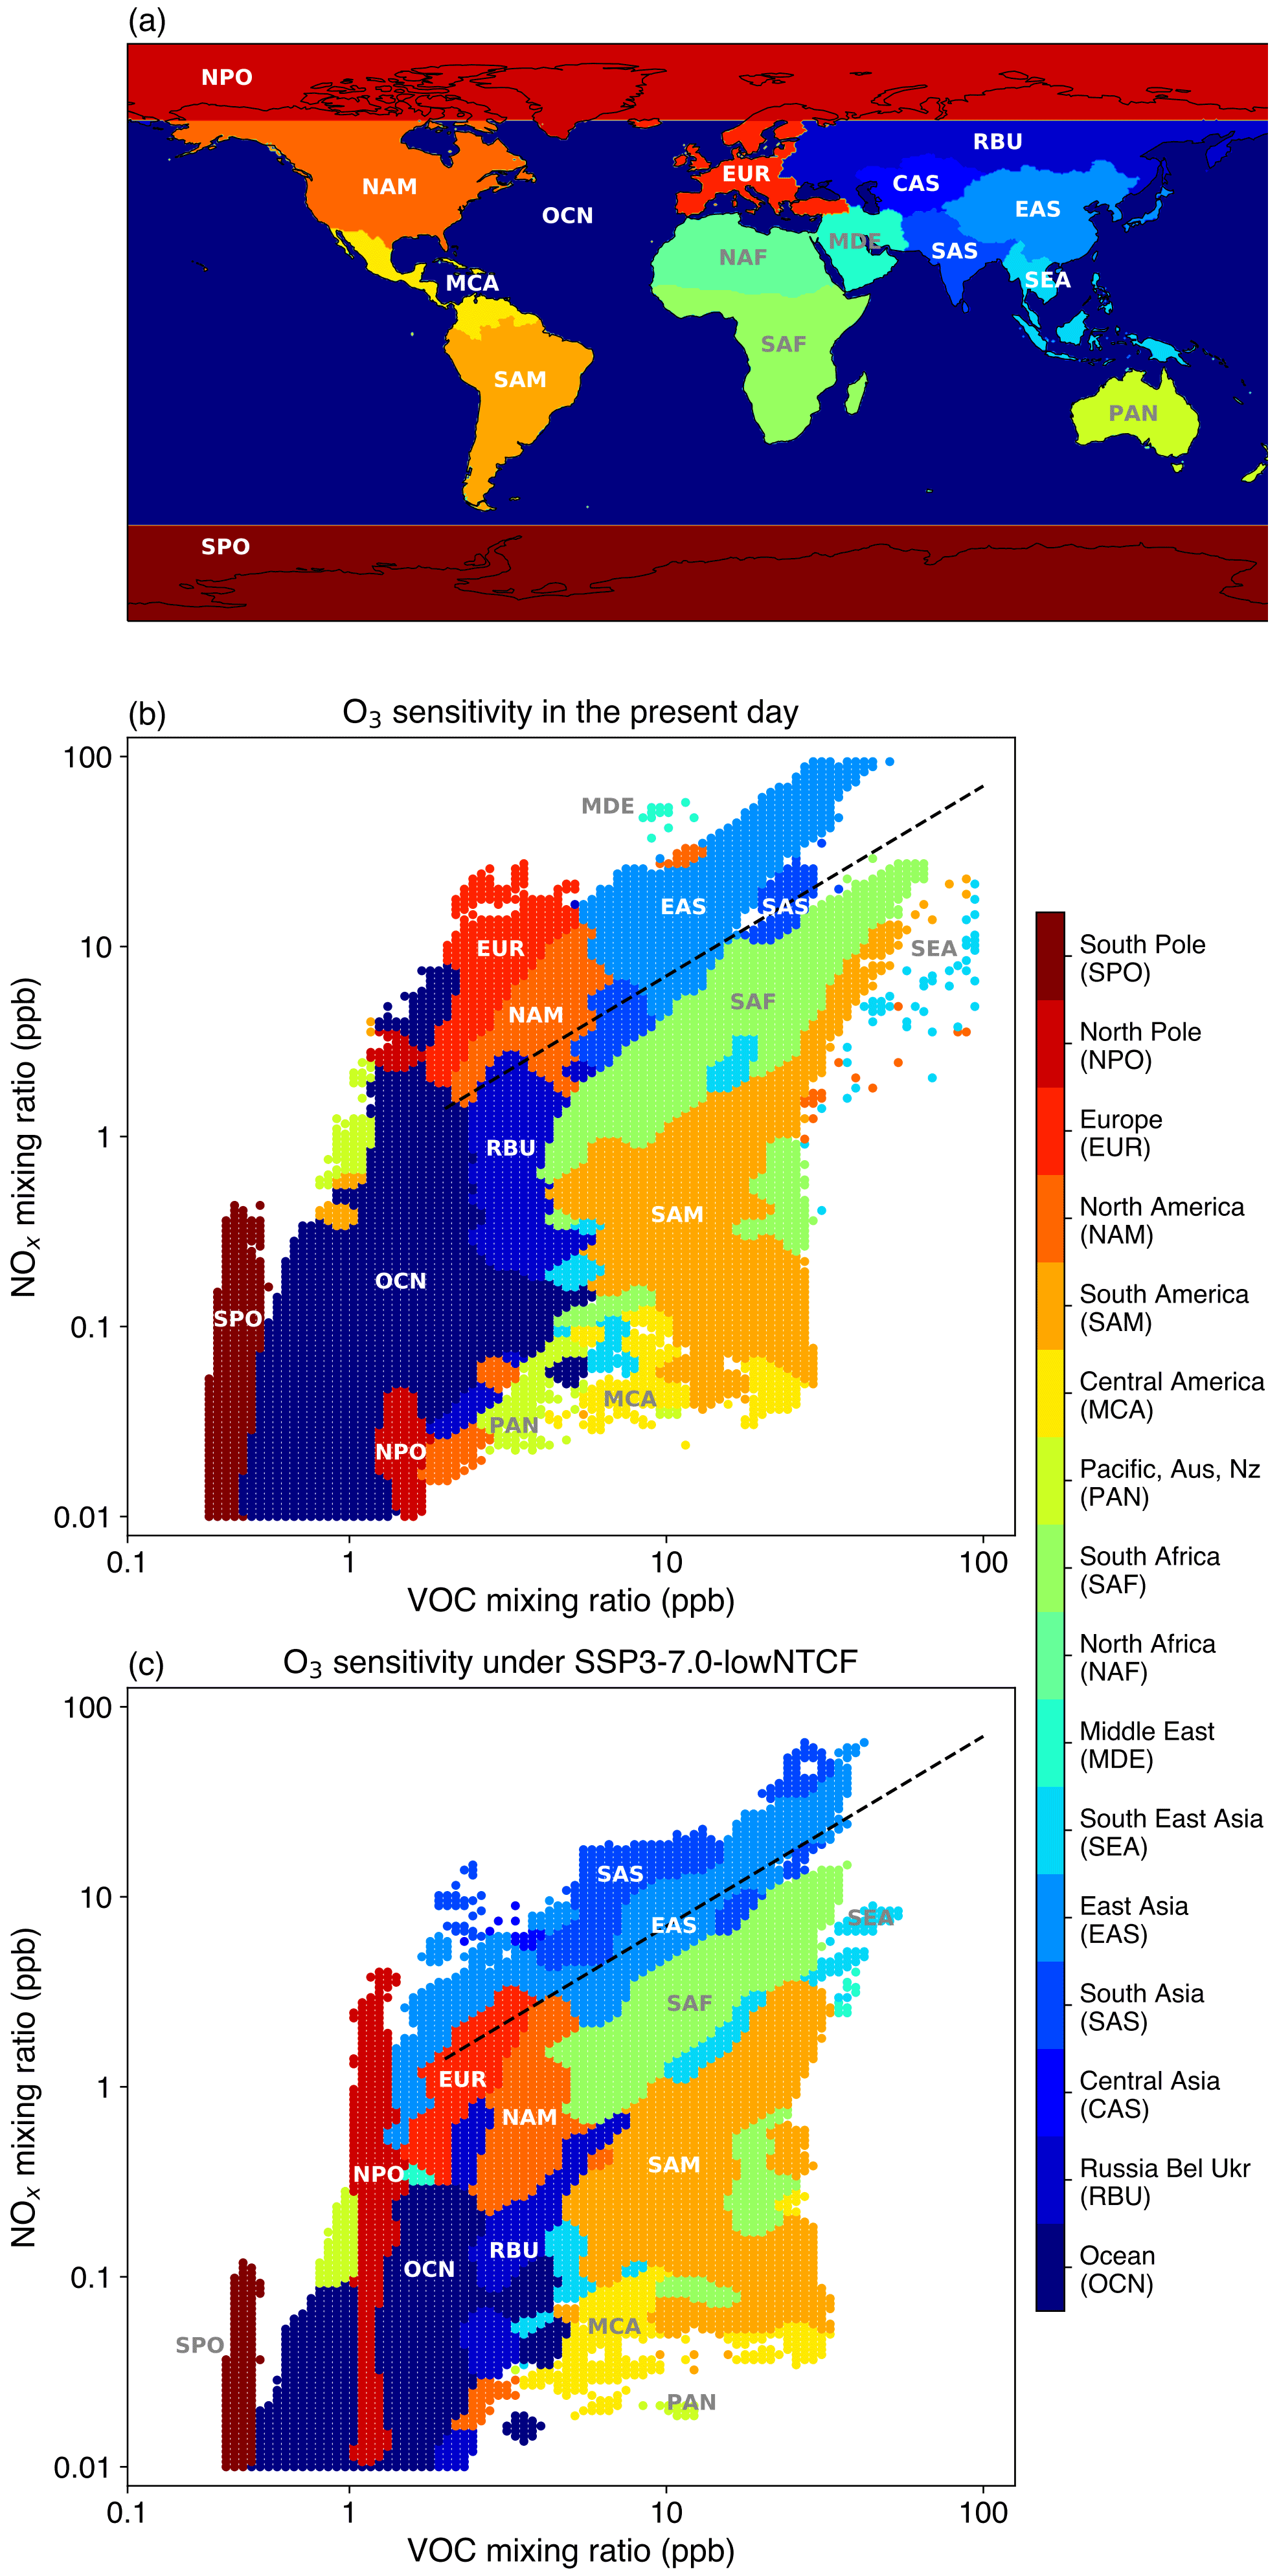
Figure 7Geographical regions defined in the Task Force on Hemispheric Transport of Air Pollutants Phase 2 (TF HTAP2) (a). Regions dominating each part of NOxVOC mixing ratio space in the present day (b) and under SSP3-7.0-lowNTCF (c). The straight line shows the threshold of 0.8. Monthly mean data for all months under each pathway are used to plot (b) and (c).
Figure 7b clearly shows that low-NOx and low-VOC environments are most common in oceanic and polar regions where surface O3 levels are typically low and where O3 production is NOx-limited. In contrast, Europe, North America, and East Asia dominate the high-NOx and high-VOC environments in the present day where O3 levels are high and O3 production is VOC-limited. Europe and North America have similar VOC mixing ratios, but NOx mixing ratios are generally higher in Europe than in North America, which results in Europe lying further above the threshold. This demonstrates that stricter controls on NOx emissions are required for Europe to shift from VOC-limited to NOx-limited regimes than for North America. East Asia dominates VOC-limited regimes due to much higher NOx and VOC mixing ratios than other regions. Parts of South Asia and the Middle East are also VOC-limited. Major biogenic emission source regions such as South America, South Africa, and South-East Asia have high VOC mixing ratios but moderate levels of NOx, and the chemical environment is therefore NOx-limited.
The impacts of reductions in NTCF emissions are shown in Fig. 7c. We find that Europe and North America are no longer the most dominant VOC-limited regimes due to decreased NOx mixing ratios. East Asia is still a dominant VOC-limited region under SSP3-7.0-lowNTCF, but reduced NOx emissions shift parts of East Asia into NOx limitation. South Asia becomes the main VOC-limited region with relatively high NOx mixing ratios. South America, South Africa, and South-East Asia are still NOx-limited because there are no large NOx increases in these regions.
O3 sensitivity in major present-day VOC-limited regions under different scenarios is shown in Fig. 8. Reductions in NOx emissions are important and effective in transforming VOC limitation to NOx limitation, reflected in large NOx-limited areas in Europe and North America under all scenarios. In contrast, most parts of East Asia are VOC-limited under SSP3-7.0 and SSP3-7.0-lowCH4 due to increased NOx emissions. Since changes in VOC mixing ratios are relatively small for all scenarios, they have little substantial influence on O3 sensitivity. Under future climate, increased biogenic VOC emissions in Europe and North America partly offset decreased anthropogenic and biomass VOC emissions and are hence beneficial to maintain an NOx-limited environment. We note that South Asia is the only region that is substantially VOC-limited in the future due to increased NOx emissions. Reductions in CH4 mixing ratios have relatively little impact on O3 sensitivity, although they greatly reduce surface O3 mixing ratios (Sect. 4.3).
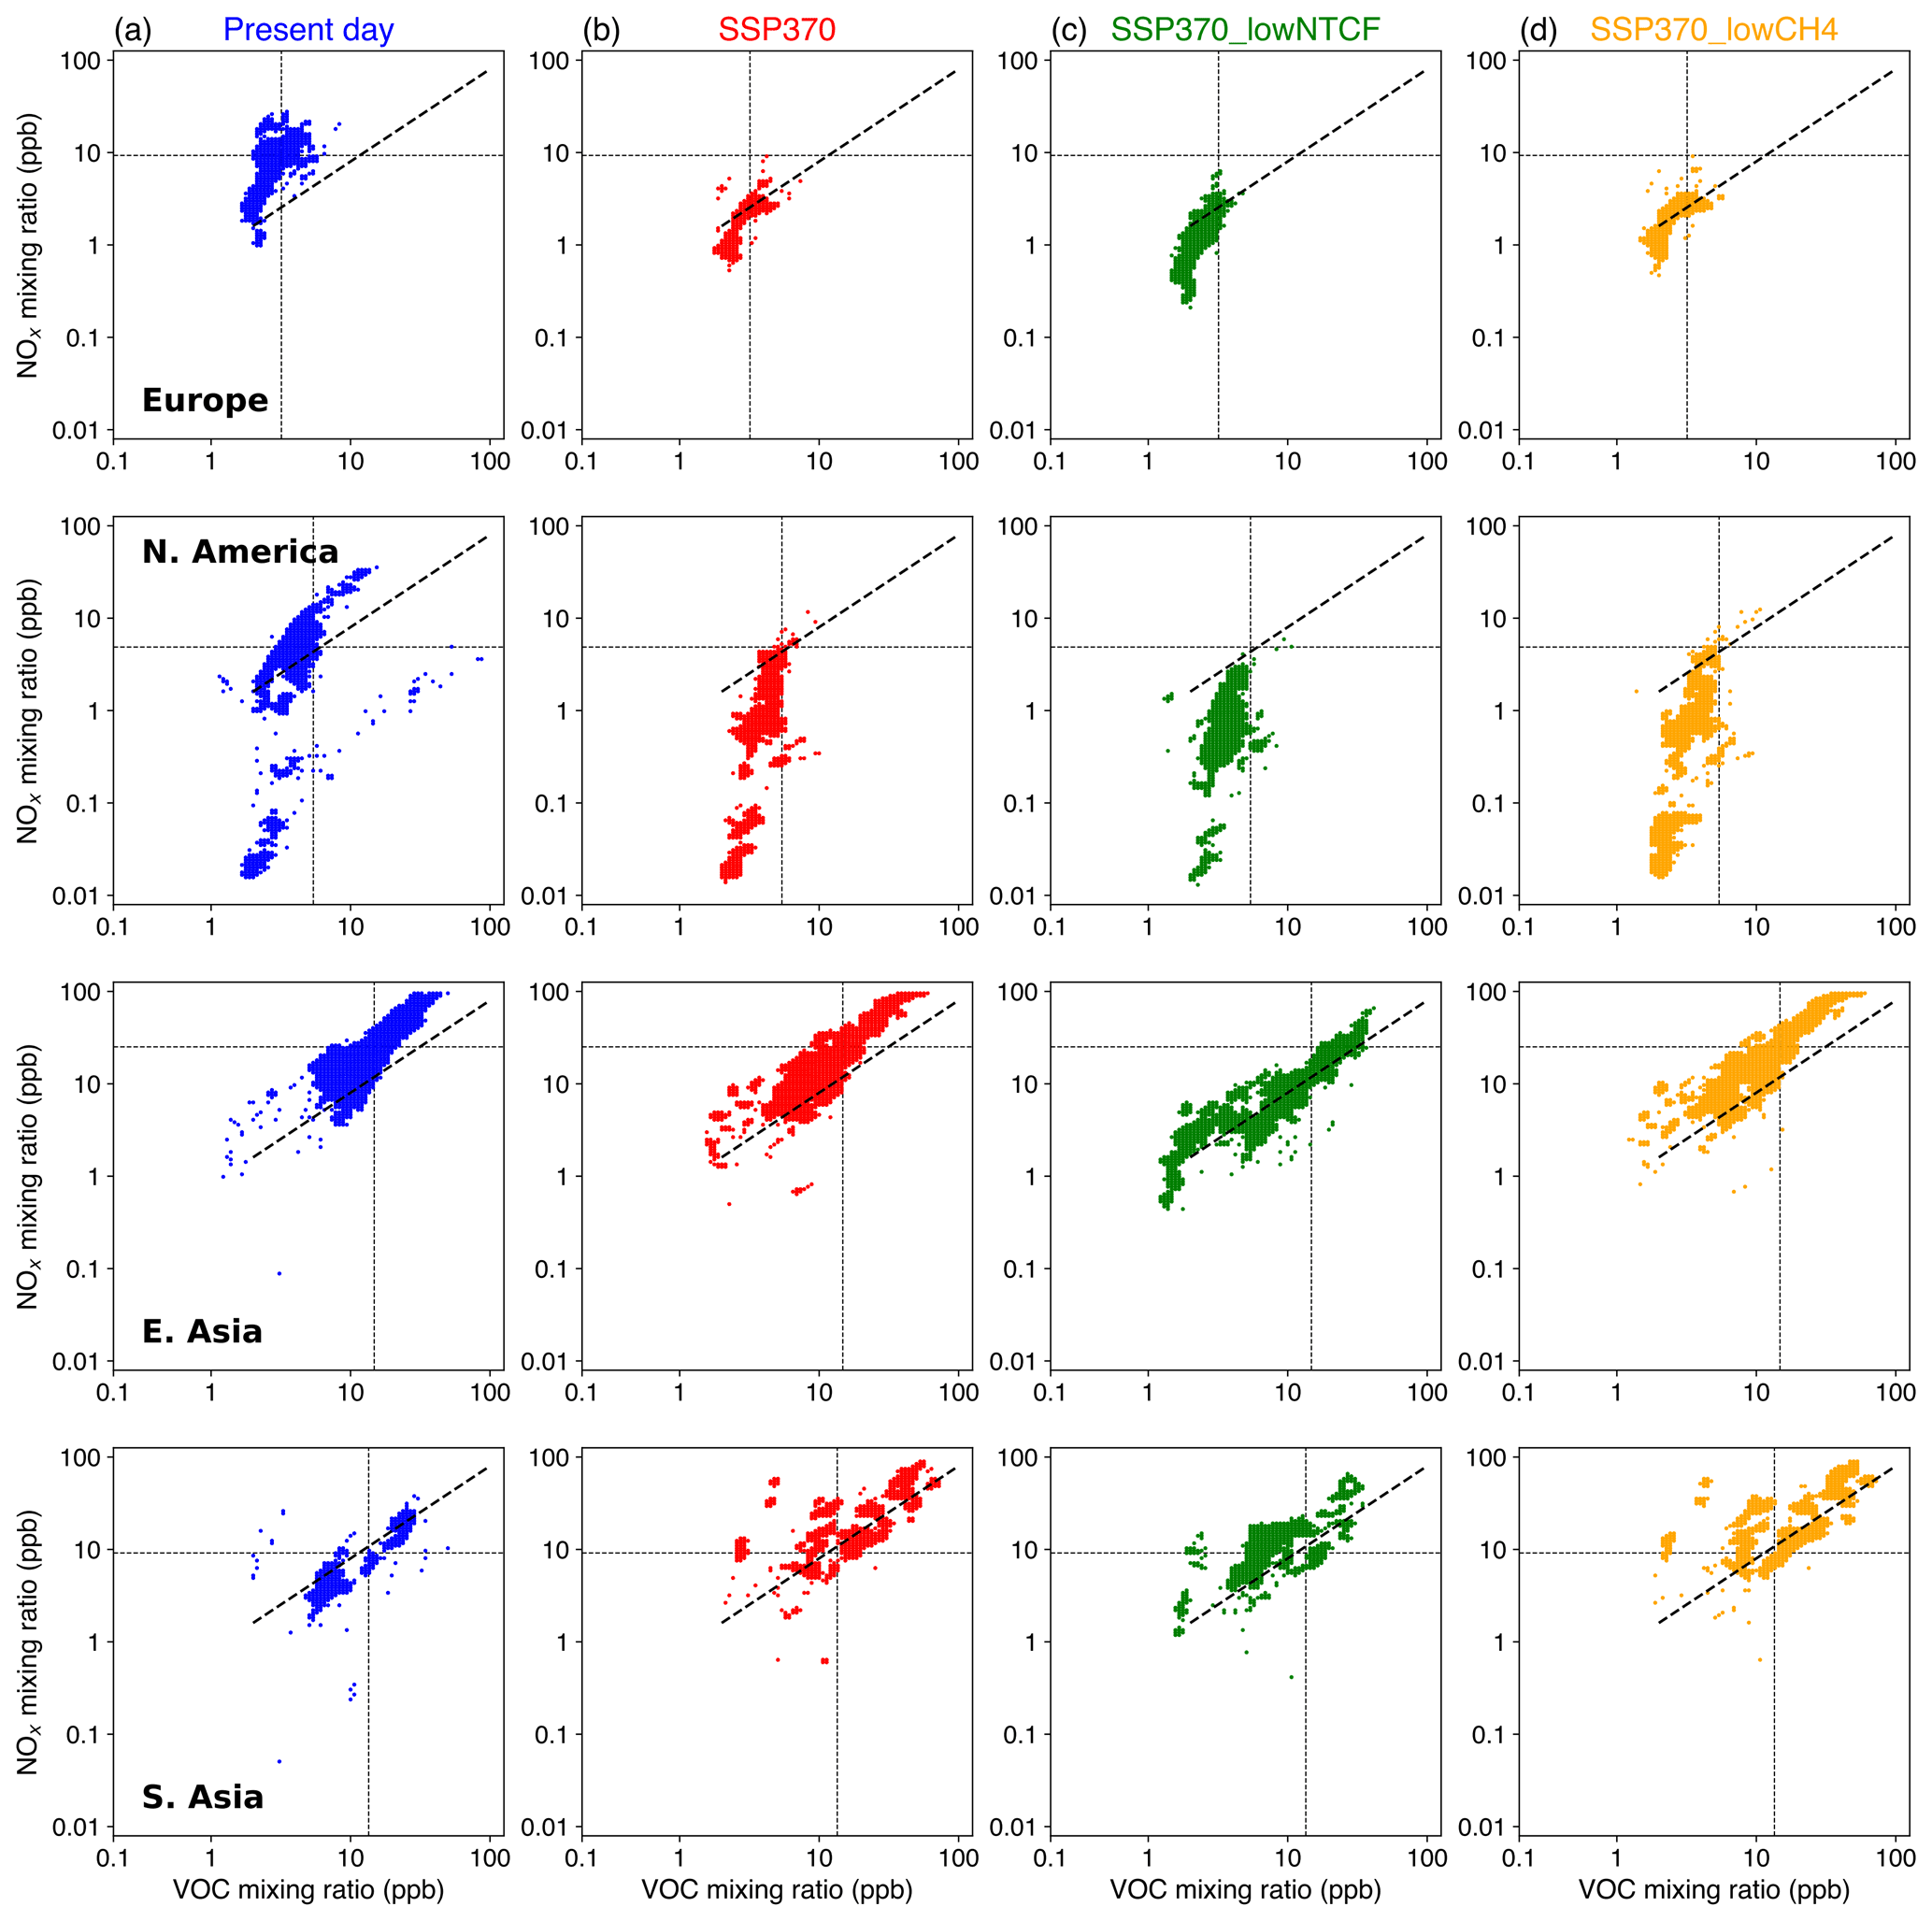
Figure 8O3 sensitivity across Europe, North America, East Asia, and South Asia in the present day (a) and under SSP3-7.0 (b), SSP3-7.0-lowNTCF (c), and SSP3-7.0-lowCH4 (d). The threshold of 0.8 is shown. Horizontal and vertical lines indicate regional mean NOx and VOC mixing ratios in the present day.
Global spatial distributions of annual O3 sensitivity in the present day and the future are shown in Fig. 9. VOC-limited regimes are represented by high ratios, reflecting relatively high NOx or low VOC mixing ratios. In the present day, high NOx emissions contribute to VOC limitation in large areas of North America, western and central Europe, and East Asia. While North America and Europe have lower NOx mixing ratios than East Asia, lower VOC mixing ratios still lead to VOC limitation. Only south-west parts of India are VOC-limited. In the future, O3 production in more areas of North America and Europe becomes NOx-limited. However, VOC-limited regimes in East Asia, particularly China, are persistent due to projected increases in NOx emissions until 2055 under SSP3-7.0 and SSP3-7.0-lowCH4. We find that reductions in CH4 mixing ratios have relatively little influence on O3 sensitivity over continental regions (Fig. 9b vs. d). We note that SSP3-7.0-lowNTCF shows the smallest VOC-limited areas across the globe. East Asia is still partly VOC-limited under this scenario, particularly in northern China (Fig. 9c), which indicates that further reductions in NOx emissions are required in addition to those expected in this region in the future (Fig. 3b).

Figure 9Spatial distributions of annual mean in the present day (2004–2014; a) and under SSP3-7.0 (b), SSP3-7.0-lowNTCF (c), and SSP3-7.0-lowCH4 (d) (2045–2055). An threshold ratio of 0.8 is used here to distinguish O3 sensitivity regimes.
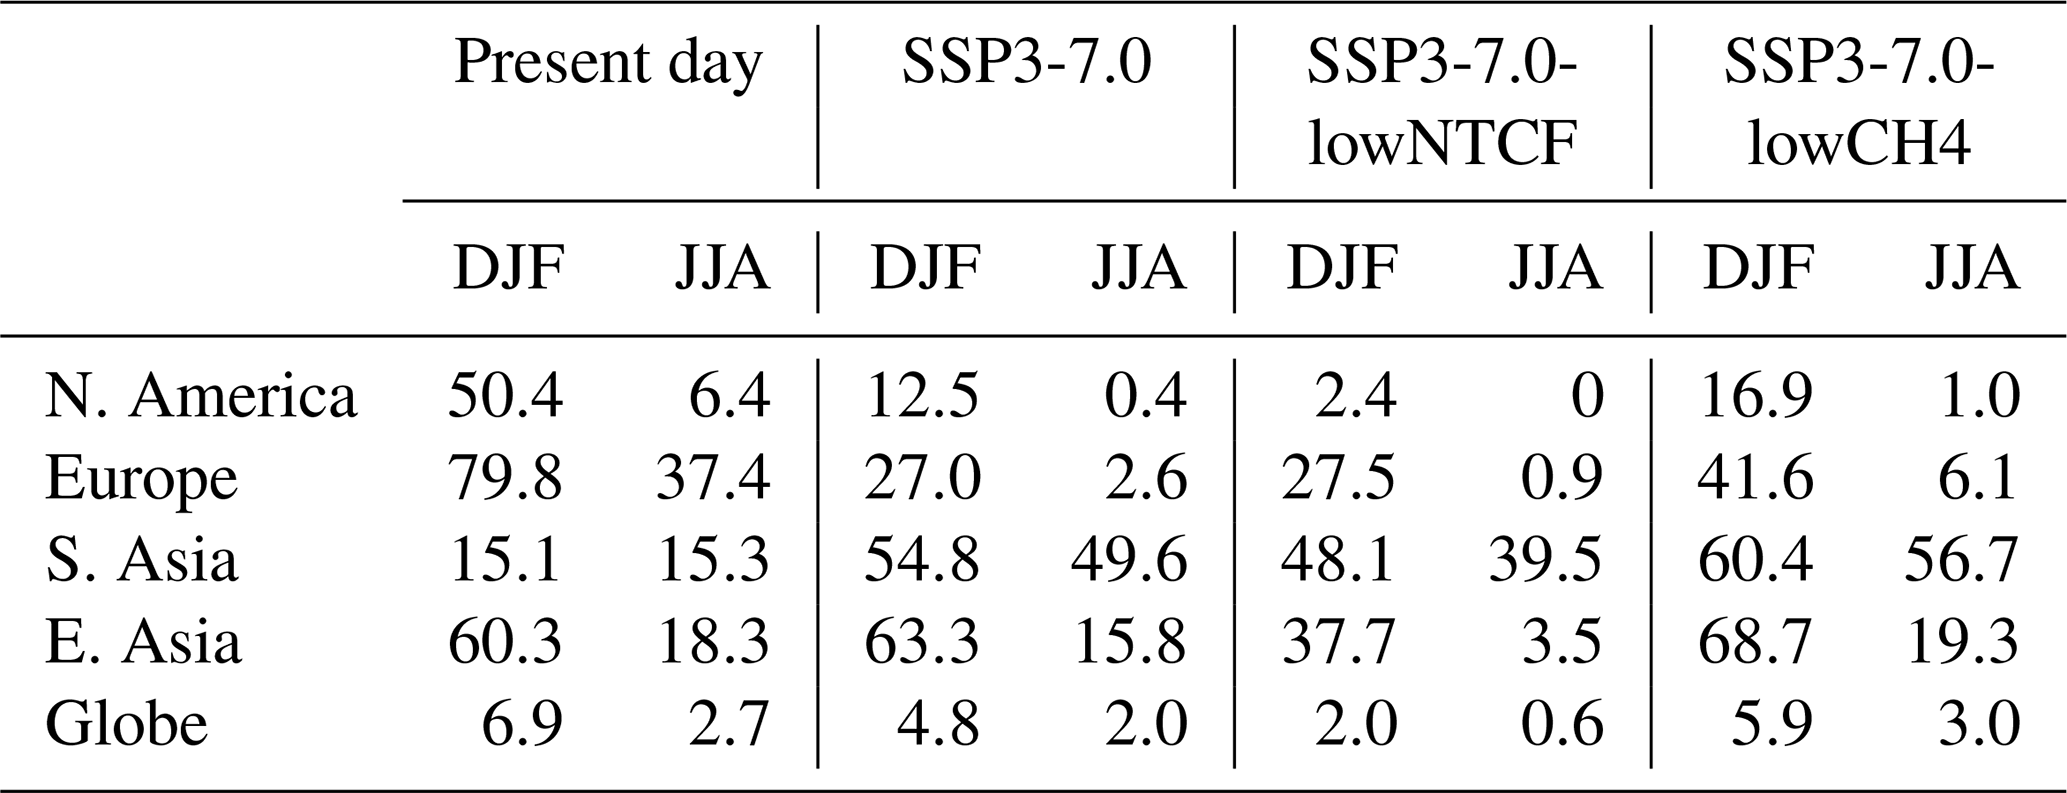
We contrast regional O3 sensitivities for winter and summer seasons in Fig. 10, as we note that O3 responses in different seasons can be substantially different in high-emission regions. This suggests that static emission control strategies throughout the year may not be the best way to lower annual mean O3 pollution, and adjustments may be needed according to seasonal O3 sensitivities. More extensive VOC-limited areas are found in winter than in summer under both present-day and future conditions, but these account for less than 7 % of the total area of the world in the present day (Table 5). Over 50 % of North America, Europe, and East Asia are VOC-limited in winter in the present day. This explains why North America and Europe show O3 increases in winter (Fig. 4) despite reduced NOx emissions. However, there are fewer VOC-limited regions across the globe under all future pathways (Fig. 10). About 1 % of North America is VOC-limited in summer and less than 7 % of Europe. In contrast, over 48 % (winter) and 39 % (summer) of South Asia are VOC-limited in future. Slightly more areas are VOC-limited under SSP3-7.0-lowCH4 than under SSP3-7.0 (Fig. 10c, d). Overall, reductions in NOx emissions are important to reduce O3 production in high-emission regions and shift VOC-limited areas to NOx limitation, but this may lead to higher O3 mixing ratios in winter without further emission controls on VOC and CH4.
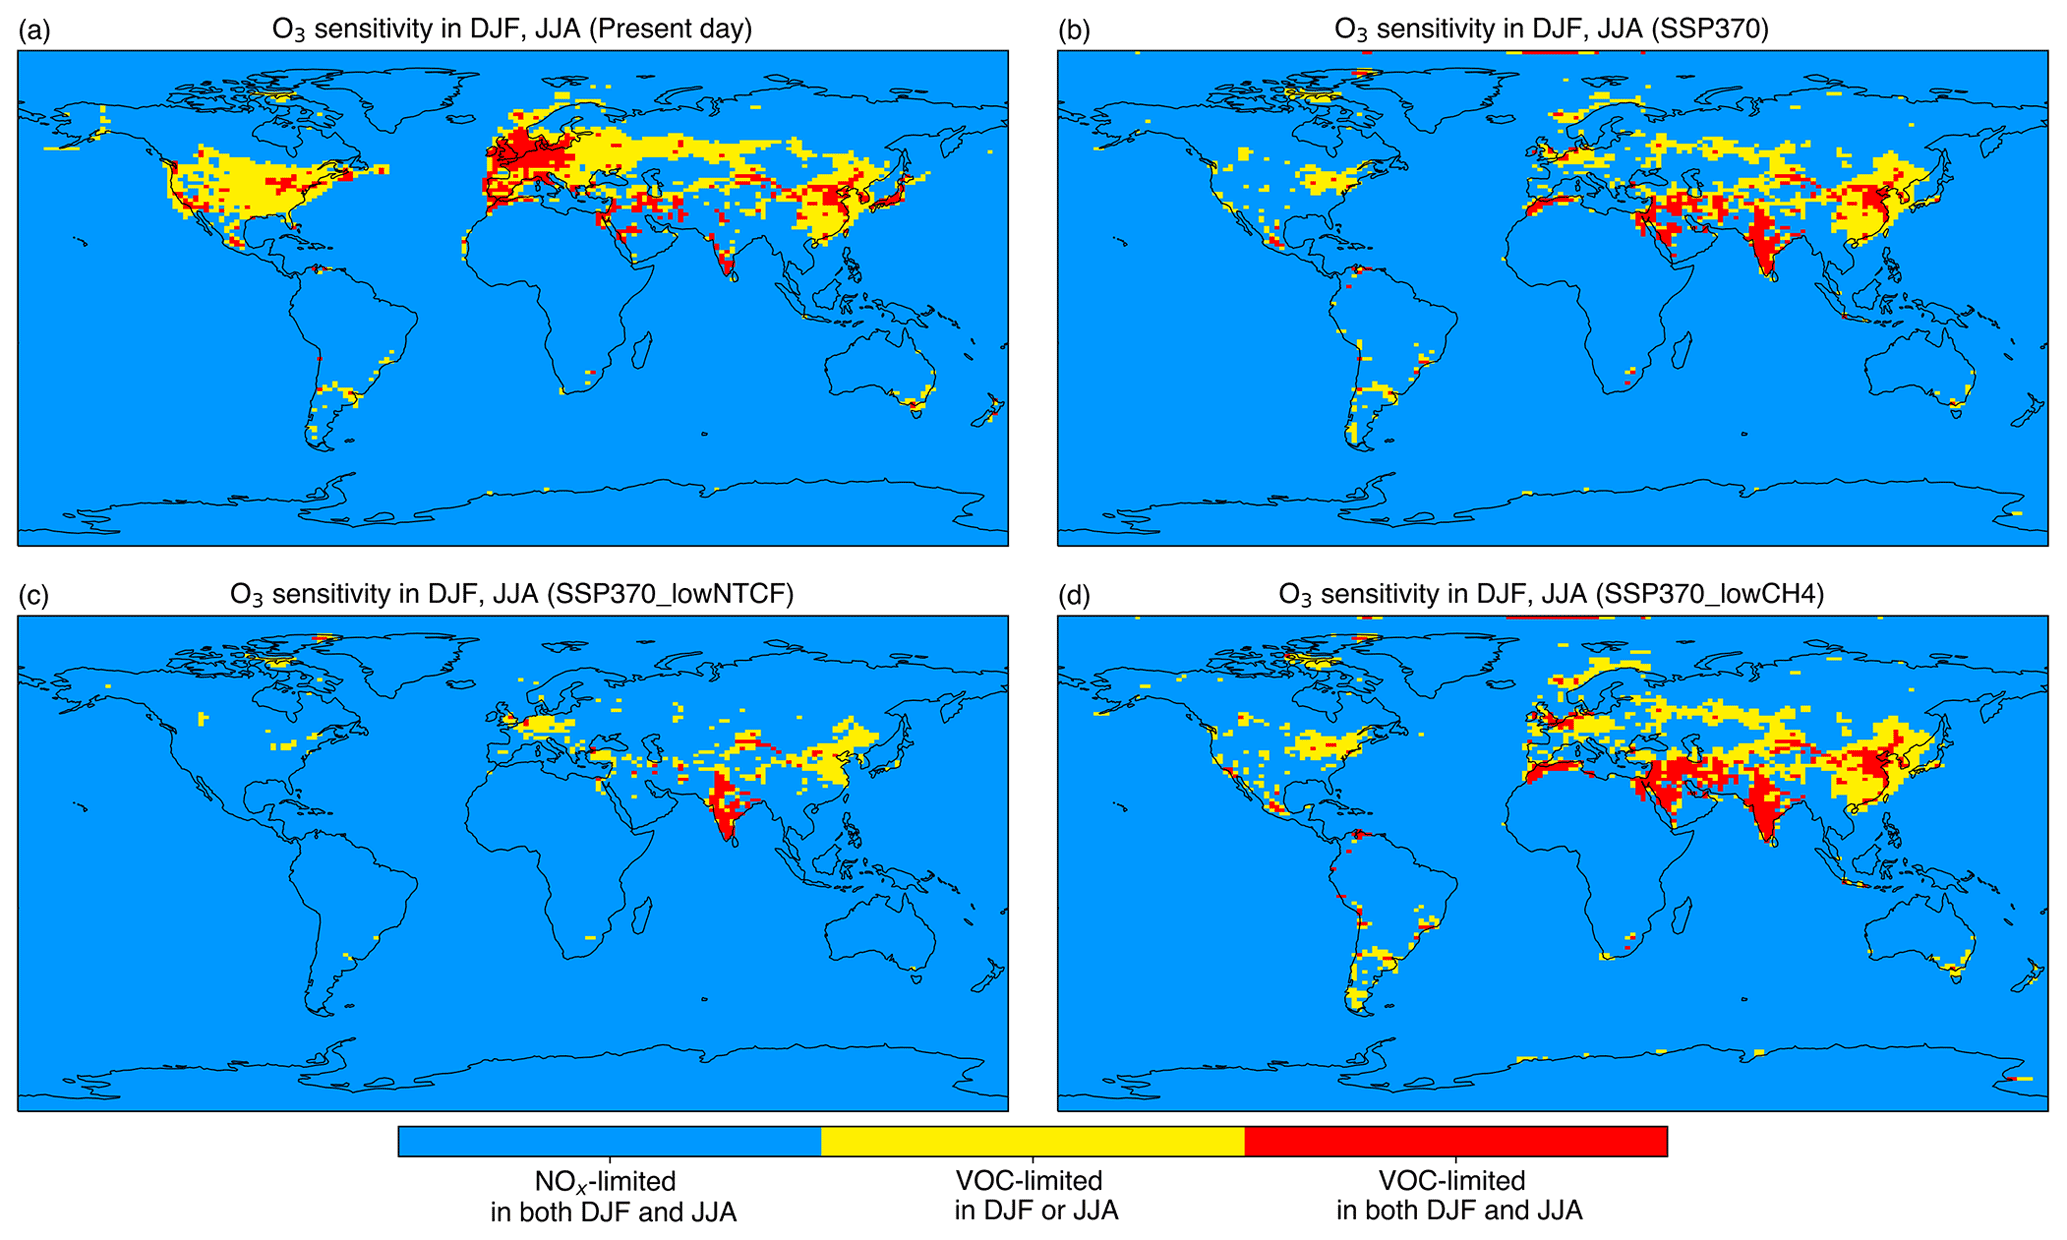
Figure 10Seasonal differences in O3 sensitivity regimes for the present day (2004–2014; a) and under SSP3-7.0 (b), SSP3-7.0-lowNTCF (c), and SSP3-7.0-lowCH4 (d) (2045–2055). An threshold ratio of 0.8 is used here to distinguish O3 sensitivity regimes.
Table 5The percentage of VOC-limited areas (%) in different regions under different pathways in winter (DJF) and in summer (JJA).
We use a global chemistry–climate model, UKESM1, to assess the impacts of changing near-term climate forcer (NTCF) emissions and CH4 mixing ratios in the context of climate change on tropospheric O3 in the present day (2004–2014) and the near future (2045–2055). CMIP6 future scenarios including SSP3-7.0, SSP3-7.0-lowNTCF, and SSP3-7.0-lowCH4 are used from the AerChemMIP project. We have examined O3 changes from the present day to the future and investigated regional O3 sensitivities to explain contrasting O3 changes in different seasons.
An extended chemistry scheme incorporating more reactive VOC species is used to permit the representation of more active photochemical environments for O3 production. This shows higher surface O3 mixing ratios in high-emission regions and a 5 % higher tropospheric O3 burden. While simulated surface O3 mixing ratios are biased low in winter and high in summer, these systematic model biases are similar to those using the original chemistry scheme as well as a more comprehensive chemistry scheme. This indicates that other factors in the model are likely to be responsible for the biases, but the extended chemistry scheme permits the representation of a more appropriate chemical environment for O3 production in high-emission areas.
From the present day to the future, the tropospheric O3 burden increases by 4 % under SSP3-7.0 and decreases by 7 % and 5 % under SSP3-7.0-lowNTCF and SSP3-7.0-lowCH4. The tropospheric O3 chemical lifetime remains similar (21–22 d) under all scenarios, and this is similar to previous estimates. Seasonal global mean surface O3 mixing ratios increase by 0.7–0.9 ppb under SSP3-7.0 and decrease by 3.3–5.2 ppb under SSP3-7.0-lowNTCF and by 2.7–3.5 ppb under SSP3-7.0-lowCH4. We find that reductions in NTCF emissions are effective in reducing surface O3 mixing ratios, and reductions in CH4 mixing ratios are also important. We also find that both the magnitude and direction of seasonal, daytime, and nighttime O3 changes relative to the present day can vary greatly across different regions especially South and East Asia.
O3 sensitivity is quantified using monthly mean ratios to give a broad assessment of regional O3 sensitivity. The estimated monthly mean thresholds range from 0.6 to 1.0, and 0.8 is used to distinguish O3 sensitivity regimes. Most VOC-limited regimes occur in high-emission regions across the Northern Hemisphere, such as North America, Europe, the Middle East, South Asia, and East Asia. More areas in North America and Europe become NOx-limited under all future pathways due to the projected decrease in NOx emissions. There are more VOC-limited areas in East Asia under SSP3-7.0 and SSP3-7.0-lowCH4 due to the projected increase in NOx emissions, although there are fewer VOC-limited areas in East Asia under SSP3-7.0-lowNTCF. South Asia becomes the dominant region for VOC-limited O3 production in the future. Projections of regional O3 sensitivity demonstrate that reductions in NOx emissions are the most important factor to shift VOC-limited regimes to NOx limitation.
We highlight that O3 sensitivity varies by season. There are more VOC-limited regimes in winter (7 %) than in summer (3 %) across the globe. Reductions in NOx emissions increase surface O3 mixing ratios in high-emission areas particularly in winter, and reductions in VOC emissions should be targeted. In the future, reductions in NOx and VOC emissions should both be effective in mitigating O3 pollution in most areas of North America and Europe in summer because there are only 1 % and 7 % VOC-limited areas in these two regions. However, further reductions in NOx emissions are needed for parts of East Asia and South Asia to convert most VOC-limited areas to NOx-limited ones. While anthropogenic and biomass emissions may be controlled in the future, more biogenic emissions under a warmer climate would hinder the impacts of VOCs on O3 mitigation. Reductions in CH4 mixing ratios are also important to reduce surface O3 pollution. NOx decreases are important to reduce surface O3 mixing ratios from a global perspective but will lead to increased O3 mixing ratios in some regions, and hence emission controls on VOC and CH4 are necessary to mitigate regional O3 pollution during the transition from VOC to NOx limitation.
The data generated in this study are available upon request.
ZL, RMD, OW, FMO'C, and STT designed the study. ZL set up the model, conducted model simulations, and performed the analysis. ZL, RMD, and OW prepared the paper. All co-authors contributed to reviewing and editing the paper.
The contact author has declared that neither they nor their co-authors have any competing interests.
Publisher’s note: Copernicus Publications remains neutral with regard to jurisdictional claims in published maps and institutional affiliations.
Zhenze Liu thanks the University of Edinburgh China Scholarship Council. Oliver Wild and Ruth M. Doherty thank the Natural Environment Research Council (NERC) for funding under grants NE/N006925/1, NE/N006976/1, and NE/N006941/1. Steven T. Turnock thanks the UK-China Research & Innovation Partnership Fund through the Met Office Climate Science for Service Partnership (CSSP) China as part of the Newton Fund. This work made use of computation resources on the Met Office and NERC joint supercomputer system (MONSooN) in the UK.
This research has been supported by the Natural Environment Research Council (grant nos. NE/N006925/1, NE/N006976/1, and NE/N006941/1) and the China Scholarship Council (grant no. 201708060462).
This paper was edited by Tanja Schuck and reviewed by two anonymous referees.
Agathokleous, E., Feng, Z. Z., Oksanen, E., Sicard, P., Wang, Q., Saitanis, C. J., Araminiene, V., Blande, J. D., Hayes, F., Calatayud, V., Domingos, M., Veresoglou, S. D., Penuelas, J., Wardle, D. A., De Marco, A., Li, Z. Z., Harmens, H., Yuan, X. Y., Vitale, M., and Paoletti, E.: Ozone affects plant, insect, and soil microbial communities: A threat to terrestrial ecosystems and biodiversity, Sci. Adv., 6, eabc1176, https://doi.org/10.1126/sciadv.abc1176, 2020. a
Allen, R. J., Horowitz, L. W., Naik, V., Oshima, N., O'Connor, F. M., Turnock, S., Shim, S., Le Sager, P., van Noije, T., Tsigaridis, K., Bauer, S. E., Sentman, L. T., John, J. G., Broderick, C., Deushi, M., Folberth, G. A., Fujimori, S., and Collins, W. J.: Significant climate benefits from near-term climate forcer mitigation in spite of aerosol reductions, Environ. Res. Lett., 16, 034010, https://doi.org/10.1088/1748-9326/abe06b, 2021. a
Archer-Nicholls, S., Abraham, N. L., Shin, Y. M., Weber, J., Russo, M. R., Lowe, D., Utembe, S., O'Connor, F. M., Kerridge, B., Latter, B., Siddans, R., Jenkin, M., Wild, O., and Archibald, A. T.: The Common Representative Intermediates Mechanism version 2 in the United Kingdom Chemistry and Aerosols Model, J. Adv. Model. Earth Sy., 13, e2020MS002420, https://doi.org/10.1029/2020MS002420, 2020. a
Archibald, A. T., O'Connor, F. M., Abraham, N. L., Archer-Nicholls, S., Chipperfield, M. P., Dalvi, M., Folberth, G. A., Dennison, F., Dhomse, S. S., Griffiths, P. T., Hardacre, C., Hewitt, A. J., Hill, R. S., Johnson, C. E., Keeble, J., Köhler, M. O., Morgenstern, O., Mulcahy, J. P., Ordóñez, C., Pope, R. J., Rumbold, S. T., Russo, M. R., Savage, N. H., Sellar, A., Stringer, M., Turnock, S. T., Wild, O., and Zeng, G.: Description and evaluation of the UKCA stratosphere–troposphere chemistry scheme (StratTrop vn 1.0) implemented in UKESM1, Geosci. Model Dev., 13, 1223–1266, https://doi.org/10.5194/gmd-13-1223-2020, 2020a. a, b
Archibald, A. T., Neu, J. L., Elshorbany, Y. F., Cooper, O. R., Young, P. J., Akiyoshi, H., Cox, R. A., Coyle, M., Derwent, R. G., Deushi, M., Finco, A., Frost, G. J., Galbally, I. E., Gerosa, G., Granier, C., Griffiths, P. T., Hossaini, R., Hu, L., Jockel, P., Josse, B., Lin, M. Y., Mertens, M., Morgenstern, O., Naja, M., Naik, V., Oltmans, S., Plummer, D. A., Revell, L. E., Saiz-Lopez, A., Saxena, P., Shin, Y. M., Shahid, I., Shallcross, D., Tilmes, S., Trickl, T., Wallington, T. J., Wang, T., Worden, H. M., and Zeng, G.: Tropospheric Ozone Assessment Report: A critical review of changes in the tropospheric ozone burden and budget from 1850 to 2100, Elementa, 8, 034, https://doi.org/10.1525/elementa.2020.034, 2020b. a
Bieser, J., Aulinger, A., Matthias, V., Quante, M., and Van Der Gon, H. D.: Vertical emission profiles for Europe based on plume rise calculations, 159, 2935–2946, https://doi.org/10.1016/j.envpol.2011.04.030, 2011. a
Colette, A., Aas, W., Banin, L., Braban, C. F., Ferm, M., Gonzalez Ortiz, A., Ilyin, I., Mar, K., Pandolfi, M., and Putaud, J.-P.: Air pollution trends in the EMEP region between 1990 and 2012, available at: http://nora.nerc.ac.uk/id/eprint/513779 (last access: 1 August 2021), 2016. a
Collins, W. J., Lamarque, J.-F., Schulz, M., Boucher, O., Eyring, V., Hegglin, M. I., Maycock, A., Myhre, G., Prather, M., Shindell, D., and Smith, S. J.: AerChemMIP: quantifying the effects of chemistry and aerosols in CMIP6, Geosci. Model Dev., 10, 585–607, https://doi.org/10.5194/gmd-10-585-2017, 2017. a
Doherty, R. M., Wild, O., Shindell, D. T., Zeng, G., MacKenzie, I. A., Collins, W. J., Fiore, A. M., Stevenson, D. S., Dentener, F. J., Schultz, M. G., Hess, P., Derwent, R. G., and Keating, T. J.: Impacts of climate change on surface ozone and intercontinental ozone pollution: A multi-model study, J. Geophys. Res.-Atmos., 118, 3744–3763, https://doi.org/10.1002/jgrd.50266, 2013. a, b
Doherty, R. M., Heal, M. R., and O'Connor, F. M.: Climate change impacts on human health over Europe through its effect on air quality, Environ. Health, 16, 33–44, https://doi.org/10.1186/s12940-017-0325-2, 2017. a
Dunker, A. M., Yarwood, G., Ortmann, J. P., and Wilson, G. M.: Comparison of source apportionment and source sensitivity of ozone in a three-dimensional air quality model, Environ. Sci. Technol., 36, 2953–2964, https://doi.org/10.1021/es011418f, 2002. a
Eyring, V., Bony, S., Meehl, G. A., Senior, C. A., Stevens, B., Stouffer, R. J., and Taylor, K. E.: Overview of the Coupled Model Intercomparison Project Phase 6 (CMIP6) experimental design and organization, Geosci. Model Dev., 9, 1937–1958, https://doi.org/10.5194/gmd-9-1937-2016, 2016. a
Fenech, S., Doherty, R. M., Heaviside, C., Vardoulakis, S., Macintyre, H. L., and O'Connor, F. M.: The influence of model spatial resolution on simulated ozone and fine particulate matter for Europe: implications for health impact assessments, Atmos. Chem. Phys., 18, 5765–5784, https://doi.org/10.5194/acp-18-5765-2018, 2018. a
Feng, L., Smith, S. J., Braun, C., Crippa, M., Gidden, M. J., Hoesly, R., Klimont, Z., van Marle, M., van den Berg, M., and van der Werf, G. R.: The generation of gridded emissions data for CMIP6, Geosci. Model Dev., 13, 461–482, https://doi.org/10.5194/gmd-13-461-2020, 2020. a
Fiore, A. M., West, J. J., Horowitz, L. W., Naik, V., and Schwarzkopf, M. D.: Characterizing the tropospheric ozone response to methane emission controls and the benefits to climate and air quality, J. Geophys. Res.-Atmos., 113, D08307, https://doi.org/10.1029/2007jd009162, 2008. a
Fiore, A. M., Naik, V., Spracklen, D. V., Steiner, A., Unger, N., Prather, M., Bergmann, D., Cameron-Smith, P. J., Cionni, I., Collins, W. J., Dalsøren, S., Eyring, V., Folberth, G. A., Ginoux, P., Horowitz, L. W., Josse, B., Lamarque, J.-F., MacKenzie, I. A., Nagashima, T., O'Connor, F. M., Righi, M., Rumbold, S. T., Shindell, D. T., Skeie, R. B., Sudo, K., Szopa, S., Takemura, T., and Zeng, G.: Global air quality and climate, Chem. Soc. Rev., 41, 6663–6683, https://doi.org/10.1039/C2CS35095E, 2012. a
Fujimori, S., Hasegawa, T., Masui, T., Takahashi, K., Herran, D. S., Dai, H. C., Hijioka, Y., and Kainuma, M.: SSP3: AIM implementation of Shared Socioeconomic Pathways, Global Environ. Chang., 42, 268–283, https://doi.org/10.1016/j.gloenvcha.2016.06.009, 2017. a
Gao, M., Gao, J., Zhu, B., Kumar, R., Lu, X., Song, S., Zhang, Y., Jia, B., Wang, P., Beig, G., Hu, J., Ying, Q., Zhang, H., Sherman, P., and McElroy, M. B.: Ozone pollution over China and India: seasonality and sources, Atmos. Chem. Phys., 20, 4399–4414, https://doi.org/10.5194/acp-20-4399-2020, 2020. a
Griffiths, P. T., Murray, L. T., Zeng, G., Shin, Y. M., Abraham, N. L., Archibald, A. T., Deushi, M., Emmons, L. K., Galbally, I. E., Hassler, B., Horowitz, L. W., Keeble, J., Liu, J., Moeini, O., Naik, V., O'Connor, F. M., Oshima, N., Tarasick, D., Tilmes, S., Turnock, S. T., Wild, O., Young, P. J., and Zanis, P.: Tropospheric ozone in CMIP6 simulations, Atmos. Chem. Phys., 21, 4187–4218, https://doi.org/10.5194/acp-21-4187-2021, 2021. a, b
Hakim, Z. Q., Archer-Nicholls, S., Beig, G., Folberth, G. A., Sudo, K., Abraham, N. L., Ghude, S., Henze, D. K., and Archibald, A. T.: Evaluation of tropospheric ozone and ozone precursors in simulations from the HTAPII and CCMI model intercomparisons – a focus on the Indian subcontinent, Atmos. Chem. Phys., 19, 6437–6458, https://doi.org/10.5194/acp-19-6437-2019, 2019. a
Hoesly, R. M., Smith, S. J., Feng, L., Klimont, Z., Janssens-Maenhout, G., Pitkanen, T., Seibert, J. J., Vu, L., Andres, R. J., Bolt, R. M., Bond, T. C., Dawidowski, L., Kholod, N., Kurokawa, J.-I., Li, M., Liu, L., Lu, Z., Moura, M. C. P., O'Rourke, P. R., and Zhang, Q.: Historical (1750–2014) anthropogenic emissions of reactive gases and aerosols from the Community Emissions Data System (CEDS), Geosci. Model Dev., 11, 369–408, https://doi.org/10.5194/gmd-11-369-2018, 2018. a
Huang, G., Brook, R., Crippa, M., Janssens-Maenhout, G., Schieberle, C., Dore, C., Guizzardi, D., Muntean, M., Schaaf, E., and Friedrich, R.: Speciation of anthropogenic emissions of non-methane volatile organic compounds: a global gridded data set for 1970–2012, Atmos. Chem. Phys., 17, 7683–7701, https://doi.org/10.5194/acp-17-7683-2017, 2017. a
Janssens-Maenhout, G., Crippa, M., Guizzardi, D., Dentener, F., Muntean, M., Pouliot, G., Keating, T., Zhang, Q., Kurokawa, J., Wankmüller, R., Denier van der Gon, H., Kuenen, J. J. P., Klimont, Z., Frost, G., Darras, S., Koffi, B., and Li, M.: HTAP_v2.2: a mosaic of regional and global emission grid maps for 2008 and 2010 to study hemispheric transport of air pollution, Atmos. Chem. Phys., 15, 11411–11432, https://doi.org/10.5194/acp-15-11411-2015, 2015. a, b
Jin, X. M. and Holloway, T.: Spatial and temporal variability of ozone sensitivity over China observed from the Ozone Monitoring Instrument, J. Geophys. Res.-Atmos., 120, 7229–7246, https://doi.org/10.1002/2015jd023250, 2015. a
Kleinman, L. I.: Low and high NOx tropospheric photochemistry, J. Geophys. Res.-Atmos., 99, 16831–16838, https://doi.org/10.1029/94JD01028, 1994. a, b
Lamarque, J.-F., Bond, T. C., Eyring, V., Granier, C., Heil, A., Klimont, Z., Lee, D., Liousse, C., Mieville, A., Owen, B., Schultz, M. G., Shindell, D., Smith, S. J., Stehfest, E., Van Aardenne, J., Cooper, O. R., Kainuma, M., Mahowald, N., McConnell, J. R., Naik, V., Riahi, K., and van Vuuren, D. P.: Historical (1850–2000) gridded anthropogenic and biomass burning emissions of reactive gases and aerosols: methodology and application, Atmos. Chem. Phys., 10, 7017–7039, https://doi.org/10.5194/acp-10-7017-2010, 2010. a
Lefohn, A. S., Malley, C. S., Smith, L., Wells, B., Hazucha, M., Simon, H., Naik, V., Mills, G., Schultz, M. G., Paoletti, E., De Marco, A., Xu, X. B., Zhang, L., Wang, T., Neufeld, H. S., Musselman, R. C., Tarasick, D., Brauer, M., Feng, Z. Z., Tang, H. Y., Kobayashi, K., Sicard, P., Solberg, S., and Gerosa, G.: Tropospheric ozone assessment report: Global ozone metrics for climate change, human health, and crop/ecosystem research, Elementa, 6, 27, https://doi.org/10.1525/elementa.279, 2018. a
Lelieveld, J. and Dentener, F. J.: What controls tropospheric ozone?, J. Geophys. Res.-Atmos., 105, 3531–3551, https://doi.org/10.1029/1999JD901011, 2000. a
Lin, M., Horowitz, L. W., Xie, Y., Paulot, F., Malyshev, S., Shevliakova, E., Finco, A., Gerosa, G., Kubistin, D., and Pilegaard, K.: Vegetation feedbacks during drought exacerbate ozone air pollution extremes in Europe, Nat. Clim. Change, 10, 444–451, https://doi.org/10.1038/s41558-020-0743-y, 2020. a, b
Liu, Z., Doherty, R. M., Wild, O., Hollaway, M., and O’Connor, F. M.: Contrasting chemical environments in summertime for atmospheric ozone across major Chinese industrial regions: the effectiveness of emission control strategies, Atmos. Chem. Phys., 21, 10689–10706, https://doi.org/10.5194/acp-21-10689-2021, 2021. a, b, c, d
Lu, X., Zhang, L., Liu, X., Gao, M., Zhao, Y., and Shao, J.: Lower tropospheric ozone over India and its linkage to the South Asian monsoon, Atmos. Chem. Phys., 18, 3101–3118, https://doi.org/10.5194/acp-18-3101-2018, 2018. a
Lu, X., Zhang, L., Wang, X., Gao, M., Li, K., Zhang, Y., Yue, X., and Zhang, Y.: Rapid increases in warm-season surface ozone and resulting health impact in China since 2013, Environ. Sci. Tech. Let., 7, 240–247, https://doi.org/10.1021/acs.estlett.0c00171, 2020. a
Ma, M., Gao, Y., Wang, Y., Zhang, S., Leung, L. R., Liu, C., Wang, S., Zhao, B., Chang, X., Su, H., Zhang, T., Sheng, L., Yao, X., and Gao, H.: Substantial ozone enhancement over the North China Plain from increased biogenic emissions due to heat waves and land cover in summer 2017, Atmos. Chem. Phys., 19, 12195–12207, https://doi.org/10.5194/acp-19-12195-2019, 2019. a
Mailler, S., Khvorostyanov, D., and Menut, L.: Impact of the vertical emission profiles on background gas-phase pollution simulated from the EMEP emissions over Europe, Atmos. Chem. Phys., 13, 5987–5998, https://doi.org/10.5194/acp-13-5987-2013, 2013. a
Mann, G. W., Carslaw, K. S., Spracklen, D. V., Ridley, D. A., Manktelow, P. T., Chipperfield, M. P., Pickering, S. J., and Johnson, C. E.: Description and evaluation of GLOMAP-mode: a modal global aerosol microphysics model for the UKCA composition-climate model, Geosci. Model Dev., 3, 519–551, https://doi.org/10.5194/gmd-3-519-2010, 2010. a
Meinshausen, M., Vogel, E., Nauels, A., Lorbacher, K., Meinshausen, N., Etheridge, D. M., Fraser, P. J., Montzka, S. A., Rayner, P. J., Trudinger, C. M., Krummel, P. B., Beyerle, U., Canadell, J. G., Daniel, J. S., Enting, I. G., Law, R. M., Lunder, C. R., O'Doherty, S., Prinn, R. G., Reimann, S., Rubino, M., Velders, G. J. M., Vollmer, M. K., Wang, R. H. J., and Weiss, R.: Historical greenhouse gas concentrations for climate modelling (CMIP6), Geosci. Model Dev., 10, 2057–2116, https://doi.org/10.5194/gmd-10-2057-2017, 2017. a
Meinshausen, M., Nicholls, Z. R. J., Lewis, J., Gidden, M. J., Vogel, E., Freund, M., Beyerle, U., Gessner, C., Nauels, A., Bauer, N., Canadell, J. G., Daniel, J. S., John, A., Krummel, P. B., Luderer, G., Meinshausen, N., Montzka, S. A., Rayner, P. J., Reimann, S., Smith, S. J., van den Berg, M., Velders, G. J. M., Vollmer, M. K., and Wang, R. H. J.: The shared socio-economic pathway (SSP) greenhouse gas concentrations and their extensions to 2500, Geosci. Model Dev., 13, 3571–3605, https://doi.org/10.5194/gmd-13-3571-2020, 2020. a
Morgenstern, O., Braesicke, P., O'Connor, F. M., Bushell, A. C., Johnson, C. E., Osprey, S. M., and Pyle, J. A.: Evaluation of the new UKCA climate-composition model – Part 1: The stratosphere, Geosci. Model Dev., 2, 43–57, https://doi.org/10.5194/gmd-2-43-2009, 2009. a
Mulcahy, J. P., Johnson, C., Jones, C. G., Povey, A. C., Scott, C. E., Sellar, A., Turnock, S. T., Woodhouse, M. T., Abraham, N. L., Andrews, M. B., Bellouin, N., Browse, J., Carslaw, K. S., Dalvi, M., Folberth, G. A., Glover, M., Grosvenor, D. P., Hardacre, C., Hill, R., Johnson, B., Jones, A., Kipling, Z., Mann, G., Mollard, J., O'Connor, F. M., Palmiéri, J., Reddington, C., Rumbold, S. T., Richardson, M., Schutgens, N. A. J., Stier, P., Stringer, M., Tang, Y., Walton, J., Woodward, S., and Yool, A.: Description and evaluation of aerosol in UKESM1 and HadGEM3-GC3.1 CMIP6 historical simulations, Geosci. Model Dev., 13, 6383–6423, https://doi.org/10.5194/gmd-13-6383-2020, 2020. a
Naik, V., Szopa, S., Adhikary, B., Artaxo, P., Berntsen, T., Collins, W. D., Fuzzi, S., Gallardo, L., Kiendler Scharr, A., Klimont, Z., Liao, H., Unger, N., and Zanis, P.: IPCC, 2021: Climate Change 2021: Chapter 6: Short-Lived Climate Forcers, Cambridge University Press, available at: https://www.ipcc.ch/report/ar6/wg1/ (last access: 20 January 2022), 2021. a
O'Connor, F. M., Johnson, C. E., Morgenstern, O., Abraham, N. L., Braesicke, P., Dalvi, M., Folberth, G. A., Sanderson, M. G., Telford, P. J., Voulgarakis, A., Young, P. J., Zeng, G., Collins, W. J., and Pyle, J. A.: Evaluation of the new UKCA climate-composition model – Part 2: The Troposphere, Geosci. Model Dev., 7, 41–91, https://doi.org/10.5194/gmd-7-41-2014, 2014. a, b
O'Connor, F. M., Abraham, N. L., Dalvi, M., Folberth, G. A., Griffiths, P. T., Hardacre, C., Johnson, B. T., Kahana, R., Keeble, J., Kim, B., Morgenstern, O., Mulcahy, J. P., Richardson, M., Robertson, E., Seo, J., Shim, S., Teixeira, J. C., Turnock, S. T., Williams, J., Wiltshire, A. J., Woodward, S., and Zeng, G.: Assessment of pre-industrial to present-day anthropogenic climate forcing in UKESM1, Atmos. Chem. Phys., 21, 1211–1243, https://doi.org/10.5194/acp-21-1211-2021, 2021. a
O'Neill, B. C., Kriegler, E., Riahi, K., Ebi, K. L., Hallegatte, S., Carter, T. R., Mathur, R., and van Vuuren, D. P.: A new scenario framework for climate change research: the concept of shared socioeconomic pathways, Climatic Change, 122, 387–400, https://doi.org/10.1007/s10584-013-0905-2, 2014. a
Pacifico, F., Harrison, S. P., Jones, C. D., Arneth, A., Sitch, S., Weedon, G. P., Barkley, M. P., Palmer, P. I., Serça, D., Potosnak, M., Fu, T.-M., Goldstein, A., Bai, J., and Schurgers, G.: Evaluation of a photosynthesis-based biogenic isoprene emission scheme in JULES and simulation of isoprene emissions under present-day climate conditions, Atmos. Chem. Phys., 11, 4371–4389, https://doi.org/10.5194/acp-11-4371-2011, 2011. a
Prather, M., Flato, G., Friedlingstein, P., Jones, C., Lamarque, J.-F., Liao, H., and Rasch, P.: IPCC, 2013: Climate Change 2013: Annex II: Climate System Scenario Tables, Cambridge University Press, available at: https://www.ipcc.ch/report/ar5/wg1/ (last access: 20 January 2022), 2013. a
Rao, S., Klimont, Z., Smith, S. J., Van Dingenen, R., Dentener, F., Bouwman, L., Riahi, K., Amann, M., Bodirsky, B. L., van Vuuren, D. P., Reis, L. A., Calvin, K., Drouet, L., Fricko, O., Fujimori, S., Gernaat, D., Havlik, P., Harmsen, M., Hasegawa, T., Heyes, C., Hilaire, J., Luderer, G., Masui, T., Stehfest, E., Strefler, J., van der Sluis, S., and Tavoni, M.: Future air pollution in the Shared Socio-economic Pathways, Global Environ. Chang., 42, 346–358, https://doi.org/10.1016/j.gloenvcha.2016.05.012, 2017. a, b
Romer, P. S., Duffey, K. C., Wooldridge, P. J., Edgerton, E., Baumann, K., Feiner, P. A., Miller, D. O., Brune, W. H., Koss, A. R., de Gouw, J. A., Misztal, P. K., Goldstein, A. H., and Cohen, R. C.: Effects of temperature-dependent NOx emissions on continental ozone production, Atmos. Chem. Phys., 18, 2601–2614, https://doi.org/10.5194/acp-18-2601-2018, 2018. a
Schnell, J. L. and Prather, M. J.: Co-occurrence of extremes in surface ozone, particulate matter, and temperature over eastern North America, P. Natl. Acad. Sci., 114, 2854–2859, https://doi.org/10.1073/pnas.1614453114, 2017. a
Schultz, M. G., Schröder, S., Lyapina, O., Cooper, O. R., Galbally, I., Petropavlovskikh, I., von Schneidemesser, E., Tanimoto, H., Elshorbany, Y., Naja, M., Seguel, R. J., Dauert, U., Eckhardt, P., Feigenspan, S., Fiebig, M., Hjellbrekke, A.-G., Hong, Y.-D., Kjeld, P. C., Koide, H., Lear, G., Tarasick, D., Ueno, M., Wallasch, M., Baumgardner, D., Chuang, M.-T., Gillett, R., Lee, M., Molloy, S., Moolla, R., Wang, T., Sharps, K., Adame, J. A., Ancellet, G., Apadula, F., Artaxo, P., Barlasina, M. E., Bogucka, M., Bonasoni, P., Chang, L., Colomb, A., Cuevas-Agulló, E., Cupeiro, M., Degorska, A., Ding, A., Fröhlich, M., Frolova, M., Gadhavi, H., Gheusi, F., Gilge, S., Gonzalez, M. Y., Gros, V., Hamad, S. H., Helmig, D., Henriques, D., Hermansen, O., Holla, R., Hueber, J., Im, U., Jaffe, D. A., Komala, N., Kubistin, D., Lam, K.-S., Laurila, T., Lee, H., Levy, I., Mazzoleni, C., Mazzoleni, L. R., McClure-Begley, A., Mohamad, M., Murovec, M., Navarro-Comas, M., Nicodim, F., Parrish, D., Read, K. A., Reid, N., Ries, L., Saxena, P., Schwab, J. J., Scorgie, Y., Senik, I., Simmonds, P., Sinha, V., Skorokhod, A. I., Spain, G., Spangl, W., Spoor, R., Springston, S. R., Steer, K., Steinbacher, M., Suharguniyawan, E., Torre, P., Trickl, T., Weili, L., Weller, R., Xu, X., Xue, L., and Zhiqiang, M.: Tropospheric Ozone Assessment Report, links to Global surface ozone datasets, PANGAEA [data set], https://doi.org/10.1594/PANGAEA.876108, 2017a. a, b
Schultz, M. G., Schroder, S., Lyapina, O., Cooper, O. R., Galbally, I., Petropavlovskikh, I., von Schneidemesser, E., Tanimoto, H., Elshorbany, Y., Naja, M., Seguel, R. J., Dauert, U., Eckhardt, P., Feigenspan, S., Fiebig, M., Hjellbrekke, A. G., Hong, Y. D., Kjeld, P. C., Koide, H., Lear, G., Tarasick, D., Ueno, M., Wallasch, M., Baumgardner, D., Chuang, M. T., Gillett, R., Lee, M., Molloy, S., Moolla, R., Wang, T., Sharps, K., Adame, J. A., Ancellet, G., Apadula, F., Artaxo, P., Barlasina, M. E., Bogucka, M., Bonasoni, P., Chang, L., Colomb, A., Cuevas-Agullo, E., Cupeiro, M., Degorska, A., Ding, A. J., FrHlich, M., Frolova, M., Gadhavi, H., Gheusi, F., Gilge, S., Gonzalez, M. Y., Gros, V., Hamad, S. H., Helmig, D., Henriques, D., Hermansen, O., Holla, R., Hueber, J., Im, U., Jaffe, D. A., Komala, N., Kubistin, D., Lam, K. S., Laurila, T., Lee, H., Levy, I., Mazzoleni, C., Mazzoleni, L. R., McClure-Begley, A., Mohamad, M., Murovec, M., Navarro-Comas, M., Nicodim, F., Parrish, D., Read, K. A., Reid, N., Ries, N. R. L., Saxena, P., Schwab, J. J., Scorgie, Y., Senik, I., Simmonds, P., Sinha, V., Skorokhod, A. I., Spain, G., Spangl, W., Spoor, R., Springston, S. R., Steer, K., Steinbacher, M., Suharguniyawan, E., Torre, P., Trickl, T., Lin, W. L., Weller, R., Xu, X. B., Xue, L. K., and Ma, Z. Q.: Tropospheric Ozone Assessment Report: Database and metrics data of global surface ozone observations, Elementa, 5, 58, https://doi.org/10.1525/elementa.244, 2017b. a
Sellar, A. A., Jones, C. G., Mulcahy, J. P., Tang, Y. M., Yool, A., Wiltshire, A., O'Connor, F. M., Stringer, M., Hill, R., Palmieri, J., Woodward, S., de Mora, L., Kuhlbrodt, T., Rumbold, S. T., Kelley, D. I., Ellis, R., Johnson, C. E., Walton, J., Abraham, N. L., Andrews, M. B., Andrews, T., Archibald, A. T., Berthou, S., Burke, E., Blockley, E., Carslaw, K., Dalvi, M., Edwards, J., Folberth, G. A., Gedney, N., Griffiths, P. T., Harper, A. B., Hendry, M. A., Hewitt, A. J., Johnson, B., Jones, A., Jones, C. D., Keeble, J., Liddicoat, S., Morgenstern, O., Parker, R. J., Predoi, V., Robertson, E., Siahaan, A., Smith, R. S., Swaminathan, R., Woodhouse, M. T., Zeng, G., and Zerroukat, M.: UKESM1: Description and Evaluation of the UK Earth System Model, J. Adv. Model. Earth Sy., 11, 4513–4558, https://doi.org/10.1029/2019ms001739, 2019. a, b
Sillman, S.: The use of NOy, H2O2, and HNO3 as indicators for ozone-NOx-hydrocarbon sensitivity in urban locations, J. Geophys. Res.-Atmos., 100, 14175–14188, https://doi.org/10.1029/94JD02953, 1995. a
Sillman, S.: The relation between ozone, NOx and hydrocarbons in urban and polluted rural environments, Atmos. Environ., 33, 1821–1845, https://doi.org/10.1016/S1352-2310(98)00345-8, 1999. a, b
Sillman, S. and West, J. J.: Reactive nitrogen in Mexico City and its relation to ozone-precursor sensitivity: results from photochemical models, Atmos. Chem. Phys., 9, 3477–3489, https://doi.org/10.5194/acp-9-3477-2009, 2009. a
Silver, B., Reddington, C., Arnold, S., and Spracklen, D.: Substantial changes in air pollution across China during 2015–2017, Environ. Res. Lett., 13, 114012, https://doi.org/10.1088/1748-9326/aae718, 2018. a
Simon, H., Reff, A., Wells, B., Xing, J., and Frank, N.: Ozone trends across the United States over a period of decreasing NOx and VOC emissions, Environ. Sci. Technol., 49, 186–195, https://doi.org/10.1021/es504514z, 2015. a
Stevenson, D., Dentener, F., Schultz, M., Ellingsen, K., Van Noije, T., Wild, O., Zeng, G., Amann, M., Atherton, C., and Bell, N.: Multimodel ensemble simulations of present-day and near-future tropospheric ozone, J. Geophys. Res.-Atmos., 111, D08301, https://doi.org/10.1029/2005JD006338, 2006. a
Stevenson, D. S., Young, P. J., Naik, V., Lamarque, J.-F., Shindell, D. T., Voulgarakis, A., Skeie, R. B., Dalsoren, S. B., Myhre, G., Berntsen, T. K., Folberth, G. A., Rumbold, S. T., Collins, W. J., MacKenzie, I. A., Doherty, R. M., Zeng, G., van Noije, T. P. C., Strunk, A., Bergmann, D., Cameron-Smith, P., Plummer, D. A., Strode, S. A., Horowitz, L., Lee, Y. H., Szopa, S., Sudo, K., Nagashima, T., Josse, B., Cionni, I., Righi, M., Eyring, V., Conley, A., Bowman, K. W., Wild, O., and Archibald, A.: Tropospheric ozone changes, radiative forcing and attribution to emissions in the Atmospheric Chemistry and Climate Model Intercomparison Project (ACCMIP), Atmos. Chem. Phys., 13, 3063–3085, https://doi.org/10.5194/acp-13-3063-2013, 2013. a
Stock, Z. S., Russo, M. R., and Pyle, J. A.: Representing ozone extremes in European megacities: the importance of resolution in a global chemistry climate model, Atmos. Chem. Phys., 14, 3899–3912, https://doi.org/10.5194/acp-14-3899-2014, 2014. a
Tarasick, D., Galbally, I. E., Cooper, O. R., Schultz, M. G., Ancellet, G., Leblanc, T., Wallington, T. J., Ziemke, J., Liu, X., Steinbacher, M., Staehelin, J., Vigouroux, C., Hannigan, J. W., García, O., Foret, G., Zanis, P., Weatherhead, E., Petropavlovskikh, I., Worden, H., Osman, M., Liu, J., Chang, K., Gaudel, A., Lin, M., Granados-Muñoz, M., Thompson, A. M., Oltmans, S. J., Cuesta, J., Dufour, G., Thouret, V., Hassler, B., Trickl, T., and Neu, J. L.: Tropospheric Ozone Assessment Report: Tropospheric ozone from 1877 to 2016, observed levels, trends and uncertainties, Elementa, 7, 39, https://doi.org/10.1525/elementa.376, 2019. a
Thornhill, G. D., Collins, W. J., Kramer, R. J., Olivié, D., Skeie, R. B., O'Connor, F. M., Abraham, N. L., Checa-Garcia, R., Bauer, S. E., Deushi, M., Emmons, L. K., Forster, P. M., Horowitz, L. W., Johnson, B., Keeble, J., Lamarque, J.-F., Michou, M., Mills, M. J., Mulcahy, J. P., Myhre, G., Nabat, P., Naik, V., Oshima, N., Schulz, M., Smith, C. J., Takemura, T., Tilmes, S., Wu, T., Zeng, G., and Zhang, J.: Effective radiative forcing from emissions of reactive gases and aerosols – a multi-model comparison, Atmos. Chem. Phys., 21, 853–874, https://doi.org/10.5194/acp-21-853-2021, 2021a. a
Thornhill, G., Collins, W., Olivié, D., Skeie, R. B., Archibald, A., Bauer, S., Checa-Garcia, R., Fiedler, S., Folberth, G., Gjermundsen, A., Horowitz, L., Lamarque, J.-F., Michou, M., Mulcahy, J., Nabat, P., Naik, V., O'Connor, F. M., Paulot, F., Schulz, M., Scott, C. E., Séférian, R., Smith, C., Takemura, T., Tilmes, S., Tsigaridis, K., and Weber, J.: Climate-driven chemistry and aerosol feedbacks in CMIP6 Earth system models, Atmos. Chem. Phys., 21, 1105–1126, https://doi.org/10.5194/acp-21-1105-2021, 2021b. a
Turnock, S. T., Allen, R. J., Andrews, M., Bauer, S. E., Deushi, M., Emmons, L., Good, P., Horowitz, L., John, J. G., Michou, M., Nabat, P., Naik, V., Neubauer, D., O'Connor, F. M., Olivié, D., Oshima, N., Schulz, M., Sellar, A., Shim, S., Takemura, T., Tilmes, S., Tsigaridis, K., Wu, T., and Zhang, J.: Historical and future changes in air pollutants from CMIP6 models, Atmos. Chem. Phys., 20, 14547–14579, https://doi.org/10.5194/acp-20-14547-2020, 2020. a, b, c, d
van Marle, M. J. E., Kloster, S., Magi, B. I., Marlon, J. R., Daniau, A.-L., Field, R. D., Arneth, A., Forrest, M., Hantson, S., Kehrwald, N. M., Knorr, W., Lasslop, G., Li, F., Mangeon, S., Yue, C., Kaiser, J. W., and van der Werf, G. R.: Historic global biomass burning emissions for CMIP6 (BB4CMIP) based on merging satellite observations with proxies and fire models (1750–2015), Geosci. Model Dev., 10, 3329–3357, https://doi.org/10.5194/gmd-10-3329-2017, 2017. a
van Vuuren, D. P., Kriegler, E., O'Neill, B. C., Ebi, K. L., Riahi, K., Carter, T. R., Edmonds, J., Hallegatte, S., Kram, T., Mathur, R., and Winkler, H.: A new scenario framework for Climate Change Research: scenario matrix architecture, Climatic Change, 122, 373–386, https://doi.org/10.1007/s10584-013-0906-1, 2014. a
Walters, D., Baran, A. J., Boutle, I., Brooks, M., Earnshaw, P., Edwards, J., Furtado, K., Hill, P., Lock, A., Manners, J., Morcrette, C., Mulcahy, J., Sanchez, C., Smith, C., Stratton, R., Tennant, W., Tomassini, L., Van Weverberg, K., Vosper, S., Willett, M., Browse, J., Bushell, A., Carslaw, K., Dalvi, M., Essery, R., Gedney, N., Hardiman, S., Johnson, B., Johnson, C., Jones, A., Jones, C., Mann, G., Milton, S., Rumbold, H., Sellar, A., Ujiie, M., Whitall, M., Williams, K., and Zerroukat, M.: The Met Office Unified Model Global Atmosphere 7.0/7.1 and JULES Global Land 7.0 configurations, Geosci. Model Dev., 12, 1909–1963, https://doi.org/10.5194/gmd-12-1909-2019, 2019. a
Wang, T., Xue, L., Brimblecombe, P., Lam, Y. F., Li, L., and Zhang, L.: Ozone pollution in China: A review of concentrations, meteorological influences, chemical precursors, and effects, Sci. Total Environ., 575, 1582–1596, https://doi.org/10.1016/j.scitotenv.2016.10.081, 2017. a
Wang, W., van der A, R., Ding, J., van Weele, M., and Cheng, T.: Spatial and temporal changes of the ozone sensitivity in China based on satellite and ground-based observations, Atmos. Chem. Phys., 21, 7253–7269, https://doi.org/10.5194/acp-21-7253-2021, 2021. a
Whalley, L. K., Slater, E. J., Woodward-Massey, R., Ye, C., Lee, J. D., Squires, F., Hopkins, J. R., Dunmore, R. E., Shaw, M., Hamilton, J. F., Lewis, A. C., Mehra, A., Worrall, S. D., Bacak, A., Bannan, T. J., Coe, H., Percival, C. J., Ouyang, B., Jones, R. L., Crilley, L. R., Kramer, L. J., Bloss, W. J., Vu, T., Kotthaus, S., Grimmond, S., Sun, Y., Xu, W., Yue, S., Ren, L., Acton, W. J. F., Hewitt, C. N., Wang, X., Fu, P., and Heard, D. E.: Evaluating the sensitivity of radical chemistry and ozone formation to ambient VOCs and NOx in Beijing, Atmos. Chem. Phys., 21, 2125–2147, https://doi.org/10.5194/acp-21-2125-2021, 2021. a
Wild, O.: Modelling the global tropospheric ozone budget: exploring the variability in current models, Atmos. Chem. Phys., 7, 2643–2660, https://doi.org/10.5194/acp-7-2643-2007, 2007. a
Wild, O. and Prather, M. J.: Global tropospheric ozone modeling: Quantifying errors due to grid resolution, J. Geophys. Res.-Atmos., 111, D11305, https://doi.org/10.1029/2005jd006605, 2006. a
Ye, L., Wang, X., Fan, S., Chen, W., Chang, M., Zhou, S., Wu, Z., and Fan, Q.: Photochemical indicators of ozone sensitivity: application in the Pearl River Delta, China, Front. Env. Sci. Eng., 10, 1–14, https://doi.org/10.1007/s11783-016-0887-1, 2016. a
Young, P. J., Archibald, A. T., Bowman, K. W., Lamarque, J.-F., Naik, V., Stevenson, D. S., Tilmes, S., Voulgarakis, A., Wild, O., Bergmann, D., Cameron-Smith, P., Cionni, I., Collins, W. J., Dalsøren, S. B., Doherty, R. M., Eyring, V., Faluvegi, G., Horowitz, L. W., Josse, B., Lee, Y. H., MacKenzie, I. A., Nagashima, T., Plummer, D. A., Righi, M., Rumbold, S. T., Skeie, R. B., Shindell, D. T., Strode, S. A., Sudo, K., Szopa, S., and Zeng, G.: Pre-industrial to end 21st century projections of tropospheric ozone from the Atmospheric Chemistry and Climate Model Intercomparison Project (ACCMIP), Atmos. Chem. Phys., 13, 2063–2090, https://doi.org/10.5194/acp-13-2063-2013, 2013. a
Young, P. J., Naik, V., Fiore, A. M., Gaudel, A., Guo, J., Lin, M., Neu, J., Parrish, D., Rieder, H., and Schnell, J.: Tropospheric Ozone Assessment Report: Assessment of global-scale model performance for global and regional ozone distributions, variability, and trends, Elementa, 6, 10, https://doi.org/10.1525/elementa.265, 2018. a, b
Zhang, J. F., Wei, Y. J., and Fang, Z. F.: Ozone Pollution: A Major Health Hazard Worldwide, Front. Immunol., 10, 2518, https://doi.org/10.3389/fimmu.2019.02518, 2019. a
- Abstract
- Introduction
- Materials and methods
- Model evaluation of tropospheric and surface O3
- O3 changes under future scenarios
- O3 sensitivity in the present day and the future
- Spatial distributions of O3 sensitivity
- Conclusions
- Data availability
- Author contributions
- Competing interests
- Disclaimer
- Acknowledgements
- Financial support
- Review statement
- References