the Creative Commons Attribution 4.0 License.
the Creative Commons Attribution 4.0 License.
 | 26 Aug 2022
Mixing state of black carbon at different atmospheres in north and southwest China
Gang Zhao
Tianyi Tan
Shuya Hu
Zhuofei Du
Dongjie Shang
Zhijun Wu
Jing Zheng
Wenfei Zhu
Mengren Li
Limin Zeng
Large uncertainties remain when estimating the radiative forcing by black carbon (BC) because the corresponding microphysical properties have not been well addressed. In this study, the BC size distributions were studied based on three different field campaigns at an urban site, a suburban site, and a background site in China using a single particle soot photometer (SP2) in tandem with a differential mobility diameter. Measurement results indicate that the BC particles were composed of either thinly or thickly coated aerosols. The mean number fractions of the thinly coated BC aerosols were 51 %, 67 %, and 21 % for the urban, suburban, and background sites, respectively. The corresponding thickly coated (thinly coated) core mass median diameters were 187 (154), 182 (146), and 238 (163) nm, respectively. The mean diameter of the thickly coated BC-containing aerosols was larger than that of the thinly coated BC-containing aerosols, while the mean BC core diameter of the thickly coated BC-containing aerosols was smaller than that of the thinly coated BC-containing aerosols. About 10 % of the BC-containing aerosols with the BC core are attached to the other non-BC components, which were mainly generated by coagulation between the BC and non-BC components. The measurement results in our study can be further used in modeling studies to help with constraining the uncertainties of the BC radiative effects.
- Article
(1359 KB) - Full-text XML
-
Supplement
(1864 KB) - BibTeX
- EndNote


Black carbon (BC) plays an important role in the climate system by absorbing solar radiation (Ramanathan and Carmichael, 2008), interacting with the cloud (Roberts et al., 2008), and changing the albedo of the snow (Menon et al., 2002). It is the second most important aerosol component after carbon dioxide, contributing to global warming (Bond et al., 2013). The solar absorption of BC has a significant influence on the development of the boundary layer and then aggravates the air pollution (Ding et al., 2016). The turbulence in the atmospheric boundary layer can be suppressed due to the existence of BC (Wilcox et al., 2016). The BC also plays a remarkable role in driving the formation and trend of regional haze (Zhang et al., 2020).
BC is mainly generated by the incomplete combustion of biofuels and fossil fuels (Bond and Bergstrom, 2006). After emission, the morphology of BC transforms from fractal to spherical and subsequently grows to a fully compact particle with other chemical components coating it (Peng et al., 2016). During the aging process, the BC optical properties change significantly up to a factor of 3, and then the corresponding magnitude of climate forcing contributed by BC is increased by up to a factor of 2 (Zhang et al., 2008). Large uncertainties remain in estimating the BC radiative effects due to the large variation in BC microphysical properties, such as size distributions and mixing states during the aging process (Zhao et al., 2019; Moffet et al., 2016; Matsui et al., 2018). Therefore, characterizing the differences in size distributions and mixing states between the thinly and thickly coated BC particles can help better constrain the uncertainties of BC aerosol radiative effects. To our best understanding, few studies have specified the mixing states and size distributions of both the thinly and thickly coated BC aerosols.
The thickly coated BC particles can also be classified into two morphological types: bare BC on the surface of non-BC particles or partially coated by non-BC particles (attached type), and BC embedded within or coated by non-BC components (coated type). With the same amount of non-BC components, the mass absorption cross-sections of BC by the attached type are much smaller than those by the coated type (Moteki and Kondo, 2008, 2010; Moteki et al., 2014). Therefore, the impact of BC on climate can be better estimated when accurately identifying the two types of ambient BC-containing particles. Observations are required to constrain the spatial and temporal microphysical properties of the atmospheric BC.
The single-particle soot photometer (SP2) is always used to measure the mixing states and size distributions of ambient BC particles. In the previous study, advanced technology was used to study the coating over different BC core size diameters on the ground (Liu et al., 2019) and for vertical profiles (Ding et al., 2019). The measured signals from SP2 can be used to distinguish the BC-containing aerosols as thinly and thickly coated ones. The measured results can also be employed to distinguish the BC-containing particles between attached and coated types, which were described in detail in the methodology part.
In this study, the tandem SP2 and differential mobility analyzer (DMA) was employed at an urban site, a suburban site, and a background site in China to investigate the microphysical properties of the BC particles. The size distributions and mixing states of both the thinly coated and thickly coated BC aerosols at different atmospheres were characterized. We also investigated the corresponding morphology properties of the BC-containing aerosols. The measured microphysical properties provide the basis for future modeling studies of the BC radiative effects in different environments in China.
2.1 Measurement sites
The measurements were conducted at three different atmospheric sites in China, namely the urban site of Peking University urban atmosphere environment monitoring station (PKU, 39.9∘ N, 116.1∘ E, 58 m a.s.l.) in Beijing between 20 January and 4 February 2016, the suburban site of Changping (CP, 40.3∘ N, 116.2∘ E, 70 m a.s.l.) in Beijing between 15 May and 5 June 2016, and the background site of Lijiang (LJ, 27.2∘ N, 100.2∘ E, 3410 m a.s.l.) in Yunnan Province between 22 March and 4 April 2015. The PKU site is located northwest of Beijing. This site could characterize the air pollution of urban Beijing (Hu et al., 2017; S. Hu et al., 2021). The CP site is located in the northwest of the Beijing urban area, representing a regional atmosphere (Zhao et al., 2021; Wang et al., 2019b). The LJ site represents the background areas, located in the mountain Yulong, in the Yunnan province of China (Shang et al., 2018; Zheng et al., 2017; Wang et al., 2019a). The aerosol optical depth at the wavelength of 550 nm during the year 2020 indicated that the LJ site was very clean, and the PKU and CP sites were more polluted as shown in Fig. S1 in the Supplement.
2.2 Instruments
2.2.1 DMA–SP2 system
As for the SP2, the continuous Nd:YAG laser beam with the wavelength of 1064 nm is generated intensively in the instrument chamber. When the BC-containing particles pass through the laser beam, they absorb the radiation and then are heated to around 3500–5000 K. The intensity of the emitted incandescent light from the heated BC particle is then transformed to the BC mass concentration. The scattering signals of the BC particle are recorded to estimate the BC particle mixing state.
In this study, the SP2 (Droplet Measurement Technology, Inc., USA) was placed after the DMA (Model 3081, TSI, USA) to measure the size-resolved BC mixing states, and the instrument setup is schematically shown in Fig. S2. The DMA was set to scan the aerosol over the size range between 12.3 and 697 nm every five minutes. The flow rate leading to the SP2 and the condensation particle counter (CPC, Model 3776, TSI, USA) were 0.12 and 0.28 L min−1, respectively. The sheath flow of the DMA was 4 L min−1.
The Aquadag was used to calibrate the measured incandescence signal of the SP2 using the DMA–SP2 system. The formula from Gysel et al. (2011) was used to convert the mobility diameter into the mass of Aquadag. A correction factor of 0.75 was applied to account for the different response sensitivity of SP2 to Aquadag and ambient BC (Moteki et al., 2010).
In this study, the coating thickness of the BC-containing aerosols was calculated by the difference between the total mobility diameter (Dp) measured by the DMA and the optical equivalent diameters of the BC core. For details of calculating the optical equivalent coating thickness, refer to Zhang et al. (2018a) and Sect. S3.
2.2.2 Other instruments
The submicron particles (PM1) chemical compositions were measured using a high-resolution time-of-flight aerosol mass spectrometer (AMS; Aerodyne Research Inc., Billerica, MA, USA). The data processing software PIKA (version 1.16) was used for data analysis. The positive matrix factorization (PMF) analysis was conducted for the source appointment of the organic aerosols (Ulbrich et al., 2009). More details on the measurement of the aerosol chemical compositions and data processing can be found in Zheng et al. (2017).
The mass concentrations of O3 were measured using UV absorption (model 49i, Thermo Fisher Inc. USA) with a time resolution of 1 min. The mass concentrations of NO and NO2 were measured using the chemiluminescence technique (NO-NO2-NOx Analyzer, Model 42i, Thermo Scientific, USA). The mass concentrations of SO2 were measured using the ultraviolet fluorescence method (SO2 analyzer, model 43i-TLE, Thermo Scientific, USA). The temperature (T), relative humidity (RH), wind speed (WS), and wind direction (WD) were monitored continuously during these campaigns.
2.3 Methodology
For the BC-containing aerosol, there is a lag between the peak time of the scattering and the incandescence signal (Metcalf et al., 2012). The lag time between the peak scattering signal and the peak incandescence signal can be employed to describe the coating thickness (Moteki and Kondo, 2007; Schwarz et al., 2006) and further used to distinguish the BC-containing aerosols as thinly and thickly coated ones. The lag-time probability distribution at our measurement sites also shows two modes which will be shown in Sect. 3.2, and thus the lag time can be used to efficiently distinguish the BC-containing aerosols as thinly and thickly coated ones here. It should be noted that the time-lag method may not effectively distinguish the BC particles between fresh or aged ones because some BC particles sourced from biomass burning (Schwarz et al., 2008a) and solid fuel burning (Liu et al., 2014, 2020) initially have thick coating but cannot be grouped into aged BC particles.
For the thickly coated BC particles, the measured scattering and incandescence signal can also be employed to distinguish the BC-containing particles as attached and coated types (Moteki et al., 2014) by calculating the time-dependent scattering cross-sections of BC-containing particles (Moteki and Kondo, 2007). For the coated type, all of the coating material will evaporate and the scattering cross-sections will decrease to zero after passing through the laser beam, while the scattering cross-section of the attached BC-containing aerosol will not decrease to zero (Moteki and Kondo, 2008). The method adopted by Dahlkötter et al. (2014) was employed here to characterize the morphology of the BC-containing aerosols. For details of distinguishing the BC-containing particles as attached and coated types, also refer to Sect. S4.
3.1 Overview of the measurement results in different atmospheres
The time series of the measurement results are shown in Figs. S6–S8 for the PKU, CP, and LJ sites, respectively. For the PKU site, the wind was mainly from the north and the wind speed was low with a mean value of 2.2 m s−1. The ambient atmosphere was very dry with a mean RH of 27.6 %, with minimum and maximum values of 5.8 % and 72.6 %, respectively. The temperature in the winter in Beijing had a mean value of 0.8 ∘C between −5.9 and 9.2 ∘C. The mean mass concentration of PM2.5 was 49.3 ± 55.4 µg m−3. The concentration of SO2 and NOx () had the same trends as PM2.5, with mean values of 16.3 ± 11.9 and 68.2 ± 63.4 ppb, respectively. The O3 concentration is anti-correlated with PM2.5. For the suburban site CP, the wind showed obvious diurnal cycles with high-speed west wind during the day and low-speed east wind during the night. The mean wind speed was 2.4 ± 1.6 m s−1. The RH during the campaign was 38.8 % ± 16.0 %, with a maximum value of 80.5 %. The temperature during the campaign was 21.8 ± 5.2 ∘C with a maximum value of 33.2 ∘C. As for the NOx, the mean concentration was 21.4 ± 17.7 ppb. The mean concentration of SO2 was 2.89 ± 1.10 ppb. The measured mean O3 concentration was 54.5 ± 38.8 ppb. The mean PM2.5 concentration was 22.6 ± 16.8 µg m−3, with a maximum value of 71.8 µg m−3. As for the background LJ site, The mean value of the wind speed, RH, and T were 3.13 m s−1, 50.23 %, and 6.5 ∘C, respectively. The mean PM2.5 mass concentration was 6.2 ± 5.7 µg m−3. The mean NOx and SO2 concentrations were 0.05 and 0.97 ppb respectively.
The characteristics of the measurement sites are summarized and shown in Fig. 1. The differences in the temperature and RH among these sites mainly resulted from the fact that the measurements were conducted in different seasons. The concentrations of SO2, NOx, and PM2.5 indicated that the urban site PKU was the most polluted. The suburban site CP was slightly polluted and the background LJ was the cleanest.
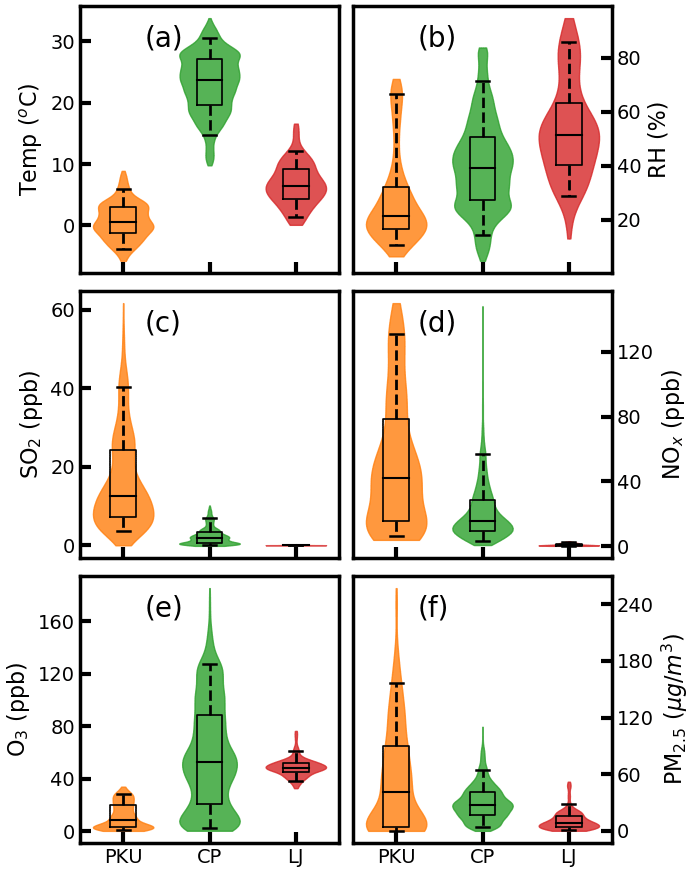
Figure 1The measured distribution of (a) temperature, (b) RH, (c) SO2, (d) NOx, (e) O3, and (f) PM2.5 for PKU (orange), CP (green), and LJ (red) sites, respectively. The box and whisker plots represent the 5th, 25th, 75th, and 95th percentiles. The width of the filled colors represents the probability distributions of the corresponding measured values.
The air mass back trajectories as shown in Fig. S9 during the measurement at PKU show that the measurement site was mainly influenced by the polluted air from the south and southeast, and the relatively clean air from the northwest. The CP site was mainly influenced by the clean air from the northwest and the polluted air from the southeast. The air mass of the LJ site was mainly from the southwest and west.
3.2 Mixing states of the thinly coated and thickly coated BC-containing aerosols
The measured lag-time probability distributions for the PKU, CP, and LJ sites are shown in Fig. 2a–c, respectively. The lag time had two modes for each measurement site. The BC particles are sorted as thinly or thickly coated BC. A two log-normal distribution was used for the probability distribution of the lag time for BC-containing particles as
where Δt is the lag time, Ai, σg,i, Δti are the scale factor, geometric standard deviation, and geometric mean lag time of mode i, respectively. The critical lag time that distinguishes the thinly and thickly BC particles was determined by calculating the value when the probability distribution values of mode 1 and mode 2 are equal. In this study, the BC-containing aerosols with a lag time larger than 1.4 µs were classified as thickly coated particles for the LJ site. The other BC-containing aerosols were classified as thinly coated particles. Our critical lag time of 1.4 µs is smaller than the previous studies that distinguished the BC-containing aerosols between thinly coated BC and thickly coated BC with a lag time of 2 µs (Moteki and Kondo, 2007; Metcalf et al., 2012), 1.8 µs (Metcalf et al., 2012), and 4.2 µs (Liu et al., 2010), which was determined by the internal setup up of the SP2. The critical lag time for the PKU and CP sites were 1.3 and 1.7 µs, respectively.
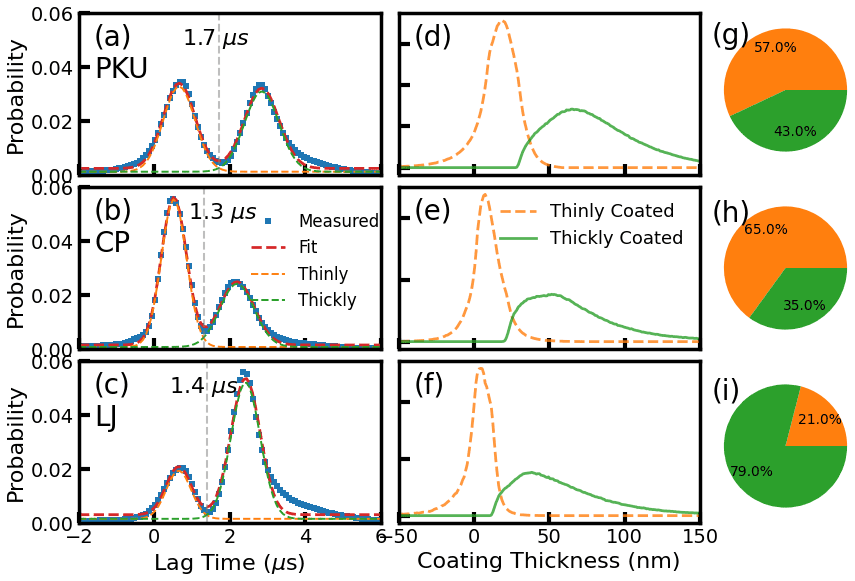
Figure 2(a) The measured probability distribution of the lag time for the PKU site. Panel (d) shows the corresponding coating thickness distributions of thinly coated (orange) and thickly coated (green) BC-containing aerosols. Panel (g) gives the number fraction of the thinly coated (orange) and thickly coated (green) BC-containing aerosols. Panels (b), (e), and (h) are the corresponding values for the CP site. Panels (c), (f), and (g) give the results for LJ sites.
For each type of BC-containing aerosols, we calculated the coating thickness probabilities and the results are shown in Fig. 2d–f for the PKU, CP, and LJ sites, respectively. Results showed that the BC-containing aerosols were mainly composed of thickly coated BC aerosols and thinly coated BC aerosols. The coating thickness for the thinly coated BC-containing aerosol was smaller than that of the thickly coated BC-containing aerosols. However, the coating thickness of the thickly coated BC-containing aerosols spread wider than that of the thinly coated ones.
The number fractions of the thickly coated BC-containing aerosols were significantly different for different atmospheres as shown in Fig. 2g–i. At the polluted urban site, the number concentration of the thickly coated BC-containing aerosols was comparable to that of the thinly coated BC-containing aerosols, with the number fractions of 56 % and 44 % for the thinly coated and thickly coated BC particles, respectively. The number fraction of the thickly coated BC aerosols at the CP site was 67 %. However, the BC-containing aerosols at the background LJ site were dominated by thickly coated ones with a number fraction of 81 %.
The difference in the number fraction of the thickly coated BC particles was synthetically influenced by the ambient pollution levels and the sources of the BC aerosols. The suburban site CP had the largest number fraction of the thinly coated BC particles. The CP site is not far from the urban, and thus the thinly coated BC particles from the traffic contribute a large amount of the total ones. The urban site PKU had a larger number fraction of the thickly coated BC than that of the CP site. This might be resulting from the PKU site being more polluted than the CP site and then the aging processing at the PKU site was faster than that at the CP site. The LJ site is far from the traffic sources. The measured BC particles at the LJ site were mainly from long-range transportation and experienced a longer time of aging process than that at the CP and PKU sites. Therefore, the BC-containing aerosols were dominated by the thickly coated ones at the LJ sites.
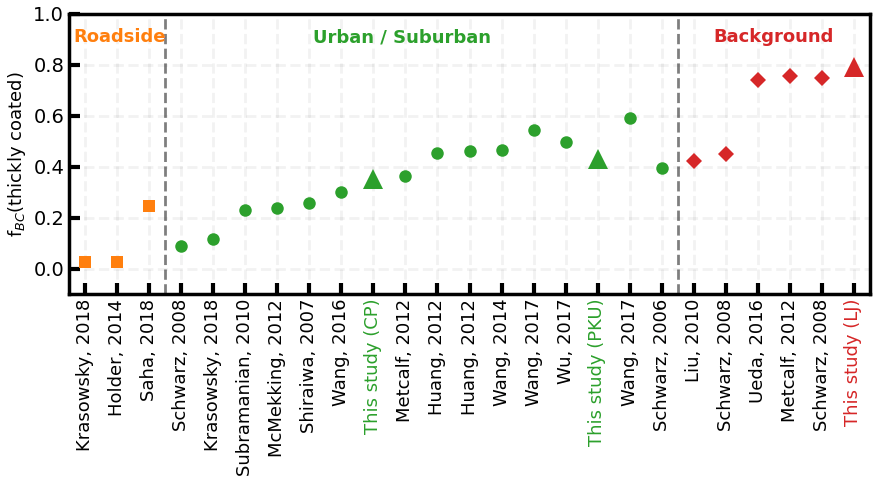
Figure 3Measured number fraction of the thickly coated BC under different atmospheric environments based on literature. Our measured values are shown as triangles.
We compared the number fraction of the thickly coated BC at different measurement sites from literature (Ueda et al., 2016; Schwarz et al., 2008a, b; Y. Wang et al., 2017; J. Wang et al., 2017; Wu et al., 2017; Q. Wang et al., 2017; Wang et al., 2014, 2016; Huang et al., 2012; Metcalf et al., 2012; Shiraiwa et al., 2007; McMeeking et al., 2012; Subramanian et al., 2010; Saha et al., 2018; Krasowsky et al., 2018; Holder et al., 2014) and the results are shown in Fig. 3. The number fraction values were divided into three different kinds of groups, namely the roadside, urban or suburban, and background. Results from Fig. 3 show that the number fractions at the roadside tend to be the lowest. These sites were close to the traffic sources and the measured BC-containing aerosols were mainly from the traffic. The left part of the green circles corresponds to the relatively clean urban or suburban sites with the number fractions of the thickly coated BC around 30 %. However, the number fractions of the relative polluted urban or suburban sites had a larger number fraction of the thickly coated BC around 50 %. The number fractions of the thickly coated BC at the background sites were the largest. Therefore, the number fractions of the thickly coated BC-containing aerosols were synthetically influenced by the distance from the primary source and the pollution levels of the ambient atmosphere. The number fraction of the thickly coated BC-containing aerosols increased with the distance from the primary emission sources and the pollution levels. Our results were consistent with the aerial measurement by Metcalf et al. (2012), who found that the number fraction of the thickly coated BC was 29 %–41 % at the top of the Los Angeles city and 47 %–54 % for the out plume of this city.
For a better understanding of the source of the thinly coated and thickly coated BC, we compared the number concentrations of the BC-containing aerosols with the source apportionment results from the AMS data for the CP site. Among the PMF results, the factor of hydrocarbon-like organic aerosol (HOA) is mainly composed of long-chain hydrocarbon, and oxygenated organic aerosol (OOA) is mainly from the secondary formation. HOA is mainly from the diesel exhaust, gasoline exhaust, and lubricating oil emission. From Fig. 4a, the number concentration of the thinly coated BC and mass concentration of HOA showed good consistency, with R2 equaling 0.69 as shown in Fig. S10, which further proved the evidence that the thinly coated BC-containing aerosols were from the traffic sources. The time series of the thickly coated BC and OOA showed good consistency as shown in Fig. 4b, with R2 equaling 0.87. Therefore, the aging processing of the ambient BC was accompanied by the ambient OA. The mass concentration of OOA and the number concentration of thickly coated BC can be used as good indicators for each other.
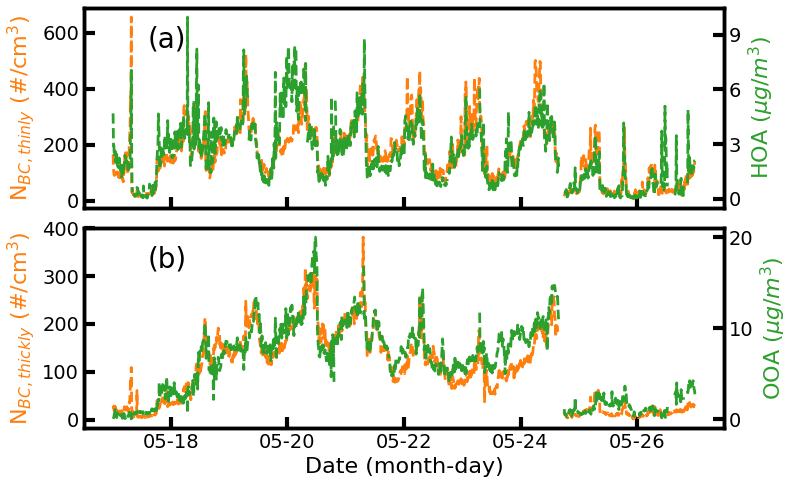
Figure 4The time series of (a) the number concentration of the thinly coated BC (orange) and the mass concentration of HOA (green), (b) the number concentration of thickly coated BC (orange), and the mass concentration of OOA (green) for the CP site.
3.3 Size distributions of the thinly coated and thickly coated BC-containing aerosols
The size distributions of the BC-containing aerosols exert a significant influence on their corresponding radiative effects (Zhao et al., 2019; Matsui et al., 2018). We calculated the number size distribution (NSD) of BC-containing aerosols for the thinly coated and thickly coated ones at different sites, and the results are shown in Fig. 5. It should be noted that the Dp in Fig. 5 corresponds to the mobility diameter from the DMA. The BC-containing aerosol NSD was further fit using the log-normal distribution.
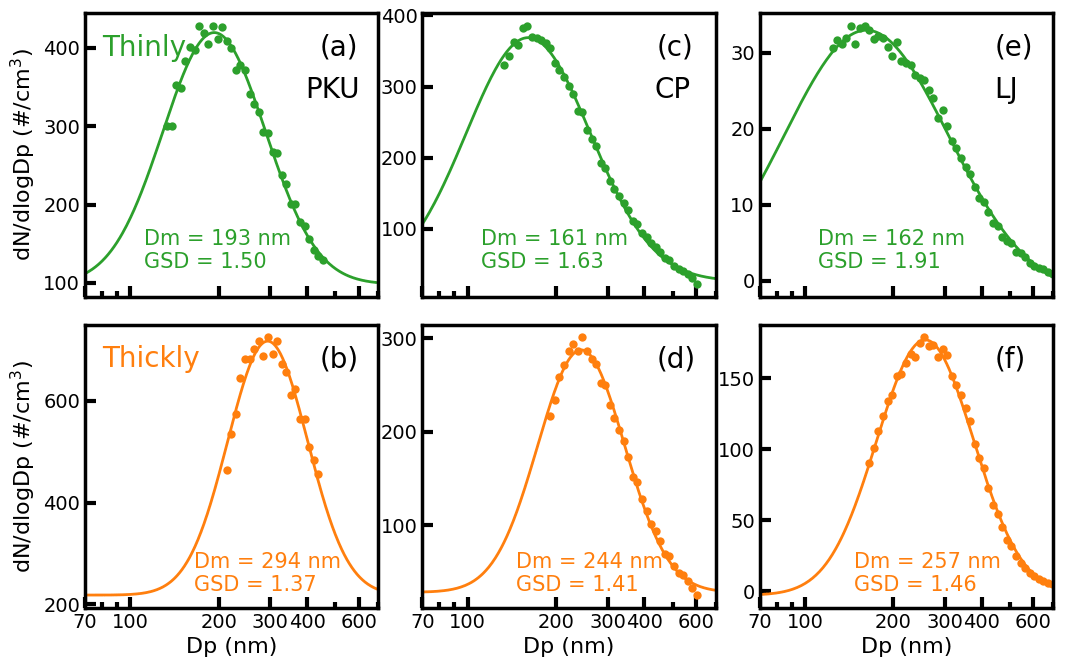
Figure 5The number size distributions of the thinly coated BC-containing aerosols at (a) PKU, (c) CP, and (e) LJ sites. Panels (b), (d), and (f) are the number size distributions of the thickly coated BC-containing aerosols for the PKU, CP, and LJ sites, respectively. The dots in the figure are the measurement results and the lines are the corresponding fit results with a log-normal distribution.
As for the thinly coated BC-containing aerosols, the geometric mean diameters were 193, 161, and 162 nm for the PKU, CP, and LJ sites, respectively. The geometric standard deviations (GSD) of the BC-containing aerosol NSD were 1.50, 1.63, and 1.91 for the PKU, CP, and LJ sites, respectively. The GSD to some extent reflects the diversity of the BC sources. The LJ site had the largest GSD, which indicated multiple sources of thinly coated BC-containing aerosols. The LJ site was highly influenced by atmospheric transportation, due to the high altitude of this location (Zheng et al., 2017; Tan et al., 2021). Therefore, the thinly coated BC-containing aerosols could be originated from different orientations. As for the urban site PKU, the thinly coated BC aerosols were mainly from urban lifestyle emissions. Therefore, the thinly coated BC aerosols at the PKU site had the lowest value of the GSD. However, the thinly coated BC aerosols at the suburban site CP were influenced synthetically by urban lifestyle sources and some other sources from suburban, and thus had a larger value of GSD than that of PKU.
As for the thickly coated BC, it is obvious that they had larger diameters than those of the thinly coated BC due to the coating of other non-BC components. The geometric mean Dp values of the thickly coated BC were 294, 244, and 257 nm for the PKU, CP, and LJ sites, respectively. The corresponding GSD values were 1.37, 1.41, and 1.46.
Based on the above results, the geometric mean Dp values of the thickly coated BC aerosols were larger than that of the thinly coated BC aerosols by 52 %, 52 %, and 59 % for the PKU, CP, and LJ sites, respectively. The GSD values of the thickly coated BC were consistent with that of the thinly coated BC with the lowest value at the PKU site and highest value at the LJ site, which is consistent with the diversity of the sources of BC-containing aerosols. For each site, the GSD values of the thickly coated BC aerosols were smaller than that of the thinly coated ones. The GSD of BC-containing aerosols tends to be smaller during the aging processing because the increment of the diameter should decrease with the diameter.
3.4 Size distribution of the thinly coated and thickly coated BC core
The number and mass concentrations of the BC core under different mass equivalent diameters were calculated and the results are shown in Fig. 6 and Table 1. It should be noted here that, when it comes to the BC size distribution, the mass-equivalent diameter of BC cores (Dme) (assuming a density of 1.8 g cm−3) was adopted in this study for direct comparison with previous studies.
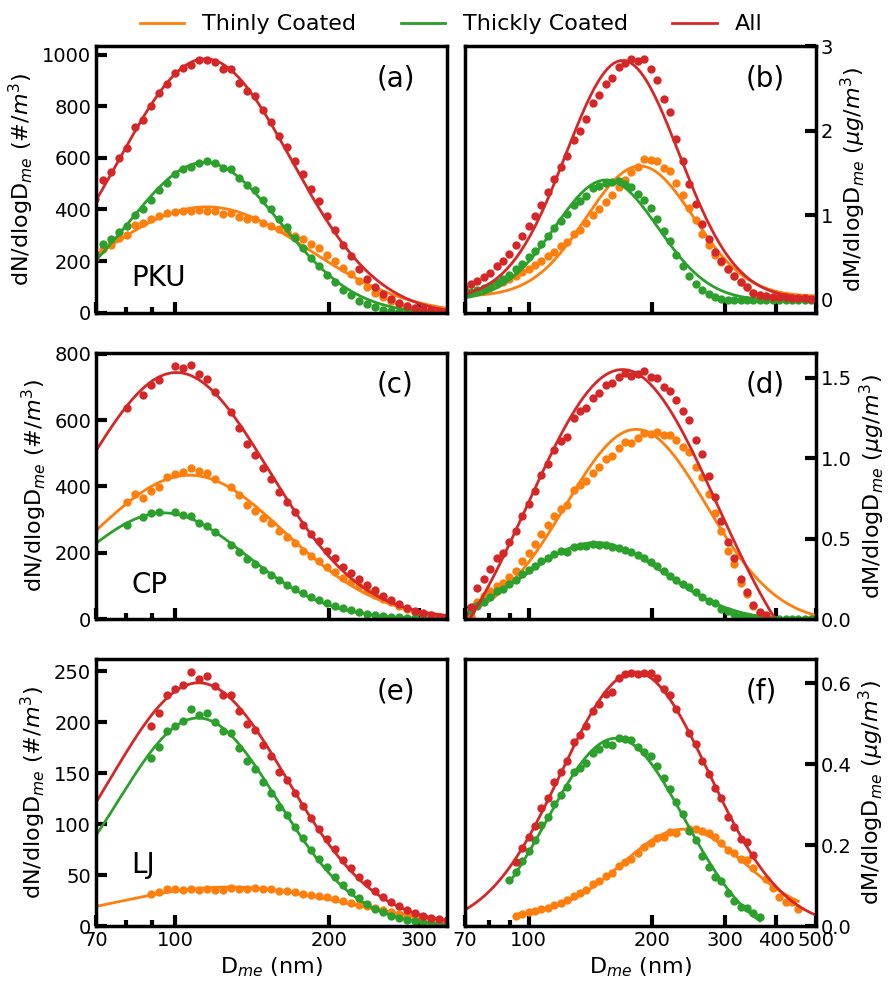
Figure 6The BC core number size distributions of the thinly coated (orange), thickly coated (green), and overall (red) BC aerosols for the (a) PKU, (c) CP, and (e) LJ sites. Panels (b), (d), and (f) show the BC core mass distributions of the thinly coated (orange), thickly coated (orange), and overall (red) BC aerosols for the PKU, CP, and LJ sites, respectively.
Table 1The Dme and GSD values of the BC core at different sites.
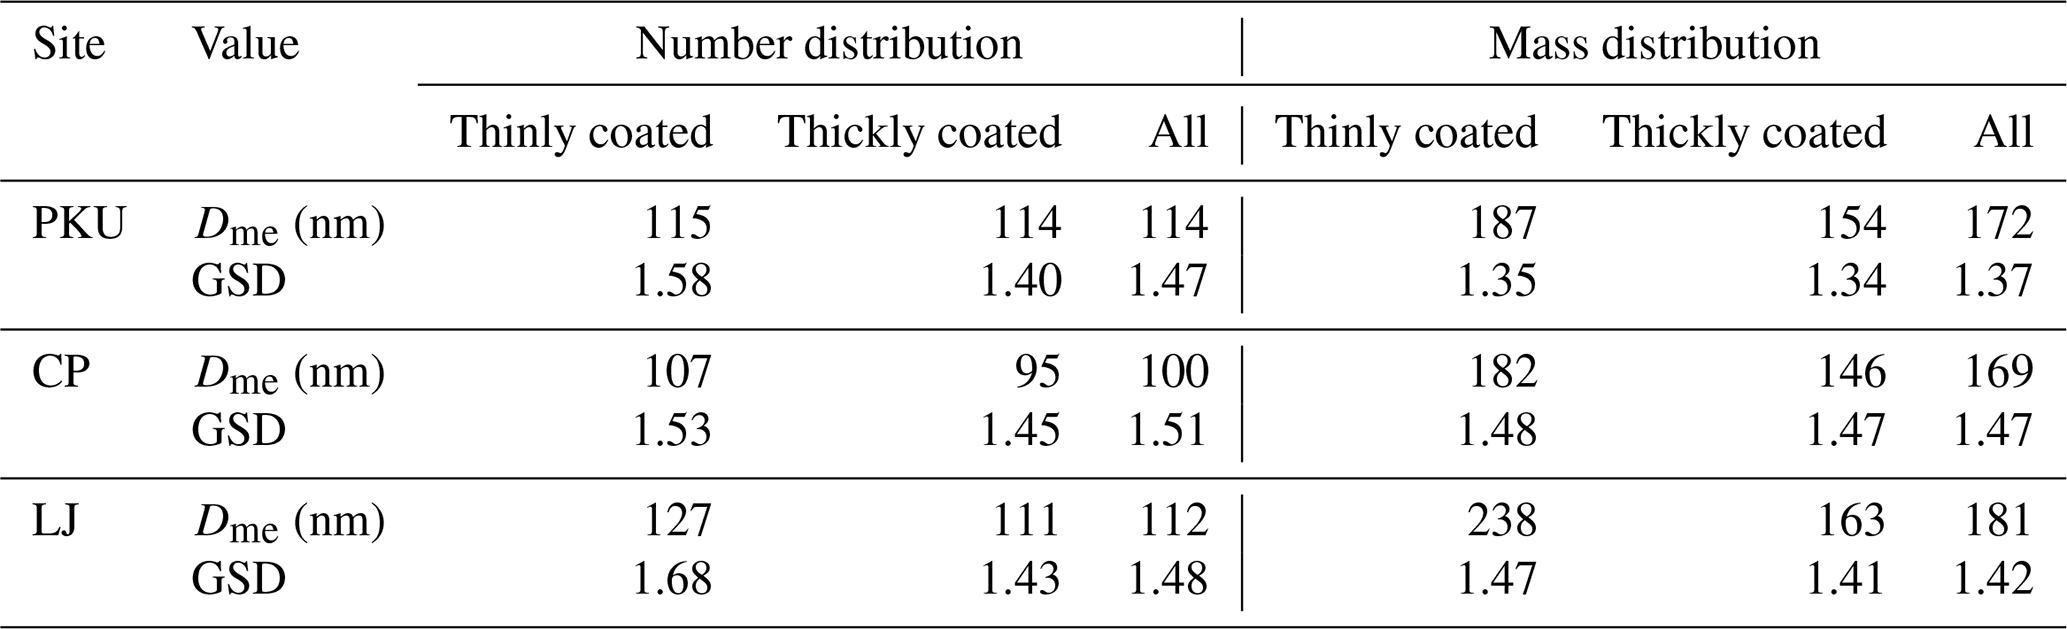
As for the number size distribution of the BC core, the geometric mean Dme of the thinly coated BC particles were 115, 107, and 127 nm, for the PKU, CP, and LJ sites respectively. The corresponding GSD values are 1.58, 1.53, and 1.68, respectively. The Dme for the thickly coated BC particles were 114, 95, and 111 nm for the PKU, CP, and LJ sites respectively, and the corresponding GSD values were 1.40, 1.45, and 1.43, respectively. Both the GSD and the Dme of the thickly coated BC were smaller than that of the thinly coated BC. The overall geometric mean diameter of the BC core number size distributions are 114, 100, and 111 nm for the PKU, CP, and LJ sites respectively.
There are mainly three possible reasons that may lead to the rather smaller geometric mean diameter for the thinly coated BC than the thickly coated BC. First, the smaller BC core tends to have a higher time lag as a smaller BC core will take a longer time to evaporate the coating on it, and thus the thinly coated particles tend to have smaller core diameters. Second, it takes less time for the smaller BC particles to grow the same amount of coating thickness when the increment of the BC particles was dominated by condensation. Thirdly, the small BC particles may have a longer life than the large BC particles.
As for the mass size distribution of the BC core, the geometric mean Dme of the thinly coated BC were 187, 182, and 238 nm for the PKU, CP, and LJ sites, respectively, and the corresponding GSD values were 1.35, 1.48, and 1.47. The overall geometric mean diameter of the BC core mass distributions are 172, 169, and 181 nm for the PKU, CP, and LJ sites respectively. The geometric mean diameter of the BC core mass distributions of 172 nm in PKU was slightly smaller than that of Liu et al. (2019), with a geometric mean diameter of 195 nm in another measurement in the urban environment in Beijing and comparable to Zhang et al. (2018b) with a geometric mean diameter of the BC core around 180 nm.
3.5 Morphology of the BC-containing aerosols
The time series of the number fractions of the attached BC-containing aerosols to the total BC-containing aerosols (fattached) are shown in Fig. 7. From Fig. 7, the fattached ranged between 0 and 0.21 with a mean value of 7.2 % ± 3.7 %, 11.0 % ± 3.7 %, and 10.1 % ± 4.1 %. Moteki et al. (2014) found that the fattached was generally less than 0.1 in Tokyo. The fattached ranged between 3 % and 16 % in suburban London (Liu et al., 2015). A mean value of 12 % was found for biomass burning particles using electron microscopy (China et al., 2013). Our measurement results were consistent with the previous studies. The fattached tend to increase with the PM2.5 for different sites, which may indicate that the attached BC-containing aerosols were generated from the coagulation of BC and non-BC aerosols.
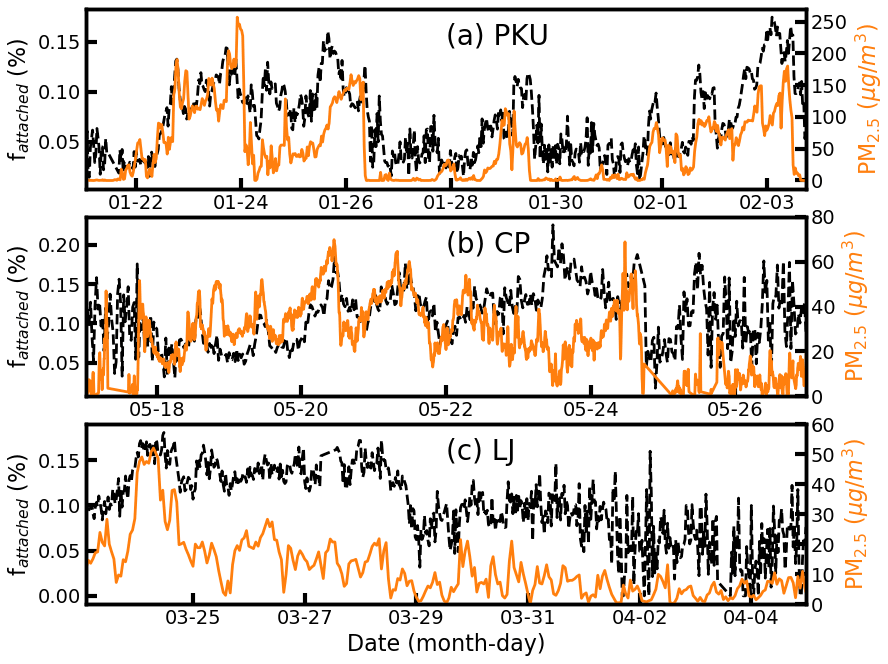
Figure 7The time series of the number fractions of the attached BC (black) and PM2.5 mass concentrations (orange) for the (a) PKU, (b) CP, and (c) LJ sites.
We calculated the fattached under different aerosol diameters and the results are shown in Fig. 8. There were few attached BC-containing aerosols when the diameter was smaller than 250 nm with fattached lowing than 2 %. The fattached increased with the diameter for all of the measurement sites. It could reach 30 % for the LJ sites. Based on the results from the electron microscopy, the BC volume fractions are smaller than those of the non-BC volume fractions in the attached BC aerosols (Moteki et al., 2014). The increment of fattached with Dp is essentially consistent with the results from K. Hu et al. (2021) that larger Dp contains more fractal BC, which is hard to be enveloped by coatings. Our results further indicate that the attached BC aerosols were formed from coagulation, as the coagulation efficiency of the two particles increased with the difference between their sizes (Cai and Jiang, 2017; Kim et al., 2016; Mahfouz and Donahue, 2021).
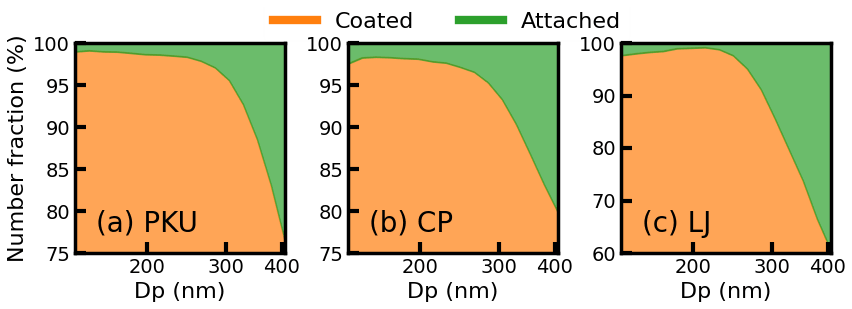
Figure 8The number fractions of the coated and attached BC under different diameters for the (a) PKU, (b) CP, and (c) LJ sites.
Under the heavier pollution, more secondary aerosol forms and more condensation process would on one hand, increase the coating of the previously coated BC particles, which would not increase the number fraction of coated BC. On the other hand, the condensation process would coat on the attached BC particle and to some content would lead to the transformation from the attached BC to coated BC particles. Based on our measurement results, the above process of transformation from attached BC to coated BC may not be comparable to the process of coagulation between thinly coated BC and non-BC particles, which would lead to the increment of the fraction of attached BC with the pollution levels.
The fattached under different aerosol number concentrations (N) and different ratios of the BC-free aerosol number concentrations to the BC-containing aerosol number concentrations are shown in Fig. 9. Results showed that the fattached increased with the above two factors. The results were consistent with the fact that the coagulation between BC and non-BC components is more likely to happen with the increment of the BC-free aerosol number concentrations. Based on the analysis above, we concluded that the attached BC-containing aerosols are mainly formed through coagulation.
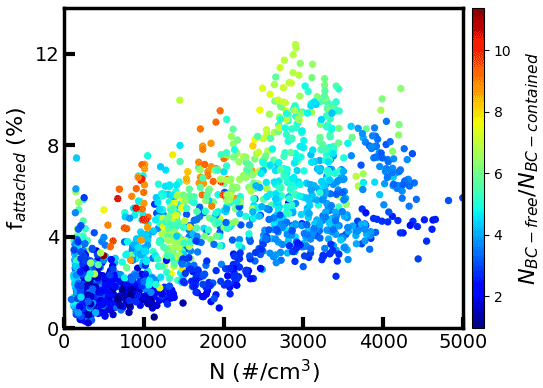
Figure 9The number fractions of the attached BC aerosols under different total aerosol number concentrations for the CP sites. The filled colors represent the ratios between the BC-fee aerosol number concentrations to the BC-containing aerosol number concentrations.
In this study, the BC microphysical properties were studied based on field measurement using the DMA–SP2 system at the urban site PKU, suburban site CP, and a background site LJ in China.
The number fractions of the thickly coated BC-containing aerosols were 49 %, 33 %, and 79 % for the PKU, CP, and LJ sites, respectively. The mass concentrations of the thinly coated BC-containing aerosols showed good consistency with that of HOA, which indicated that the thinly coated BC-containing aerosols were mainly generated from the emission of vehicles. The thickly coated BC-containing aerosols are highly correlated with the OOA.
The geometric diameter of the thinly coated BC-containing aerosols ranged between 160 and 200 nm, while the corresponding range was 240–300 nm for the thickly coated BC-containing aerosols. The GSD of the BC-containing aerosols decreased during the aging process. The corresponding mobility diameters of these thickly coated (thinly coated) BC-containing aerosols were 294 (193), 244 (161), and 257 (162) nm. The measured thickly coated (thinly coated) BC core number median diameters were 115 (114), 107 (95), and 127 (111) nm for the urban, suburban, and background sites, respectively. The corresponding thickly coated (thinly coated) core mass median diameters were 187 (154), 182 (146), and 238 (163) nm respectively. The mean diameter of the thickly coated BC-containing aerosols was larger than that of the thinly coated BC-containing aerosols, while the mean BC core diameter of the thickly coated BC-containing aerosols was smaller than that of the thinly coated BC-containing aerosols. There are about 10 % of the BC-containing aerosols with the BC core attached to the other non-BC components. We concluded that these attached BC-containing aerosols were mainly generated by coagulation between the BC and non-BC components even though the aging of the ambient BC aerosols was driven by condensation.
The data is available at https://doi.org/10.5281/zenodo.5816310 (Zhao, 2022).
The supplement related to this article is available online at: https://doi.org/10.5194/acp-22-10861-2022-supplement.
GZ, TT, SH, ZW, SG, JZ, ML, LZ, and MH gave the conceptualization. GZ wrote the manuscript. GZ wrote original draft. GZ and TT finished the visualization. TT, SH, ZD, DS, ZW, SG, JZ, WZ, ML, LZ and MH finished the data curation. MH is responsible for the resources, supervision and draft revision.
The contact author has declared that none of the authors has any competing interests.
Publisher's note: Copernicus Publications remains neutral with regard to jurisdictional claims in published maps and institutional affiliations.
This research has been supported by the China Postdoctoral Science Foundation (grant no. 2021M700192) and the National Natural Science Foundation of China (grant no. 91844301).
This paper was edited by Samara Carbone and reviewed by two anonymous referees.
Bond, T. C. and Bergstrom, R. W.: Light Absorption by Carbonaceous Particles: An Investigative Review, Aerosol Sci. Tech., 40, 27–67, https://doi.org/10.1080/02786820500421521, 2006.
Bond, T. C., Doherty, S. J., Fahey, D. W., Forster, P. M., Berntsen, T., DeAngelo, B. J., Flanner, M. G., Ghan, S., Karcher, B., Koch, D., Kinne, S., Kondo, Y., Quinn, P. K., Sarofim, M. C., Schultz, M. G., Schulz, M., Venkataraman, C., Zhang, H., Zhang, S., Bellouin, N., Guttikunda, S. K., Hopke, P. K., Jacobson, M. Z., Kaiser, J. W., Klimont, Z., Lohmann, U., Schwarz, J. P., Shindell, D., Storelvmo, T., Warren, S. G., and Zender, C. S.: Bounding the role of black carbon in the climate system: A scientific assessment, J. Geophys. Res.-Atmos., 118, 5380–5552, https://doi.org/10.1002/jgrd.50171, 2013.
Cai, R. and Jiang, J.: A new balance formula to estimate new particle formation rate: reevaluating the effect of coagulation scavenging, Atmos. Chem. Phys., 17, 12659–12675, https://doi.org/10.5194/acp-17-12659-2017, 2017.
China, S., Mazzoleni, C., Gorkowski, K., Aiken, A. C., and Dubey, M. K.: Morphology and mixing state of individual freshly emitted wildfire carbonaceous particles, Nat. Commun., 4, 2122, https://doi.org/10.1038/ncomms3122, 2013.
Dahlkötter, F., Gysel, M., Sauer, D., Minikin, A., Baumann, R., Seifert, P., Ansmann, A., Fromm, M., Voigt, C., and Weinzierl, B.: The Pagami Creek smoke plume after long-range transport to the upper troposphere over Europe – aerosol properties and black carbon mixing state, Atmos. Chem. Phys., 14, 6111–6137, https://doi.org/10.5194/acp-14-6111-2014, 2014.
Ding, A., Huang, X., Nie, W., Sun, J., Kerminen, V.-M., Petäjä, T., Su, H., Cheng, Y., Yang, X.-Q., Wang, M., Chi, X., Wang, J., Virkkula, A., Guo, W., Yuan, J., Wang, S. R., Zhang, R., Wu, Y., Song, Y. C., Zhu, T., Zilitinkevich, S., Kulmala, M., and Fu, C.: Enhanced haze pollution by black carbon in megacities in China, Geophys. Res. Lett., 43, 2873–2879, 2016.
Ding, S., Liu, D., Zhao, D., Hu, K., Tian, P., Zhou, W., Huang, M., Yang, Y., Wang, F., Sheng, J., Liu, Q., Kong, S., Cui, P., Huang, Y., He, H., Coe, H., and Ding, D.: Size-Related Physical Properties of Black Carbon in the Lower Atmosphere over Beijing and Europe, Environ. Sci. Technol., 53, 11112–11121, https://doi.org/10.1021/acs.est.9b03722, 2019.
Gysel, M., Laborde, M., Olfert, J. S., Subramanian, R., and Gröhn, A. J.: Effective density of Aquadag and fullerene soot black carbon reference materials used for SP2 calibration, Atmos. Meas. Tech., 4, 2851–2858, https://doi.org/10.5194/amt-4-2851-2011, 2011.
Holder, A. L., Hagler, G. S. W., Yelverton, T. L. B., and Hays, M. D.: On-road black carbon instrument intercomparison and aerosol characteristics by driving environment, Atmos. Environ., 88, 183–191, https://doi.org/10.1016/j.atmosenv.2014.01.021, 2014.
Hu, K., Liu, D., Tian, P., Wu, Y., Deng, Z., Wu, Y., Zhao, D., Li, R., Sheng, J., Huang, M., Ding, D., Li, W., Wang, Y., and Wu, Y.: Measurements of the Diversity of Shape and Mixing State for Ambient Black Carbon Particles, Geophys. Res. Lett., 48, e2021GL094522, https://doi.org/10.1029/2021gl094522, 2021.
Hu, S., Zhao, G., Tan, T., Li, C., Zong, T., Xu, N., Zhu, W., and Hu, M.: Current challenges of improving visibility due to increasing nitrate fraction in PM2.5 during the haze days in Beijing, China, Environ. Pollut., 290, 118032, https://doi.org/10.1016/j.envpol.2021.118032, 2021.
Hu, W., Hu, M., Hu, W.-W., Zheng, J., Chen, C., Wu, Y., and Guo, S.: Seasonal variations in high time-resolved chemical compositions, sources, and evolution of atmospheric submicron aerosols in the megacity Beijing, Atmos. Chem. Phys., 17, 9979–10000, https://doi.org/10.5194/acp-17-9979-2017, 2017.
Huang, X.-F., Sun, T.-L., Zeng, L.-W., Yu, G.-H., and Luan, S.-J.: Black carbon aerosol characterization in a coastal city in South China using a single particle soot photometer, Atmos. Environ., 51, 21–28, https://doi.org/10.1016/j.atmosenv.2012.01.056, 2012.
Kim, Y.-H., Yiacoumi, S., Nenes, A., and Tsouris, C.: Charging and coagulation of radioactive and nonradioactive particles in the atmosphere, Atmos. Chem. Phys., 16, 3449–3462, https://doi.org/10.5194/acp-16-3449-2016, 2016.
Krasowsky, T. S., McMeeking, G. R., Sioutas, C., and Ban-Weiss, G.: Characterizing the evolution of physical properties and mixing state of black carbon particles: from near a major highway to the broader urban plume in Los Angeles, Atmos. Chem. Phys., 18, 11991–12010, https://doi.org/10.5194/acp-18-11991-2018, 2018.
Liu, D., Flynn, M., Gysel, M., Targino, A., Crawford, I., Bower, K., Choularton, T., Jurányi, Z., Steinbacher, M., Hüglin, C., Curtius, J., Kampus, M., Petzold, A., Weingartner, E., Baltensperger, U., and Coe, H.: Single particle characterization of black carbon aerosols at a tropospheric alpine site in Switzerland, Atmos. Chem. Phys., 10, 7389–7407, https://doi.org/10.5194/acp-10-7389-2010, 2010.
Liu, D., Allan, J. D., Young, D. E., Coe, H., Beddows, D., Fleming, Z. L., Flynn, M. J., Gallagher, M. W., Harrison, R. M., Lee, J., Prevot, A. S. H., Taylor, J. W., Yin, J., Williams, P. I., and Zotter, P.: Size distribution, mixing state and source apportionment of black carbon aerosol in London during wintertime, Atmos. Chem. Phys., 14, 10061–10084, https://doi.org/10.5194/acp-14-10061-2014, 2014.
Liu, D., Joshi, R., Wang, J., Yu, C., Allan, J. D., Coe, H., Flynn, M. J., Xie, C., Lee, J., Squires, F., Kotthaus, S., Grimmond, S., Ge, X., Sun, Y., and Fu, P.: Contrasting physical properties of black carbon in urban Beijing between winter and summer, Atmos. Chem. Phys., 19, 6749–6769, https://doi.org/10.5194/acp-19-6749-2019, 2019.
Liu, H., Pan, X., Liu, D., Liu, X., Chen, X., Tian, Y., Sun, Y., Fu, P., and Wang, Z.: Mixing characteristics of refractory black carbon aerosols at an urban site in Beijing, Atmos. Chem. Phys., 20, 5771–5785, https://doi.org/10.5194/acp-20-5771-2020, 2020.
Liu, S., Aiken, A. C., Gorkowski, K., Dubey, M. K., Cappa, C. D., Williams, L. R., Herndon, S. C., Massoli, P., Fortner, E. C., Chhabra, P. S., Brooks, W. A., Onasch, T. B., Jayne, J. T., Worsnop, D. R., China, S., Sharma, N., Mazzoleni, C., Xu, L., Ng, N. L., Liu, D., Allan, J. D., Lee, J. D., Fleming, Z. L., Mohr, C., Zotter, P., Szidat, S., and Prevot, A. S.: Enhanced light absorption by mixed source black and brown carbon particles in UK winter, Nat. Commun., 6, 8435, https://doi.org/10.1038/ncomms9435, 2015.
Mahfouz, N. G. A. and Donahue, N. M.: Technical note: The enhancement limit of coagulation scavenging of small charged particles, Atmos. Chem. Phys., 21, 3827–3832, https://doi.org/10.5194/acp-21-3827-2021, 2021.
Matsui, H., Hamilton, D. S., and Mahowald, N. M.: Black carbon radiative effects highly sensitive to emitted particle size when resolving mixing-state diversity, Nat. Commun., 9, 3446, https://doi.org/10.1038/s41467-018-05635-1, 2018.
McMeeking, G. R., Bart, M., Chazette, P., Haywood, J. M., Hopkins, J. R., McQuaid, J. B., Morgan, W. T., Raut, J.-C., Ryder, C. L., Savage, N., Turnbull, K., and Coe, H.: Airborne measurements of trace gases and aerosols over the London metropolitan region, Atmos. Chem. Phys., 12, 5163–5187, https://doi.org/10.5194/acp-12-5163-2012, 2012.
Menon, S., Hansen, J., Nazarenko, L., and Luo, Y.: Climate effects of black carbon aerosols in China and India, Science, 297, 2250–2253, https://doi.org/10.1126/science.1075159, 2002.
Metcalf, A. R., Craven, J. S., Ensberg, J. J., Brioude, J., Angevine, W., Sorooshian, A., Duong, H. T., Jonsson, H. H., Flagan, R. C., and Seinfeld, J. H.: Black carbon aerosol over the Los Angeles Basin during CalNex, J. Geophys. Res.-Atmos., 117, D00V13, https://doi.org/10.1029/2011JD017255, 2012.
Moffet, R. C., O'Brien, R. E., Alpert, P. A., Kelly, S. T., Pham, D. Q., Gilles, M. K., Knopf, D. A., and Laskin, A.: Morphology and mixing of black carbon particles collected in central California during the CARES field study, Atmos. Chem. Phys., 16, 14515–14525, https://doi.org/10.5194/acp-16-14515-2016, 2016.
Moteki, N. and Kondo, Y.: Effects of Mixing State on Black Carbon Measurements by Laser-Induced Incandescence, Aerosol Sci. Tech., 41, 398–417, https://doi.org/10.1080/02786820701199728, 2007.
Moteki, N. and Kondo, Y.: Method to measure time-dependent scattering cross sections of particles evaporating in a laser beam, J. Aerosol Sci., 39, 348–364, https://doi.org/10.1016/j.jaerosci.2007.12.002, 2008.
Moteki, N. and Kondo, Y.: Dependence of Laser-Induced Incandescence on Physical Properties of Black Carbon Aerosols: Measurements and Theoretical Interpretation, Aerosol Sci. Tech., 44, 663–675, https://doi.org/10.1080/02786826.2010.484450, 2010.
Moteki, N., Kondo, Y., and Nakamura, S.-I.: Method to measure refractive indices of small nonspherical particles: Application to black carbon particles, J. Aerosol Sci., 41, 513–521, https://doi.org/10.1016/j.jaerosci.2010.02.013, 2010.
Moteki, N., Kondo, Y., and Adachi, K.: Identification by single-particle soot photometer of black carbon particles attached to other particles: Laboratory experiments and ground observations in Tokyo, J. Geophys. Res.-Atmos., 119, 1031–1043, https://doi.org/10.1002/2013JD020655, 2014.
Peng, J., Hu, M., Guo, S., Du, Z., Zheng, J., Shang, D., Levy Zamora, M., Zeng, L., Shao, M., Wu, Y.-S., Zheng, J., Wang, Y., Glen, C. R., Collins, D. R., Molina, M. J., and Zhang, R.: Markedly enhanced absorption and direct radiative forcing of black carbon under polluted urban environments, P. Natl. Acad. Sci. USA, 111, 201602310, https://doi.org/10.1073/pnas.1602310113, 2016.
Ramanathan, V. and Carmichael, G.: Global and regional climate changes due to black carbon, Nat. Geosci., 1, 221–227, https://doi.org/10.1038/ngeo156, 2008.
Roberts, G. C., Ramana, M. V., Corrigan, C., Kim, D., and Ramanathan, V.: Simultaneous observations of aerosol-cloud-albedo interactions with three stacked unmanned aerial vehicles, P. Natl. Acad. Sci. USA, 105, 7370–7375, https://doi.org/10.1073/pnas.0710308105, 2008.
Saha, P. K., Khlystov, A., and Grieshop, A. P.: Downwind evolution of the volatility and mixing state of near-road aerosols near a US interstate highway, Atmos. Chem. Phys., 18, 2139–2154, https://doi.org/10.5194/acp-18-2139-2018, 2018.
Schwarz, J. P., Gao, R. S., Fahey, D. W., Thomson, D. S., Watts, L. A., Wilson, J. C., Reeves, J. M., Darbeheshti, M., Baumgardner, D. G., Kok, G. L., Chung, S. H., Schulz, M., Hendricks, J., Lauer, A., Kärcher, B., Slowik, J. G., Rosenlof, K. H., Thompson, T. L., Langford, A. O., Loewenstein, M., and Aikin, K. C.: Single-particle measurements of midlatitude black carbon and light-scattering aerosols from the boundary layer to the lower stratosphere, J. Geophys. Res., 111, D16207, https://doi.org/10.1029/2006jd007076, 2006.
Schwarz, J. P., Gao, R. S., Spackman, J. R., Watts, L. A., Thomson, D. S., Fahey, D. W., Ryerson, T. B., Peischl, J., Holloway, J. S., Trainer, M., Frost, G. J., Baynard, T., Lack, D. A., de Gouw, J. A., Warneke, C., and Del Negro, L. A.: Measurement of the mixing state, mass, and optical size of individual black carbon particles in urban and biomass burning emissions, Geophys. Res. Lett., 35, L13810, https://doi.org/10.1029/2008GL033968, 2008a.
Schwarz, J. P., Spackman, J. R., Fahey, D. W., Gao, R. S., Lohmann, U., Stier, P., Watts, L. A., Thomson, D. S., Lack, D. A., Pfister, L., Mahoney, M. J., Baumgardner, D., Wilson, J. C., and Reeves, J. M.: Coatings and their enhancement of black carbon light absorption in the tropical atmosphere, J. Geophys. Res.-Atmos., 113, D03203, https://doi.org/10.1029/2007jd009042, 2008b.
Shang, D., Hu, M., Zheng, J., Qin, Y., Du, Z., Li, M., Fang, J., Peng, J., Wu, Y., Lu, S., and Guo, S.: Particle number size distribution and new particle formation under the influence of biomass burning at a high altitude background site at Mt. Yulong (3410 m), China, Atmos. Chem. Phys., 18, 15687–15703, https://doi.org/10.5194/acp-18-15687-2018, 2018.
Shiraiwa, M., Kondo, Y., Moteki, N., Takegawa, N., Miyazaki, Y., and Blake, D. R.: Evolution of mixing state of black carbon in polluted air from Tokyo, Geophys. Res. Lett., 34, 16803, https://doi.org/10.1029/2007GL029819, 2007.
Subramanian, R., Kok, G. L., Baumgardner, D., Clarke, A., Shinozuka, Y., Campos, T. L., Heizer, C. G., Stephens, B. B., de Foy, B., Voss, P. B., and Zaveri, R. A.: Black carbon over Mexico: the effect of atmospheric transport on mixing state, mass absorption cross-section, and BC/CO ratios, Atmos. Chem. Phys., 10, 219–237, https://doi.org/10.5194/acp-10-219-2010, 2010.
Tan, T., Hu, M., Du, Z., Zhao, G., Shang, D., Zheng, J., Qin, Y., Li, M., Wu, Y., Zeng, L., Guo, S., and Wu, Z.: Measurement report: Strong light absorption induced by aged biomass burning black carbon over the southeastern Tibetan Plateau in pre-monsoon season, Atmos. Chem. Phys., 21, 8499–8510, https://doi.org/10.5194/acp-21-8499-2021, 2021.
Ueda, S., Nakayama, T., Taketani, F., Adachi, K., Matsuki, A., Iwamoto, Y., Sadanaga, Y., and Matsumi, Y.: Light absorption and morphological properties of soot-containing aerosols observed at an East Asian outflow site, Noto Peninsula, Japan, Atmos. Chem. Phys., 16, 2525–2541, https://doi.org/10.5194/acp-16-2525-2016, 2016.
Ulbrich, I. M., Canagaratna, M. R., Zhang, Q., Worsnop, D. R., and Jimenez, J. L.: Interpretation of organic components from Positive Matrix Factorization of aerosol mass spectrometric data, Atmos. Chem. Phys., 9, 2891–2918, https://doi.org/10.5194/acp-9-2891-2009, 2009.
Wang, J., Zhang, Q., Chen, M., Collier, S., Zhou, S., Ge, X., Xu, J., Shi, J., Xie, C., Hu, J., Ge, S., Sun, Y., and Coe, H.: First Chemical Characterization of Refractory Black Carbon Aerosols and Associated Coatings over the Tibetan Plateau (4730 m a.s.l.), Environ. Sci. Technol., 51, 14072–14082, https://doi.org/10.1021/acs.est.7b03973, 2017.
Wang, Q., Huang, R. J., Cao, J., Han, Y., Wang, G., Li, G., Wang, Y., Dai, W., Zhang, R., and Zhou, Y.: Mixing State of Black Carbon Aerosol in a Heavily Polluted Urban Area of China: Implications for Light Absorption Enhancement, Aerosol Sci. Tech., 48, 689–697, https://doi.org/10.1080/02786826.2014.917758, 2014.
Wang, Q., Huang, R.-J., Zhao, Z., Zhang, N., Wang, Y., Ni, H., Tie, X., Han, Y., Zhuang, M., Wang, M., Zhang, J., Zhang, X., Dusek, U., and Cao, J.: Size distribution and mixing state of refractory black carbon aerosol from a coastal city in South China, Atmos. Res., 181, 163–171, https://doi.org/10.1016/j.atmosres.2016.06.022, 2016.
Wang, Q., Huang, R., Zhao, Z., Cao, J., Ni, H., Tie, X., Zhu, C., Shen, Z., Wang, M., Dai, W., Han, Y., Zhang, N., and Prevot, A. S. H.: Effects of photochemical oxidation on the mixing state and light absorption of black carbon in the urban atmosphere of China, Environ. Res. Lett., 12, 044012, https://doi.org/10.1088/1748-9326/aa64ea, 2017.
Wang, Y., Liu, F., He, C., Bi, L., Cheng, T., Wang, Z., Zhang, H., Zhang, X., Shi, Z., and Li, W.: Fractal Dimensions and Mixing Structures of Soot Particles during Atmospheric Processing, Environ. Sci. Tech. Let., 4, 487–493, https://doi.org/10.1021/acs.estlett.7b00418, 2017.
Wang, Y., Hu, M., Lin, P., Tan, T., Li, M., Xu, N., Zheng, J., Du, Z., Qin, Y., Wu, Y., Lu, S., Song, Y., Wu, Z., Guo, S., Zeng, L., Huang, X., and He, L.: Enhancement in Particulate Organic Nitrogen and Light Absorption of Humic-Like Substances over Tibetan Plateau Due to Long-Range Transported Biomass Burning Emissions, Environ. Sci. Technol., 53, 14222–14232, https://doi.org/10.1021/acs.est.9b06152, 2019a.
Wang, Y., Hu, M., Wang, Y., Zheng, J., Shang, D., Yang, Y., Liu, Y., Li, X., Tang, R., Zhu, W., Du, Z., Wu, Y., Guo, S., Wu, Z., Lou, S., Hallquist, M., and Yu, J. Z.: The formation of nitro-aromatic compounds under high NOx and anthropogenic VOC conditions in urban Beijing, China, Atmos. Chem. Phys., 19, 7649–7665, https://doi.org/10.5194/acp-19-7649-2019, 2019b.
Wilcox, E. M., Thomas, R. M., Praveen, P. S., Pistone, K., Bender, F. A. M., and Ramanathan, V.: Black carbon solar absorption suppresses turbulence in the atmospheric boundary layer, P. Natl. Acad. Sci. USA, 113, 11794–11799, https://doi.org/10.1073/pnas.1525746113, 2016.
Wu, Y., Wang, X., Tao, J., Huang, R., Tian, P., Cao, J., Zhang, L., Ho, K.-F., Han, Z., and Zhang, R.: Size distribution and source of black carbon aerosol in urban Beijing during winter haze episodes, Atmos. Chem. Phys., 17, 7965–7975, https://doi.org/10.5194/acp-17-7965-2017, 2017.
Zhang, F., Wang, Y., Peng, J., Chen, L., Sun, Y., Duan, L., Ge, X., Li, Y., Zhao, J., Liu, C., Zhang, X., Zhang, G., Pan, Y., Wang, Y., Zhang, A. L., Ji, Y., Wang, G., Hu, M., Molina, M. J., and Zhang, R.: An unexpected catalyst dominates formation and radiative forcing of regional haze, P. Natl. Acad. Sci. USA, 117, 3960–3966, https://doi.org/10.1073/pnas.1919343117, 2020.
Zhang, R., Khalizov, A. F., Pagels, J., Zhang, D., Xue, H., and McMurry, P. H.: Variability in morphology, hygroscopicity, and optical properties of soot aerosols during atmospheric processing, P. Natl. Acad. Sci. USA, 105, 10291–10296, https://doi.org/10.1073/pnas.0804860105, 2008.
Zhang, Y., Su, H., Ma, N., Li, G., Kecorius, S., Wang, Z., Hu, M., Zhu, T., He, K., Wiedensohler, A., Zhang, Q., and Cheng, Y.: Sizing of ambient particles from a Single Particle Soot Photometer measurement to retrieve mixing state of Black Carbon at a Regional site of the North China Plain, J. Geophys. Res.-Atmos., 123, 12778–12795, https://doi.org/10.1029/2018JD028810, 2018a.
Zhang, Y., Zhang, Q., Cheng, Y., Su, H., Li, H., Li, M., Zhang, X., Ding, A., and He, K.: Amplification of light absorption of black carbon associated with air pollution, Atmos. Chem. Phys., 18, 9879–9896, https://doi.org/10.5194/acp-18-9879-2018, 2018b.
Zhao, G.: Data for “Mixing state of refractory black carbon at different atmospheres in north and southwest China”, Version 1, Zenodo [data set], https://doi.org/10.5281/zenodo.5816310, 2022.
Zhao, G., Tao, J., Kuang, Y., Shen, C., Yu, Y., and Zhao, C.: Role of black carbon mass size distribution in the direct aerosol radiative forcing, Atmos. Chem. Phys., 19, 13175–13188, https://doi.org/10.5194/acp-19-13175-2019, 2019.
Zhao, G., Hu, M., Fang, X., Tan, T., Xiao, Y., Du, Z., Zheng, J., Shang, D., Wu, Z., Guo, S., and Zhao, C.: Larger than expected variation range in the real part of the refractive index for ambient aerosols in China, Sci. Total Environ., 779, 146443, https://doi.org/10.1016/j.scitotenv.2021.146443, 2021.
Zheng, J., Hu, M., Du, Z., Shang, D., Gong, Z., Qin, Y., Fang, J., Gu, F., Li, M., Peng, J., Li, J., Zhang, Y., Huang, X., He, L., Wu, Y., and Guo, S.: Influence of biomass burning from South Asia at a high-altitude mountain receptor site in China, Atmos. Chem. Phys., 17, 6853–6864, https://doi.org/10.5194/acp-17-6853-2017, 2017.