the Creative Commons Attribution 4.0 License.
the Creative Commons Attribution 4.0 License.
 | 21 Jan 2022
The importance of alkyl nitrates and sea ice emissions to atmospheric NOx sources and cycling in the summertime Southern Ocean marine boundary layer
Jessica M. Burger
Julie Granger
Emily Joyce
Meredith G. Hastings
Kurt A. M. Spence
Katye E. Altieri
Atmospheric nitrate originates from the oxidation of nitrogen oxides and impacts both tropospheric chemistry and climate. NOx sources, cycling and NOx to nitrate formation pathways are poorly constrained in remote marine regions, especially the Southern Ocean, where pristine conditions serve as a useful proxy for the pre-industrial atmosphere. Here, we measured the isotopic composition (δ15N and δ18O) of atmospheric nitrate in coarse-mode (>1 µm) aerosols collected in the summertime marine boundary layer of the Atlantic Southern Ocean from 34.5 to 70∘ S and across the northern edge of the Weddell Sea. The δ15N– decreased with latitude from −2.7 ‰ to −42.9 ‰. The decline in δ15N with latitude is attributed to changes in the dominant NOx sources: lightning at the low latitudes, oceanic alkyl nitrates at the mid-latitudes and photolysis of nitrate in snow at the high latitudes. There is no evidence of any influence from anthropogenic NOx sources or equilibrium isotope fractionation. Using air mass back trajectories and an isotope mixing model, we calculate that oceanic alkyl nitrate emissions have a δ15N signature of ‰. Given that measurements of alkyl nitrate contributions to remote nitrogen budgets are scarce, this may be a useful tracer for detecting their contribution in other oceanic regions. The δ18O– was always less than 70 ‰, indicating that daytime processes involving OH are the dominant NOx oxidation pathway during summer. Unusually low δ18O– values (less than 31 ‰) were observed at the western edge of the Weddell Sea. The air mass history of these samples indicates extensive interaction with sea-ice-covered ocean, which is known to enhance peroxy radical production. The observed low δ18O– is therefore attributed to increased exchange of NO with peroxy radicals, which have a low δ18O, relative to ozone, which has a high δ18O. This study reveals that the mid- and high-latitude surface ocean may serve as a more important NOx source than previously thought and that the ice-covered surface ocean impacts the reactive nitrogen budget as well as the oxidative capacity of the marine boundary layer.
- Article
(6851 KB) - Full-text XML
-
Supplement
(1006 KB) - BibTeX
- EndNote


Atmospheric nitrate (NO), hereafter defined as gas-phase nitric acid (HNO3) and particulate NO (p-NO, impacts air quality and climate by contributing to atmospheric particulate matter (Park and Kim, 2005) and influencing the Earth's radiative heat budget (IPCC, 2013). It also plays a major role in the biogeochemical cycling of reactive nitrogen (Altieri et al., 2021). NO aerosols originate from the oxidation of nitrogen oxides, collectively referred to as NOx (NOx = NO + NO2). NOx cycling controls the chemical production of tropospheric ozone (O3), a greenhouse gas and pollutant (Finlayson-Pitts and Pitts, 2000), which in turn contributes to the oxidizing capacity of the atmosphere (Alexander and Mickley, 2015). Globally, fossil fuel combustion is the primary NOx source (van der A et al., 2008), which far exceeds natural emissions such as biomass burning (Finlayson-Pitts and Pitts, 2000), soil processes (Davidson and Kingerlee, 1997) and lightning (Schumann and Huntrieser, 2007).
Due to its remoteness, the summertime Southern Ocean marine boundary layer (MBL) can be representative of pre-industrial-like atmospheric conditions (Hamilton et al., 2014). The chemical composition of the Southern Ocean MBL is characterized by low NO concentrations (Virkkula et al., 2006), representative of a background aerosol environment (i.e. minimal anthropogenic influence). Furthermore, the South Atlantic sector of the Southern Ocean is primarily influenced by natural NOx sources. During summer, high lightning activity over South America and southern Africa results in NOx production between approximately 40∘ S and the intertropical convergence zone (ITCZ) (Nesbitt et al., 2000). As such, lightning is expected to be the dominant NOx source in the low-latitude MBL (Schumann and Huntrieser, 2007; van der A et al., 2008). Because of its pristine nature, the summertime Southern Ocean serves as a unique region in which to study atmospheric chemistry and is a useful pre-industrial reference point for comparing the magnitude of anthropogenic aerosol impacts on climate (Haywood and Boucher, 2000; Hamilton et al., 2014).
The atmospheric chemistry of the polar MBL at the high southern latitudes differs from that of the mid- and low-latitude MBL. During summer, high levels of photochemistry result in the emission of reactive gases from sea ice and snow cover in the Antarctic. As a result, highly elevated concentrations of hydrogen oxide radicals (HOx= OH + peroxy radicals), halogens, nitrous acid (HONO), and NOx have been observed during spring and summer in the polar regions (Brough et al., 2019). Furthermore, photochemical production of NOx within the surface snow of Antarctica and subsequent oxidation in the overlying atmosphere represents a significant NO source to the Antarctic troposphere (Jones et al., 2000, 2001). NO photolysis near the surface–air interface of ice crystals produces NO2 (Grannas et al. 2007; Jones et al., 2000), which can be released to the firn (i.e. the intermediate stage of ice between snow and glacial ice) air and escape the snowpack to the overlying atmosphere (Erbland et al., 2013; Shi et al., 2015, 2018). During winter, additional NOx sources to the Antarctic atmosphere may include long-range-transported peroxyacetyl nitrates (PAN) and stratospheric inputs (Savarino et al., 2007; Lee et al., 2014; Walters et al., 2019).
Emission of alkyl nitrates (a group of nitrogen gases collectively referred to as RONO2) from the surface ocean have been recently proposed as a potential NOx source to the MBL in remote regions (Williams et al., 2014; Fisher et al., 2018). Observations of elevated MBL alkyl nitrate concentrations suggest that a direct oceanic source exists in both the tropics (Atlas et al., 1993; Blake et al., 2003) and the high-latitude Southern Ocean (Blake et al., 1999; Jones et al., 1999). Although the exact mechanism remains unclear, experimental evidence suggests that oceanic RONO2 production occurs via photochemical processes involving the aqueous-phase reaction of RO2, derived from the photolysis of oceanic dissolved organic matter, and NO, derived from seawater nitrite photolysis (Dahl et al., 2003; Dahl and Saltzman, 2008). Supersaturated RONO2 conditions in the surface ultimately drive a net flux from the ocean to the atmosphere (Chuck et al., 2002; Dahl et al., 2005). The photolysis of emitted RONO2 and subsequent OH oxidation in the overlying atmosphere leads to NOx formation (Fisher et al., 2018), and/or RONO2 can form aerosol NO directly by hydrolysis (Rindelaub et al., 2015).
Current global atmospheric models suggest that oceanic RONO2 represents a significant source of nitrogen (N) to the Southern Ocean MBL, accounting for 20 % to 60 % of the reactive N pool at high latitudes (60 to 90∘ S) (Fisher et al., 2018). However, only one shipborne dataset with coincident ocean–atmosphere RONO2 concentration measurements exists to substantiate this notion (Hughes et al., 2008). Additionally, the NOx source from RONO2 degradation dominates relative to model-defined primary NOx emission sources over the Southern Ocean, which include shipping, aircraft and lightning (Fisher et al., 2018). However, the lack of seawater observations available to constrain Southern Ocean RONO2 distributions hampers the validation of model fluxes. Better understanding of the Southern Ocean RONO2 source is required to improve simulations and accurately evaluate its contribution to the Southern Ocean MBL NOx budget.
Natural abundance isotopes of atmospheric nitrate
Measurements of the oxygen (O) and N stable isotope ratios of atmospheric NO can be used to constrain NOx sources, cycling and NOx to NO oxidation pathways, which are critical for understanding the reactive N budget in the atmosphere. This technique has been applied in polluted (Elliott et al., 2007; Zong et al., 2017), open-ocean (Hastings et al., 2003; Morin et al., 2009; Kamezaki et al., 2019; Gobel et al., 2013; Altieri et al., 2013) and polar environments (Morin et al., 2009; Walters et al., 2019). Stable isotope ratios are reported as a ratio of the heavy to light isotopologues of a sample relative to the constant isotopic ratio of a reference standard, using delta (δ) notation in units of per mil (‰) following Eq. (1):
where R represents the ratio of or in the sample and in the reference standard, respectively. The reference for O is Vienna Standard Mean Ocean Water (VSMOW), and for N it is atmospheric N2 (Bölhke et al., 2003).
When NOx is converted to NO, the N atom is conserved. As such, it is generally expected that the N stable isotope ratio of atmospheric NO (δ15N–) reflects the δ15N of the source NOx (Kendall et al., 2007), plus any isotopic fractionation associated with cycling or NOx to NO conversion. For example, the δ15N of lightning generated NOx is close to 0 ‰ (Hoering, 1957) and is distinct from stratospheric and snowpack NOx. Savarino et al. (2007) used the degree of N2O destruction in the stratosphere and the associated isotopic fractionation to derive an Antarctic stratospheric δ15N–NOx source signature of 19±3 ‰ (Savarino et al., 2007). In contrast, snow-emitted NOx typically has a very low δ15N signature due to the large fractionation (15ε) of ‰ (Berhanu et al., 2014, 2015) associated with NO photolysis in the snowpack, where ‰, and the kinetic isotope effect (KIE) is the ratio of the rates with which the two isotopes of N are converted from reactant to product. If equilibrium isotope fractionation during cycling occurs, it results in the 15N enrichment of NO2 such that the NO formed from this NO2 will have a higher δ15N– than the initial NOx source (Freyer et al., 1993; Walters et al., 2016). Equilibrium isotope fractionation during the transformation of NOx to also results in higher δ15N– compared to the original NOx source (Walters and Michalski, 2015).
In contrast to N, the O stable isotope ratio of atmospheric NO (δ18O–) is reflective of the oxidants involved in NOx cycling prior to NO formation, as well as the dominant NO formation pathway (Hastings et al., 2003; Michalski et al., 2003; Alexander et al., 2020). The O atoms of NOx are rapidly exchanged with oxidizing agents in the atmosphere to produce NO. Tropospheric NOx recycles rapidly with O3 following the equations below:
The oxidation of NO to NO2 requires an atmospheric oxidant, typically O3, throughout most of the troposphere (Reaction R1), while the breakdown of NO2 back to NO is photolytic and requires light (Reaction R2). Therefore, under night-time/dark conditions, Reaction (R2) shuts down, and NOx is comprised almost entirely of NO2.
The dominant daytime sink for NOx is the oxidation of NO2 by OH, which produces HNO3 via Reaction (R3), where M is a non-reacting molecule.
Under night-time/dark conditions, the photolytic production of OH cannot occur, and NO2 is oxidized by O3 (Reaction R4). HNO3 is ultimately formed via the hydrolysis of dinitrogen pentoxide (N2O5), following Reactions (R5) and (R6).
NO3 can also react with hydrocarbons (HC) (e.g. dimethylsulfide, DMS) to form HNO3 following Reaction (R7).
Lastly, in regions with elevated halogen concentrations, NO2 can be oxidized by reactive halogens, for example, bromine oxide (BrO), to form HNO3 following Reactions (R8) and (R9).
Typically, aerosol δ18O– is interpreted as being determined by the dominant NOx oxidation pathways, Reaction (R3) vs. Reaction (R4) to Reaction (R9). If some combination of Reactions (R4)–(R9) occurs, then O3 is the main oxidant, whereas during Reaction (R3), one of the O atoms originates from OH. The OH radical exchanges with H2O vapour in the troposphere; therefore the δ18O of OH is a function of the δ18O of H2O vapour, which generally ranges from −27.5 ‰ to 0 ‰ in the subtropics and over the Southern Ocean (Michalski et al., 2012; Guilpart et al., 2017; Dar et al., 2020), and equilibrium isotope exchange between OH and H2O (Walters and Michalski, 2016). In contrast, the δ18O of tropospheric O3 is much higher, the most recent estimate being 114.8±10.4 ‰ (Vicars and Savarino, 2014). Therefore, a higher δ18O for atmospheric NO reflects the increased influence of O3 on NOx to NO conversion (Reactions R4–R9), and the δ18O– is lower when Reaction (R3) is favoured, due to the lack of exchange of O atoms with O3 (Hastings et al., 2003; Fang et al., 2011; Altieri et al., 2013).
Here, we present the concentration and isotopic composition of coarse-mode (>1 µm) atmospheric NO collected in the MBL of the Southern Ocean between Cape Town, South Africa, and coastal Antarctica, as well as across the Weddell Sea gyre, during summer. Using air mass back trajectories, surface ocean nitrite measurements and the aerosol δ15N– and δ18O–, we address (1) the major NOx sources as well as the main oxidants in cycling and NOx to NO conversion across a large latitudinal transect of the Atlantic Southern Ocean and within the Weddell Sea gyre and (2) the influence of sea ice and snowpack emissions on chemistry in the high-latitude MBL.
2.1 Sample collection
Samples were collected on board the Research Vessel (R/V) SA Agulhas II during one cruise subdivided into three legs. Leg one refers to the southward voyage from Cape Town (33.9∘ S, 18.4∘ E) to Penguin Bukta (71.4∘ S, 2.5∘ W) in early summer (7 to 19 December 2018) as part of the South African National Antarctic Expedition's annual relief voyage (SANAE 58). Leg two is the Weddell Sea Expedition (WSE) from 4 January to 21 February 2019. All data were recorded in GMT. The WSE refers to the voyage west from Penguin Bukta to the northern edge of the Weddell Sea gyre to the Larsen C Ice Shelf, followed by a detour to King George Island before returning to the Weddell Sea and sailing back to Penguin Bukta. Leg three refers to the SANAE 58 return voyage north from Penguin Bukta to Cape Town in late summer (27 February to 15 March 2019). From here on, legs one, two and three will be referred to as early summer, the Weddell Sea and late summer, respectively.
Size-segregated atmospheric aerosols were collected on the ninth floor above the bridge (approximately 20 m above sea level), using a high-volume air sampler (HV-AS; Tisch Environmental). Air was pumped at an average flow rate of 0.82 m3 min−1 through a five-stage cascade impactor (TE-235; Tisch Environmental), loaded with combusted (400 ∘C for 4 h) glass fibre filters (TE-230-GF; Tisch Environmental) that have a surface area of approximately 119 cm2. Aerosol nitrate in the MBL is predominantly present in the coarse mode (>1 µm); therefore only filter stages 1 through 4 were analysed, where the aerodynamical diameter of particles collected is as follows: stage 1 (>7 µm), stage 2 (3 to 7 µm), stage 3 (1.5 to 3 µm) and stage 4 (1 to 1.5 µm).
A sector collector was used to restrict HV-AS activity to avoid contamination from ship stack emissions (Campbell Scientific Africa). The HV-AS only began operating if the wind was blowing at an angle less than 75∘ or greater than 180∘ from the bow of the ship for a minimum of 10 min at a speed of at least 1 m s−1. Filters were removed from the cascade impactor inside a laminar flow cabinet (Air Science), placed in individual zip-sealed plastic bags and stored at −20 ∘C until analysis.
Given that the MBL of the Southern Ocean is characterized by low atmospheric NO concentrations, an attempt was made to ensure that at least 24 h of in-sector sampling had passed before filters were removed from the cascade impactor. However, this was not always possible as on occasion the filters had to be removed early to avoid contamination due to unusual ship manoeuvres or stagnant conditions. Therefore, sampling times ranged between 13 and 88 h across the three legs. The details of each cruise leg can be found in the Supplement (Table S1).
During the research voyage, a field blank was collected by fitting the cascade impactor with a set of filters and walking the cascade impactor from the laboratory to the HV-AS in the same way that atmospheric samples were deployed. The cascade impactor was placed into the HV-AS and then immediately removed without the HV-AS turning on, after which the filters were removed from the cascade impactor and stored in the same manner as the atmospheric samples. All chemical analyses performed on samples were also performed on the field blank filters to assess possible contamination during filter deployment or sample handling.
2.2 Sample analysis
Filter stages 1 to 4 were extracted using ultra-clean deionized water (DI; 18.2 MΩ) under a laminar flow cabinet (Air Science). The extraction ratio was approximately 30 cm2 of filter in 25 mL of DI. Extracts were immediately sonicated for 1 h and then stored at 4 ∘C for at least 12 h. Thereafter, extracts were filtered (0.2 µm) using an acid-washed syringe into a clean 30 mL HDPE bottle and stored at −20 ∘C until analysis (Baker et al., 2010).
Aerosol nitrate concentrations ([NO]) were determined using a Thermo Scientific Dionex Aquion ion chromatography (IC) system (precision of ±0.3 µmol L−1). The anion IC system contained an AG22 RFIC 4×50 mm guard column and AG22 RFIC 4×250 mm analytical column. A six-point standard curve that encompassed the range of sample concentrations (extract [NO]: 1.3 to 27.7 µmol L−1) was run on each day of analysis (Dionex Seven Anion-II Standard), and an R2 value >0.999 was required for sample analysis to proceed. Final aerosol [NO] was corrected by subtracting the field blanks, which represented 35 % of the total [NO] on average. Aerosol samples were also analysed for [NO] using a Lachat QuikChem® flow injection autoanalyzer (precision of ±0.8 µmol L−1). The average [NO] measured using the Lachat QuikChem® flow injection autoanalyzer and the IC system is reported (Table S3).
Nitrogen and oxygen isotopic ratios were measured using the denitrifier method (Sigman et al., 2001; Casciotti et al., 2002). To determine the and of NO, a natural strain of denitrifying bacteria, Pseudomonas aureofaciens, that lack the terminal nitrous oxide (N2O) reductase enzyme, was used to convert aqueous NO quantitatively to N2O gas. The product N2O was analysed by continuous flow isotope ratio mass spectrometry using a Delta V Advantage isotope ratio mass spectrometer (IRMS) interfaced with an online N2O extraction and purification system. Individual analyses were referenced to injections of N2O from a pure gas cylinder and then standardized through comparison to the international reference materials of IAEA-N3 and USGS34 for δ15N– and IAEA-N3, USGS34 and USGS35 for δ18O– (Table S2) (Böhlke et al., 2003). The of samples was corrected for the contribution of 17O to the peak at mass 45 using an average reported Δ17O value of 26 ‰ from atmospheric nitrate collected in the Weddell Sea (Morin et al., 2009). The pooled standard deviation for all measurements of IAEA-N3 and USGS34 for δ15N– and IAEA-N3, USGS34 and USGS35 for δ18O– are reported (Table S2). All samples were measured in triplicate in separate batch analyses. The pooled standard deviation from all replicate analyses of samples was 0.25 ‰ for δ15N– and 0.64 ‰ for δ18O–. The average δ15N– and δ18O– computed for each filter deployment was weighted by the [NO] observed for each stage, and error was propagated according to standard statistical practises (Table S3).
Seawater samples were collected in triplicate every 2 h from the ship's underway system (position at depth approximately 5 m) for the analysis of surface ocean nitrite concentrations ([NO]). [NO] was analysed using the colorimetric method of Grasshoff et al. (1983) using a Thermo Scientific Genesys 30 visible spectrophotometer (detection limit of 0.05 µmol L−1) (Table S4).
2.3 Air mass back trajectory analysis
To determine the air mass source region for each aerosol sample, air mass back trajectories (AMBTs) were computed for each hour in which the HV-AS was operational for at least 45 min of that hour. Given that the ship was moving, a different date, time and starting location were used to compute each AMBT. An altitude of 20 m was chosen to match the height of the HV-AS above sea level, and 72 h AMBTs were computed to account for the lifetime of NO in the atmosphere. All AMBTs were computed with NOAA's Hybrid Single-Particle Lagrangian Integrated Trajectory model (HYSPLIT v 4), using NCEP Global Data Assimilation System (GDAS) output, which can be accessed at https://www.arl.noaa.gov/ready/hysplit4.html (last access: 12 January 2022) (NOAA Air Resources Laboratory, Silver Spring, Maryland) (Stein et al., 2015; Rolph, 2016).
The coarse-mode (>1 µm in diameter) aerosol [NO], computed by summing the [NO] of stages 1 through 4, ranged from 17.3 to 264.0 ng m−3 (Fig. 1a and Table 1). The mass-weighted δ15N of coarse-mode aerosol NO ranged from −43.1 ‰ to −2.7 ‰ (Figs. 1b, 2 and Table 1). There were no clear trends in atmospheric [NO] or δ15N– with aerosol size (Table S5).
The highest nitrate concentrations occurred between 34 and 45∘ S, and then they decreased with increasing latitude (Fig. 1a). Similarly, higher values characterized δ15N– between 34 and 45∘ S ( ‰), and then they decreased with increasing latitude (Fig. 1b). At high latitudes (south of 60∘ S), median values of 30.31 ng m−3 and −22.2 ‰ were observed for nitrate concentration and δ15N, respectively. Coincident mass-weighted δ18O– values ranged from 16.5 ‰ to 70 ‰ (Figs. 1c, 3 and Table 1). No latitudinal trend in δ18O– was apparent, although distinctly low δ18O– values were observed in the Weddell Sea, as discussed in Sect. 4.3 below. The difference between δ18O– observed in the Weddell Sea (during January to February) and δ18O– observed at corresponding latitudes (56 to 70∘ S) during the early and late summer transects is statistically significant (p value =0.009). The early and late summer cruise transects were similar spatially in that both took place along the same hydrographic line (i.e. the Good Hope line), apart from the deviation to South Georgia during late summer (Fig. 2a, b). Even though the early and late summer cruise transects occurred in December and March, respectively, there is no statistically significant difference in [NO] (p value =0.43), δ15N– (p value =0.53) or δ18O– (p value =0.67) between them. Therefore, the early and late summer legs are discussed together and collectively referred to as the latitudinal transect.
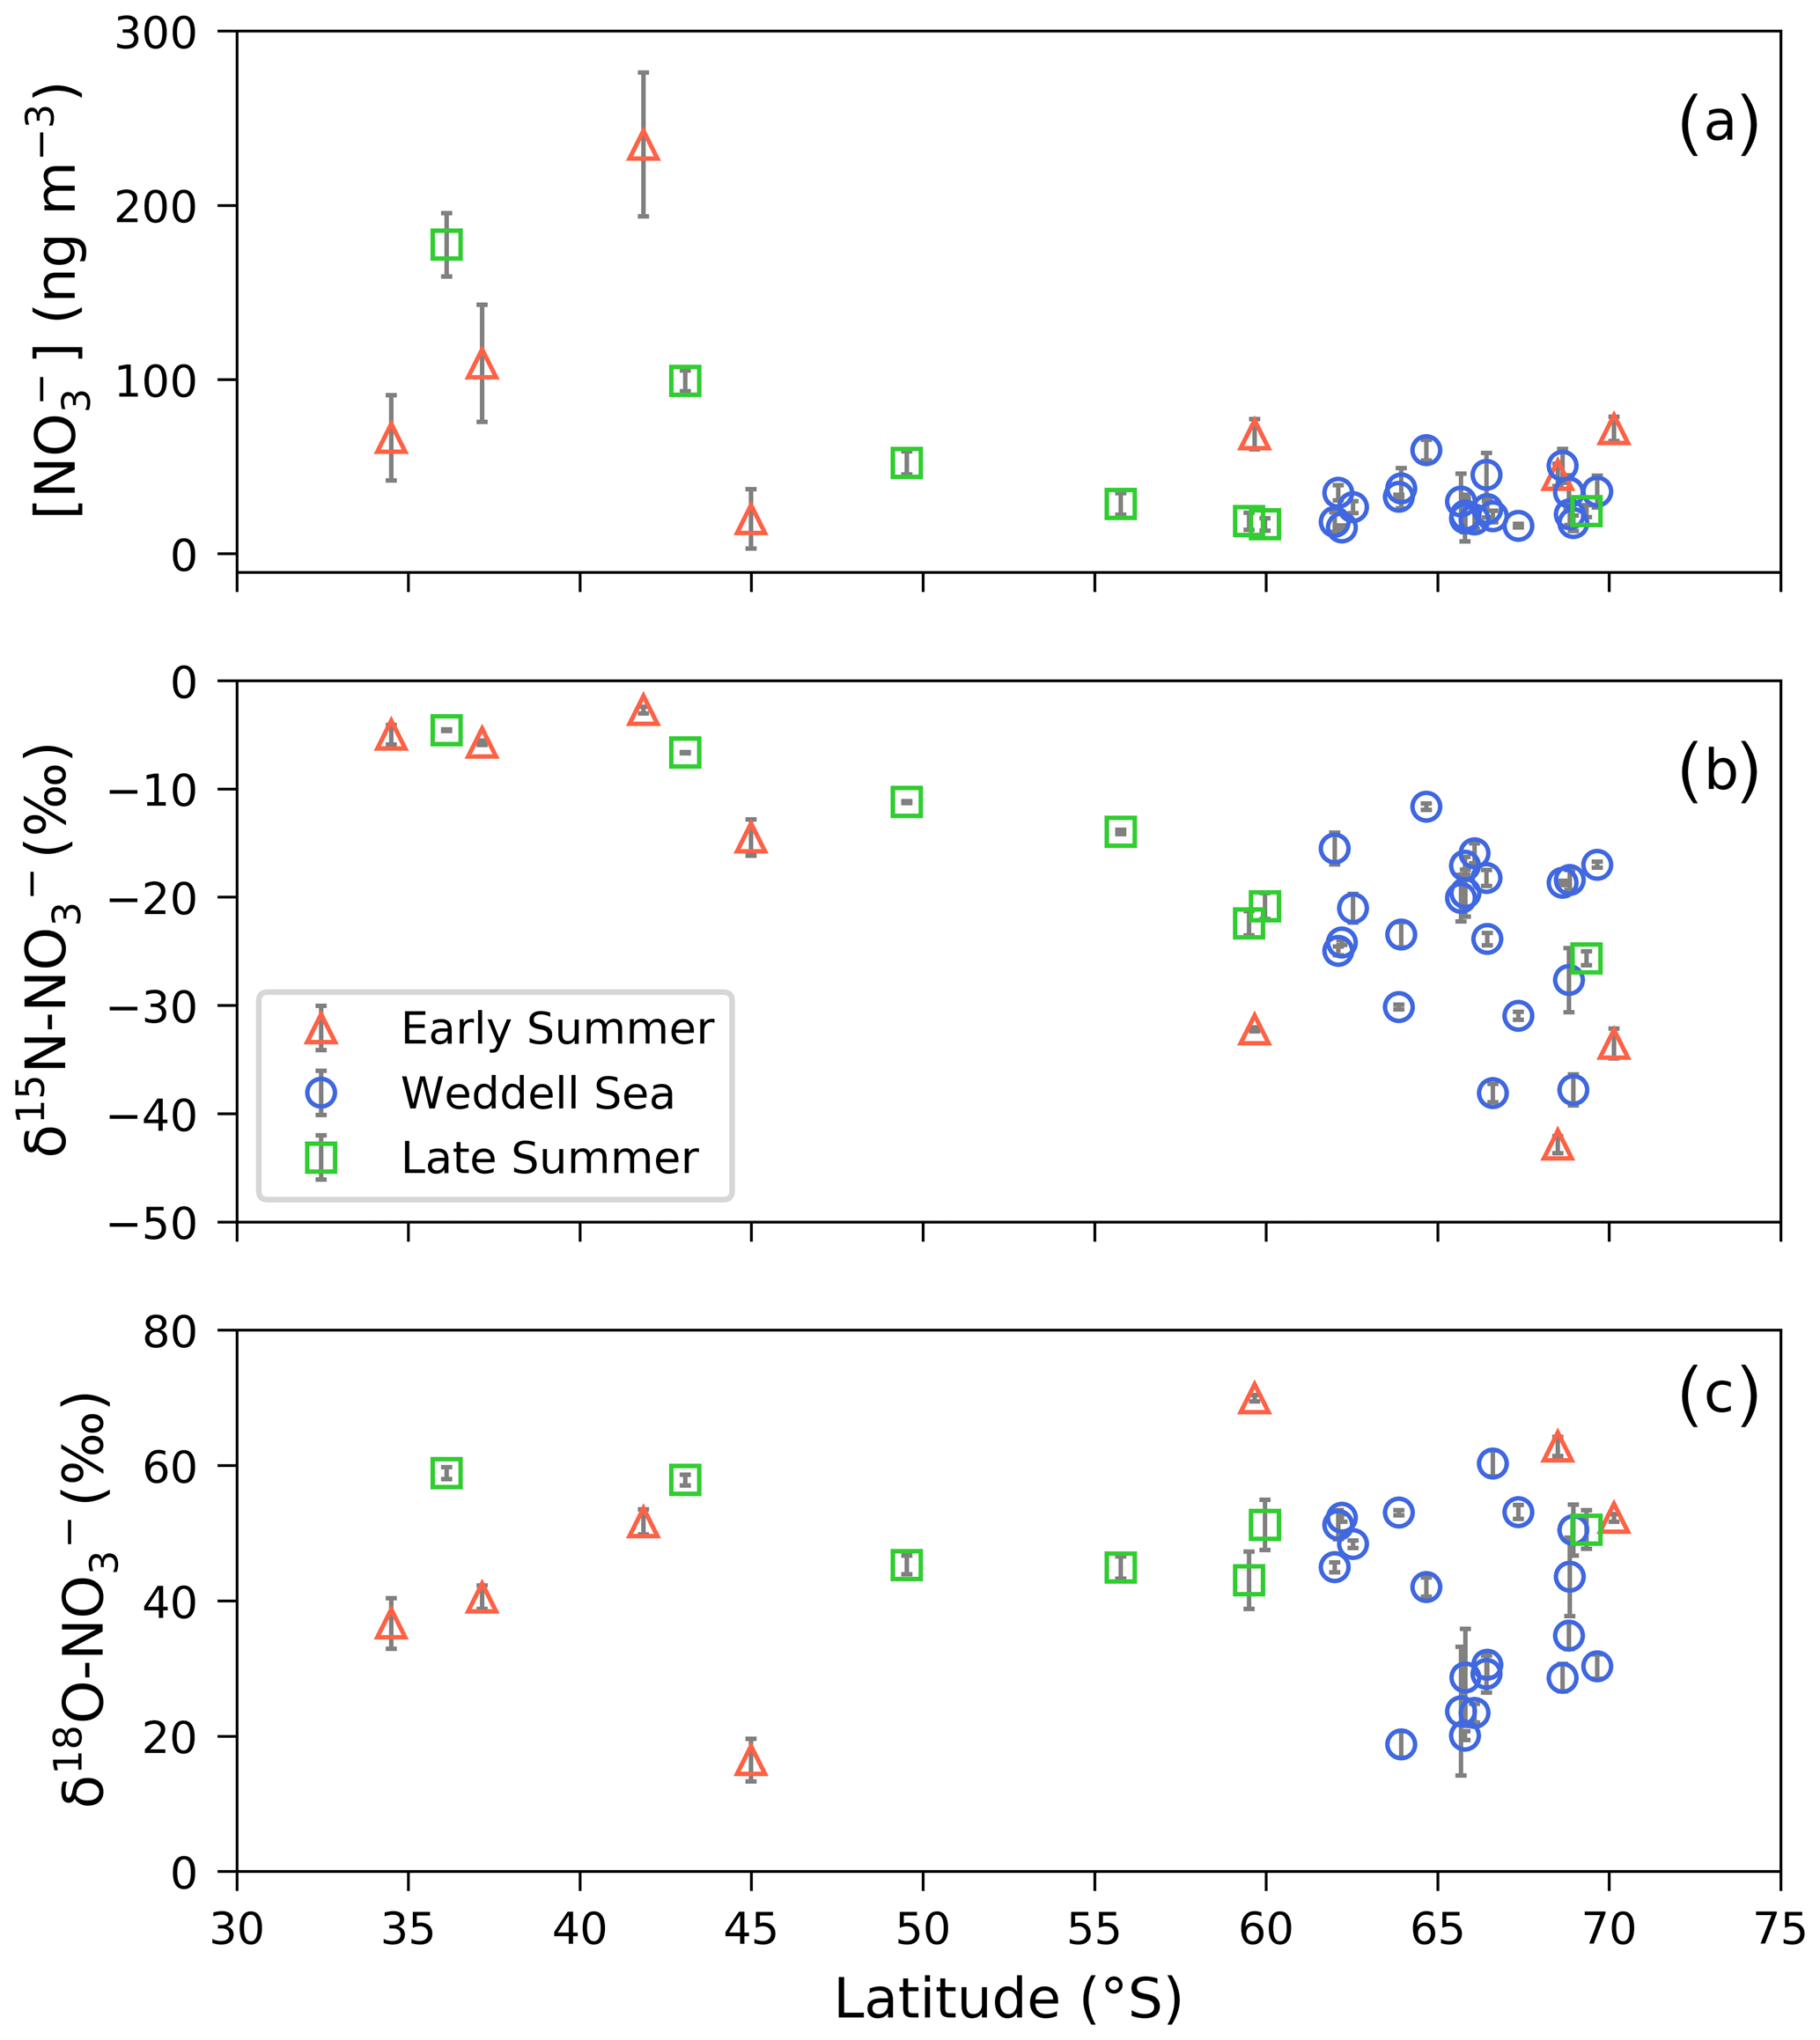
Figure 1(a) The average (±1 SD) coarse-mode (>1 µm) nitrate concentration [NO] (ng m−3) and the weighted average (±1 SD) δ15N (b) and δ18O (c) of atmospheric nitrate (δ15N– (‰ vs. N2) and δ18O– (‰ vs. VSMOW), respectively), as a function of latitude (∘ S). Early and late summer latitudinal transects are denoted by the red triangles and green squares, respectively. Weddell Sea samples are denoted by blue circles. Where error bars (±1 SD) are not visible, the standard deviation is smaller than the size of the marker.
Table 1The average (avg), standard deviation (SD) and range of total coarse-mode (>1 µm) atmospheric nitrate concentration ([]; ng m−3) and the mass-weighted average N and O isotopic composition of coarse-mode nitrate (δ15N– and δ18O–; ‰) are shown. Cruise legs are denoted as follows: early summer (ES), Weddell Sea (WS) and late summer (LS).
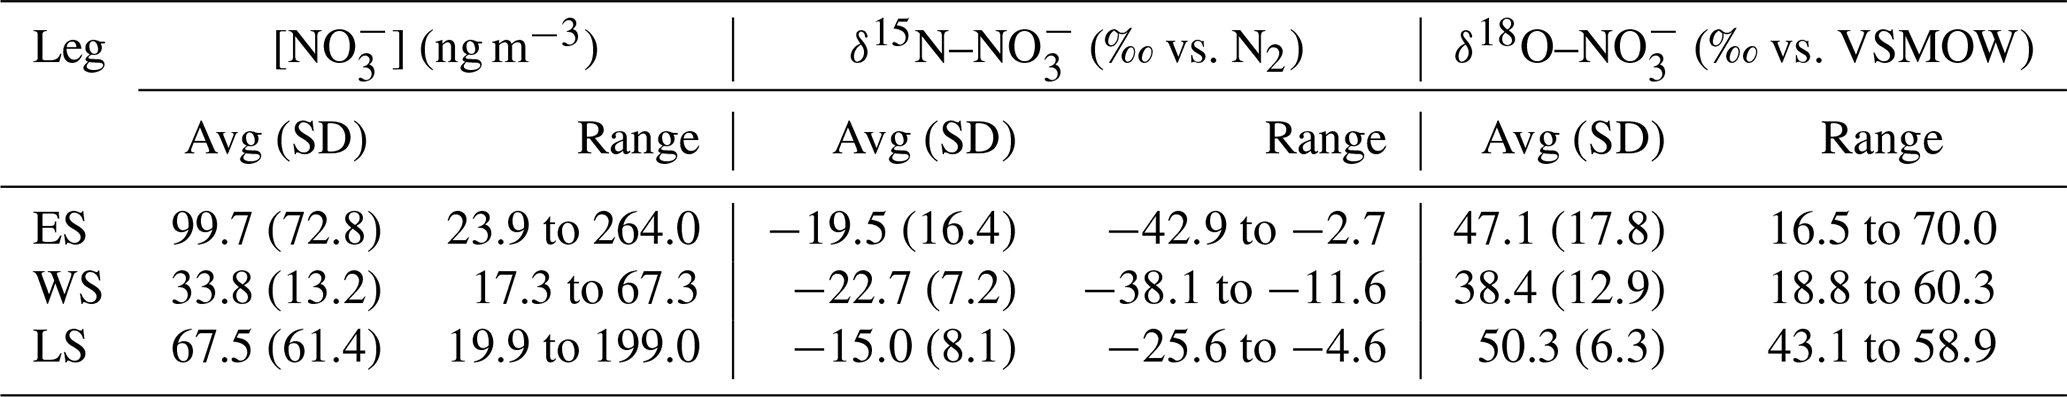
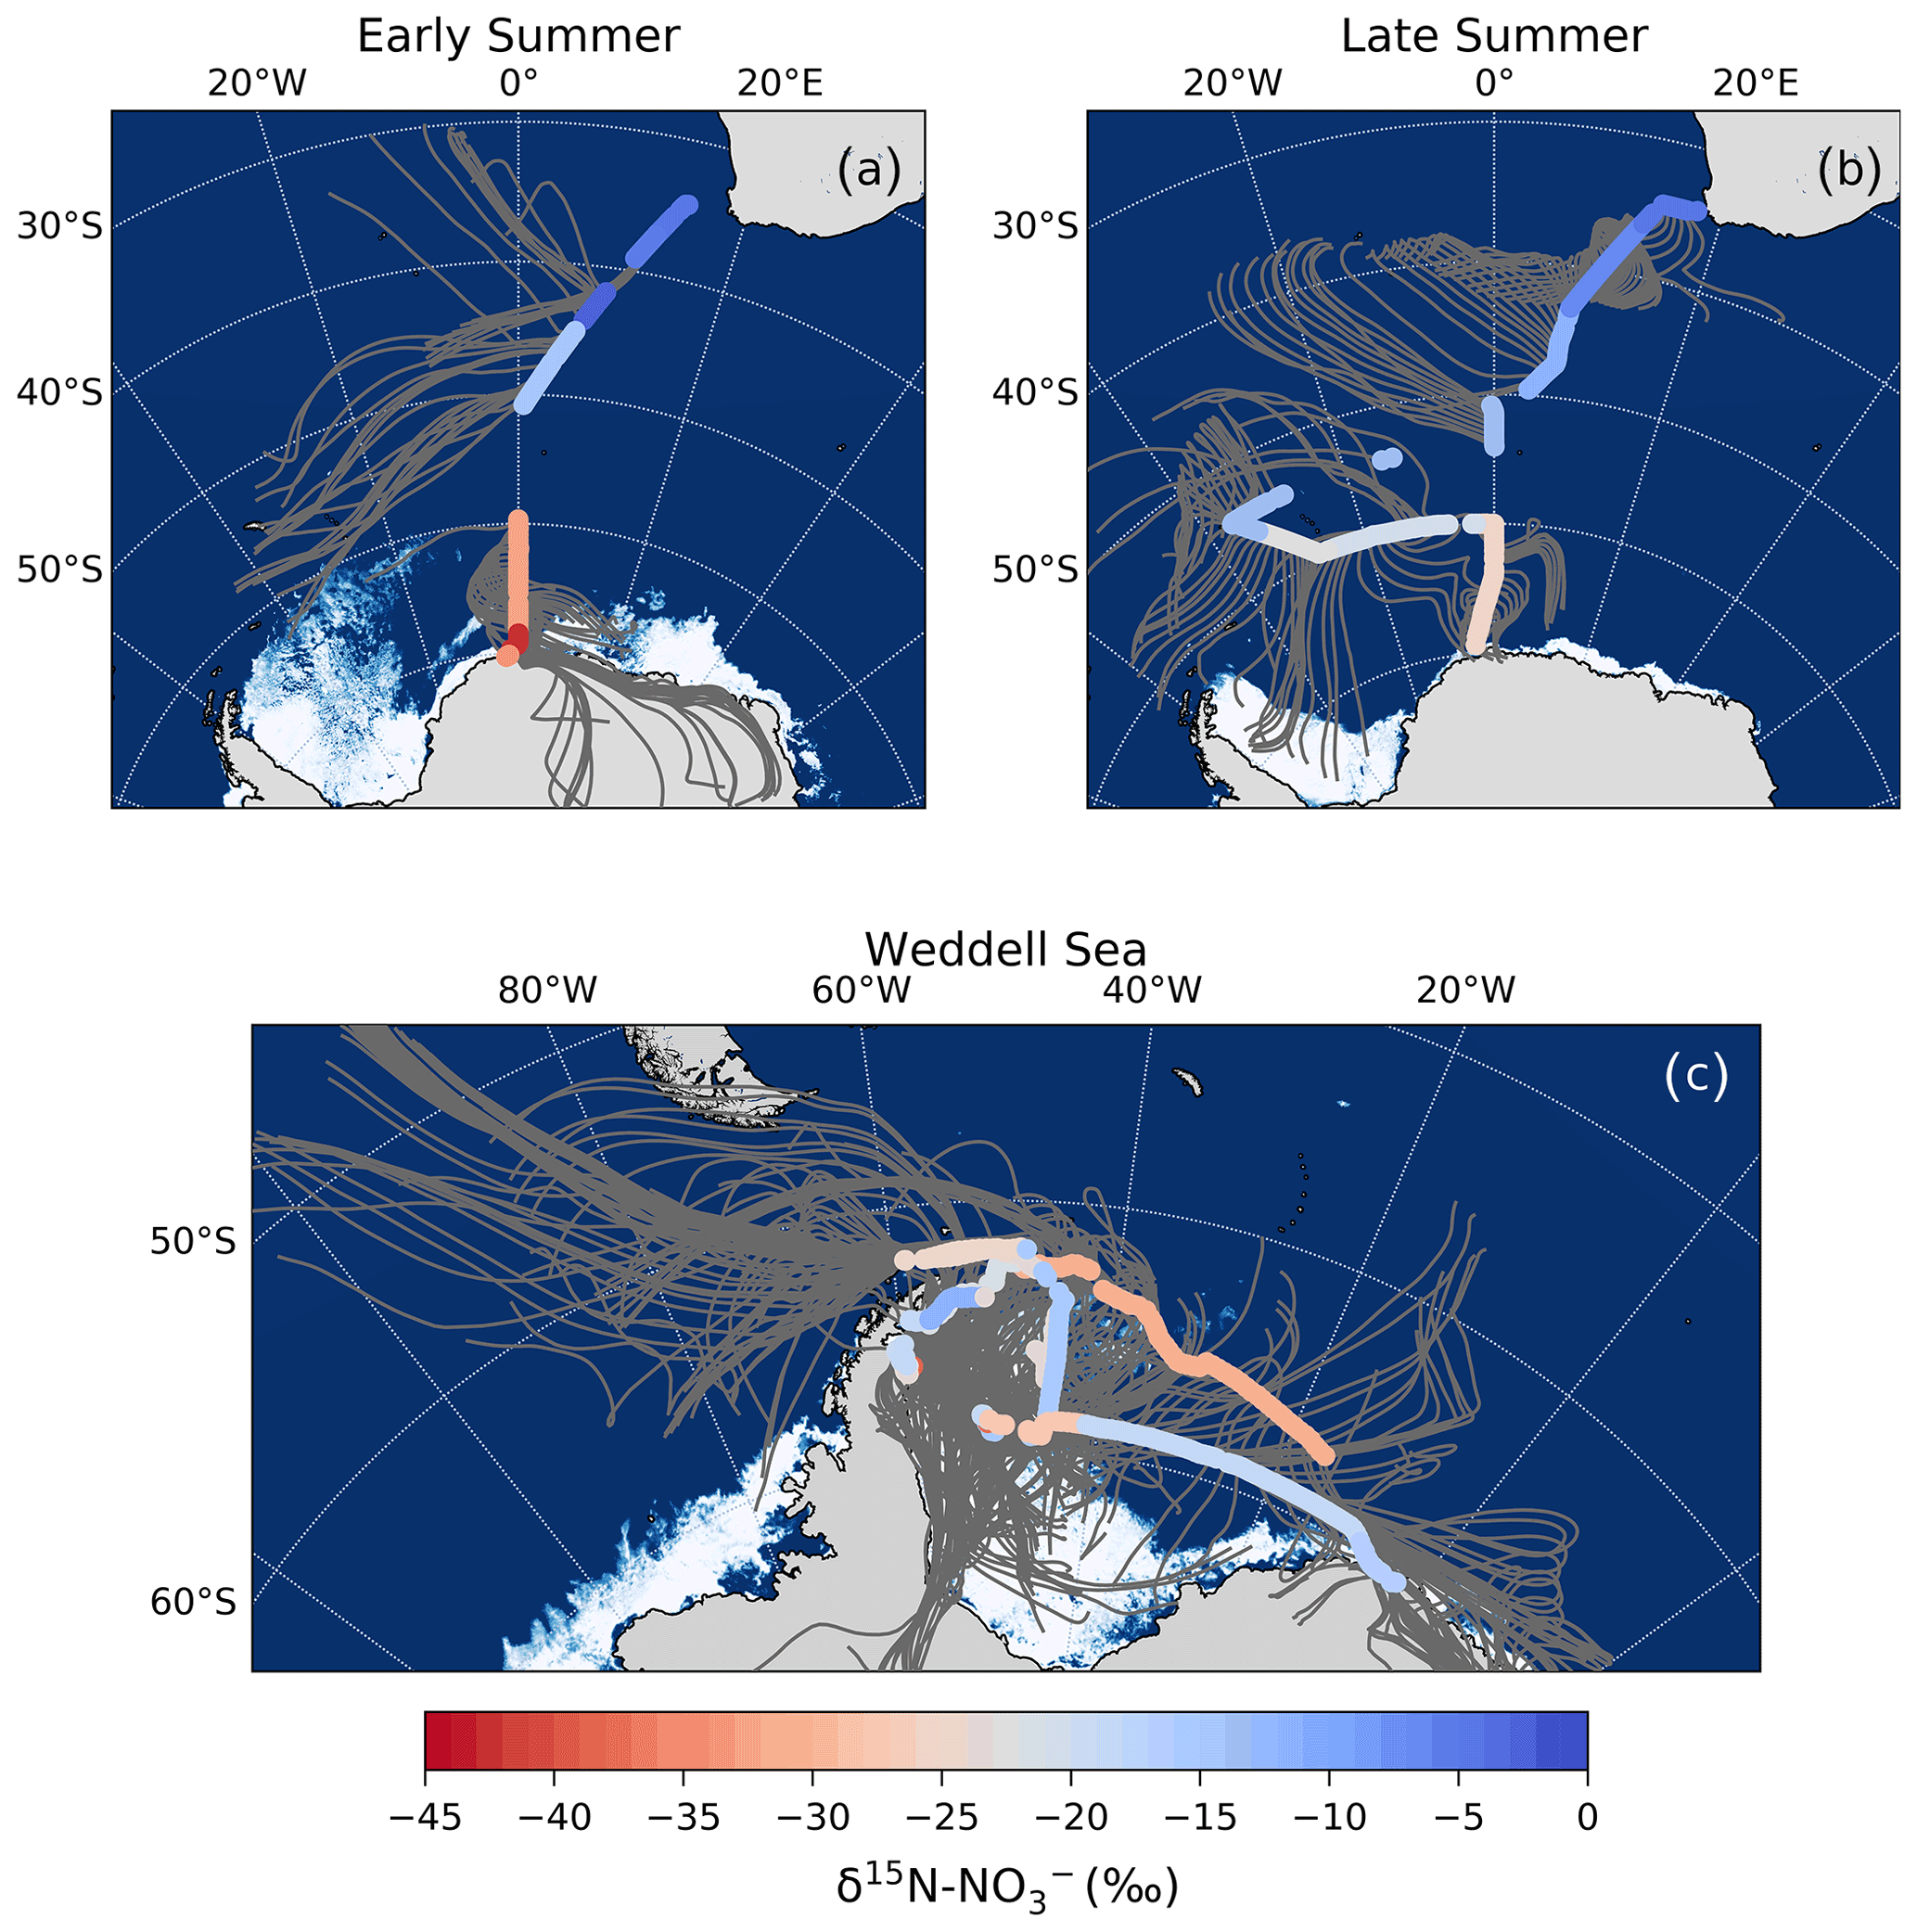
Figure 2The 72 h AMBTs (grey lines) computed for each hour of the voyage when the HV-AS was operational for more than 45 min of the hour during early summer (a), during late summer (b) and in the Weddell Sea (c). The colour bar represents the weighted average δ15N of coarse-mode (>1 µm) atmospheric nitrate (δ15N–). Individual AMBTs for each aerosol sample from the Weddell Sea are shown in Fig. S1 in the Supplement. The white area represents the location of the sea ice determined using satellite-derived sea ice concentration data, obtained from passive microwave sensors AMSR2 (Advanced Microwave Scanning Radiometer 2; Spreen et al., 2008).
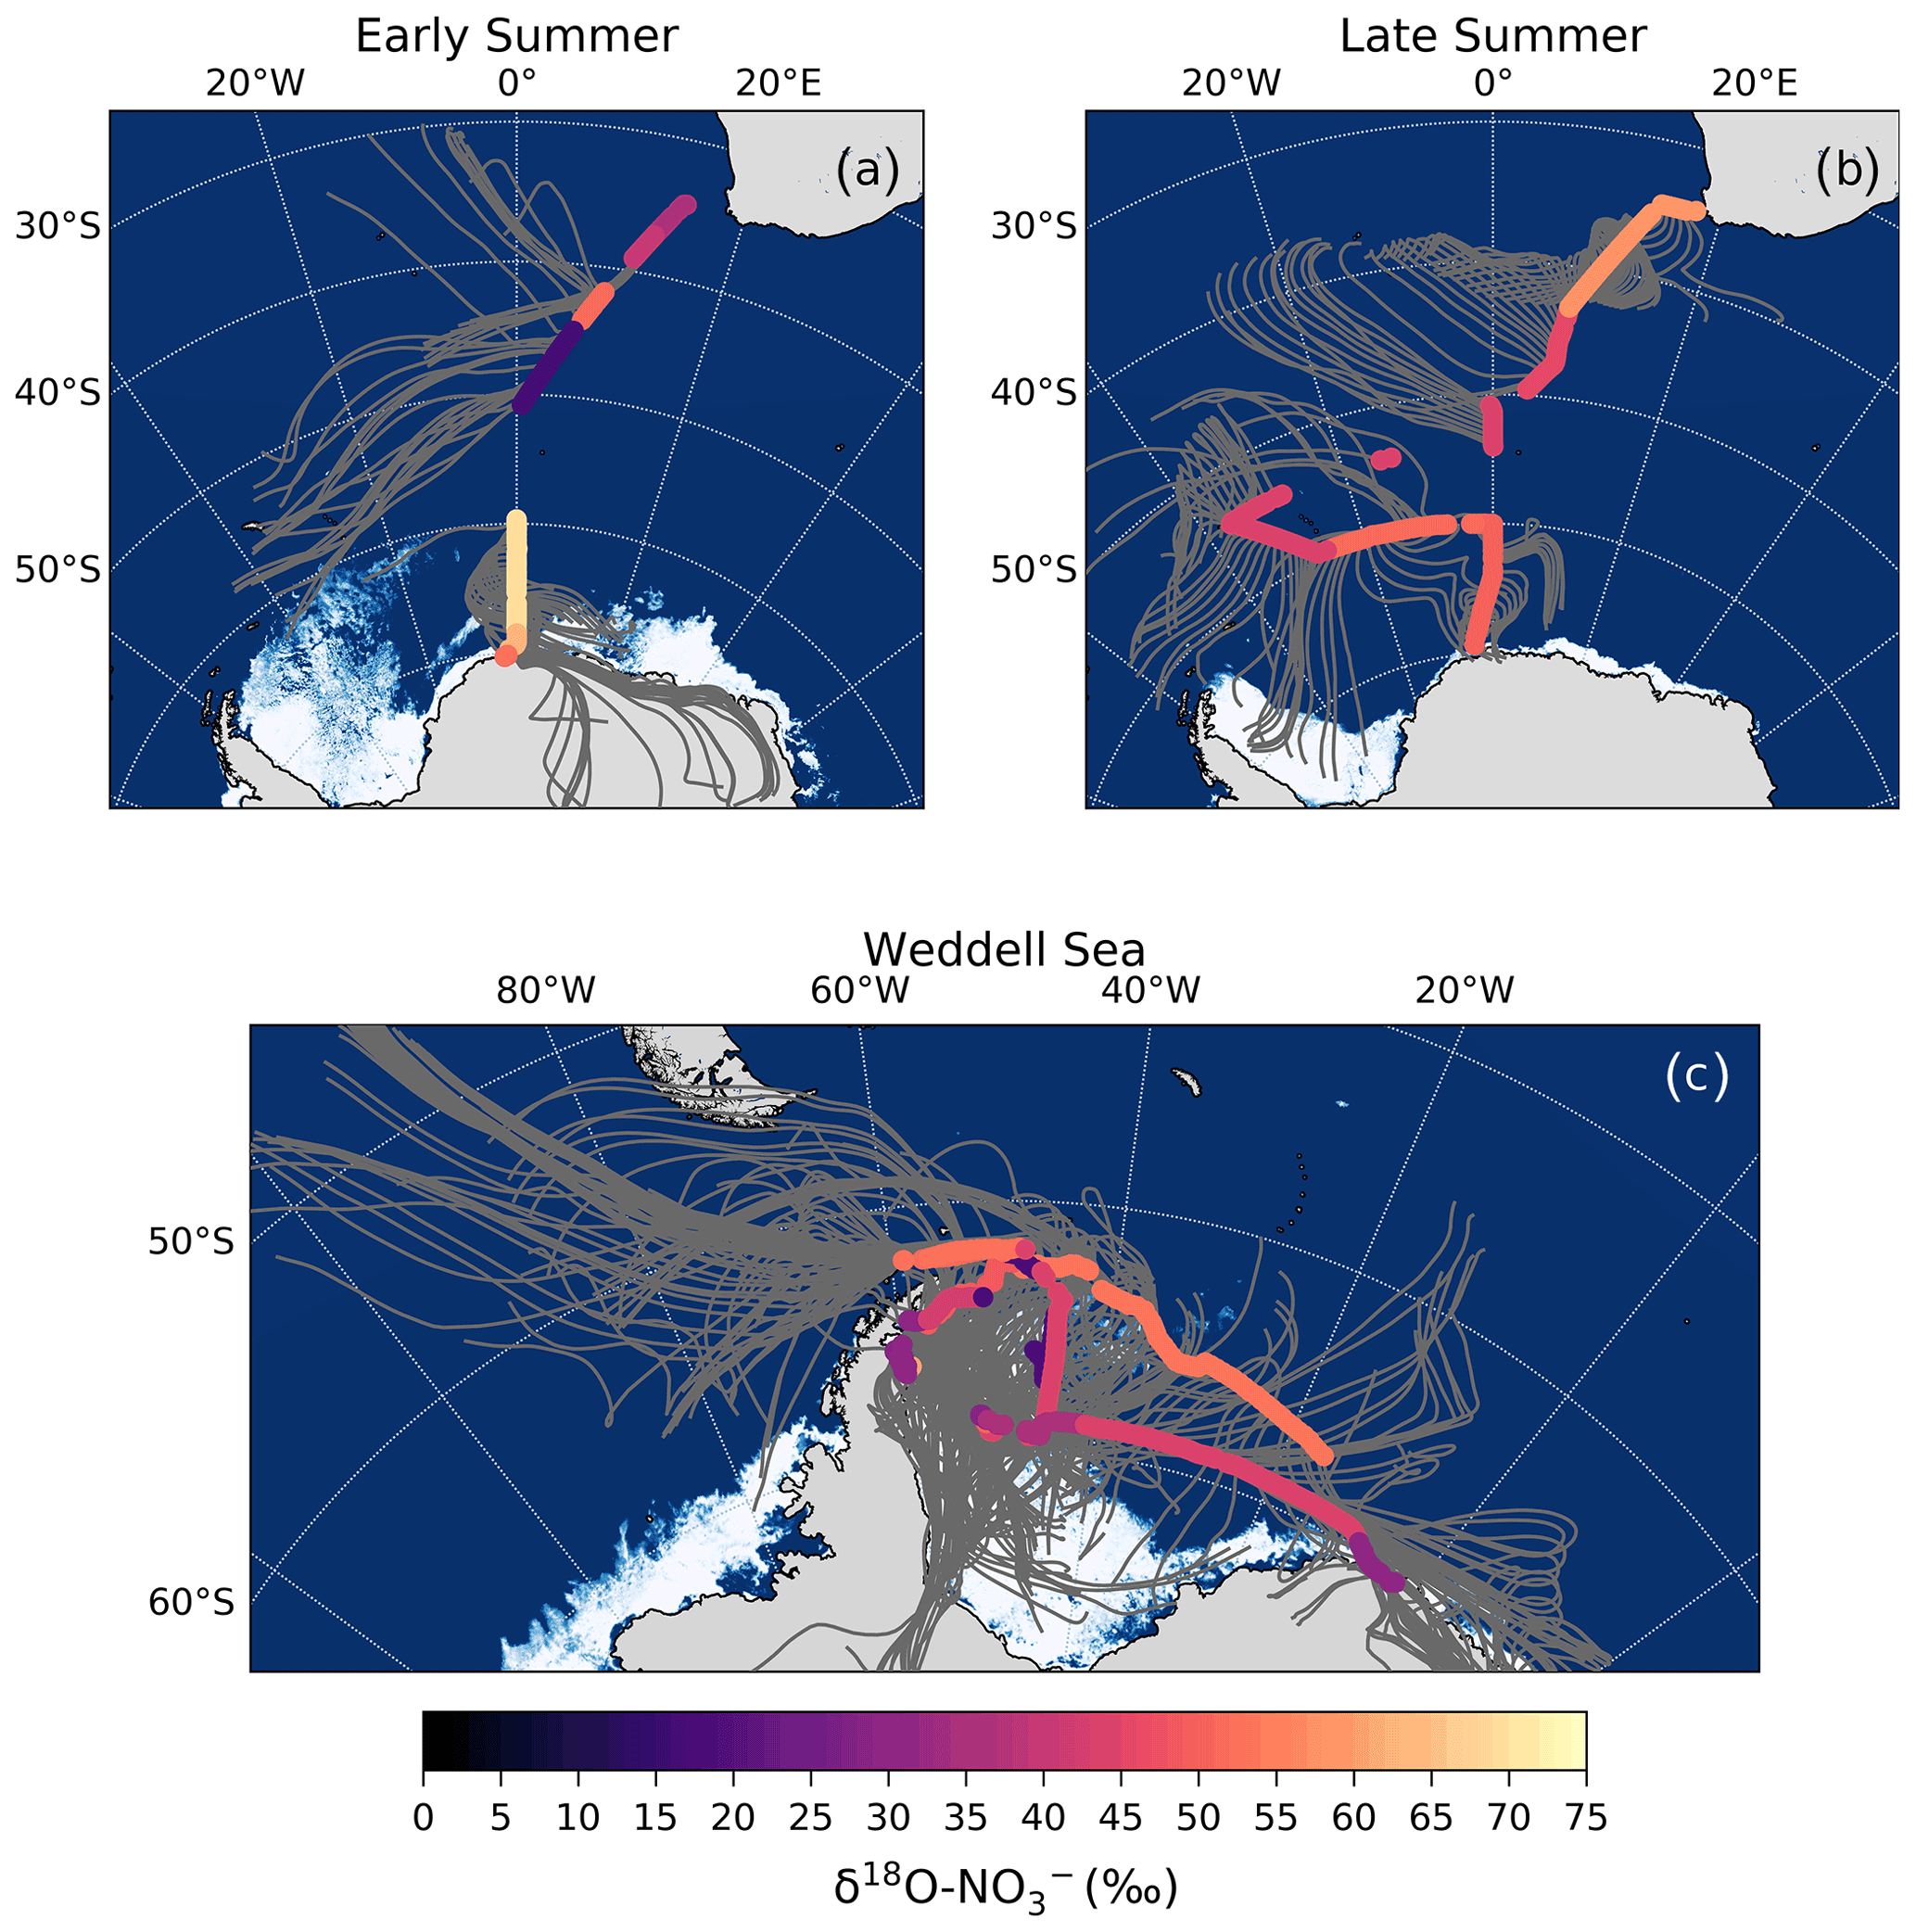
Figure 3The 72 h AMBTs (grey lines) computed for each hour of the voyage when the HV-AS was operational for more than 45 min of the hour during early summer (a), during late summer (b) and in the Weddell Sea (c). The colour bar represents the weighted average δ18O of coarse-mode (>1 µm) atmospheric nitrate (δ18O–). Individual AMBTs for each aerosol sample from the Weddell Sea are shown in Fig. S1. The white area represents the location of the sea ice (see Fig. 2 caption).
Our observations reveal a latitudinal gradient in atmospheric NO concentration and δ15N–, which we hypothesize may be attributed to the varying contribution of the dominant NOx sources present between Cape Town and coastal Antarctica. In contrast, δ18O– depicts no latitudinal trend; however, relatively low δ18O– values are observed in the Weddell Sea, which we hypothesize may be attributed to the influence of sea ice emissions on NOx cycling. Below, we first discuss the extent to which anthropogenic NOx sources may influence the observed atmospheric NO concentrations and δ15N signatures. Then we discuss the dominant NOx sources to low-, mid- and high-latitude Southern Ocean MBL NO, determined in part from 72 h AMBTs, as well as the role of various oxidants in cycling and NO2 oxidation.
4.1 Minimal influence of anthropogenic NOx sources
Aerosol NO concentrations were low (<100 ng m−3; Fig. 1a) for most air masses sampled along the latitudinal transect and in the Weddell Sea, consistent with the expectation of minimal influence from anthropogenic NOx sources. For comparison, [NO] in a polluted urban airshed over South Africa can be >500 ng m−3 (Collett et al., 2010). Interestingly, NO concentrations were higher (±200 ng m−3; Fig. 1a) in samples collected near the South African coast at the beginning of the latitudinal transect (i.e. above 43∘ S). However, 72 h AMBTs computed for all latitudinal transect samples indicate that sampled air masses originated from over the South Atlantic sector of the Southern Ocean (Fig. 2a and b), with no continental influence and limited opportunity for direct anthropogenic NOx emissions to contribute to aerosol NO, assuming NO has a lifetime of 72 h (Alexander et al., 2020). Furthermore, contamination from ship stack emissions was avoided using a sector collector to restrict HV-AS activity to certain wind directions (Sect. 2.1). As such, the higher atmospheric NO concentrations observed near South Africa are best explained by greater lightning NOx production, which generally occurs between 40∘ S and the ITCZ during summer (Nesbitt et al., 2000; van der A et al., 2008).
4.2 Interpretation of natural NOx sources using the N isotopic composition of atmospheric NO
Aerosol δ15N– ranged from −2.7 ‰ for low-latitude air masses to −42.9 ‰ for high-latitude air masses (including those sampled in the Weddell Sea; Fig. 1b). As discussed in Sect. 1.1, the δ15N– reflects the δ15N of the source NOx plus any isotopic fractionation imparted from cycling or NOx to NO conversion. Similar to previous studies, we surmise that NOx equilibrium fractionation is unlikely to be relevant in our system, as NOx concentrations are significantly lower than O3 concentrations (Elliott et al., 2007; Morin et al., 2009; Walters et al., 2016; Park et al., 2018). Typical O3 concentrations observed at coastal sites in Antarctica are on the order of 20 ppbv (parts per billion by volume) (Nadzir et al., 2018), whereas the sum of NO and NO2 rarely exceeds 0.04 ppbv (Jones et al., 2000; Weller et al., 2002; Bauguitte et al., 2012). Under these conditions NOx isotopic exchange occurs at a much slower rate than Reactions (R1) and (R2), such that little to no equilibrium isotope fractionation is expressed, and the δ15N of the NO should reflect the δ15N of the NOx source (Walters et al., 2016). Additionally, equilibrium isotope effects are temperature-dependent (increasing with decreasing temperature), and here ambient temperatures decline with increasing latitude. Therefore, if equilibrium isotope fractionation were occurring during cycling and/or NOx to NO conversion, one would expect δ15N– to increase with latitude, as both fractionation processes produce NO with a higher δ15N than the source NOx. However, the opposite trend is observed here, whereby δ15N– decreases with increasing latitude (Fig. 1b). Therefore, we discount the hypothesis that equilibrium isotope effects can explain the latitudinal gradient in δ15N–.
NO in the Antarctic troposphere may also derive from stratospheric denitrification, whereby HNO3 is injected into the troposphere from the stratosphere via the subsidence and penetration of polar stratospheric clouds (PSCs). However, this phenomenon typically occurs in winter when the tropospheric barrier is weak, and the lower stratosphere is cold enough for PSC formation (Savarino et al., 2007; Walters et al., 2019). Furthermore, δ15N– originating from stratospheric inputs is estimated to be 19±3 ‰ (Savarino et al., 2007), a value substantially greater than the atmospheric δ15N– observed here for high-latitude air masses; thus, we discount a direct influence from stratospheric NOx. We propose that the observed variation in atmospheric δ15N– across the Southern Ocean is best explained by the changing contribution of three dominant NOx sources: lightning, surface ocean alkyl nitrate emissions and photochemical production on snow and ice, determined using AMBT analyses and typical NOx source signatures where possible, as discussed below.
4.2.1 High latitudes: photochemical NOx source
Aerosol δ15N– was relatively low in air masses from the southern high latitudes, including in the Weddell Sea (average of −24.3 ‰; Figs. 1b and 2). The latitudinal gradient in lightning NOx production suggests that lightning NOx is greatly reduced at high latitudes (Nesbitt et al., 2000). Similar to other studies in the region (Savarino et al., 2007; Morin et al., 2009), we suggest that photochemical NOx production on snow or ice accounts for the low aerosol δ15N– in high-latitude air masses, where high-latitude air mass samples are defined as those exposed to the Antarctic continent or the surrounding sea ice (with sea ice concentration being at least 50 %). Antarctic estimates for isotopic fractionation associated with snow NO photolysis during summer range from −47.9 ‰ to −55.8 ‰ for laboratory and field experiments, respectively (Berhanu et al., 2014, 2015), resulting in the emission of low δ15N NOx to the overlying atmosphere (Savarino et al., 2007; Morin et al., 2009; Shi et al., 2018; Walters et al., 2019). Therefore, NO photolysis explains the very low δ15N– observed in high-latitude air masses in early and late summer that crossed snow-covered continental ice or sea ice before being sampled (Fig. 2a, b). During early summer, air masses spent significantly more time over the snow-covered continent compared to late summer, and the sea ice extent was greater in early summer compared to late summer (Fig. 2a, b). Combined, these dynamics resulted in a much lower δ15N– for high-latitude air masses during early summer compared to late summer (minimum value of −42.9 ‰ vs. −25.6 ‰). Similarly low MBL δ15N– values ( ‰) were recently observed for the southern high latitudes of the Indian Ocean (Shi et al., 2021). Our data are also consistent with year-round studies of atmospheric NO at coastal Antarctica (Savarino et al., 2007) and the South Pole (Walters et al., 2019), where δ15N– was reported to range from −46.9 ‰ to 10.8 ‰ and from −60.8 ‰ to 10.5 ‰, respectively. Both studies observed a seasonal cycle in δ15N–, whereby the lowest values occurred during sunlit periods (i.e. summer) due to snowpack NOx emissions, and the highest values occurred during dark periods (i.e. winter) due to stratospheric inputs (Savarino et al., 2007; Walters et al., 2019).
4.2.2 Low latitudes to mid-latitudes: oceanic NOx source
At the northern extent of our transects, the low-latitude aerosol samples, defined as those with air mass back trajectories originating from anywhere north of 43∘ S in early summer and 41∘ S in late summer (Fig. 2), had the highest average δ15N– signature ( ‰; n=5). These values can be attributed to lightning-generated NOx, which has a δ15N signature close to 0 ‰ (Hoering, 1957). Lightning activity at low latitudes is also consistent with the higher atmospheric [NO] observed (Fig. 1a) and is further supported by co-occurring high [NO] and relatively high δ15N– (Fig. S2). An average atmospheric δ15N– signature of −4 ‰ was previously reported for the low-latitude Atlantic Ocean, between 45∘ S and 45∘ N, and was similarly attributed to a combination of natural NOx sources including lightning (Morin et al., 2009).
Aerosol samples across the mid-latitudes had an average δ15N– of −13.2 ‰ (Figs. 1b and 2). Mid-latitude air masses are defined as those originating from anywhere south of 43∘ S in early summer and south of 41∘ S in late summer that made no contact with Antarctica or any surrounding sea ice (Fig. 2a, b). Furthermore 43∘ S and 41∘ S represent the latitudes at which non-zero sea surface nitrite concentrations began to be observed in early and late summer (Fig. 4). Mid-latitude samples were therefore unlikely to be influenced by snow-emitted NOx with its light isotopic signature. However, the observed aerosol δ15N– was too low (−14.5 ‰ to −11.2 ‰) to be explained solely by lightning-generated NOx. In the absence of any signature of anthropogenic NOx emissions (Sect. 4.1), we argue that the dominant NOx source for the mid-latitude samples originates from seawater.
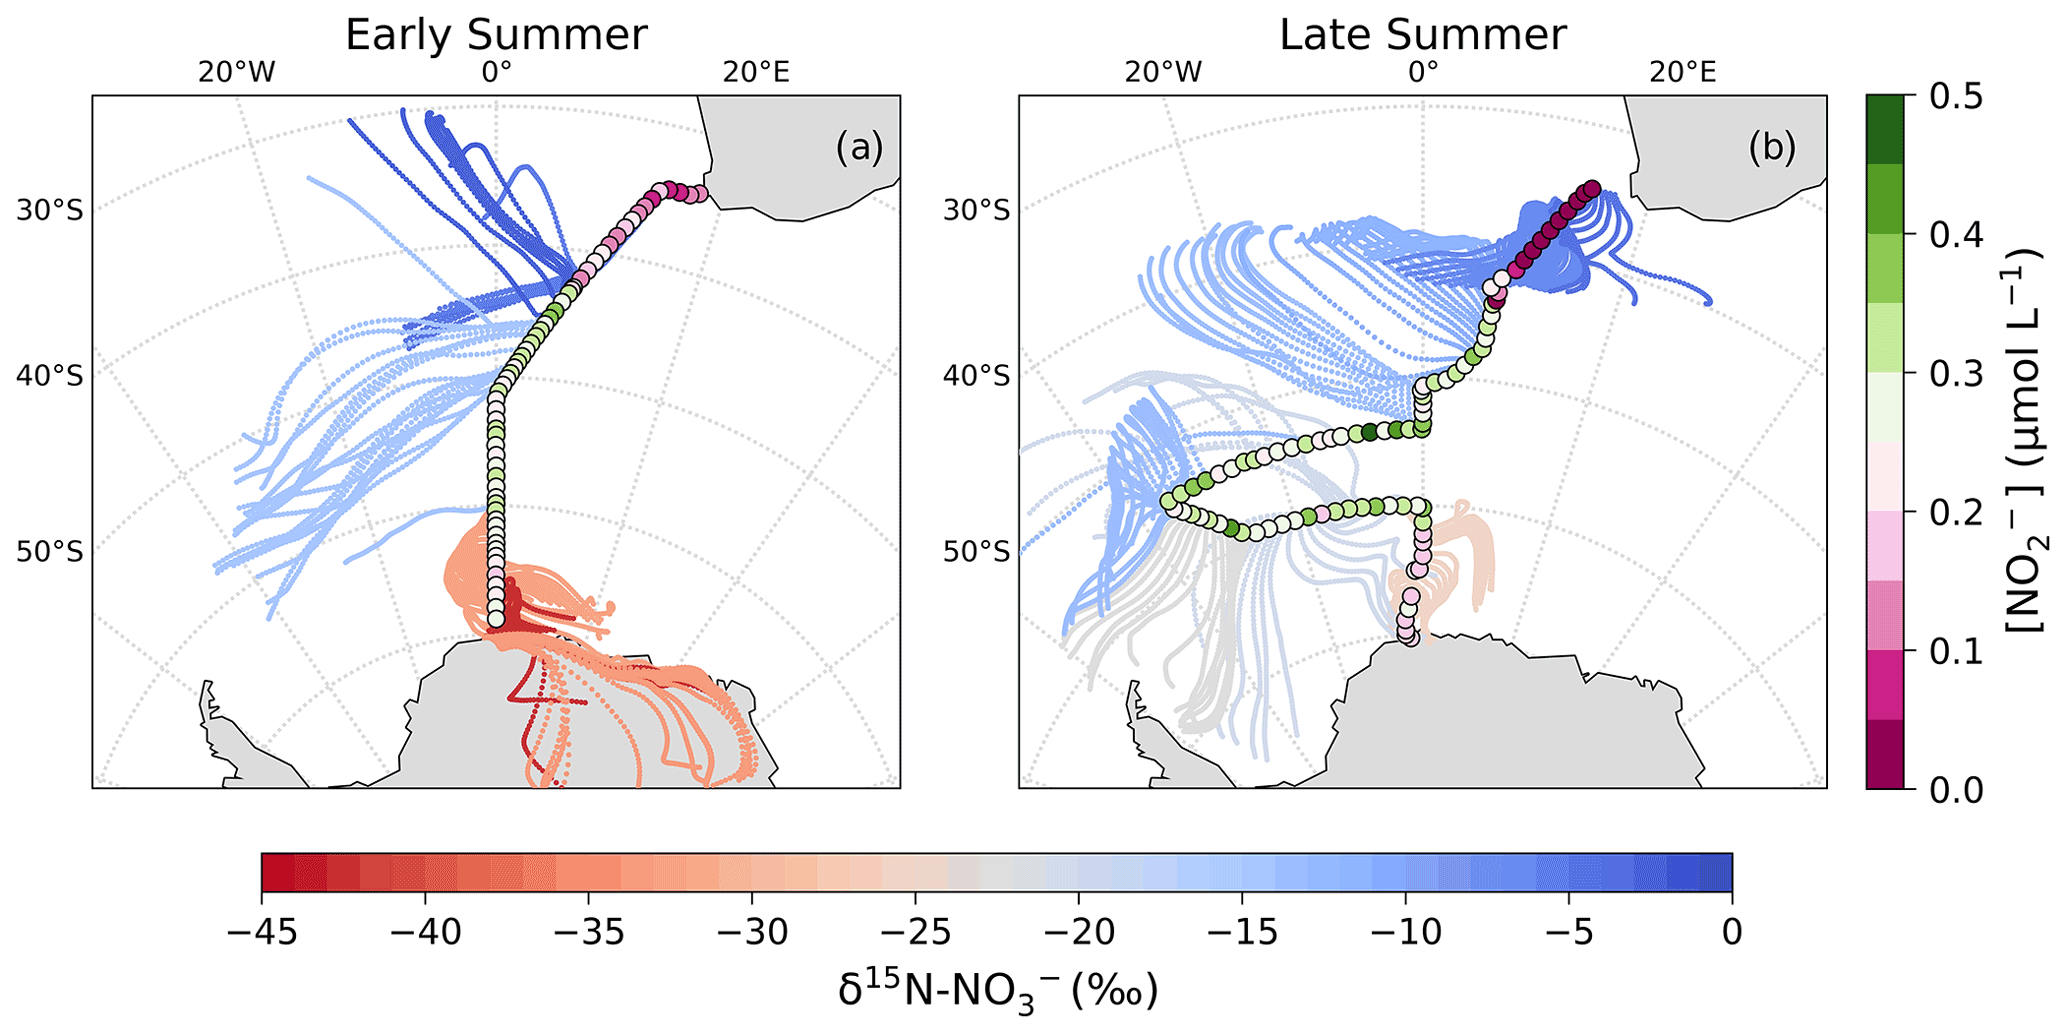
Figure 4The 72 h AMBTs computed for each hour of the voyage during early (a) and late (b) summer, when the HV-AS was operational for more than 45 min of the hour. AMBTs are colour-coded by the weighted average δ15N of atmospheric nitrate (δ15N–), represented by the horizontal colour bar. Overlaid are the surface ocean nitrite concentrations (circles; []; µmol L−1), measured along each transect and represented by the vertical colour bar.
As mentioned in Sect. 1, the most likely mechanism for an oceanic NOx source is via the photolysis of surface ocean derived RONO2 in the MBL. NO derived from seawater nitrite is thought to limit RONO2 production (Dahl and Saltzman, 2008; Dahl et al., 2012), such that non-zero nitrite concentrations are required for RONO2 production to occur. Here, surface ocean nitrite concentrations were relatively high, in particular from ∼41 to 50∘ S (Fig. 4). Furthermore, the latitudinal extent of mid-latitude air masses with low δ15N– signatures corresponds well with the same latitudinal extent in which non-zero surface ocean nitrite concentrations occurred (Fig. 4). As such, we suggest that in this region oceanic RONO2 emission is the main source to the Southern Ocean MBL, ultimately resulting in the low δ15N– values observed for mid-latitude air masses.
No estimates exist for the δ15N of oceanic RONO2; however RONO2 photolysis may yield isotopically light NOx given that NO photolysis produces low δ15N products (e.g. Frey et al., 2009). Therefore, once oxidized in the overlying atmosphere, NOx derived from oceanic RONO2 photolysis may form atmospheric NO with a low δ15N signature. Aerosol δ15N– values have been observed to range from −14.1 ‰ to −7.3 ‰ in the eastern equatorial Pacific (Kamezaki et al., 2019) and from −6 ‰ to ∼0 ‰ (average ‰) in the western equatorial Pacific (Shi et al., 2021). Observed δ15N– is higher in the western compared to the eastern equatorial Pacific, which could be attributed to the proximity of the western equatorial Pacific to continental/anthropogenic NOx sources, resulting in NO having a higher δ15N signature. The low average δ15N– observed for the mid-latitude air masses of the Southern Ocean MBL sampled in the present study (−14.5 ‰ to −11.2 ‰) is remarkably similar to that for the air masses observed in the eastern equatorial Pacific (Kamezaki et al., 2019). Kamezaki et al. (2019) also concluded that such low δ15N– values cannot be explained solely by lightning NOx, and given the lack of considerable influence from any continental NOx sources, they invoked the contribution of oceanic N emissions in the form of ammonia (NH3) and/or RONO2. However, NH3 flux data for the summertime Atlantic Southern Ocean derived from in situ ocean/atmosphere observations suggest that the ocean in this region is a net sink of NH3 (Altieri et al., 2021).
The latitudinal extent of our sampling campaign enabled us to estimate a range of likely values for the N isotopic composition of NO derived from oceanic RONO2. We split the latitudinal transect into three regions, each characterized by the dominance of a different natural source of NO, i.e. lightning NOx at low latitudes (Fig. 5, light orange), oceanic RONO2 emissions at mid-latitudes (Fig. 5, dark orange) and snowpack emissions at high latitudes (Fig. 5, red).
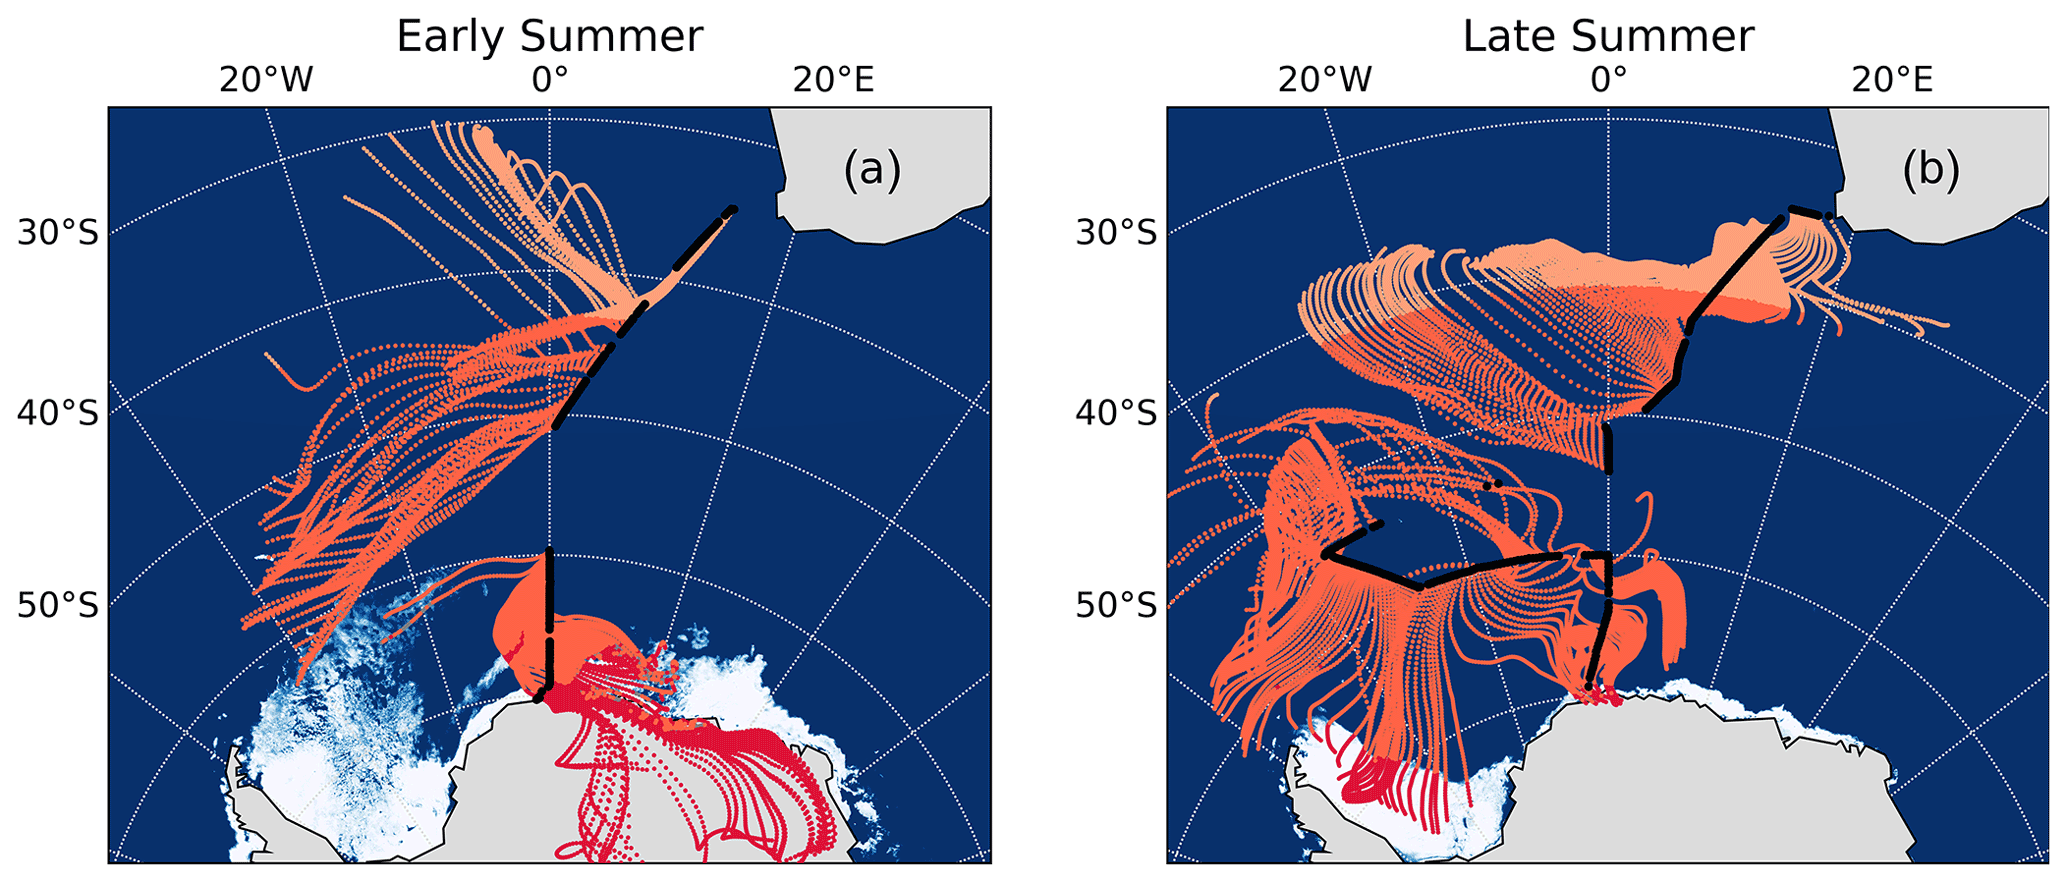
Figure 5The 72 h AMBTs computed for each hour of the voyage during early (a) and late (b) summer, when the HV-AS was operational for more than 45 min of the hour. Light orange, dark orange and red AMBTs represent time spent over the low-, mid- and high-latitude Southern Ocean, respectively. The white area represents the location of the sea ice (see Fig. 2 caption).
Assuming that the dominant natural source of NO is the only source relevant in each latitudinal zone, we estimate the contribution of each source to total NO formation by ascertaining the amount of time air masses spent in each zone. We further assume that atmospheric δ15N– reflects at most a combination of two sources based on the AMBTs of each sample, either lightning NOx and oceanic RONO2 emissions near South Africa or oceanic RONO2 emissions and snowpack NOx emissions near Antarctica (Fig. 5 and Table S6). Using a two-endmember mixing model, the δ15N signature of the source NO derived from mid-latitude Southern Ocean RONO2 emissions was calculated for all samples where air masses from the mid-latitude region contributed at least 10 % (Table S6). This 10 % threshold was chosen as the isotopic endmember of oceanic RONO2 is harder to determine with confidence when its contribution to total NO is less than 10 %.
As an example, the AMBTs for sample ES 4 spent 3 % of the time in the low-latitude zone and 97 % in the mid-latitude zone. Using the measured δ15N– for ES 4 of −14.5 ‰, and assuming lightning NOx has a δ15N signature of 0 ‰, we calculate the δ15N signature of the RONO2-derived NO to be −14.9 ‰. It is important to note that using this approach to estimate the δ15N– from oceanic RONO2 emissions relies heavily on AMBTs generated using HYSPLIT. While HYSPLIT is a frequently used tool for assessing air mass origin in the Southern Hemisphere and over Antarctica (Morin et al., 2009; Walters et al., 2019; Shi et al., 2021), it is important to note that a spatial uncertainty of 15 % to 30 % of the trajectory path distance can be expected (Scarchilli et al., 2011). AMBTs also become increasingly uncertain the further back in time they are used (Sinclair et al., 2013). Some of this uncertainty is alleviated by the fact that the AMBTs generated here are relatively short (<5 d). Additionally, the spatial scale of the low-, mid- and high-latitude zones is large, such that some variation in sample AMBTs will not significantly alter the expected dominant NO source.
Using this approach for each filter deployment along the latitudinal transect, an average δ15N– from oceanic RONO2 emissions of ‰ was estimated. Furthermore, the contribution of RONO2 emissions can explain the lowering of δ15N from 0 ‰ for the low-latitude air mass samples. For example, the highest δ15N observed in the study was −2.7 ‰, and this sample has a <5 % contribution from the mid-latitude zone. The other two low-latitude samples have 30 % to 40 % contribution from the mid-latitude zone, and their δ15N is lower (Table S3), as expected due to the influence of RONO2 emissions.
The influence of low δ15N– from RONO2 emissions is not limited to the Southern Ocean, and this estimate of the N isotopic composition for the RONO2 derived source may be useful to constrain the contribution of RONO2 emissions to NO formation in other ocean regions with elevated surface ocean nitrite concentrations, such as the tropical Pacific.
4.3 The O isotopes of atmospheric nitrate
The corresponding δ18O values allow us to determine the pathways of NO formation from NOx. However, an assumption must first be made regarding the oxidation of NO to NO2. While the dominant oxidant of NO to NO2 is O3 (Reaction R1) in most of the troposphere, over the open ocean there can be a significant contribution via the reaction of NO with peroxy radicals (HO2 and its organic homologues RO2) (Alexander et al., 2020). Peroxy radicals compete with O3 to convert NO into NO2 via Reaction (R10).
The δ18O of peroxy radicals is much lower than that of O3 because the O atoms derive from atmospheric O2, which has a well-defined δ18O of 23.9 ‰ (Kroopnick and Craig, 1972). The δ18O–NO2 can then be calculated using Eq. (2):
where f is the fraction of NO2 formed from Reaction (R1), (1−f) is the fraction formed from Reaction (R10) and the terminal δ18O–O3 value (δ18O–) is 130.4±12.9 ‰ (Vicars and Savarino, 2014).
The δ18O– is then determined using Eq. (3), in which two-thirds of the O atoms in NO come from NO2, and one-third comes from OH, i.e. Reaction (R3), or using Eq. (4), in which three-sixths of the O atoms in NO come from O3, two-sixths come from NO2 and one-sixth comes from H2O, i.e. Reactions (R4)–(R6) (Hastings et al., 2003; Alexander et al., 2020).
We assume that 15 % of NO to NO2 conversion occurs via oxidation and 85 % by O3 oxidation, as is suggested by global models (Alexander et al., 2020), and use the minimum and maximum δ18O–H2O range of −27.5 ‰ to 0 ‰, the temperature-dependent equilibrium isotope exchange between OH and H2O (Walters and Michalski, 2016) and the resulting minimum and maximum estimates for δ18O–OH of −67.4 ‰ to −41.0 ‰. Using these assumptions and Eqs. (3) and (4), the expected δ18O– for the daytime OH oxidation pathway (Reaction R3) is 46.5 ‰ to 71.4 ‰, and for the dark Reactions (R4)–(R6), it is 88.7 ‰ to 113.5 ‰.
The observed δ18O– values were all less than 70 ‰ (Figs. 1c and 3), suggesting that NOx oxidation by OH (Reaction R3) was indeed the dominant pathway for atmospheric NO formation during summer. The low δ18O– values observed suggest a minimal influence of O3 in the oxidation chemistry, ruling out both the halogen-related (Reactions R8 to R9) and DMS-related (Reaction R7) NO formation pathways in addition to N2O5 hydrolysis (Reactions R4 to R6). This is consistent with previous year-round studies of atmospheric NO at coastal Antarctica (Savarino et al., 2007) and the South Pole (Walters et al., 2019), where δ18O– was at a minimum in summer (59.6 ‰ and 47.0 ‰, respectively). Both studies confirm the importance of HOx oxidation chemistry in summer when solar radiation enhances the production of these oxidants, followed by a switch to O3-dominated oxidation chemistry in winter (Savarino et al., 2007; Ishino et al., 2017; Walters et al., 2019).
Interestingly, most aerosol samples have a δ18O– less than 46.5 ‰ (n=19), the lower limit estimated above for the OH pathway. This suggests that there is more NO to NO2 conversion via oxidation occurring than the global average. A maximum contribution to NO oxidation of ∼63 % is required to explain the lowest δ18O– value, which was observed over the mid-latitudes during early summer. Increased RO2 production over the mid-latitudes could derive from RONO2 photolysis in the MBL, which we hypothesize is happening in this region based on the δ15N– (Sect. 4.2.2).
Although the lowest δ18O observation occurred in the mid-latitudes, the majority of low δ18O– values were observed in the Weddell Sea, away from the region of maximum RONO2 emissions. Approximately half of the Weddell Sea samples have a δ18O– <31 ‰, which would require a contribution to NO oxidation upwards of 40 % (more than double the contribution estimated by global models; Alexander et al., 2020). These δ18O– observations are unusually low compared to previous observations for the same region in spring (Morin et al., 2009).
We hypothesize that the large contribution of to oxidation (i.e. a decrease in f in Eq. 2) resulting in these low δ18O– values is due to the influence of sea ice emissions. The 72 h AMBTs for these low δ18O– Weddell Sea samples indicate that all the air masses either originated from, or spent a significant amount of time recirculating, over the sea-ice-covered region of the western Weddell Sea (Fig. 6b). By contrast, aerosol samples from the Weddell Sea with δ18O– values greater than 31 ‰ have air masses that experienced significantly more oceanic influence (Fig. 6a).
There is evidence that sea ice can lead to enhanced peroxy radical production (Brough et al., 2019). In that work, increased HO2+RO2 concentrations were observed during spring at a coastal Antarctic site when air masses arrived from across a sea-ice-covered zone. This was attributed to the oxidation of hydrocarbons by chlorine atoms, which leads to increased RO2 concentrations via Reactions (R11) and (R12).

Figure 6The 72 h AMBTs (light blue lines) computed for each hour of the voyage in the Weddell Sea, when the HV-AS was operational for more than 45 min of the hour. The vertical colour bar represents the weighted average δ18O of atmospheric nitrate (δ18O–), where δ18O– was >31 ‰ (a) and <31 ‰ (b). The white area represents the location of the sea ice (see Fig. 2 caption).
Cl atoms are much more reactive with hydrocarbons than OH (Monks, 2005) and can enhance hydrocarbon oxidation, even when present at low concentrations. Brough et al. (2019) suggest that air masses that traversed the sea ice zone contained photolabile chlorine compounds that built up at night until photolysis occurred during the next day (Brough et al., 2019). Although our study was conducted in summer (the season of minimum sea ice extent), the sampling locations were uniquely positioned at the western edge of the Weddell Sea gyre, where significant sea ice remained (Fig. 6). Therefore, we suggest that chlorine chemistry over the sea ice increased RO2 concentrations at the time of our sampling, allowing the NO+RO2 pathway to play a more significant role in the Weddell Sea and resulting in low δ18O– values. We note that the only other estimates of δ18O– from the Weddell Sea ranged from ∼50 ‰ to 110 ‰ during springtime, and these samples were associated with air masses that spent almost no time over the sea ice and therefore had limited potential for this peroxy radical chemistry to drive down the δ18O– to the low values we observe (Morin et al., 2009).
Our observations across a large latitudinal gradient of the summertime Southern Ocean MBL suggest it is dominated by natural NOx sources with distinct isotopic signatures. Aerosol NO was predominantly formed from lightning-generated NOx with a δ15N of ∼0 ‰ at the lower latitudes, whereas snowpack NOx emissions with a δ15N ‰ dominated the MBL inventory at higher latitudes. Over the mid-latitudes, NO derived primarily from oceanic RONO2 emissions, with an estimated δ15N signature of ‰. Additional research is needed to improve our mechanistic and isotopic understanding of surface ocean RONO2 formation, flux and conversion to aerosol nitrate in order to constrain the contribution of oceanic RONO2 emissions to NO formation in other ocean regions where this source has been invoked, such as the tropical Pacific (Kamezaki et al., 2019). The isotopic composition of NO observed here can further inform interpretations of Antarctic ice core NO isotope records to understand aerosol climate forcing and controls on the atmospheric oxidation budget over millennia (Freyer et al., 1996; Jiang et al., 2019) – the interpretation of which relies on knowledge of the NOx isotopic source signatures in the polar atmosphere.
The δ18O– values were consistently lower than 70 ‰, which confirms NOx oxidation by OH (Reaction R3) to be the dominant pathway for atmospheric NO formation during summer. However, unusually low δ18O– values observed at the mid-latitudes and in the Weddell Sea indicate the increased importance of peroxy radicals (and decreased importance of O3) in NO oxidation to NO2 in the MBL. At mid-latitudes, peroxy radicals (RO2) may derive from RONO2 photolysis, while in the Weddell Sea, sea ice appears to play an important role in the formation of this oxidant via its influence on chlorine chemistry (Brough et al., 2019). This implies that snow-covered sea ice is not only a source of NOx but also other species that have the potential to change the composition of the atmosphere above the ice and impact NOx oxidation chemistry. These results also highlight the utility of δ18O– to identify the major oxidants in NO oxidation, as well as NOx to NO conversion. In particular, δ18O– can serve as a useful tool for testing our understanding of the relative importance of in cycling, which can be difficult to constrain in some environments.
Our study challenges the traditional paradigm that considers the ocean to be a passive recipient of N deposition, as the Southern Ocean mid-latitude NO source may derive almost entirely from oceanic RONO2 emissions. In the tropical equatorial Pacific atmosphere, Kamezaki et al. (2019) also suggested evidence for a low δ15N– source derived from the ocean. In the subtropical Atlantic Ocean MBL, Altieri et al. (2016) found that biogeochemical cycling in the surface ocean can directly influence the lower atmosphere, serving as a source of aerosol organic N and ammonium. This study suggests that the surface waters of the Southern Ocean may also serve as a NOx source, ultimately resulting in NO aerosol formation. As such, the surface ocean may play a bigger role in atmospheric oxidative capacity over remote marine regions than previously thought.
Datasets for this research are available at https://doi.org/10.5281/zenodo.5840260 (Burger et al., 2021).
The supplement related to this article is available online at: https://doi.org/10.5194/acp-22-1081-2022-supplement.
KEA designed the study and sampling campaign, acquired funding and supervised the research. KEA and JG provided financial and laboratory resources and assisted in data validation. KAMS and JMB conducted the sampling at sea, and JMB performed the laboratory analyses. MGH and EJ assisted in data validation, reviewing and editing of the manuscript. JMB analysed the data and prepared the manuscript with contributions from all co-authors.
The contact author has declared that neither they nor their co-authors have any competing interests.
Publisher’s note: Copernicus Publications remains neutral with regard to jurisdictional claims in published maps and institutional affiliations.
We thank the Captain and crew of the R/V SA Agulhas II for their support at sea and the Marine Biogeochemistry Lab in the Oceanography Department at the University of Cape Town for their assistance in the field and laboratory. We also thank the Flotilla Foundation and the Weddell Sea Expedition (2019). We thank Lija Treibergs, Reide Jacksin and Peter Ruffino for their assistance in analysing the nitrate isotopes and Riesna Audh for her assistance with satellite-derived sea ice concentration data. We thank Riesna Audh, Raquel Flynn and Shantelle Smith for nitrite concentration measurements and Raquel Flynn for quality controlling the nitrite concentration data.
This research has been supported by a CAREER award to Julie Granger from the U.S. National Science Foundation (OCE-1554474). It has also been supported by the South African National Research Foundation through a Competitive Support for Rated Researchers Grant to Katye E. Altieri (111716) and a South African National Antarctic Programme Postgraduate Fellowship to Jessica Mary Burger and Grant to Katye E. Altieri (110732). Lastly this research was supported by the University of Cape Town through a University Research Council Launching Grant and VC Future Leaders 2030 Grant awarded to Katye E. Altieri.
This paper was edited by Roya Bahreini and reviewed by two anonymous referees.
Alexander, B. and Mickley, L. J.: Paleo-perspectives on the potential future changes in the oxidative capacity of the atmosphere due to climate change and anthropogenic emissions, Current Pollution Reports, 1, 57–69, https://doi.org/10.1007/s40726-015-0006-0, 2015.
Alexander, B., Sherwen, T., Holmes, C. D., Fisher, J. A., Chen, Q., Evans, M. J., and Kasibhatla, P.: Global inorganic nitrate production mechanisms: comparison of a global model with nitrate isotope observations, Atmos. Chem. Phys., 20, 3859–3877, https://doi.org/10.5194/acp-20-3859-2020, 2020.
Altieri, K. E., Hastings, M. G., Gobel, A. R., Peters, A. J., and Sigman, D. M.: Isotopic composition of rainwater nitrate at Bermuda: the influence of air mass source and chemistry in the marine boundary layer, J. Geophys. Res.-Atmos., 118, 11304–11316, https://doi.org/10.1002/jgrd.50829, 2013.
Altieri, K. E., Fawcett, S. E., Peters, A. J., Sigman, D. M., and Hastings, M. G.: Marine biogenic source of atmospheric organic nitrogen in the subtropical North Atlantic, P. Natl. Acad. Sci. USA, 113, 925–930, https://doi.org/10.1073/pnas.1516847113, 2016.
Altieri, K. E., Fawcett, S. E., and Hastings, M. G.: Reactive Nitrogen Cycling in the Atmosphere and Ocean, Annu. Rev. Earth Pl. Sc., 49, 513–540, https://doi.org/10.1146/annurev-earth-083120-052147, 2021.
Atlas, E., Pollock, W., Greenberg, J., Heidt, L., and Thompson, A. M..: Alkyl nitrates, nonmethane hydrocarbons, and halocarbon gases over the equatorial Pacific Ocean during Saga 3, J. Geophys. Res., 98, 16933–16947, https://doi.org/10.1029/93JD01005, 1993.
Baker, A. R., Lesworth, T., Adams, C., Jickells, T. D., and Granzeveld, L.: Estimation of atmospheric nutrient inputs to the Atlantic Ocean from 50∘ N to 50∘ S based on large-scale field sampling: Fixed nitrogen and dry deposition of phosphorus, Global Biogeochem. Cy., 24, GB3006, https://doi.org/10.1029/2009GB003634, 2010.
Bauguitte, S. J.-B., Bloss, W. J., Evans, M. J., Salmon, R. A., Anderson, P. S., Jones, A. E., Lee, J. D., Saiz-Lopez, A., Roscoe, H. K., Wolff, E. W., and Plane, J. M. C.: Summertime NOx measurements during the CHABLIS campaign: can source and sink estimates unravel observed diurnal cycles?, Atmos. Chem. Phys., 12, 989–1002, https://doi.org/10.5194/acp-12-989-2012, 2012.
Berhanu, T. A., Meusinger, C., Erbland, J., Jost, R., Bhattacharya, S. K., Johnson, M. S., and Savarino, J.: Laboratory study of nitrate photolysis in Antarctic snow. II. Isotopic effects and wavelength dependence, J. Chem. Phys., 140, 244306, https://doi.org/10.1063/1.4882899, 2014.
Berhanu, T. A., Savarino, J., Erbland, J., Vicars, W. C., Preunkert, S., Martins, J. F., and Johnson, M. S.: Isotopic effects of nitrate photochemistry in snow: a field study at Dome C, Antarctica, Atmos. Chem. Phys., 15, 11243–11256, https://doi.org/10.5194/acp-15-11243-2015, 2015.
Blake, N. J., Blake, D. R., Wingenter, O. W., Sive, B. C., Kang, C. H., Thornton, D. C., Bandy, A. R., Atlas, E., Flocke, F., Harris, J. M., and Rowland, F. S.: Aircraft measurements of the latitudinal, vertical, and seasonal variations of NMHCs, methyl nitrate, methyl halides, and DMS during the First Aerosol Characterization Experiment (ACE 1), J. Geophys. Res., 104, 21803–21817, https://doi.org/10.1029/1999JD900238, 1999.
Blake, N. J., Blake, D. R., Swanson, A. L., Atlas, E., Flocke, F., and Rowland, F. S.: Latitudinal, vertical, and seasonal variations of C1-C4 alkyl nitrate in the troposphere over the Pacific Ocean during PEM-Tropics A and B: Oceanic and continental sources, J. Geophys. Res., 108, 8242, https://doi.org/10.1029/2001JD001444, 2003.
Bölhke, J. K., Mroczkowski, S. J., and Coplen, T. B.: Oxygen isotopes in nitrate: new reference materials for 18O:17O:16O measurements and observations on nitrate-water equilibrium, Rapid Commun. Mass Sp., 17, 1835–1846, https://doi.org/10.1002/rcm.1123, 2003.
Brough, N., Jones, A. E., and Griffiths, P. T.: Influence of sea ice-derived halogens on atmospheric HOx as observed in Springtime coastal Antarctica, Geophys. Res. Lett., 46, 10168–10176, https://doi.org/10.1029/2019GL083825, 2019.
Burger, J. M., Granger, J., Joyce, E., Hastings, M. G., Spence, K. A. M., and Altieri, K. E.: The importance of alkyl nitrates and sea ice emissions to atmospheric NOx sources and cycling in the summertime Southern Ocean marine boundary layer, Version 3, Zenodo [data set], https://doi.org/10.5281/zenodo.5840260, 2021.
Casciotti, K. L., Sigman, D. M., Hastings, M. G., Böhlke, J. K., and Hilkert, A.: Measurement of the oxygen isotopic composition of nitrate in seawater and freshwater using the denitrifier method, Anal. Chem., 74, 4905–4912, https://doi.org/10.1021/ac020113w, 2002.
Chuck, A. L., Turner, S. M., and Liss, P. S.: Direct evidence for a marine source of C1 and C2 alkyl nitrates, Science, 297, 1151–1154, https://doi.org/10.1126/science.1073896, 2002.
Collett, K. S., Piketh, S. J., and Ross, K. E.: An assessment of the atmospheric nitrogen budget on the South African Highveld, S. Afr. J. Sci., 106, 1–9, https://doi.org/10.4102/sajs.v106i5/6.220, 2010.
Dahl, E. E. and Saltzman, S. E.: Alkyl nitrate photochemical production rates in North Pacific seawater, Mar. Chem., 112, 137–141, https://doi.org/10.1016/j.marchem.2008.10.002, 2008.
Dahl, E. E., Saltzman, S. E., and de Bruyn, W. J.: The aqueous phase yield of alkyl nitrates from ROO + NO: Implications for photochemical production in seawater, Geophys. Res. Lett., 30, 1271, https://doi.org/10.1029/2002GL016811, 2003.
Dahl, E. E., Yvon-Lewis, S. A., and Saltzman, S. E.: Saturation anomalies of alkyl nitrates in the tropical Pacific Ocean, Geophys. Res. Lett., 32, L20817, https://doi.org/10.1029/2005GL023896, 2005.
Dahl, E. E., Heiss, E. M., and Murawski, K.: The effects of dissolved organic matter on alkyl nitrate production during GOMECC and laboratory studies, Mar. Chem., 142, 11–17, https://doi.org/10.1016/j.marchem.2012.08.001, 2012.
Dar, S. S., Ghosh, P., Swaraj, A., and Kumar, A.: Craig–Gordon model validation using stable isotope ratios in water vapor over the Southern Ocean, Atmos. Chem. Phys., 20, 11435–11449, https://doi.org/10.5194/acp-20-11435-2020, 2020.
Davidson, E. A. and Kingerlee, W.: A global inventory of nitric oxide emissions from soils, Nutr. Cycl. Agroecosys., 48, 37–50, https://doi.org/10.1023/A:1009738715891, 1997.
Elliott, E. M., Kendall, C., Wankel, S. D., Burns, S. A., Boyer, E. W., Harlin, K., Bain, D. J., and Butler, T. J.: Nitrogen isotopes as indicators of NOx source contributions to atmospheric nitrate deposition across the Midwestern and Northeastern United States, Environ. Sci. Technol., 41, 7661–7667, https://doi.org/10.1021/es070898t, 2007.
Erbland, J., Vicars, W. C., Savarino, J., Morin, S., Frey, M. M., Frosini, D., Vince, E., and Martins, J. M. F.: Air–snow transfer of nitrate on the East Antarctic Plateau – Part 1: Isotopic evidence for a photolytically driven dynamic equilibrium in summer, Atmos. Chem. Phys., 13, 6403–6419, https://doi.org/10.5194/acp-13-6403-2013, 2013.
Fang, Y. T., Koba, K., Wang, X. M., Wen, D. Z., Li, J., Takebayashi, Y., Liu, X. Y., and Yoh, M.: Anthropogenic imprints on nitrogen and oxygen isotopic composition of precipitation nitrate in a nitrogen-polluted city in southern China, Atmos. Chem. Phys., 11, 1313–1325, https://doi.org/10.5194/acp-11-1313-2011, 2011.
Finlayson-Pitts, B. J. and Pitts, J. N.: Chemistry of the upper and lower troposphere, Academic Press, San Diego, California, https://doi.org/10.1016/B978-0-12-257060-5.X5000-X, 2000.
Fisher, J. A., Atlas, E. L., Barletta, B., Meinardi, S., Blake, D. R., Thompson, C. R., Ryerson, T. B., Peischl, J., Tzompa-Sosa, Z. A., and Murray, L. T.: Methyl, ethyl and propyl nitrates: global distribution and impacts on reactive nitrogen in remote marine environments, J. Geophys. Res.-Atmos., 123, 12412–12429, https://doi.org/10.1029/2018JD029046, 2018.
Frey, M. M., Savarino, J., Morin, S., Erbland, J., and Martins, J. M. F.: Photolysis imprint in the nitrate stable isotope signal in snow and atmosphere of East Antarctica and implications for reactive nitrogen cycling, Atmos. Chem. Phys., 9, 8681–8696, https://doi.org/10.5194/acp-9-8681-2009, 2009.
Freyer, H. D., Kley, D., Volz-Thomas, A., and Kobel, K.: On the interaction of isotopic exchange processes with photochemical reactions in atmospheric oxides of nitrogen, J. Geophys. Res., 98, 14791–14796, https://doi.org/10.1029/93JD00874, 1993.
Freyer, H. D., Kobel, K., Delmas, R. J., Kley, D., and Legrand, M. R.: First results of ratios in nitrate from alpine and polar ice cores, Tellus B, 48, 93–105, https://doi.org/10.3402/tellusb.v48i1.15671, 1996.
Gobel, A. R., Altieri, K. E., Peters, A. J., Hastings, M. G., and Sigman, D. M.: Insights into anthropogenic nitrogen deposition to the North Atlantic investigated using the isotopic composition of aerosol and rainwater nitrate, Geophys. Res. Lett., 40, 5977–5982, https://doi.org/10.1002/2013GL058167, 2013.
Grannas, A. M., Jones, A. E., Dibb, J., Ammann, M., Anastasio, C., Beine, H. J., Bergin, M., Bottenheim, J., Boxe, C. S., Carver, G., Chen, G., Crawford, J. H., Dominé, F., Frey, M. M., Guzmán, M. I., Heard, D. E., Helmig, D., Hoffmann, M. R., Honrath, R. E., Huey, L. G., Hutterli, M., Jacobi, H. W., Klán, P., Lefer, B., McConnell, J., Plane, J., Sander, R., Savarino, J., Shepson, P. B., Simpson, W. R., Sodeau, J. R., von Glasow, R., Weller, R., Wolff, E. W., and Zhu, T.: An overview of snow photochemistry: evidence, mechanisms and impacts, Atmos. Chem. Phys., 7, 4329–4373, https://doi.org/10.5194/acp-7-4329-2007, 2007.
Grasshoff, K., Kremling, K., and Ehrhardt, M.: Methods of seawater analysis, Verlag Chemi, Florida, 1983.
Guilpart, E., Vimeux, F., Evan, S., Brioude, J., Mertzger, J., Barthe, C., Risi, C., and Cattani, O.: The isotopic composition of near-surface water vapor at the Maïdo observatory (Reunion Island, southwestern Indian Ocean) documents the controls of the humidity of the subtropical troposphere, J. Geophys. Res.-Atmos., 122, 9628–9650, https://doi.org/10.1002/2017JD026791, 2017.
Hamilton, D. S., Lee, L. A., Pringle, K. J., Reddington, C. L., Spracklen, D. V., and Carslaw, K. S.: Occurence of pristine aerosol environments on a polluted planet, P. Natl. Acad. Sci. USA, 111, 18466–18471, https://doi.org/10.1073/pnas.1415440111, 2014.
Hastings, M. G., Sigman, D. M., and Lipschultz, F.: Isotopic evidence for source changes of nitrate in rain at Bermuda, J. Geophys. Res., 108, 4790, https://doi.org/10.1029/2003JD003789, 2003.
Haywood, J. and Boucher, O.: Estimates of the direct and indirect radiative forcing due to tropospheric aerosols: a review, Rev. Geophys., 38, 513–543, https://doi.org/10.1029/1999RG000078, 2000.
Hoering, T.: The isotopic composition of the ammonia and the nitrate ion in rain, Geochim. Cosmochim. Ac., 12, 97–102, https://doi.org/10.1016/0016-7037(57)90021-2, 1957.
Hughes, C., Chuck, A. L., Turner, S. M., and Liss, P. S.: Methyl and ethyl nitrate saturation anomalies in the Southern Ocean (36–65∘ S, 30–70∘ W), Environ. Chem., 5, 11–15, https://doi.org/10.1071/EN07083, 2008.
IPCC: Boucher, O. D., Randall, P., Artaxo, C., Bretherton, G., Feingold, P., Forster, V.-M., Kerminen, Y., Kondo, H., Liao, U., Lohmann, P., Rasch, S.K., Satheesh, S., Sherwood, B., Stevens, and Zhang, X. Y.: Clouds and Aerosols, in: Climate Change 2013: The Physical Science Basis. Contribution of Working Group I to the Fifth Assessment Report of the Intergovernmental Panel on Climate Change, edited by: Stocker, T. F., Qin, D., Plattner, G.-K., Tignor, M., Allen, S. K., Boschung, J, Nauels, A., Xia, Y., Bex, V., and Midgley, P. M., Cambridge University Press, Cambridge, United Kingdom and New York, NY, USA, 2013.
Ishino, S., Hattori, S., Savarino, J., Jourdain, B., Preunkert, S., Legrand, M., Caillon, N., Barbero, A., Kuribayashi, K., and Yoshida, N.: Seasonal variations of triple oxygen isotopic compositions of atmospheric sulfate, nitrate, and ozone at Dumont d'Urville, coastal Antarctica, Atmos. Chem. Phys., 17, 3713–3727, https://doi.org/10.5194/acp-17-3713-2017, 2017.
Jiang, S., Shi, G., Cole-Dai, J., Geng, L., Ferris, D. G., An, C., and Li, Y.: Nitrate preservation in snow at Dome A, East Antarctica from ice core concentration and isotope records, Atmos. Environ., 213, 405–412, https://doi.org/10.1016/j.atmosenv.2019.06.031, 2019.
Jones, A. E., Weller, R., Minikin, A., Wolff, E. W., Sturges, W. T., McIntyre, H. P., Leonard, S. R., Schrems, O., and Bauguitte, S.: Oxidized nitrogen chemistry and speciation in the Antarctic troposphere, J. Geophys. Res., 104, 21355–21366, https://doi.org/10.1029/1999JD900362, 1999.
Jones, A. E., Weller, R., Wolff, E. W., and Jacobi, H.-W.: Speciation and rate of photochemical NO and NO2 production in Antarctic snow, Geophys. Res. Lett., 27, 345–348, https://doi.org/10.1029/1999GL010885, 2000.
Jones, A. E., Weller, R., Anderson, P. S., Jacobi, H.-W., Wolff, E. W., Schrems, O., and Miller, H.: Measurements of NOx emissions from the Antarctic snowpack, Geophys. Res. Lett., 28, 1499–1502, https://doi.org/10.1029/2000GL011956, 2001.
Kamezaki, K., Hattori, S., Iwamoto, Y., Ishino, S., Furutani, H., Miki, Y., Uematsu, M., Miura, K., and Yoshida, N.: Tracing the sources and formation pathways of atmospheric particulate nitrate over the Pacific Ocean using stable isotopes, Atmos. Environ., 209, 152–166, https://doi.org/10.1016/j.atmosenv.2019.04.026, 2019.
Kendall, C., Elliot, E. M., and Wankel, S. D.: Tracing anthropogenic inputs of nitrogen to ecosystems, in: Stable isotopes in ecology and environmental science, edited by: Michener, R. and Lajtha, K., Blackwell Publishing, Malden, Mass, 375–449, https://doi.org/10.1002/9780470691854.ch12, 2007.
Kroopnick, P. and Craig, H.: Atmospheric oxygen: isotopic composition and solubility fractionation, Science, 175, 54–55, 1972.
Lee, H.-M., Henze, D. K., Alexander, B., and Murray, L. T.: Investigating the sensitivity of surface-level nitrate seasonality in Antarctica to primary sources using a global model, Atmos. Environ., 89, 757–767, https://doi.org/10.1016/j.atmosenv.2014.03.003, 2014.
Michalski, G., Scott, Z., Kabiling, M., and Thiemens, M. H.: First measurments and modeling of Δ17O in atmospheric nitrate, Geophys. Res. Lett., 30, 1870, https://doi.org/10.1029/2003GL017015, 2003.
Michalski, G., Bhattacharya, S. K., and Mase, D. F.: Oxygen isotope dynamics of atmospheric nitrate and its precursor molcules, in: Handbook of environmental isotope geochemistry. Advances in Isotope Geochemistry, edited by: Baskaran, M., Springer, Berlin, Heidelberg, 613–635, https://doi.org/10.1007/978-3-642-10637-8_30, 2012.
Monks, P. S.: Gas-phase radical chemistry in the troposphere, Chem. Soc. Rev., 34, 376–395, https://doi.org/10.1039/B307982C, 2005.
Morin, S., Savarino, J., Frey, M. M., Domine, F., Jacobi, H. W., Kaleschke, L., and Martins, J. M.: Comprehensive isotopic composition of atmospheric nitrate in the Atlantic Ocean boundary layer from 65∘ S to 79∘ N, J. Geophys. Res., 114, D05303, https://doi.org/10.1029/2008JD010696, 2009.
Nadzir, M. S., Ashfold, M. J., Khan, M. F., Robinson, A. D., Bolas, C., Latif, M. T., Wallis, B. M., Mead, M. I., Hamid, H. H. A., Harris, N. R. P., Ramly, Z. T. A., Lai, G. T., Liew, J. N., Ahamed, F., Uning, R., Samah, A. A., Maulud, K. N., Suparta, W., Zainudin, S. K., Wahab, M. I. A., Sahani, M., Müller , M., Yeok, F. S., Rahman, N. A., Mujahid, A., Morris, K. I., and Sasso, N. D.: Spatial-temporal variations in surface ozone over Ushuaia and the Antarctic region: observations from in situ measurements, satellite data, and global models, Environ. Sci. Pollut. R., 25, 2194–2210, https://doi.org/10.1007/s11356-017-0521-1, 2018.
Nesbitt, S. W., Zhang, R., and Orville, R. E.: Seasonal and global NOx production by lightning estimated from the Optical Transient Detector (OTD), Tellus B, 52, 1206–1215, https://doi.org/10.3402/tellusb.v52i5.17098, 2000.
Park, S. S. and Kim, Y. J.: Source contributions to fine particulate matter in an urban atmosphere, Chemosphere, 59, 217–226, https://doi.org/10.1016/j.chemosphere.2004.11.001, 2005.
Park, Y., Park, K., Kim, H., Yu, S., Noh, S., Kim, M.-S, Kim, J.-Y., Ahn, J.-Y., Seok, K.-S., and Kim, Y.-H.: Characterizing isotopic compositions of TC-C, NO-N and NH-N in PM2.5 in South Korea: Impact of China's winter heating, Environ. Pollut., 233, 735–744, https://doi.org/10.1016/j.envpol.2017.10.072, 2018.
Rindelaub, J. D., McAvey, K. M., and Shepson, P. B.: The photochemical production of organic nitrates from α-pinene and loss via acid-dependent particle phase hydrolysis, Atmos. Environ., 100, 193–201, https://doi.org/10.1016/j.atmosenv.2014.11.010, 2015.
Rolph, G. D.: Real-time Environmental Applications and Display System (READY) Website, NOAA Air Resources Laboratory, College Park, MD, available at: https://www.ready.noaa.gov/index.php (last access: 12 January 2022), 2016.
Savarino, J., Kaiser, J., Morin, S., Sigman, D. M., and Thiemens, M. H.: Nitrogen and oxygen isotopic constraints on the origin of atmospheric nitrate in coastal Antarctica, Atmos. Chem. Phys., 7, 1925–1945, https://doi.org/10.5194/acp-7-1925-2007, 2007.
Scarchilli, C., Frezzotti, M., and Ruti, P. M.: Snow precipitation at four ice core sites in East Antarctica: provenance, seasonality and blocking factors, Clim. Dynam., 37, 2107–2125, https://doi.org/10.1007/s00382-010-0946-4, 2011.
Schumann, U. and Huntrieser, H.: The global lightning-induced nitrogen oxides source, Atmos. Chem. Phys., 7, 3823–3907, https://doi.org/10.5194/acp-7-3823-2007, 2007.
Shi, G., Buffen, A. M., Hastings, M. G., Li, C., Ma, H., Li, Y., Sun, B., An, C., and Jiang, S.: Investigation of post-depositional processing of nitrate in East Antarctic snow: isotopic constraints on photolytic loss, re-oxidation, and source inputs, Atmos. Chem. Phys., 15, 9435–9453, https://doi.org/10.5194/acp-15-9435-2015, 2015.
Shi, G., Buffen, A. M., Ma, H., Hu, Z., Sun, B., Li, C., Yu, J., Ma, T., An, C., Jiang, S., Li, Y., and Hastings, M. G.: Distinguishing summertime atmopsheric production of nitrate across the East Antarctic ice sheet, Geochim. Cosmochim. Ac., 231, 1–14, https://doi.org/10.1016/j.gca.2018.03.025, 2018.
Shi, G., Ma, H., Zhu, Z., Hu, A., Chen, Z., Jiang, Su., An, C., Yu, J., Ma, T., Li, Y., Sun, B., and Hastings, M. G.: Using stable isotopes to distinguish atmospheric nitrate production and its contribution to the surface ocean across hemispheres, Earth Planet. Sc. Lett., 564, 116914, https://doi.org/10.1016/j.epsl.2021.116914, 2021.
Sigman, D. M., Casciotti, K. L., Andreani, M., Barford, C., Galanter, M., and Böhlke, J. K.: A bacterial method for the nitrogen isotopic analysis of nitrate in seawater and freshwater, Anal. Chem., 73, 4145–4153, https://doi.org/10.1021/ac010088e, 2001.
Sinclair, K. E., Bertler, N. A. N., Trompetter, W. J., and Baisden, W. T.: Seasonality of airmass pathways to coastal Antarctica: ramifications for interpreting high-resolution ice core records, J. Climate, 26, 2065–2076, https://doi.org/10.1175/JCLI-D-12-00167.1, 2013.
Spreen, G., Kaleschke, L., and Heygster, G.: Sea ice remote sensing using AMSR-E 89-GHz channels, J. Geophys. Res., 113, C02S03, https://doi.org/10.1029/2005JC003384, 2008.
Stein, A. F., Draxler, R. R, Rolph, G. D., Stunder, B. J. B., Cohen, M. D., and Ngan, F.: NOAA's HYSPLIT atmospheric transport and dispersion modeling system, B. Am. Meteorol. Soc., 96, 2059–2077, https://doi.org/10.1175/BAMS-D-14-00110.1, 2015.
van der A, R. J., Eskes, H. J., Boersma, K. F., van Noije, T. P., Van Roozendael, M., De Smedt, I., Peters, D. H. M. U., and Meijer, E. W.: Trends, seasonal variability and dominant NOx source derived from a ten year record of NO2 measured from space, J. Geophys. Res., 113, D04302, https://doi.org/10.1029/2007JD009021, 2008.
Vicars, W. C. and Savarino, J.: Quantitative constraints on the 17O-excess (Δ17O) signature of surface ozone: Ambient measurements from 50∘ N to 50∘ S using the nitrite-coated filter technique, Geochim. Cosmochim. Ac., 135, 270–287, https://doi.org/10.1016/j.gca.2014.03.023, 2014.
Virkkula, A., Teinilä, K., Hillamo, R., Kerminen, V.-M., Saarikoski, S., Aurela, M., Viidanoja, J., Paatero, J., Koponen, I. K., and Kulmala, M.: Chemical composition of boundary layer aerosol over the Atlantic Ocean and at an Antarctic site, Atmos. Chem. Phys., 6, 3407–3421, https://doi.org/10.5194/acp-6-3407-2006, 2006.
Walters, W. W. and Michalski, G.: Theoretical calculation of nitorgen isotope equilibrium exchange fractionation factors for various NOy molecules, Geochim. Cosmochim. Ac., 164, 284–297, https://doi.org/10.1016/j.gca.2015.05.029, 2015.
Walters, W. W. and Michalski, G.: Theoretical calculation of oxygen equilibrium isotope fractionation factors involving various NOy molecules, OH, and H2O and its implications for isotope variations in atmospheric nitrate, Geochim. Cosmochim. Ac., 191, 89—101, https://doi.org/10.1016/j.gca.2016.06.039, 2016.
Walters, W. W., Simonini, D. S., and Michalski, G.: Nitrogen isotope exchange between NO and NO2 and its implications for δ15N variations in tropospheric NOx and atmospheric nitrate, Geophys. Res. Lett., 43, 440–448, https://doi.org/10.1002/2015GL066438, 2016.
Walters, W. W., Michalski, G., Bohlke, J. K., Alexander, B., Savarino, J., and Thiemens, M. H.: Assessing the seasonal dynamics of nitrate and sulfate aerosols at the South Pole utilizing stable isotopes, J. Geophys. Res.-Atmos., 124, 8161–8177, https://doi.org/10.1029/2019JD030517, 2019.
Weller, R., Jones, A. E., Wille, A., Jacobi, H.-W., McIntyre, H. P., Sturges, W. T., Huke, M., and Wagenback, D.: Seasonality of reactive nitrogen oxides (NOy) at Neumayer Station, Antarctica, J. Geophys. Res., 107, 4673, https://doi.org/10.1029/2002JD002495, 2002.
Williams, J. E., Le Bras, G., Kukui, A., Ziereis, H., and Brenninkmeijer, C. A. M.: The impact of the chemical production of methyl nitrate from the NO + CH3O2 reaction on the global distributions of alkyl nitrates, nitrogen oxides and tropospheric ozone: a global modelling study, Atmos. Chem. Phys., 14, 2363–2382, https://doi.org/10.5194/acp-14-2363-2014, 2014.
Zong, Z., Wang, X., Tian, C., Chen, Y., Fang, Y., Zhang, F., Li, C., Sun, J., Li, J., and Zhang, G.: First assessment of NOx sources at a regional background site in North China using isotopic analysis linked with modeling, Environ. Sci. Technol., 51, 5923–5931, https://doi.org/10.1021/acs.est.6b06316, 2017.