the Creative Commons Attribution 4.0 License.
the Creative Commons Attribution 4.0 License.
 | 25 Aug 2022
Impact of a subtropical high and a typhoon on a severe ozone pollution episode in the Pearl River Delta, China
Shanshan Ouyang
Tao Deng
Jingyang Chen
Guowen He
Jeremy Cheuk-Hin Leung
Nan Wang
Shaw Chen Liu
A record-breaking severe ozone (O3) pollution episode occurred in the Pearl River Delta (PRD) in early autumn 2019 when the PRD was under the influence of a Pacific subtropical high followed by Typhoon Mitag. In this study, we analyzed the effects of meteorological and photochemical processes on the O3 concentration in the PRD during this episode by carrying out the Weather Research Forecast–Community Multiscale Air Quality (WRF-CMAQ) model simulations. Results showed that low relative humidity, high boundary layer height, weak northerly surface wind, and strong downdrafts were the main meteorological factors contributing to O3 pollution. Moreover, delayed sea breezes that lasted into the night would transport O3 from the sea back to the land and resulted in secondary O3 maxima at night. In addition, O3 and its precursors stored in the residual layer above the surface layer at night can be mixed down to the surface in the next morning, further enhancing the daytime ground-level O3 concentration on the following day. Photochemical production of O3, with a daytime average production rate of about 7.2 ppb h−1 (parts per billion), is found to be the predominate positive contributor to the O3 budget of the boundary layer (0–1260 m) during the entire O3 episode, while the horizontal and vertical transport fluxes are the dominant negative contributors. This O3 episode accounted for 10 out of the yearly total of 51 d when the maximum daily 8 h average (MDA8) O3 concentration exceeded the national standard of 75 ppb in the PRD in 2019. Based on these results, we propose that the enhanced photochemical production of O3 during the episode is a major cause of the most severe O3 pollution year since the official O3 observation started in the PRD in 2006. Moreover, since this O3 episode is a synoptic-scale phenomenon covering the entire eastern China, we also suggest that the enhanced photochemical production of O3 in this O3 episode is a major cause of the extraordinarily high O3 concentrations observed in eastern China in 2019.
- Article
(7685 KB) - Full-text XML
- BibTeX
- EndNote


Tropospheric ozone (O3) is a product of photochemical reactions between nitrogen oxides (NOx) and volatile organic compounds (VOCs) under sunlight; it is a typical secondary pollutant that plays a major role in regional atmospheric pollution (Sillman, 1999; Trainer et al., 2000; Lu et al., 2018). High surface O3 concentrations have adverse effects on human health (Jacob and Winner, 2009; Fleming et al., 2018; Liu et al., 2018) and the production of crops (Wang et al., 2017; Mills et al., 2018). During the past few decades, along with the rapid economic development, air pollution problems have become increasingly serious in China. Since the implementation of air pollution prevention and control measures in 2013, the overall air quality in China, particularly the concentration of particulate matter, has been significantly improved (Zhang and Geng, 2019). However, in recent summer and autumn, O3 concentrations in eastern China, particularly in Beijing–Tianjin–Hebei (Gong and Liao, 2019; Mao et al., 2020), the Yangtze River Delta (YRD; Shu et al., 2016; Zhan et al., 2020), and the Pearl River Delta (PRD; Deng et al., 2019; G. He et al., 2021), actually increasingly exceeded China's national ambient air quality secondary standard, i.e., hourly O3 of 200 µg m−3 (about 93 ppb – parts per billion) and the maximum daily 8 h average (MDA8) O3 concentration of 160 µg m−3 (about 75 ppb).
Variations in the emission of O3 precursors and meteorological conditions are two main factors affecting the atmospheric O3 concentration (Xu et al., 2018; H. Han et al., 2019). NOx produced by industry, transportation, and power plants and VOCs from solvent use, industry, transportation, residential areas, and vegetation are major sources of the O3 precursors (Li et al., 2017; Zheng et al., 2018). Meteorological conditions such as high temperature, low humidity, high pressure, low wind speed, and strong solar radiation can affect the photochemical production and transport of O3, resulting in high O3 pollution events (Deng et al., 2019; C. He et al., 2021; Hu et al., 2021). Located in the coastal area of South China, the PRD region has a typical subtropical monsoon climate, in which the weather conditions are easily affected by typhoons and subtropical highs in summer and autumn (Lin et al., 2019). Since these two synoptic meteorological patterns are highly conducive to O3 generation, the study of O3 generation under these conditions are essential for the understanding of the O3 pollution problem in the PRD.
Previous studies have reported the influence of the intensity (Lam et al., 2018), track (Deng et al., 2019), and frequency of occurrence (Lin et al., 2019) of tropical cyclones on the O3 concentration in the PRD. Furthermore, by comparing the meteorological conditions and the O3 sources in summer and autumn with and without typhoons, Qu et al. (2021) revealed that the approach of typhoons accompanied by a higher wind speed and strengthened downdraft will reduce cloud cover and thus lead to higher solar radiation, which was favorable to the O3 production. Zhan et al. (2020) analyzed the O3 production processes caused by four consecutive typhoons in the summer of 2018 based on model simulations. They found that O3 pollution events in the YRD region mainly occurred between the end of a typhoon and the arrival of the next typhoon. Since fluctuations between high-pressure and low-pressure systems strongly affect the variation in O3 concentrations (Bachmann, 2015), the western Pacific subtropical high (WPSH) is also an important factor affecting O3 in eastern China (Zhao and Wang, 2017; Chang et al., 2019; Yin et al., 2019). Numerical simulation studies by Zeren et al. (2019) and Shu et al. (2016) revealed that strong photochemical reactions and unfavorable diffusion conditions caused by the single/combined action of subtropical highs and typhoons are the main reasons for the occurrence of regional O3 pollution.
In this study, we carried out Weather Research Forecast–Community Multiscale Air Quality (WRF-CMAQ) model simulations and made comprehensive analyses of meteorological and photochemical processes in a severe O3 pollution episode associated with a Pacific subtropical high and Typhoon Mitag in 2019. The rest of this paper is structured as follows. The data and methods are presented in Sect. 2. Section 3 contains the major results and findings. It is subdivided into five subsections, namely, basic characteristics of the regional O3 episode, evaluation of model performance, influence of meteorological conditions on O3 during the three periods, characteristics of O3 in the horizontal and vertical spatial distribution, and contributions of photochemical and transport processes to O3 formation. A summary and the conclusions are presented in Sect. 4.
2.1 Datasets
Hourly O3 concentration monitoring data during the O3 pollution episode in the PRD from 1 September to 31 October 2019 were obtained from the China National Environmental Monitoring Center (CNEMC; available at http://www.cnemc.cn/en/, last access: 15 April 2022). The study area includes 56 stations in nine cities (Zhaoqing (ZQ), Jiangmen (JM), Foshan (FS), Zhuhai (ZH), Zhongshan (ZS), Guangzhou (GZ), Dongguan (DG), Shenzhen (SZ) and Huizhou (HZ)) in the PRD (Fig. 1b).

Figure 1(a) The two nested model domains in the WRF-CMAQ model and (b) the location of the nine main cities in the PRD region.
The European Centre for Medium-Range Weather Forecasts (ECMWF) Reanalysis v5 (ERA5) dataset (available at https://cds.climate.copernicus.eu/, last access: 15 April 2022), with a horizontal resolution of and a time interval of 6 h, was used to analyze the atmospheric circulation patterns during the pollution episode. The variables used in this study include zonal and meridional wind speed and geopotential height.
Hourly meteorological data of PRD region were provided by the China Meteorological Data Service Centre (https://data.cma.cn/en/, last access: 15 April 2022), including 2 m temperature (T2), 2 m relative humidity (RH), 10 m wind speed (WS10), and 10 m wind direction (WD10).
In this study, the 6 h Final Global Forecast System Operational Analysis (FNL) data with a resolution of from the National Center for Environmental Prediction (NCEP) were used to provide initial and boundary conditions for the WRF simulation (available at https://rda.ucar.edu/datasets/ds083.2/, last access: 15 April 2022). Geographical data were obtained from the Research Data Archive of the National Center for Atmospheric Research (NCAR; available at https://www2.mmm.ucar.edu/wrf/users/download/get_sources_wps_geog.html, last access: 15 April 2022).
2.2 Model description and configurations
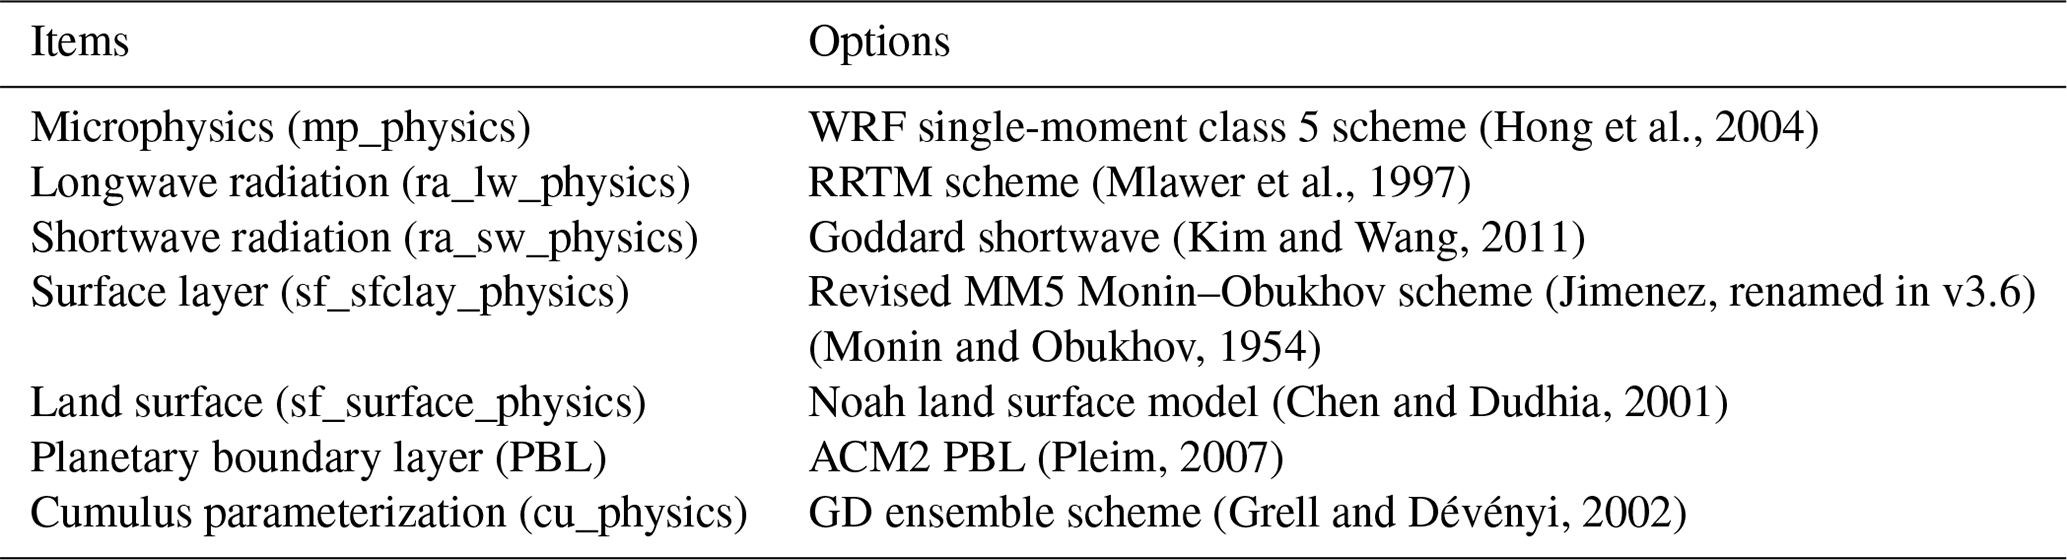
The WRF (v3.9.1)-CMAQ (v4.7.1) model, which has been extensively shown to perform well in simulating pollution processes in China (Wang et al., 2015; Zhan et al., 2020; Qu et al., 2021; Zhao et al., 2021), was used to simulate the O3 pollution episode. The WRF model was set with two one-way nested domains with horizontal resolutions of 27 and 9 km, respectively (Fig. 1a). The outer domain (d01) covers most areas of East Asia with 283×184 grids, and the inner domain (d02) covers most parts of South China with 250×190 grids. For both domains, there were 38 vertical sigma layers extending from the surface to the top pressure of 50 hPa, with 17 layers located below 1 km providing vertical information on the planetary boundary layer. The model applies the Rapid Radiative Transfer Model (RRTM) longwave scheme, Mesoscale Model (MM5) similarity surface layer, Noah land surface model, ACM2 planetary boundary layer scheme, and Grell–Devenyi (GD) ensemble scheme. The detailed configuration options for dynamic parameterization in WRF are summarized in Table 1. The resolutions of CMAQ were 182×138 and 220×170 grids. Biogenic emissions were generated offline using the Model of Emissions of Gases and Aerosols from Nature (MEGAN version 2.04; Guenther et al., 2006). The chemical mechanism of carbon bond 05 (Yarwood et al., 2005) was chosen for the gas-phase chemistry. The anthropocentric pollutant emissions were obtained from the Multi-resolution Emission Inventory for China (MEIC) of 2016 (http://meicmodel.org/, last access: 15 April 2022). The period simulated in this study was from 00:00 local time (hereafter, unless indicated otherwise, all times are in local time) on 18 September to 00:00 on 5 October, where the first 72 h were taken as the spin-up time to minimize the bias due to initial conditions.
Table 1Physical parameterization configuration options of WRF in this study.
The integrated process rate (IPR) is an effective diagnostic module provided by the CMAQ model that allows the calculation of the hourly contribution of different physicochemical processes to various pollutants, thus determining the quantitative impact of each process on the change in pollutant concentration in each grid cell. This method makes it possible to identify the causes of pollution and the main physicochemical processes responsible for the changes in pollutant concentrations. The causes of pollutant concentration variations were classified into the following seven types of physical and chemical processes: horizontal advection (HADV), vertical advection (ZADV), horizontal diffusion (HDIF), vertical diffusion (VDIF), dry deposition (DDEP), cloud processes (CLDS), and chemical processes (CHEM). In this study, the horizontal transport (HTRA) was defined as the sum of HADV and HDIF, and the vertical transport (VTRA) was defined as the sum of ZADV and VDIF.
2.3 Model evaluation
To evaluate the model performance, the simulation results in d02, including T2, RH, WS10, WD10, and O3 concentration, were compared with hourly observation data. Statistical metrics, including the correlation coefficient R, root mean square error (RMSE), normalized mean bias (NMB), and index of agreement (IOA; Huang et al., 2005), were used. These metrics are defined as follows:
where Si and Oi represent the simulations and observations, respectively, and represent the mean of the simulated and observed values, respectively, and N is the number of valid data. R represents the degree of matching between the observation data and simulation data, and NMB and RMSE indicate the degree of deviation between the observation and simulation data. In general, when the NMB and RMSE are closer to zero, the R and IOA are closer to one, and the model simulation is considered to be in better agreement with the observation.
3.1 Characteristics of the O3 episode
3.1.1 Overview of the O3 episode
Figure 2a shows the diurnal variation in O3 concentrations observed in the PRD region (averaged over the 56 stations) from 1 September to 31 October 2019. It is worth noting that the subtropical highs and typhoons were the two main synoptic systems when the O3 episode occurred (the yellow and blue shading). In particular, O3 concentrations persistently exceeded 93 ppb (the red dotted line) in the afternoons from 25 September to 2 October for 8 straight days. In addition, there were 51 d when MDA8 O3 exceeded 75 ppb in the PRD for the entire year of 2019 (not shown). Figure 2b further shows the calendar chart of MDA8 O3 concentrations in nine cities from September to October, sorted by longitude in the PRD. Levels (Lev) 1–5 in colored bars represent excellent (about 0–47 ppb), good (about 47–75 ppb), light pollution (about 75–100 ppb), moderate pollution (about 100–124 ppb), and severe pollution (about 124–374 ppb) for the air quality index categories in the Technical Regulation on Ambient Air Quality Index (AQI), respectively. The O3 concentration in the PRD remained at a relatively high level in late September and early October, with MDA8 O3 reaching Lev 3 in nine cities from 25 September to 1 October and even reaching Lev 5 in JM, ZS, and ZH on 28 September.

Figure 2(a) Diurnal variation in O3 concentrations in nine cities (a total of 56 stations averaged) in the PRD from 1 September to 31 October 2019. The red dotted line indicates the O3 concentration of 93 ppb. Yellow shading indicates the period affected by the subtropical high, blue shading indicates the period affected by the typhoon, and gray shading indicates the period affected by the synoptic patterns other than subtropical high and typhoon. (b) Calendar chart of O3 concentration levels for September and October 2019. These cities are sorted by longitude. Levels (Lev) 1–5 in colored bars represent excellent, good, light pollution, moderate pollution, and severe pollution of air quality index categories in the Technical Regulation on Ambient Air Quality Index (AQI), respectively.

Figure 3Time series of sites with nocturnal ground-level O3 rebound in sequence from coast to inland. (a) Time series at SZ, DG, GZ, and FS on 26 September. (b) Time series at SZ, ZH, ZS, and DG on 29 September. (c) Time series at JM, FS, and GZ on 1 October.
In general, the nighttime O3 concentration is low due to the titration by nitrogen oxide emitted during the night. However, during the pollution period, the O3 concentration rebounded at several sites after sunset, and the time for the rebound of O3 at different sites showed different time lags from coastal to inland sites. For example, on 26 September, the times of O3 rebound in SZ, DG, GZ, and FS were 20:00, 21:00, 22:00, and 23:00, respectively (Fig. 3a). On 29 September, the times of O3 rebound in SZ, ZH, ZS, and DG were 18:00, 20:00, 22:00, and 23:00, respectively (Fig. 3b). On 1 October, the times of O3 rebound in JM, FS, and GZ were 21:00, 22:00, and 23:00, respectively (Fig. 3c). This phenomenon was apparently related to the backflow of O3 from the ocean due to sea breezes, which will be further elaborated on in Sect. 3.4.2.
3.1.2 Evolution of synoptic systems
Figure 4 shows the spatial distribution of the ERA5 reanalysis 500 hPa geopotential height and 850 hPa wind fields over East Asia at 14:00 on 25 September and from 29 September to 3 October. On 21 September (not shown), Typhoon Tapah moved northward away from the PRD, and the PRD region was controlled by low-level northerly airflow from the western side of the typhoon. O3 concentrations dropped slightly at this time (Fig. 2). From 25 (Fig. 4a) to 28 September, the area enclosed by the 5880 gpm (geopotential meter) isoline (orange area) continued to cover the entire PRD, which means the downdraft caused by the subtropical high could suppress the vertical diffusion of surface air pollutants. Meanwhile, solar radiation intensified under the clear sky and caused O3 to continue increase (Fig. 2).
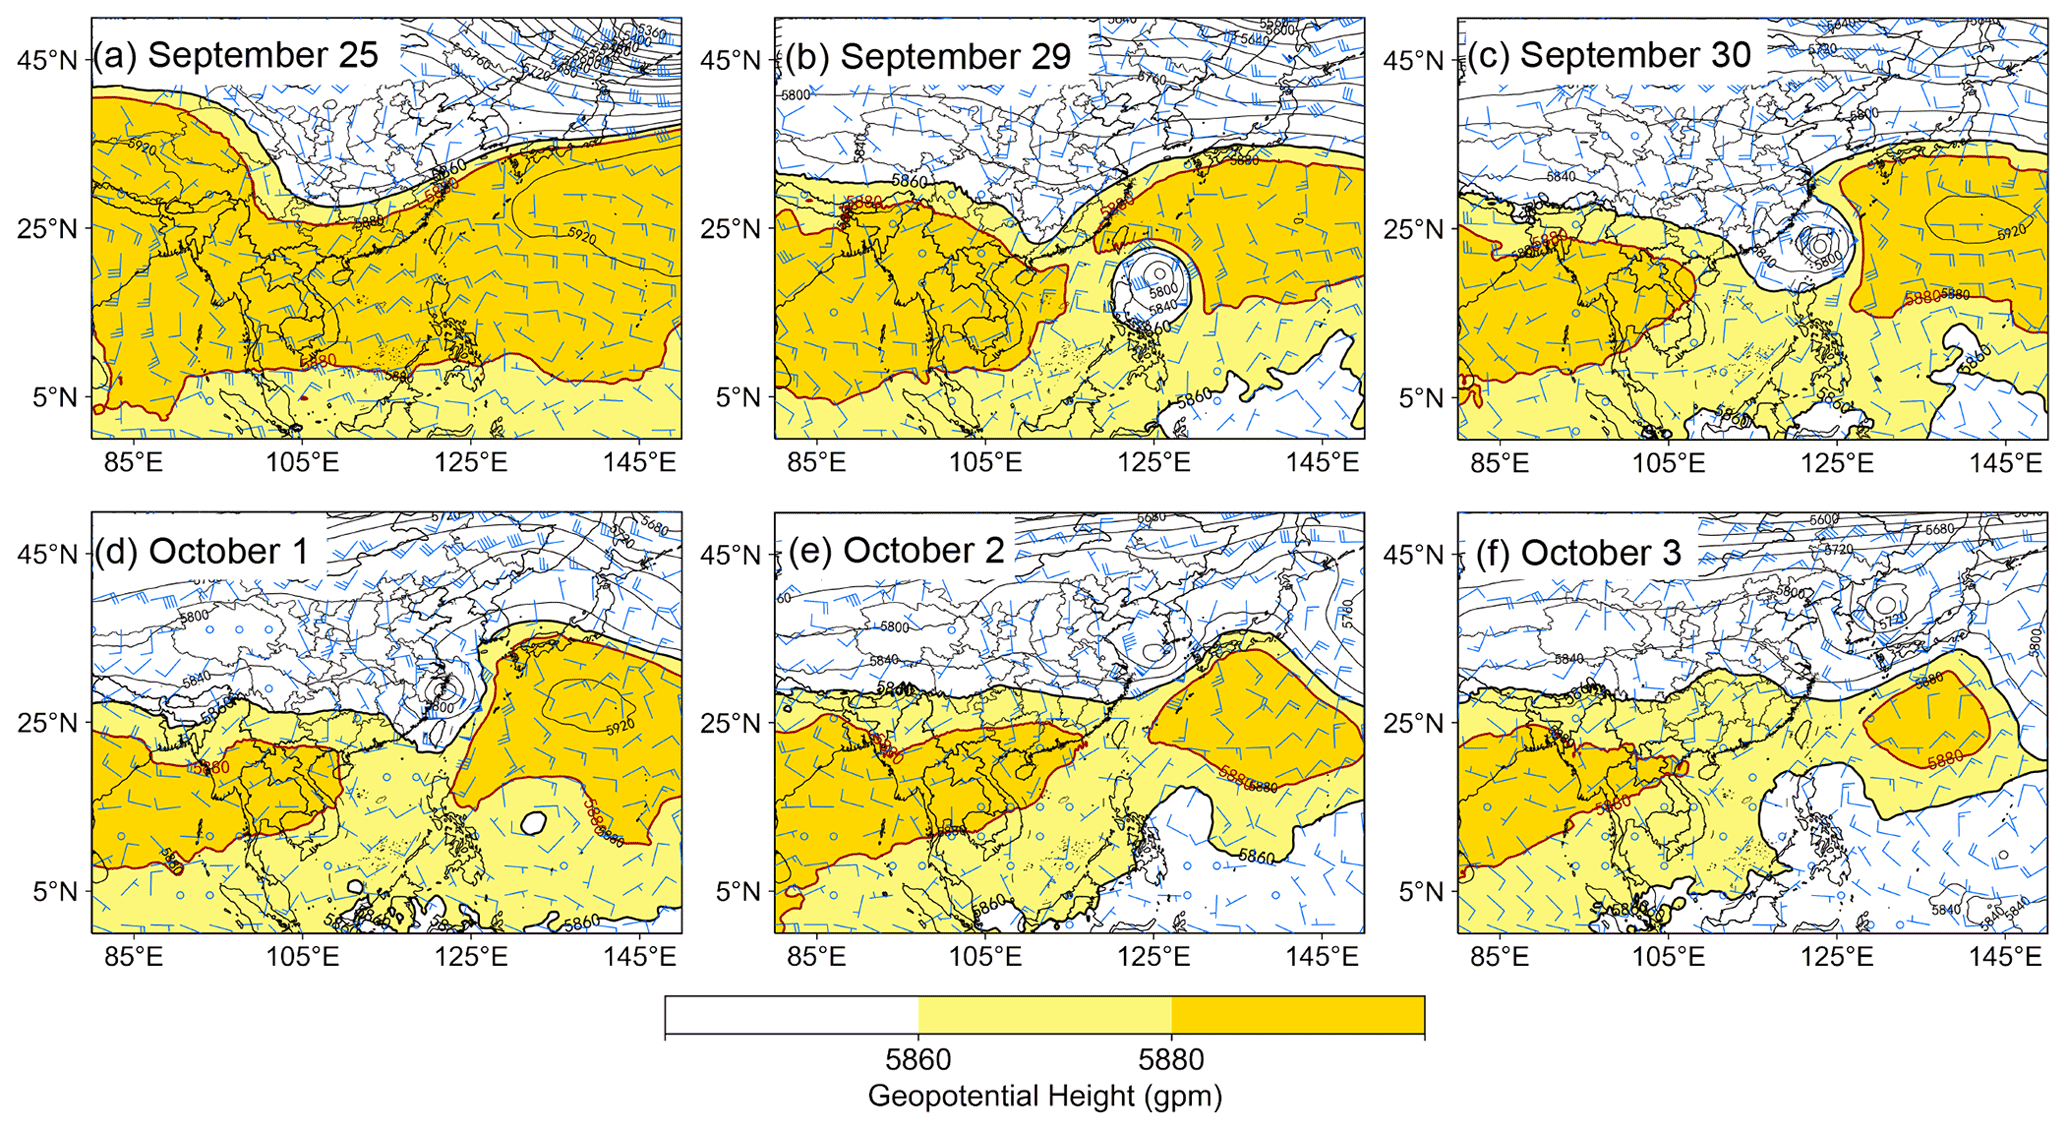
Figure 4Spatial distribution of 500 hPa geopotential height and 850 hPa wind fields over East Asia at 14:00 on 25 September (a) and from 29 September to 3 October (b–f).
Afterward, the position and intensity of the subtropical high was affected by tropical storm Mitag, which developed and strengthened rapidly over the western Pacific on 28 September and was upgraded to typhoon level on 29 September (Fig. 4b). It crossed the ridge of high pressure all the way northward to the southeast of Taiwan, resulting in a break in the subtropical system. When the western extension of the ridge of the eastern subtropical high retreated eastward to 118∘ E, the PRD region was in the downdraft area outside the typhoon system. Meanwhile, high O3 levels were observed continuously in the PRD. On 1 October (Fig. 4d), Typhoon Mitag made landfall on the coast of eastern China and then turned northeastward and made landfall again on the coast of South Korea on 2 October (Fig. 4e). In the end, it merged into the upper trough of the westerlies on 3 October (Fig. 4f). As Typhoon Mitag moved away, the ground-level O3 concentration in the PRD decreased significantly.
In summary, the PRD was mainly influenced by the WPSH, followed by Typhoon Mitag, during the O3 episode of 23 September–2 October. Therefore, the WRF-CMAQ model simulation and subsequent analyses will focus on the following three periods: the subtropical high period (23–28 September), the Typhoon Mitag period (29 September to 2 October), and the clean period (3–4 October).
3.2 Evaluation of model performance
Hourly observations of T2, RH, WS10, and WD10 at meteorological stations in nine cities in the PRD from 21 September to 4 October 2019 are compared with the WRF simulation results to evaluate the model performance (Fig. 5). The results of the evaluation metrics, R, NMB, RMSE, and IOA are listed in Table 2. Simulated T2 and RH are consistent with the observations, with R of 0.97 and 0.84, respectively. WRF underestimates T2 and RH by 1.92 % and 0.97 %, respectively, and the RMSEs are 1.05 ∘C and 9.10 %, respectively. Surface wind is closely related to the horizontal transportation, accumulation, and diffusion of pollutants. Although WRF overestimates WS10 in this study by 69.2 %, the R value reaches 0.69, indicating that the model can reproduce the variability in wind speed. The simulation of wind fields is influenced by the terrain and various complex physical processes (Wang et al., 2015); however, the IOA value of WD10 is 0.64, indicating that the model can simulate the variability in WD10 well during the study period. In general, the statistical metrics above show that WRF can capture the main meteorological characteristics of this O3 episode, which is similar to those of previous studies on O3 episodes in the PRD (Wang et al., 2015; Y. Li et al., 2022).
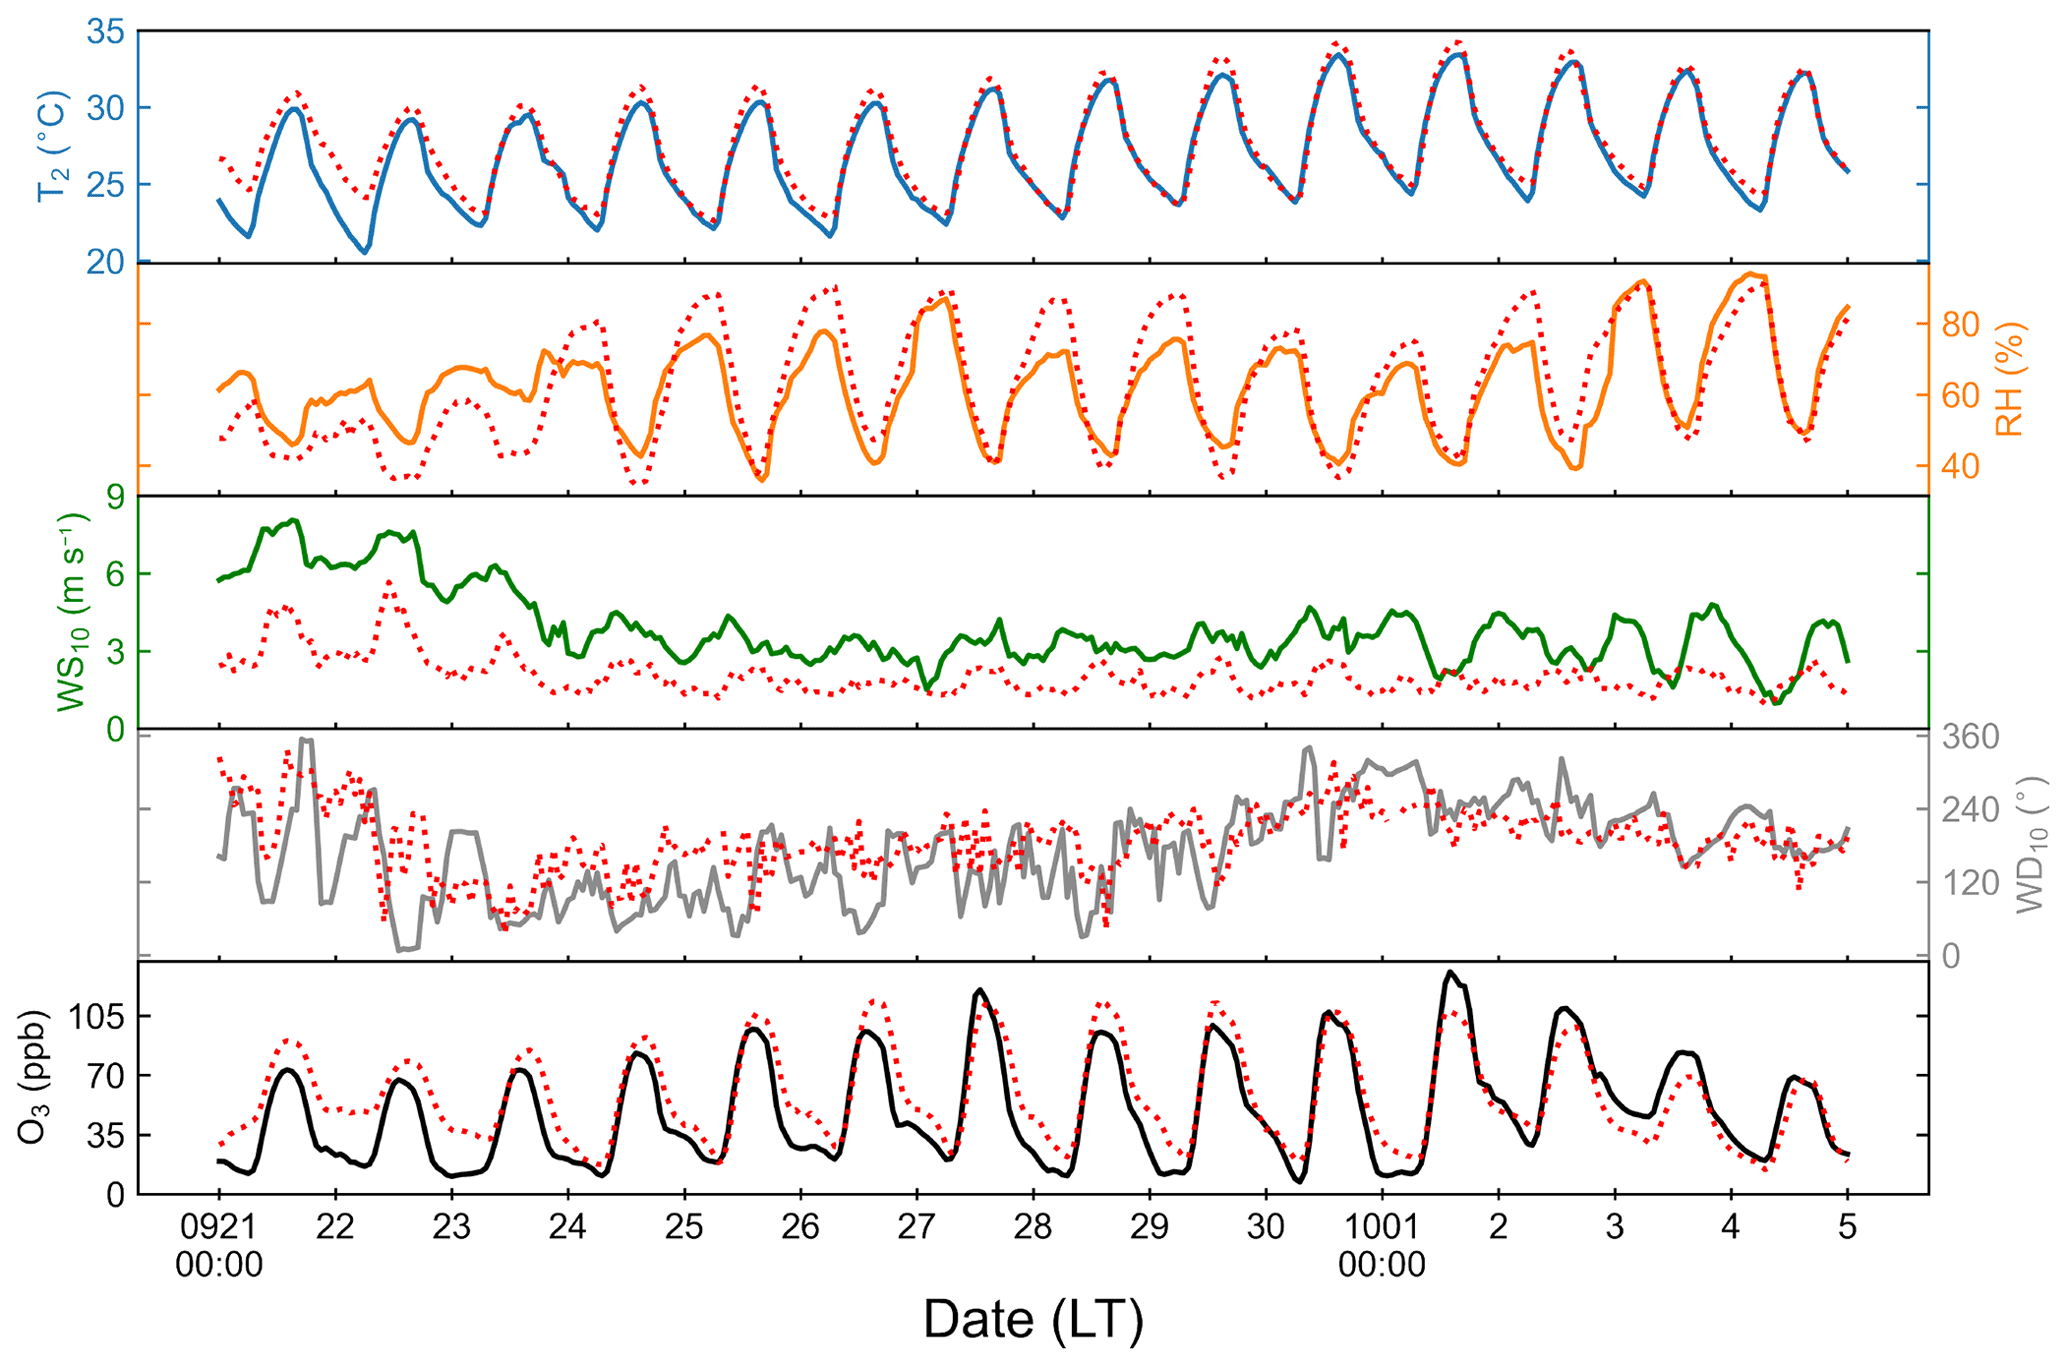
Figure 5Hourly variations in T2, RH, WS10, WD10, and O3 in observed values (red dots) compared to model simulations (solid lines) from 21 September to 4 October 2019.
Table 2Statistical metrics of meteorological parameters and O3 in the comparison between the observations (Obs.) and simulations (Sim.) from 21 September to 4 October.
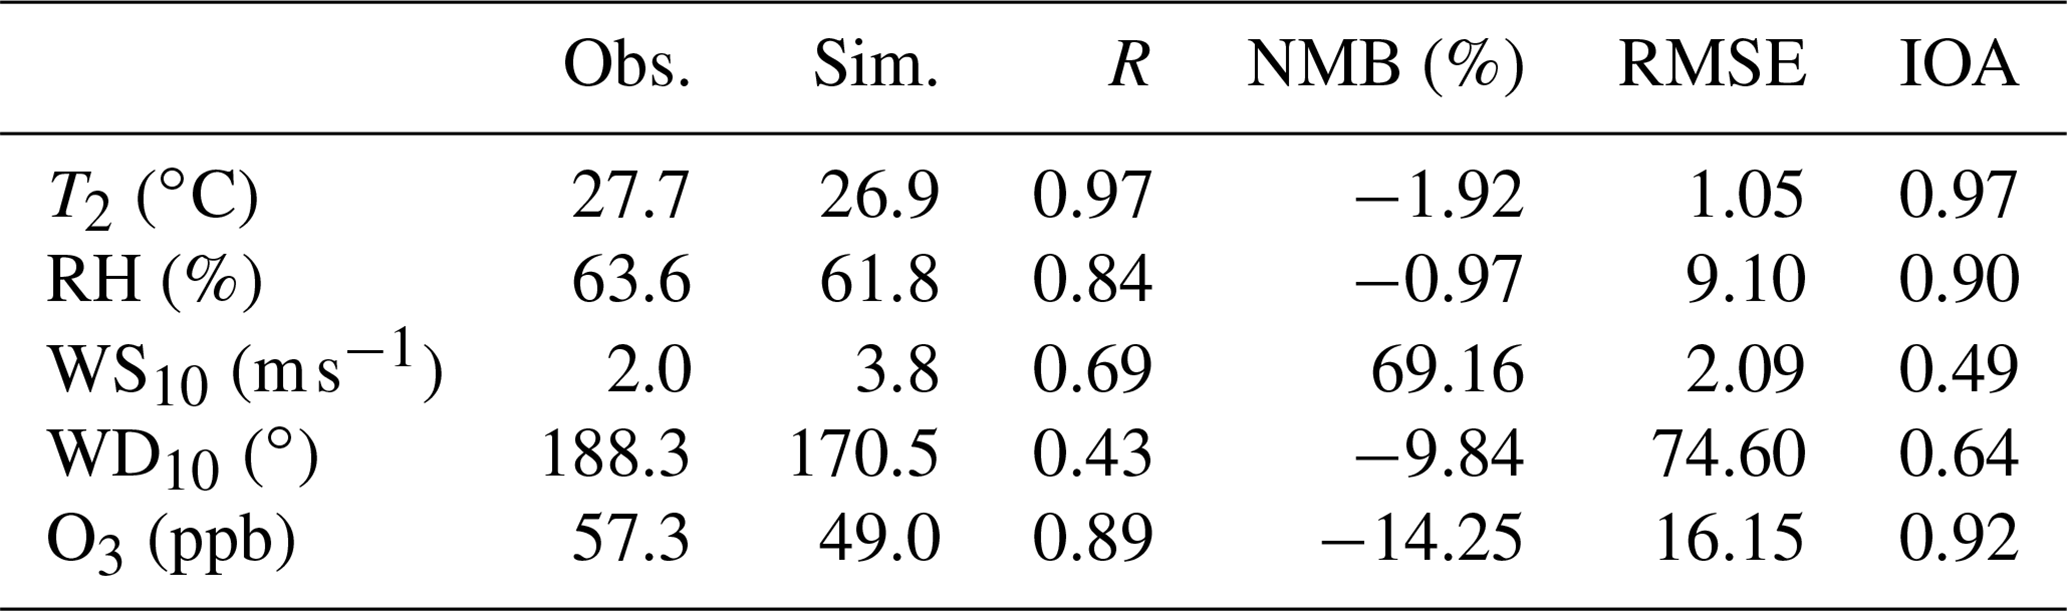
Figure 5 also shows the time series of O3 in the observations and simulations (from the model's lowest layer). The model captures the diurnal variation in O3 well, reaching the peak in the afternoon and then gradually decreasing to the low values at night. Although the O3 concentrations simulated by the CMAQ model are lower on the nights of 21 and 22 September and higher on the afternoons of 1–3 October, the NMB of −14.25 % and RMSE of 16.15 ppb indicate that the model results are within the acceptable ranges. The bias of the model may come from the WRF simulation error and/or the uncertainty in emissions (Wu et al., 2021). The emission inventory used is based on the MEIC prepared in 2016, which may not accurately represent real emissions in 2019. In addition, the uncertainty of the emissions of O3 precursors (NOx and VOCs) may also lead to a negative bias in nighttime O3 due to the titration effect (Lu et al., 2019; Yang et al., 2019).
3.3 Influence of meteorological conditions on O3 during the three periods
The effects of different weather systems on O3 during the three periods of this O3 episode are analyzed by examining the meteorological variables in Fig. 6, i.e., T2, RH, zonal wind speed at 10 m (U10), meridional wind speed at 10 m (V10), WS10, planetary boundary layer height (PBLH), downward shortwave flux at the ground surface (SWDOWN) and vertical velocity (Omega, ω). The parameters closely related to photochemical processes, namely SWDOWN, T2, RH, and PBLH, are shown in daytime averages (08:00–18:00), while the parameters closely related to transport, namely U10, V10, WS10, and Omega, are averaged over the entire 24 h. To explore the vertical air motions below the boundary layer (1260 m), Omega was calculated from the average of all model layers below 1260 m. Figure 6a shows the values of different meteorological parameters selected for the subtropical high period (25–28 September), typhoon period (29 September to 2 October), and clean period (3–4 October). SWDOWN was strong throughout the O3 episode, and the resulting high NO2 photolysis rate provided sufficient conditions for the generation of O3, especially in the upper and middle layers of the boundary layer (Dickerson, 1997; G. He et al., 2021). Compared to the clean period, lower RH, higher PBLH, a predominantly weak northerly wind at the surface (negative V10), and a stronger downdraft (positive Omega) were found in the first two periods. Lower RH tends to be unfavorable for the wet deposition of O3 (He et al., 2017; Y. Han et al., 2019; M. Li et al., 2021). The relatively high thermal PBLH allows for adequate mixing of O3 (Li et al., 2018; Zhao et al., 2019; Dong et al., 2020), which is more conducive to the downward transport of O3 in the upper layer when superimposed with the stronger downdraft under the background of the subtropical high and typhoon (Y. Li et al., 2022; Liu et al., 2022). The weak northerly wind favors the transport of high concentrations of locally generated O3 southwards to the coastal areas, resulting in higher O3 concentrations in the south of the PRD than in the north during the pollution periods. At the same time, the stable weather under the background of the subtropical high and Typhoon Mitag are more favorable for the formation of a deep residual layer, which can store photochemically generated O3 in the daytime and exacerbate the surface O3 concentration through vertical transport on the next day. Furthermore, since the virtual potential temperature (θv) can represent the height of the atmospheric mixed layer, it can also be seen from the θv profile results in the PRD from 25 September to 4 October at 14:00 in Fig. 6c that the inflection point of the θv in the pollution periods are above 1500 m, that is, the mixed layers are higher, indicating that the relatively higher mixed layer height is more conducive to the mixing of O3.
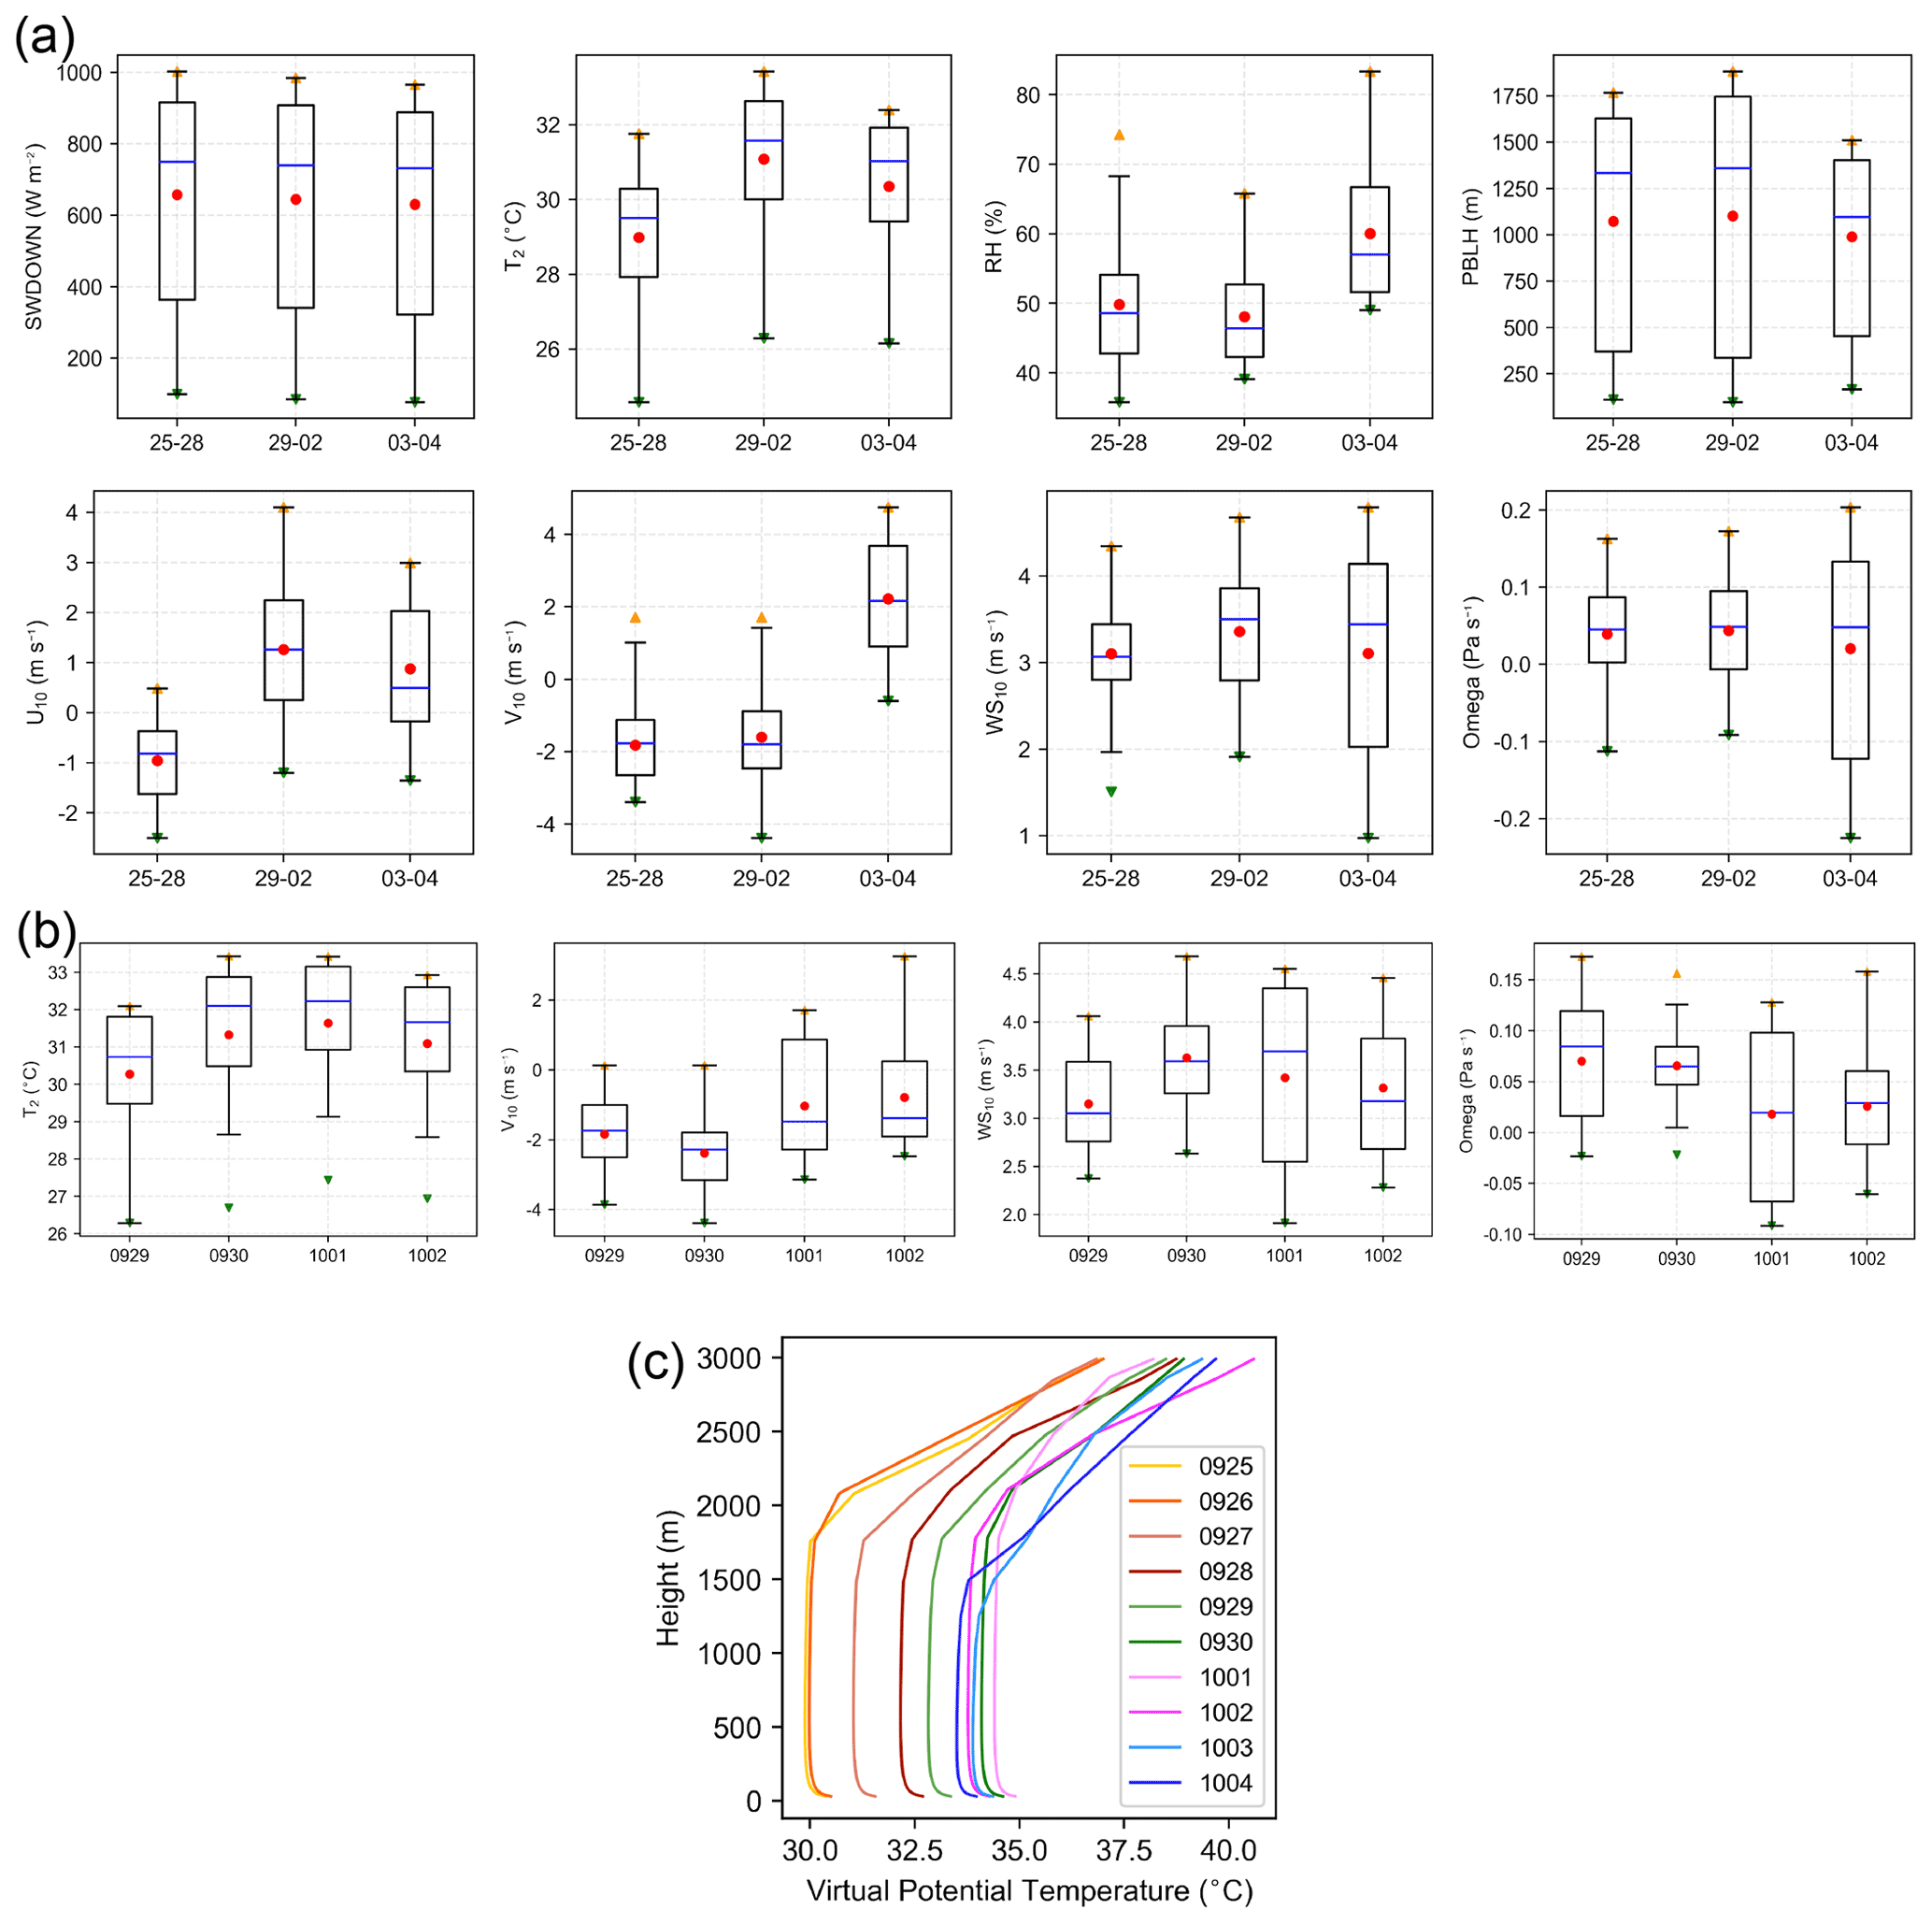
Figure 6(a) Box plot of different meteorological parameters at the subtropical high period (25–28 September), typhoon period (29 September to 2 October), and clean period (3–4 October). (b) Box plot of the comparisons of key meteorological parameters when Typhoon Mitag was in different locations. (c) Comparisons of virtual potential temperature (θv) profiles in different periods at 14:00. The boxes in panels (a) and (b) represent the interquartile range of each meteorological parameter, the lines dividing the boxes represent the median, the whiskers represent the maximum and minimum values other than outliers, the red dots represent the mean, and the triangles represent the maxima and minima.
On the other hand, when the PRD was under the influence of Typhoon Mitag, it had a higher T2, a switch to weak northwesterly wind, and stronger Omega compared to the subtropical high period, indicating that the more severe meteorological conditions combined with O3 and its precursors accumulated in the subtropical high period were beneficial to the further enhancement of the O3 photochemical generation. Further, the key meteorological parameters affecting the changes in O3 concentrations in the PRD varied as Typhoon Mitag moved away from PRD can be seen in Fig. 6b, where T2, W10, a weak northerly wind (negative V10), and Omega all rose first and then gradually decreased after 1 October, indicating that the meteorological conditions were more favorable for O3 generation and accumulation when the PRD was under the influence of typhoon peripheral circulation. Although Typhoon Mitag gradually moved away from the PRD on 2 October, the subtropical high strengthened (Fig. 3e), resulting in the PRD being still under the control of strong subsidence airflow. On 3 October, Typhoon Mitag moved further away with the weakening of the subtropical high, and the PRD was located between the broken subtropical highs (Fig. 3f). With a southerly wind prevailing at lower levels (positive V10), the O3 episode was greatly alleviated, indicating that the clean sea breeze in the removal of the O3 concentration played an important role.
The findings above suggest that the meteorological factors such as lower RH, predominantly weak northerly wind, stronger downdraft, and higher PBLH caused by the subtropical high and Typhoon Mitag were the main reasons for the development of this O3 pollution episode, and it ended due to the switch to clean southerly wind at lower levels.
3.4 Horizontal and vertical spatial distributions of O3
3.4.1 Effect of prevailing wind on O3
The horizontal spatial distributions of O3 and wind fields at 16:00 on 26 and 30 September and 3 October are selected to analyze the impact of surface wind on O3 in the three periods. Northeasterly wind prevailed during the subtropical high period (Fig. 7a), while north–northwesterly wind prevailed during the typhoon period (Fig. 7b). During both periods, the O3 concentrations in the southern part of PRD were higher than that in the northern part, indicating that the northerly component of wind delivered the high concentrations of O3 in the northern PRD southward to the coastal areas and overseas. After Typhoon Mitag moved northward and dissipated on 3 October, the wind in the PRD shifted to southerlies (Fig. 7c). At this time, the southerly wind from the sea had a cleansing effect on the O3 pollution. Under the transport of the southerly wind, the O3 concentration in the downwind northern part of PRD became higher than the upwind southern part. This further verifies the important influence of the southerly wind on the distribution of O3, as described in Sect. 3.3.
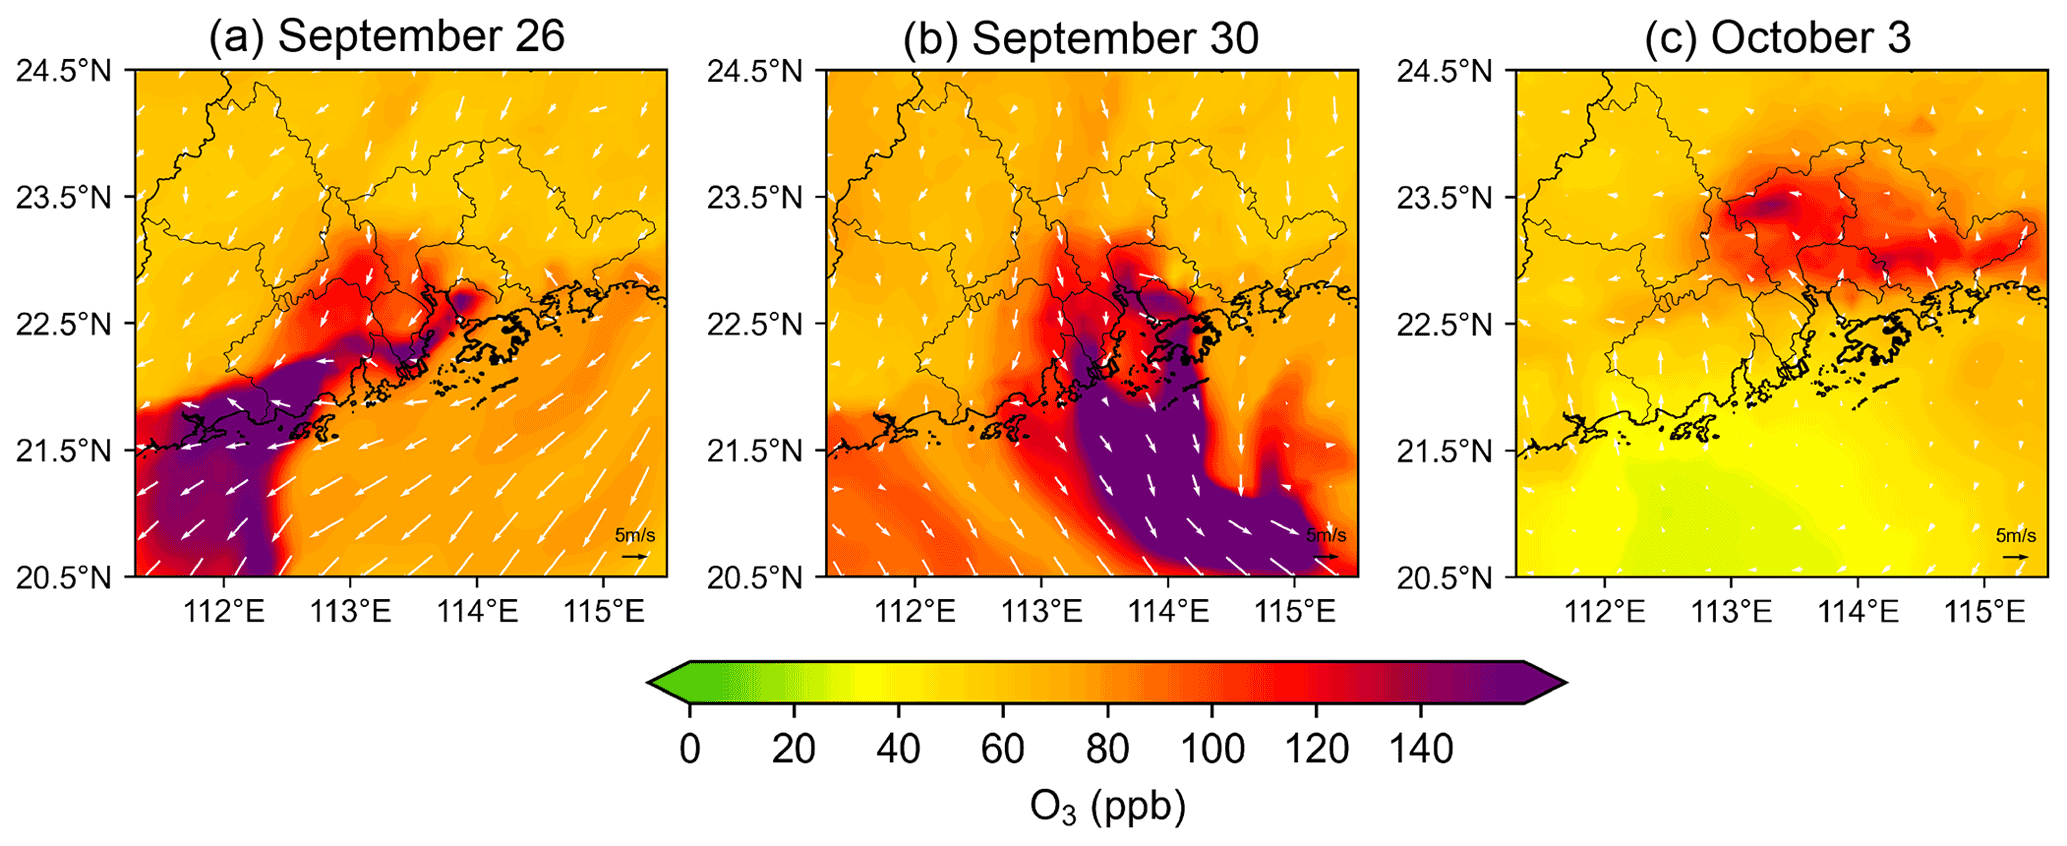
Figure 7Spatial distribution of O3 and wind fields at ground level at 16:00 on (a) 26 September, (b) 30 September, and (c) 3 October.
3.4.2 Effect of the sea–land breeze
As mentioned earlier, an O3 secondary peak was observed at several stations during the period under the influence of a subtropical high or typhoon, and the time of the secondary peak at these stations was delayed from coastal to inland (Fig. 3), indicating that the secondary peak was influenced by the circulation of the sea–land breeze. Many studies have shown that the sea–land breeze plays an important role in the transport of air pollutants between land and sea, and the interaction of sea–land air masses would lead to the redistribution of O3 in the coastal areas such as the PRD (Ding et al., 2004; Wu et al., 2013; Wang et al., 2018; Zeren et al., 2019; Lin et al., 2021). In order to explain the mechanism influencing the sea–land breeze, Fig. 8 shows the vertical distribution of O3 concentration (contours) and atmospheric circulation (wind vectors) over PRD along the WD10 at 14:00, 20:00, and 23:00 on 26 and 29 September and 1 October. At 14:00, the locally generated high concentrations of O3 covered most of the land area of the PRD, and a weaker sea breeze began to appear at the junction of sea and land in the near-surface layer. Under the domination of the prevailing northerly wind, the high concentrations of O3 was gradually transported to the coastal areas at 20:00, after which the coastal low- and middle-layer O3 was brought back to the land as the sea breeze strengthened. The influence of the sea breeze could reach inland areas as far as FS, and the impact height can reach more than 500 m. There is a clear stationary zone between the sea breeze and the northerly wind above the top of the boundary layer, which is more conducive to the formation of the residual layer. Our analysis shows that the contribution of horizontal transport to the increase in O3 concentrations during the influence of the sea breeze was about 6.9 ppb on average and up to 8.4 ppb on 26 September.
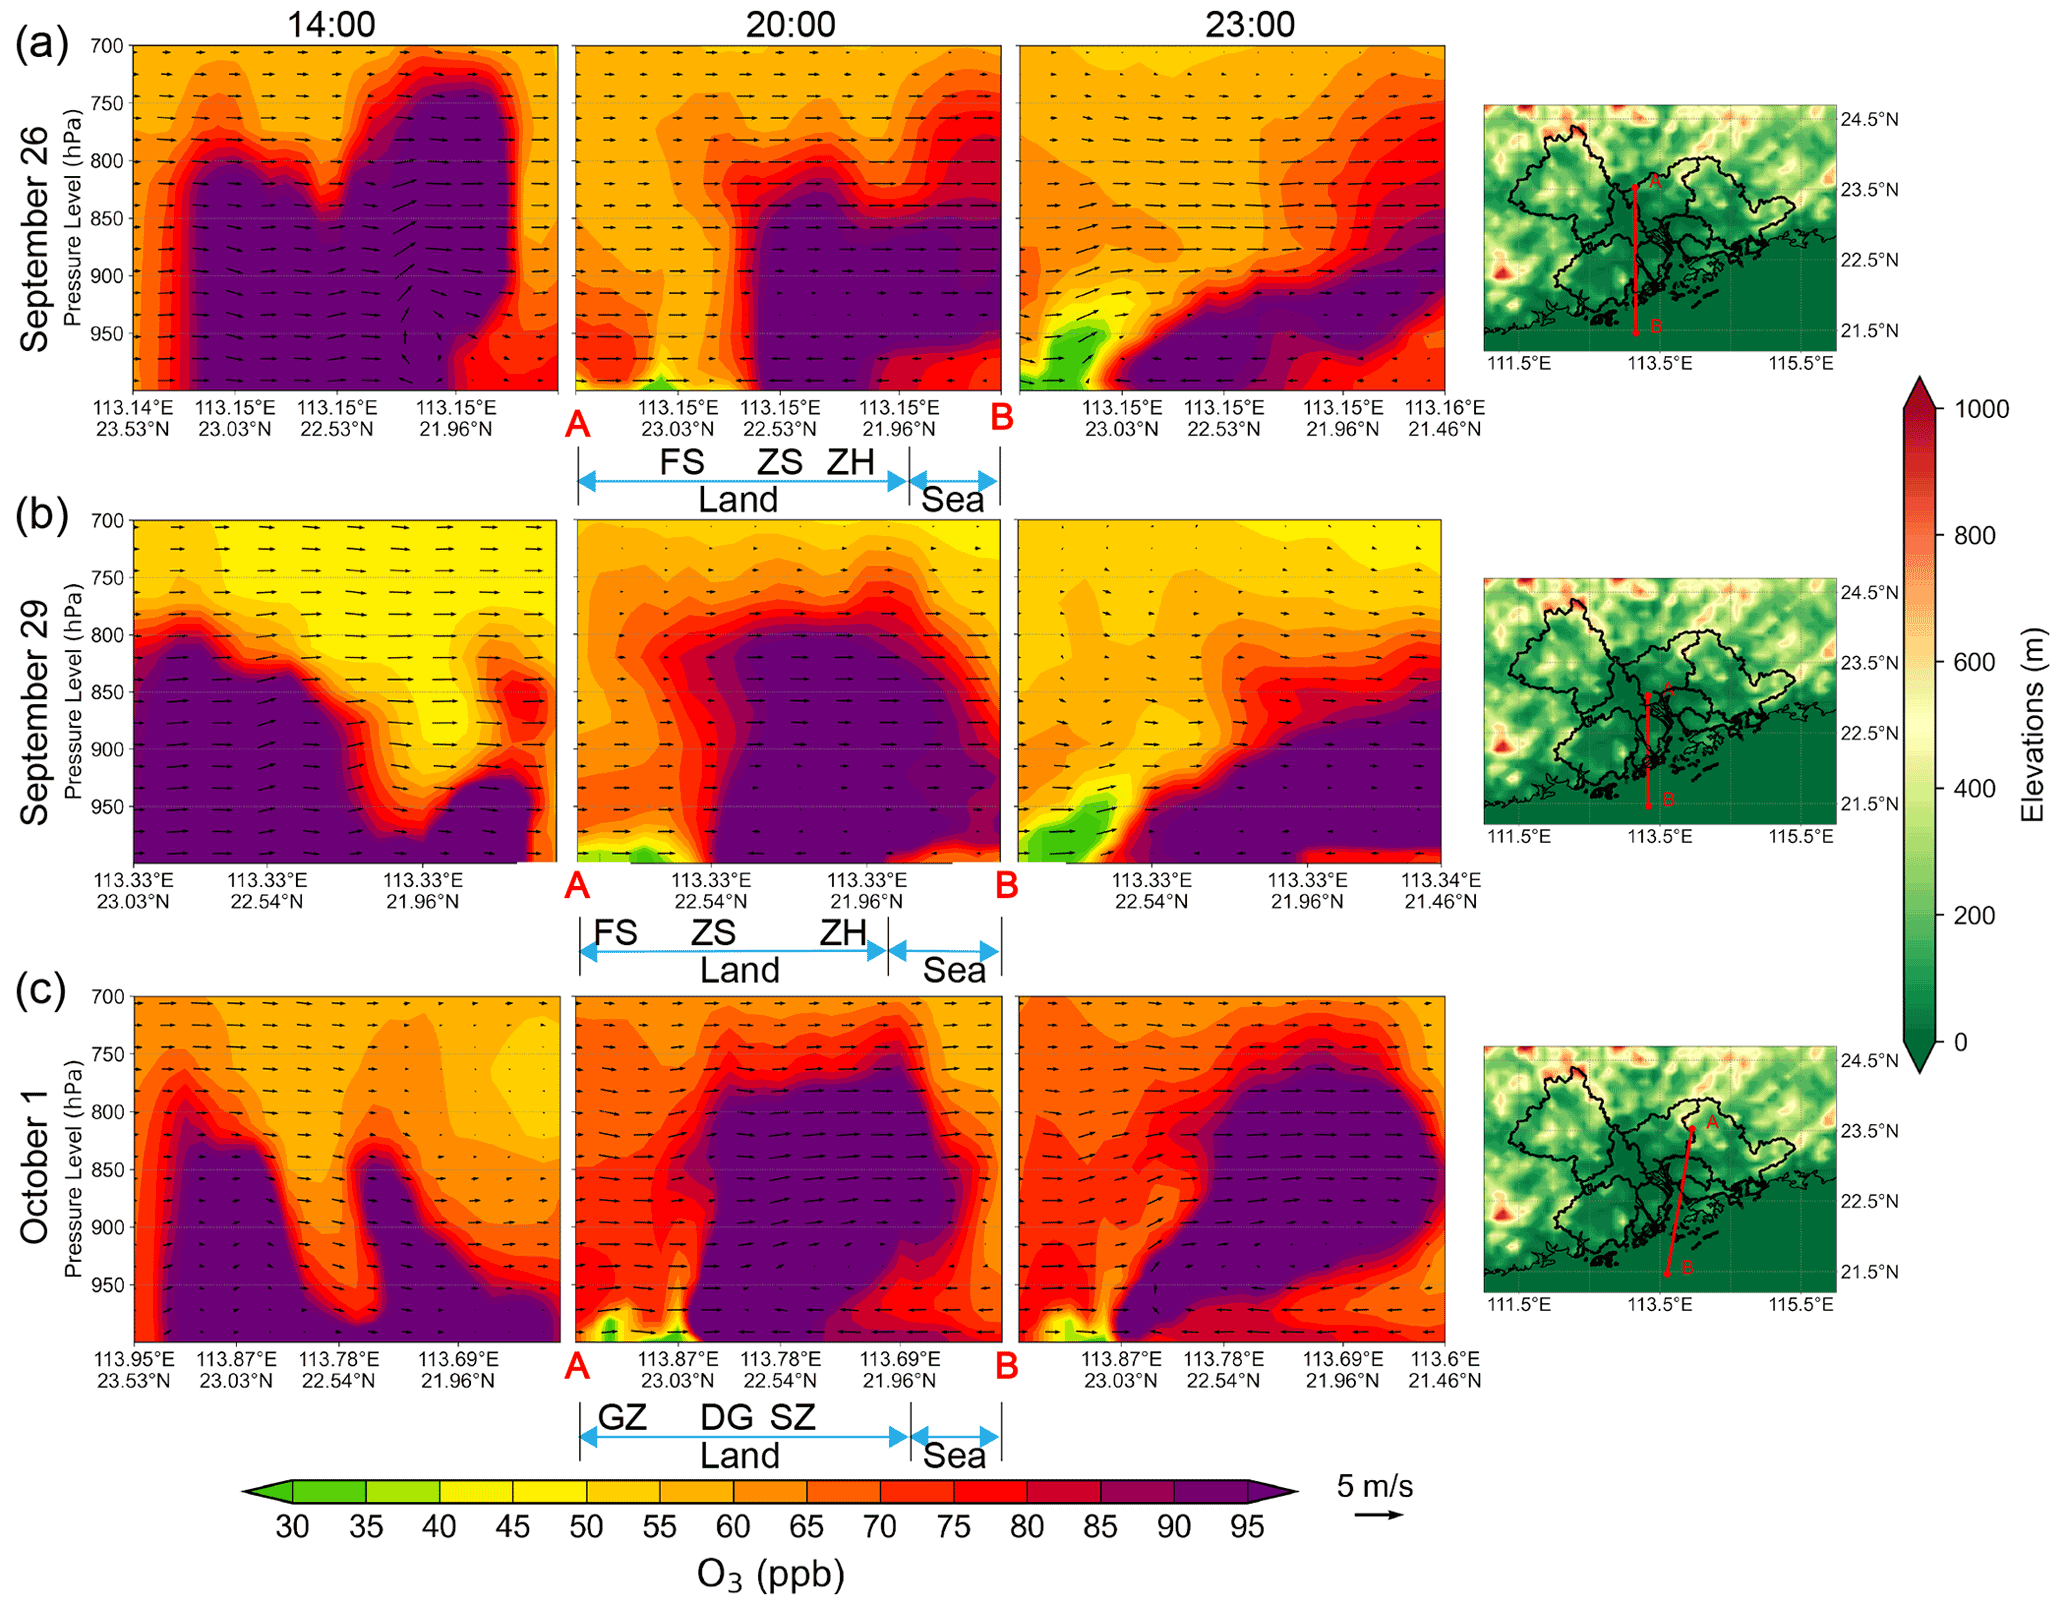
Figure 8Vertical distribution of O3 concentration (contours) and atmospheric circulation (wind vectors) over PRD along the WD10 at 14:00, 20:00, and 23:00 on (a) 26 September, (b) 29 September, and (c) 1 October.
It is well known that a sea–land breeze emerges due to the surface temperature difference between the land and the ocean. The land warms faster than the ocean during the day because the latter has a higher heat capacity than the former. As a result, the sea breeze usually starts in the mid-morning when the land temperature becomes higher than that of the sea. At night, the land cools faster than the ocean, triggering the land breeze when the land temperature becomes lower than the ocean temperature. However, the sea breeze was still noticeable as late as 23:00 during this episode. The reason for this phenomenon is that, under the influence of prevailing northerly wind, the occurrence of the sea breeze was delayed until approximately 14:00 (Wu et al., 2013; Wang et al., 2018). In addition, the existence of the heat island effect caused the temperature in the area near the Pearl River Estuary to remain higher than the ocean temperature until around 20:00 at night (Li et al., 2016; Zhan and Xie, 2022), after which it shifted to a land breeze as the land temperature fell below that of the ocean.
These results indicate that, when the land breeze direction coincides with the northerly background wind, the locally generated high concentration of O3 is transported to the southern part of PRD and coastal sea (Fig. 7). When the sea breeze in the opposite direction of the prevailing northerly wind appeared after sunset, the high concentration of O3 transported to the sea was brought back to coastal areas, or even inland, causing the ground-level O3 concentration to have a secondary peak at night.
3.4.3 Effect of nighttime residual layer O3
The vertical motion of airflow, especially the subsidence airflow due to the subtropical high and typhoon, can have important impact on the O3 pollution in the PRD. Therefore, this section explores the vertical variation in O3. The average O3 concentration simulated by the model for the area (22.23–23.39∘ N, 112.43–114.53∘ E) was used to analyze the formation of O3 during the O3 episode. Figure 9 shows the vertical distribution of the O3 concentration during the O3 episode. After sunset, a significant amount of O3 could be seen stored in the nighttime residual layer (500–1000 m) and above the mixed layer (1000 m) during the O3 episode. Taking 29 September as an example, the ground-level O3 concentration stayed above 100 ppb from noon until 16:00 in the afternoon. After sunset (around 18:00), the ground temperature dropped rapidly, and an inversion formed with the warm air in the upper boundary layer. Because of the absence of photochemical production and consumption of near-surface O3 by NO titration, the near-surface O3 concentration dropped sharply. Above the inversion layer, high daytime O3 is stored because there was no titration of O3 by NO. Higher O3 of approximately 45–85 ppb accumulated in the residual and mixed layer around 500–1500 m at night.
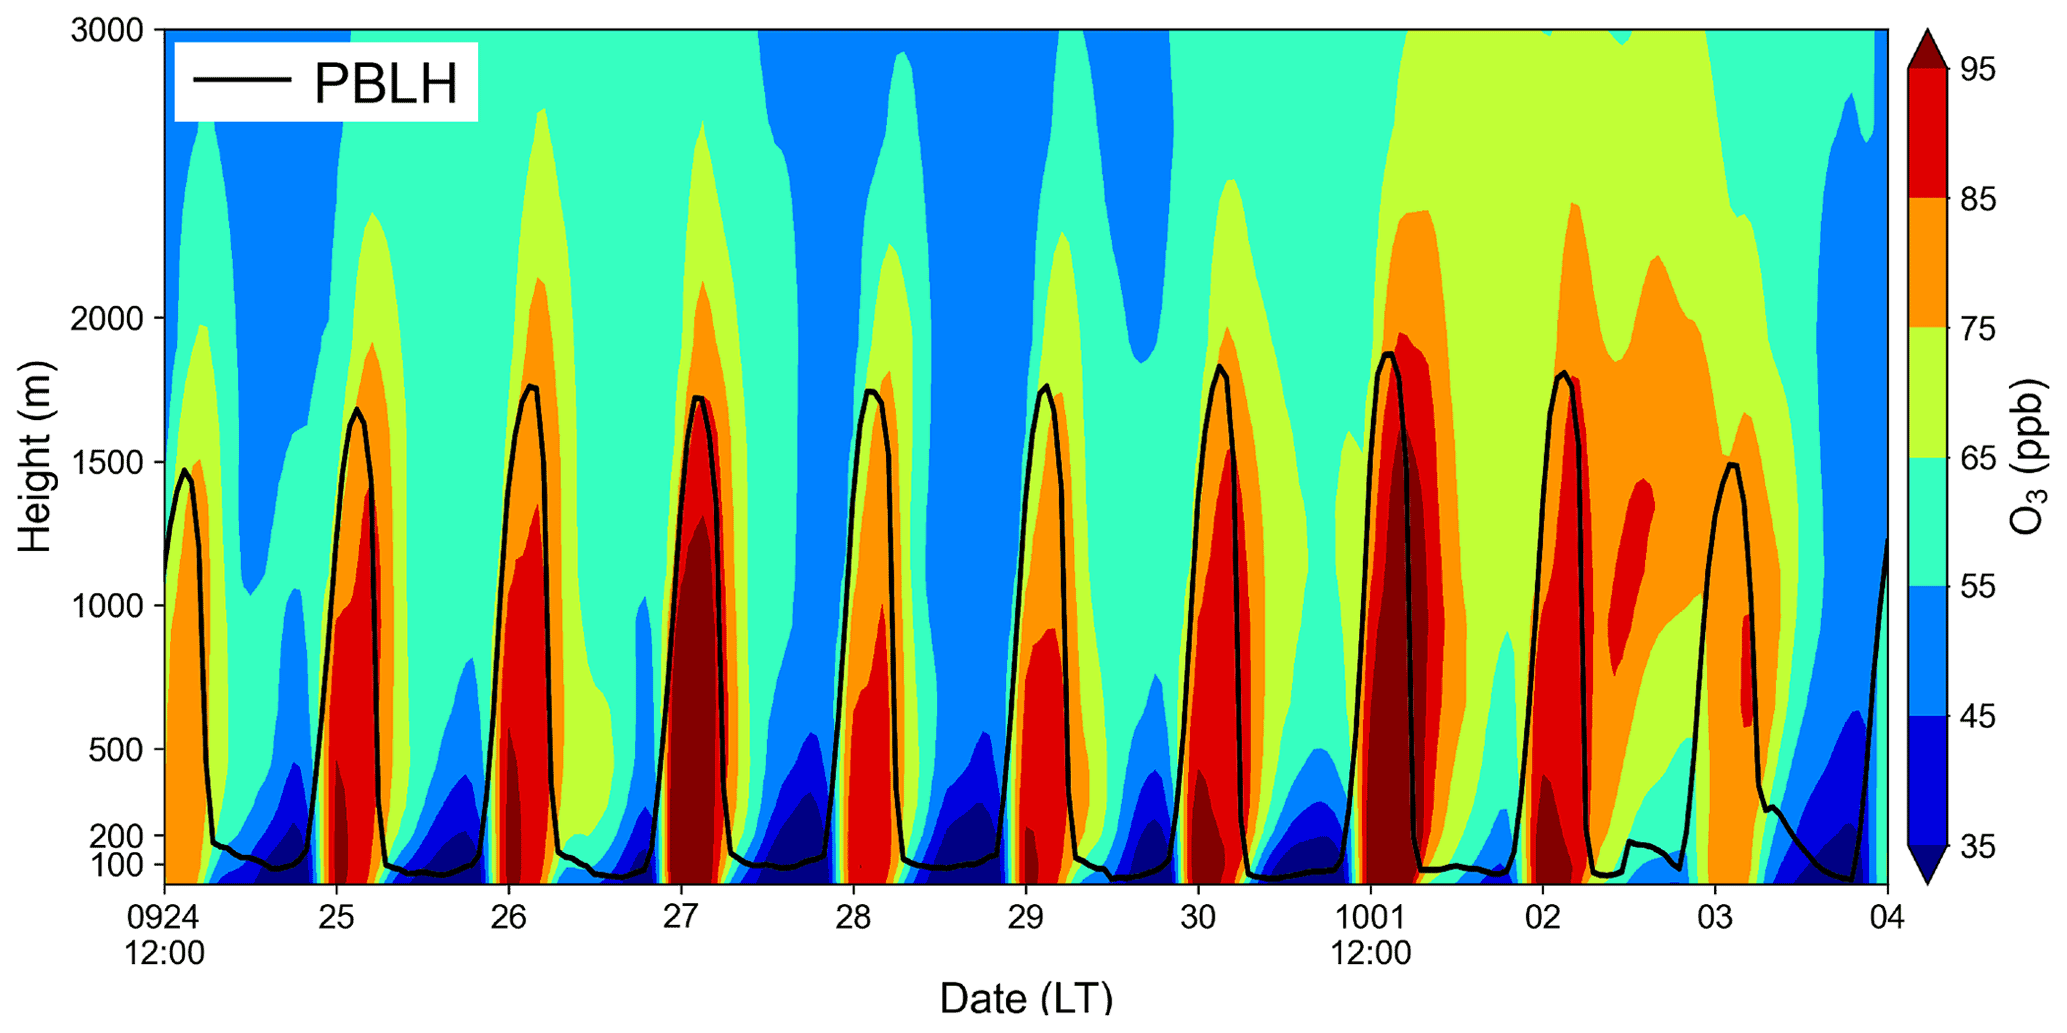
Figure 9Temporal–vertical distribution of the O3 concentration above PRD during the O3 episode. The black line represents the height of the planetary boundary layer (PBLH).
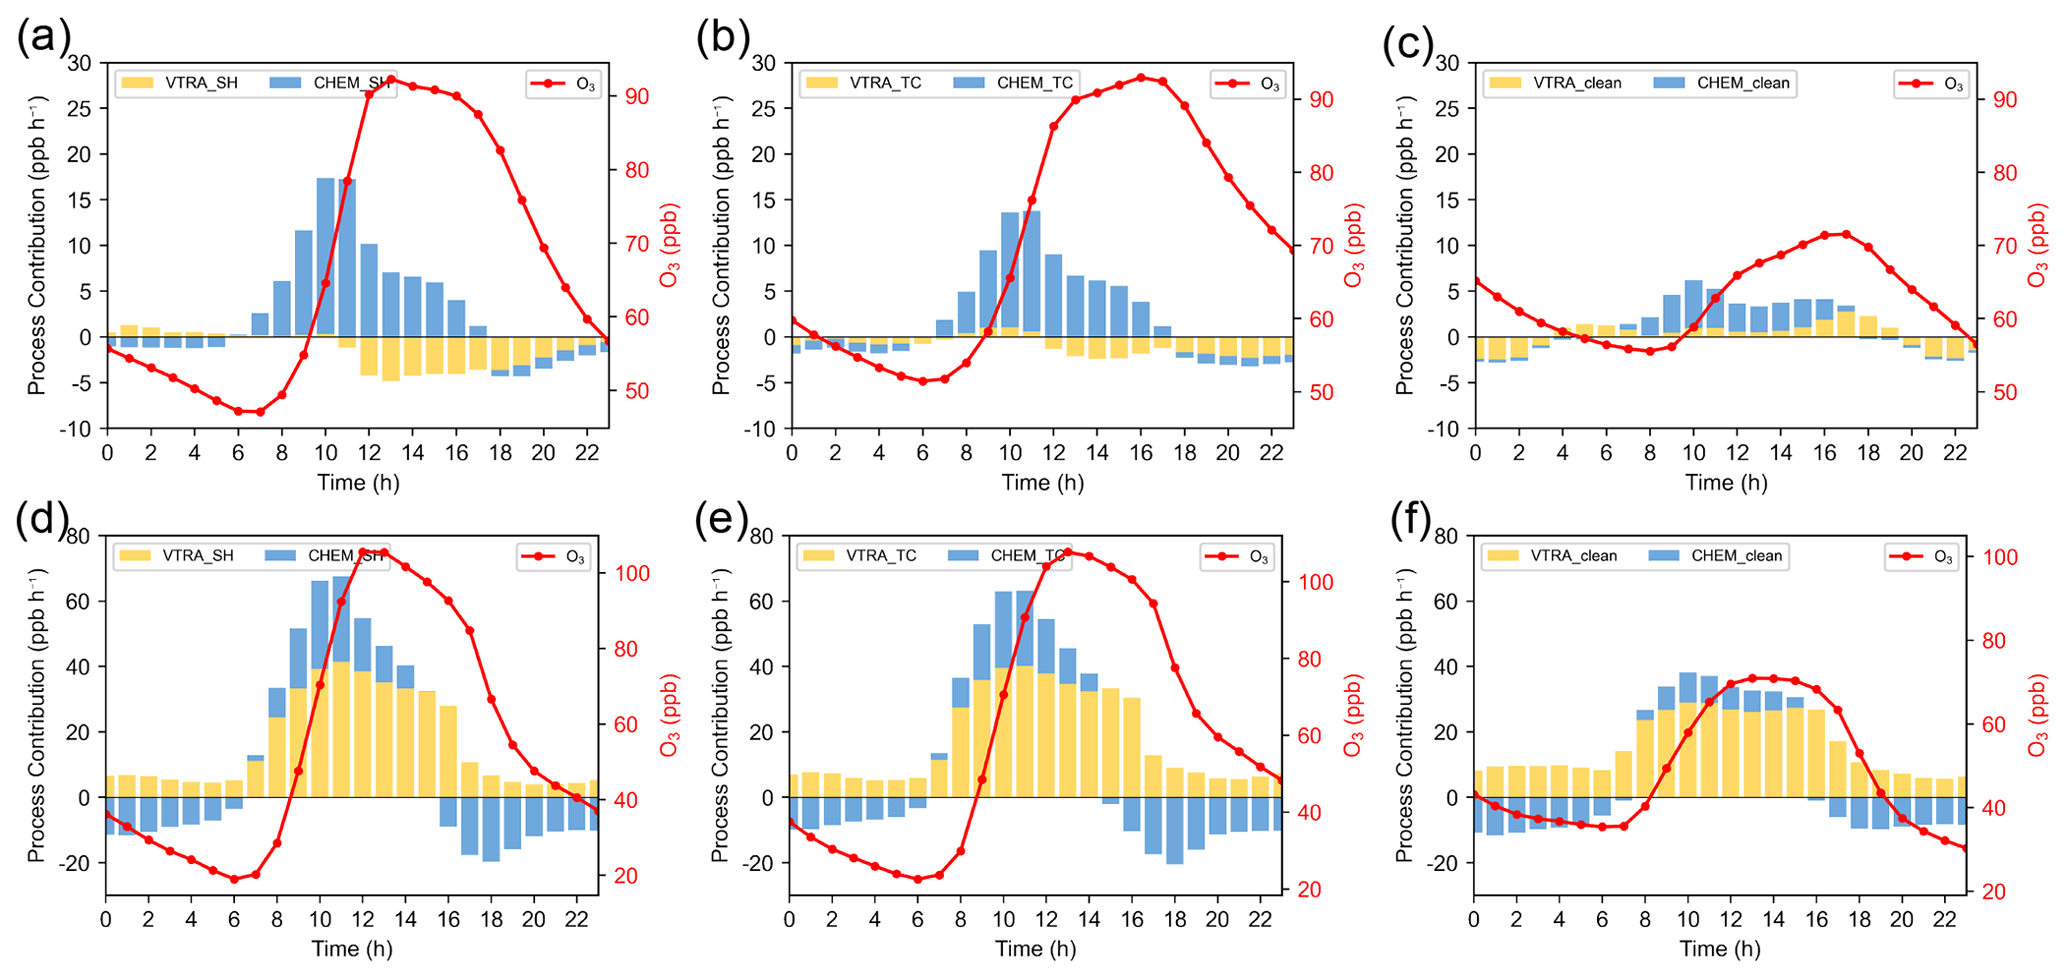
Figure 10The O3 concentration (red line) and the contributions of photochemical (CHEM; blue bars) and vertical transport (VTRA; yellow bars) processes to O3 in the PRD during the subtropical high period (a, d), typhoon period (b, e), and clean period (c, f), where panels (a–c) are the values for all layers above the near-surface layer (35–1260 m), and panels (d–f) are the values for the near-surface layer (0–35 m).
High concentrations of O3 in the residual layer above the surface layer were slowly transported to the surface until sunrise because the nighttime inversion slowed down the vertical mixing (yellow bars in Fig. 10d–f). After sunrise, the contribution of photochemical production (CHEM) within the boundary layer began to increase (blue bars in Fig. 10a–c); the height of the mixed layer kept rising, and the boundary between it and the residual layer disappeared due to the development of the mixed layer. The contributions of vertical transport (VTRA; yellow bars in Fig. 10a–c) were small during this time, indicating that the O3 inflow from the upper layer was almost equal to the O3 transport to the surface. Therefore, for the near-surface O3, the contributions of VTRA may contain a significant contribution of CHEM in the layer above the surface layer. Quantitatively, it is difficult to evaluate this contribution by CHEM; hence, VTRA has to be treated as the maximum contribution from the residual layer.
The near-surface VTRA (yellow bars in Fig. 10d–f) is substantially higher than CHEM (blue bars in Fig. 10d–f), indicating that the largest increase in ground-level O3 concentration the next morning is mainly due to the vertical mixing of higher concentrations of O3 in the residual layer with near-surface air masses. As clean southerly wind prevailed in the PRD on 3 October, the updrafts in the boundary layer gradually increased; hence, the contribution to O3 from vertical mixing of the residual layer and photochemical reactions diminished. Thus, even with higher O3 storage in the residual and mixed layers, O3 pollution was mitigated. The results of the process analysis show that VTRA (including contribution by CHEM above the surface layer) contributes 34 %–50 % to surface O3 at 08:00–14:00 during the entire episode. This range of VTRA is consistent with those obtained by X.-B. Li et al. (2021) in eastern China (about 12.6 %–78.3 %), Zhu et al. (2020) in rural areas of the North China Plain (about 50.7 %), and G. He et al. (2021) in Shenzhen (about 47.44 %–61.44 %) but higher than Liu et al. (2022) in urban areas of the North China Plain (about 20.6 %–27.9 %).
The above results suggest that high O3 concentrations in a region can be generated by daytime photochemical reactions and that O3 and its precursors stored in the residual layer during the night are mixed at the surface by vertical movement in the early morning, significantly impacting daytime ground-level O3 on the next day.
3.5 Contributions of photochemical and transport processes to O3 formation
Figure 11a shows the vertical distribution of the daytime (08:00–18:00) contribution of individual photochemical and transport processes to the O3 concentrations in the PRD on selected representative days of the subtropical high period (26 September), typhoon period (29 September), and clean period (3 October). As expected, the photochemical production of O3 is the main positive contributor to the O3 budget of all layers between 35 m and about 1000 m. The CHEM is balanced by the VTRA (the main negative contributor) to both the surface layer and layers above 1000 m (the free troposphere). The surface layer O3 is mainly maintained by the balance between VTRA and dry deposition (DDEP). Relative to the clean period, the CHEM is significantly greater, and the vertical mixing was more intense when the PRD was affected by the subtropical high or Typhoon Mitag. Between the two pollution periods, the typhoon period has a slightly greater CHEM and a less horizontal transport/dispersion (HTRA) of O3 than the subtropical high period.
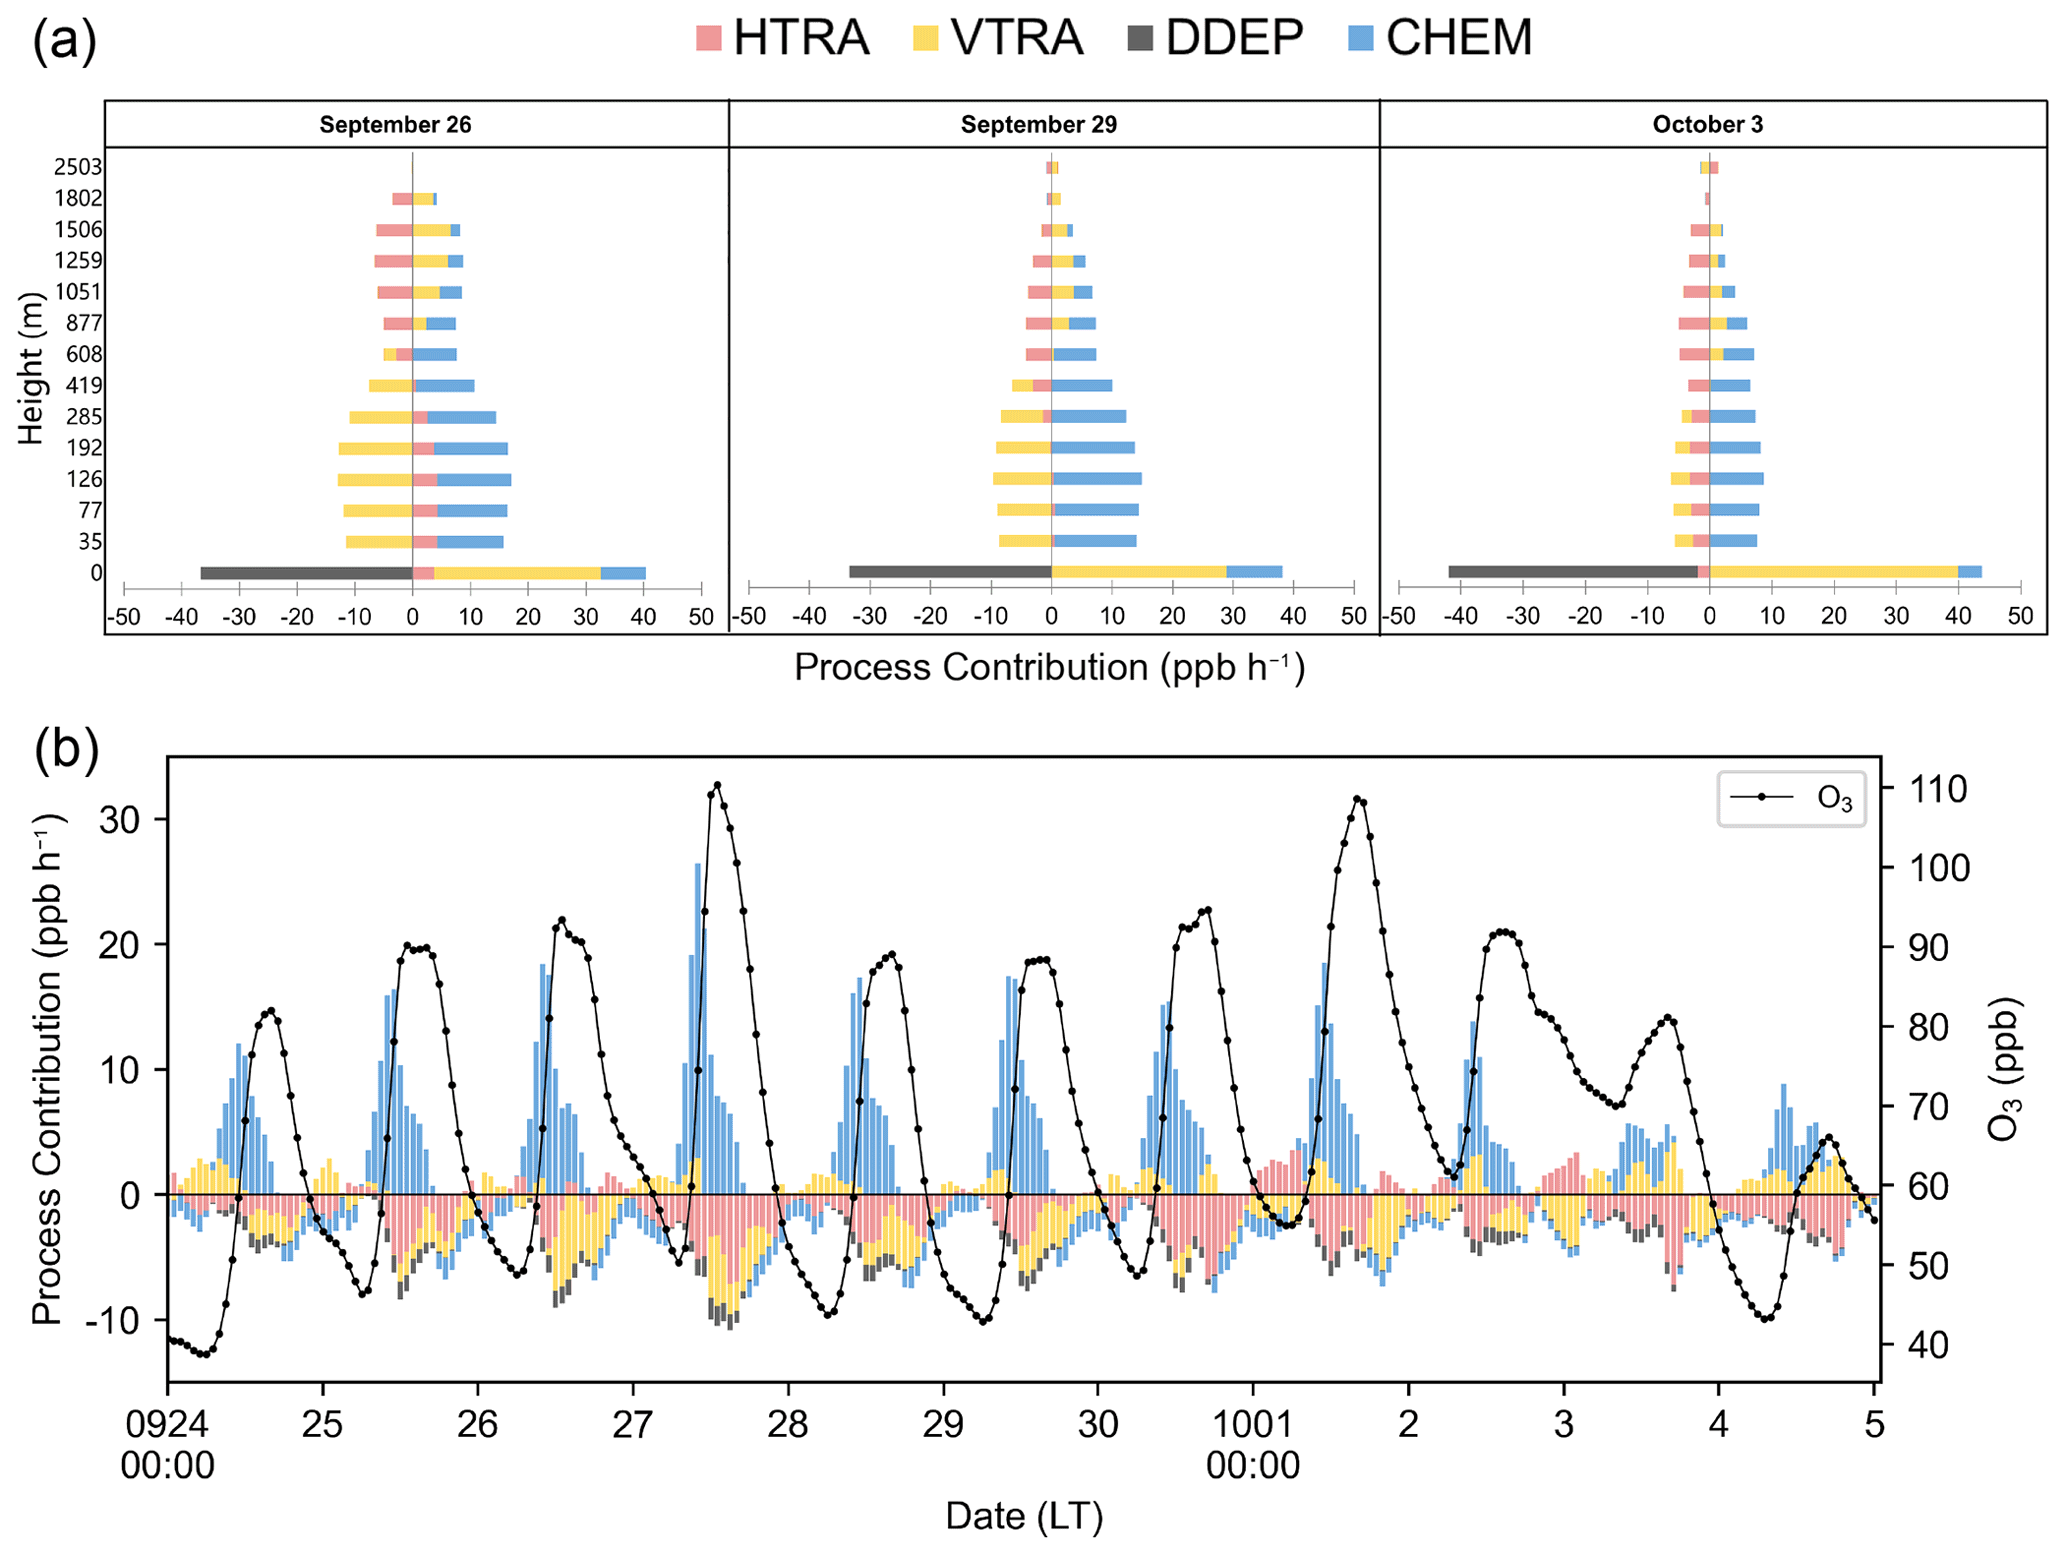
Figure 11(a) Daytime mean (08:00–18:00) vertical contributions of individual processes to O3 in the PRD under different periods. (b) Time series of individual processes (the averages of the whole boundary layer) contributing to O3 in the PRD. The black line (O3) represents the averaged O3 concentration under the layers below 1260 m.
The time series at the hourly resolution of individual photochemical and transport processes in the boundary layer (defined as 0–1260 m, based on the median height of PBLH in Fig. 6a) for the entire O3 episode are shown in Fig. 11b. CHEM dominates the positive contribution to O3 during the day from about 08:00 to 15:00 (the exact time is more clearly illustrated in Fig. 10a–c). This is the case throughout the entire episode, even for 24 September and 3 and 4 October, indicating clearly that the daily O3 maximum is primarily controlled by CHEM. The horizontal and vertical transport flux (HTRA+VTRA) is the dominant negative contributor to the O3 formation throughout the whole day. The absolute value of HTRA+VTRA starts increasing in the morning, reaching a peak value near the O3 maximum where it overtakes CHEM, and causes the O3 concentration to decrease in the afternoon and thereafter. This near-balance between CHEM and HTRA+VTRA at the daily O3 maximum occurred throughout the entire O3 episode, even for the clean period. The results above have an important implication, i.e., that the photochemical production of O3 in the boundary layer in the PRD during the O3 episode contributes to not only the high O3 inside the boundary layer in the PRD but also the transport of O3 horizontally and vertically outside the boundary layer in the PRD.
Table 3Daytime (08:00–18:00) and nighttime (19:00–07:00 the next day) mean contributions of individual O3 processes for layers below 1260 m under different periods.
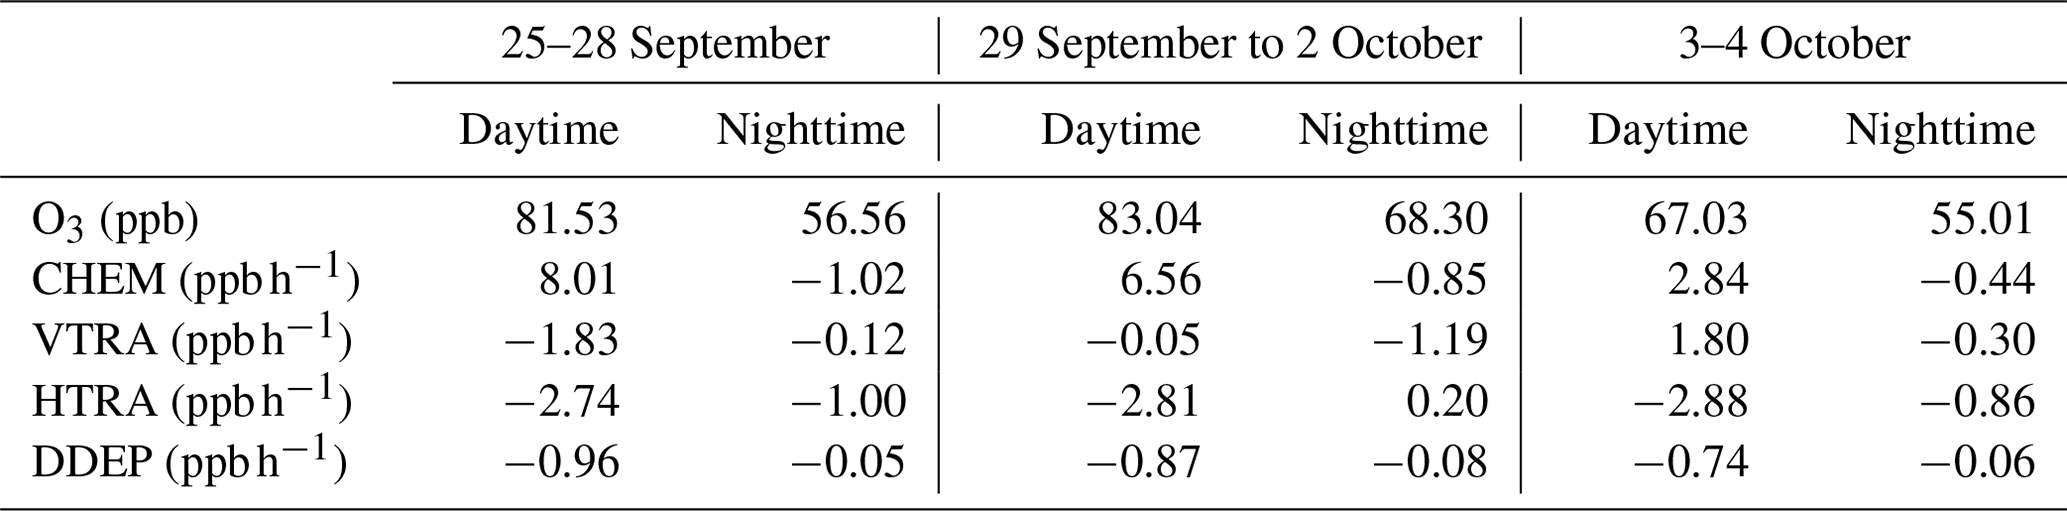
Given the importance of the daytime CHEM, the daytime average CHEM for each period is shown in Table 3 and compared to values of VTRA, HTRA, DDEP, and O3. Again, the dominant terms are those of CHEM, and the value of CHEM is remarkably high in the range of 6.56 to 8.01 ppb h−1 during the period influenced by the subtropical high and Typhoon Mitag (25 September to 2 October 2019), due to strong photochemical reaction rates resulting from higher SWDOWN and lower RH, but only about 2.84 ppb h−1 during the clean period of 3–4 October, due to the switch of clean southerly wind. In comparison, the contribution of HTRA in the pollution periods is in the range of −2.74 to −2.81 ppb h−1 during the day and about −1.00 to 0.20 ppb h−1 at night, while the contribution of VTRA in the pollution periods is even smaller in the range of −0.05 to −1.83 ppb h−1 during the day and about −0.12 to −1.19 ppb h−1 at night. The values in Table 3 clearly show that the changes in major meteorological factors induced by the subtropical high and Typhoon Mitag led to the enhancement of O3 photochemical production by providing favorable reaction conditions, which were the major cause for the high O3 concentrations inside the PRD and its downwind regions (mostly over the sea, as shown in Figs. 7 and 8) during this O3 episode. Furthermore, this episode accounted for 8 out of a total of 15 d when hourly O3 exceeded 93 ppb in the PRD during the period from 1 September to 31 October 2019 (Fig. 2). Actually, only 2 out of the 15 d occurred in the gray shaded periods (other than subtropical high and typhoon). In addition, this episode accounted for 10 out of a total of 51 d when MDA8 O3 exceeded 75 ppb in the PRD in the entire year of 2019. Based on the results above, we propose that the influence of a Pacific subtropical high followed by Typhoon Mitag in early autumn 2019 is the major cause of the most severe O3 pollution year since the official O3 observation started in the PRD in 2006 (G. He et al., 2021; X.-B. Li et al., 2022). Moreover, since this O3 episode is a synoptic-scale phenomenon covering the entire eastern part of China (Professional Committee of Ozone Pollution Control of Chinese Society for Environmental Sciences, 2022), we also suggest that the enhanced photochemical production of O3 in this O3 episode is a major cause of the high O3 concentrations observed in eastern China in 2019.
In late September 2019, a severe O3 pollution episode with the longest duration since the observation records began occurred in the PRD. In this study, we have analyzed the effects of individual meteorological and photochemical processes on the O3 concentrations in the PRD during this episode by carrying out the WRF-CMAQ model simulations. According to the synoptic patterns and variations in O3 concentration, the O3 episode was divided into the following three periods: the subtropical high period, typhoon period, and clean period. By comparing the meteorological parameters at different periods, we found that the meteorological factors leading to this O3 pollution episode were low RH, high boundary layer height, predominantly weak northerly wind at the surface, and strong downdraft.
From the spatial distribution of O3 and wind fields, it can be seen that the prevailing northerly wind in the PRD, induced by the subtropical high and Typhoon Mitag, can transport high concentrations of locally generated O3 out overseas. In addition, under the influence of prevailing northerly wind, the occurrence of the sea breeze was delayed until late afternoon, and the sea breeze that lasted into the night transported the O3 from the sea back to land. The contribution of horizontal transport to the increase in O3 concentration during the influence of sea breeze was about 5.5–8.4 ppb. The end of the episode was due to the northward movement of Typhoon Mitag away from PRD, which resulted in a strong southerly wind, bringing clean and moist oceanic air to PRD. In addition, the temporal–vertical distribution of the O3 concentration shows that O3 and its precursors stored in the residual layer above the surface layer at night can be mixed down to the surface by vertical motion in the next morning, thus increasing the daytime ground-level O3 concentration on the next day.
The CHEM exhibits the predominant positive contribution to the O3 budget of the boundary layer (0–1260 m) in the entire O3 episode, with the remarkably high values in the range of 6.56 to 8.01 ppb h−1 during the period influenced by the subtropical high and Typhoon Mitag but only about 2.84 ppb h−1 during the clean period. In comparison, the HTRA and VTRA are the dominant negative contributor to the O3 budget throughout the whole day, with the daytime average production rate during the pollution periods of about −2.81 and −0.94 ppb h−1, respectively. As this episode accounted for 10 out of the yearly total of 51 d when (MDA8) O3 exceeded 75 ppb in the PRD in the entire year of 2019, we propose that the influence of a Pacific subtropical high followed by Typhoon Mitag is the major cause of the most severe O3 pollution year since the official O3 observation started in the PRD in 2006. Moreover, since this O3 episode occurs not only in the PRD but also in entire eastern part of China, we also suggest that the increased photochemical production of O3 in this O3 episode is a main reason for the high O3 concentrations observed in eastern China in 2019.
Hourly surface O3 data were obtained from the CNEMC (http://www.cnemc.cn/en/, last access: 15 April 2022, China National Environmental Monitoring Centre, 2022). Hourly meteorological data were provided by the China Meteorological Data Service Centre of the CMA (https://data.cma.cn/en/, last access: 15 April 2022, China Meteorological Administration, 2022). The ERA5 data were acquired from European Centre for Medium-Range Weather Forecasts Reanalysis v5 dataset (https://doi.org/10.24381/cds.bd0915c6, Hersbach et al., 2018). The FNL meteorological data were taken from the NCEP (https://doi.org/10.5065/D6M043C6, National Centers for Environmental Prediction/National Weather Service/NOAA/U.S. Department of Commerce, 2000). Model output data of this paper are available upon request.
TD and SCL proposed the essential research idea. SO, JC, and TD performed the model simulations work and carried out the model output data analysis. SO wrote the original paper with input from TD, SCL, and RL. SCL, RL, TD, and JCHL helped to revise the paper. NW and GH discussed the results and offered valuable comments.
The contact author has declared that none of the authors has any competing interests.
Publisher's note: Copernicus Publications remains neutral with regard to jurisdictional claims in published maps and institutional affiliations.
We would like to acknowledge the China National Environmental Centre, the National Meteorological Information Centre, the European Centre for Medium-Range Weather Forecasts, and the National Center for Environmental Prediction, for providing datasets that made this work possible. The numerical calculations were performed on the Guangdong Meteorological Service. We also acknowledge the support of the Institute for Environmental and Climate Research in Jinan University and the Institute of Tropical and Marine Meteorology/Guangdong Provincial Key Laboratory of Regional Numerical Weather Prediction of the China Meteorological Administration.
This research has been supported by the Guangdong Provincial Key Research and Development Program (grant no. 2020B1111360003), the National Natural Science Foundation of China (grant nos. 41775037, 92044302, and 41905123), the Guangdong Innovative, Entrepreneurial Research Team Program (grant no. 2016ZT06N263), the Special Fund Project for Science and Technology Innovation Strategy of Guangdong Province (grant no. 2019B121205004), the Guangzhou Municipal Science and Technology Project, China (grant no. 202002020065), the Science and Technology Innovation Team Plan of Guangdong Meteorological Bureau (grant no. GRMCTD202003), and the Guangdong Basic and Applied Basic Research Foundation (grant no. 2020A1515011136).
This paper was edited by Andrea Pozzer and reviewed by two anonymous referees.
Bachmann, J. D.: Air quality and climate connections, J. Air Waste Manage., 65, 641–644, https://doi.org/10.1080/10962247.2015.1040697, 2015.
Chang, L., Xu, J., Tie, X., and Gao, W.: The impact of Climate Change on the Western Pacific Subtropical High and the related ozone pollution in Shanghai, China, Sci. Rep., 9, 16998, https://doi.org/10.1038/s41598-019-53103-7, 2019.
Chen, F. and Dudhia, J.: Coupling an advanced land surface–hydrology model with the Penn State–NCAR MM5 modeling system. Part I: Model implementation and sensitivity, Mon. Weather Rev., 129, 569–585, https://doi.org/10.1175/1520-0493(2001)129<0569:CAALSH>2.0.CO;2, 2001.
China Meteorological Administration (CMA): National Meteorological Information Centre, CMA Meteorological Data Centre [data set], http://data.cma.cn/en/, last access: 15 April 2022.
China National Environmental Monitoring Centre (CNEMC): Air quality data in China, CNEMC [data set], http://www.cnemc.cn/en/, last access: 15 April 2022.
Deng, T., Wang, T., Wang, S., Zou, Y., Yin, C., Li, F., Liu, L., Wang, N., Song, L., Wu, C., and Wu, D.: Impact of typhoon periphery on high ozone and high aerosol pollution in the Pearl River Delta region, Sci. Total Environ., 668, 617–630, https://doi.org/10.1016/j.scitotenv.2019.02.450, 2019.
Dickerson, R. R.: The impact of aerosols on solar ultraviolet radiation and photochemical smog, Science, 278, 827–830, https://doi.org/10.1126/science.278.5339.827, 1997.
Ding, A., Wang, T., Zhao, M., Wang, T., and Li, Z.: Simulation of sea-land breezes and a discussion of their implications on the transport of air pollution during a multi-day ozone episode in the Pearl River Delta of China, Atmos. Environ., 38, 6737–6750, https://doi.org/10.1016/j.atmosenv.2004.09.017, 2004.
Dong, Y., Li, J., Guo, J., Jiang, Z., Chu, Y., Chang, L., Yang, Y., and Liao, H.: The impact of synoptic patterns on summertime ozone pollution in the North China Plain, Sci. Total Environ., 735, 139559, https://doi.org/10.1016/j.scitotenv.2020.139559, 2020.
Fleming, Z. L., Doherty, R. M., Von Schneidemesser, E., Malley, C. S., Cooper, O. R., Pinto, J. P., Colette, A., Xu, X., Simpson, D., Schultz, M. G., Lefohn, A. S., Hamad, S., Moolla, R., Solberg, S., and Feng, Z.: Tropospheric Ozone Assessment Report: Present-day ozone distribution and trends relevant to human health, Elementa-Sci. Anthrop., 6, 12, https://doi.org/10.1525/elementa.273, 2018.
Gong, C. and Liao, H.: A typical weather pattern for ozone pollution events in North China, Atmos. Chem. Phys., 19, 13725–13740, https://doi.org/10.5194/acp-19-13725-2019, 2019.
Grell, G. A. and Dévényi, D.: A generalized approach to parameterizing convection combining ensemble and data assimilation techniques, Geophys. Res. Lett., 29, 38-31–38-34, https://doi.org/10.1029/2002GL015311, 2002.
Guenther, A., Karl, T., Harley, P., Wiedinmyer, C., Palmer, P. I., and Geron, C.: Estimates of global terrestrial isoprene emissions using MEGAN (Model of Emissions of Gases and Aerosols from Nature), Atmos. Chem. Phys., 6, 3181–3210, https://doi.org/10.5194/acp-6-3181-2006, 2006.
Han, H., Liu, J., Yuan, H., Wang, T., Zhuang, B., and Zhang, X.: Foreign influences on tropospheric ozone over East Asia through global atmospheric transport, Atmos. Chem. Phys., 19, 12495–12514, https://doi.org/10.5194/acp-19-12495-2019, 2019.
Han, Y., Gong, Z., Ye, J., Liu, P., McKinney, K. A., and Martin, S. T.: Quantifying the role of the relative humidity-dependent physical state of organic particulate matter in the uptake of semivolatile organic molecules, Environ. Sci. Technol., 53, 13209–13218, https://doi.org/10.1021/acs.est.9b05354, 2019.
He, C., Mu, H., Yang, L., Wang, D., Di, Y., Ye, Z., Yi, J., Ke, B., Tian, Y., and Hong, S.: Spatial variation of surface ozone concentration during the warm season and its meteorological driving factors in China, Environ. Sci., 42, 4168–4179, https://doi.org/10.13227/j.hjkx.202009228, 2021 (in Chinese).
He, G., Deng, T., Wu, D., Wu, C., Huang, X., Li, Z., Yin, C., Zou, Y., Song, L., Ouyang, S., Tao, L., and Zhang, X.: Characteristics of boundary layer ozone and its effect on surface ozone concentration in Shenzhen, China: A case study, Sci. Total Environ., 791, 148044, https://doi.org/10.1016/j.scitotenv.2021.148044, 2021.
He, X., Pang, S., Ma, J., and Zhang, Y.: Influence of relative humidity on heterogeneous reactions of O3 and with soot particles: Potential for environmental and health effects, Atmos. Environ., 165, 198–206, https://doi.org/10.1016/j.atmosenv.2017.06.049, 2017.
Hersbach, H., Bell, B., Berrisford, P., Biavati, G., Horányi, A., Muñoz Sabater, J., Nicolas, J., Peubey, C., Radu, R., Rozum, I., Schepers, D., Simmons, A., Soci, C., Dee, D., and Thépaut, J.-N.: ERA5 hourly data on pressure levels from 1959 to present, Copernicus Climate Change Service (C3S) Climate Data Store (CDS) [data set], https://doi.org/10.24381/cds.bd0915c6, 2018.
Hong, S.-Y., Dudhia, J., and Chen, S.-H.: A revised approach to ice microphysical processes for the bulk parameterization of clouds and precipitation, Mon. Weather Rev., 132, 103–120, https://doi.org/10.1175/1520-0493(2004)132<0103:ARATIM>2.0.CO;2, 2004.
Hu, C., Kang, P., Jaffe, D. A., Li, C., Zhang, X., Wu, K., and Zhou, M.: Understanding the impact of meteorology on ozone in 334 cities of China, Atmos. Environ., 248, 118221, https://doi.org/10.1016/j.atmosenv.2021.118221, 2021.
Huang, J.-P., Fung, J. C. H., Lau, A. K. H., and Qin, Y.: Numerical simulation and process analysis of typhoon-related ozone episodes in Hong Kong, J. Geophys. Res.-Atmos., 110, D05301, https://doi.org/10.1029/2004JD004914, 2005.
Jacob, D. J. and Winner, D. A.: Effect of climate change on air quality, Atmos. Environ., 43, 51–63, https://doi.org/10.1016/j.atmosenv.2008.09.051, 2009.
Kim, H.-J. and Wang, B.: Sensitivity of the WRF model simulation of the East Asian summer monsoon in 1993 to shortwave radiation schemes and ozone absorption, Asia-Pac. J. Atmos. Sci., 47, 167–180, https://doi.org/10.1007/s13143-011-0006-y, 2011.
Lam, Y. F., Cheung, H. M., and Ying, C. C.: Impact of tropical cyclone track change on regional air quality, Sci. Total Environ., 610, 1347–1355, https://doi.org/10.1016/j.scitotenv.2017.08.100, 2018.
Li, G., Bei, N., Cao, J., Wu, J., Long, X., Feng, T., Dai, W., Liu, S., Zhang, Q., and Tie, X.: Widespread and persistent ozone pollution in eastern China during the non-winter season of 2015: observations and source attributions, Atmos. Chem. Phys., 17, 2759–2774, https://doi.org/10.5194/acp-17-2759-2017, 2017.
Li, K., Jacob, D. J., Liao, H., Shen, L., Zhang, Q., and Bates, K. H.: Anthropogenic drivers of 2013–2017 trends in summer surface ozone in China, P. Natl. Acad. Sci. USA, 116, 422–427, https://doi.org/10.1073/pnas.1812168116, 2018.
Li, M., Song, Y., Mao, Z., Liu, M., and Huang, X.: Impacts of thermal circulations induced by urbanization on ozone formation in the Pearl River Delta region, China, Atmos. Environ., 127, 382–392, https://doi.org/10.1016/j.atmosenv.2015.10.075, 2016.
Li, M., Yu, S., Chen, X., Li, Z., Zhang, Y., Wang, L., Liu, W., Li, P., Lichtfouse, E., Rosenfeld, D., and Seinfeld, J. H.: Large scale control of surface ozone by relative humidity observed during warm seasons in China, Environ. Chem. Lett., 19, 3981–3989, https://doi.org/10.1007/s10311-021-01265-0, 2021.
Li, X.-B., Fan, G., Lou, S., Yuan, B., Wang, X., and Shao, M.: Transport and boundary layer interaction contribution to extremely high surface ozone levels in eastern China, Environ. Pollut., 268, 115804, https://doi.org/10.1016/j.envpol.2020.115804, 2021.
Li, X.-B., Yuan, B., Parrish, D. D., Chen, D., Song, Y., Yang, S., Liu, Z., and Shao, M.: Long-term trend of ozone in southern China reveals future mitigation strategy for air pollution, Atmos. Environ., 269, 118869, https://doi.org/10.1016/j.atmosenv.2021.118869, 2022.
Li, Y., Zhao, X., Deng, X., and Gao, J.: The impact of peripheral circulation characteristics of typhoon on sustained ozone episodes over the Pearl River Delta region, China, Atmos. Chem. Phys., 22, 3861–3873, https://doi.org/10.5194/acp-22-3861-2022, 2022.
Lin, C.-Y., Sheng, Y.-F., Chen, W.-C., Chou, C. C. K., Chien, Y.-Y., and Chen, W.-M.: Air quality deterioration episode associated with a typhoon over the complex topographic environment in central Taiwan, Atmos. Chem. Phys., 21, 16893–16910, https://doi.org/10.5194/acp-21-16893-2021, 2021.
Lin, X., Yuan, Z., Yang, L., Luo, H., and Li, W.: Impact of extreme meteorological events on ozone in the Pearl River Delta, China, Aerosol Air Qual. Res., 19, 1307–1324, https://doi.org/10.4209/aaqr.2019.01.0027, 2019.
Liu, H., Liu, S., Xue, B., Lv, Z., Meng, Z., Yang, X., Xue, T., Yu, Q., and He, K.: Ground-level ozone pollution and its health impacts in China, Atmos. Environ., 173, 223–230, https://doi.org/10.1016/j.atmosenv.2017.11.014, 2018.
Liu, H., Han, X., Tang, G., Zhang, J., Xia, X., Zhang, M., and Meng, L.: Model analysis of vertical exchange of boundary layer ozone and its impact on surface air quality over the North China Plain, Sci. Total Environ., 821, 153436, https://doi.org/10.1016/j.scitotenv.2022.153436, 2022.
Lu, H., Lyu, X., Cheng, H., Ling, Z., and Guo, H.: Overview on the spatial–temporal characteristics of the ozone formation regime in China, Environ. Sci.-Proc. Imp., 21, 916–929, https://doi.org/10.1039/C9EM00098D, 2019.
Lu, X., Hong, J., Zhang, L., Cooper, O. R., Schultz, M. G., Xu, X., Wang, T., Gao, M., Zhao, Y., and Zhang, Y.: Severe surface ozone pollution in China: a global perspective, Environ. Sci. Tech. Let., 5, 487–494, https://doi.org/10.1021/acs.estlett.8b00366, 2018.
Mao, J., Wang, L., Lu, C., Liu, J., Li, M., Tang, G., Ji, D., Zhang, N., and Wang, Y.: Meteorological mechanism for a large-scale persistent severe ozone pollution event over eastern China in 2017, J. Environ. Sci., 92, 187–199, https://doi.org/10.1016/j.jes.2020.02.019, 2020.
Mills, G., Sharps, K., Simpson, D., Pleijel, H., Broberg, M., Uddling, J., Jaramillo, F., Davies, W. J., Dentener, F., Van den Berg, M., Agrawal, M., Agrawal, S. B., Ainsworth, E. A., Büker, P., Emberson, L., Feng, Z., Harmens, H., Hayes, F., Kobayashi, K., and Paoletti, E.: Ozone pollution will compromise efforts to increase global wheat production, Global Change Biol., 24, 3560–3574, https://doi.org/10.1111/gcb.14157, 2018.
Mlawer, E. J., Taubman, S. J., Brown, P. D., Iacono, M. J., and Clough, S. A.: Radiative transfer for inhomogeneous atmospheres: RRTM, a validated correlated-k model for the longwave, J. Geophys. Res.-Atmos., 102, 16663–16682, https://doi.org/10.1029/97JD00237, 1997.
Monin, A. S. and Obukhov, A. M.: Basic laws of turbulent mixing in the surface layer of the atmosphere, Contrib. Geophys. Inst. Acad. Sci. USSR, 24, 163–187, 1954.
National Centers for Environmental Prediction/National Weather Service/NOAA/U.S. Department of Commerce: NCEP FNL Operational Model Global Tropospheric Analyses, continuing from July 1999 (updated daily), Research Data Archive at the National Center for Atmospheric Research, Computational and Information Systems Laboratory [data set], https://doi.org/10.5065/D6M043C6, 2000.
Pleim, J. E.: A combined local and nonlocal closure model for the atmospheric boundary layer. Part I: Model description and testing, J. Appl. Meteorol. Clim., 46, 1383–1395, https://doi.org/10.1175/JAM2539.1, 2007.
Professional Committee of Ozone Pollution Control of Chinese Society for Environmental Sciences: The Bluebook: Prevention and Control of Ozone Pollution in China (2020), Science Press, Beijing, China, ISBN 978-7-03-071664-4, 2022 (in Chinese).
Qu, K., Wang, X., Yan, Y., Shen, J., Xiao, T., Dong, H., Zeng, L., and Zhang, Y.: A comparative study to reveal the influence of typhoons on the transport, production and accumulation of O3 in the Pearl River Delta, China, Atmos. Chem. Phys., 21, 11593–11612, https://doi.org/10.5194/acp-21-11593-2021, 2021.
Shu, L., Xie, M., Wang, T., Gao, D., Chen, P., Han, Y., Li, S., Zhuang, B., and Li, M.: Integrated studies of a regional ozone pollution synthetically affected by subtropical high and typhoon system in the Yangtze River Delta region, China, Atmos. Chem. Phys., 16, 15801–15819, https://doi.org/10.5194/acp-16-15801-2016, 2016.
Sillman, S.: The relation between ozone, NOx and hydrocarbons in urban and polluted rural environments, Atmos. Environ., 33, 1821–1845, https://doi.org/10.1016/S1352-2310(98)00345-8, 1999.
Trainer, M., Parrish, D., Goldan, P., Roberts, J., and Fehsenfeld, F.: Review of observation-based analysis of the regional factors influencing ozone concentrations, Atmos. Environ., 34, 2045–2061, https://doi.org/10.1016/S1352-2310(99)00459-8, 2000.
Wang, H., Lyu, X., Guo, H., Wang, Y., Zou, S., Ling, Z., Wang, X., Jiang, F., Zeren, Y., Pan, W., Huang, X., and Shen, J.: Ozone pollution around a coastal region of South China Sea: interaction between marine and continental air, Atmos. Chem. Phys., 18, 4277–4295, https://doi.org/10.5194/acp-18-4277-2018, 2018.
Wang, N., Guo, H., Jiang, F., Ling, Z. H., and Wang, T.: Simulation of ozone formation at different elevations in mountainous area of Hong Kong using WRF-CMAQ model, Sci. Total Environ., 505, 939–951, https://doi.org/10.1016/j.scitotenv.2014.10.070, 2015.
Wang, T., Xue, L., Brimblecombe, P., Lam, Y. F., Li, L., and Zhang, L.: Ozone pollution in China: A review of concentrations, meteorological influences, chemical precursors, and effects, Sci. Total Environ., 575, 1582–1596, https://doi.org/10.1016/j.scitotenv.2016.10.081, 2017.
Wu, M., Wu, D., Fan, Q., Wang, B. M., Li, H. W., and Fan, S. J.: Observational studies of the meteorological characteristics associated with poor air quality over the Pearl River Delta in China, Atmos. Chem. Phys., 13, 10755–10766, https://doi.org/10.5194/acp-13-10755-2013, 2013.
Wu, Q., Tang, X., Kong, L., Liu, Z., Chen, D., Lu, M., Wu, H., Shen, J., Wu, L., Pan, X., Li, J., Zhu, J., and Wang, Z.: Model Evaluation and Uncertainty Analysis of PM2.5 Components over Pearl River Delta Region Using Monte Carlo Simulations, Aerosol Air Qual. Res., 21, 200075, https://doi.org/10.4209/aaqr.2020.02.0075, 2021.
Xu, W., Xu, X., Lin, M., Lin, W., Tarasick, D., Tang, J., Ma, J., and Zheng, X.: Long-term trends of surface ozone and its influencing factors at the Mt Waliguan GAW station, China – Part 2: The roles of anthropogenic emissions and climate variability, Atmos. Chem. Phys., 18, 773–798, https://doi.org/10.5194/acp-18-773-2018, 2018.
Yang, L., Luo, H., Yuan, Z., Zheng, J., Huang, Z., Li, C., Lin, X., Louie, P. K. K., Chen, D., and Bian, Y.: Quantitative impacts of meteorology and precursor emission changes on the long-term trend of ambient ozone over the Pearl River Delta, China, and implications for ozone control strategy, Atmos. Chem. Phys., 19, 12901–12916, https://doi.org/10.5194/acp-19-12901-2019, 2019.
Yarwood, G., Rao, S., Yocke, M., and Whitten, G.: Updates to the Carbon Bond Chemical Mechanism: CB05, Technical Report, Final Report to US EPA, RT-0400675, https://camx-wp.azurewebsites.net/Files/CB05_Final_Report_120805.pdf (last access: 4 April 2022), 2005.
Yin, Z., Cao, B., and Wang, H.: Dominant patterns of summer ozone pollution in eastern China and associated atmospheric circulations, Atmos. Chem. Phys., 19, 13933–13943, https://doi.org/10.5194/acp-19-13933-2019, 2019.
Zeren, Y., Guo, H., Lyu, X., Jiang, F., Wang, Y., Liu, X., Zeng, L., Li, M., and Li, L.: An ozone “pool” in South China: Investigations on atmospheric dynamics and photochemical processes over the Pearl River Estuary, J. Geophys. Res.-Atmos., 124, 12340–12355, https://doi.org/10.1029/2019JD030833, 2019.
Zhan, C. and Xie, M.: Land use and anthropogenic heat modulate ozone by meteorology: a perspective from the Yangtze River Delta region, Atmos. Chem. Phys., 22, 1351–1371, https://doi.org/10.5194/acp-22-1351-2022, 2022.
Zhan, C., Xie, M., Huang, C., Liu, J., Wang, T., Xu, M., Ma, C., Yu, J., Jiao, Y., Li, M., Li, S., Zhuang, B., Zhao, M., and Nie, D.: Ozone affected by a succession of four landfall typhoons in the Yangtze River Delta, China: major processes and health impacts, Atmos. Chem. Phys., 20, 13781–13799, https://doi.org/10.5194/acp-20-13781-2020, 2020.
Zhang, Q. and Geng, G.: Impact of clean air action on PM2.5 pollution in China, Sci. China Earth Sci., 62, 1845–1846, https://doi.org/10.1007/s11430-019-9531-4, 2019.
Zhao, D., Lin, Y., Li, Y., and Gao, X.: An extreme heat event induced by Typhoon Lekima (2019) and its contributing factors, J. Geophys. Res.-Atmos., 126, e2021JD034760, https://doi.org/10.1029/2021JD034760, 2021.
Zhao, W., Tang, G., Yu, H., Yang, Y., Wang, Y., Wang, L., An, J., Gao, W., Hu, B., Cheng, M., An, X., Li, X., and Wang, Y.: Evolution of boundary layer ozone in Shijiazhuang, a suburban site on the North China Plain, J. Environ. Sci., 83, 152–160, https://doi.org/10.1016/j.jes.2019.02.016, 2019.
Zhao, Z. and Wang, Y.: Influence of the West Pacific subtropical high on surface ozone daily variability in summertime over eastern China, Atmos. Environ., 170, 197–204, https://doi.org/10.1016/j.atmosenv.2017.09.024, 2017.
Zheng, B., Tong, D., Li, M., Liu, F., Hong, C., Geng, G., Li, H., Li, X., Peng, L., Qi, J., Yan, L., Zhang, Y., Zhao, H., Zheng, Y., He, K., and Zhang, Q.: Trends in China's anthropogenic emissions since 2010 as the consequence of clean air actions, Atmos. Chem. Phys., 18, 14095–14111, https://doi.org/10.5194/acp-18-14095-2018, 2018.
Zhu, X., Ma, Z., Qiu, Y., Liu, H., Liu, Q., and Yin, X.: An evaluation of the interaction of morning residual layer ozone and mixing layer ozone in rural areas of the North China Plain, Atmos. Res., 236, 104788, https://doi.org/10.1016/j.atmosres.2019.104788, 2020.