the Creative Commons Attribution 4.0 License.
the Creative Commons Attribution 4.0 License.
 | 19 Aug 2022
Retrieving instantaneous extinction of aerosol undetected by the CALIPSO layer detection algorithm
Feiyue Mao
Ruixing Shi
Daniel Rosenfeld
Yannian Zhu
Xin Lu
Aerosols significantly affect the Earth–atmosphere energy balance and climate change by acting as cloud condensation nuclei. Specifically, the susceptibility of cloud and precipitation to aerosols is stronger when aerosols are faint but tends to be saturated in polluted conditions. However, previous methodologies generally miss these faint aerosols based on instantaneous observations because they are too optically thin to be detected and are therefore usually unretrieved. This result in a large underestimation when quantifying aerosol climate impacts. Here, we focus on retrieving and verifying the instantaneous extinction of undetected faint aerosol by the CALIPSO layer detection algorithm on a global scale. Using the observations during the Stratospheric Aerosol and Gas Experiment III on the International Space Station (SAGE III/ISS) as constraints, the lidar ratios of undetected faint aerosol are estimated with a global median of 42.2 and 24.5 sr at the stratosphere and the troposphere, respectively. The retrieved extinction of undetected aerosol during night-time shows good agreement with the independent 12-month SAGE III/ISS product on a 1∘ average. The corresponding correlation coefficient and averaged normalized root-mean-square error are 0.66 % and 100.6 %, respectively. The minimum retrieved extinction coefficients can be extended to 10−3 and 10−4 km−1 with an uncertainty of 35 % and 125 % during night-time, respectively. The CALIPSO retrieval during daytime has a positive bias and relatively low agreement with SAGE III/ISS due to the low signal-to-noise ratio caused by sunlight. This study has great potential for improving the understanding of aerosol variations and the quantification of aerosol impacts on global climate change.
- Article
(10103 KB) - Full-text XML
- BibTeX
- EndNote


Aerosols significantly affect the Earth–atmosphere system through direct and indirect climate radiative forcing (Boucher et al., 2013). Increased aerosol not only perturbs atmospheric radiative balance by directly interacting with solar radiation (direct effect) but also affects the cloud properties and precipitation by acting as cloud condensation nuclei and ice-forming particles (indirect effect) (Dipu et al., 2013; Rosenfeld et al., 2014). However, aerosols still represent a major uncertainty in global climate change and energy balance with a low scientific understanding (Lee et al., 2016; Watson-Parris et al., 2020), which is partly attributed to insufficient observations to accurately characterize the three-dimensional (3D) aerosol distribution. The Cloud-Aerosol Lidar and Infrared Pathfinder Satellite Observation (CALIPSO) satellite can globally detect the vertical properties of aerosols and clouds beyond the limitations of passive observation (Winker et al., 2010), providing unprecedented opportunities to advance the understanding of 3D aerosol distribution characteristics and global climate forcing (Lu et al., 2018; Song et al., 2021; Winker et al., 2013).
Aerosols are mostly concentrated in the planetary boundary layer, where optically thick aerosol layers occur and can usually be detected by the CALIPSO detection algorithm (Li et al., 2017; Kim et al., 2021). In addition, the persistent faint aerosol in the troposphere and stratosphere has long been considered to have an important effect on the Earth's climate (Deshler, 2008; Thorsen and Fu, 2015). However, these faint aerosols are usually too optically thin to be detected by the CALIPSO layer detection algorithm. A previous study indicated the retrieved aerosol optical depths (AODs) of aerosols undetected by the CALIPSO layer detection algorithm can reach 0.03–0.05 (Toth et al., 2018), which accounts for approximately 20 % of the total AOD, and these aerosols are very important for climatology (Toth et al., 2018; Smirnov et al., 2011; Levy et al., 2013). Thorsen and Fu (2015) pointed out that CALIPSO may have underestimated the magnitude of the aerosol direct radiative effect by 30 %–50 % due to the undetected faint aerosols in the current CALIPSO algorithm. In addition, aerosols significantly affect cloud formation by acting as cloud condensation nuclei. However, clouds interact directly with ambient sub-cloud aerosol instead of near-surface heavy aerosol, the properties of which could be very different, especially for aerosol and ice cloud interactions (Rosenfeld et al., 2014). Thus, the ignorance of faint aerosols surrounding high-altitude clouds causes large uncertainty in quantifying the climate effect of aerosols.
Few studies focus on retrieving aerosols undetected by the CALIPSO detection algorithm (Kar et al., 2019; Kim et al., 2017). Kim et al. (2017) attempted to calculate the missing AOD of these undetected aerosols by using the AOD observed by Moderate Resolution Imaging Spectroradiometer (MODIS) over ocean as constraints. However, that study mainly focused on the AOD of the undetected aerosol with a fixed lidar ratio, but the extinction of the undetected aerosol was rarely discussed and verified. Additionally, Kim et al. (2017) provided the same lidar ratio (28.75 sr) for the troposphere and stratosphere globally, potentially introducing large uncertainty into the extinction retrieval. In 2019, the CALIPSO level 3 stratospheric aerosol profile product was released. However, the purpose of CALIPSO level 3 products is to provide monthly grid data (5∘ × 20∘ in latitude and longitude) (Kar et al., 2019), which are insufficient to support studies sensitive to temporal and spatial variations of aerosols, such as studies of aerosol and cloud interactions (Ma et al., 2015). Furthermore, many studies suggest that CALIPSO may potentially obtain more information on faint aerosols with appropriate data processing (Thomason et al., 2007; Vernier et al., 2009; Kar et al., 2019).
Thus, the present study focuses on retrieving the instantaneous extinction of aerosol undetected by the CALIPSO detection algorithm based on the single-track CALIPSO data. The global distribution of the lidar ratio is obtained with the constraint of the Stratospheric Aerosol and Gas Experiment III on the International Space Station (SAGE III/ISS) observation in the troposphere and stratosphere, respectively. Furthermore, the CALIPSO night-time and daytime extinction coefficients are retrieved and compared against independent SAGE III/ISS data and CALIPSO level 2 and 3 aerosol products. Finally, the impacts of the retrieved lidar ratio and empirical lidar ratio are discussed.
2.1 CALIPSO data and pre-processing
The CALIPSO mission introduced new technology for retrieving aerosol profiles from space since April 2006, with a dual-wavelength backscattering lidar as the primary payload (Winker et al., 2010). The CALIPSO team has released different levels of products for different scientific objectives. Level 1 products are calibrated observations containing environmental parameters. Level 2 products are physical and optical parameters of aerosol layers and cloud layers obtained according to a series of technical routes. The aerosol and cloud layers are detected by the Selective Iterative Boundary Locator Algorithm (SIBYL) (Vaughan et al., 2009) and then classified by the Scene Classification Algorithm (Kim et al., 2018), and finally the extinction coefficient is retrieved according to the Hybrid Extinction Retrieval Algorithm (Winker et al., 2010; Young et al., 2018). Level 3 products provide monthly averaged gridded global distribution data of clouds and aerosols (Kar et al., 2019).
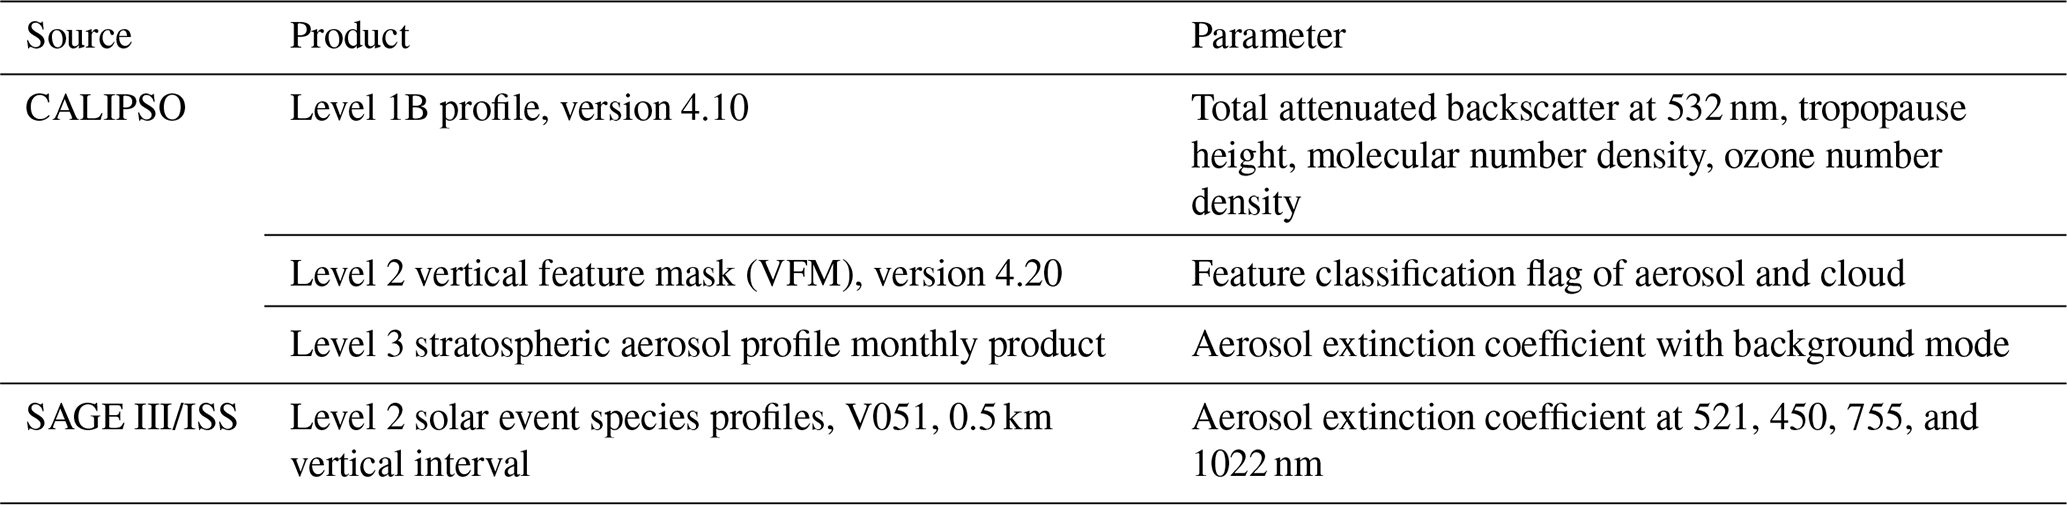
This study uses CALIPSO level 1B for the extinction retrieval of the undetected aerosol by SIBYL from June 2017 to May 2020 (Table 1). In addition, the CALIPSO level 3 monthly averaged stratospheric aerosol profile product with a resolution of 5∘ × 20∘ in latitude and longitude is compared with the retrieved extinction of undetected aerosol. To improve the signal-to-noise ratio (SNR) and avoid contamination by clouds and detected aerosols, the CALIPSO level 1B total attenuated backscatter (TAB) data were pre-processed according to the following steps.
-
We removed the affected CALIPSO observations according to “Low Laser Energy Technical Advisory” guidelines due to the effects of an elevated frequency of low-energy laser shots of CALIPSO within the South Atlantic Anomaly (SAA) (https://www-calipso.larc.nasa.gov/resources/calipso_users_guide/advisory.php, last access: 6 August 2022).
-
We removed the clouds and the aerosol layer detected by the SIBYL and the data below them. We used a threshold value of 0.5 in the attenuated colour ratio (the ratio of the TAB at 1064 and 532 nm) to remove undetected tenuous cirrus clouds, similar to the data-screening method of the CALIPSO level 3 stratospheric aerosol profile product (Kar et al., 2019).
-
The vertical resolution of the CALIPSO level 1B TAB profiles varies with the height of 30, 60, 120, and 300 m for −0.5–8, 8–20.2, 20.2–30.1, and 30.1–40 km, respectively. Referring to Kim et al. (2017), the TAB profiles are reduced to a vertical resolution of 300 m by linear interpolation to improve the SNR, followed by a vertical moving mean filtering (with a five-point window) and horizontal averaging to 20 km to retrieve the extinction of undetected aerosol.
Table 1Data used in the study with their sources and parameters. The tropopause height, molecular number density, and ozone number density are provided by the Global Modeling and Assimilation Office.
2.2 SAGE III/ISS data and pre-processing
The Stratospheric Aerosol and Gas Experiment (SAGE) was developed to obtain vertical profiles of aerosol optical properties since 1984. The SAGE could detect the extinction of faint aerosol in the upper troposphere and the stratosphere (Damadeo et al., 2013). SAGE III conducts solar and lunar occultation measurements globally while orbiting the Earth on the International Space Station (ISS). Light passes through the atmosphere and is attenuated by some combination of scattering and absorption of molecules, particles, and clouds. The extinction coefficients are then derived based on the recorded spectra (Thomason et al., 2010). The aerosol extinction of the SAGE III/ISS product with a vertical resolution of 0.5 km at the 521 nm channel, which is closest to the CALIPSO 532 nm channel, is used for constraint and validation in this study. Only the SAGE III/ISS solar occultation product was used in this study because of the absence of aerosol extinction information in the SAGE III/ISS lunar occultation product (Table 1).
A low bias in the extinction coefficients of the SAGE III/ISS aerosol product is observed at 521 nm due to the ozone interference in the retrieval algorithm. This finding is more pronounced at mid-latitudes and altitudes between 20 and 25 km (Wang et al., 2020). Due to bias being negligible at 450 and 755 nm aerosol channels, the following equation is therefore used to correct the extinction at 521 nm based on the Ångström exponent of 450, 521, and 755 nm (Wang et al., 2020):
where σ is the extinction coefficient from the SAGE III/ISS aerosol product and the numbers represent the wavelength. We removed the bins in the SAGE III/ISS aerosol extinction profile with colour ratio (the ratio of the aerosol extinction at 521 and 1022 nm) in the range of 0.8 to 1.2 to avoid cloud contamination (Schoeberl et al., 2021).
2.3 Match of CALIPSO and SAGE III/ISS
Since only daytime data from SAGE III/ISS are available, the CALIPSO orbits are spatially and temporally matched to the nearest SAGE III/ISS observations on the same calendar date with the consideration for a slower temporal–spatial variation of faint aerosol comparing strong aerosol near the surface. The horizontal resolution of SAGE III/ISS occultation observations is low with ∼ 300 km (https://space.oscar.wmo.int/instruments/view/sage_iii, last access: 6 August 2022). Thus, we selected a 2∘ × 1∘ (longitude × latitude) grid centred on the SAGE III/ISS observations to match CALIPSO instantaneous observation. To ensure enough CALIPSO profiles are included for each successfully matched sample, the CALIPSO track crossed the grid and have to exceed 0.75∘ latitude (Fig. 1a). The 2∘ longitude is to obtain the successfully matched samples as soon as possible. Figure 1b shows the global distribution of night-time CALIPSO and SAGE III/ISS match numbers in 20∘ × 20∘ grids for 3 years from June 2017 to May 2020. No successful match in the grids is found in the black boundary due to the removal of low-energy laser shots of CALIPSO in the SAA region. Finally, 1349 and 1325 profiles are successfully matched for CALIPSO night-time and daytime data with SAGE, respectively.
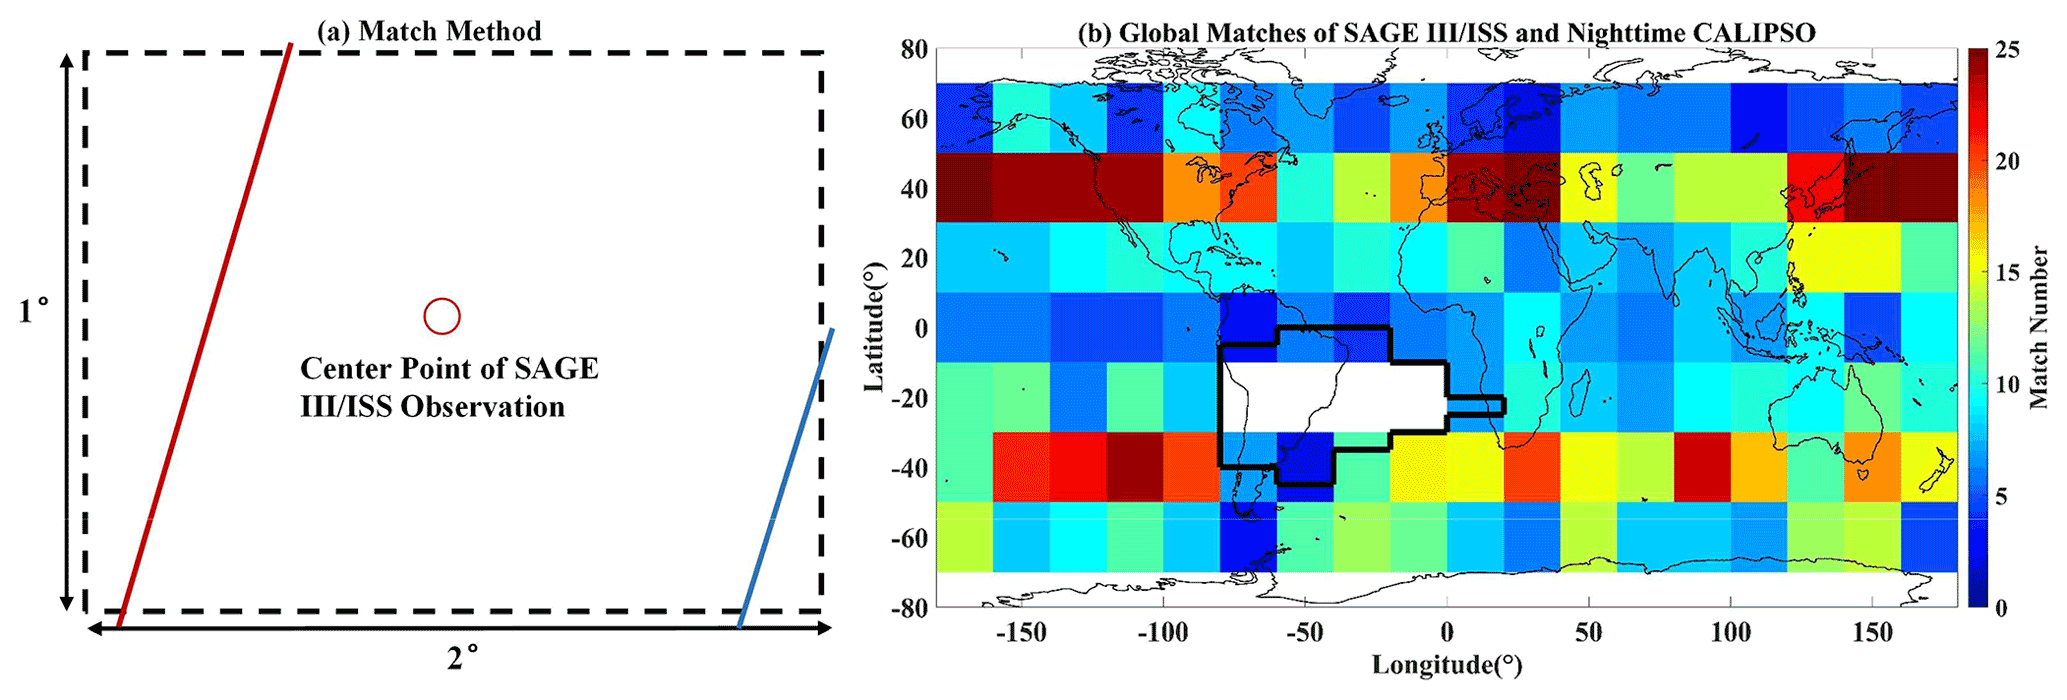
Figure 1(a) Schematic of the CALIPSO match to the SAGE III/ISS. The red circle represents the centre point of SAGE III/ISS observations. The red and blue lines represent cases of successful and failed (CALIPSO track is less than 0.75∘ in the grid) matched cases, respectively. (b) The number of globally matched CALIPSO and SAGE III/ISS observations during night-time from June 2017 to May 2020. The black boundary represents the South Atlantic Anomaly (SAA), where CALIPSO experiences an elevated frequency of low-energy laser shots. The colour bar represents the number of matched cases in each 20∘ × 20∘ grid.
2.4 Retrieving instantaneous extinction of undetected aerosol under the constraint of SAGE III/ISS
In this study, the undetected aerosol extinction coefficient is retrieved by the Fernald method, similar to CALIPSO level 2 and level 3 aerosol products (Young and Vaughan, 2009; Kar et al., 2019; Young et al., 2018). Based on the pre-processed TAB (i.e. β′(r)), the particulate backscatter coefficient (i.e. βp(r)) is solved by iterating Eqs. (2) and (3c) in the following equations:
where , , and represent the molecular, ozone, and particulate two-way transmittances, respectively. The molecular backscatter coefficients (βm(r)) and molecular and ozone two-way transmittances ( and can be calculated from the molecular number density and ozone number density provided by CALIPSO level 1B product, respectively. The αm(r), , and αp(r) represent the extinction coefficient of molecule, ozone, and particle, respectively. The retrieval algorithm has several basic settings. The multiple scattering coefficient (ηp) for undetected aerosol particles is set to 1, as is the case in the retrieval of the CALIPSO level 2 product (Young et al., 2018). Meanwhile, the bin at 36 km is considered aerosol free (i.e. βp(0)=0, ) (Kar et al., 2019).
When using the Fernald method to retrieve aerosol extinction coefficients, the lidar ratio (Sp(r)) is a key parameter (Fernald, 1984; Fernald et al., 1972) and is often set based on aerosol type or empirical values (Young et al., 2018; Kar et al., 2019). The backscattered signal of undetected aerosols is extremely weakly detected and classified by the CALIPSO layer detection and classification algorithms (Kim et al., 2017; Toth et al., 2018). The extinction retrieval of undetected aerosols is very sensitive to the lidar ratio (Kim et al., 2017). Therefore, to obtain the appropriate lidar ratio of undetected aerosol, we retrieve the lidar ratio by using SAGE III/ISS 521 nm AOD as a constraint, and the algorithm flow is shown in Fig. 2.
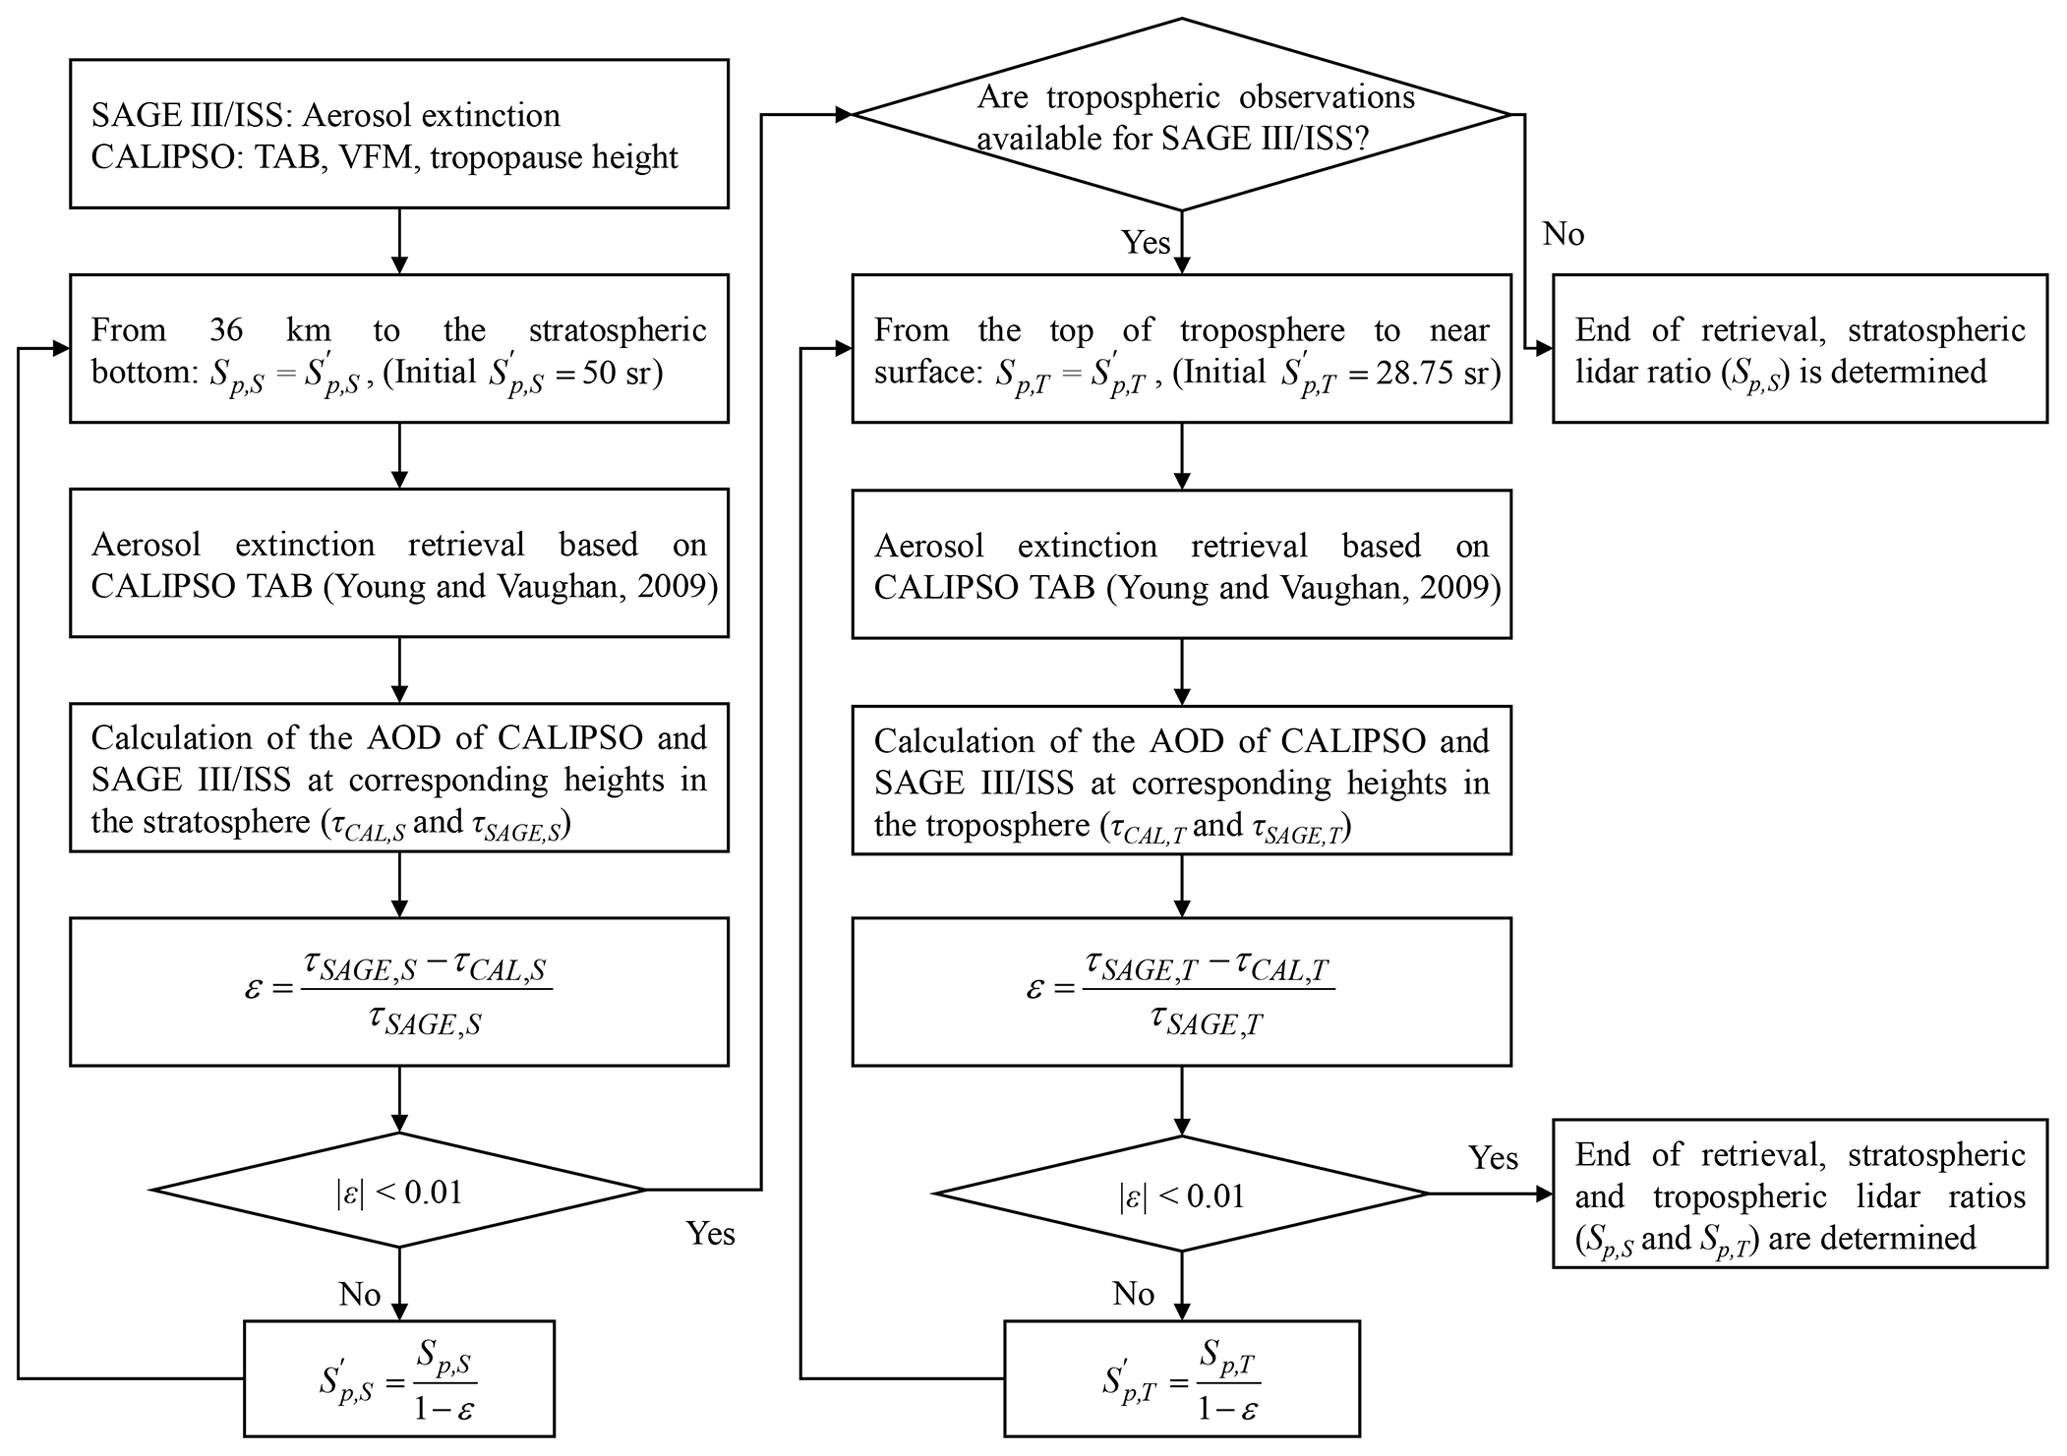
Figure 2Flowchart for the retrieval of lidar ratio by using SAGE III/ISS AOD as a constraint.
We perform the retrieval of the lidar ratio separately because the aerosol compositions in the troposphere and stratosphere are different. For the stratosphere, the initial lidar ratio (Sp,S) is set to 50 sr, which is widely assumed for stratosphere aerosol (Kar et al., 2019; Khaykin et al., 2017), and the extinction retrieval is performed from 36 km to the bottom of the stratosphere. The AOD of CALIPSO and SAGE III/ISS (τCAL,S and τSAGE,S) for the same altitude bins in the stratosphere and the deviation (ε) between them are also calculated. The lidar ratio is iteratively modified, and the extinction and AOD of CALIPSO are recalculated until |ε|<0.01. The same procedure is performed in the troposphere; the difference between the retrieval altitude and using an initial lidar ratio (Sp,T) of 28.75 sr refers to the estimate by Kim et al. (2017).
The tropospheric and stratospheric lidar ratios are retrieved globally based on matched SAGE III/ISS and CALIPSO profiles and counted at each 20∘ × 20∘ grid. When performing the extinction retrieval of CALIPSO, Sp,S and Sp,T can be selected depending on which grid the profile is located on. The constrained retrieval of the lidar ratio uses night-time CALIPSO and daytime SAGE III/ISS profiles given that daytime CALIPSO observations are affected by solar background noise and have a much lower SNR than night-time observations (Hunt et al., 2009). The implicit assumption is that diurnal variations in undetected aerosols are ignored. To obtain a consistent lidar ratio retrieval dataset and validation dataset, we used data from the first 2 months of each quarter to derive the lidar ratio and those of the last month for validation. Thus, for 3 years from June 2017 to May 2020, 24 months of data are retrieved to determine the lidar ratio, while 12 months of data are used for validation.
For the retrieved extinction of undetected aerosol, we calculated the uncertainty to assess the reliability of the results according to the algorithm of CALIPSO level 2 aerosol product (Young et al., 2013), where the main equations are as follows:
where Δβp(r) and Δαp(r) in Eqs. (6) and (7) are the particle backscatter uncertainty and particle extinction uncertainty, respectively; they are the target parameters for the calculation. Equation (5) is the formula for one of the terms of Eq. (6), where is the uncertainty of the renormalized TAB, is the uncertainty of the TAB, and ΔCN(rN) is the uncertainty of renormalization. The error due to renormalization is negligible (Kim et al., 2017) because the starting altitude of retrieval (rN=36 km) is consistent with the calibration region (36–39 km) for the CALIPSO level 1B version 4 product (Kar et al., 2018); therefore, ΔCN(rN) is set to 0. The standard deviation of the TAB is used to approximate because the TAB in this study was pre-processed.
Uncertainty is found in the calibration factor in , which contains systematic and random components (Young et al., 2013), and this approximation neglects the systematic error in the calibration factor, producing a low bias in the uncertainty calculation. Fortunately, the calibration factor bias of the night-time CALIPSO version 4 product has been reduced to 1.6 % ± 2.4 % (Kar et al., 2018). Additionally, Kim et al. (2017) pointed out that the bias caused by the lidar ratio is dominated in the retrieval. Thus, we consider ignoring the calibration factor in the systematic error. The other terms in Eq. (6), total backscatter coefficient (βT(r)), molecular and particle two-way transmittance uncertainty ( and ), and molecular backscatter uncertainty (ΔβM(r)), are calculated in the same way as in Young et al. (2013) and are not repeated here. Sp and ΔSp in Eq. (7) are selected from the median and median absolute deviation, respectively, in the retrieved 20∘ × 20∘ grid lidar ratio based on CALIPSO profile locations.
3.1 Global gridded distribution of lidar ratio
Figure 3 shows the global distribution of the median lidar ratios in 20∘ × 20∘ grids retrieved by CALIPSO under the SAGE III/ISS 521 nm products constraint. The median of the global stratospheric lidar ratio is 42.2 sr, whereas the lidar ratio is smaller at high latitudes than that near the Equator (Fig. 3a), which is consistent with the latitude-lidar ratio distribution in Kar et al. (2019). The median global tropospheric lidar ratio is smaller (24.5 sr) and shows a different trend from that of the stratosphere, slightly decreasing from the northern to the southern hemisphere (Fig. 3b). In the following, we retrieve the extinction of CALIPSO undetected aerosol with the median lidar ratios of the stratosphere and troposphere in the grid, where the CALIPSO profile is located on. In addition, the median absolute deviation of the lidar ratio in the grid is used to calculate the uncertainty of the extinction (Eq. 7).
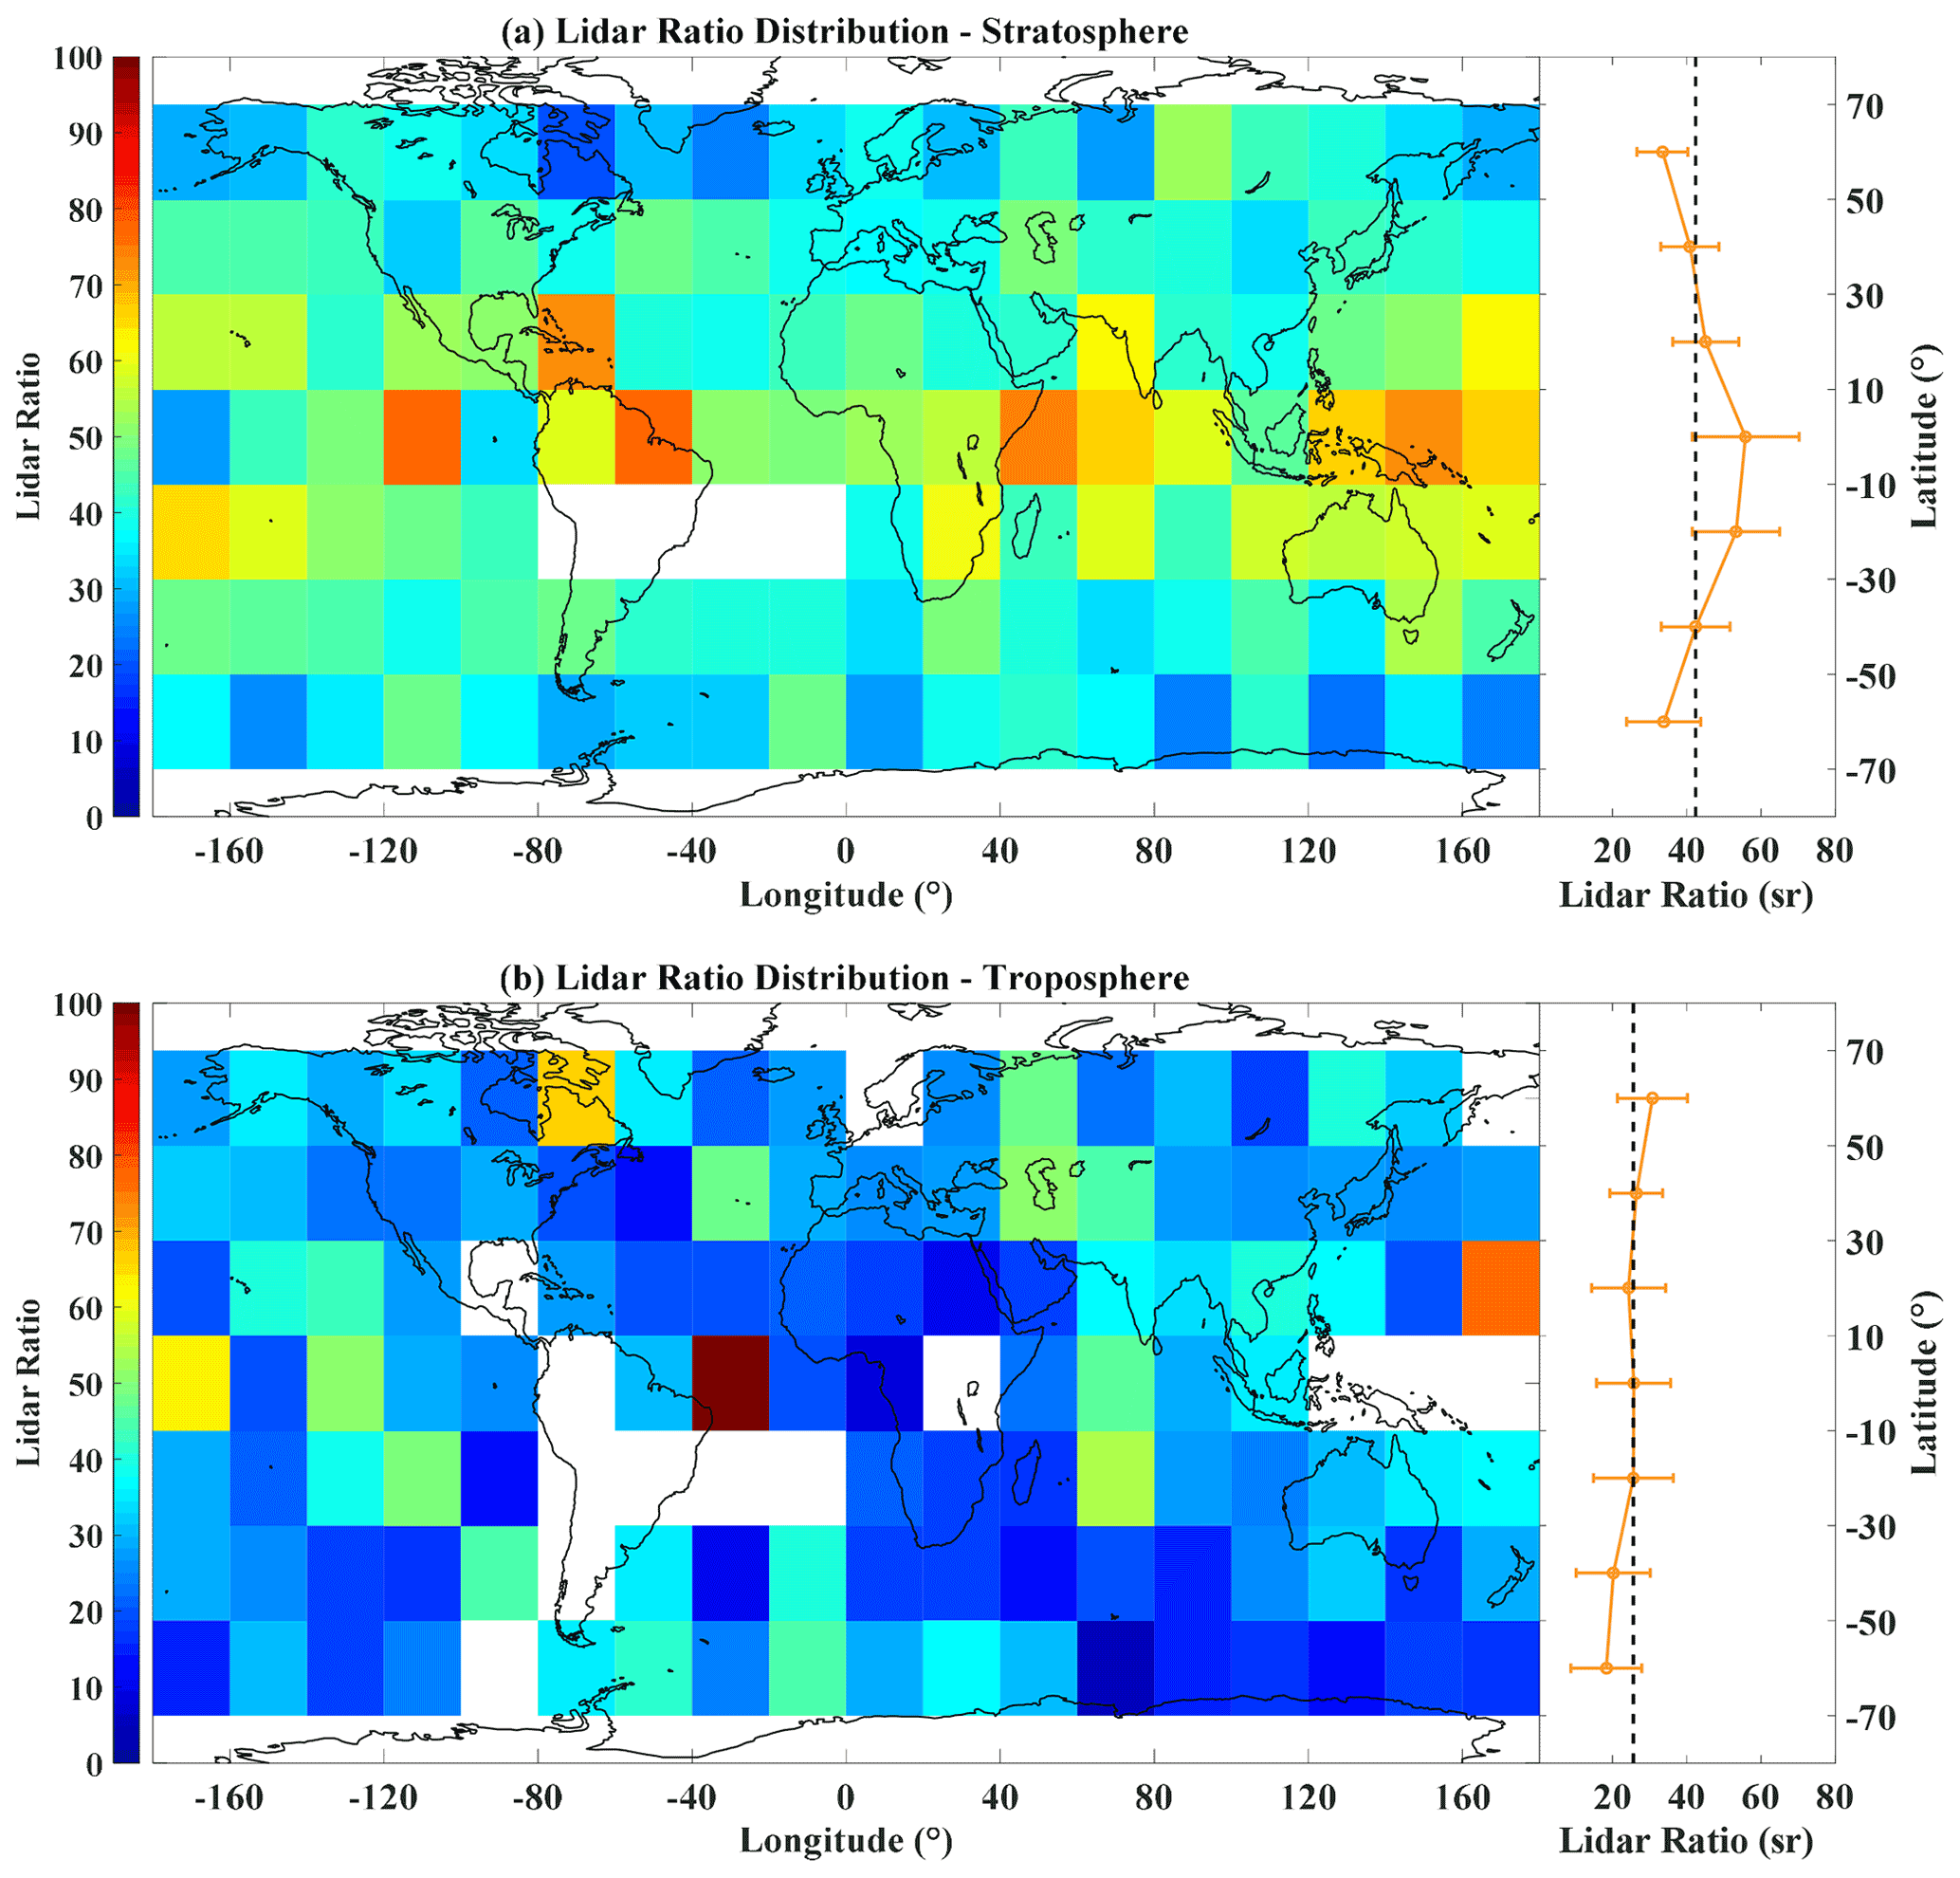
Figure 3(a) Global stratospheric distribution of lidar ratios with a grid size of 20∘ × 20∘. The colour bar represents the median lidar ratio value. The line on the right shows the median variation at 20∘ intervals from −70∘ to 70∘ (latitude) globally, and the error bar represents the median absolute deviation. Panel (b) is the same as panel (a), but for the troposphere. A blank grid indicates that no data is available.
3.2 Comparison with SAGE III/ISS aerosol product
Figure 4a shows a case of the retrieved CALIPSO extinction at 33∘ N latitude on 26 August 2019. An undetected faint aerosol layer (extinction coefficients around 0.005 km−1) is connected to the detected stratospheric aerosol layer provided by the CALIPSO level 2 aerosol product at altitudes of 15 to 20 km around 10 to 40∘ N latitude. Figure 4b shows highly consistent extinctions of the CALIPSO undetected aerosol and the matched SAGE III/ISS 521 nm aerosol product (dashed red line in Fig. 4a) above 15 km. Additionally, this profile comparison demonstrates the feasibility of ignoring the diurnal variation of undetected aerosols.
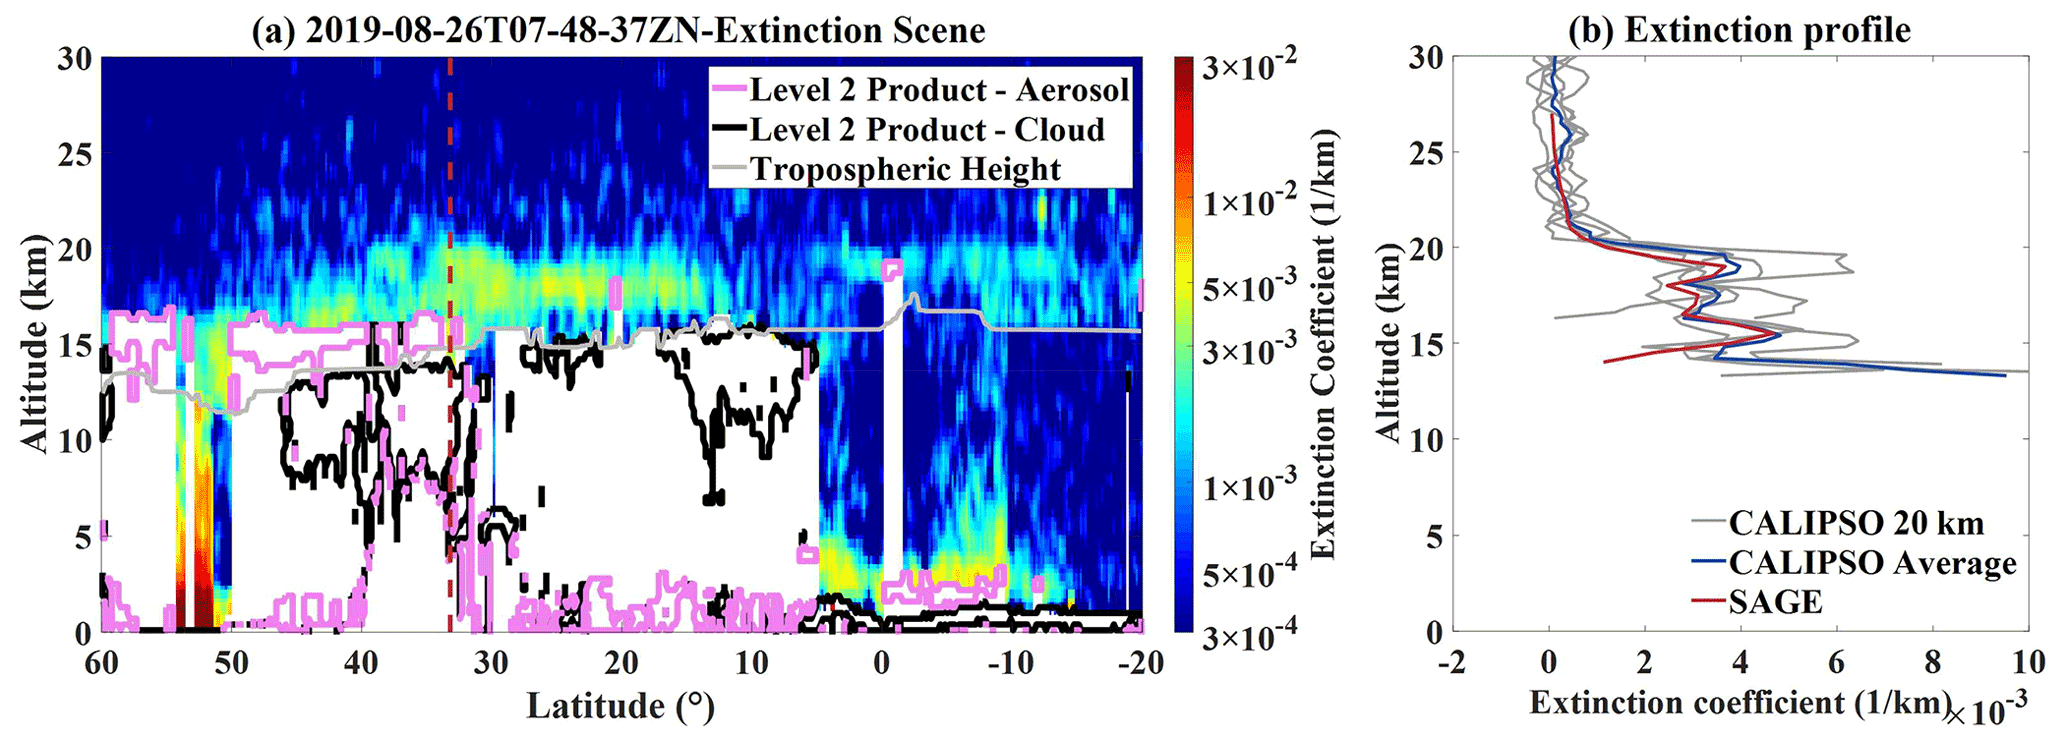
Figure 4(a) Latitude–altitude graph of undetected aerosol extinction based on CALIPSO night-time data on 26 August 2019. The colour represents the extinction coefficient (km−1). The purple and black boundary lines represent the detected aerosol and cloud layers provided by CALIPSO level 2 products, respectively. The grey line represents tropospheric height. The dashed red line is the observation position of SAGE III/ISS. The white areas represent the removed data inside and below the detected layers. The retrieved faint aerosol at 20 km is shown after additional mean filtering (3 × 3 window) to highlight the faint aerosol area. (b) Comparison of faint aerosol extinction (km−1) profile for matched CALIPSO and SAGE III/ISS 521 nm aerosol product. The grey lines represent the undetected aerosol extinction of CALIPSO retrieval at a resolution of 20 km horizontally and 0.3 km vertically, and the blue line represents the average of grey lines. The red line represents the aerosol extinction from SAGE III/ISS.
The night-time CALIPSO undetected aerosol extinction and SAGE III/ISS 521 nm aerosol extinction show good agreement for the 12-month validation dataset (Fig. 5a), with the average retrieved aerosol extinction (black line) closing to the 1:1 line. The correlation coefficients (R) and normalized root-mean-square error (NRMSE) are 0.66 % and 100.6 % based on the independent 12-month SAGE validation dataset, respectively. The CALIPSO extinction in Fig. 5a comes from the averaged extinction profiles over the 1∘ matched range with SAGE (Fig. 1a). They are equal to the average of the five 20 km extinction profiles over the matched range. Therefore, considering the systematic error of the lidar ratio in Eq. (7), we calculate the uncertainty of averaged extinction within one-degree range according to the following equation:
where n represents the number of CALIPSO 20 km profiles (i=1, 2, …, n) in the matching range, α20 km is the 20 km aerosol extinction of CALIPSO, and is the uncertainty for 1∘ aerosol extinction of CALIPSO. The first term on the right indicates the random error and is equal to the sum of the squares of errors based on the five related 20 km extinction values. The second term indicates the systematic error from the lidar ratio and should not decrease with the average scale based on the error propagation principle.
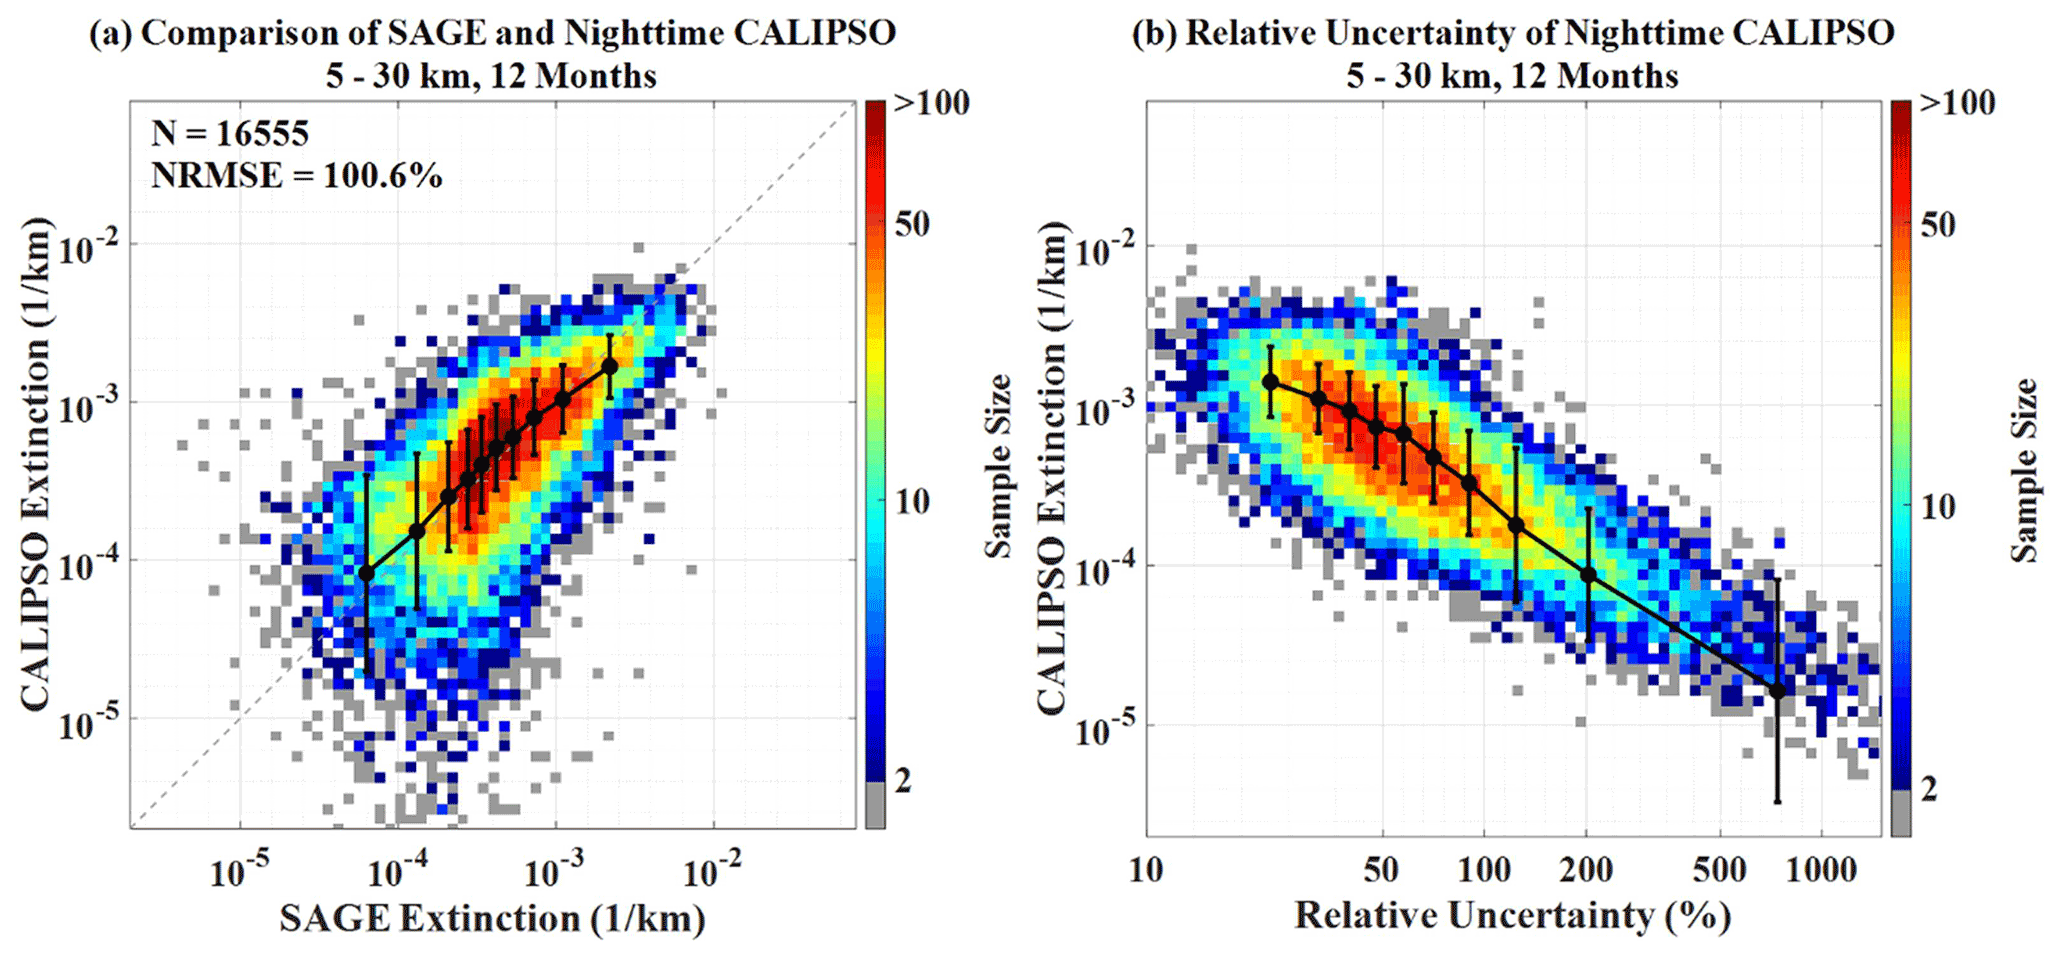
Figure 5(a) Correlation plots of the retrieved undetected aerosol extinction between CALIPSO and SAGE III/ISS product from 5 to 30 km during night-time for 12 months of validation. The colour bar represents the sample size. The black bins represent the mean values of each 10 % quantile (0 %–10 %, 10 %–20 %, …, and 90 %–100 %) of SAGE III/ISS 521 nm aerosol extinction and corresponding CALIPSO retrieval. The I-type bars indicate the standard deviation of CALIPSO retrieval at each 10 % quantile. (b) The relative uncertainty of 1∘ CALIPSO extinction.
Figure 5b shows the relationship between the extinction and relative uncertainty (ratio of and ) of the CALIPSO retrieval. The relative uncertainty increases as the extinction coefficient decreases because low extinction corresponds to low particle concentrations and weak backscatter signals, resulting in lower SNR. The averaged black line in Fig. 5b shows the mean relative uncertainties of CALIPSO, specifically ∼ 35 % and ∼ 125 % for the retrieved extinction of 10−3 and 10−4 km−1, respectively. This indicates the retrieved extinction of undetected aerosol is much smaller than the low boundary of the detected aerosol extinction (10−2 km−1) from the CALIPSO level 2 extinction product with a 40 % uncertainty (Kacenelenbogen et al., 2011; Toth et al., 2018; Winker et al., 2013). Similarly, Watson-Parris et al. (2018) noted through the model that the minimum value of aerosol extinction at 0–15 km should be close to 10−4 km−1, whereas CALIPSO level 2 aerosol products remain above 10−2 km−1, resulting in 92 % and 87 % of global aerosol areas during daytime and night-time being undetected by CALIPSO layer detection algorithm, respectively.
The agreement between daytime CALIPSO retrieval and SAGE III/ISS between 5 to 30 km (with R=0.25 and NRMSE = 454.5 %) is poorer than during night-time (with R=0.66 and NRMSE = 100.6 %) (Figs. 5a and 6a). The poorer agreement is due to the lower SNR of CALIPSO, which is attributed to sunlight during the daytime (Fig. 6b) (Hunt et al., 2009). The distribution of lidar signals received by photomultipliers is Neyman type-A (originally defined for a Poisson process) (Teich, 1981), thereby introducing a positive bias in the extinction retrieval calculation when the SNR is low. Also, Young et al. (2013) noted that the CALIPSO retrievals with SNR ≤ 1 usually contain a positive bias. The SNR during daytime above 20 km is usually less than 1 for TAB at a 20 km horizontal scale (Fig. 6b), leading to a significantly positive bias in the retrieval (Fig. 6a), as noted by Young et al. (2013). In addition, a layer detection algorithm possibly misses more optically thick aerosol layers at low SNR during daytime compared with that during night-time (Huang et al., 2015), thereby causing large retrieved aerosol extinctions in Fig. 6a.
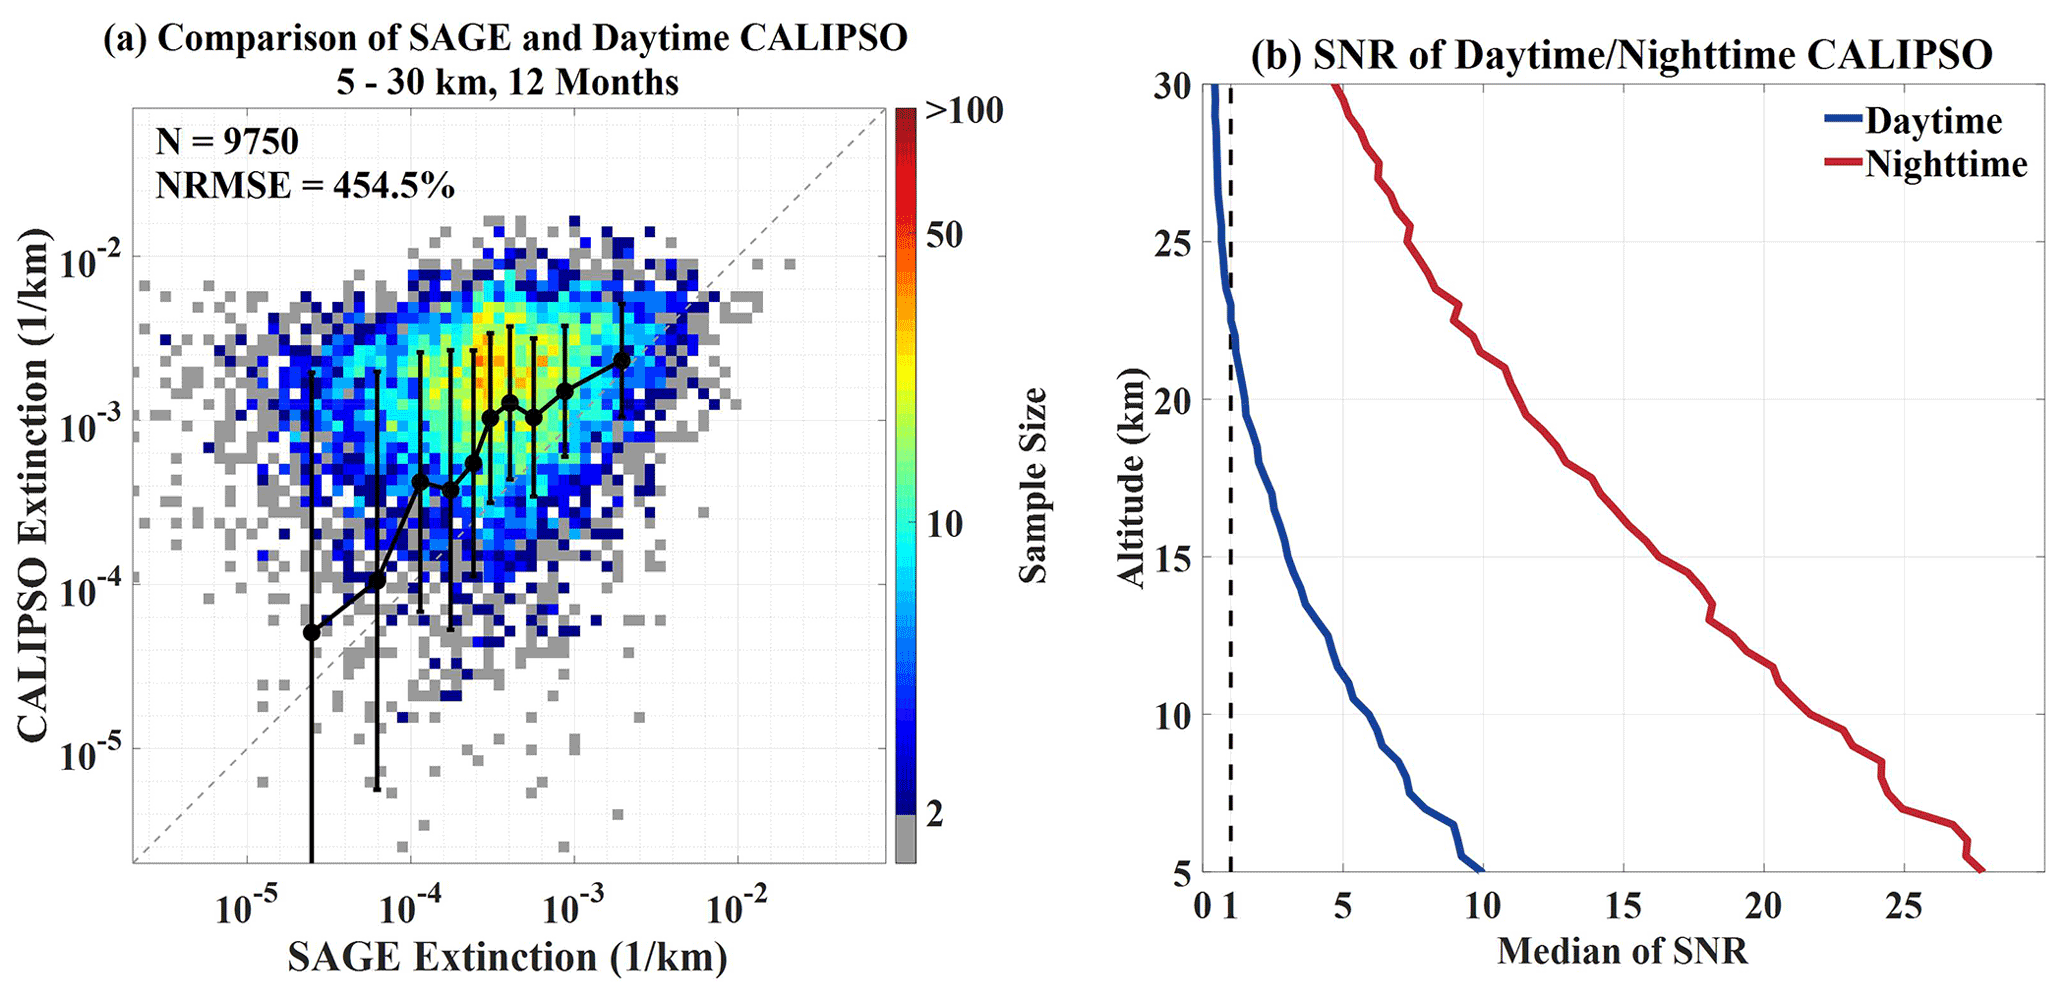
Figure 6Panel (a) is the same as Fig. 5a but at daytime. (b) SNR profiles of the TAB at 20 km horizontal resolution at daytime (blue) and night-time (red). The SNR is calculated according to based on the pre-processed TAB with 20 km horizontal resolution in the matching range, where μ and σ are the mean and the standard deviation of the signal, respectively.
3.3 Comparison with CALIPSO level 2 and level 3 products
Figure 7 shows a case to compare the retrieved undetected aerosol with CALIPSO level 2 product during a wildfire event in Australia in August 2019. Smoke and dust transmission trajectory are shown in the dashed red boxed area of the Terra MODIS true-colour image (Fig. 7a). In the scene of aerosol extinction coefficient (Fig. 7b), CALIPSO level 2 product only shows two detected strong aerosol layers (shown as purple boundaries) between −25∘ and −30∘ latitude, which is labelled as elevated smoke (Fig. 7c). These aerosol layers should belong to a continuous layer (shown in the dashed red box), but the CALIPSO vertical feature mask (VFM) product does not show the faint aerosol (∼ 0.01 km−1) between the two strong aerosol layers (∼ 0.03 km−1), which may be below the threshold of the SIBYL. The attenuated scattering ratio (ASR) (Fig. 7d), which is the ratio of the CALIPSO level 1 total attenuated backscatter and attenuated molecular backscatter product, also demonstrates the overall continuous nature of this aerosol layer.

Figure 7(a) MODIS Terra true-colour image at daytime and the passing CALIPSO track (yellow line) at night-time. (b) Latitude–altitude of undetected aerosol extinction of the corresponding night-time CALIPSO track, which is consistent with Fig. 4a. The purple and black boundary lines and extinction inside represent the detected aerosol and cloud layers provided by CALIPSO level 2 products, respectively. (c) Aerosol subtypes in CALIPSO VFM product (N/A stands for not applicable, 1 is marine, 2 is dust, 3 is polluted continental/smoke, 4 is clean continental, 5 is polluted dust, 6 is elevated smoke, 7 is dusty marine, 8 is polar stratospheric aerosol, 9 is volcanic ash, and 10 is sulfate/other). (d) Attenuated scattering ratio.
Figure 8a and b show the spatial distribution of aerosol extinction averaged in June and August 2019 at 17 km altitude from the CALIPSO level 3 monthly averaged stratospheric aerosol profile product with a resolution of 5∘ × 20∘ in latitude and longitude (Kar et al., 2019). A significant amount of aerosol enhancement was observed in the stratosphere in August in the Northern Hemisphere (Fig. 8b), possibly due to the eruption of the Raikoke volcano in June 2019 (Kloss et al., 2021; de Leeuw et al., 2021). We selected two CALIPSO tracks across aerosol enhancement areas in June and August (Fig. 8c and d), respectively. The stratosphere at the Northern Hemisphere latitudes is clean, whereas natural dust aerosol prevails in the lower troposphere on 10 June when Raikoke has not yet erupted (Fig. 8c and e). The clean conditions shown by our retrieval are consistent with the CALIPSO level 3 products that indicate the clean stratosphere at a monthly temporal scale.

Figure 8Panels (a) and (b) are the stratospheric extinction distributions of CALIPSO level 3 stratospheric aerosol profile products at 17 km in June and August, respectively. Panels (c) and (d) are the retrieved aerosol extinction scenes based on CALIPSO instantaneous data on 10 June and 10 August, respectively, which are consistent with Fig. 4a. The corresponding trajectories for the two scenes are shown as red lines in (a) and (b), and the corresponding aerosol subtypes are shown in (e) and (f), which is the as same as in Fig. 7c.
Following the onset of volcanic eruptions, strong stratospheric aerosol layers are found in the stratosphere between 50∘ N and 60∘ N that are classified as sulfate by the VFM (Fig. 8f). As shown in the dashed red box of Fig. 8d, aerosol extinction enhancement (∼ 0.005 km−1) occurs around 17 km near 40 to 5∘ N, which corresponds to the monthly average scale aerosol contamination in the stratosphere throughout the Northern Hemisphere in Fig. 8b but is not captured by CALIPSO level 2 products (Fig. 8f). Therefore, the retrieved undetected aerosol extinction can capture the aerosol enhancement from special events well at a horizontal resolution of 20 km (Fig. 8d). The colour ratios, particle depolarization ratios, and integrated attenuated backscatter are extracted manually for the dashed red region (16 to 20 km, 40 to 5∘ N) with an average of 0.17, 0.02 and 0.00033 sr−1, respectively. Using these optical and non-optical properties (i.e., centre height, temperature, and latitude), aerosol subtypes can be determined by the CALIPSO scene classification algorithms (Kim et al., 2018). The results show that the aerosol subtype in this region is sulfate, which supports that the aerosol enhancement is more likely to be from the eruption of the Raikoke volcano. Additionally, a previous study indicates that Siberian wildfire smoke possibly contributes to the enhanced stratospheric aerosols in 2019 by combining the CALIPSO observation and backward trajectories model (Ansmann et al., 2021).
3.4 Discussion of lidar ratio and its effects on retrieval
As mentioned in Sect. 2.4, the initial stratosphere and troposphere lidar ratios were derived from the empirical value (50 sr) of CALIPSO level 3 stratospheric aerosol product (Kar et al., 2019) and the lidar ratio (28.75 sr) obtained by Kim et al. (2017), respectively. The latter is estimated from the retrieved CALIPSO column-integrated extinction with MODIS AOD constraints. As shown in Fig. 9, the retrieved extinction using the fixed lidar ratio is higher than that using the SAGE-constrained lidar ratio because the median lidar ratio of the former (50 and 28.75 sr) is larger than the latter (42.2 and 24.5 sr). However, the NRMSE of retrieved extinction decreased by about 15 % (from 120.2 % to 105.6 %) when changing the fixed lidar ratio to the SAGE-constrained lidar ratio on a global scale. Specifically, using the fixed lidar ratio of 50 sr in the high-latitude stratosphere could result in a larger bias because the fixed lidar ratio is more different from the SAGE-constrained lidar ratio (∼ 35 sr) (Fig. 3a). Therefore, these indicate a better accuracy of retrieved undetected aerosol extinction using the SAGE-constrained lidar ratio on a global scale.
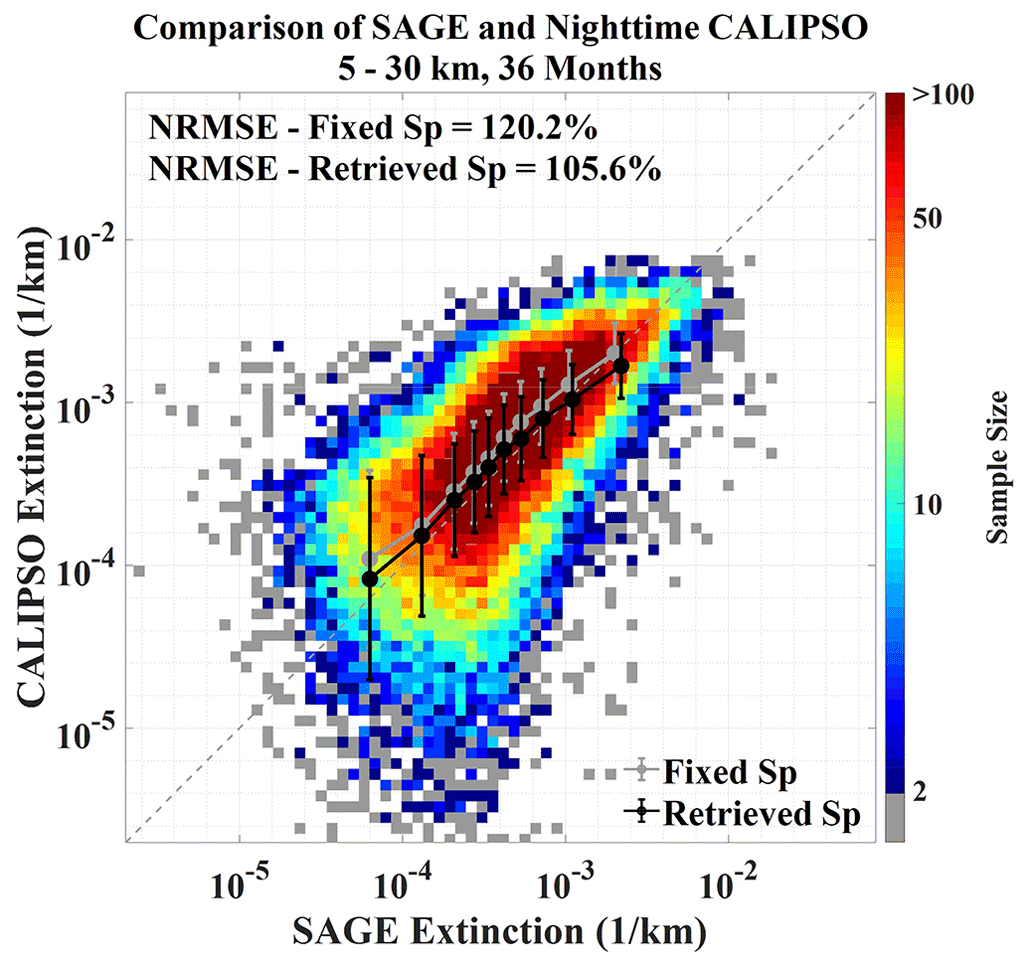
Figure 9The coloured scatter plot is the same as that in Fig. 5a, but the CALIPSO extinction is retrieved using fixed lidar ratios of 50 and 28.75 sr in the stratosphere and troposphere from June 2017 to May 2020, respectively. The grey and black lines are the mean value of each 10 % quantile (as in Fig. 5a) of the CALIPSO retrieved extinction using the fixed lidar ratios and our retrieved lidar ratios, respectively. The I-type bars indicate the standard deviation of the CALIPSO retrieval at each 10 % quantile.
Figure 7b illustrates a possibly missed smoke from a wildfire. Based on the SAGE-constrained lidar ratio (median 42.2 and 24.5 sr), we retrieve and see the faint aerosol undetected by CALIPSO layer detection algorithm that connects with two strong aerosol layers. The lidar ratio for the smoke reported in the CALIPSO level 2 version 4 product is 70 ± 16 sr (Young et al., 2018), which is very different from the SAGE-constrained lidar ratio for the troposphere at this location. Theoretically, a larger lidar ratio will derive a larger extinction in the retrieval. This indicates that the undetected aerosol extinction should be larger if using the smoke lidar ratio of 70 ± 16 sr. However, so far this bias cannot be avoided here because an automatic classification is impossible when we do not know the boundaries of those aerosols. Therefore, we have to treat the stratospheric (or tropospheric) undetected aerosols as a whole and assign the same lidar ratio regardless of the aerosol type in this study. Although the retrieved extinction in Fig. 7 is biased, it demonstrates the importance of retrieving and determining the undetected aerosol extinction at a high spatial–temporal resolution. A solution to reduce this bias is to develop a more effective layer detection and classification algorithm, and our team is already working on it (Mao et al., 2021).
An abundance of faint aerosols in the background atmosphere significantly affects the global climate (Deshler, 2008). However, these faint aerosols are too optically thin to be instantaneously detected and are rarely retrieved by current methodologies (Watson-Parris et al., 2018; Toth et al., 2018). With the constraint of using SAGE aerosol observations on a global scale, this study retrieved instantaneous extinction of aerosol undetected by the CALIPSO layer detection algorithm based on CALIPSO level 1B data. The main conclusions are summarized as follows.
The lidar ratio for the stratosphere and troposphere on a global scale is derived based on CALIPSO instantaneous observations using SAGE III/ISS AOD as a constraint. The derived lidar ratio is significantly higher in the stratosphere (median 42.2 sr) than that in the troposphere (median 24.5 sr). The derived lidar ratio peaks at the Equator and decreases with latitude at the stratosphere, while the lidar ratio variations are small at the troposphere on a global scale.
The retrieved undetected aerosol extinction based on CALIPSO night-time instantaneous observations shows good agreement with the SAGE III/ISS product on a 1∘ average. The correlation (R) and NRMSE are 0.66 % and 100.6 % based on the independent 12-month SAGE III/ISS data, respectively. The uncertainties of the retrieved extinction coefficients at 10−3 and 10−4 km−1 are ∼ 35 % and 125 % during night-time, respectively.
The comparison of retrieved undetected aerosol extinction based on globally fixed and SAGE-constrained lidar ratios indicates the NRMSE decreased by about 15 % (from 120.2 % to 105.6 %) during night-time. Additionally, the CALIPSO retrieval during daytime has a positive bias and relatively low agreement with SAGE III/ISS, exhibiting R and NRMSE of 0.25 and 454.5 %, respectively, due to the low signal-to-noise ratio caused by sunlight.
In the case of the Australian wildfire event, instantaneous retrieved extinction of missed aerosol from CALIPSO level 2 products provides more details of aerosol distribution. In addition, compared with the CALIPSO level 3 stratospheric aerosol product, the retrievals show consistent aerosol enhancement, possibly due to the eruption of Raikoke volcano, but at a higher spatial-temporal resolution.
This study allows for more efficient capturing of aerosol vertical properties of events, such as volcanic eruptions and wildfires, by acquiring instantaneous and high-resolution faint aerosols globally (Vernier et al., 2015; Andersson et al., 2015). Moreover, a large potential for new insights is found in the physical mechanism of aerosol–cloud interaction and quantifying the related radiative forcing more accurately (Boucher et al., 2013; Dipu et al., 2013). Furthermore, layer detection of tenuous aerosol and cloud layers and the classification of aerosol subtypes should receive increased attention to improve the accuracy of faint aerosol retrievals. More effective data denoising processes can also be investigated to reduce biases in extinction retrieval, such as the systematic positive bias in the retrieval of daytime observations from CALIPSO.
The computer code used to analyse the data is available from the corresponding author on request.
The datasets used in this study can be accessed from the following websites or by contacting the corresponding author. CALIPSO data are available from the Atmospheric Science Data Center at NASA LaRC (https://asdc.larc.nasa.gov/project/CALIPSO, last access: 6 August 2022, Winker et al., 2010), including lidar level 1B, level 2, and level 3 stratospheric aerosol profile products. The SAGE III/ISS data products are also available at the Atmospheric Science Data Center (https://asdc.larc.nasa.gov/project/SAGE III-ISS, last access: 6 August 2022, Thomason et al., 2010).
FM, ZP, and DR conceived the study. ZP, FM, RS, and DR designed the retrieval methodology and comparison experiments. RS, FM, and ZP implemented the methodology and carried out the data analysis. RS, ZP, and FM prepared the manuscript with contributions from the other co-authors. LZ, YZ, and XL contributed to the discussion of methodology and scientific significance. All co-authors commented on and reviewed the manuscript.
The contact author has declared that none of the authors has any competing interests.
Publisher's note: Copernicus Publications remains neutral with regard to jurisdictional claims in published maps and institutional affiliations.
The authors are grateful to the teams involved with CALIPSO and SAGE III/ISS for providing their data. The CALIPSO and SAGE III/ISS aerosol data were obtained from the Atmospheric Science Data Center at NASA LaRC. The numerical calculations in this study have been conducted on the supercomputing system in the Supercomputing Center of Wuhan University. We would also like to acknowledge the anonymous reviewers for their comments and suggestions, which significantly improved the quality of the paper.
This study is supported by the National Natural Science Foundation of China (grant nos. 41971285 and 41627804) and the National Key Research and Development Program of China (grant no. 2017YFC0212600).
This paper was edited by Michael Pitts and reviewed by four anonymous referees.
Andersson, S. M., Martinsson, B. G., Vernier, J.-P., Friberg, J., Brenninkmeijer, C. A., Hermann, M., Van Velthoven, P. F., and Zahn, A.: Significant radiative impact of volcanic aerosol in the lowermost stratosphere, Nat. Commun., 6, 7692, https://doi.org/10.1038/ncomms8692, 2015.
Ansmann, A., Ohneiser, K., Chudnovsky, A., Baars, H., and Engelmann, R.: CALIPSO Aerosol-Typing Scheme Misclassified Stratospheric Fire Smoke: Case Study From the 2019 Siberian Wildfire Season, Frontiers in Environmental Science, 9, https://doi.org/10.3389/fenvs.2021.769852, 2021.
Boucher, O., Randall, D., Artaxo, P., Bretherton, C., Feingold, G., Forster, P., Kerminen, V.-M., Kondo, Y., Liao, H., Lohmann, U., Rasch, P., Satheesh, S. K., Sherwood, S., Stevens, B., and Zhang, X. Y.: Clouds and Aerosols, in: Climate Change 2013: The Physical Science Basis. Contribution of Working Group I to the Fifth Assessment Report of the Intergovernmental Panel on Climate Change, edited by: Stocker, T. F., Qin, D., Plattner, G.-K., Tignor, M., Allen, S. K., Boschung, J., Nauels, A., Xia, Y., Bex, V., and Midgley, P. M., Cambridge University Press, 571–657, ISBN 978-1-107-66182-0, 2013.
Damadeo, R. P., Zawodny, J. M., Thomason, L. W., and Iyer, N.: SAGE version 7.0 algorithm: application to SAGE II, Atmos. Meas. Tech., 6, 3539–3561, https://doi.org/10.5194/amt-6-3539-2013, 2013.
de Leeuw, J., Schmidt, A., Witham, C. S., Theys, N., Taylor, I. A., Grainger, R. G., Pope, R. J., Haywood, J., Osborne, M., and Kristiansen, N. I.: The 2019 Raikoke volcanic eruption – Part 1: Dispersion model simulations and satellite retrievals of volcanic sulfur dioxide, Atmos. Chem. Phys., 21, 10851–10879, https://doi.org/10.5194/acp-21-10851-2021, 2021.
Deshler, T.: A review of global stratospheric aerosol: Measurements, importance, life cycle, and local stratospheric aerosol, Atmos. Res., 90, 223–232, https://doi.org/10.1016/j.atmosres.2008.03.016, 2008.
Dipu, S., Prabha, T. V., Pandithurai, G., Dudhia, J., Pfister, G., Rajesh, K., and Goswami, B.: Impact of elevated aerosol layer on the cloud macrophysical properties prior to monsoon onset, Atmos. Environ., 70, 454–467, https://doi.org/10.1016/j.atmosenv.2012.12.036, 2013.
Fernald, F. G.: Analysis of atmospheric lidar observations: some comments, Appl. Optics, 23, 652–653, 1984.
Fernald, F. G., Herman, B. M., and Reagan, J. A.: Determination of aerosol height distributions by lidar, J. Appl. Meteorol. Clim., 11, 482–489, 1972.
Huang, J., Guo, J., Wang, F., Liu, Z., Jeong, M. J., Yu, H., and Zhang, Z.: CALIPSO inferred most probable heights of global dust and smoke layers, J. Geophys. Res.-Atmos., 120, 5085–5100, https://doi.org/10.1002/2014JD022898, 2015.
Hunt, W. H., Winker, D. M., Vaughan, M. A., Powell, K. A., Lucker, P. L., and Weimer, C.: CALIPSO lidar description and performance assessment, J. Atmos. Ocean. Tech., 26, 1214–1228, 2009.
Kacenelenbogen, M., Vaughan, M. A., Redemann, J., Hoff, R. M., Rogers, R. R., Ferrare, R. A., Russell, P. B., Hostetler, C. A., Hair, J. W., and Holben, B. N.: An accuracy assessment of the CALIOP/CALIPSO version 2/version 3 daytime aerosol extinction product based on a detailed multi-sensor, multi-platform case study, Atmos. Chem. Phys., 11, 3981–4000, https://doi.org/10.5194/acp-11-3981-2011, 2011.
Kar, J., Vaughan, M. A., Lee, K.-P., Tackett, J. L., Avery, M. A., Garnier, A., Getzewich, B. J., Hunt, W. H., Josset, D., Liu, Z., Lucker, P. L., Magill, B., Omar, A. H., Pelon, J., Rogers, R. R., Toth, T. D., Trepte, C. R., Vernier, J.-P., Winker, D. M., and Young, S. A.: CALIPSO lidar calibration at 532 nm: version 4 nighttime algorithm, Atmos. Meas. Tech., 11, 1459–1479, https://doi.org/10.5194/amt-11-1459-2018, 2018.
Kar, J., Lee, K.-P., Vaughan, M. A., Tackett, J. L., Trepte, C. R., Winker, D. M., Lucker, P. L., and Getzewich, B. J.: CALIPSO level 3 stratospheric aerosol profile product: version 1.00 algorithm description and initial assessment, Atmos. Meas. Tech., 12, 6173–6191, https://doi.org/10.5194/amt-12-6173-2019, 2019.
Khaykin, S. M., Godin-Beekmann, S., Keckhut, P., Hauchecorne, A., Jumelet, J., Vernier, J.-P., Bourassa, A., Degenstein, D. A., Rieger, L. A., Bingen, C., Vanhellemont, F., Robert, C., DeLand, M., and Bhartia, P. K.: Variability and evolution of the midlatitude stratospheric aerosol budget from 22 years of ground-based lidar and satellite observations, Atmos. Chem. Phys., 17, 1829–1845, https://doi.org/10.5194/acp-17-1829-2017, 2017.
Kim, M. H., Omar, A. H., Vaughan, M. A., Winker, D. M., Trepte, C. R., Hu, Y., Liu, Z., and Kim, S. W.: Quantifying the low bias of CALIPSO's column aerosol optical depth due to undetected aerosol layers, J. Geophys. Res.-Atmos., 122, 1098–1113, https://doi.org/10.3390/rs13081496, 2017.
Kim, M.-H., Omar, A. H., Tackett, J. L., Vaughan, M. A., Winker, D. M., Trepte, C. R., Hu, Y., Liu, Z., Poole, L. R., Pitts, M. C., Kar, J., and Magill, B. E.: The CALIPSO version 4 automated aerosol classification and lidar ratio selection algorithm, Atmos. Meas. Tech., 11, 6107–6135, https://doi.org/10.5194/amt-11-6107-2018, 2018.
Kim, M.-H., Yeo, H., Park, S., Park, D.-H., Omar, A., Nishizawa, T., Shimizu, A., and Kim, S.-W.: Assessing CALIOP-Derived Planetary Boundary Layer Height Using Ground-Based Lidar, Remote Sensing, 13, 1496, https://doi.org/10.1002/2016JD025797, 2021.
Kloss, C., Berthet, G., Sellitto, P., Ploeger, F., Taha, G., Tidiga, M., Eremenko, M., Bossolasco, A., Jégou, F., Renard, J.-B., and Legras, B.: Stratospheric aerosol layer perturbation caused by the 2019 Raikoke and Ulawun eruptions and their radiative forcing, Atmos. Chem. Phys., 21, 535–560, https://doi.org/10.5194/acp-21-535-2021, 2021.
Lee, L. A., Reddington, C. L., and Carslaw, K. S.: On the relationship between aerosol model uncertainty and radiative forcing uncertainty, P. Natl. Acad. Sci. USA, 113, 5820–5827, https://doi.org/10.1073/pnas.1507050113, 2016.
Levy, R. C., Mattoo, S., Munchak, L. A., Remer, L. A., Sayer, A. M., Patadia, F., and Hsu, N. C.: The Collection 6 MODIS aerosol products over land and ocean, Atmos. Meas. Tech., 6, 2989–3034, https://doi.org/10.5194/amt-6-2989-2013, 2013.
Li, Z., Guo, J., Ding, A., Liao, H., Liu, J., Sun, Y., Wang, T., Xue, H., Zhang, H., and Zhu, B.: Aerosol and boundary-layer interactions and impact on air quality, Natl. Sci. Rev., 4, 810–833, https://doi.org/10.1093/nsr/nwx117, 2017.
Lu, X., Mao, F., Pan, Z., Gong, W., Wang, W., Tian, L., and Fang, S.: Three-Dimensional Physical and Optical Characteristics of Aerosols over Central China from Long-Term CALIPSO and HYSPLIT Data, Remote Sensing, 10, 314, https://doi.org/10.3390/rs10020314, 2018.
Ma, P. L., Rasch, P. J., Wang, M., Wang, H., Ghan, S. J., Easter, R. C., Gustafson Jr., W. I., Liu, X., Zhang, Y., and Ma, H. Y.: How does increasing horizontal resolution in a global climate model improve the simulation of aerosol-cloud interactions?, Geophys. Res. Lett., 42, 5058–5065, https://doi.org/10.1002/2015GL064183, 2015.
Mao, F., Liang, Z., Pan, Z., Gong, W., Sun, J., Zhang, T., Huang, X., Zang, L., Lu, X., and Hong, J.: A simple multiscale layer detection algorithm for CALIPSO measurements, Remote Sens. Environ., 266, 112687, https://doi.org/10.1016/j.rse.2021.112687, 2021.
Rosenfeld, D., Andreae, M. O., Asmi, A., Chin, M., de Leeuw, G., Donovan, D. P., Kahn, R., Kinne, S., Kivekäs, N., and Kulmala, M.: Global observations of aerosol-cloud-precipitation-climate interactions, Rev. Geophys., 52, 750–808, https://doi.org/10.1002/2013RG000441, 2014.
Schoeberl, M., Jensen, E., Wang, T., Taha, G., Ueyama, R., Wang, Y., DeLand, M., and Dessler, A.: Cloud and Aerosol Distributions From SAGE III/ISS Observations, J. Geophys. Res.-Atmos., 126, e2021JD035550, https://doi.org/10.1029/2021JD035550, 2021.
Smirnov, A., Holben, B. N., Giles, D. M., Slutsker, I., O'Neill, N. T., Eck, T. F., Macke, A., Croot, P., Courcoux, Y., Sakerin, S. M., Smyth, T. J., Zielinski, T., Zibordi, G., Goes, J. I., Harvey, M. J., Quinn, P. K., Nelson, N. B., Radionov, V. F., Duarte, C. M., Losno, R., Sciare, J., Voss, K. J., Kinne, S., Nalli, N. R., Joseph, E., Krishna Moorthy, K., Covert, D. S., Gulev, S. K., Milinevsky, G., Larouche, P., Belanger, S., Horne, E., Chin, M., Remer, L. A., Kahn, R. A., Reid, J. S., Schulz, M., Heald, C. L., Zhang, J., Lapina, K., Kleidman, R. G., Griesfeller, J., Gaitley, B. J., Tan, Q., and Diehl, T. L.: Maritime aerosol network as a component of AERONET – first results and comparison with global aerosol models and satellite retrievals, Atmos. Meas. Tech., 4, 583–597, https://doi.org/10.5194/amt-4-583-2011, 2011.
Song, Q., Zhang, Z., Yu, H., Ginoux, P., and Shen, J.: Global dust optical depth climatology derived from CALIOP and MODIS aerosol retrievals on decadal timescales: regional and interannual variability, Atmos. Chem. Phys., 21, 13369–13395, https://doi.org/10.5194/acp-21-13369-2021, 2021.
Teich, M. C.: Role of the doubly stochastic Neyman type-A and Thomas counting distributions in photon detection, Appl. Optics, 20, 2457–2467, 1981.
Thomason, L. W., Pitts, M. C., and Winker, D. M.: CALIPSO observations of stratospheric aerosols: a preliminary assessment, Atmos. Chem. Phys., 7, 5283–5290, https://doi.org/10.5194/acp-7-5283-2007, 2007.
Thomason, L. W., Moore, J. R., Pitts, M. C., Zawodny, J. M., and Chiou, E. W.: An evaluation of the SAGE III version 4 aerosol extinction coefficient and water vapor data products, Atmos. Chem. Phys., 10, 2159–2173, https://doi.org/10.5194/acp-10-2159-2010, 2010 (data available at: https://asdc.larc.nasa.gov/project/SAGE III-ISS, last access: 6 August 2022).
Thorsen, T. J. and Fu, Q.: CALIPSO-inferred aerosol direct radiative effects: Bias estimates using ground-based Raman lidars, J. Geophys. Res.-Atmos., 120, 12209–12220, https://doi.org/10.1002/2015JD024095, 2015.
Toth, T. D., Campbell, J. R., Reid, J. S., Tackett, J. L., Vaughan, M. A., Zhang, J., and Marquis, J. W.: Minimum aerosol layer detection sensitivities and their subsequent impacts on aerosol optical thickness retrievals in CALIPSO level 2 data products, Atmos. Meas. Tech., 11, 499–514, https://doi.org/10.5194/amt-11-499-2018, 2018.
Vaughan, M. A., Powell, K. A., Winker, D. M., Hostetler, C. A., Kuehn, R. E., Hunt, W. H., Getzewich, B. J., Young, S. A., Liu, Z., and McGill, M. J.: Fully automated detection of cloud and aerosol layers in the CALIPSO lidar measurements, J. Atmos. Ocean. Tech., 26, 2034–2050, 2009.
Vernier, J.-P., Pommereau, J.-P., Garnier, A., Pelon, J., Larsen, N., Nielsen, J., Christensen, T., Cairo, F., Thomason, L. W., and Leblanc, T.: Tropical stratospheric aerosol layer from CALIPSO lidar observations, J. Geophys. Res.-Atmos., 114, D00H10, https://doi.org/10.1029/2009JD011946, 2009.
Vernier, J. P., Fairlie, T., Natarajan, M., Wienhold, F., Bian, J., Martinsson, B., Crumeyrolle, S., Thomason, L., and Bedka, K.: Increase in upper tropospheric and lower stratospheric aerosol levels and its potential connection with Asian pollution, J. Geophys. Res.-Atmos., 120, 1608–1619, https://doi.org/10.1002/2014JD022372, 2015.
Wang, H. J. R., Damadeo, R., Flittner, D., Kramarova, N., Taha, G., Davis, S., Thompson, A. M., Strahan, S., Wang, Y., Froidevaux, L., Degenstein, D., Bourassa, A., Steinbrecht, W., Walker, K. A., Querel, R., Leblanc, T., Godin-Beekmann, S., Hurst, D., and Hall, E.: Validation of SAGE III/ISS Solar Occultation Ozone Products With Correlative Satellite and Ground-Based Measurements, J. Geophys. Res.-Atmos., 125, e2020JD032430, https://doi.org/10.1029/2020JD032430, 2020.
Watson-Parris, D., Schutgens, N., Winker, D., Burton, S. P., Ferrare, R. A., and Stier, P.: On the limits of CALIOP for constraining modeled free tropospheric aerosol, Geophys. Res. Lett., 45, 9260–9266, https://doi.org/10.1029/2018GL078195, 2018.
Watson-Parris, D., Bellouin, N., Deaconu, L., Schutgens, N. A., Yoshioka, M., Regayre, L. A., Pringle, K. J., Johnson, J. S., Smith, C., and Carslaw, K.: Constraining uncertainty in aerosol direct forcing, Geophys. Res. Lett., 47, e2020GL087141. https://doi.org/10.1029/2020GL087141, 2020.
Winker, D., Pelon, J., Coakley Jr., J., Ackerman, S., Charlson, R., Colarco, P., Flamant, P., Fu, Q., Hoff, R., and Kittaka, C.: The CALIPSO mission: A global 3D view of aerosols and clouds, B. Am. Meteorol. Soc., 91, 1211–1230, https://doi.org/10.1175/2010BAMS3009.1, 2010 (data available at: https://asdc.larc.nasa.gov/project/CALIPSO, last access: 6 August 2022).
Winker, D. M., Tackett, J. L., Getzewich, B. J., Liu, Z., Vaughan, M. A., and Rogers, R. R.: The global 3-D distribution of tropospheric aerosols as characterized by CALIOP, Atmos. Chem. Phys., 13, 3345–3361, https://doi.org/10.5194/acp-13-3345-2013, 2013.
Young, S. and Vaughan, M. A.: The Retrieval of Profiles of Particulate Extinction from Cloud-Aerosol Lidar Infrared Pathfinder Satellite Observations (CALIPSO) Data: Algorithm Description, J. Atmos. Ocean. Tech., 26, 1105–1119, 2009.
Young, S. A., Vaughan, M. A., Kuehn, R. E., and Winker, D. M.: The retrieval of profiles of particulate extinction from Cloud–Aerosol Lidar and Infrared Pathfinder Satellite Observations (CALIPSO) data: Uncertainty and error sensitivity analyses, J. Atmos. Ocean. Tech., 30, 395–428, 2013.
Young, S. A., Vaughan, M. A., Garnier, A., Tackett, J. L., Lambeth, J. D., and Powell, K. A.: Extinction and optical depth retrievals for CALIPSO's Version 4 data release, Atmos. Meas. Tech., 11, 5701–5727, https://doi.org/10.5194/amt-11-5701-2018, 2018.