the Creative Commons Attribution 4.0 License.
the Creative Commons Attribution 4.0 License.
 | 16 Aug 2022
Columnar and surface urban aerosol in the Moscow megacity according to measurements and simulations with the COSMO-ART model
Natalia E. Chubarova
Heike Vogel
Elizaveta E. Androsova
Alexander A. Kirsanov
Olga B. Popovicheva
Bernhard Vogel
Gdaliy S. Rivin
Urban aerosol pollution was analyzed over the Moscow megacity region using the COSMO-ART (COSMO – COnsortium for Small-scale MOdelling, ART – Aerosols and Reactive Trace gases) online coupled mesoscale model system and intensive measurement campaigns at the Moscow State University Meteorological Observatory (MSU MO, 55.707∘ N, 37.522∘ E) during the April–May period in 2018 and 2019. We analyzed mass concentrations of particulate matter with diameters smaller than 10 µm (PM10), black carbon (BC) and aerosol gas precursors (NOx, SO2, CHx) as well as columnar aerosol parameters for fine and coarse modes together with different meteorological parameters, including an index characterizing the intensity of particle dispersion (IPD). Both model and experimental datasets have shown a statistically significant linear correlation of BC with NO2 and PM10 mass concentrations, which indicates mostly common sources of emissions of these substances. There was a pronounced increase in the ratio from 0.7 % to 5.9 %, with the decrease in the IPD index related to the amplification of the atmospheric stratification. We also found an inverse dependence between the ratio and columnar single-scattering albedo (SSA) for the intense air mixing conditions. This dependence together with the obtained negative correlation between wind speed and may serve as an indicator of changes in the absorbing properties of the atmosphere due to meteorological factors. On average, the relatively low BC PM10 ratio (for urban regions) of 4.7 % is the cause of the observed relatively high SSA = 0.94 in Moscow. Using long-term parallel aerosol optical depth (AOD) measurements over the 2006–2020 period at the MSU MO and under upwind clean background conditions at Zvenigorod Scientific Station (ZSS) of the IAP RAS (55.7∘ N, 36.8∘ E), we estimated the urban component of AOD (AODurb) and some other parameters as the differences at these sites. The annual mean AODurb at 550 nm was about 0.021 with more than 85 % of the fine aerosol mode. The comparisons between AODurb obtained from the model and measurements during this experiment have revealed a similar level of aerosol pollution of about AODurb=0.015–0.019, which comprised 15 %–19 % of the total AOD at 550 nm. The urban component of PM10 (PM10urb) was about 16 µg m−3 according to the measurements and 6 µg m−3 according to the COSMO-ART simulations. We obtained a pronounced diurnal cycle of PM10urb and urban BC (BCurb) as well as their strong correlation with the IPDs. With the IPD index change from 3 to 1 at night, there was about a 4 times increase in PM10urb (up to 30–40 µg m−3) and a 3 times increase in BCurb (up to 3–3.5 µg m−3). At the same time, no pronounced daily cycle was found for the columnar urban aerosol component (AODurb), although there was a slight increase in model AODurb at night.
- Article
(2934 KB) - Full-text XML
- BibTeX
- EndNote


Anthropogenic aerosol pollution has a complex impact on the atmosphere, significantly affecting solar radiation, air temperature and humidity and resulting in noticeable climatic effects (IPCC, 2022, 2013; Jacobson, 2004; Bond et al., 2013). Aerosol particles at the surface level also have a harmful effect on human health (Manisalidis et al., 2020; Lu et al., 2015). Radiative effects of the anthropogenic aerosol are negative and exceed 1 W m−2, partially compensating for the increase in the air temperature in the troposphere due to the rise in the concentration of greenhouse gases. However, the uncertainty of aerosol climate impact estimates remains quite high (IPCC, 2021; Myhre et al., 2013). These uncertainties are associated with a wide variety of optical and microphysical characteristics of aerosol (Seinfeld and Pandis, 2016) and its significant temporal and spatial variations. Anthropogenic aerosol is considered to be smaller in size and is more absorbing than natural aerosol (Myhre, 2009; Su et al., 2013; Kinne et al., 2013).
To date, these features of the urban aerosol pollution have not been fully studied, despite the significant efforts of the scientific community and the existence of different international aerosol programs within the World Data Centre for Aerosols (2022), https://gaw-wdca.org (last access: 15 January 2022): AERONET (Aerosol Robotic Network, https://aeronet.gsfc.nasa.gov/, last access: 20 February 2022), ACTRIS (2022) (Aerosol, Clouds and Trace Gases, https://actris.nilu.no, last access: 1 February 2022), and AEROCOM (2022) (Aerosol Comparisons between Observations and Models, https://aerocom.met.no/, last access: 16 February 2022).
The intensive aerosol studies concern the optical properties of urban aerosol, its relation with meteorological characteristics as well as the relationship between surface concentration and columnar aerosol content and the emission sources (Segura et al., 2017; Zhuang et al., 2018; Wang et al., 2018, 2019; Zhdanova et al., 2020). However, in most publications the authors consider natural and urban columnar aerosol in polluted areas without highlighting its urban component (Kumar et al., 2019; Chou et al., 2006; Zhuang et al., 2018; Segura et al., 2017). In only a few papers were the urban component of columnar aerosol optical depth (AOD) and other aerosol properties evaluated (Zawadska et al., 2013; Chubarova et al., 2011b; Zhdanova et al., 2020). At the same time, the detection of the urban aerosol component and its relationship with anthropogenic emissions of gas precursors are critical for assessing aerosol radiation forcing and its climate effect (IPCC, 2022).
When analyzing urban aerosol pollution, it is important to understand the relationship between the content of ground-level aerosol and the aerosol content in the atmospheric column. However, such an analysis has been made only in a small number of publications (Segura et al., 2017; Gubanova et al., 2018; Wang et al., 2019).
Black carbon (BC) is a particularly important urban aerosol component which absorbs visible radiation and contributes to the heating of the atmosphere, in contrast to most other aerosol species (Jacobson, 2004, 2006; Ramanathan and Carmichael, 2008; Bond et al., 2013). The urban environment is the main source of BC emissions due to the use of diesel fuel (Weingartner et al., 1997). The contribution of these emissions from heavy vehicles (trucks, buses, etc.) with diesel engines can reach 42 % of the total mass of black carbon emissions into the atmosphere (Reddy and Venkataraman, 2002). To date, measurements of black carbon are irregular and quite rare, especially in cities, where the emissions are particularly high. This leads to a lack of understanding of the processes occurring in the atmosphere, and, in particular, to a possible error in estimating the contribution of BC to the balance between heating and cooling rates (Bond et al., 2013), which, in turn, increases the uncertainty of its climatic effect. The possible influence of BC on the absorbing properties of the atmosphere has been analyzed in only a few publications (Kozlov et al., 2016; Markowicz et al., 2017; Rajesh and Ramachandran, 2018). Thus, measurements and modeling of black carbon and the evaluation of its influence on the atmospheric properties are important tasks, especially in urban conditions (Gilardoni et al., 2011; Kozlov et al., 2008; Lugon et al., 2021; Tang et al., 2021). The quantification of urban aerosol and its properties is also important for improving the accuracy of the meteorological forecast of temperature and humidity of the atmosphere, which noticeably depends on aerosol amount and its characteristics (Toll et al., 2016; Wang et al., 2020; Huang and Ding, 2021; Poliukhov and Blinov, 2021).
Chemical transport models (CTMs) coupled with weather prediction models or with the data of re-analysis are used for studying aerosol pollution and its influence on meteorological parameters (Evans et al., 2003; WMO-COST, 2008; Vogel et al., 2010; Baklanov et al., 2017). However, for reliable estimations of aerosol parameters, the simulations should be carefully tested against measurements. For example, in Ukhov et al. (2020), the application of the WRF-Chem model over the Middle East and its examination against observations provided reliable assessment of pollution by mineral and sulfate aerosol over the urban area in this region.
According to AEROCOM modeling data and CMIP5 assessments, the anthropogenic component of AOD at a wavelength of 550 nm is 0.03±0.01, which is 24±6 % of the total AOD (IPCC, 2013). This is smaller compared with the satellite retrievals, which provide the estimates of about 0.06 (or 20 %–40 % of the total AOD) over land (Loeb and Su, 2010; Bellouin et al., 2013). According to the latest estimates, there is still an underestimation in simulated AOD of about 21 % (Gliß et al., 2021). Hence, the measurements of the urban aerosol component and the evaluation of its ratio in total AOD may provide a helpful test bed for aerosol urban modeling.
The Moscow megacity with its population of about 13 million people and with about 7 million vehicles is one of the largest urban agglomerations in the world. As the capital of the Russian Federation, it is a large financial and administrative center. Air pollutant levels in Moscow are consistent with those in other megacities in Europe and North America (Elansky, 2014; Elansky et al., 2018). BC measurements in the center of Moscow have revealed substantially lower levels of air pollution than in Beijing (Golitsyn et al., 2015). The levels of BC concentration are similar to those in European cities, which indicates the comparable impacts of major urban sources such as traffic with intensive implementation of modern environmental requirements, heating power plants and manufacturing industries (Popovicheva et al., 2020, 2022).
The main tasks of this paper concern the analysis of the aerosol properties at the surface and in the atmospheric column, their relationship with meteorological parameters in Moscow, and evaluation of aerosol pollution as the difference between the aerosol properties in the Moscow megacity and in pristine conditions using the results of the chemical transport model and the data obtained during the intensive measurement campaigns over the Moscow region in the spring periods of 2018 and 2019.

Figure 1Location of CIMEL sun/sky AERONET photometers at the Meteorological Observatory of Moscow State University (MSU MO) and at the Zvenigorod Scientific Station (ZSS) of the A. M. Obukhov Institute of Atmospheric Physics, Moscow region.
2.1 The description of measurements and model experiments
For a detailed study of the properties of atmospheric aerosol and its urban component, a complex experiment has been organized in Moscow. It consisted of intensive measurement campaigns at the Meteorological Observatory of Moscow State University (MSU MO), located at 55.7∘ N, 37.52∘ E (Fig. 1), and model simulations by the COSMO-ART (COSMO – COnsortium for Small-scale MOdelling, ART – Aerosols and Reactive Trace gases) online coupled mesoscale model system (Vogel et al., 2009, 2010), which is based on the operational weather forecast COSMO model developed at the Deutscher Wetterdienst (Baldauf et al., 2011). The numerical experiments were made using the Russian COSMO-Ru-ART configuration (Vil'fand et al., 2017) of COSMO-ART over the whole Moscow area and the surrounding areas. The measurement campaign and model simulations covered the periods of April–May 2018 and 2019.
2.1.1 Measurements
The MSU MO is located in the territory of the MSU Botanical Garden in the park area at a distance of several kilometers from the local sources of emissions (power stations). The nearest highways are about 300–450 m away from the site. During the intensive measurement campaigns, the mass concentrations of various gas aerosol species at the Earth's surface and aerosol characteristics in the total atmospheric column were studied together with meteorological observations.
The gas and aerosol measurements at the surface consisted of mass concentrations of particulate matter with diameters smaller than 10 µm (PM10) and BC, different aerosol gas precursors and other gas species (NO, NO2, SO2, volatile organic compounds – VOCs – marked as CHx, CO) with a 20 min time resolution. These observations were operated by the Mosecomonitoring State Environmental Protection Agency (2022). For PM10 measurements, the TEOM 1400a (Thermo Environmental Instruments Inc., USA) was used. Internationally certified OPTEC Russian instruments (http://www.optec.ru, last access: 13 January 2022; OPTEC, 2022) were applied to measure gas species mass concentrations of NO, NO2, SO2 and CO. The Gamma-ET instrument (http://etek-ltd.ru, last access: 26 January 2022; Gamma-ET, 2022) was used for the CHx measurements. The description of the quality assurance (QA) procedures is given at http://mosecom.mos.ru (last access: 26 January 2022).
Aerosol equivalent BC (eBC) mass concentrations were measured with 1 min resolution using a custom-made portable aethalometer (Popovicheva et al., 2017). With this instrument the light attenuation caused by the particles depositing on a quartz fiber was analyzed at three wavelengths (450, 550 and 650 nm). The eBC concentrations were determined by converting the time-resolved light attenuation to eBC mass at 650 nm and were characterized by a specific mean mass attenuation coefficient, as described in Popovicheva et al. (2017). The calibration parameter for quantification of eBC mass was derived during parallel long-term measurements against an AE33 aethalometer (Magee Scientific) that operates at the same three wavelengths. More details can be found in Popovicheva et al. (2020).
Aerosol measurements in the atmospheric column were carried out using the CIMEL sun/sky photometer, which has been operated at Moscow State University in the framework of the AERONET program since 2001 (Holben et al., 1998; Chubarova et al., 2011a). We analyzed AOD in the spectral range from 340 to 1020 nm, fine and coarse AOD modes at a wavelength of 500 nm (O'Neill et al., 2001), the Ångström extinction exponent (AEE) and the Ångström absorption exponent (AAE) in the spectral range of 440–870 nm, single-scattering albedo (SSA) at 675 nm and an asymmetry factor at 675 nm for various aerosol modes calculated in accordance with the AERONET algorithms (Dubovik and King, 2000). The latest version 3.0 level-2 AERONET dataset was used in the analysis (Giles et al., 2019). Its detailed testing revealed that the new algorithm of automatic cloud filtration, applied in this version, worked much better than the old one, with the exception of the winter months (Chubarova, 2020). As a result, we did not apply additional cloud filtering, as has been previously done (Chubarova et al., 2016). During daytime the dataset has 15 min resolution of the aerosol characteristics obtained from the direct sun measurements and 1 h resolution from sky measurements. For comparisons with model AOD at 550 nm (AOD550), we recalculated measured AOD at 500 nm (AOD500) to AOD550 using the AEE parameter.
We also used meteorological observations (air temperature, atmospheric pressure, wind speed, wind direction) with 1 min resolution from the Vaisala MAWS-301 automatic weather station as well as the standard meteorological MSU MO measurements with 3 h resolution. In addition, the index, characterizing the intensity of particle dispersion (IPD) proposed in Kuznetsova et al. (2014), has been applied in the analysis. This index is calculated using a set of meteorological parameters, including atmospheric pressure conditions, the type of atmospheric circulation, the stratification of the atmosphere, wind speed up to 850 hPa and level of precipitation. The IPD index varies from 1 to 3. The conditions with IPD = 1 are characterized by a stable stratification of the atmosphere, a low-gradient baric field, low wind speed conditions and the absence of precipitation. At IPD = 3 the opposite picture is observed with intensive air mixing conditions, high wind speed, precipitation, unstable stratification and frontal zones. In our study the 1 h resolution IPD index is evaluated using the 24 h COSMO mesoscale model forecast. Finally, all the data were combined in the 1 h resolution dataset.
2.1.2 COSMO-ART mesoscale model system and numerical experiments
The urban aerosol characteristics were calculated using the COSMO-Ru-ART model system (Vogel et al., 2010; Vil'fand et al., 2017; Rivin et al., 2019) with a horizontal grid step of 7 km and a time resolution of 40 s over the 1000×1000 km area. In this model system meteorological simulations were performed by the COSMO mesoscale model (http://www.cosmo-model.org/, last access: 27 January 2022; COSMO, 2022), an operational weather prediction model at the Russian Hydrometeorological Centre (Rivin et al., 2019).
Since the main objective of our study was to evaluate aerosol pollution in Moscow at the MSU MO and in upwind background conditions, we did not focus on detailed variations of aerosol inside the city and used a 7 km grid step for model simulations.
The gas aerosol concentrations are simulated using the ART chemical transport model, which is coupled with the COSMO model. The COSMO-Ru-ART mesoscale model system reproduces chemical transformations of substances in the gas-phase and heterogeneous reactions, photolysis, nucleation, coagulation, condensation, emissions of various types of aerosols and dry and wet aerosol deposition (Vogel et al., 2010; Vil'fand et al., 2017). About 172 chemical reactions are used in the ART model to describe chemical processes in the troposphere. One of the most important features of COSMO-Ru-ART is the parallel calculation of meteorological parameters and chemical transformations at each time step, which allows a user to take into account the reverse effect of aerosols on radiation and meteorological characteristics of the atmosphere.
The simulations of reactive gaseous and particulate matter are based on the enhanced KAMM/DRAIS/MADEsoot/dust model (Riemer et al., 2003; Vogel et al., 2006, 2010). In MADEsoot (Modal Aerosol Dynamics Model for Europe extended by soot), all aerosol modes are represented by lognormal distributions. Five modes for Aitken and sub-micron aerosol particles include one pure soot mode, secondary particles consisting of sulfate, ammonium, nitrate, organic compounds (SOA), as well as the modes representing aged soot particles, consisting of sulfate, ammonium, nitrate, organic compounds, water, and soot. It also includes the coarse particle mode, which contains additional anthropogenic emitted particles. All aerosol fractions are subject to coagulation and condensation following Whitby et al. (1991), Kerminen and Wexler (1994), Binkowski and Shankar (1995), Odum et al. (1996) and Schell et al. (2001). The soot particles are directly emitted into the atmosphere. Coagulation and condensation are accounted for in transfer of soot from external to internal mixtures. The Aitken and sub-micron particles are formed due to the aging process. For each mode prognostics equations for the number density and the mass concentration are solved numerically. The standard deviations are kept constant. Since the number densities of the coarse mode are small, the inter-modal coagulation between the coarse mode and the other modes and the intra-modal coagulation of the coarse-mode particles are both neglected. Additionally, the aerosol distributions are modified by the sedimentation, advection and turbulent diffusion processes. More details can be found in Vogel et al. (2010). The resuspension of urban dust with stronger winds currently is not taken into account. The chemical reactions of the gaseous species are calculated using the chemical mechanism RADMKA (Regional Acid Deposition Model Version Karlsruhe) based on RADM2 (Regional Acid Deposition Model; Stockwell et al., 1990), with the important updates described in Vogel et al. (2010). The photolysis frequencies were simulated according to Vogel et al. (2009). For the evaluation of the aerosol optical properties (the extinction coefficient, the SSA and the asymmetry factor), a special parameterization scheme is used based on the a priori calculations with the application of the approach described in Bohren and Huffmann (1983) and pre-calculated aerosol distributions. This procedure is based on typical size distributions and chemical compositions, which are simulated in the model domain.
As a result, using the COSMO-Ru-ART model system, we can quantify the rate of formation of new aerosol particles and aerosol gas precursors in the polluted urban atmosphere in real atmospheric conditions, which in turn are modified by the updated chemical composition. The data of the forecast of the COSMO-Ru system (Rivin et al., 2019) and the global ICON model were used as initial and boundary conditions.
In addition, for the operation of the ART model, the data from the Global Land Cover 2000 project on land use and inventory data from TNO2010 (Netherlands Organization for Applied Scientific Research, https://www.tno.nl/en/, last access: 28 January 2022; TNO, 2022) were applied to determine anthropogenic emissions of pollutants. The 1 h resolution TNO2010 emission inventory has been developed using official reported emissions data by source category and combining them with other estimates where needed (Kuenen et al., 2014). Urban aerosol sources according to TNO2010 include direct emission of particulate matter of undefined composition (as a dust fraction) and soot as well as the gas aerosol precursors of sulfate, organic, and nitrate secondary aerosols. The model also accounts for relatively small natural biogenic emissions of non-methane volatile organic compounds from the Global Land Cover 2000 project, which are the gas precursors of organic aerosol. Testing the model estimates with the TNO2010 and TNO2003–2007 inventory datasets against observations provided much better agreement for urban aerosol when TNO2010 was used (Chubarova, 2020). This enables us to apply the TNO2010 inventory in this study. The preliminary comparisons with the modern CAMS inventory dataset for 2019 also showed agreement of the urban aerosol estimates. The spatial distribution of monthly mean aerosol gas precursor urban emissions, including SO2, NOx, non-methane volatile organic compounds (NMVOCs) as well as direct emissions of BC and PM10 over the Moscow area for April and May, is shown in Fig. 2. One can see that most of the urban emissions are observed over the center of the Moscow megacity due to the influence of traffic. In April the emissions of SO2 and NOx are larger due to the heating season.
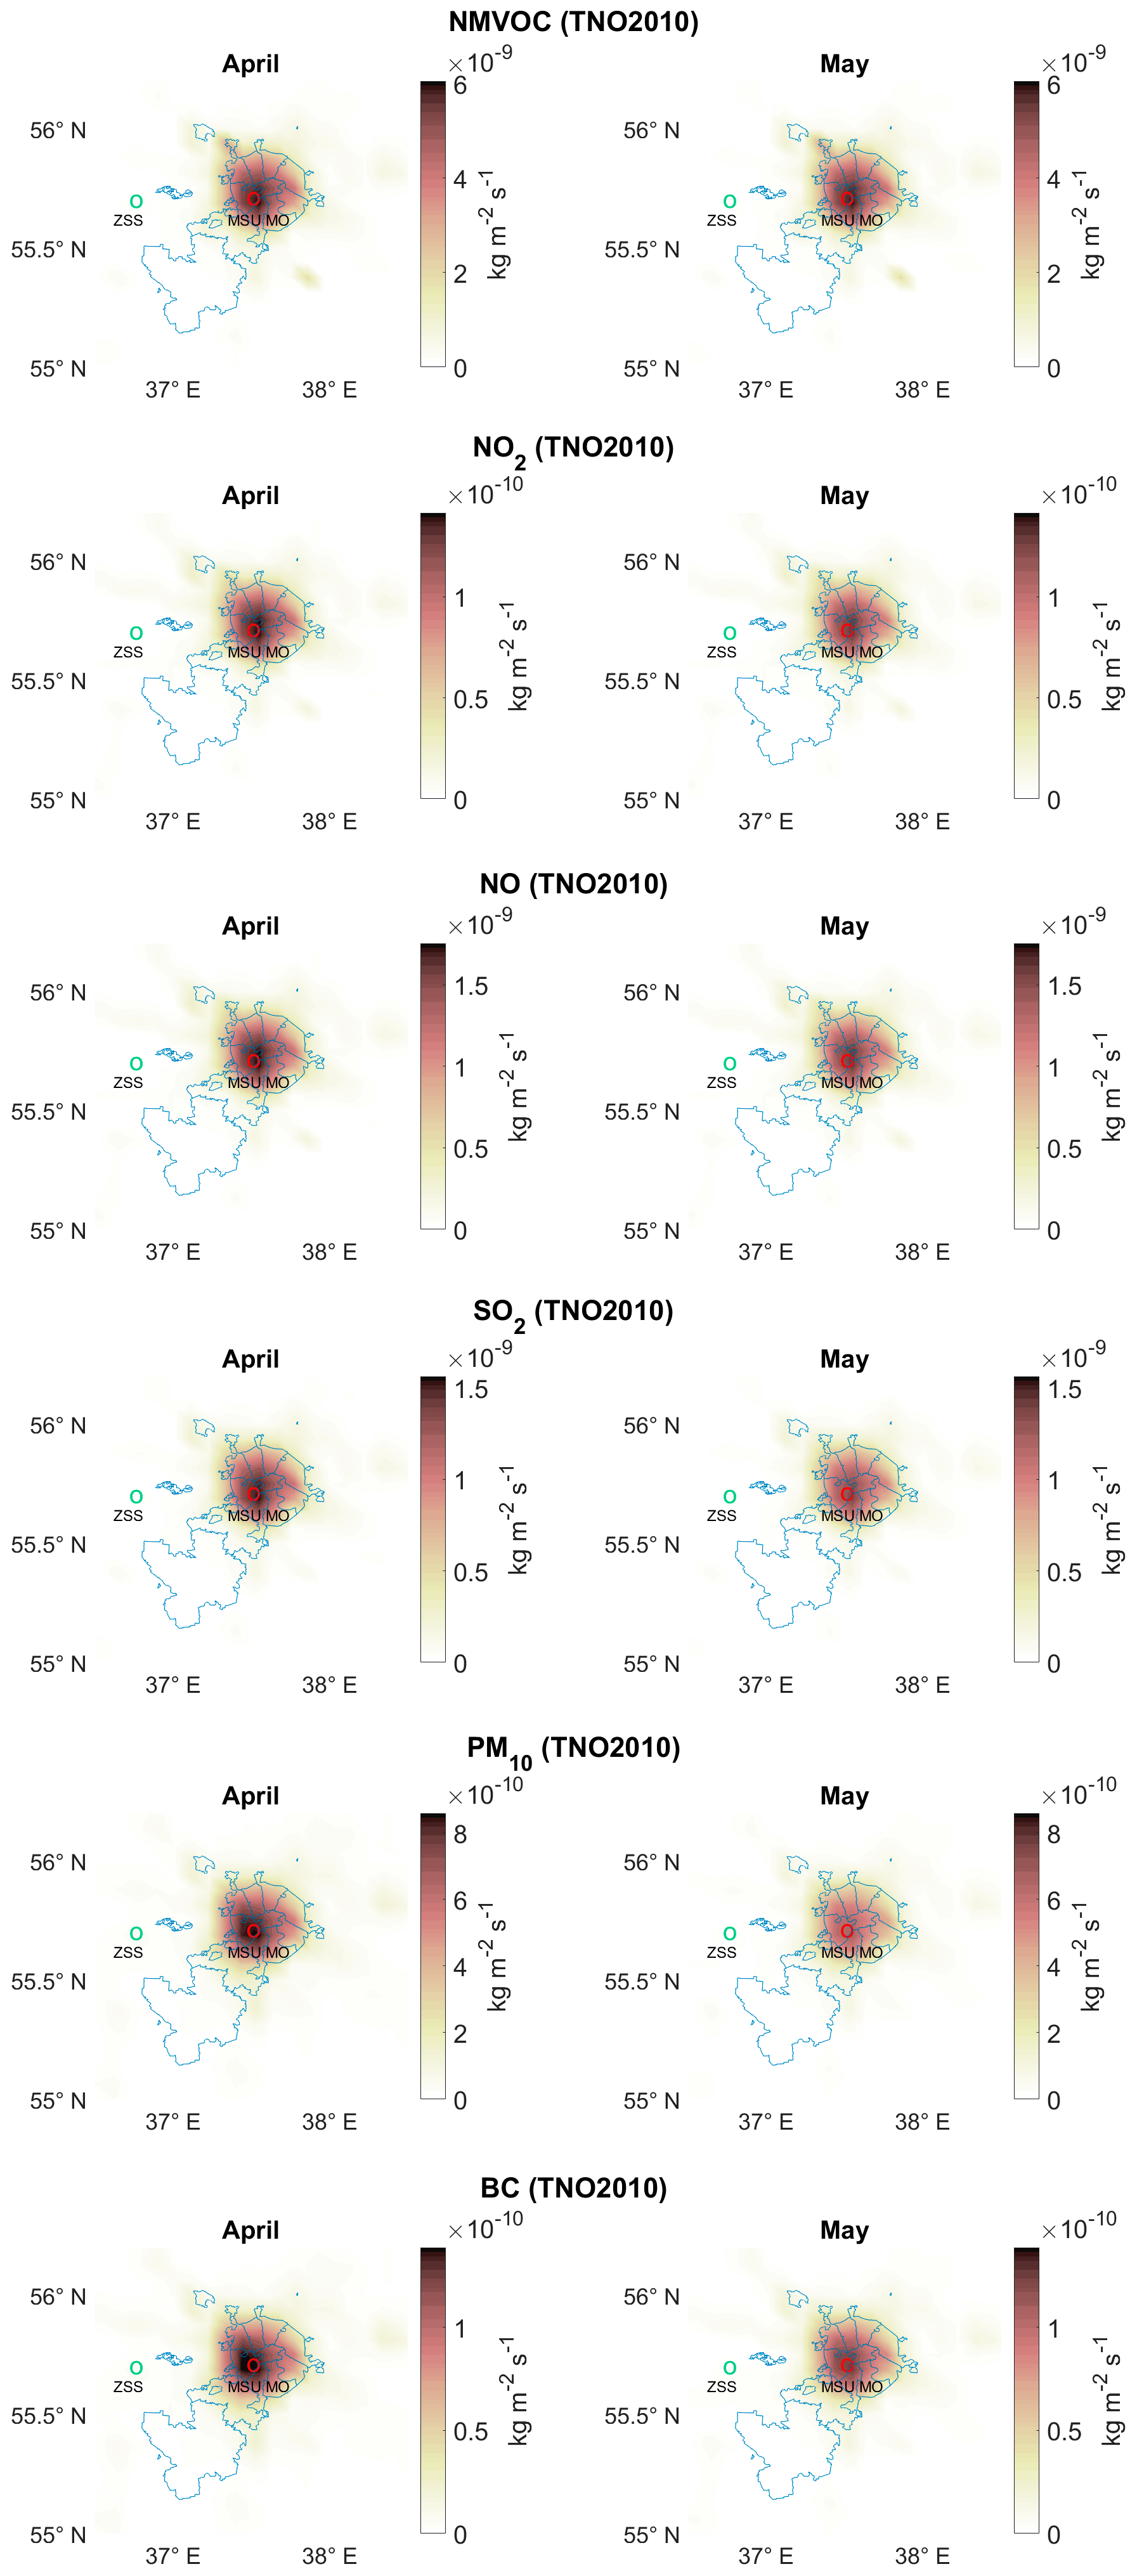
Figure 2Monthly mean emissions of aerosol gas precursors, PM10 and BC emissions according to the TNO2010 inventory in April and May in the Moscow region. The location of the Moscow State University Meteorological Observatory is shown by a red circle and the Zvenigorod site by a green circle.
Aerosol concentrations at the borders of the simulated area were assumed to be close to zero to exclude the influence of regional background aerosol and aerosol gas precursor effects. So, the simulated gas and aerosol concentrations are associated mainly with the urban Moscow emissions, except for small biogenic ones. The time set for aerosol generation was equal to or higher than 31 h, in accordance with the recommendations of the model developers (Bernhard Vogel, private communication, 2020). Thus, we mainly consider the simulation of the anthropogenic components of the surface mass concentrations of PM10, BC and aerosol gas precursors as well as the columnar urban component of aerosol optical depth at 550 nm and SSA.
2.2 Evaluation of the urban aerosol component
To identify the urban component of aerosol, we compared the results of parallel measurements and model simulations over the MSU MO and Zvenigorod Scientific Station (ZSS) of the A. M. Obukhov Institute of Atmospheric Physics (IAP) (55.7∘ N, 36.8∘ E) located 55 km to the west of the MSU MO (see Fig. 1). Due to prevailing westerlies and the location of the ZSS site far from local anthropogenic emissions (see Fig. 2), it can be characterized as a background pristine site. This kind of diagnostic provides us with reliable estimates of the urban aerosol effect over the Moscow megacity.
The urban component of columnar aerosol optical depth from both measurements and modeling was estimated as the difference between the data at the MSU MO (marked as Moscow) and at the background ZSS site (marked as Zven):
In a similar manner, we estimated the urban components of some other columnar aerosol parameters, such as AEE and the fine and coarse modes of AOD at 500 nm.
At ZSS the AERONET measurements have been in operation since 2006; therefore, the parallel measurements between Moscow and Zvenigorod were analyzed for the 2006–2020 period. The time difference between the two instant measurements in these sites is only 3 min.
A similar approach was used for evaluating the urban component of PM10 mass concentration:
In Zvenigorod the PM10 mass concentration was also measured with the help of the TEOM 1400a instrument by the Mosecomonitoring Agency. Since the data were available only for 2018, the comparisons of the PM10 urban component were made only for this year.
We consider our BC measurements in Moscow to provide the pure BCurb component, whereas black carbon is mainly formed and emitted in the urban environment (see Fig. 2).
The joint use of aerosol measurements and modeling in the atmosphere of the Moscow region provides the more reliable assessment of urban aerosol pollution.
In order to have more accurate evaluation of the urban aerosol component, it was necessary to remove the cases with the influence of smoke aerosol, which has different optical properties (Dubovik et al., 2002; Liu et al., 2018). For the initial information on the location of the biomass burning event, we used the FIRMS (FIRe Monitoring Service) dataset (https://firms.modaps.eosdis.nasa.gov/, last access: 31 January 2022). After identification of biomass burning spots, we applied the backward-trajectory analysis using the READY system (Rolph et al., 2017) with the help of the HYSPLIT visualization model at a height of 0.5–3 km (Stein et al., 2015). We consider the air mass to be affected by biomass burning aerosol if the cases are detected within 50 km of the line of particle motion. If the number of biomass burning spots was smaller than 5, in addition, we analyzed AAE measurements from AERONET at the MSU MO and used the threshold of AAE <1 to reveal typical aerosol for the Moscow area. During the low-temperature biomass burning process, the AAE values should be higher than 1 because of much intensive absorption at shorter wavelengths (at 440 nm in our case) by organic carbon (Kirchstetter et al., 2004; Sun et al., 2017). More details of this method can be found in Chubarova et al. (2021).
It should be noted that this procedure has been applied only for the comparisons between modeled and measured aerosol parameters, since no fire emissions have been accounted for in the model simulations.
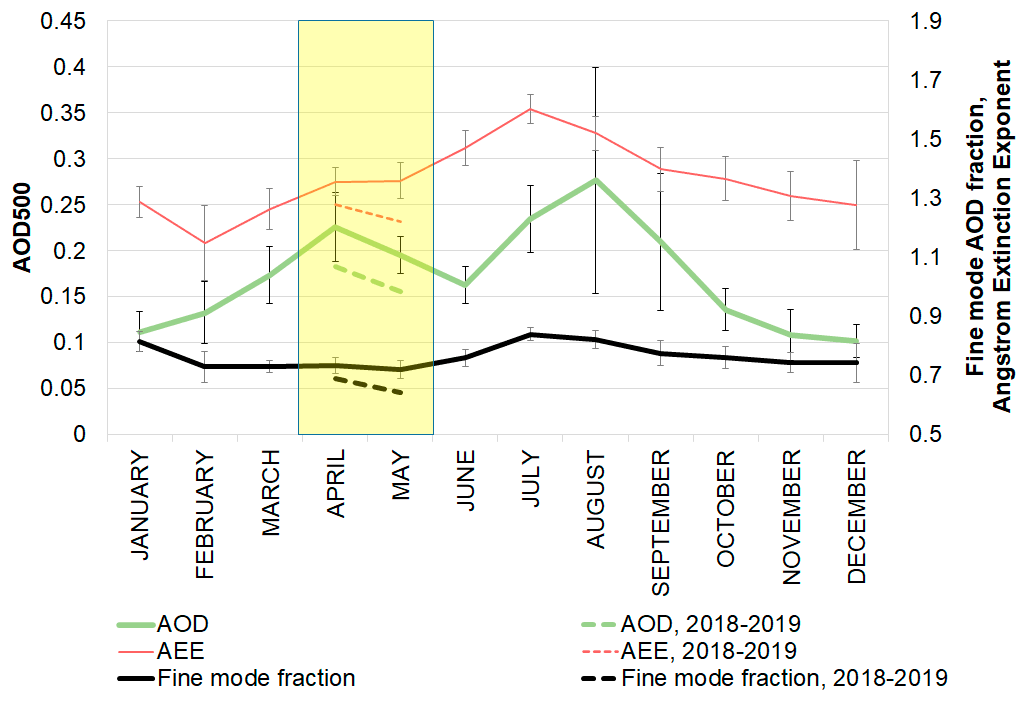
Figure 3Seasonal changes in monthly mean AOD at 500 nm, Ångström extinction exponent (AEE) at the 440–870 nm interval and fine-mode AOD fraction at 500 nm for the 2001–2020 period and for the April–May months in 2018 and 2019. Level 2, version 3. Moscow, MSU MO. The period of the study is shown by the yellow column.
3.1 Aerosol characteristics in Moscow according to long-term AERONET measurements
In order to understand whether or not the aerosol features during the intensive experiment were representative for the whole warm period, we analyzed the results of long-term aerosol measurements using the MSU MO AERONET dataset from 2001 to 2020. Figure 3 presents the seasonal variability of the AOD at 500 nm (AOD500), its fine and coarse modes and the AEE according to long-term observations and, in particular, for April and May in 2018 and 2019. One can see a noticeable AOD500 increase during the warm period. The spring maximum of AOD500 is associated with the descent of snow cover and the effects of seasonal agricultural biomass burning in conditions with low precipitation typical for this period (Chubarova et al., 2014). The elevated spring AOD500 values are accompanied by a lower AEE, which also is in agreement with the slightly smaller fraction of the fine-mode AOD500. The summer AOD500 maximum is associated with the active formation of submicron aerosol with a fine-mode AOD500 fraction higher than 80 %. The April–May period of 2018–2019 is characterized by slightly lower AOD500, which is in agreement with a negative AOD500 trend in Moscow in recent years (Chubarova et al., 2016; Zhdanova et al., 2020). The lower fraction of fine-mode aerosol (64 % compared with 71 %–73 %) may also indicate the decrease in the formation of secondary aerosol due to the effective reduction of urban gas precursor emissions in Moscow (Zhdanova et al., 2020). However, in general, the aerosol conditions in April and May of 2018–2019 correspond to those during the warm period, with a slightly reduced AOD500 and its fine-mode fraction, which corresponds to the observed trends of purification of the Moscow atmosphere in recent years.
Table 1Statistics of hourly mean aerosol characteristics in the total column of the atmosphere and at the surface, including aerosol optical depth (AOD at 500 nm), Ångström extinction exponent, fine-mode fraction at 500 nm, single-scattering albedo (SSA) at 675 nm, factor of asymmetry (ASY) for fine, coarse and total aerosol at 675 nm, water vapor content (W, cm) and surface mass concentrations of PM10, BC, different aerosol gas precursors and the ratio. Moscow, April–May 2018–2019.
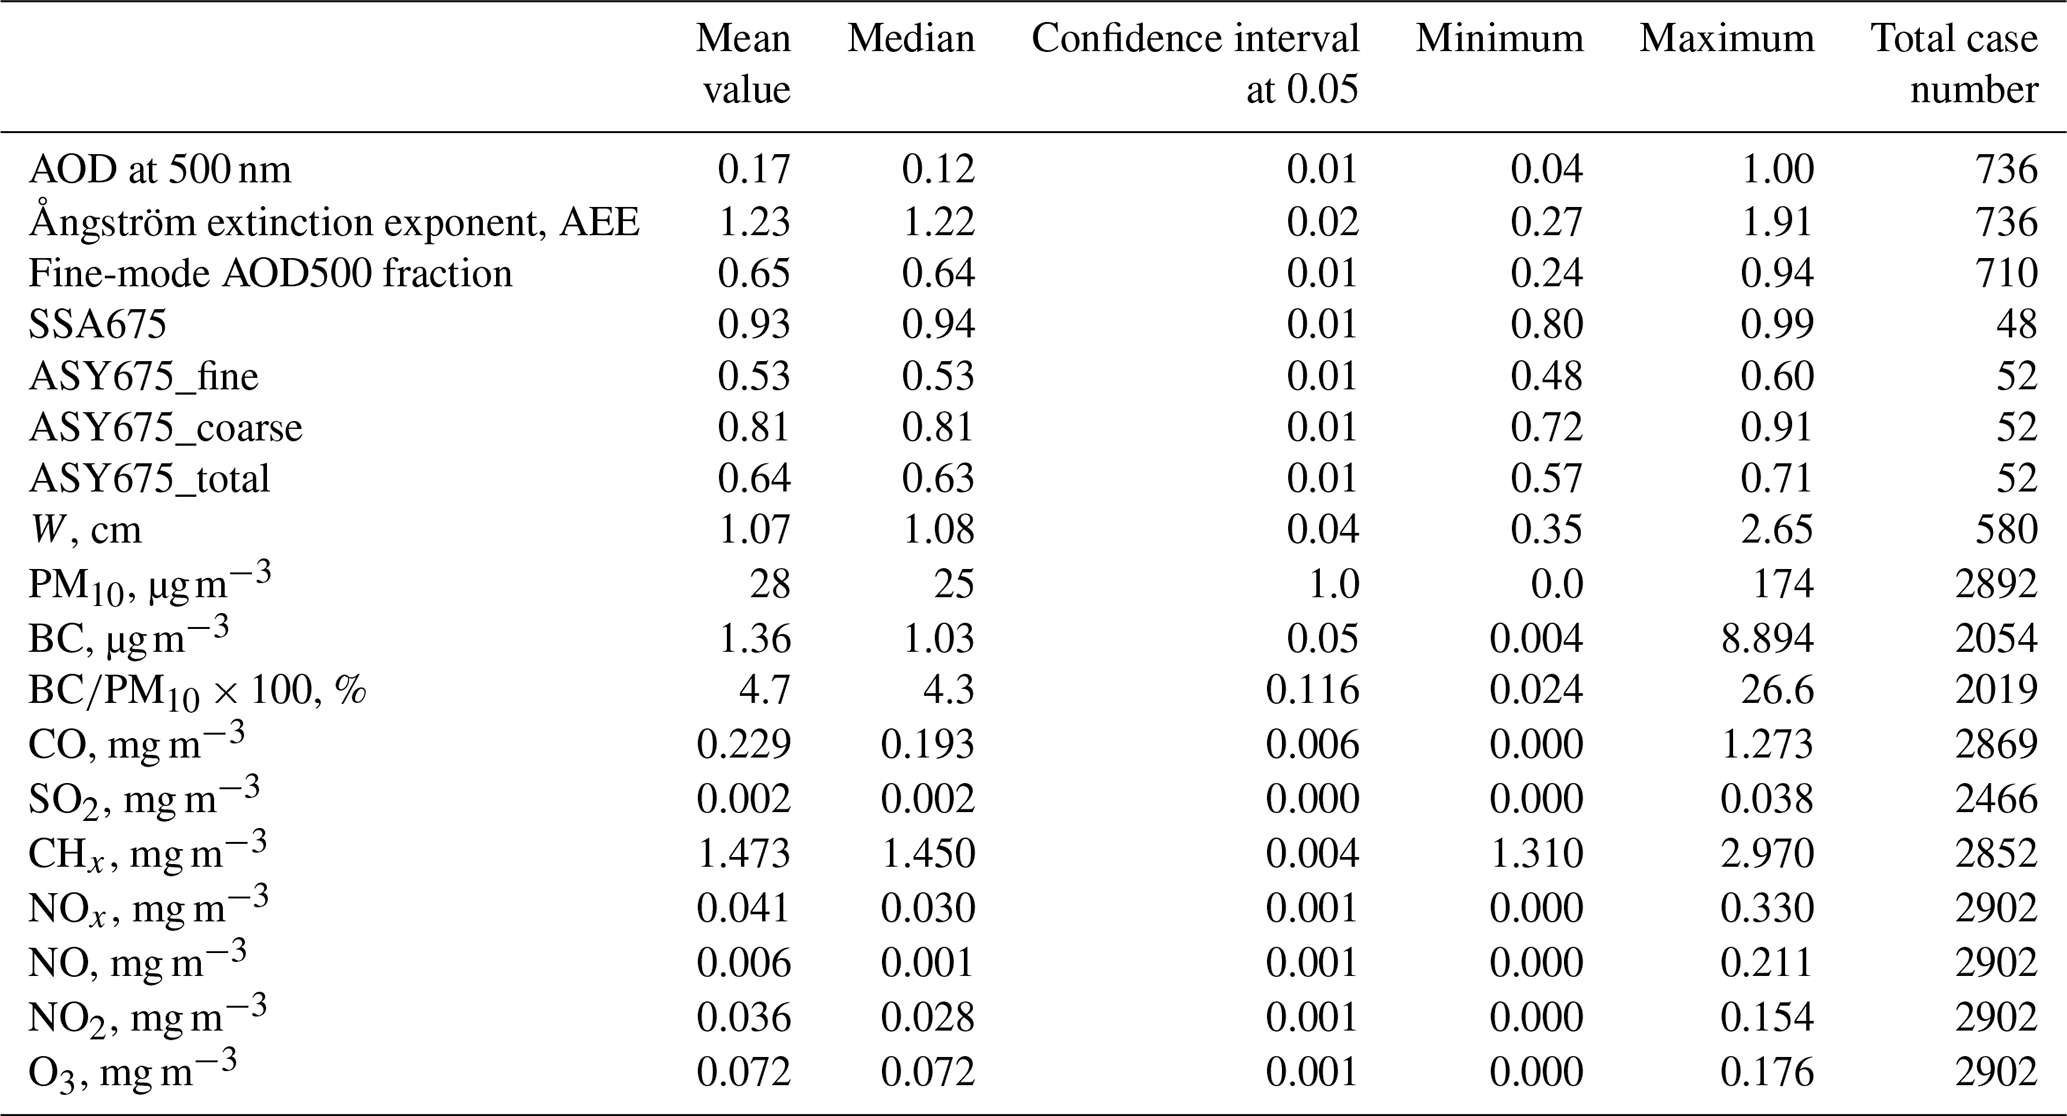
Note: the case number is different, since columnar aerosol characteristics can be measured only during daytime, and some of them only in semi-clear-sky conditions.
3.2 The main characteristics of aerosol, aerosol gas precursors and their relationship according to the intensive measurement campaigns of 2018–2019
Table 1 shows the statistics of aerosol and gas parameters of the atmosphere during the spring intensive measurement campaigns in 2018 and 2019. The median value of AOD at 500 nm is small (0.12), corresponding to its level in central and northern Europe (Chubarova, 2009; Filonchuk et al., 2019) with the predominance of the fine aerosol mode. The median PM10 value of 25 µg m−3 is also relatively small and significantly lower than the PM10 concentrations in Chinese megacities, where average concentrations exceed 100 µg m−3 (Kislov, 2017). However, for some days (16 April 2018, 22, 25 and 27 April 2019), we observed elevated PM10 levels exceeding the threshold of the daily maximum allowable concentration of 60 µg m−3 adopted as the Russian standard. The median value of SSA = 0.94 is typical for slightly absorbing aerosol, which is in agreement with the rather low ratio (4.3 %) and relatively low mean concentrations of BC (1.03 µg m−3). However, during some conditions in Moscow we observe an increase in hourly BC up to 8.9 µg m−3. This corresponds to high BC concentrations of about 5.5–9 µg m−3, which are observed in Dhanbad, India (Singh et al., 2015), and Guangzhou, China (Wu et al., 2013). Over remote unpolluted areas, however, BC concentrations are about 0.4–0.5 µg m−3 (Bhugwant and Brémaud, 2001; Herich et al., 2011). Due to the predominance of the fine aerosol fraction, the asymmetry factor of the aerosol-phase function is relatively small (about 0.63 when considering both the fine and coarse aerosol modes), which also corresponds to relatively high AEE values (Dubovik et al., 2002).
The analysis of the aerosol gas precursors has revealed very low concentrations of sulfur dioxide in Moscow, while nitrogen oxides are traditionally high due to heavy traffic in the city and emissions from power plants (Kulbachevsky, 2020).

Figure 4Daily means of AOD500, fine-mode AOD fraction at 500 nm, PM10 (mg m−3) and aerosol gas precursor (NOx, CHx) mass concentrations (mg m−3), BC PM10 ratio, water vapor content (cm) and IPD index in 2018 (a) and 2019 (b).
Figure 4 presents the time series of daily mean AOD at 500 nm, PM10, as well as the concentrations of the main aerosol gas precursors during the intensive campaigns. To characterize meteorological conditions, we also show daily variability of water vapor content W and the IPD indices. There are large variations in both surface and columnar aerosol characteristics of the atmosphere during these periods. In the stable atmosphere with a daily mean IPD of about 2, elevated columnar and surface aerosol loadings are observed (for example, on 12–16 April 2018, 14–16 May 2018 and 20–22 April 2019). However, during the days affected by the advection of biomass burning aerosol (for example, 1 May 2018 or 27 April 2019), there is high aerosol loading even in good air mixing conditions at IPD = 3. These days are also characterized by the elevated NOx concentrations due to the active chemical transformation affected by forest fires (Jin et al., 2021). Note that the high NOx level is observed in spite of low traffic due to weekends (27 April 2019) or holidays (1 May 2018).
Table 2Correlation matrix between hourly mean different aerosol characteristics, aerosol gas precursors and meteorological parameters. April–May 2018–2019. N=230. Statistically significant correlation coefficients at a significance level of 0.05 are shown in bold.
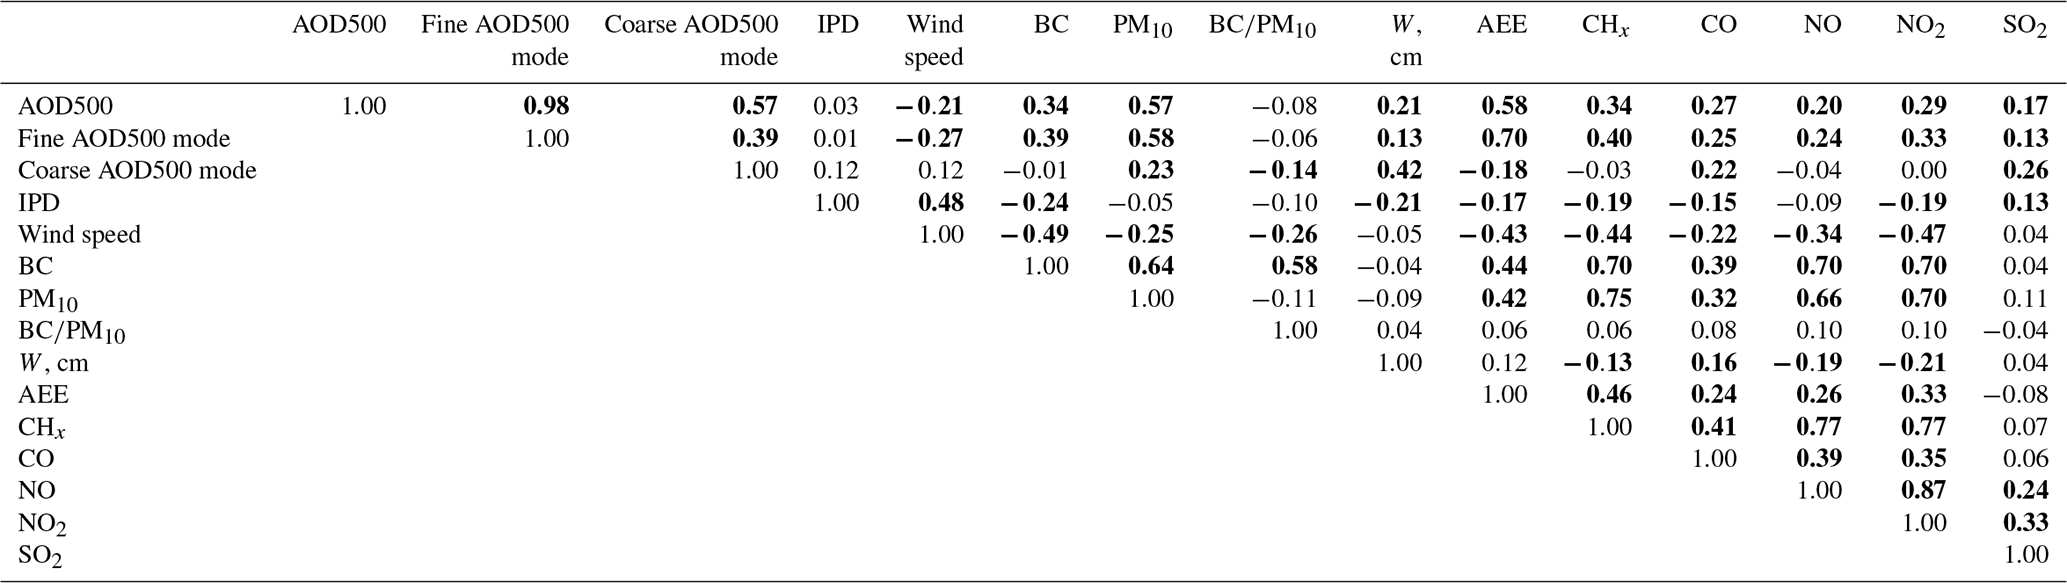
A correlation matrix has been estimated for evaluating the relationship between different columnar and surface aerosol characteristics, aerosol gas precursors and meteorological parameters (Table 2). There is a high correlation between AOD500 and fine AOD500 mode, which is dominant in central and eastern Europe (Logothetis et al., 2020). The prevailing fine-aerosol-mode fraction is also observed in PM10 for urban conditions over central and northern Europe (see, for example, Fig. 10 in Wu and Boor, 2021). Relatively high correlation is detected between surface measurements of PM10 with BC and aerosol gas precursors, except SO2, which indicates the importance of these substances for aerosol formation. We also obtained a statistically significant but not very high correlation of columnar AOD500 with surface PM10 and BC. Fine AOD500 mode has a slightly higher correlation with BC, which could be explained by the fine-mode BC composition (Bond et al., 2013). The importance of secondary urban aerosol in columnar fine-mode AOD500 (Dubovik et al., 2002) has also been proven by a statistically significant correlation between fine AOD500 mode and aerosol gas precursors (NOx, SO2, CHx); however, the correlation coefficients are not high due to the complexity of the chemical and meteorological processes.
A positive correlation between water vapor content W in the atmospheric column and the aerosol parameters has revealed more favorable processes of aerosol formation in relatively warmer and wetter air masses. In addition, the advection of cold air masses with small W and aerosol loading from northern regions may also be an important cause of this correlation (Szkop et al., 2016). There is also a statistically significant but not very high negative correlation of AOD with surface wind speed due to the ventilation effect in the urban environment, which occurs due to blowing of the urban aerosol out of Moscow. A decrease in AEE and, correspondingly, decrease in the fine AOD fraction with the increase in wind speed may also be associated with less effective fine-mode aerosol generation due to better ventilation conditions and with possibly more effective urban coarse aerosol-mode dust resuspension in stronger winds (Hosiokangas et al., 2004; Amato et al., 2009). This is also in accordance with statistically significant correlation between wind speed and aerosol gas precursors. The exception is sulfur dioxide, whose concentrations are extremely small in Moscow (see Table 1), and therefore large errors can be observed when detecting these relations. The pronounced negative correlations with wind speed were found for surface aerosol species, such as PM10 and, especially, BC. Negative correlation between BC and wind speed was also shown in Chen et al. (2014) and Popovicheva et al. (2020). Note that the observed negative correlation of the ratio with wind speed may lead to the decrease in the absorbing properties of the atmosphere in case of high wind speed.
A statistically significant but not high correlation between surface aerosol gas precursors and IPD indices confirms more favorable conditions for intense air mixing, which, as a result, provide a decrease in aerosol gas precursor mass concentration. However, the correlation of columnar AOD and PM10 with the IPD index, in contrast to wind speed, is not statistically significant, probably due to the considerable contribution of natural aerosol in AOD and PM10 in Moscow. The closer relationship of wind speed and IPD with BC compared with PM10 indicates a more important role of local meteorological situations for black carbon, since urban emissions of pollutants are the main source of BC, while PM10 has a regional aerosol source, which undergoes significant variations (Air quality in Europe, 2020). The smaller PM10 negative correlation with wind speed could also be explained by the effects of dust resuspension in stronger winds (Hosiokangas et al., 2004; Amato et al., 2009).
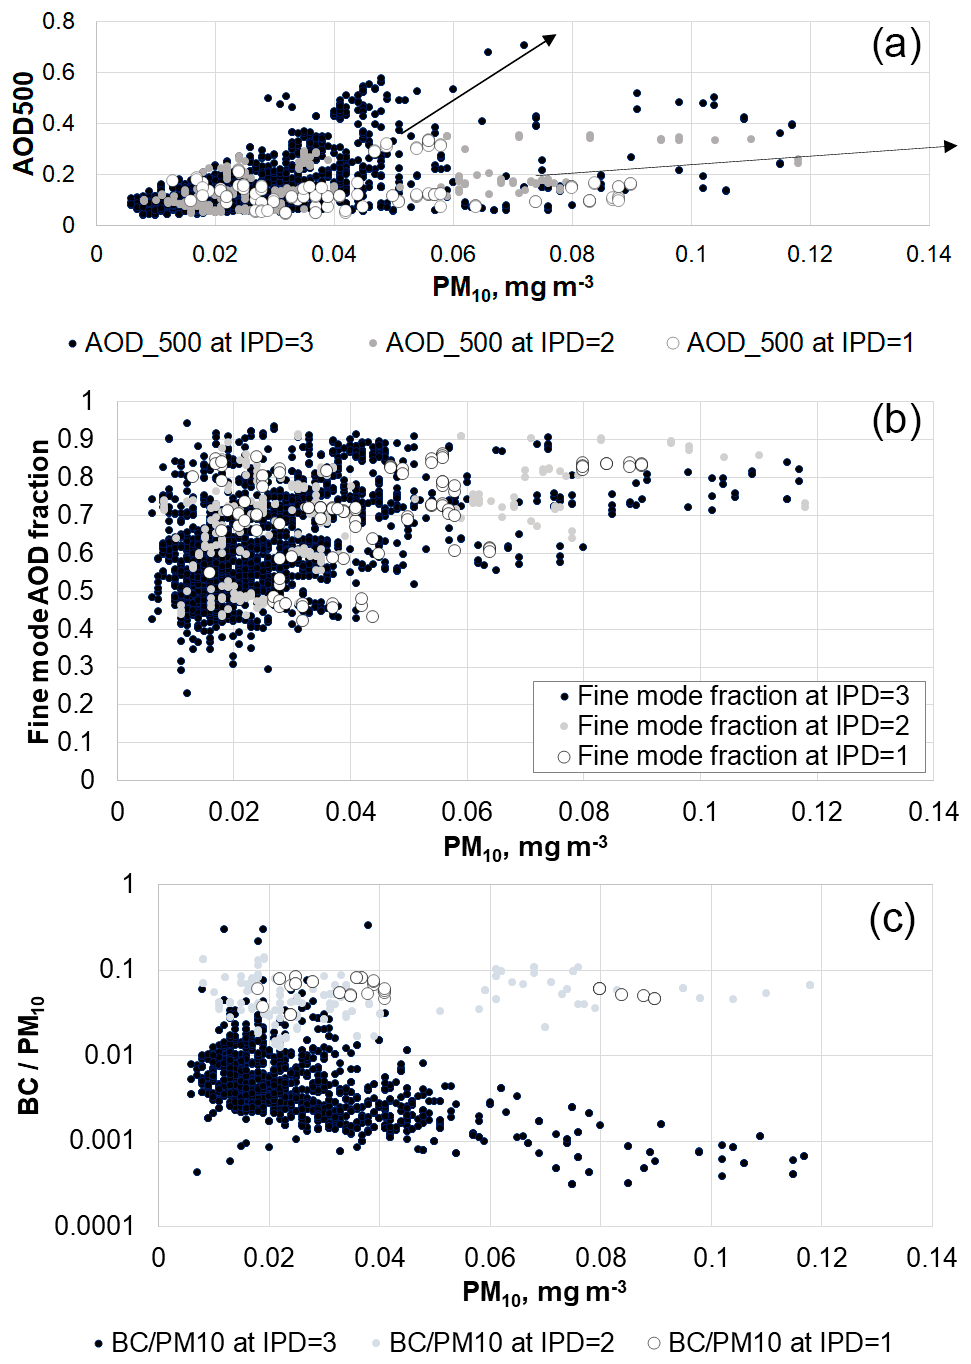
Figure 5AOD at 500 nm (a), fine-mode fraction of AOD at 500 nm (b), and BC PM10 ratio (c) as a function of PM10 mass concentration (mg m−3) under various IPD mixing air conditions.
A more detailed analysis of the relationship between AOD500 and PM10 surface mass concentrations, shown in Fig. 5a, demonstrates that, along with the existence of generally not very high correlation (see Table 2), there is a split into two types of dependences at a point of bifurcation of PM10 ∼0.05 mg m−3. A weaker AOD500 dependence versus PM10 characterizes the accumulation of PM10 only in the low layer (due to the local emission sources near the surface) in the absence of the considerable AOD500 increase, with many cases at IPD = 1 relating to the low intensity of particle dispersion. A more pronounced dependence between AOD500 and PM10 is associated with the influence of air mass advection, when the concentration of surface particles increases simultaneously with AOD500. In this case only a few cases at IPD = 1 are observed (Fig. 5a). The increase in PM10 is also connected with the significant increase in the fine-mode AOD500 fraction and the total absence of its low values at high PM10 levels (Fig. 5b). The existence of these two dependences may explain the not very high correlation between AOD500 and PM10 for the whole dataset.
There are also noticeable variations in the ratio, depending on PM10 and IPD (Fig. 5c). In well-mixed air conditions (IPD = 3), much lower values of the ratio are observed: in most cases, they are smaller than 0.01 and decrease with the growth of PM10. This corresponds to the situation when there is advection of air outside of Moscow, with a high natural aerosol content but with a relatively low BC content. On average, at IPD = 3, the ratio is equal to 0.7 %. At the same time, with the IPD decrease, the ratio becomes higher with mean values of 5.5 % and 5.9 %, respectively, at IPD = 2 and IPD = 1. Thus, the use of IPD data may significantly refine the level and, as a result, the absorbing properties of the atmosphere.
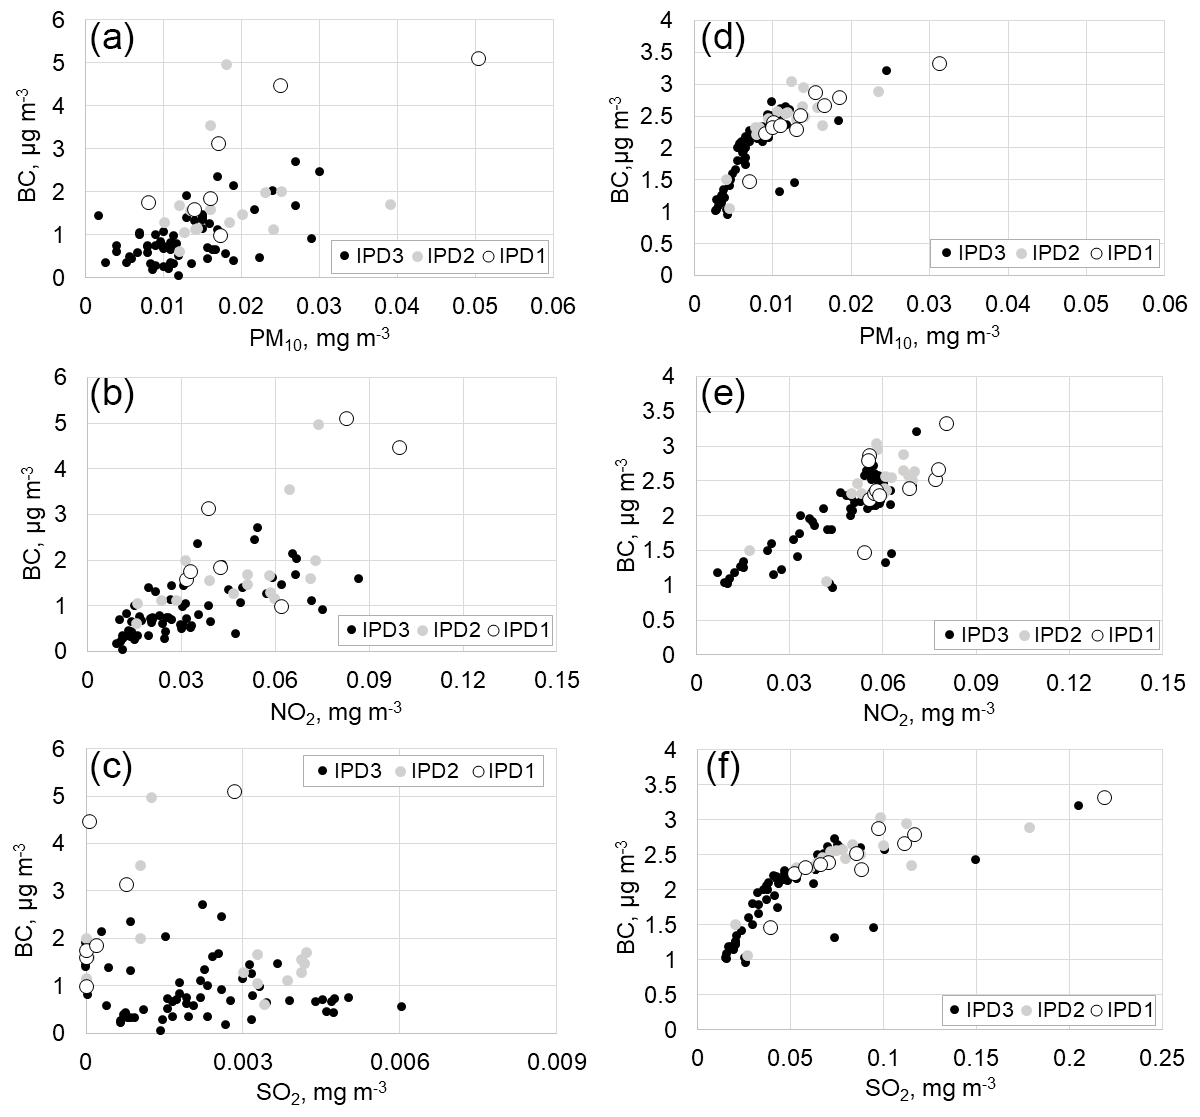
Figure 6The dependence of measured (left column) and model (right column) BC mass concentrations as a function of PM10 (a, d) and aerosol gas precursors (NO2 – b, e; SO2 – c, f) for different IPD regimes for April–May 2018. The cases affected by biomass burning aerosol were excluded.
Figure 6 presents the scattering diagrams of BC mass concentration as a function of PM10, NO2 and SO2 for different IPD regimes obtained according to both measurements and COSMO-ART simulations. Model simulations confirm close relationships of BC with PM10 and NO2. At the same time, the correlation of BC with sulfur dioxide has been revealed only by modeling at relatively high concentrations of SO2, which are not observed in Moscow (Kislov, 2017; Kulbachevsky, 2019). This indicates that the data on SO2 emissions in Moscow according to the TNO inventory were overestimated. The main source of SO2 emissions is usually the coal fuel at power plants, which is not used in the Moscow region, except for situations of extremely cold winters (Kislov, 2017). In addition, the Euro-5 motor fuel standard, which has been used in Moscow since 2016, provided low-SO2 emissions in the atmosphere.
Since the measurements of black carbon are very sparse, in some cases it may be necessary to evaluate its concentration according to the available measurements of the gas composition at environmental monitoring stations. According to our measurements, hourly values of BC mass concentration (µg m−3) can be evaluated from PM10 (µg m−3) or NO2 (µg m−3) using the following regression equations:
where R is the Pearson correlation coefficient.
These regression dependences can be used as a first approximation for the estimates of BC concentrations during the warm period with relatively high temperatures and high solar radiation providing favorable conditions for photochemistry, which is important for the NO2 production. The similar results, obtained by modeling, confirmed the possibility of using these regression dependences. Note that the account of IPD can additionally increase the correlation between BC and PM10 (R=0.94 for IPD = 1, R=0.81 for IPD = 3, compared with R=0.64 for the whole dataset). A similar but smaller increase in correlation is observed after the IPD account in the relationship between BC and NO2 (R=0.74 for IPD = 1, R=0.85 for IPD = 3 compared with R=0.7 for the whole dataset).
3.3 Relationships between the aerosol single-scattering albedo and ratio
We noted earlier that the ratio may characterize the absorbing properties of aerosol, since BC is almost the only source of solar radiation absorption in the visible spectral range, and its high concentrations can lead to a decrease in aerosol SSA (Kozlov et al., 2016) and to significant radiative heating of the atmosphere. As a result, we proposed using the ratio in a first approximation for estimating the SSA values. This approach might also be useful in different atmospheric tasks, since in the standard AERONET algorithm there is a strong limitation on cloud-free conditions and relatively high AOD for SSA retrievals (Dubovik and King, 2000). However, it is necessary to understand how accurately the ratio at the surface captures the conditions of the entire column of the atmosphere.
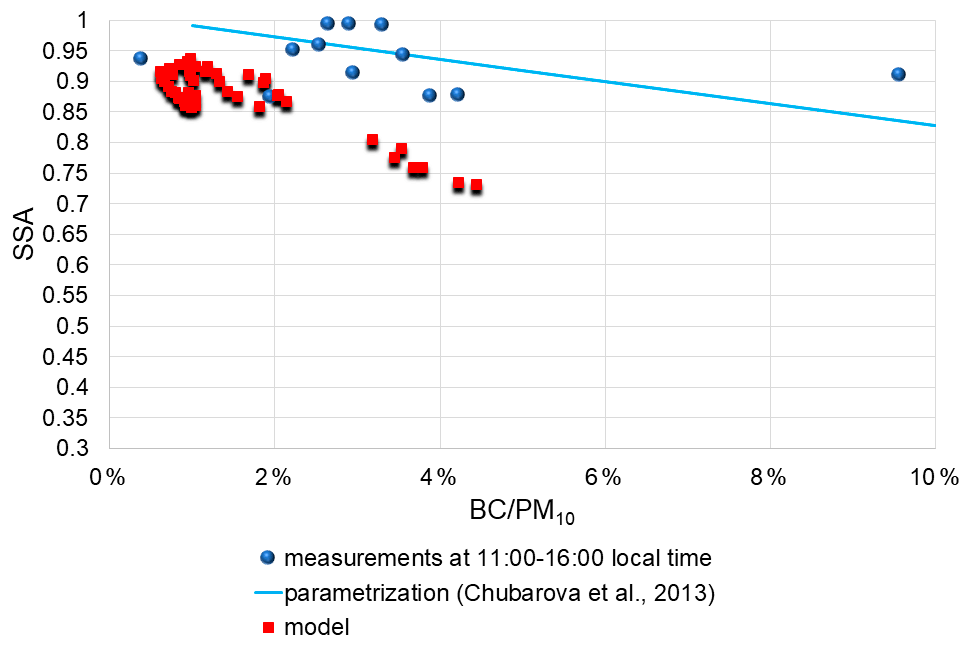
Figure 7Single-scattering albedo in the visible spectral region as a function of the BC PM10 ratio according to model simulations and measurements within 3 h around local noon and linear regression obtained from observations in Chubarova et al. (2013). Clear-sky conditions.
According to our observations, the restriction of air mixing conditions at IPD = 3 was not enough to obtain the relationship between these characteristics. In addition, we applied a limitation to the daytime period (±3 h around the solar noon), when a significant increase in air convection is observed during the warm period. The application of this additional restriction provides the dependence between SSA and (Fig. 7), which is close to the results obtained in the previous experiment in Moscow (Chubarova et al., 2013). The dependence was not strong, possibly due to the large uncertainty (about 0.03) of the SSA AERONET retrievals (Dubovik and King, 2000) and the relatively small statistics. Model estimates of SSA dependence on the ratio provide a much more significant relationship with the correlation coefficient R=0.87, but the values themselves are lower and the SSA sensitivity to the value is higher. Thus, to better attribute this dependence, further analysis with more statistics is required.
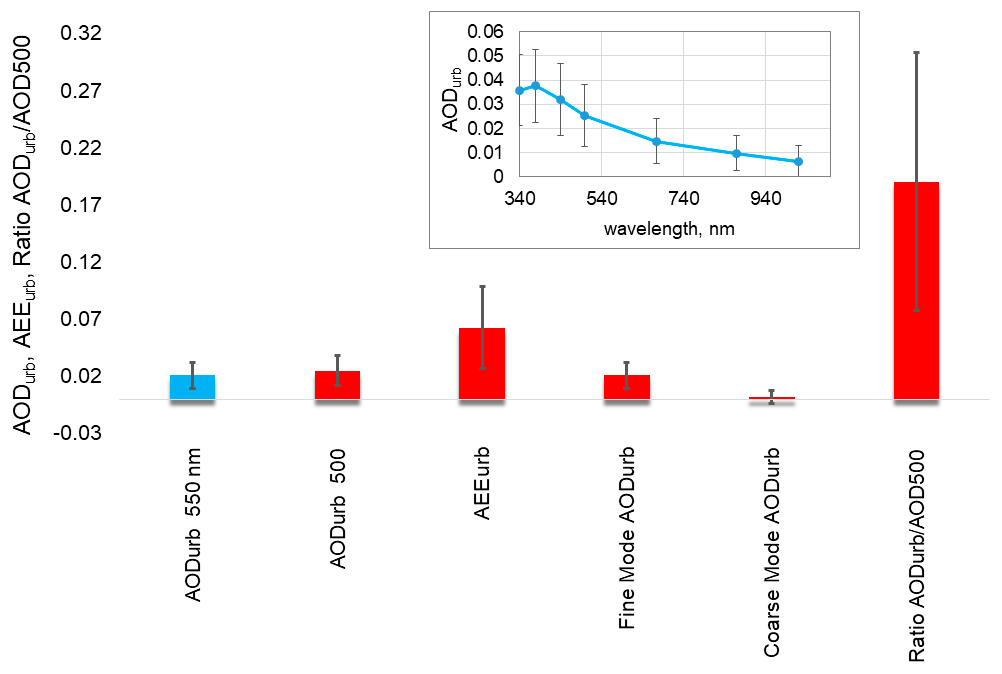
Figure 8Annual mean urban components of different aerosol parameters – AODurb at 550 and 500 nm, fine-mode AODurb, coarse-mode AODurb, urban component of AEEurb and AODurb AOD500 ratio with confidence intervals at the 0.05 significance level. The inset shows the mean AODurb spectral dependence. Comment: we show the AOD at two wavelengths to provide more convenient comparisons with the CIMEL sun-photometer observations (AOD at 500 nm) and model results (AOD at 550 nm). Moscow. 2006–2020.
3.4 Aerosol urban pollution based on comparisons between Moscow and background conditions at the ZSS
As described in Sect. 2, we estimated the urban aerosol pollution in the Moscow megacity as the difference of aerosol characteristics between MSU MO and the Zvenigorod site (see Eqs. 1 and 2). Figure 8 shows the annual mean total urban component of AOD, the fine and coarse modes of AODurb, AEEurb, and the AODurb AOD ratio for the entire period of parallel AERONET observations in Moscow and Zvenigorod from 2006 to 2020. On average, total AODurb at 500 nm is about 0.025, with a predominant fine-mode AODurb=0.021, which is in agreement with the positive sign of AEEurb. The AODurb AOD ratio at 500 nm is about 19 %. No statistically significant difference in the coarse AOD mode is found between Moscow and the clean unpolluted site. The inset in Fig. 8 shows the AODurb spectral dependence, which is characterized by larger values at shorter wavelengths corresponding to the fine aerosol mode (Chubarova et al., 2011b). The inverse dependence of AOD in the UV region with smaller AODurb at 340 nm may be observed due to a slight underestimation of nitrogen dioxide content in the atmospheric column in Moscow, which is used in AOD evaluation. Note that this underestimation was much larger in the previous version 2.0 AERONET dataset (see the discussion in Chubarova et al., 2011b).
For the period of the experiment (April–May 2018 and 2019), we compared the observed AODurb, which was not affected by the smoke air advection from the areas of forest and agricultural fires, with the parallel model AODurb values. In addition, we removed the cases with cloud amount N>5. The latter filtering is necessary, since in cloudy conditions there is too active aerosol generation in the COSMO-ART model system (Chubarova, 2020).
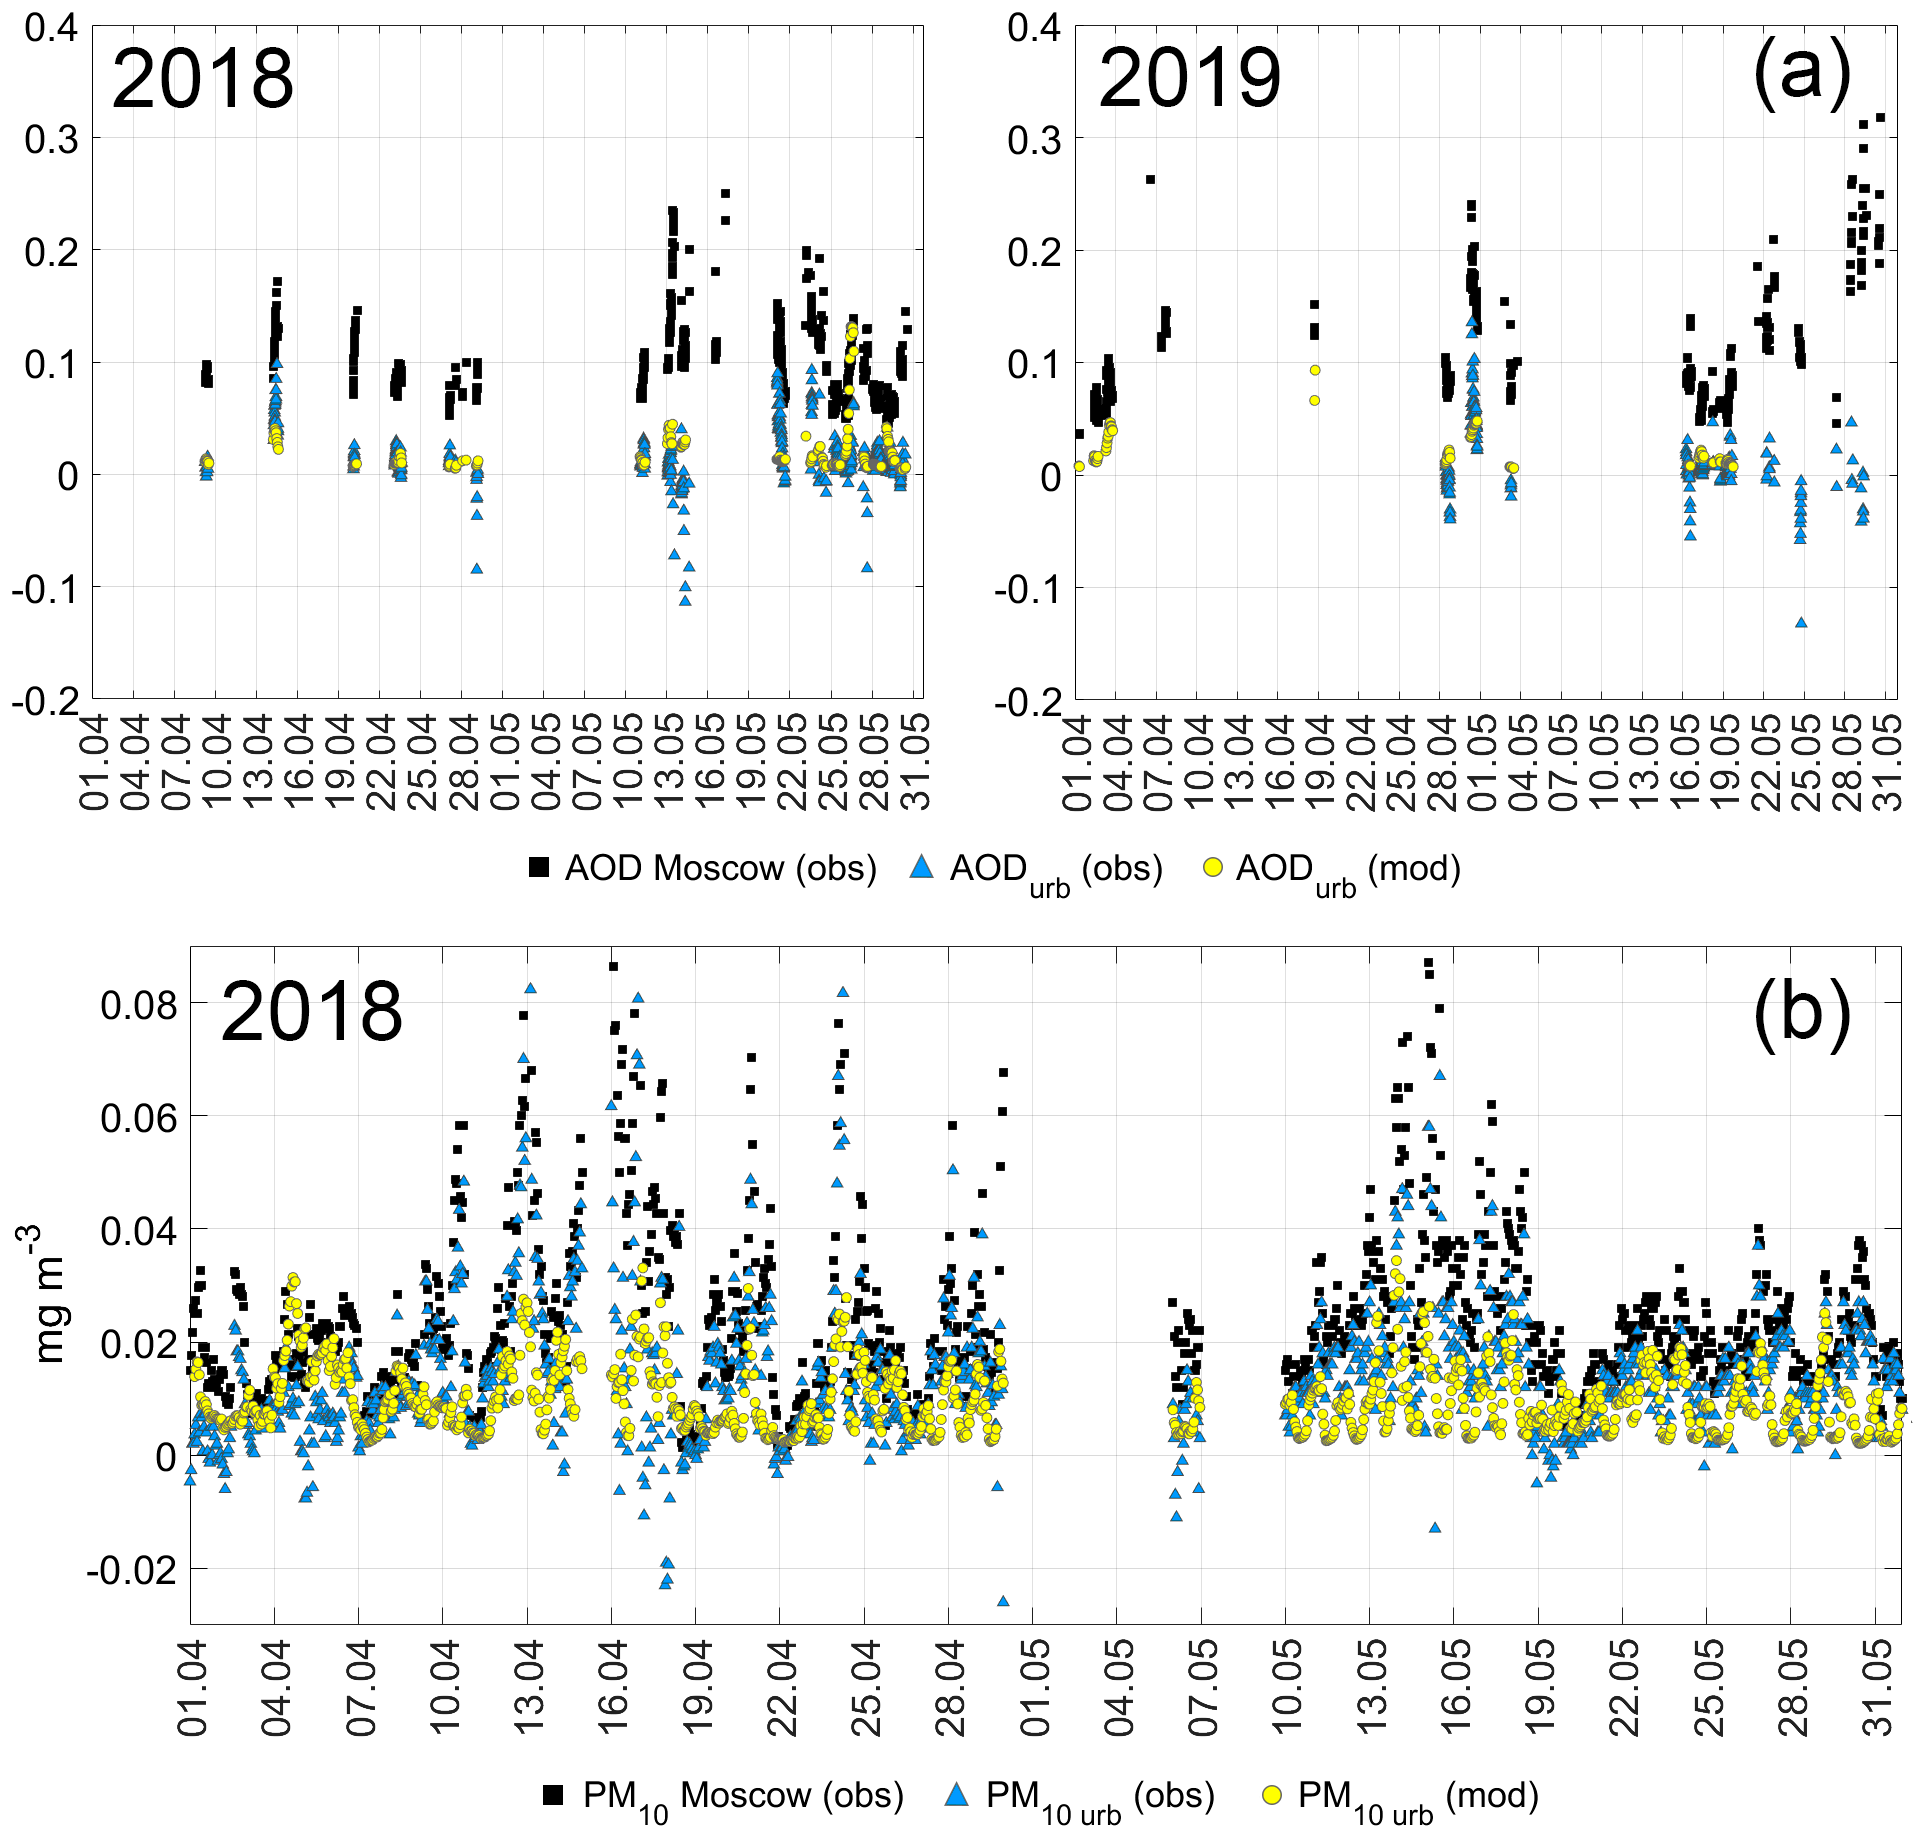
Figure 9(a) Time series of AOD550 from observations, AOD Moscow (obs), and its urban components from observations, AODurb (obs), and modeling, AODurb (mod), in 2018 (left upper panel) and 2019 (right upper panel). (b) Time series of PM10 from observations (PM10 Moscow (obs), mg m−3) and its urban components (mg m−3) from observations, PM10urb(obs), and modeling, PM10urb(mod). 2018.
Table 3Main statistics of hourly average aerosol characteristics and their urban components after removing the cases of smoke advection and the effects of urban air advection from Moscow.

Note: we used a filter of total cloud amount N<5. We also consider only the cases with the AOD data during daytime for evaluating the PM10 statistics and no effects from biomass burning aerosol.
Figure 9a shows the time series of the measured and modeled AODurb at a wavelength of 550 nm and aerosol optical thickness AOD550 from the observations in Moscow. The model AODurb varies mainly in the range of 0.05, reaching in some cases 0.1–0.17. The measured AODurb varies in the larger range from −0.12 to +0.14. Negative AODurb may be associated with the influence of the advection of polluted air from Moscow, which will be analyzed later. On average, model and measured AODurb values are in good agreement, comprising 0.015–0.016 (see Table 3) or 15 %–16 % of the total AOD550. Note that these estimates include the cases with urban air advection from Moscow to the Zvenigorod area.
Figure 9b presents the time series of the PM10 mass concentration in Moscow and its modeled and measured urban components. We see significant variations in the measured PM10urb, which can be negative during the night or early in the morning. On average, the model PM10urb is lower than the measured PM10urb values (6.0 and 15.9 µg m−3, respectively; see Table 3). The higher values of the measured PM10urb provide a larger PM10urb PM10 ratio of about 70 %, while according to the model estimates, this ratio is much smaller (about 27 %). This may happen due to some underestimation of urban aerosol and gas emissions in Moscow megacity conditions, which should be studied further.
Since BC is the almost purely urban aerosol component in the absence of smoke aerosol advection, the model BCurb BC ratio comprises more than 93 % of the total BC. We also see higher model BC concentrations compared with the measurements (1.6 and 0.95 µg m−3, respectively), which may also result in the too low model single-scattering albedo in urban conditions shown in Fig. 7. This may happen due to the overestimation of BC emissions in the TNO2010 inventory dataset.
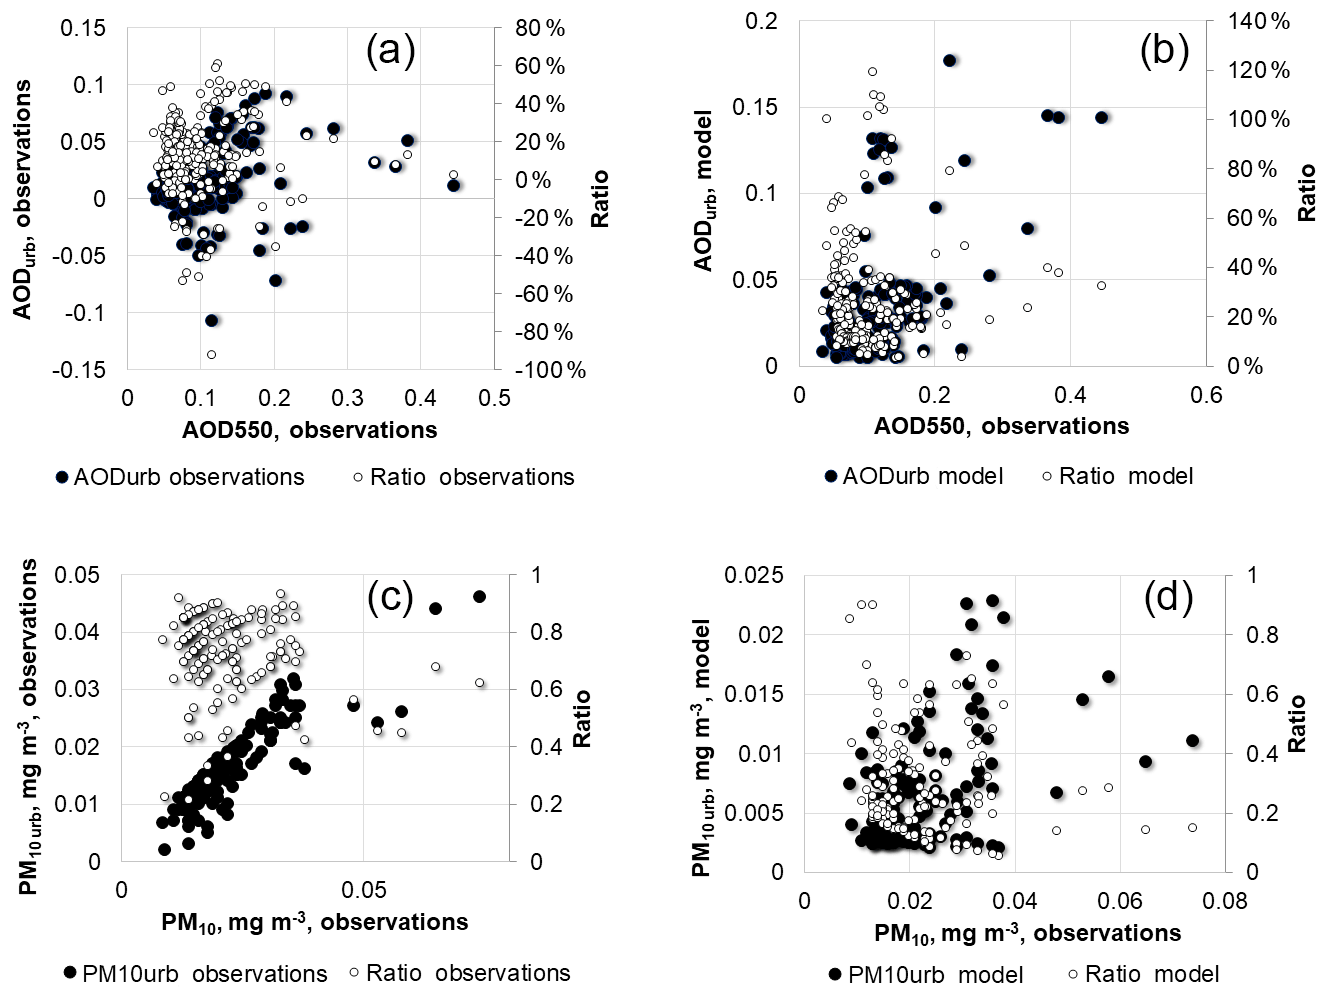
Figure 10Measured (a, c) and model (b, d) urban component of aerosol optical depth at 550 nm (AODurb), urban PM10 mass concentration (PM10urb, mg m−3) and their ratios to the observed total AOD550 and PM10 as a function of the observed total AOD550 (a, b) and PM10 (c, d) in Moscow (MSU MO). For consistency reasons, we show only quasi-simultaneous AOD and PM10 measurements during the daytime period with AOD observations. The cases affected by biomass burning aerosol were excluded.
Urban aerosol may have a relationship with natural aerosol, since they are both determined by the chemical composition of the atmosphere and meteorological conditions. To evaluate their relations, we analyzed the dependences between the urban aerosol component and its total amount. Figure 10a and b present modeled and measured AODurb and the AODurb AOD550 ratio as a function of AOD550 according to the MSU MO measurements. There are large variations in AODurb obtained from measurements and modeling. According to the model results, there is a slight positive AODurb increase at AOD550 >0.2. The absence of the dependence for measured AODurb versus AOD at 550 nm (see Fig. 10a) can be observed due to a significant contribution of the advection of natural aerosol with high AOD. Figure 10c and d present similar dependencies of PM10urb and the PM10urb PM10 ratio as a function of the observed PM10 in Moscow. A positive correlation dependence between PM10urb and PM10 is more pronounced, especially that obtained from observations. This can be explained by higher concentrations of aerosol gas precursors at the surface and, as a result, more favorable conditions for the secondary aerosol generation. Note that there is a significant correlation between the concentrations of aerosol gas precursors and PM10 (see Table 2).
The analysis of the AODurb AOD550 and PM10urb PM10 ratios has revealed a tendency to decrease at high aerosol content. This may mean that large aerosol content in Moscow is observed due to advection, while the largest contribution of urban aerosol (up to 50 %–100 %) is detected at a relatively low aerosol level of about AOD550 = 0.1–0.2 or PM10<0.04 mg m−3.
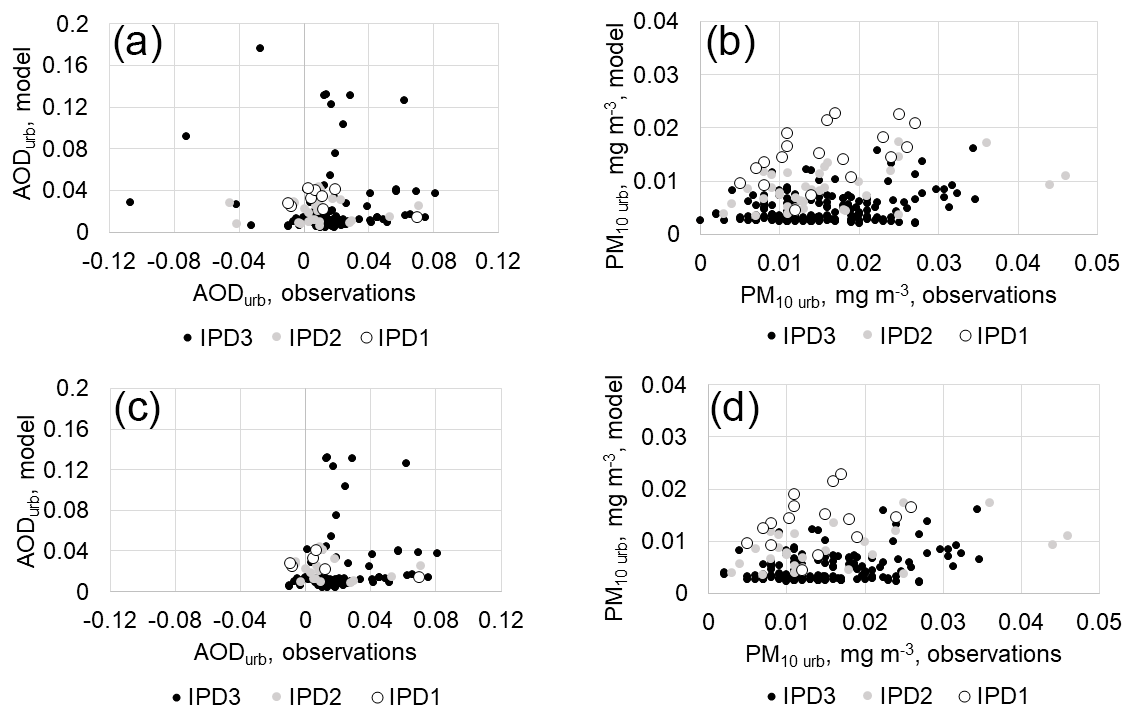
Figure 11The relationship between model and measured urban aerosol optical depth at 550 nm (AODurb – a, c) and the urban component of PM10 (PM10urb, mg m−3 – b, d) for all the cases (n=229) (a, b) and for the cases without the effects of urban air advection from Moscow to Zvenigorod (n=203) (c, d) under different IPD conditions. For consistency reasons, we show only quasi-simultaneous AOD and PM10 measurements during the daytime period with AOD observations. The cases affected by biomass burning aerosol were excluded. 2018.
As mentioned earlier, the increase in aerosol loading over the Moscow suburbs can occur due to the advection of polluted air from Moscow. Therefore, the calculated and measured aerosol urban components were compared in addition for the cases when the influence of the air advection from the Moscow megacity was not observed. To remove such cases from the sample, we applied the HYSPLIT model ensembles of the 24 h forward trajectories (Stein et al., 2015) at 500–1000 m for noon conditions. We consider that, since the Zvenigorod site is located directly to the west of Moscow's city center, the air quality was not affected by Moscow pollution if the trajectories were in the zone from 0 to 180∘. Figure 11 shows the dependence between modeled and measured AODurb and PM10urb for all the cases (Fig. 11a and b) and for the cases without air advection from Moscow (Fig. 11c and d). The analysis was made for the same AOD and PM10 statistics obtained during daytime and in sunny conditions. We see that, after the removal of the Moscow influence, far fewer cases with the measured negative AODurb values are observed (compare Fig. 11a and c), and the remaining negative AODurb values do not exceed 0.01, which is the uncertainty of AOD measurements in AERONET (Holben et al., 1998). As a result, after removing the Moscow-affected cases, the mean AODurb value is equal to 0.019, which is slightly higher compared with AODurb=0.016 obtained for all the cases (see Table 3). Similarly, Fig. 11b and d present the relationships between the calculated and measured PM10urb for all the cases and for the cases without the Moscow influence. Interestingly, during daytime there were no negative PM10urb values when PM10 zven> PM10 Moscow, as shown in Fig. 9b. The observed mean PM10urb is equal to 15.9 µg m−3, which is higher than the model PM10urb estimates (6 µg m−3), while for BC we have, by contrast, model overestimation (1.5 against 0.95 µg m−3).

Figure 12The composites of the diurnal cycle of AODurb (a), PM10 urb (b) and BCurb mass concentrations (c) according to measurements and modeling for different conditions of the intensity of particle dispersion (IPD). For PM10 and BC the diurnal cycle of their emissions is also shown. The confidence intervals were calculated at the 0.05 significance level. Moscow.
Since the emissions and intensity of particle dispersion have a pronounced daily course, the urban aerosol component may also have significant differences. Figure 12 shows the composite diurnal cycles of AOD, PM10 and BC at different IPDs as well as the primary emissions of black carbon and PM10 according to the TNO2010 inventory. In general, there are noticeable diurnal changes in modeled and experimental data at the surface layer, which has some specific features depending on IPD. One can see the accumulation of PM10 and BC at night below the inversion layer in the stable atmosphere, which is characterized by IPD = 1. Note that, during daytime (from 10:00 to 17:00), the conditions with IPD = 1 were never recorded because of warming of the surface and the amplification of convection.
As for the columnar AOD characteristic, there is no evident diurnal cycle of measured AODurb during daylight hours; however, model AODurb values demonstrate a small increase at night, especially under conditions with IPD = 1. Figure 12b and c show a noticeable dependence of BCurb and PM10urb on the IPD index, especially for night and early morning conditions. The elevated values of the surface urban aerosol at night in conditions with IPD = 1 reach 30–40 µg m−3 for PM10urb and 3–3.5 µg m−3 for BCurb.
The PM10 and especially BC diurnal cycles are mainly determined by variations of the boundary layer of the atmosphere. In warm periods there is an increase in its height during daytime, which contributes to the processes of dilution and strengthening of convective processes due to the additional heating by solar radiation, which leads to a decrease in the concentration of BC at the surface (Ramachandran and Rajesh, 2007; Kozlov et al., 2011; Chen et al., 2014). There is the absence of a morning BC maximum in Moscow during rush hours, which was observed in many other cities, for example, in Tomsk (Kozlov et al., 2011), in Ahmedabad (Ramachandran and Rajesh, 2007) and in Athens (Diapouli et al., 2017). It can be explained by the specific regulation of diesel-heavy trucks, which have permission of entry only at night in Moscow (Popovicheva et al., 2020). In addition, it is necessary to account for a specific location of the MSU MO at a distance from the direct sources of urban emissions (highways).
The analysis of the urban aerosol pollution was done for a large agglomeration of the Moscow megacity using the COSMO-Ru-ART mesoscale model system and intensive measurement campaigns in April–May of 2018 and 2019 for a wide range of meteorological and atmospheric conditions. We showed that, on average, the columnar aerosol characteristics during the intensive spring campaigns were similar to those observed during the warm period. However, AODs were slightly smaller compared with corresponding monthly average values over the 2001–2020 period. This is in agreement with the observed negative AOD trend in the Moscow megacity (Chubarova et al., 2016; Zhdanova et al., 2020). A reduction in the fine-mode AOD fraction may be associated with a decrease in the emissions of urban aerosol gas precursors in recent years (Zhdanova et al., 2020). A weak aerosol absorption in Moscow with relatively high values of SSA = 0.94 corresponds to relatively small concentrations of black carbon (for urban areas) and its low ratio. The BC mass concentration is consistent with the estimated BC values of 1.1 µg m−3 in the GADS database for the Moscow region during the warm period (Koepke et al., 1997). This is twice as high compared with the BC concentrations in clean unpolluted regions (Herich et al., 2011) and more than 5 times smaller than in the polluted areas of India and China (Wu et al., 2013; Singh et al., 2015). We show that Moscow is characterized by reduced concentrations of sulfur dioxide and by increased concentrations of nitrogen oxides due to the emissions from transport and power plants (Kulbachevsky, 2019, 2020). Mean PM10 concentrations in Moscow correspond to those in large European cities (about 15–30 µg m−3) and are significantly smaller than those in Asian industrial centers (Kislov, 2017).
The analysis of the experimental data during the intensive spring campaigns shows a noticeable day-to-day variability of different gases, aerosol characteristics and IPD indices. In some cases, especially high concentrations are observed at IPD = 1, but in some cases smoke advection, even in conditions with IPD = 3, provides elevated levels of aerosol pollution.
We obtained high correlations between AOD500 and the fine AOD500 mode, which were typical for central and eastern Europe (Logothetis et al., 2020). Fine aerosol-mode fraction also dominates in PM10 in urban regions of central and northern Europe according to Wu and Boor (2021). We found a relatively high correlation between surface measurements of PM10 and BC with aerosol gas precursors, except for SO2. This may indicate the importance of secondary aerosol generation in the urban atmosphere of Moscow. According to the model simulations, secondary aerosols are about 55 % of the total urban aerosol content, which is generally in accordance with Huang et al. (2014), with the maximum contribution of the organic component (30 %).
The atmospheric water vapor content, which can be used as an indicator of the air mass (Myachkova, 1983), has a relationship with the aerosol parameters in the atmospheric column, which indicates more favorable processes of aerosol formation in relatively warmer and wetter air masses (Chubarova, 2009). Wind speed has a statistically significant correlation with almost all surface and columnar aerosol characteristics as well as aerosol gas precursor species. This could be explained by the effects of ventilation of the urban environment, its better dilution and movement of the urban polluted air to the suburbs. The closer relationship between wind speed and BC compared with PM10 indicates a more important role of local meteorological conditions for black carbon. This happens since BC is characterized by urban origin, while for PM10 the regional background aerosol variations may also play an important role. The obtained negative relationship of BC and the ratio with wind speed is especially important, since it can serve as an indicator of changes in the absorbing properties of the atmosphere. We also found the influence of IPD on the mean ratio, which is 0.7 % at IPD = 3, 5.5 % at IPD = 2 and 5.9 % at IPD = 1. The small BC PM10 ratio at IPD = 3 can be explained by the intensive air advection from the clean areas outside Moscow with low BC concentrations and by strong vertical mixing with the upper layers of the atmosphere with smaller BC concentrations. By contrast, at IPD = 1, in conditions of a stable stratified atmosphere and the absence of ventilation, we observe a strong increase in . Thus, the use of the IPD index may significantly specify the ratio and, as a result, the absorbing properties of the atmosphere.
The relationship between columnar AOD and surface PM10 concentrations has a point of bifurcation around 0.05 mg m−3, revealing two types of dependences, which has a physical explanation. The lower dependence characterizes the growth of PM10 only in the close to surface atmospheric layer with predominant IPD = 1 in the absence of the pronounced AOD increase. The upper dependence is associated with the influence of air mass advection, when the concentration of surface particles increases simultaneously with AOD. In Gubanova et al. (2018), close links between the AOD and PM2.5 concentrations on monthly scale have also been obtained, especially during the warm period. In addition, we show a significant increase in the fine-mode AOD fraction with PM10, and in conditions with PM10>80 µg m−3, the fine-mode AOD fraction is always higher 70 %.
In the analysis, more attention is paid to BC, since this aerosol component significantly absorbs visible solar irradiance (Jacobson, 2004, 2006; Ramanathan and Carmichael, 2008). Based on the measured data, we have obtained simple regression equations to quantify BC concentration using the observed PM10 or NO2 mass concentrations for warm period conditions. These relationships have also been confirmed by the model simulations. In addition, the account of IPD indices in these dependences has led to a stronger connection between these characteristics.
We show that in the well-mixed atmosphere there is an inverse dependence of columnar aerosol SSA on the ratio according to both model and measurements. Model estimates provide much higher correlation between these parameters and stronger sensitivity of SSA to the BC PM10 ratio. These dependences should be studied further using larger statistics, since they can be important for indirect evaluation of absorbing aerosol properties in cloudy conditions, when the observations of SSA are not available from AERONET.
According to the parallel simultaneous AERONET measurements in Moscow and at the background Zvenigorod site over the 2006–2020 period, the annual mean AODurb at 500 nm is 0.025, corresponding to 19 % of the total AOD500. We also determined that AODurb consists of 85 % of the fine-mode fraction. These AODurb estimates are in agreement with the results of the first years of the urban aerosol studies of Moscow (Chubarova et al., 2011b). Note that this is the only pair of long-term simultaneous AERONET measurements in the world, which are located inside and outside the large megacity and operated by the same type of sun photometer. The estimates of the urban AOD of about 0.02 were also made using a handheld sun photometer in Warsaw (Zavadzka et al., 2013). Warsaw with a population of less than 2 million is much smaller than the Moscow megacity. However, the active use of coal with large SO2 emissions may provide a significant increase in sulfate aerosol generation and, hence, may lead to the increase in AODurb. For Moscow conditions the results of MODIS satellite estimates using the MAIAC multi-angle algorithm with accounting for surface reflectivity (Lyapustin et al., 2018) showed the urban AOD550 effect of about 0.01 (Zhdanova et al., 2020). In contrast, in Li et al. (2018), over Berlin according to the MODIS MYD04_3 data, a much higher urban AOD (about 0.08) was obtained. These AODurb values are likely to be overestimated, since Berlin with a population of 3.6 million people and restrictions on emissions should have lower aerosol pollution compared with the Moscow megacity.
We found that the AODurb AOD550 and PM10urb PM10 ratios had a tendency to decrease at high aerosol content. This may mean that the large aerosol content in Moscow was observed mainly due to advection, while the urban aerosol contribution of up to 50 %–100 % was important at a relatively low aerosol level of about AOD = 0.1–0.2 or PM10<40 µg m−3.
The increase in aerosol loading in the background clean conditions in Zvenigorod can also occur due to the advection of polluted air from Moscow. After the removal of the cases affected by Moscow pollution, the amount of negative AODurb became much smaller, and it did not exceed 0.01, which is the uncertainty of sun-photometer measurements. As a result, the average aerosol urban pollution, according to the observations, was estimated as AODurb=0.019, PM10urb=15.9 µg m−3 and BCurb=0.95 µg m−3. The urban AOD fraction (AODurb AODmeas) was equal to 19 %, which was in agreement with the annual mean over the 2006–2020 period as well as with the estimates in Chubarova et al. (2011). The model PM10urb provided some underestimation compared with measurements (6 and 15.9 µg m−3, respectively). By contrast, there was a model overestimation of BC concentration (1.6 µg m−3 compared with 0.95 µg m−3), which may be the cause of the too low values of the model single-scattering albedo. This difference of model estimates with the observations occurred likely due to underestimation of primary aerosol emissions and overestimation of BC emissions in the TNO2010 inventory for the Moscow megacity, which should be studied further.
The analysis of the composite diurnal cycles for PM10urb and BCurb at different IPD at the surface layer have detected their noticeable changes in both model and experimental data. We revealed the significant accumulation of PM10 and BC at night below the inversion layer at IPD = 1. In these conditions at night the increase in concentration reached 4 times for PM10urb (30–40 µg m−3), and 3 times for BC (up to 3–3.5 µg m−3) compared with the conditions at IPD = 3. During the warm period there was a noticeable increase in the height of boundary layer during daytime, which contributed to the processes of dilution and amplification of convection, when the Earth's surface was heated by solar radiation (Ramachandran and Rajesh, 2007; Kozlov et al., 2011; Chen et al., 2014) providing a decrease in surface concentrations of different aerosol and gas species. The observed AODurb values did not have a clear diurnal cycle; however, according to model calculations, they were slightly higher at night, especially in conditions of the stratified atmosphere at IPD = 1.
We have presented a detailed analysis of surface and columnar aerosol measurements and model simulations in urban and clean background conditions, which allows us to obtain reliable quantitative estimates of the urban component of the aerosol pollution at the surface and in the atmospheric column and to identify the relationships between them in different meteorological conditions.
We found the predominance of the fine AOD500 mode in AOD500 and a statistically significant though not very high correlation between columnar AOD500 and surface PM10 mass concentrations with the effect of splitting the dependence into two different ones. Relatively high correlations between surface measurements of PM10 and BC were observed with aerosol gas precursors, except for SO2.
Both model and experimental datasets have shown a statistically significant linear correlation of BC with NO2 and PM10 mass concentrations, which indicated mostly common sources of emissions of these substances.
The annual mean urban component of AOD (AODurb) at 500 nm in the Moscow megacity over the 2006–2020 period was about 0.025 (or 19 % of total AOD), with more than 85 % of the fine-mode fraction. According to the measurements, we have obtained the mean estimates of AODurb=0.019, PM10urb=15.9 µg m−3 and BC = 0.95 µg m−3 after removing the cases affected by smoke aerosol advection. A similar level of AODurb=0.015 has been evaluated using model simulations.
There was a pronounced increase in the ratio from 0.7 % to 5.9 % with the decrease in the IPD index related to the amplification of the atmospheric stratification. We also found an inverse dependence between the ratio and columnar single-scattering albedo (SSA) for the intense air mixing conditions. This dependence together with the obtained negative correlation between wind speed and the ratio may serve as an indicator of changes in the absorbing properties of the atmosphere due to meteorological factors.
A pronounced diurnal cycle of PM10urb and BCurb has been obtained with a strong dependence on IPD indices. At night a significant accumulation of PM10urb and BCurb below the inversion layer was observed in conditions with IPD = 1, reaching 4 times for PM10urb and 3 times for BC compared with the conditions at IPD = 3. The observed AODurb did not have a clear diurnal cycle; however, according to model calculations, it was slightly higher at night, especially in poorly mixed conditions at IPD = 1.
In future work, we plan to use the obtained results for evaluating the radiative effects of the urban aerosol pollution and for identifying its influence on meteorological parameters and weather forecast.
The aerosol measurements from the Moscow Meteorological Observatory and Zvenigorod site can be accessed from the dataset of the Aerosol Robotic Network (AERONET) (http://aeronet.gsfc.nasa.gov/, AERONET, 2022). The results of model simulations are available upon request (https://meteoinfo.ru/en/, last access: 10 February 2022). Other data of the Meteorological Observatory (http://momsu.ru/english.html, last access: 10 February 2022) and Mosecomonitoring Agency (http://mosecom.mos.ru/, last access: 10 February 2022) are available upon request. The estimations of smoke aerosol effects were made using the data from https://firms.modaps.eosdis.nasa.gov/download/ (FIRMS, 2021).
The conceptualization, data analysis, and final text writing were done by NEC. AAK, GSR, BV and HV designed the model experiments and performed the simulations. OBP contributed with the BC dataset, and EEA contributed with data analysis and the design of the figures. NEC prepared the manuscript with contributions from all the co-authors.
The contact author has declared that none of the authors has any competing interests.
Publisher's note: Copernicus Publications remains neutral with regard to jurisdictional claims in published maps and institutional affiliations.
This article is part of the special issue “Pan-Eurasian Experiment (PEEX) – Part II”. It is not associated with a conference.
We acknowledge support by the KIT Publication Fund of the Karlsruhe Institute of Technology. The work of Russian group was carried out under the Development Program of the MSU Interdisciplinary Scientific and Educational School “Future Planet and Global Environmental Change” at the Lomonosov Moscow State University and partially supported by the grant no. 075-15-2021-574 with the partial application of the equipment of the MSU Shared Research Equipment Centers, “Technologies for obtaining new nanostructured materials and their complex study”, and “Monitoring of atmospheric radiation”.
The article processing charges for this open-access publication were covered by the Karlsruhe Institute of Technology (KIT).
This paper was edited by Arthur Chan and reviewed by two anonymous referees.
AERONET: https://aeronet.gsfc.nasa.gov/, last access: 28 January 2022.
ACTRIS: https://actris.nilu.no, last access: 28 January 2022.
AEROCOM: https://aerocom.met.no/, last access: 28 January 2022.
Air quality in Europe: 2020 report, EEA Report No 09/2020, Luxembourg, Publications Office of the European Union, 164 pp., ISSN 1977-8449, 2020.
Amato, F., Pandolfi, M., Escrig, A., Querol, X., Alastuey, A., Pey, J., Perez, N., and Hopke, P. K.: Quantifying road dust resuspension in urban environment by Multilinear Engine: A comparison with PMF2, Atmos. Environ., 43, 2770–2780, https://doi.org/10.1016/j.atmosenv.2009.02.039, 2009.
Baklanov, A., Smith Korsholm, U., Nuterman, R., Mahura, A., Nielsen, K. P., Sass, B. H., Rasmussen, A., Zakey, A., Kaas, E., Kurganskiy, A., Sørensen, B., and González-Aparicio, I.: Enviro-HIRLAM online integrated meteorology–chemistry modelling system: strategy, methodology, developments and applications (v7.2), Geosci. Model Dev., 10, 2971–2999, https://doi.org/10.5194/gmd-10-2971-2017, 2017.
Baldauf, M., Seifert, A., Förstner, J., Majewski, D., Raschendorfer, M., and Reinhardt, T.: Operational Convective-Scale Numerical Weather Prediction with the COSMO Model: Description and Sensitivities, Mon. Weather Rev., 139, 3887–3905, https://doi.org/10.1175/MWR-D-10-05013.1, 2011.
Bellouin, N., Quaas, J., Morcrette, J.-J., and Boucher, O.: Estimates of aerosol radiative forcing from the MACC re-analysis, Atmos. Chem. Phys., 13, 2045–2062, https://doi.org/10.5194/acp-13-2045-2013, 2013.
Bhugwant, C. and Brémaud, P.: Simultaneous Measurements of Black Carbon, PM10, Ozone and NOx Variability at a Locally Polluted Island in the Southern Tropics, J. Atmos. Chem., 39, 261–280, https://doi.org/10.1023/A:1010692201459, 2001.
Binkowski, F. S. and Shankar, U.: The regional particulate matter model, 1. Model description and preliminary results, J. Geophys. Res., 100, 26191–26209, 1995.
Bohren, C. F. and Huffman, D. R.: Absorption and Scattering of Light by Small Particles, Wiley, New York, 1983.
Bond, T. C., Doherty, S. J., Fahey, D. W., Forster, P. M., Berntsen, T., DeAngelo, B. J., Flanner, M. G., Ghan, S., Kärcher, B., Koch, D., Kinne, S., Kondo, Y., Quinn, P. K., Sarofim, M. C., Schultz, M. G., Schulz, M., Venkataraman, C., Zhang, H., Zhang, S., Bellouin, N., Guttikunda, S. K., Hopke, P. K., Jacobson, M. Z., Kaiser, J. W., Klimont, Z., Lohmann, U., Schwarz, J. P., Shindell, D., Storelvmo, T., Warren, S. G., and Zender, C. S.: Bounding the role of black carbon in the climate system: A scientific assessment, J. Geophys. Res.-Atmos., 118, 5380–5552, https://doi.org/10.1002/jgrd.50171, 2013.
Chen, X., Zhang, Z., Engling, G., Zhang, R., Tao, J., Lin, M., Sang, X., Chan, C., Li, S., and Li, Y.: Characterization of fine particulate black carbon in Guangzhou, a megacity of South China, Atmos. Pollut. R., 5, 361–370, https://doi.org/10.5094/APR.2014.042, 2014.
Chou, M.-D., Lin, P.-H., Ma, P.-L., and Lin, H.-J.: Effects of aerosols on the surface solar radiation in a tropical urban area, J. Geophys. Res., 111, D15207, https://doi.org/10.1029/2005JD006910, 2006.
Chubarova, N. Y.: Seasonal distribution of aerosol properties over Europe and their impact on UV irradiance, Atmos. Meas. Tech., 2, 593–608, https://doi.org/10.5194/amt-2-593-2009, 2009.
Chubarova, N. Y. (Ed.): Aerosol urban pollution and its effects on weather, regional climate and geochemical processes, MAKS Press, Moscow, Russian Federation, https://doi.org/10.29003/m1475.978-5-317-06464-8, 2020.
Chubarova, N., Smirnov, A., and Holben, B.: Aerosol properties in Moscow according to 10 years of AERONET measurements at the Meteorological Observatory of Moscow State University, Geography, Environment, Sustainability, 4, 19–32, https://doi.org/10.24057/2071-9388-2011-4-1-19-32, 2011a.
Chubarova, N. Y., Sviridenkov, M. A., Smirnov, A., and Holben, B. N.: Assessments of urban aerosol pollution in Moscow and its radiative effects, Atmos. Meas. Tech., 4, 367–378, https://doi.org/10.5194/amt-4-367-2011, 2011b.
Chubarova, N., Sviridenkov, M., Kopeikin, V., Emilenko, K., Verichev, A. and Skorokhod, S. E.: Aerosol pollution over Moscow area, 3rd Meeting on Pan-Eurasian Experiment (PEEX), 26–28 August 2013, Hyytiala, Finland, 2013.
Chubarova, N. E., Nezval', E. I., Belikov, I. B., Gorbarenko, E. V., Eremina, I. D., Zhdanova, E. Yu., Korneva, I. A., Konstantinov, P. I., Lokoshchenko, M. A., Skorokhod, A. I., and Shilovtseva, O. A.: Climatic and environmental characteristics of Moscow megalopolis according to the data of the Moscow State University Meteorological Observatory over 60 years, Russ. Meteorol. Hydrol., 39, 602–613, https://doi.org/10.3103/S1068373914090052, 2014.
Chubarova, N. Y., Poliukhov, A. A., and Gorlova, I. D.: Long-term variability of aerosol optical thickness in Eastern Europe over 2001–2014 according to the measurements at the Moscow MSU MO AERONET site with additional cloud and NO2 correction, Atmos. Meas. Tech., 9, 313–334, https://doi.org/10.5194/amt-9-313-2016, 2016.
Chubarova, N. Y., Androsova, Y. Y., and Lezina, Y. A.: The dynamics of the atmospheric pollutants during the COVID-19 pandemic 2020 and their relationship with meteorological conditions in Moscow, Geography, Environment, Sustainability, 14, 168–182, https://doi.org/10.24057/2071-9388-2021-012, 2021.
COSMO: http://www.cosmo-model.org/, last access: 28 January 2022.
Diapouli, E., Kalogridis, A.-C., Markantonaki, C., Vratolis, S., Fetfatzis, P., Colombi, C., and Eleftheriadis, K.: Annual Variability of Black Carbon Concentrations Originating from Biomass and Fossil Fuel Combustion for the Suburban Aerosol in Athens, Greece, Atmosphere, 8, 234, https://doi.org/10.3390/atmos8120234, 2017.
Dubovik, O. and King, M. D.: A flexible inversion algorithm for retrieval of aerosol optical properties from Sun and sky radiance measurements, J. Geophys. Res., 105, 20673–20696, https://doi.org/10.1029/2000JD900282, 2000.
Dubovik, O., Holben, B., Eck, T. F., Smirnov, A., Kaufman, Y. J., King, M. D., Tanre, D., and Slutsker, I.: Variability of absorption and optical properties of key aerosol types observed in worldwide locations, J. Atmos. Sci., 59, 590–608, 2002.
Elansky, N. F.: Air quality and CO emissions in the Moscow megacity, Urban Clim., 8, 42–56, https://doi.org/10.1016/j.uclim.2014.01.007, 2014.
Elansky, N. F., Ponomarev, N. A., and Verevkin, Y. M.: Air quality and pollutant emissions in the Moscow megacity in 2005–2014, Atmos. Environ., 175, 54–64, https://doi.org/10.1016/j.atmosenv.2017.11.057, 2018.
Evans, M. J., Fiore, A., and Jacob, D. J.: The GEOS-CHEM chemical mechanism: Version 5-07-8, Tech. rep., University of Leeds, Leeds, UK, 2003.
Filonchuk, M., Hurynovich, V., Yan, H., Zhou, L., and Gusev, A.: Climatology of aerosol optical depth over Eastern Europe based on 19 years (2000–2018) MODIS TERRA data, Int. J. Climatol., 40, 3531–3549, https://doi.org/10.1002/joc.6412, 2019.
FIRMS: https://firms.modaps.eosdis.nasa.gov/map/, last access: 15 September 2021.
Gamma-ET Instruments: Gamma-ET, http://www.etek-ltd.ru/, last access: 28 January 2022.
Giles, D. M., Sinyuk, A., Sorokin, M. G., Schafer, J. S., Smirnov, A., Slutsker, I., Eck, T. F., Holben, B. N., Lewis, J. R., Campbell, J. R., Welton, E. J., Korkin, S. V., and Lyapustin, A. I.: Advancements in the Aerosol Robotic Network (AERONET) Version 3 database – automated near-real-time quality control algorithm with improved cloud screening for Sun photometer aerosol optical depth (AOD) measurements, Atmos. Meas. Tech., 12, 169–209, https://doi.org/10.5194/amt-12-169-2019, 2019.
Gilardoni, S., Vignati, E., and Wilson, J.: Using measurements for evaluation of black carbon modeling, Atmos. Chem. Phys., 11, 439–455, https://doi.org/10.5194/acp-11-439-2011, 2011.
Gliß, J., Mortier, A., Schulz, M., Andrews, E., Balkanski, Y., Bauer, S. E., Benedictow, A. M. K., Bian, H., Checa-Garcia, R., Chin, M., Ginoux, P., Griesfeller, J. J., Heckel, A., Kipling, Z., Kirkevåg, A., Kokkola, H., Laj, P., Le Sager, P., Lund, M. T., Lund Myhre, C., Matsui, H., Myhre, G., Neubauer, D., van Noije, T., North, P., Olivié, D. J. L., Rémy, S., Sogacheva, L., Takemura, T., Tsigaridis, K., and Tsyro, S. G.: AeroCom phase III multi-model evaluation of the aerosol life cycle and optical properties using ground- and space-based remote sensing as well as surface in situ observations, Atmos. Chem. Phys., 21, 87–128, https://doi.org/10.5194/acp-21-87-2021, 2021.
Golitsyn, G. S., Grechko, E. I., Wang, G., Wang, P., Dzhola, A. V., Emilenko, A. S., Kopeikin, V. M., Rakitin, V. S., Safronov, A. N., and Fokeeva, E. V.: Studying the pollution of Moscow and Beijing atmospheres with carbon monoxide and aerosol, Izv. Atmos. Ocean. Phys., 51, 1–11, https://doi.org/10.1134/S0001433815010041, 2015.
Gubanova, D. P., Belikov, I. B., Elansky, N. F., Skorokhod, A. I., and Chubarova, N. E.: Variations in PM2.5 Surface Concentration in Moscow according to Observations at MSU Meteorological Observatory, Atmos. Ocean. Opt., 31, 290–299, https://doi.org/10.1134/S1024856018030065, 2018.
Herich, H., Hueglin, C., and Buchmann, B.: A 2.5 year's source apportionment study of black carbon from wood burning and fossil fuel combustion at urban and rural sites in Switzerland, Atmos. Meas. Tech., 4, 1409–1420, https://doi.org/10.5194/amt-4-1409-2011, 2011.
Holben, B. N., Eck, T. F., Slutsker, I., Tanré, D., Buis, J. P., Setzer, A., Vermote, E., Reagan, J. A., Kaufman, Y. J., Nakajima, T., Lavenu, F., Jankowiak, I., and Smirnov, A.: AERONET – A Federated Instrument Network and Data Archive for Aerosol Characterization, Remote Sens. Environ., 66, 1–16, https://doi.org/10.1016/S0034-4257(98)00031-5, 1998.
Hosiokangas, J., Vallius, M., Ruuskanen, J., Mirme, A., and Pekkanen, J.: Resuspended dust episodes as an urban air-quality problem in subarctic regions, Scand. J. Work Environ. Health, 30, 28–35, 2004.
Huang, R. J., Zhang, Y., Bozzetti, C., Ho, K. F., Cao, J. J., Han, Y., Daellenbach, K. R., Slowik, J. G., Platt, S. M., Canonaco, F., Zotter, P., Wolf, R., Pieber, S. M., Bruns, E. A., Crippa, M., Ciarelli, G., Piazzalunga, A., Schwikowski, M., Abbaszade, G., Schnelle-Kreis, J., Zimmermann, R., An, Z., Szidat, S., Baltensperger, U., El Haddad, I., Prévôt, A. S.: High secondary aerosol contribution to particulate pollution during haze events in China, Nature, 514, 218–222, https://doi.org/10.1038/nature13774, 2014.
Huang, X. and Ding, A.: Aerosol as a critical factor causing forecast biases of air temperature in global numerical weather prediction models, Sci. Bull., 66, 1917–1924, https://doi.org/10.1016/j.scib.2021.05.009, 2021.
IPCC: Climate Change 2013: The Physical Science Basis. Contribution of Working Group I to the Fifth Assessment Report of the Intergovernmental Panel on Climate Change, 1535, https://doi.org/10.1017/cbo9781107415324.004, 2013.
IPCC: Climate Change 2021: The Physical Science Basis. Contribution of Working Group I to the Sixth Assessment Report of the Intergovernmental Panel on Climate Change, edited by: Masson-Delmotte, V., Zhai, P., Pirani, A., Connors, S. L., Péan, C., Berger, S., Caud, N., Chen, Y., Goldfarb, L., Gomis, M. I., Huang, M., Leitzell, K., Lonnoy, E., Matthews, J. B. R., Maycock, T. K., Waterfield, T., Yelekçi, O., Yu, R., and Zhou, B., in press, 2022.
Jacobson, M. Z.: Climate response of fossil fuel and biofuel soot, accounting for soot's feedback to snow and sea ice albedo and emissivity, J. Geophys. Res., 109, D21201, https://doi.org/10.1029/2004JD004945, 2004.
Jacobson, M. Z.: Effects of absorption by soot inclusions within clouds and precipitation on global climate, J. Phys. Chem. A, 110, 6860–6873, https://doi.org/10.1021/jp056391r, 2006.
Jin, X., Zhu, Q., and Cohen, R. C.: Direct estimates of biomass burning NOx emissions and lifetimes using daily observations from TROPOMI, Atmos. Chem. Phys., 21, 15569–15587, https://doi.org/10.5194/acp-21-15569-2021, 2021.
Kerminen, V.-M. and Wexler, A. S.: Post-fog nucleation of H2SO4 – H2O particles in smog, Atmos. Environ., 28, 2399–2406, 1994.
Kinne, S., O'Donnel, D., Stier, P., Kloster, S., Zhang, K., Schmidt, H., Rast, S., Giorgetta, M., Eck, T. F., and Stevens, B.: MAC-v1: A new global aerosol climatology for climate studies: MAC-v1 for Climate Studies, J. Adv. Model. Earth Syst., 5, 704–740, https://doi.org/10.1002/jame.20035, 2013.
Kirchstetter, T. W., Novakov, T., and Hobbs, P. V.: Evidence that the spectral dependence of light absorption by aerosols is affected by organic carbon, J. Geophys. Res., 109, D21, https://doi.org/10.1029/2004JD004999, 2004.
Kislov, A. V. (Ed.): Climate of Moscow in global warming conditions, Moscow University Press, Moscow, Russian Federation, ISBN 978-5-19-011227-6, 2017.
Koepke, P., Hess, M., Schult, I., and Shettle, E. P.: Global Aerosol Data Set, Rep. No. 243, Max-Planck-Institut für Meteorologie, Hamburg, Germany, 1997.
Kozlov, V., Panchenko, M., and Yausheva, E.: Mass fraction of black carbon in submicron aerosol as an indicator of influence of smoke from remote forest fires in Siberia, Atmos. Environ., 42, 2611–2620, https://doi.org/10.1016/j.atmosenv.2007.07.036, 2008.
Kozlov, V. S., Panchenko, M. V., Pol'kin, V. V., and Terpugova, S. A.: Technique for determination of the single scattering albedo of submicron aerosol in the approximation of lognormal size distribution of black carbon, Proc. SPIE 10035, 22nd International Symposium on Atmospheric and Ocean Optics: Atmospheric Physics, 100352Z, 29 November 2016, https://doi.org/10.1117/12.2247992, 2016.
Kozlov, V., Panchenko, M., and Yausheva, E.: Diurnal variations of the submicron aerosol and black carbon in the near-ground layer, Atmos. Ocean. Opt., 24, 30–38, 2011.
Kuenen, J. J. P., Visschedijk, A. J. H., Jozwicka, M., and Denier van der Gon, H. A. C.: TNO-MACC_II emission inventory; a multi-year (2003–2009) consistent high-resolution European emission inventory for air quality modelling, Atmos. Chem. Phys., 14, 10963–10976, https://doi.org/10.5194/acp-14-10963-2014, 2014.
Kulbachevsky, A. O. (Ed.): Report on the state of the environment in Moscow in 2018, http://www.ecology.moscow/eco/ru/report_result/o_452195 (last access: 16 September 2021), 2019.
Kulbachevsky, A. O. (Ed.): Report on the state of the environment in Moscow in 2019, https://www.mos.ru/upload/documents/files/7452/Gosdoklad_last_edit_ll_.pdf (last access: 16 September 2021), 2020.
Kumar, S., Srivastava, A. K., and Pathak, V.: Surface solar radiation and its association with aerosol characteristics at an urban station in the Indo-Gangetic Basin: Implication to radiative effect, J. Atmos. Sol.-Terr. Phy., 193, 105061, https://doi.org/10.1016/j.jastp.2019.105061, 2019.
Kuznetsova, I. N., Shalygina, I. Yu., Nakhaev, M. I., Glazkova, A. A., Zakharova, P. V., Lezina, E. A., and Zvyagintsev, A. M.: Unfavorable meteorological factors for air quality, Proceedings of Russian Hydrometeorological Center, 351, 154–172, 2014.
Li, H., Meier, F., Lee, X., Chakraborty, T., Liu, J., Schaap, M., and Sodoudi, S.: Interaction between urban heat island and urban pollution island during summer in Berlin, Sci. Total Environ., 636, 818–828, https://doi.org/10.1016/j.scitotenv.2018.04.254, 2018.
Liu, C., Chung, C. E., Yin, Y., and Schnaiter, M.: The absorption Ångström exponent of black carbon: from numerical aspects, Atmos. Chem. Phys., 18, 6259–6273, https://doi.org/10.5194/acp-18-6259-2018, 2018.
Loeb, N. G. and Su, W.: Direct Aerosol Radiative Forcing Uncertainty Based on a Radiative Perturbation Analysis, J. Climate, 23, 5288–5293, https://doi.org/10.1175/2010JCLI3543.1, 2010.
Logothetis, S.-A., Salamalikis, V., and Kazantzidis, A.: Aerosol classification in Europe, Middle East, North Africa and Arabian Peninsula based on AERONET Version 3, Atmos. Res., 239, 104893, https://doi.org/10.1016/j.atmosres.2020.104893, 2020.
Lu, F., Xu, D., Cheng, Y., Dong, S., Guo, C., Jiang, X., and Zheng, X.: Systematic review and meta-analysis of the adverse health effects of ambient PM2.5 and PM10 pollution in the Chinese population, Environ. Res., 136, 196–204, https://doi.org/10.1016/j.envres.2014.06.029, 2015.
Lugon, L., Vigneron, J., Debert, C., Chrétien, O., and Sartelet, K.: Black carbon modeling in urban areas: investigating the influence of resuspension and non-exhaust emissions in streets using the Street-in-Grid model for inert particles (SinG-inert), Geosci. Model Dev., 14, 7001–7019, https://doi.org/10.5194/gmd-14-7001-2021, 2021.
Lyapustin, A., Wang, Y., Korkin, S., and Huang, D.: MODIS Collection 6 MAIAC algorithm, Atmos. Meas. Tech., 11, 5741–5765, https://doi.org/10.5194/amt-11-5741-2018, 2018.
Manisalidis, I., Stavropoulou, E., Stavropoulos, A., and Bezirtzoglou, E.: Environmental and Health Impacts of Air Pollution: A Review, Front. Public Health, 8, 14, https://doi.org/10.3389/fpubh.2020.00014, 2020.
Markowicz, K. M., Ritter, C., Lisok, J., Makuch, P., Stachlewska, I. S., Cappelletti, D., Mazzola, M., and Chilinski, M. T.: Vertical variability of aerosol single-scattering albedo and equivalent black carbon concentration based on in-situ and remote sensing techniques during the iAREA campaigns in Ny-Ålesund, Atmos. Environ., 431–447, https://doi.org/10.1016/j.atmosenv.2017.06.014, 2017.
Mosecomonitoring State Environmental Protection Agency: http://mosecom.mos.ru/, last access: 28 January 2022.
Myachkova, N. A.: Climates of the USSR, Moscow University Press, Moscow, 1983.
Myhre, G.: Consistency Between Satellite-Derived and Modeled Estimates of the Direct Aerosol Effect, Science, 325, 187–190, https://doi.org/10.1126/science.1174461, 2009.
Myhre, G., Berglen, T. F., Johnsrud, M., Hoyle, C. R., Berntsen, T. K., Christopher, S. A., Fahey, D. W., Isaksen, I. S. A., Jones, T. A., Kahn, R. A., Loeb, N., Quinn, P., Remer, L., Schwarz, J. P., and Yttri, K. E.: Modelled radiative forcing of the direct aerosol effect with multi-observation evaluation, Atmos. Chem. Phys., 9, 1365–1392, https://doi.org/10.5194/acp-9-1365-2009, 2009.
Myhre, G., Samset, B. H., Schulz, M., Balkanski, Y., Bauer, S., Berntsen, T. K., Bian, H., Bellouin, N., Chin, M., Diehl, T., Easter, R. C., Feichter, J., Ghan, S. J., Hauglustaine, D., Iversen, T., Kinne, S., Kirkevåg, A., Lamarque, J.-F., Lin, G., Liu, X., Lund, M. T., Luo, G., Ma, X., van Noije, T., Penner, J. E., Rasch, P. J., Ruiz, A., Seland, Ø., Skeie, R. B., Stier, P., Takemura, T., Tsigaridis, K., Wang, P., Wang, Z., Xu, L., Yu, H., Yu, F., Yoon, J.-H., Zhang, K., Zhang, H., and Zhou, C.: Radiative forcing of the direct aerosol effect from AeroCom Phase II simulations, Atmos. Chem. Phys., 13, 1853–1877, https://doi.org/10.5194/acp-13-1853-2013, 2013.
Odum, J. R., Hoffmann, T., Bowman, F., Collins, D., Flagan, R. C., and Seinfeld, J. H.: Gas/Particle partitioning and secondary organic aerosol yields, Environ. Sci. Technol., 30, 2580–2585, 1996.
O'Neill, N. T., Dubovik, O., and Eck, T. F.: Modified Ångström exponent for the characterization of submicrometer aerosols, Appl. Optics, 40, 2368, https://doi.org/10.1364/AO.40.002368, 2001.
OPTEC: https://www.optec.ru/, last access: 28 January 2022.
Poliukhov, A. A. and Blinov, D. V.: Aerosol Effects on Temperature Forecast in the COSMO-Ru Model, Russ. Meteorol. Hydrol., 46, 19–27, https://doi.org/10.3103/S1068373921010039, 2021.
Popovicheva, O. B., Evangeliou, N., Eleftheriadis, K., Kalogridis, A. C., Sitnikov, N., Eckhard, S., and Stohl, A.: Black Carbon Sources Constrained by Observations in the Russian High Arctic. Environmental Science and Technology, American Chemical Society (United States), 51, 3871–3879, 2017.
Popovicheva, O. B., Volpert, E., Sitnikov, N. M., Chichaeva, M. A., and Padoan, S.: Black carbon in spring aerosols of Moscow urban background, Geography, Environment, Sustainability, 13, 233–243, https://doi.org/10.24057/2071-9388-2019-90, 2020.
Popovicheva, O., Chichaeva, M., Kovach, R., Zhdanova, E., and Kasimov, N.: Seasonal, Weekly, and Diurnal Black Carbon in Moscow Megacity Background under Impact of Urban and Regional Sources, Atmosphere, 2022, 563, https://doi.org/10.3390/atmos13040563, 2022.
Rajesh, T. A. and Ramachandran, S.: Black carbon aerosol mass concentration, absorption and single scattering albedo from single and dual spot aethalometers: Radiative implications, J. Aerosol Sci., 119, 77–90, https://doi.org/10.1016/j.jaerosci.2018.02.001, 2018.
Ramanathan, V. and Carmichael, G.: Global and regional climate changes due to black carbon, Nat. Geosci., 1, 221–227, https://doi.org/10.1038/ngeo156, 2008.
Ramachandran, S. and Rajesh, T. A.: Black carbon aerosol mass concentrations over Ahmedabad, an urban location in western India: Comparison with urban sites in Asia, Europe, Canada, and the United States, J. Geophys. Res., 112, D06211, https://doi.org/10.1029/2006JD007488, 2007.
Reddy, M. S. and Venkataraman, C.: Inventory of aerosol and sulphur dioxide emissions from India: I – Fossil fuel combustion, Atmos. Environ., 36, 677–697, https://doi.org/10.1016/S1352-2310(01)00463-0, 2002.
Riemer, N., Vogel, H., Vogel, B., and Fiedler, F.: Modeling aerosols on the mesoscale-γ: Treatment of soot aerosol and its radiative effects, J. Geophys. Res., 109, 4601, https://doi.org/10.1029/2003JD003448, 2003.
Rivin, G. S., Rozinkina, I. A., Astakhova, E. D., Blinov, D. V., Bundel'A, Y., Kirsanov, A. A., and Churiulin, E. V.: COSMO-Ru high-resolution short-range numerical weather prediction system: its development and applications, Hydrometeorol. Res. Forecast., 374, 37–53, 2019.
Rolph, G., Stein, A., and Stunder, B.: Real-time Environmental Applications and Display sYstem: READY, Environ. Modell. Softw., 95, 210–228, https://doi.org/10.1016/j.envsoft.2017.06.025, 2017.
Schell, B., Ackermann, I. J., Binkowski, F. S., and Ebel, A.: Modeling the formation of secondary organic aerosol within a comprehensive air quality model system, J. Geophys. Res., 106, 28275–28293, 2001.
Segura, S., Estellés, V., Utrillas, M., and Martínez-Lozano, J.: Long term analysis of the columnar and surface aerosol relationship at an urban European coastal site, Atmos. Environ., 167, 309–322, https://doi.org/10.1016/j.atmosenv.2017.08.012, 2017.
Seinfeld, J. H. and Pandis, S. N. (Eds.): Atmospheric chemistry and physics: from air pollution to climate change, 3rd Edn., A Wiley- Interscience publication, Hoboken, New Jersey, USA, 2016.
Singh, S., Tiwari, S., Gond, D. P., Dumka, U. C., Bisht, D. S., Tiwari, S., Pandithurai, G., and Sinha, A.: Intra-seasonal variability of black carbon aerosols over a coal field area at Dhanbad, India, Atmos. Res., 161–162, 25–35, https://doi.org/10.1016/j.atmosres.2015.03.015, 2015.
Stein, A. F., Draxler, R. R., Rolph, G. D., Stunder, B. J. B., Cohen, M. D., and Ngan, F.: NOAA's HYSPLIT atmospheric transport and dispersion modeling system, B. Am. Meteorol. Soc., 96, 2059–2077, https://doi.org/10.1175/BAMS-D-14-00110.1, 2015.
Stockwell, W. R., Middleton, P., and Chang, J. S.: The second generation regional acid deposition model chemical mechanism for regional air quality modelling, J. Geophys. Res., 95, 16343–16367, 1990.
Su, W., Loeb, N. G., Schuster, G. L., Chin, M., and Rose, F. G.: Global all-sky shortwave direct radiative forcing of anthropogenic aerosols from combined satellite observations and GOCART simulations, J. Geophys. Res.-Atmos., 118, 655–669, https://doi.org/10.1029/2012JD018294, 2013.
Sun, J., Zhi, G., Hitzenberger, R., Chen, Y., Tian, C., Zhang, Y., Feng, Y., Cheng, M., Zhang, Y., Cai, J., Chen, F., Qiu, Y., Jiang, Z., Li, J., Zhang, G., and Mo, Y.: Emission factors and light absorption properties of brown carbon from household coal combustion in China, Atmos. Chem. Phys., 17, 4769–4780, https://doi.org/10.5194/acp-17-4769-2017, 2017.
Szkop, A., Pietruczuk, A., and Posyniak, M.: Classification of Aerosol over Central Europe by Cluster Analysis of Aerosol Columnar Optical Properties and Backward Trajectory Statistics, Acta Geophys., 64, 2650–2676, 2016.
Tang, T., Shindell, D., Zhang, Y., Voulgarakis, A., Lamarque, J.-F., Myhre, G., Faluvegi, G., Samset, B. H., Andrews, T., Olivié, D., Takemura, T., and Lee, X.: Distinct surface response to black carbon aerosols, Atmos. Chem. Phys., 21, 13797–13809, https://doi.org/10.5194/acp-21-13797-2021, 2021.
TNO: https://www.tno.nl/en/, last access: 15 September 2021.
Toll, V., Gleeson, E., Nielsen, K. P., Männik, A., Mašek, J., Rontu, L., and Post, P.: Impacts of the direct radiative effect of aerosols in numerical weather prediction over Europe using the ALADIN-HIRLAM NWP system, Atmos. Res., 172, 163–173, 2016.
Ukhov, A., Mostamandi, S., da Silva, A., Flemming, J., Alshehri, Y., Shevchenko, I., and Stenchikov, G.: Assessment of natural and anthropogenic aerosol air pollution in the Middle East using MERRA-2, CAMS data assimilation products, and high-resolution WRF-Chem model simulations, Atmos. Chem. Phys., 20, 9281–9310, https://doi.org/10.5194/acp-20-9281-2020, 2020.
Vil'fand, R. M., Kirsanov, A. A., Revokatova, A. P., Rivin, G. S., and Surkova, G. V.: Forecasting the transport and transformation of atmospheric pollutants with the COSMO-ART model, Russ. Meteorol. Hydrol., 42, 292–298, https://doi.org/10.3103/S106837391705003X, 2017.
Vogel, B., Hoose, C., Vogel, H., and Kottmeier, C.: A model of dust transport applied to the Dead Sea area, Meteorol. Z., 14, 611–624, 2006.
Vogel, B., Vogel, H., Bäumer, D., Bangert, M., Lundgren, K., Rinke, R., and Stanelle, T.: The comprehensive model system COSMO-ART – Radiative impact of aerosol on the state of the atmosphere on the regional scale, Atmos. Chem. Phys., 9, 8661–8680, https://doi.org/10.5194/acp-9-8661-2009, 2009.
Vogel, H., Bäumer, D., Bangert, M., Lundgren, K., Rinke, R., and Stanelle, T.: COSMO-ART: Aerosols and Reactive Trace Gases Within the COSMO Model, in: Integrated Systems of Meso-Meteorological and Chemical Transport Models, edited by: Baklanov, A., Alexander, M., and Sokhi, R., Springer, Berlin, Heidelberg, Germany, 75–80, https://doi.org/10.1007/978-3-642-13980-2_6, 2010.
Wang, D., Szczepanik, D., and Stachlewska, I. S.: Interrelations between surface, boundary layer, and columnar aerosol properties derived in summer and early autumn over a continental urban site in Warsaw, Poland, Atmos. Chem. Phys., 19, 13097–13128, https://doi.org/10.5194/acp-19-13097-2019, 2019.
Wang, X., Dickinson, R. E., Su, L., Zhou, C., and Wang, K.: PM2.5 Pollution in China and how it has been exacerbated by terrain and meteorological conditions, B. Am. Meteorol. Soc., 99, 105–119, https://doi.org/10.1175/BAMS-D-16-0301.1, 2018.
Wang, Y., Le, T., Chen, G., Yung, Y. L., Su, H., Seinfeld, J. H., and Jiang, J. H.: Reduced European aerosol emissions suppress winter extremes over northern Eurasia, Nat. Clim. Chang., 10, 225–230, https://doi.org/10.1038/s41558-020-0693-4, 2020.
Weingartner, E., Keller, C., Stahel, W. A., Burtscher, H., and Baltensperger, U.: Aerosol emission in a road tunnel, Atmos. Environ., 31, 451–462, https://doi.org/10.1016/S1352-2310(96)00193-8, 1997.
Whitby, E. R., McMurray, P. H., Shankar, U., and Binkowski, F. S.: Modal Aerosol Dynamics Modeling, Technical Report 600/3- 91/020, (NTIS PB91-161729/AS Natl. Tech. Inf. Serv. Springfield, Va.), Atmos. Res. and Exposure Assess. Lab. U.S. Environ. Prot. Agency, Research Triangle Park, N.C., 1991.
WMO-COST: Joint Report of COST Action 728 and GURME – Overview of Existing Integrated (off-line and on-line) Mesoscale Meteorological and Chemical Transport Modelling Systems in Europe (WMO TD No. 1427), GAW report 177, https://library.wmo.int/doc_num.php?explnum_id=9379 (last access: 16 September 2021), 2008.
World Data Centre for Aerosols: https://www.gaw-wdca.org, last access: 28 January 2022.
Wu, D., Wu, C., Liao, B., Chen, H., Wu, M., Li, F., Tan, H., Deng, T., Li, H., Jiang, D., and Yu, J. Z.: Black carbon over the South China Sea and in various continental locations in South China, Atmos. Chem. Phys., 13, 12257–12270, https://doi.org/10.5194/acp-13-12257-2013, 2013.
Wu, T. and Boor, B. E.: Urban aerosol size distributions: a global perspective, Atmos. Chem. Phys., 21, 8883–8914, https://doi.org/10.5194/acp-21-8883-2021, 2021.
Zawadzka, O., Markowicz, K. M., Pietruczuk, A., Zielinski, T., and Jaroslawski, J.: Impact of urban pollution emitted in Warsaw on aerosol properties, Atmos. Environ., 69, 15–28, https://doi.org/10.1016/j.atmosenv.2012.11.065, 2013.
Zhdanova, E. Y., Chubarova, N. Y., and Lyapustin, A. I.: Assessment of urban aerosol pollution over the Moscow megacity by the MAIAC aerosol product, Atmos. Meas. Tech., 13, 877–891, https://doi.org/10.5194/amt-13-877-2020, 2020.
Zhuang, B., Wang, T., Liu, J., Che, H., Han, Y., Fu, Y., Li, S., Xie, M., Li, M., Chen, P., Chen, H., Yang, X.-Q., and Sun, J.: The optical properties, physical properties and direct radiative forcing of urban columnar aerosols in the Yangtze River Delta, China, Atmos. Chem. Phys., 18, 1419–1436, https://doi.org/10.5194/acp-18-1419-2018, 2018.