the Creative Commons Attribution 4.0 License.
the Creative Commons Attribution 4.0 License.
 | 12 Aug 2022
Estimating global ammonia (NH3) emissions based on IASI observations from 2008 to 2018
Yuzhong Zhang
Wei Chen
Martin Van Damme
Pierre-François Coheur
Lieven Clarisse
Emissions of ammonia (NH3) to the atmosphere impact human health, climate, and ecosystems via their critical contributions to secondary aerosol formation. However, the estimation of NH3 emissions is associated with large uncertainties because of inadequate knowledge about agricultural sources. Here, we use satellite observations from the Infrared Atmospheric Sounding Interferometer (IASI) and simulations from the GEOS-Chem model to constrain global NH3 emissions over the period from 2008 to 2018. We update the prior NH3 emission fluxes with the ratio between biases in simulated NH3 concentrations and effective NH3 lifetimes against the loss of the NHx family. In contrast to the approximate factor of 2 discrepancies between top-down and bottom-up emissions found in previous studies, our method results in a global land NH3 emission of 78 (70–92) Tg a−1, which is ∼30 % higher than the bottom-up estimates. Regionally, we find that the bottom-up inventory underestimates NH3 emissions over South America and tropical Africa by 60 %–70 %, indicating underrepresentation of agricultural sources in these regions. We find a good agreement within 10 % between bottom-up and top-down estimates over the US, Europe, and eastern China. Our results also show significant increases in NH3 emissions over India (13 % per decade), tropical Africa (33 % per decade), and South America (18 % per decade) during our study period, which is consistent with the intensifying agricultural activity in these regions in the past decade. We find that the inclusion of the sulfur dioxide (SO2) column observed by satellite is crucial for more accurate inference of NH3 emission trends over important source regions such as India and China where SO2 emissions have changed rapidly in recent years.
- Article
(3281 KB) - Full-text XML
-
Supplement
(877 KB) - BibTeX
- EndNote


Emissions of ammonia (NH3) to the atmosphere have critical implications for human health, climate, and ecosystems. As the main alkaline gas, NH3 reacts with acidic products from precursors such as nitrogen oxides (NOx) and sulfur dioxide (SO2) to form fine particulate matter, which is a well-documented risk factor for human health, causing great welfare loss globally (Erisman, 2021; Gu et al., 2021). Particulate matter also affects the Earth's radiative balance directly, by scattering incoming radiation (Ma et al., 2012), and indirectly, as cloud condensation nuclei (Höpfner et al., 2019). Additionally, both gas-phase ammonia (NH3) and aerosol-phase ammonium (NH) can deposit onto the surface of land and water through dry and wet processes, and they are associated with soil acidification (Zhao et al., 2009), ecosystem eutrophication (Dirnböck et al., 2014), biodiversity loss (Stevens et al., 2010), and cropland nitrogen uptake (Liu et al., 2013).
NH3 is emitted from a variety of anthropogenic and natural sources, including agriculture, industry, fossil fuel combustion, biomass burning, natural soils, the ocean, and wild animals (Behera et al., 2013). Among these, agricultural activity, mainly livestock manure management and mineral fertilizer application, is the most important NH3 source, accounting for ∼70 % of the total NH3 emissions globally (Bouwman et al., 1997; Sutton et al., 2013). NH3 emissions can be estimated using a bottom-up approach based on information about emission activity and emission factors (Hoesly et al., 2018; Crippa et al., 2020). However, bottom-up estimates of NH3 emissions are generally thought to be uncertain, relative to other pollutants that are mainly from fossil fuel combustion sources (e.g., NOx and CO). One of the challenges is that the intensity of agricultural NH3 emissions (i.e., emission factors), either from livestock or fertilizer, depends strongly on management and farming practices, but this information is usually not widely available (Zhang et al., 2017). Furthermore, microbial activity that is responsible for agricultural NH3 emissions is highly variable and has a complex dependence on environmental conditions, which is often inadequately captured by bottom-up approaches (Behera et al., 2013; Vira et al., 2022). In many cases, emission factors used in bottom-up modeling are based on local studies that are not representative of the diversity of conditions and are not dependent on meteorological parameters.
Top-down analyses of atmospheric observations (e.g., NH3 concentrations or NH depositional fluxes) provide an alternative constraint on NH3 emissions. For example, observations of NH3 concentrations and NH deposition fluxes from surface networks can be used to infer regional NH3 emission fluxes (e.g., Paulot et al., 2014). However, surface sites are often sparse, especially on developing continents such as Africa and South America, limiting our capability to constrain NH3 emissions globally. The advent of satellite observations has made it possible to investigate long-term spatially resolved NH3 emissions at national, continental, or even global scales. Van Damme et al. (2018) reported large NH3 point sources across the globe that have been detected by the Infrared Atmospheric Sounding Interferometer (IASI) instrument but are missing in the bottom-up inventories. Studies have also applied satellite data (e.g., IASI and Cross-track Infrared Sounder, CrIS, data) to study NH3 emissions from important source regions, including the US (Cao et al., 2020; Chen et al., 2021a), China (Zhang et al., 2018), and Europe (Marais et al., 2021; van der Graaf et al., 2022). These regional studies show 20 %–50 % differences between top-down and bottom-up estimates of NH3 emissions.
Compared with regional analyses, long-term global analyses of NH3 emissions based on satellite observations are relatively scarce (e.g., Evangeliou et al., 2021). This is partly because of the computational challenges arising from a full-fledged inversion for a long period of time and over large spatial extents. In a recent study, Evangeliou et al. (2021) proposed a fast top-down method in which NH3 emissions are computed as the ratio between NH3 column observations and NH3 lifetime. This method relies on NH3 lifetime diagnosed from a chemical transport model (CTM) and assumes a local mass balance. Their analysis found a global NH3 emission of around 180 Tg a−1, which is roughly triple the widely used bottom-up estimates (e.g., 62 Tg a−1 from the Community Emission Data System, CEDS). This large upward adjustment, if true, would have huge implications for global reactive nitrogen cycles and would indicate that our current understanding of global NH3 emissions is seriously flawed.
In this paper, we examine if the large discrepancy between the bottom-up and top-down estimates is due to the methodology. We refine the fast top-down approach by improving the NH3 lifetime diagnosis and partially accounting for the transport contributions. We develop a series of data-filtering procedures to exclude results that are not sufficiently constrained by observations or affected by large deviations from the assumption of the fast top-down method. We apply the updated method to IASI observations to derive the global distribution of NH3 emissions fluxes from 2008 to 2018, and examine the impact of the improved method on global NH3 emission inferences.
2.1 IASI observations
We use 2008–2018 reanalyzed daily NH3 total column retrievals (ANNI-NH3-v3R) from the IASI on board Metop-A. The IASI instrument measures the infrared radiation (645–2760 cm−1) from Earth's surface and the atmosphere with a circular 12 km footprint at nadir (Clerbaux et al., 2009; Van Damme et al., 2017). The retrieval algorithm calculates the hyperspectral range index from IASI spectra measurements (Van Damme et al., 2014) and converts it to the NH3 total column density via an artificial neural network (Whitburn et al., 2016; Franco et al., 2018). The retrieval uses consistent meteorological data from the ERA5 reanalysis, so it is suitable for the analyses of interannual variability and long-term trends (Hersbach et al., 2020). The ANNI-NH3-v3R product has been validated against in situ measurements and has been shown to have a good regional correlation (Guo et al., 2021; Van Damme et al., 2021). The dataset has been used in previous studies to estimate NH3 emissions globally (e.g., Evangeliou et al., 2021) and regionally (e.g., Chen et al., 2021a; Marais et al., 2021).
Here, we only use morning NH3 data (around 09:30 local solar time), although IASI provides global coverage twice daily, because of the better precision of morning observations resulting from favorable thermal contrast conditions (Clarisse et al., 2009). We filter out data with a cloud fraction greater than 10 % (Van Damme et al., 2018) and a skin temperature below 263 K (Van Damme et al., 2014). The skin temperature dataset is from ERA5 (Hersbach et al., 2020). For comparison with simulated NH3 columns (see Sect. 2.2), we regrid and average monthly IASI NH3 observations over land on the GEOS-Chem 4∘ × 5∘ grid (Fig. 1a). To reduce uncertainty from sparse sampling, we further exclude grid cells with a monthly number of successful retrievals of less than 800. We also test threshold values of 400 and 1200 successful retrievals per month in the sensitivity calculations (Table 1, rows 5–6). This criterion mainly affects the high latitudes during wintertime, as snow surfaces make these regions unfavorable for infrared measurements (Fig. S1).

Figure 1Spatial distribution of (a, c) IASI and (b, d) GEOS-Chem NH3 column concentrations. (a, b) Mean and (c, d) linear trends within the 70∘ N–70∘ S band during 2008–2018. The dots in panels (c) and (d) indicate that linear trends are significant at the 95 % confidence level. Linear trends are computed from the time series of annual averages.
2.2 GEOS-Chem simulations
We use the GEOS-Chem CTM v12.9.3 (https://doi.org/10.5281/zenodo.3974569; The International GEOS-Chem User Community, 2020) to simulate global NH3 concentrations. The GEOS-Chem model, driven by Version 2 of the Modern-Era Retrospective Analysis for Research and Applications (MERRA-2) reanalyzed meteorology (Gelaro et al., 2017), simulates the tropospheric ozone–NOx–volatile organic compound–aerosol chemistry at a 4∘ × 5∘ resolution with 47 vertical layers (30 layers in the troposphere) (Bey et al., 2001; Park et al., 2004). The thermodynamic equilibrium between gas-phase NH3 and aerosol-phase NH is explicitly simulated by the ISORROPIA II module in GEOS-Chem (Fountoukis and Nenes, 2007). The model also simulates the wet and dry deposition of NH3 and NH, which represent the terminal sinks of atmospheric NHx (≡ NH3+ NH). Dry deposition is represented with a resistances-in-series scheme (Wesely, 2007), and wet deposition includes scavenging in convective updrafts and in- and below-cloud scavenging from large-scale precipitation (Wang et al., 2011; Amos et al., 2012). Anthropogenic emissions of simulated chemicals, including those of NH3, are taken from the CEDS global emission inventory (Hoesly et al., 2018), overridden by regional inventories in Canada (Air Pollutant Emission Inventory, APEI), the US (2011 National Emissions Inventory, NEI-2011), Asia (MIX-Asia v1.1; Li et al., 2017), and Africa (DICE-Africa; Marais and Wiedinmyer, 2016). Such compiled anthropogenic emissions only include incomplete information on interannual trends because inventories are not all available throughout the whole period. Anthropogenic emissions are essentially invariant after 2013 in our setup (Fig. S2). The general lack of trends in SO2 emissions in the simulation, if not accounted for, may cause biases in inferred trends over regions such as India and China where SO2 emissions have changed rapidly (Sun et al., 2018; Qu et al., 2019; Chen et al., 2021b). Fire emissions are from the Global Fire Emissions Database (GFED4; van der Werf et al., 2017), and biogenic volatile organic compound (VOC) emissions are from the Model of Emissions of Gases and Aerosols from Nature (MEGAN; Guenther et al., 2012). Temporal (seasonal and interannual) variations in fire and biogenic emissions are resolved by the inventories. Hereafter, we refer to NH3 prior bottom-up emissions from this set of inventories as “BUE1”. For comparison, we also use another set of bottom-up inventories that consist of EDGARv5.0 (Emissions Database for Global Atmospheric Research, version 5.0) for anthropogenic emissions (https://data.jrc.ec.europa.eu/collection/edgar, last access: 8 March 2022, Crippa et al., 2020) and the Global Fire Assimilation System (GFAS) for fire emissions (CAMS, https://apps.ecmwf.int/datasets/data/cams-gfas/, last access: 8 March 2022) (minor natural emissions are the same as BUE1), which we denote as “BUE2”.
The GEOS-Chem simulation is conducted from 2008 to 2018 with an additional 1-month spin-up starting from December 2007. We sample the simulated NH3 and NH concentration fields between 09:00 and 10:00 local solar time, approximately the IASI morning overpass time. For comparison with the IASI NH3 columns, we integrate the vertical profiles of simulated NH3 concentrations by layer thickness. We note that the ANNI-NH3-v3R algorithm does not involve averaging kernels (Whitburn et al., 2016; Van Damme et al., 2021). Van Damme et al. (2018) reported the uncertainty in different vertical profiles of individual NH3 measurements to be 2 % ±24 % (global average). We also archive simulated depositional and transport rates for NH3 and NH, which are used in emission flux estimations. In addition, we perform GEOS-Chem simulations in selected years (2008, 2013, and 2018) to examine the validation and consistency of our top-down NH3 emission estimates with the ground-based measurements and IASI observations.
2.3 NH3 emission flux estimations
We compute NH3 fluxes (, in molec. m−2 s−1) in land grid cells for individual months from 2008 to 2018. We update the prior model emission fluxes (, in molec. m−2 s−1) with a correction term positively proportional to the difference between observed (, in molec. m−2) and simulated (, in molec. m−2) monthly averaged NH3 total column densities and inversely proportional to the lifetime of NH3 (, in s):
Here, is computed as the ratio of the simulated NH3 column and the sum of the simulated loss rate of the NHx family (NHx≡ NH3+ NH) through dry and wet deposition of NH3 (, in molec. m−2 s−1) and NH (, in molec. m−2 s−1):
We calculate the lifetime of NH3 with the loss of the NHx family, rather than that of NH3, because of the fast thermodynamic equilibrium between gas-phase NH3 and aerosol-/aqueous-phase NH, which implies that the conversion from NH3 to NH is not a terminal loss for NH3 from the atmosphere. The NH3 lifetime may be underestimated over source regions and overestimated over remote regions if NH3 to NH conversions are treated as a terminal loss, as in Evangeliou et al. (2021), rather than a partition within a chemical family (NHx), as in Eq. (2).
In addition, our method linearizes the column–emission relationship at prior emissions as opposed to zero emissions, as used in the previous method (e.g., Evangeliou et al., 2021). Here, the baseline NH3 column () simulated by the GEOS-Chem model explicitly accounts for the nonlocal contribution of transport, whereas the correction to prior emissions is only done locally – that is, the difference between and is attributed only to errors in local emissions without accounting for the sensitivity to emissions from other grid cells. This hybrid approach can partially include the nonlocal contribution from transport but still keeps the computation tractable for a long-term study (such as this study), striking a trade-off between the computational efficiency of a local mass balance method (e.g., Van Damme et al., 2018; Evangeliou et al., 2021) and the accuracy of a full-fledged inversion, such as the 4D-Var method (e.g., Cao et al., 2020; Chen et al., 2021a). The errors arising from local correction of NH3 emissions are expected to be small in most cases, as the NH3 lifetime is short relative to a typical transport time across a 4∘ × 5∘ grid cell on which emissions are estimated. To identify cases when this error is not negligible, we apply a monthly NHx budget analysis based on the GEOS-Chem simulation and exclude grid cells from our analysis where transport dominates over local prior emissions or deposition in the monthly NHx budget (Transport/Emission >1 or Transport/Deposition >1) (Fig. S3).
Because rapid changes in SO2 emissions in eastern China and India, particularly after 2012, are not captured by our prior simulation (Fig. S2), the estimation of NH3 emission trends using Eq. (1) may be biased over these regions. To address this issue, we further modify Eq. (1) to include observed trends in SO2 column concentrations:
where ω (%) is the fractional changes in average SO2 columns relative to the baseline year (i.e., 2012) over China or India, and (molec. m−2 s−1) is the simulated column densities of aerosol sulfate. Here, we specify a linear trend of −5 % a−1 for eastern China and 5 % a−1 for India between 2012 and 2018, based on values derived from the Ozone Monitoring Instrument (OMI) and Ozone Mapping and Profiler Suite (OMPS) observations (Wang and Wang, 2020; Liu et al., 2018). We also test the impact of the uncertainty in ω on trend inferences over China and India. The factor 2 accounts for the fact that two molecules of NH3 are required to neutralize one molecule of H2SO4. Equation (3) only applies when NH3 is in excess, which is a condition usually met in eastern China and India but not necessarily elsewhere (Lachatre et al., 2019; Acharja et al., 2022). Therefore, we only apply Eq. (3) to eastern China and India to understand the impact of changing SO2 emissions on the inference of NH3 emission trends. The systematic use of SO2 observations in NH3 emission estimations requires further investigations.
2.4 Uncertainty and sensitivity analysis
We perform a series of perturbation and sensitivity experiments to assess the uncertainty of our estimates (Table 1). We perturb and in Eq. (1). The perturbations to are set to be 50 % and 200 % (Table 1, rows 1–2). The perturbation to is set to be the standard deviation of monthly mean column concentrations (σC,obs) (Table 1, rows 3–4), which is given by
where Ωi (in mol m−2) is the ith NH3 column measurement out of a total number of n observations in a grid cell during a month, and σi is the relative error. We then use to evaluate the effect of measurement errors in emission estimates (Table 1, rows 3–4). We compute results with alternative data-filtering parameters (Table 1, rows 5–8), including the thresholds to exclude grid cells when the number of observations is too small (Table 1, rows 5–6) and the local mass balance assumption is potentially invalid (Table 1, rows 7–8). We also test if our trend inferences over China and India using Eq. (3) are sensitive to uncertainty in observed trends in SO2 concentrations (ω).
Table 1Uncertainty and sensitivity analyses of top-down NH3 emissions. Annual averaged NH3 emissions are summed over global land areas for 2008–2018.
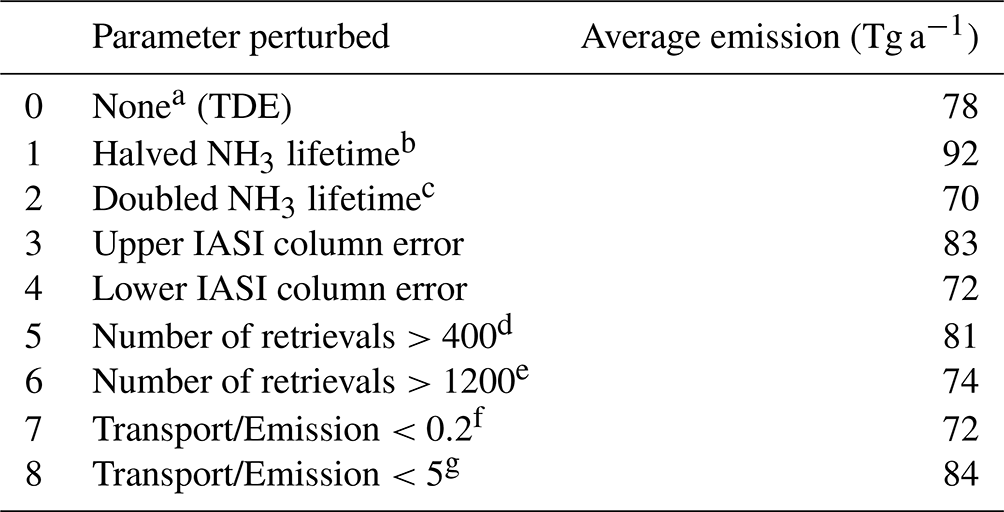
a Excluding a grid cell if the retrieval number is less than 800 during a month or if transport dominates over emissions or deposition in the simulated monthly NH3 budget. b,c The lifetime is 50 % or 200 % of values from Eq. (1), respectively. d,e The monthly retrieval number threshold for including a grid cell is set to be 400 or 1200, respectively. f,g The local budget ratio of the threshold for including a grid cell is set to be 0.2 or 5, respectively.
3.1 Observed and simulated NH3 concentrations
Figure 1a and b plot observed and simulated NH3 total column concentrations averaged over 2008–2018. The GEOS-Chem simulation generally reproduces the global distribution of NH3 concentrations observed by the IASI instrument. Good agreements (i.e., difference <10 %) are found in the US, Europe, and southern South America. However, the GEOS-Chem model underestimates NH3 concentrations by 20 %–120 % in eastern China, northern South America, and tropical Africa, and it overestimates NH3 concentrations by around 50 % in southern India, indicating biases in NH3 emissions over these regions.
Figure 1c and d show 2008–2018 linear trends in NH3 column concentrations derived from the IASI observations and the GEOS-Chem simulations. The linear trends are computed based on the time series of annual averages. The IASI trends shown in Fig. 1c are generally consistent with a recent analysis by Van Damme et al. (2021). IASI observes a positive NH3 concentration trend of 2.9 % a−1 over the US, and this trend is well captured by GEOS-Chem. Similarly, the observations and simulation agree on a dipole pattern in South America (i.e., positive trend in Brazil and negative trend in Argentina). Because anthropogenic emissions over this region are set to be invariant in our simulation (Fig. S2), this agreement suggests that these trends are due to meteorological conditions and/or fire emissions, rather than changes in anthropogenic emissions. The satellite also observes significant positive trends in NH3 concentrations over China (5.2 % a−1) and tropical Africa (2.0 % a−1), but these trends are not reproduced in the simulation (0.3 % a−1 for China and 0.2 % a−1 for tropical Africa). These simulation–observation differences may not only reflect discrepancies in the trends in anthropogenic NH3 emissions but can also be attributed to uncaptured changes in SO2 and/or NOx emissions in these regions. We also find that a positive NH3 concentration trend over Europe appears in the simulation (3.0 % a−1) but is much weaker (1.0 % a−1) in the observations, suggesting decreasing emissions after 2013. Satellite data show positive NH3 concentration trends in northwestern India but negative trends in southeastern India which are not reproduced by the simulation, although these trends over India are mostly insignificant (at the 95 % confidence level) except for a few grid cells in the southeast. Strong GEOS-Chem trends in eastern Canada and Siberia result from large wildfires that occurred in the latter part of the study period. IASI trends in northern boreal regions are less robust because of noisy and sparse measurements over high latitudes (Figs. S1, S3).
3.2 NH3 emissions inferred from IASI observations
Figure 2 shows the spatial distributions of NH3 emission fluxes and their 2008–2018 linear trends inferred from IASI observations using the method described in Sect. 2.3. Figure 3 plots annual time series aggregated for seven selected regions. The top-down emission (TDE) estimates suggest upward adjustments in NH3 emissions of 62 % over South America (SA), 69 % over tropical Africa (TA), and 327 % over Central Asia (CA), relative to the prior inventory (BUE1), but downward adjustments in NH3 emissions of 14 % over the India Peninsula (IP) and 33 % over Canada. After accounting for the contributions from natural emissions including fires, we find that most of these biases in NH3 emissions can be attributed to anthropogenic sources, except in Canada where the underestimation appears to be related to fire emissions. This result reflects a general inadequate representation of agricultural and industrial emissions from developing continents in current global emission inventories. The TDE finds good agreements with the BUE1 (difference within 10 %) over the US, Europe (EU), eastern China (EC), and Australia.
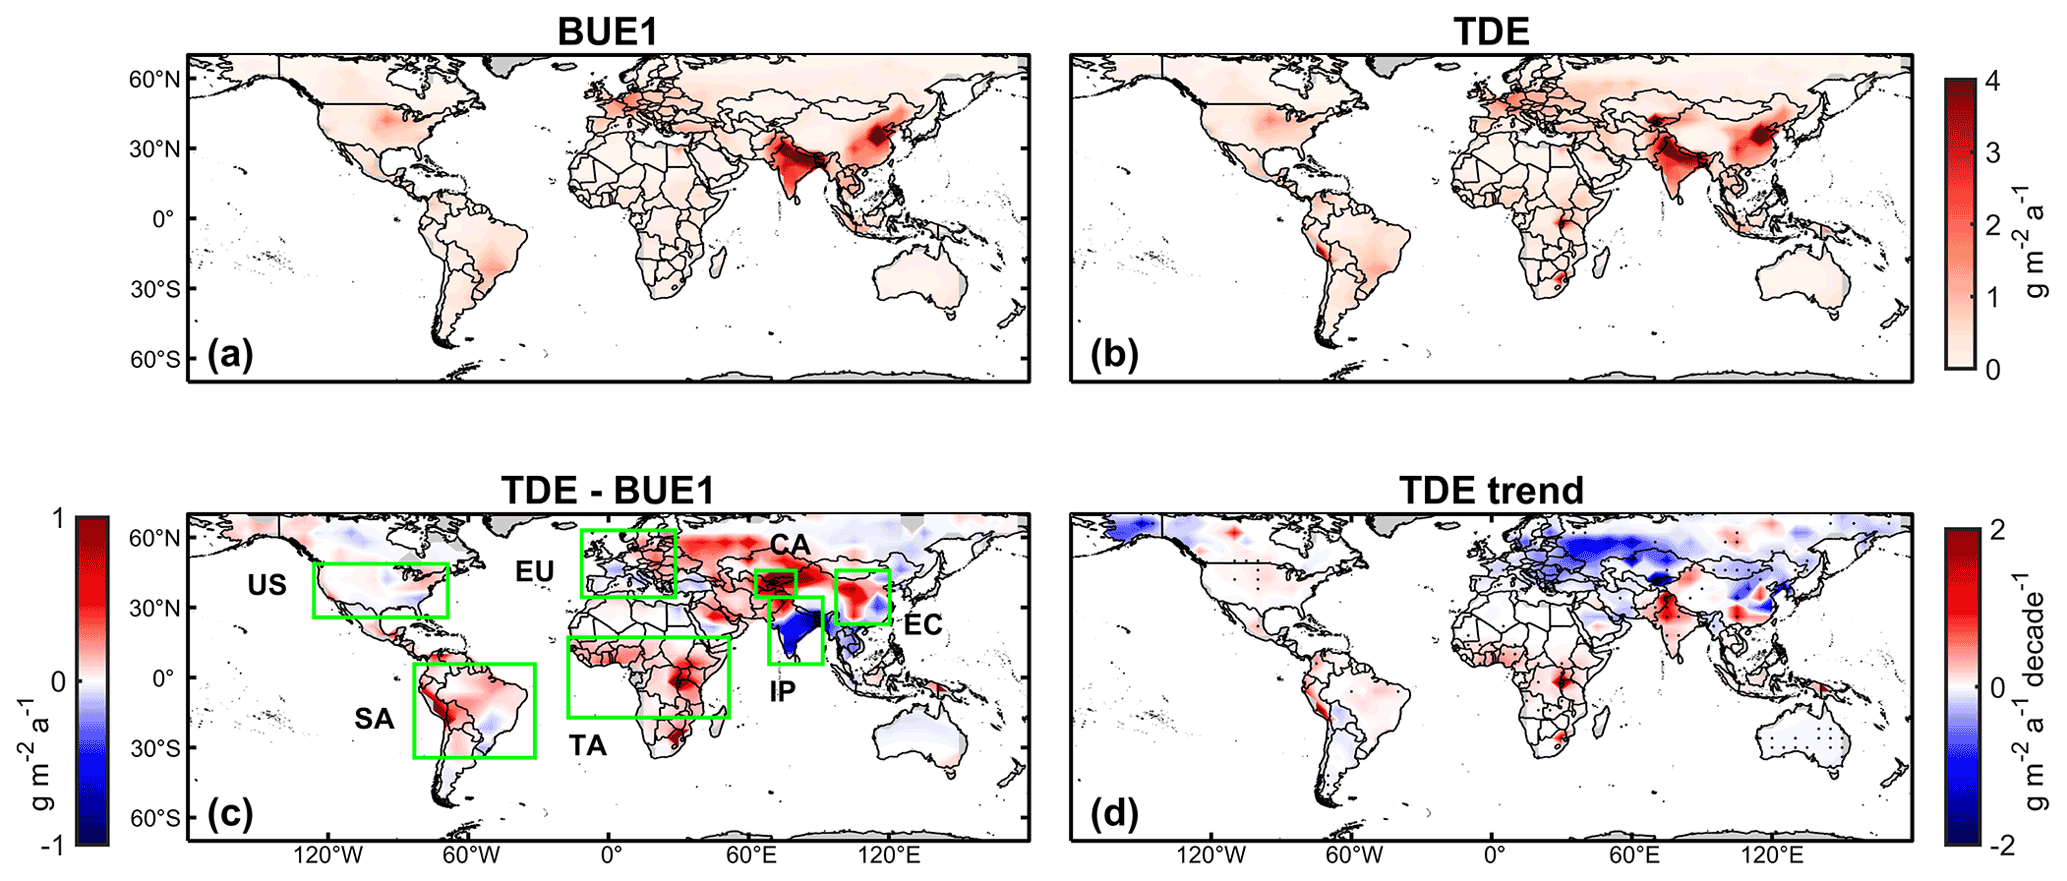
Figure 2Spatial distribution of NH3 emission fluxes during 2008–2018, showing (a) bottom-up emissions (BUE1) and (b) top-down emissions (TDE) inferred from IASI observations, (c) the difference between TDE and BUE1 estimates, and (d) emission trends derived from TDE estimates. Green boxes denote the seven regions analyzed in Sect. 3.2. Top-down emission fluxes are computed with Eq. (1) except for IP and EC for which Eq. (3) is applied. Linear trends are computed from the time series of annual averages. The dots in panel (d) represent significant linear trends at the 95 % confidence level.
In addition to the adjustments in average emissions, the TDE also detects changes in NH3 emissions during the period from 2008 to 2018, as expressed in linear trends computed from annual time series. We find significant positive emission trends in SA (1.7 Tg a−1 per decade or 18 % per decade) and TA (2.8 Tg a−1 per decade or 33 % per decade) (Fig. 3). The large positive trends in TA are found around Lake Natron, consistent with Clarisse et al. (2019) (Fig. 2d). These increases in NH3 emissions are concurrent with intensifying agricultural activity in these regions (Warner et al., 2017; Hickman et al., 2021), except for a 2010 peak over SA that coincides with fires in savanna and evergreen forests in this region (Chen et al., 2014). Comparison with data from the Food and Agriculture Organization (FAO) of the United Nations (http://www.fao.org/faostat, last access: 7 May 2022) suggests that the increase in SA is driven primarily by a growing application of synthetic fertilizer (55 % per decade), whereas the increase in TA is consistent with an increasing amount of manure (28 % per decade) from a growing livestock population (Hickman et al., 2021) (Fig. 4).
Our results infer large but variable trends over northern high latitudes (e.g., negative trends in Alaska, central Russia, and eastern Europe, but positive trends in Canada) (Fig. 2d). Because of large uncertainties associated with high-latitude observations and emission optimization, these trends are less robust but can be partly attributed to variations in fire activity. Decreases in Russia and eastern Europe are related to wildfire in boreal forests in the early part of the study period (2008–2011) (Keywood et al., 2011; Warner et al., 2017), while emission increases in Canada are due to wildfire in the late part of the study period (2013–2016 and 2017) (Pavlovic et al., 2016), as also shown in the prior fire inventory (GFED4) (Fig. S4). We also infer negative trends (−43 % per decade) in Australia, which are statistically significant, but the absolute magnitude of these trends is small (−0.03 g m−2 a−1 per decade; Fig. 2d). The TDE estimation does not find significant trends in NH3 total emissions over the US or Central Asia.
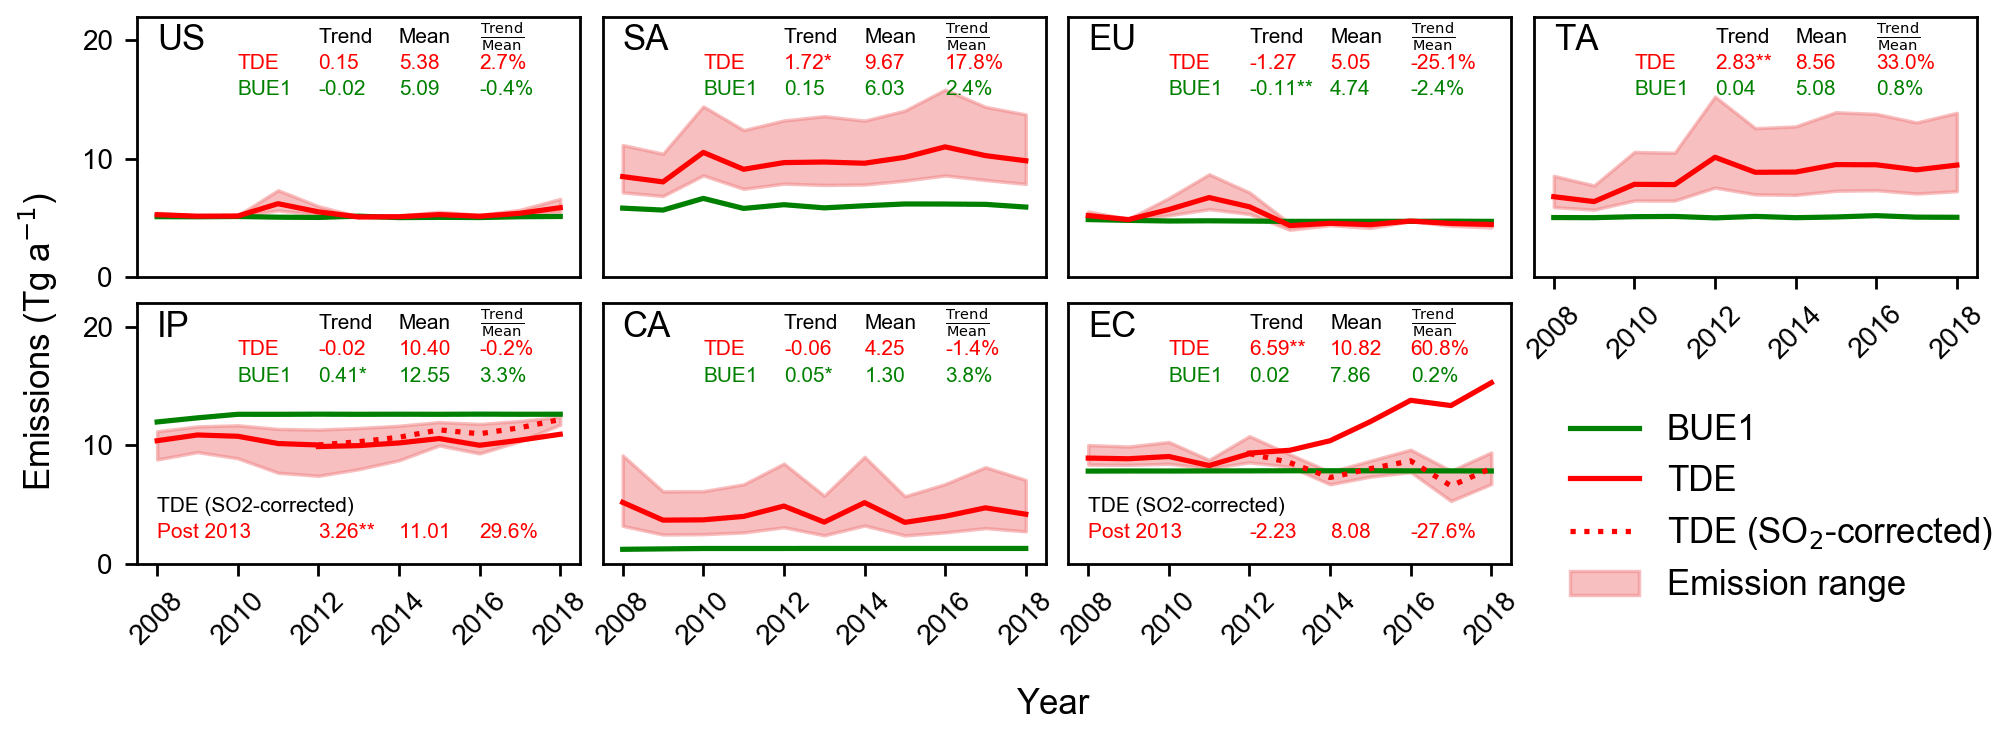
Figure 3Annual NH3 emissions for seven selected regions during 2008–2018. The shaded regions represent the upper and lower bounds derived from uncertainty analyses (see Sect. 2.4). Average annual emissions (Tg a−1), absolute linear trends (Tg a−1 per decade), and relative trends (% per decade) for 2008–2018 are inset. The asterisk symbols “*” and “**” represent that linear trends are significant at the 95 % and 99 % confidence levels, respectively. Red dashed lines represent top-down NH3 emission estimates over IP and EC during 2013–2018, based on Eq. (3) which accounts for observed trends in SO2 (denoted as “SO2-corrected”). Statistics for this estimate are also inset. The prior inventory (BUE1) implemented in our simulation only partially accounts for interannual changes from bottom-up information (i.e., Fig. 4).

Figure 4Synthetic fertilizer and livestock manure amount based on FAO reports (http://www.fao.org/faostat, last access: 7 May 2022) during 2008–2018. To roughly compare the contribution from the two sectors, we convert FAO-reported statistics to NH3 emissions (Tg a−1) by applying fixed emission factors of 13 % for manure N contents (Ma et al., 2021) and 17 % for synthetic fertilizer N contents (Riddick et al., 2016). The values of means (Tg a−1) and linear trends (Tg a−1 per decade) are inset. Scales differ between panels.
3.3 Impact of changing SO2 emissions on NH3 emission trends over eastern China and India
Based on NH3 column measurements (Eq. 1), we also find an increase of 61 % per decade (6.6 Tg a−1 per decade) in NH3 emissions over eastern China (Fig. 3). This increase is especially large after 2013 and is driven mainly by increases in the IASI NH3 column concentration in eastern China (Fig. 1c). This large post-2013 increase is inconsistent with flat or even declining fertilizer input and manure amount (Fig. 4). On the other hand, we find no appreciable emission trend in IP (Fig. 3), which appears to agree with relatively stable IASI NH3 concentrations over the period (Fig. 1c) but is not supported by the increases in fertilizer application and manure amount shown in the FAO report (Fig. 4).
An underlying assumption in Eq. (1) is that the model simulation captures the partition between gas-phase NH3 and aerosol-phase NH. In addition to alkaline NH3, the partition is also determined by the abundance of acids (e.g., H2SO4 and HNO3). Inaccurate emissions of their precursors (e.g., SO2 and NO2) in the model simulation, in particular over regions with excessive NH3, can lead to biases in simulating the NH3–NH partition. It is well known that SO2 emissions in China have decreased rapidly since 2013 because of stringent air pollution control measures (Sun et al., 2018; Zhai et al., 2021), while SO2 emissions from India have been increasing (Qu et al., 2019). However, these regional trends are not captured in our prior simulation because our simulation does not have annually varying emission inventories for these regions (Fig. S2).
We find that the discrepancies between top-down (Eq. 1) and bottom-up estimates of emission trends over EC and IP can be largely reconciled by including observed SO2 column concentrations in the top-down calculation (Eq. 3). By accounting for OMI- and OMPS-observed SO2 trends (Wang and Wang, 2020), we derive an overall decreasing trend in NH3 emissions in EC between 2013 and 2018 ( Tg a−1 per decade, % per decade) (the uncertainty is derived by perturbing ω by 1 % a−1, as for the India results below). This result suggests that observed increases in NH3 columns over China are largely explained by decreases in SO2 emissions (Figs. 1, 3), which is consistent with previous studies (Fu et al., 2017; Liu et al., 2018; Lachatre et al., 2019; Chen et al., 2021b). Bottom-up inventories (e.g., the Multi-resolution Emission Inventory for China, MEIC, v1.3 and EDGAR v5.0) also report stable or declining NH3 emissions from China during the study period (Li et al., 2017; Crippa et al., 2020). Meanwhile, the revised method (Eq. 3) finds a positive post-2013 trend (3.3±0.3 Tg a−1 per decade, 30±3 % a−1) in NH3 emissions over India. Compared with our original estimate using Eq. (1), NH3 emission trends derived with Eq. (3) (i.e., decrease in China and increase in India after 2013) are more consistent with the bottom-up information on fertilizer input and manure management (Fig. 4). This result demonstrates the potential of assimilating both NH3 and SO2 satellite observations when constraining NH3 emissions, which should be explored further in the future.
3.4 Global total NH3 emissions
Integrating over land areas globally, our IASI-based TDE estimate of NH3 is 78 (70–92) Tg a−1 (range of estimates from uncertainty analysis, see Table 1) (Fig. 5). This result is about 20 %–40 % higher than bottom-up inventories (BUE1 estimate of 62 Tg a−1 and BUE2 estimate of 56 Tg a−1). In contrast, a previous study by Evangeliou et al. (2021), also based on the IASI data, estimated a much higher global NH3 emission of 180 Tg a−1 (Fig. 5). One cause of the difference between the two IASI-based estimates is in the diagnosis of NH3 lifetime from CTM. Evangeliou et al. (2021) treats conversion from NH3 to NH as a terminal loss and diagnoses an average NH3 lifetime of 11.6±0.6 h globally from a CTM, which is close to the constant NH3 lifetime of 12 h assumed in Van Damme et al. (2018). In this study, we account for the fact that fast thermodynamic equilibrium can be established between NH3 and NH; thus, NH3 can only be terminally lost through the deposition of the NHx family (Eq. 2), which yields a global average NH3 lifetime of 21.2±3.8 h (Fig. 6). This longer NH3 lifetime implies higher sensitivity of the NH3 column density to NH3 emissions, leading to a lower estimate of global NH3 emissions. In addition, instead of locally scaling the observed NH3 column by lifetime (Van Damme et al., 2018; Evangeliou et al., 2021; Marais et al., 2021), our method (Eq. 1) partially accounts for the nonlocal contribution from transport by including prior NH3 columns from a full 3D simulation and using their difference from observed NH3 columns to correct prior emissions, which prevents the derivation of large NH3 emissions in remote regions where observed NH3 concentrations are mainly driven by transport. Our data-filtering strategy (Sect. 2.1 and 2.2) is also crucial to avoid spurious top-down results when satellite coverage is poor and the local mass balance assumption does not hold.
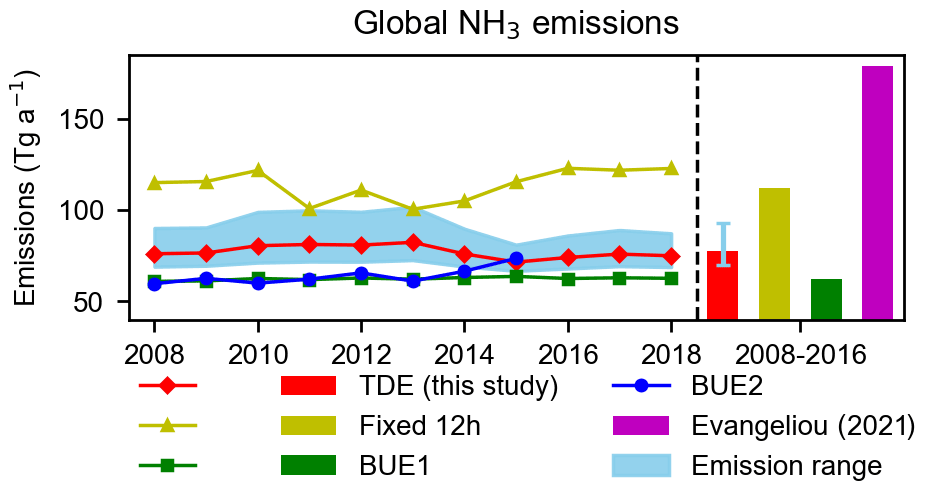
Figure 5Comparison of our top-down NH3 emission estimates (TDE) with other top-down (“Fixed 12 h” and “Evangeliou et al. (2021)”) and bottom-up (“BUE1” and “BUE2”) results during 2008–2018. The red line and red bar represent central estimates of the TDE, and the blue shaded area and the blue error bar indicate the uncertainty evaluated by our study (Sect. 2.4).

Figure 6Spatial distribution of the NH3 lifetime (h) diagnosed from GEOS-Chem (Eq. 2) within the 70∘ N–70∘ S band during 2008–2018.
Figure 6 shows the spatial variation in the NH3 lifetime diagnosed from the GEOS-Chem simulation. Short NH3 lifetimes (<10 h) are mainly found in northern high latitudes. The short lifetime in eastern China is due to the high wet NH deposition velocity, although some regional studies suggested an overestimation of deposition fluxes by the model, especially in forest areas (e.g., the Yangtze River Basin) (Zhao et al., 2017; Xu et al., 2018). A very long NH3 lifetime (>100 h) occurs over the Sahara and Australia, where dry conditions result in slow wet deposition.
3.5 Uncertainty evaluation
We derive the uncertainty of top-down estimates from the perturbation tests in Table 1. Figure 7 shows the global spatial distribution of annual average uncertainties of NH3 emissions derived from the ensemble of these perturbation tests. Absolute uncertainties are expressed as half of the ensemble ranges, and relative uncertainties are computed by normalizing absolute uncertainties by ensemble averages. We find that both absolute and relative uncertainties are large in Central Asia and tropical Africa, indicating that these source regions are not well constrained by observations. In comparison, observations have some constraints over important source regions of eastern China and northern India, which have small relative uncertainties (<20 %) but appreciable absolute uncertainties (>0.4 g a−1 m−2). Uncertainties are small (<20 % and/or <0.2 g a−1 m−2) in Europe and the US.
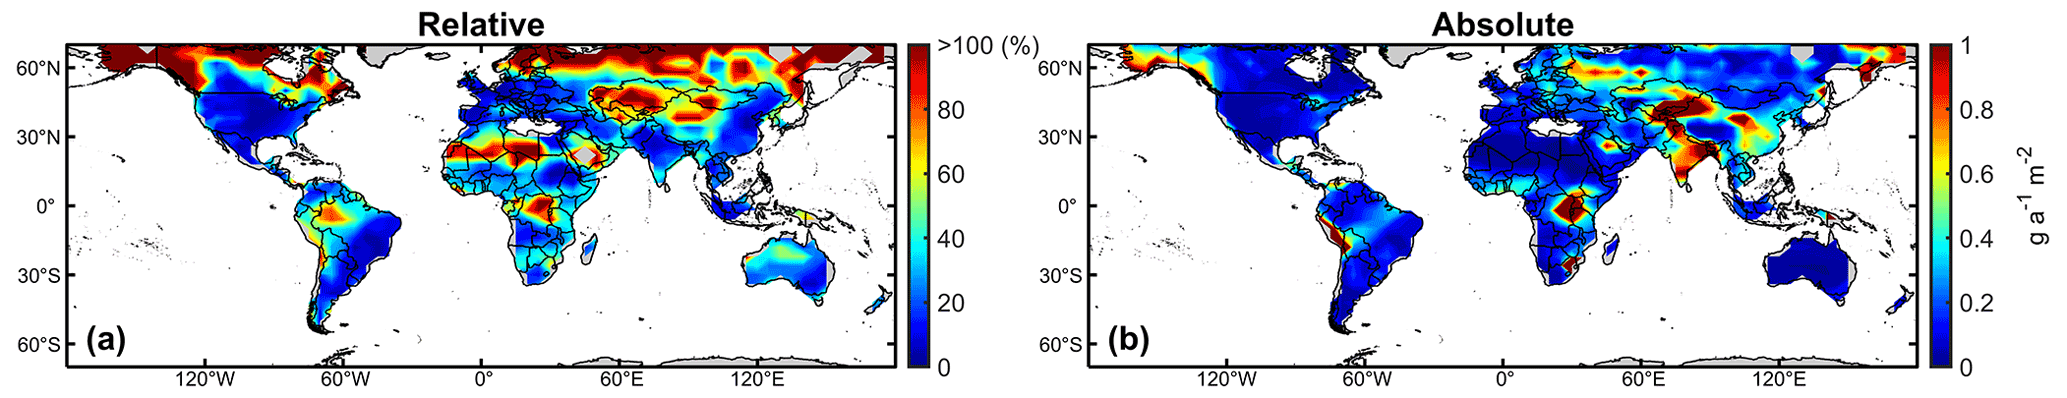
Figure 7Spatial distribution of TDE (a) relative and (b) absolute uncertainty during 2008–2018. Absolute uncertainties are derived as half of the perturbation ensemble range (Table 1), and relative uncertainties are computed by normalizing absolute uncertainties with ensemble averages.
Our fast top-down method (Eqs. 1, 3) relies on the simplification of NH3 chemical and physical processes. Therefore, it is not guaranteed that a simulation driven by TDE will generate results that are in improved agreement with IASI observations. We evaluate the consistency of our results using full GEOS-Chem simulations in the selected years of 2008, 2013, and 2018. Results are shown in Fig. S5 (fractional bias, FB) and Table S1 (number of valid grid cells; R2; and root mean square error, RMSE). The GEOS-Chem simulations driven by the prior emissions (BUE1) tend to underestimate NH3 column density (mean FB %), whereas that driven by our TDE estimates achieves a lower bias (mean FB ∼10 %), demonstrating the consistency of our TDE results with IASI observations.
3.6 Comparison with independent surface networks
We also compare simulated surface NH3 concentrations with independent ground-based measurements, including (1) biweekly averaged NH3 concentrations in North America (AMoN, https://nadp.slh.wisc.edu/networks/ammonia-monitoring-network/, last access: 3 June 2022), (2) half-hourly/daily/weekly averaged NH3 concentrations in Europe (emep, http://ebas-data.nilu.no/, last access: 3 June 2022), and (3) monthly averaged NH3 concentrations in Southeast Asia (EANET, https://www.eanet.asia/, last access: 3 June 2022). AMoN measures NH3 concentrations using passive devices (simple diffusion-type simpler), whereas emep and EANET use both active and passive sampler systems among different sites (multi-type samplers). For comparison, we convert the observed NH3 concentrations in micrograms per cubic meter (µg m−3) to parts per billion by volume (ppbv) using a factor of 1.44 (assuming a 25 ∘C temperature and 1 atmosphere pressure) and average observations monthly over the GEOS-Chem 4∘ × 5∘ grid. Figure 8 shows the comparison by season. Only small adjustments are inferred by our satellite-based estimations in these regions (i.e., North America, Europe, and Southeast Asia). Thus, TDE and BUE1 show similar performance against these ground measurements. Although the simulation can capture the site-to-site variations reasonably well, simulated surface values are generally biased low compared with observations. This low bias is also reported in the evaluation of previous IASI-based estimates (e.g., Evangeliou et al., 2021; Chen et al., 2021a). Further investigations are needed to understand the reasons for this bias.
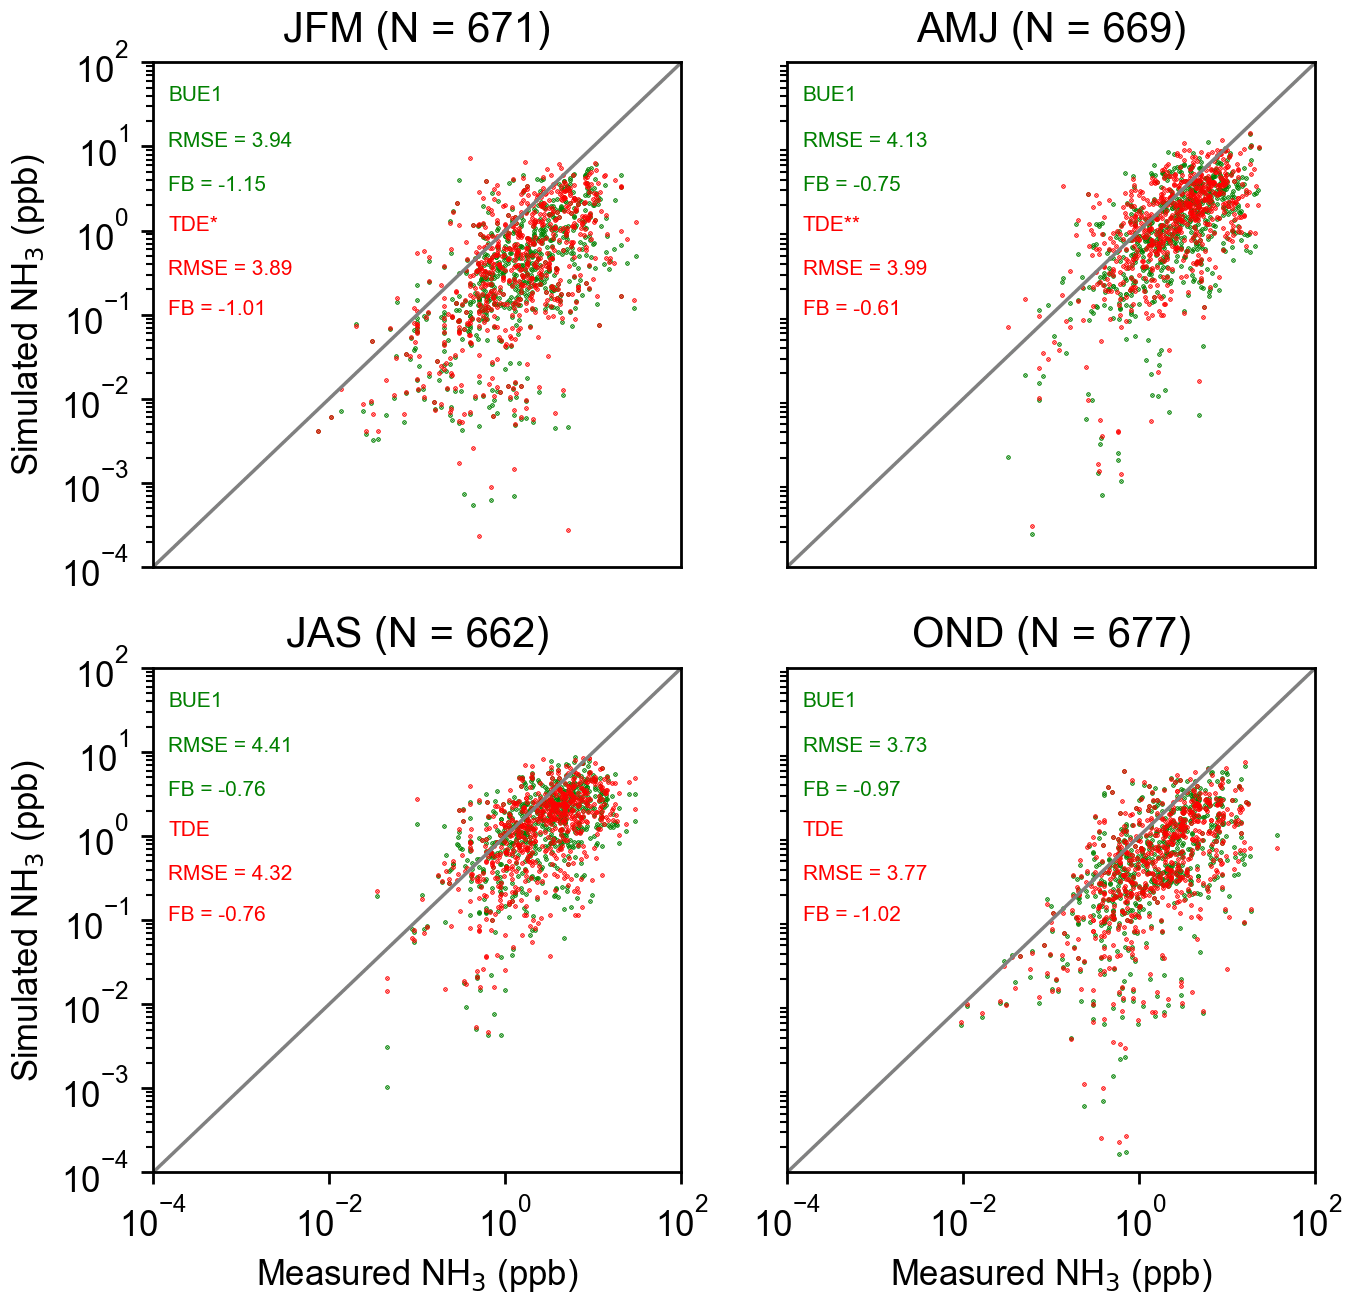
Figure 8Validation of simulated NH3 concentrations driven by BUE1 and TDE against ground-based measurements from AMoN, emep, and EANET for selected years (2008, 2013, and 2018) in four seasons (January–March, JFM; April–June, AMJ; July–September, JAS; and October–December, OND). Scatterplots are plotted using a log scale, and the average RMSE (ppb) and FB (%) for each season are inset. The asterisk symbols “*” and “**” represent that differences between BUE1 and TDE are significant at the 95 % and 99 % confidence levels, respectively.
This study quantifies global ammonia (NH3) fluxes monthly from 2008 to 2018 at a 4∘ × 5∘ resolution using a fast top-down method that incorporates IASI satellite observations and GEOS-Chem model simulations. The top-down method updates the prior NH3 emissions with a correction term that is positively proportional to the difference between the observed and simulated NH3 concentrations and that is inversely proportional to the lifetime diagnosed from a CTM. This method revises previously proposed fast top-down methods in two aspects. First, we account for thermodynamic equilibrium within the NHx family in diagnosing the NH3 lifetime, whereas previous studies have either assumed a globally constant lifetime or treated the conversion from NH3 to NH as a terminal sink. Second, our formulation linearizes the column–emission relationship at prior emissions as opposed to zero emissions, as done in the previous method, which generally reduces errors from the local mass balance approximation. Another improvement is that we apply several data-filtering procedures to exclude unreliable top-down results that are not sufficiently constrained by observations or affected by large deviations from the local mass balance assumption. The top-down method developed in this study is particularly useful for the long-term global analysis of emission trends, as it largely accounts for the impact of meteorology through the CTM simulation and requires only small amount of computation relative to a full-fledged inversion.
We apply this improved fast top-down method to IASI NH3 column observations from 2008 to 2018. We find that the BUE1 underestimates NH3 emission over South America (62 %) and tropical Africa (69 %) but results in overestimates over India (14 %) and Canada (33 %). The bottom-up inventory agrees with the top-down estimate over the US, Europe, and eastern China (i.e., within 10 %). Our analysis also shows significant increases in India (13 % per decade), tropical Africa (33 % per decade), and South America (18 % per decade) during the study period, which is consistent with intensifying agricultural activity over these regions. An analysis of agricultural statistics suggests that the increase in tropical Africa is likely driven by a growing livestock population, whereas the increase in South America is likely driven by increasing fertilizer usage.
We show that large increases in NH3 concentrations in eastern China are mainly driven by rapid decreases in SO2 emissions in recent years. By accounting for observed SO2 columns, we find that NH3 emissions from eastern China are significantly decreasing during 2008–2018 (−19 % per decade), with a larger negative trend after 2013 (−28 % per decade), compared with a significant positive trend (61 % per decade) derived from assimilating only NH3 data. Similarly, a lack of trend in observed NH3 concentrations over India is due to concurrent increases in SO2 and NH3 emissions. After including observed SO2 columns in the calculation, we estimate a 13 % increase in NH3 emissions over India, with a significant post-2013 positive trend (30 % per decade). These results from assimilating both NH3 and SO2 data are more consistent with the agricultural statistics in China and India. The multi-satellite (SO2 and NH3) method is only applied in India and China in this study. The extension of this idea globally requires the development of formulations for varied sulfate–nitrate–ammonium aerosol regimes and needs to be addressed in a future study.
Our estimate of global total NH3 emission is 78 (70–92) Tg a−1, about 30 % higher than the BUE1 estimate. This contrasts with a much higher estimate (180 Tg a−1) derived from Evangeliou et al. (2021), also using IASI data. This discrepancy can be primarily attributed to the longer NH3 lifetime (i.e., global average of 21 h) diagnosed in our method, which represents a greater sensitivity of NH3 column to emissions, and the more conservative data-filtering strategy, which removes potentially unreliable top-down results. Our diagnosis of the NH3 lifetime is an improvement over Evangeliou et al. (2021), as our formula accounts for the thermodynamic equilibrium between gas-phase NH3 and aerosol-phase NH. Using model simulations, we show that our top-down estimate achieves better consistency with IASI observations, compared with the bottom-up emission inventory.
The IASI L2 ammonia satellite observations are available from the AERIS data infrastructure (https://doi.org/10.25326/10, Clarisse and Coheur, 2022). The ERA5 skin temperature and GFAS fire emission can be requested from the Copernicus Climate Data Store (https://doi.org/10.24381/cds.e2161bac, Muñoz Sabater, 2019). Agricultural data are available from the Food and Agriculture Organization (FAO) of the United Nations (https://www.fao.org/faostat/en/#data, FAO, 2022). The GEOS-Chem model can be retrieved from https://doi.org/10.5281/zenodo.3974569 (The International GEOS-Chem User Community, 2020). All of the other data and scripts used for the present publication are available under MIT license from GitHub: https://github.com/bnulzq/NH3-emission.git (last access: 5 August 2022) (DOI: https://doi.org/10.5281/zenodo.6969734, Luo and Zhang, 2022).
The supplement related to this article is available online at: https://doi.org/10.5194/acp-22-10375-2022-supplement.
ZL and YZ designed the study. ZL performed the simulations and analyses and wrote and coordinated the paper. WC contributed to the model simulations for consistency evaluation. LC, MvD, and PFC developed the IASI NH3 satellite product. ZL and YZ wrote the paper with inputs from all co-authors.
The contact author has declared that none of the authors has any competing interests.
Neither the European Commission nor ECMWF is responsible
for any use that may be made of the Copernicus information or data it
contains.
Publisher's note: Copernicus Publications remains neutral with regard to jurisdictional claims in published maps and institutional affiliations.
We thank the High-Performance Computing Center of Westlake University for the facility support and technical assistance. We acknowledge the AERIS data infrastructure (https://doi.org/10.25326/10) for providing access to the IASI data. The IASI L1c data are received through the EUMETCast near-real-time data distribution service. Research at ULB was supported by the Belgian State Federal Office for Scientific, Technical and Cultural Affairs (Prodex HIRS) and the Air Liquide Foundation (TAPIR project). Hersbach et al. (2020) was downloaded from the Copernicus Climate Change Service (C3S) Climate Data Store. The results contain modified Copernicus Climate Change Service information 2020. IASI is a joint mission of EUMETSAT and the “Centre National d'Études Spatiales” (CNES, France). We acknowledge the constructive comments and suggestions from Peter Hess (Cornell University), Yi Wang (University of Iowa), and Shixian Zhai (Harvard University). We also acknowledge Nikolaos Evangeliou (Norwegian Institute for Air Research) for providing his NH3 emission flux data and for discussions with Zhenqi Luo.
This research has been supported by Westlake University and the Belgian F.R.S.-FNRS.
This paper was edited by Patrick Jöckel and reviewed by two anonymous referees.
Acharja, P., Ali, K., Ghude, S. D., Sinha, V., Sinha, B., Kulkarni, R., Gultepe, I., and Rajeevan, M. N.: Enhanced secondary aerosol formation driven by excess ammonia during fog episodes in Delhi, India, Chemosphere, 289, 133155, https://doi.org/10.1016/j.chemosphere.2021.133155, 2022.
Amos, H. M., Jacob, D. J., Holmes, C. D., Fisher, J. A., Wang, Q., Yantosca, R. M., Corbitt, E. S., Galarneau, E., Rutter, A. P., Gustin, M. S., Steffen, A., Schauer, J. J., Graydon, J. A., Louis, V. L. St., Talbot, R. W., Edgerton, E. S., Zhang, Y., and Sunderland, E. M.: Gas-particle partitioning of atmospheric Hg(II) and its effect on global mercury deposition, Atmos. Chem. Phys., 12, 591–603, https://doi.org/10.5194/acp-12-591-2012, 2012.
Behera, S. N., Sharma, M., Aneja, V. P., and Balasubramanian, R.: Ammonia in the atmosphere: a review on emission sources, atmospheric chemistry and deposition on terrestrial bodies, Environ. Sci. Pollut. Res. Int., 20, 8092–8131, https://doi.org/10.1007/s11356-013-2051-9, 2013.
Bey, I., Jacob, D. J., Yantosca, R. M., Logan, J. A., Field, B. D., Fiore, A. M., Li, Q., Liu, H. Y., Mickley, L. J., and Schultz, M. G.: Global modeling of tropospheric chemistry with assimilated meteorology: Model description and evaluation, J. Geophys. Res.-Atmos., 106, 23073–23095, https://doi.org/10.1029/2001jd000807, 2001.
Bouwman, A. F., Lee, D. S., Asman, W. A. H., Dentener, F. J., Van Der Hoek, K. W., and Olivier, J. G. J.: A global high-resolution emission inventory for ammonia, Global Biogeochem. Cycles, 11, 561–587, https://doi.org/10.1029/97gb02266, 1997.
Cao, H., Henze, D. K., Shephard, M. W., Dammers, E., Cady-Pereira, K., Alvarado, M., Lonsdale, C., Luo, G., Yu, F., Zhu, L., Danielson, C. G., and Edgerton, E. S.: Inverse modeling of NH3 sources using CrIS remote sensing measurements, Environ. Res. Lett., 15, 104082, https://doi.org/10.1088/1748-9326/abb5cc, 2020.
Chen, Y., Morton, D. C., Jin, Y., Collatz, G. J., Kasibhatla, P. S., van der Werf, G. R., DeFries, R. S., and Randerson, J. T.: Long-term trends and interannual variability of forest, savanna and agricultural fires in South America, Carbon Manage., 4, 617–638, https://doi.org/10.4155/cmt.13.61, 2014.
Chen, Y., Shen, H., Kaiser, J., Hu, Y., Capps, S. L., Zhao, S., Hakami, A., Shih, J.-S., Pavur, G. K., Turner, M. D., Henze, D. K., Resler, J., Nenes, A., Napelenok, S. L., Bash, J. O., Fahey, K. M., Carmichael, G. R., Chai, T., Clarisse, L., Coheur, P.-F., Van Damme, M., and Russell, A. G.: High-resolution hybrid inversion of IASI ammonia columns to constrain US ammonia emissions using the CMAQ adjoint model, Atmos. Chem. Phys., 21, 2067–2082, https://doi.org/10.5194/acp-21-2067-2021, 2021a.
Chen, Y., Zhang, L., Henze, D. K., Zhao, Y., Lu, X., Winiwarter, W., Guo, Y., Liu, X., Wen, Z., Pan, Y., and Song, Y.: Interannual variation of reactive nitrogen emissions and their impacts on PM2.5 air pollution in China during 2005–2015, Environ. Res. Lett., 16, 125004, https://doi.org/10.1088/1748-9326/ac3695, 2021b.
Clarisse, L. and Coheur, P.: Near-real time daily IASI/Metop-A ULB-LATMOS ammonia (NH3) L2 product (total column), Aeris [data set], https://doi.org/10.25326/10, 2022.
Clarisse, L., Clerbaux, C., Dentener, F., Hurtmans, D., and Coheur, P.-F.: Global ammonia distribution derived from infrared satellite observations, Nat. Geosci., 2, 479–483, https://doi.org/10.1038/ngeo551, 2009.
Clarisse, L., Van Damme, M., Gardner, W., Coheur, P.-F., Clerbaux, C., Whitburn, S., Hadji-Lazaro, J., and Hurtmans, D.: Atmospheric ammonia (NH3) emanations from Lake Natron's saline mudflats, Sci. Rep.-UK, 9, 1–12, 2019.
Clerbaux, C., Boynard, A., Clarisse, L., George, M., Hadji-Lazaro, J., Herbin, H., Hurtmans, D., Pommier, M., Razavi, A., Turquety, S., Wespes, C., and Coheur, P.-F.: Monitoring of atmospheric composition using the thermal infrared IASI/MetOp sounder, Atmos. Chem. Phys., 9, 6041–6054, https://doi.org/10.5194/acp-9-6041-2009, 2009.
Crippa, M., Solazzo, E., Huang, G., Guizzardi, D., Koffi, E., Muntean, M., Schieberle, C., Friedrich, R., and Janssens-Maenhout, G.: High resolution temporal profiles in the Emissions Database for Global Atmospheric Research, Sci. Data, 7, 121, https://doi.org/10.1038/s41597-020-0462-2, 2020.
Dirnböck, T., Grandin, U., Bernhardt-Romermann, M., Beudert, B., Canullo, R., Forsius, M., Grabner, M. T., Holmberg, M., Kleemola, S., Lundin, L., Mirtl, M., Neumann, M., Pompei, E., Salemaa, M., Starlinger, F., Staszewski, T., and Uzieblo, A. K.: Forest floor vegetation response to nitrogen deposition in Europe, Glob. Chang Biol., 20, 429–440, https://doi.org/10.1111/gcb.12440, 2014.
Erisman, J. W. J. S.: How ammonia feeds and pollutes the world, Science, 374, 685–686, 2021.
Evangeliou, N., Balkanski, Y., Eckhardt, S., Cozic, A., Van Damme, M., Coheur, P.-F., Clarisse, L., Shephard, M. W., Cady-Pereira, K. E., and Hauglustaine, D.: 10-year satellite-constrained fluxes of ammonia improve performance of chemistry transport models, Atmos. Chem. Phys., 21, 4431–4451, https://doi.org/10.5194/acp-21-4431-2021, 2021.
FAO: [Manure Management] and [Synthetic Fertilizers], Food and Agriculture Organization of the United Nations, FAOSTAT statistical database [data set], https://www.fao.org/faostat/en/#data, last access: 5 August 2022.
Fountoukis, C. and Nenes, A.: ISORROPIA II: a computationally efficient thermodynamic equilibrium model for K+–Ca2+–Mg2+–NH–Na+–SO–NO–Cl−–H2O aerosols, Atmos. Chem. Phys., 7, 4639–4659, https://doi.org/10.5194/acp-7-4639-2007, 2007.
Franco, B., Clarisse, L., Stavrakou, T., Müller, J. F., Van Damme, M., Whitburn, S., Hadji-Lazaro, J., Hurtmans, D., Taraborrelli, D., Clerbaux, C., and Coheur, P. F.: A General Framework for Global Retrievals of Trace Gases From IASI: Application to Methanol, Formic Acid, and PAN, J. Geophys. Res.-Atmos., 123, 13963–13984, https://doi.org/10.1029/2018jd029633, 2018.
Fu, X., Wang, S., Xing, J., Zhang, X., Wang, T., and Hao, J.: Increasing Ammonia Concentrations Reduce the Effectiveness of Particle Pollution Control Achieved via SO2 and NOx Emissions Reduction in East China, Environ. Sci. Technol. Lett., 4, 221–227, https://doi.org/10.1021/acs.estlett.7b00143, 2017.
Gelaro, R., McCarty, W., Suarez, M. J., Todling, R., Molod, A., Takacs, L., Randles, C., Darmenov, A., Bosilovich, M. G., Reichle, R., Wargan, K., Coy, L., Cullather, R., Draper, C., Akella, S., Buchard, V., Conaty, A., da Silva, A., Gu, W., Kim, G. K., Koster, R., Lucchesi, R., Merkova, D., Nielsen, J. E., Partyka, G., Pawson, S., Putman, W., Rienecker, M., Schubert, S. D., Sienkiewicz, M., and Zhao, B.: The Modern-Era Retrospective Analysis for Research and Applications, Version 2 (MERRA-2), J. Climate, 30, 5419–5454, https://doi.org/10.1175/JCLI-D-16-0758.1, 2017.
Gu, B., Zhang, L., Van Dingenen, R., Vieno, M., Van Grinsven, H. J., Zhang, X., Zhang, S., Chen, Y., Wang, S., and Ren, C. J. S.: Abating ammonia is more cost-effective than nitrogen oxides for mitigating PM2.5 air pollution, Science, 374, 758–762, 2021.
Guenther, A. B., Jiang, X., Heald, C. L., Sakulyanontvittaya, T., Duhl, T., Emmons, L. K., and Wang, X.: The Model of Emissions of Gases and Aerosols from Nature version 2.1 (MEGAN2.1): an extended and updated framework for modeling biogenic emissions, Geosci. Model Dev., 5, 1471–1492, https://doi.org/10.5194/gmd-5-1471-2012, 2012.
Guo, X., Wang, R., Pan, D., Zondlo, M. A., Clarisse, L., Van Damme, M., Whitburn, S., Coheur, P. F., Clerbaux, C., Franco, B., Golston, L. M., Wendt, L., Sun, K., Tao, L., Miller, D., Mikoviny, T., Müller, M., Wisthaler, A., Tevlin, A. G., Murphy, J. G., Nowak, J. B., Roscioli, J. R., Volkamer, R., Kille, N., Neuman, J. A., Eilerman, S. J., Crawford, J. H., Yacovitch, T. I., Barrick, J. D., and Scarino, A. J.: Validation of IASI Satellite Ammonia Observations at the Pixel Scale Using In Situ Vertical Profiles, J. Geophys. Res.-Atmos., 126, e2020JD033475, https://doi.org/10.1029/2020jd033475, 2021.
Hersbach, H., Bell, B., Berrisford, P., Hirahara, S., Horányi, A., Muñoz-Sabater, J., Nicolas, J., Peubey, C., Radu, R., Schepers, D., Simmons, A., Soci, C., Abdalla, S., Abellan, X., Balsamo, G., Bechtold, P., Biavati, G., Bidlot, J., Bonavita, M., Chiara, G., Dahlgren, P., Dee, D., Diamantakis, M., Dragani, R., Flemming, J., Forbes, R., Fuentes, M., Geer, A., Haimberger, L., Healy, S., Hogan, R. J., Hólm, E., Janisková, M., Keeley, S., Laloyaux, P., Lopez, P., Lupu, C., Radnoti, G., Rosnay, P., Rozum, I., Vamborg, F., Villaume, S., and Thépaut, J. N.: The ERA5 global reanalysis, Q. J. Roy. Meteor. Soc., 146, 1999–2049, https://doi.org/10.1002/qj.3803, 2020.
Hickman, J. E., Andela, N., Dammers, E., Clarisse, L., Coheur, P.-F., Van Damme, M., Di Vittorio, C. A., Ossohou, M., Galy-Lacaux, C., Tsigaridis, K., and Bauer, S. E.: Changes in biomass burning, wetland extent, or agriculture drive atmospheric NH3 trends in select African regions, Atmos. Chem. Phys., 21, 16277–16291, https://doi.org/10.5194/acp-21-16277-2021, 2021.
Hoesly, R. M., Smith, S. J., Feng, L., Klimont, Z., Janssens-Maenhout, G., Pitkanen, T., Seibert, J. J., Vu, L., Andres, R. J., Bolt, R. M., Bond, T. C., Dawidowski, L., Kholod, N., Kurokawa, J.-I., Li, M., Liu, L., Lu, Z., Moura, M. C. P., O'Rourke, P. R., and Zhang, Q.: Historical (1750–2014) anthropogenic emissions of reactive gases and aerosols from the Community Emissions Data System (CEDS), Geosci. Model Dev., 11, 369–408, https://doi.org/10.5194/gmd-11-369-2018, 2018.
Höpfner, M., Ungermann, J., Borrmann, S., Wagner, R., Spang, R., Riese, M., Stiller, G., Appel, O., Batenburg, A. M., Bucci, S., Cairo, F., Dragoneas, A., Friedl-Vallon, F., Hünig, A., Johansson, S., Krasauskas, L., Legras, B., Leisner, T., Mahnke, C., Möhler, O., Molleker, S., Müller, R., Neubert, T., Orphal, J., Preusse, P., Rex, M., Saathoff, H., Stroh, F., Weigel, R., and Wohltmann, I.: Ammonium nitrate particles formed in upper troposphere from ground ammonia sources during Asian monsoons, Nat. Geosci., 12, 608–612, https://doi.org/10.1038/s41561-019-0385-8, 2019.
Keywood, M., Kanakidou, M., Stohl, A., Dentener, F., Grassi, G., Meyer, C. P., Torseth, K., Edwards, D., Thompson, A. M., Lohmann, U., and Burrows, J.: Fire in the Air: Biomass Burning Impacts in a Changing Climate, Crit. Rev. Environ. Sci. Technol., 43, 40–83, https://doi.org/10.1080/10643389.2011.604248, 2011.
Lachatre, M., Fortems-Cheiney, A., Foret, G., Siour, G., Dufour, G., Clarisse, L., Clerbaux, C., Coheur, P.-F., Van Damme, M., and Beekmann, M.: The unintended consequence of SO2 and NO2 regulations over China: increase of ammonia levels and impact on PM2.5 concentrations, Atmos. Chem. Phys., 19, 6701–6716, https://doi.org/10.5194/acp-19-6701-2019, 2019.
Li, M., Zhang, Q., Kurokawa, J.-I., Woo, J.-H., He, K., Lu, Z., Ohara, T., Song, Y., Streets, D. G., Carmichael, G. R., Cheng, Y., Hong, C., Huo, H., Jiang, X., Kang, S., Liu, F., Su, H., and Zheng, B.: MIX: a mosaic Asian anthropogenic emission inventory under the international collaboration framework of the MICS-Asia and HTAP, Atmos. Chem. Phys., 17, 935–963, https://doi.org/10.5194/acp-17-935-2017, 2017.
Liu, M., Huang, X., Song, Y., Xu, T., Wang, S., Wu, Z., Hu, M., Zhang, L., Zhang, Q., Pan, Y., Liu, X., and Zhu, T.: Rapid SO2 emission reductions significantly increase tropospheric ammonia concentrations over the North China Plain, Atmos. Chem. Phys., 18, 17933–17943, https://doi.org/10.5194/acp-18-17933-2018, 2018.
Liu, X., Zhang, Y., Han, W., Tang, A., Shen, J., Cui, Z., Vitousek, P., Erisman, J. W., Goulding, K., Christie, P., Fangmeier, A., and Zhang, F.: Enhanced nitrogen deposition over China, Nature, 494, 459–462, https://doi.org/10.1038/nature11917, 2013.
Luo, Z. and Zhang, Y.: Estimating global ammonia (NH3) emissions based on IASI observations from 2008 to 2018 (1.0.0), Zenodo [data set], https://doi.org/10.5281/zenodo.6969734, 2022.
Ma, R., Zou, J., Han, Z., Yu, K., Wu, S., Li, Z., Liu, S., Niu, S., Horwath, W. R., and Zhu-Barker, X.: Global soil-derived ammonia emissions from agricultural nitrogen fertilizer application: A refinement based on regional and crop-specific emission factors, Glob. Chang. Biol., 27, 855–867, https://doi.org/10.1111/gcb.15437, 2021.
Ma, X., Yu, F., and Luo, G.: Aerosol direct radiative forcing based on GEOS-Chem-APM and uncertainties, Atmos. Chem. Phys., 12, 5563–5581, https://doi.org/10.5194/acp-12-5563-2012, 2012.
Marais, E. A. and Wiedinmyer, C.: Air Quality Impact of Diffuse and Inefficient Combustion Emissions in Africa (DICE-Africa), Environ. Sci. Technol., 50, 10739–10745, https://doi.org/10.1021/acs.est.6b02602, 2016.
Marais, E. A., Pandey, A. K., Van Damme, M., Clarisse, L., Coheur, P. F., Shephard, M. W., Cady-Pereira, K. E., Misselbrook, T., Zhu, L., Luo, G., and Yu, F.: UK Ammonia Emissions Estimated With Satellite Observations and GEOS-Chem, J. Geophys. Res.-Atmos., 126, e2021JD035237, https://doi.org/10.1029/2021jd035237, 2021.
Muñoz Sabater, J.: ERA5-Land hourly data from 1981 to present, Copernicus Climate Change Service (C3S) Climate Data Store (CDS) [data set], https://doi.org/10.24381/cds.e2161bac, 2019.
Park, R. J., Jacob, D. J., Field, B. D., Yantosca, R. M., and Chin, M.: Natural and transboundary pollution influences on sulfate-nitrate-ammonium aerosols in the United States: Implications for policy, J. Geophys. Res., 109, D15204, https://doi.org/10.1029/2003jd004473, 2004.
Paulot, F., Jacob, D. J., Pinder, R. W., Bash, J. O., Travis, K., and Henze, D. K.: Ammonia emissions in the United States, European Union, and China derived by high-resolution inversion of ammonium wet deposition data: Interpretation with a new agricultural emissions inventory (MASAGE_NH3), J. Geophys. Res.-Atmos., 119, 4343–4364, https://doi.org/10.1002/2013jd021130, 2014.
Pavlovic, R., Chen, J., Anderson, K., Moran, M. D., Beaulieu, P. A., Davignon, D., and Cousineau, S.: The FireWork air quality forecast system with near-real-time biomass burning emissions: Recent developments and evaluation of performance for the 2015 North American wildfire season, J. Air Waste Manag. Assoc., 66, 819–841, https://doi.org/10.1080/10962247.2016.1158214, 2016.
Qu, Z., Henze, D. K., Li, C., Theys, N., Wang, Y., Wang, J., Wang, W., Han, J., Shim, C., Dickerson, R. R., and Ren, X.: SO2 Emission Estimates Using OMI SO2 Retrievals for 2005–2017, J. Geophys. Res. Atmos., 124, 8336–8359, https://doi.org/10.1029/2019JD030243, 2019.
Riddick, S., Ward, D., Hess, P., Mahowald, N., Massad, R., and Holland, E.: Estimate of changes in agricultural terrestrial nitrogen pathways and ammonia emissions from 1850 to present in the Community Earth System Model, Biogeosciences, 13, 3397–3426, https://doi.org/10.5194/bg-13-3397-2016, 2016.
Stevens, C. J., Dupre, C., Dorland, E., Gaudnik, C., Gowing, D. J., Bleeker, A., Diekmann, M., Alard, D., Bobbink, R., Fowler, D., Corcket, E., Mountford, J. O., Vandvik, V., Aarrestad, P. A., Muller, S., and Dise, N. B.: Nitrogen deposition threatens species richness of grasslands across Europe, Environ. Pollut., 158, 2940–2945, https://doi.org/10.1016/j.envpol.2010.06.006, 2010.
Sun, W., Shao, M., Granier, C., Liu, Y., Ye, C. S., and Zheng, J. Y.: Long-Term Trends of Anthropogenic SO2, NOx, CO, and NMVOCs Emissions in China, Earth's Future, 6, 1112–1133, https://doi.org/10.1029/2018ef000822, 2018.
Sutton, M. A., Reis, S., Riddick, S. N., Dragosits, U., Nemitz, E., Theobald, M. R., Tang, Y. S., Braban, C. F., Vieno, M., Dore, A. J., Mitchell, R. F., Wanless, S., Daunt, F., Fowler, D., Blackall, T. D., Milford, C., Flechard, C. R., Loubet, B., Massad, R., Cellier, P., Personne, E., Coheur, P. F., Clarisse, L., Van Damme, M., Ngadi, Y., Clerbaux, C., Skjoth, C. A., Geels, C., Hertel, O., Wichink Kruit, R. J., Pinder, R. W., Bash, J. O., Walker, J. T., Simpson, D., Horvath, L., Misselbrook, T. H., Bleeker, A., Dentener, F., and de Vries, W.: Towards a climate-dependent paradigm of ammonia emission and deposition, Philos. T. R. Soc. Lond. B, 368, 20130166, https://doi.org/10.1098/rstb.2013.0166, 2013.
The International GEOS-Chem User Community: geoschem/geos-chem: GEOS-Chem 12.9.3 (12.9.3), Zenodo [code], https://doi.org/10.5281/zenodo.3974569, 2020.
Van Damme, M., Clarisse, L., Heald, C. L., Hurtmans, D., Ngadi, Y., Clerbaux, C., Dolman, A. J., Erisman, J. W., and Coheur, P. F.: Global distributions, time series and error characterization of atmospheric ammonia (NH3) from IASI satellite observations, Atmos. Chem. Phys., 14, 2905–2922, https://doi.org/10.5194/acp-14-2905-2014, 2014.
Van Damme, M., Whitburn, S., Clarisse, L., Clerbaux, C., Hurtmans, D., and Coheur, P.-F.: Version 2 of the IASI NH3 neural network retrieval algorithm: near-real-time and reanalysed datasets, Atmos. Meas. Tech., 10, 4905–4914, https://doi.org/10.5194/amt-10-4905-2017, 2017.
Van Damme, M., Clarisse, L., Whitburn, S., Hadji-Lazaro, J., Hurtmans, D., Clerbaux, C., and Coheur, P. F.: Industrial and agricultural ammonia point sources exposed, Nature, 564, 99–103, https://doi.org/10.1038/s41586-018-0747-1, 2018.
Van Damme, M., Clarisse, L., Franco, B., Sutton, M. A., Erisman, J. W., Wichink Kruit, R., van Zanten, M., Whitburn, S., Hadji-Lazaro, J., Hurtmans, D., Clerbaux, C., and Coheur, P.-F.: Global, regional and national trends of atmospheric ammonia derived from a decadal (2008–2018) satellite record, Environ. Res. Lett., 16, 055017, https://doi.org/10.1088/1748-9326/abd5e0, 2021.
van der Graaf, S., Dammers, E., Segers, A., Kranenburg, R., Schaap, M., Shephard, M. W., and Erisman, J. W.: Data assimilation of CrIS NH3 satellite observations for improving spatiotemporal NH3 distributions in LOTOS-EUROS, Atmos. Chem. Phys., 22, 951–972, https://doi.org/10.5194/acp-22-951-2022, 2022.
van der Werf, G. R., Randerson, J. T., Giglio, L., van Leeuwen, T. T., Chen, Y., Rogers, B. M., Mu, M., van Marle, M. J. E., Morton, D. C., Collatz, G. J., Yokelson, R. J., and Kasibhatla, P. S.: Global fire emissions estimates during 1997–2016, Earth Syst. Sci. Data, 9, 697–720, https://doi.org/10.5194/essd-9-697-2017, 2017.
Vira, J., Hess, P., Ossohou, M., and Galy-Lacaux, C.: Evaluation of interactive and prescribed agricultural ammonia emissions for simulating atmospheric composition in CAM-chem, Atmos. Chem. Phys., 22, 1883–1904, https://doi.org/10.5194/acp-22-1883-2022, 2022.
Wang, Q., Jacob, D. J., Fisher, J. A., Mao, J., Leibensperger, E. M., Carouge, C. C., Le Sager, P., Kondo, Y., Jimenez, J. L., Cubison, M. J., and Doherty, S. J.: Sources of carbonaceous aerosols and deposited black carbon in the Arctic in winter-spring: implications for radiative forcing, Atmos. Chem. Phys., 11, 12453–12473, https://doi.org/10.5194/acp-11-12453-2011, 2011.
Wang, Y. and Wang, J.: Tropospheric SO2 and NO2 in 2012–2018: Contrasting views of two sensors (OMI and OMPS) from space, Atmos. Environ., 223, 117214, https://doi.org/10.1016/j.atmosenv.2019.117214, 2020.
Warner, J. X., Dickerson, R. R., Wei, Z., Strow, L. L., Wang, Y., and Liang, Q.: Increased atmospheric ammonia over the world's major agricultural areas detected from space, Geophys. Res. Lett., 44, 2875–2884, https://doi.org/10.1002/2016GL072305, 2017.
Wesely, M.: Parameterization of surface resistances to gaseous dry deposition in regional-scale numerical models?, Atmos. Environ., 41, 52–63, https://doi.org/10.1016/j.atmosenv.2007.10.058, 2007.
Whitburn, S., Van Damme, M., Clarisse, L., Bauduin, S., Heald, C. L., Hadji-Lazaro, J., Hurtmans, D., Zondlo, M. A., Clerbaux, C., and Coheur, P. F.: A flexible and robust neural network IASI-NH3retrieval algorithm, J. Geophys. Res.-Atmos., 121, 6581–6599, https://doi.org/10.1002/2016jd024828, 2016.
Xu, W., Zhao, Y., Liu, X., Dore, A. J., Zhang, L., Liu, L., and Cheng, M.: Atmospheric nitrogen deposition in the Yangtze River basin: Spatial pattern and source attribution, Environ. Pollut., 232, 546–555, https://doi.org/10.1016/j.envpol.2017.09.086, 2018.
Zhai, S., Jacob, D. J., Wang, X., Liu, Z., Wen, T., Shah, V., Li, K., Moch, J. M., Bates, K. H., Song, S., Shen, L., Zhang, Y., Luo, G., Yu, F., Sun, Y., Wang, L., Qi, M., Tao, J., Gui, K., Xu, H., Zhang, Q., Zhao, T., Wang, Y., Lee, H. C., Choi, H., and Liao, H.: Control of particulate nitrate air pollution in China, Nat. Geosci., 14, 389–395, https://doi.org/10.1038/s41561-021-00726-z, 2021.
Zhang, L., Chen, Y., Zhao, Y., Henze, D. K., Zhu, L., Song, Y., Paulot, F., Liu, X., Pan, Y., Lin, Y., and Huang, B.: Agricultural ammonia emissions in China: reconciling bottom-up and top-down estimates, Atmos. Chem. Phys., 18, 339–355, https://doi.org/10.5194/acp-18-339-2018, 2018.
Zhang, X., Wu, Y., Liu, X., Reis, S., Jin, J., Dragosits, U., Van Damme, M., Clarisse, L., Whitburn, S., Coheur, P. F., and Gu, B.: Ammonia Emissions May Be Substantially Underestimated in China, Environ. Sci. Technol., 51, 12089–12096, https://doi.org/10.1021/acs.est.7b02171, 2017.
Zhao, Y., Duan, L., Xing, J., Larssen, T., Nielsen, C. P., and Hao, J. M.: Soil acidification in China: Is controlling SO2 emissions enough?, Environ. Sci. Technol., 43, 8021–8026, https://doi.org/10.1021/es901430n, 2009.
Zhao, Y., Zhang, L., Chen, Y., Liu, X., Xu, W., Pan, Y., and Duan, L.: Atmospheric nitrogen deposition to China: A model analysis on nitrogen budget and critical load exceedance, Atmos. Environ., 153, 32–40, https://doi.org/10.1016/j.atmosenv.2017.01.018, 2017.