the Creative Commons Attribution 4.0 License.
the Creative Commons Attribution 4.0 License.
 | 11 Aug 2022
Measurement report: Size-resolved chemical characterisation of aerosols in low-income urban settlements in South Africa
Constance K. Segakweng
Pieter G. van Zyl
Cathy Liousse
Johan P. Beukes
Jan-Stefan Swartz
Eric Gardrat
Maria Dias-Alves
Brigitte Language
Roelof P. Burger
Stuart J. Piketh
Naturally and anthropogenically emitted aerosols, which are determined by their physical and chemical properties, have an impact on both air quality and the radiative properties of the earth. An important source of atmospheric particulate matter (PM) in South Africa is household combustion for space heating and cooking, which predominantly occurs in low-income urban settlements. The aim of this study was to conduct a detailed size-resolved assessment of chemical characteristics of aerosols associated with household combustion through the collection of particulates in low-income urban settlements in South Africa to quantify the extent of the impacts of atmospheric pollution. Outdoor (ambient) and indoor aerosols in different size fractions were collected during summer and winter in four low-income urban settlements located in the north-eastern interior on the South African Highveld, i.e. Kwadela, Kwazamokuhle, Zamdela, and Jouberton. Mass concentration and chemical composition was determined for three size fractions, namely, PM1, PM2.5, and PM2.5−10. The highest concentrations of particulates were measured indoors with the highest mass concentration determined in the indoor PM2.5−10 (coarse) size fraction. However, the highest mass concentrations were determined in PM1 in all outdoor aerosol samples collected during winter and summer, and in indoor samples collected during summer.
Significantly higher concentrations were determined for SO in outdoor and indoor particulates compared to other ionic species, with NH and NO being the second most abundant. SO and NH almost exclusively occurred in the PM1 size fraction, while NO was the major constituent in the larger size fractions. The highest SO levels were recorded for the winter and summer outdoor campaigns conducted at Zamdela, while NO and NH concentrations were higher during the winter outdoor campaign. The combined concentrations of trace elements were higher for indoor particulates compared to outdoor aerosols, while the total trace element concentrations in PM1 were substantially higher than levels thereof in the two larger size fractions of particulates collected during all sampling campaigns.
No distinct seasonal trend was observed for the concentrations of trace elements. Na, Ca, and Cr had the highest concentrations in particulates collected during outdoor and indoor sampling campaigns. Ni concentrations in outdoor and indoor aerosols exceeded the annual average European standard. PM1 collected during all sampling campaigns in low-income urban settlements had the highest organic carbon (OC) and elemental carbon (EC) concentrations. The highest OC and EC levels were determined in PM1 collected during the winter indoor campaign. OC and EC concentrations were highest during winter, which can be attributed to changes in meteorological patterns and increased household combustion during winter. Low ratios determined for particulates collected in low-income urban settlements are indicative of OC and EC being mainly associated with local sources of these species. OC concentrations determined in this study were an order of magnitude lower than OC concentrations determined for ambient aerosols collected in the north-eastern interior of South Africa, while similar EC levels were measured. According to estimated dust concentrations, it was indicated that dust is the major constituent in all size ranges of particulates collected in this study, while trace elements were the second most abundant. However, trace elements made the highest contribution to indoor PM1 and PM1−2.5 mass. Mass concentrations and chemical concentrations determined for aerosols collected in low-income settlements reflect the regional impacts of anthropogenic sources in the north-eastern interior of South Africa and the influence of local sources.
- Article
(1626 KB) - Full-text XML
- BibTeX
- EndNote


Atmospheric aerosols or particulate matter (PM) are either emitted into the atmosphere directly as primary aerosols by anthropogenic activities (e.g. incomplete combustion of fossil fuels, vehicular traffic, industrial processes, and household combustion) and natural (e.g. volcanic eruptions, sea salts, and wind-blown dust) sources, or form in the atmosphere as secondary aerosols (Pöschl, 2005). The environmental impacts of atmospheric aerosols are mainly related to climate change and air quality, which include direct and indirect effects on cooling/warming of the atmosphere and adverse influences on human health, especially related to respiratory diseases (Guinot et al., 2007).
The impacts of atmospheric PM on health and radiative forcing are determined by their physical (e.g. size, mass, optical density) and chemical properties. Larger particles can, for instance, be filtered in the nose and throat, while smaller particles can penetrate through the gas exchange sections of the lungs and affect other organs (Pope et al., 2002). In addition, the chemical composition of aerosols can influence radiative forcing, since lighter coloured aerosols (e.g. sulfate, SO) reflect incoming solar radiation causing net cooling of the atmosphere, while darker absorbing particulates (e.g. black carbon) contribute to warming of the atmosphere. PM is typically classified according to size fractions, which include course (aerodynamic diameter 2.5–10 µm, PM10−2.5), fine (aerodynamic diameter 1–2.5 µm, ≤ PM2.5−1), and ultrafine particulates (aerodynamic diameter <1 µm, PM1) (Venter et al., 2017; Pope and Dockery, 2006; Seinfeld and Pandis, 2006). Atmospheric aerosols comprise numerous organic and inorganic compounds, which also influence their physical characteristics. Many studies have been conducted to chemically characterise atmospheric aerosols from various sources in order to reduce uncertainties associated with their impacts (Sciare et al., 2005; Kulmala et al., 2011).
Inorganic species in PM include trace elements and inorganic ions, while organic species are generally categorised into organic and elemental carbon (OC and EC, respectively). The major inorganic ionic species generally considered include SO, nitrate (NO), ammonium (NH), sodium (Na+), potassium (K+), chloride (Cl−), calcium (Ca2+), magnesium (Mg2+), and fluoride (F−) (Venter et al., 2017; Ibrahim and Habbani, 2013; Pöschl, 2005). These inorganic ions in atmospheric PM have a significant influence on the acidity potential of the atmosphere, which will also have an impact on ecological systems through wet and dry deposition (Conradie et al., 2016). Atmospheric aerosols comprise various trace elements, which include sodium (Na), silicon (Si), magnesium (Mg), aluminium (Al), potassium (K), calcium (Ca), titanium (Ti), chromium (Cr), manganese (Mn), iron (Fe), arsenic (As), barium (Ba), cadmium (Cd), copper (Cu), nickel (Ni), zinc (Zn), vanadium (V), molybdenum (Mo), mercury (Hg), and lead (Pb) (Adgate et al., 2007; Pacyna, 1998). Atmospheric PM also comprises a large number of organic compounds (Goldstein and Galbally, 2007), which are generally reported as a collective due to the complexities associated with identifying individual organic compounds (Chiloane et al., 2017; Maritz et al., 2019; Booyens et al., 2015). A detailed chemical characterisation of atmospheric aerosols allows for chemical mass closure, which is an important tool in establishing major sources and impacts of these species, as well as chemical transformation processes involved in local, regional, and global scales (Guinot et al., 2007; Sciare et al., 2005).
South Africa has one of the largest industrialised economies in Africa with significant industrial, mining, and agricultural activities (Josipovic et al., 2019), while being regarded a significant source region of atmospheric pollutants (Venter et al., 2017). In addition, coal-fired power stations produce >90 % of the electricity in South Africa, while seasonal open biomass burning (wildfires) also has a large impact on air quality in this region (Vakkari et al., 2014). An important source of atmospheric pollutants in South Africa revealed through various studies is household combustion for space heating and cooking, predominantly occurring in low-income urban settlements (e.g. Venter et al., 2012; Chiloane et al., 2017; Maritz et al., 2019; Laban et al., 2018). Most households in these settlements use low-grade fuels, such as coal or wood to meet their energy demands (Adesina et al., 2020; Xulu et al., 2020). These practices contribute significantly to emissions of atmospheric pollutants on a local and regional scale, while serious health risks associated with indoor and outdoor exposure are posed for people within these communities (Language et al., 2016; Xulu et al., 2020). Several studies have shown that indoor air pollution often dominates human exposure in these settlements to atmospheric pollutants, since health effects are not only determined by air pollution levels, but also by the extent of exposure, i.e. the time spent within close proximity of polluted air (Bruce et al., 2000). In addition to household combustion, waste burning within these settlements also contributes to poor ambient air quality in these low-income communities (Language et al., 2016).
In this study, an assessment of the chemical characteristics of aerosol species in different size fractions, namely, (PM1, PM1−2.5, PM2.5−10) in low-income urban settlements in South Africa, is conducted. The concentrations of particulate inorganic ions, trace elements, and OC and EC were determined to better understand the importance of the sources contributing to the various chemical species in these settlements.
2.1 Site descriptions
Aerosol samples were collected at four low-income urban settlements located in the north-eastern interior on the South African Highveld, i.e. Kwadela (26.463200∘ S–29.663124∘ E), Kwazamokuhle (26.138252∘ S, 29.738953∘ E), Zamdela (26.8373100∘ S, 27.843500∘ E), and Jouberton (26.906231∘ S, 26.584010∘ E) as indicated in Fig. 1. This is the largest industrialised area in South Africa, with this region holding several pyrometallurgical industries, mines, coal dumps, two large petrochemical plants, and a cluster of coal-fired power stations (11 of 13 South African coal-fired power stations are located in this region) (Laban et al., 2018). In addition, this area is also influenced by large-scale seasonal open biomass burning (wildfires) during the dry season (Vakkari et al., 2014), while household combustion is also an important source of atmospheric pollutants in this relatively densely populated area (Chiloane et al., 2017; Laban et al., 2018). Measurements at Kwadela, Kwazamokuhle, and Zamdela were conducted within the framework of the air quality offset programme, a legal measure introduced by the South African government whereby industries receive leniency for complying with emission standards by reducing ambient pollution levels through interventions in low-income urban settlements (Langerman et al., 2018). Aerosols sampled at Jouberton were part of the Prospective Household cohort study of Influenza, Respiratory Syncytial virus and other respiratory pathogens community burden and Transmission dynamics in South Africa (PHIRST) (NICD, 2018).

Figure 1Map of South Africa indicating the location of the four low-income urban settlements and major large point sources within the north-eastern interior.
The South African Highveld is characterised by a distinct dry and wet season, with the dry season typically occurring from mid-May to mid-October which coincides with the South African winter from June to August. More pronounced inversion layers and increased anticyclonic recirculation of air masses during winter trap pollutants near the surface causing, in conjunction with reduced wet scavenging, pollution build-up over this region during this period (Tyson and Preston-Whyte, 2000). In addition, the winter months are also characterised by increased household combustion for space heating and cooking, while seasonal open biomass burning generally occurs in the period from August to October, typically peaking during spring in September (Laban et al., 2018). Furthermore, the removal rate of atmospheric pollutants associated with precipitation is also reduced during the dry season (Venter et al., 2018).
Kwadela is situated in the Mpumalanga Province, between the towns Ermelo and Bethal, approximately 180 km east-south-east of the Johannesburg–Pretoria conurbation (Fig. 1). In addition to being influenced by regional air pollution, this low-income settlement is also exposed to traffic emissions from the nearby (∼500 m) N17 national highway. Kwazamokuhle is located near the town Hendrina in the Mpumalanga Province, approximately 150 km east of the Johannesburg–Pretoria conurbation (Fig. 1). This low-income settlement is located within close proximity of three large coal-fired power stations, i.e. the Arnot, Komati, and Hendrina power stations, as indicated in Fig. 1. Zamdela is situated on the south banks of the Vaal River in close proximity to the town Sasolburg in the Free State Province, in the densely populated and highly industrialised Vaal Triangle region (Fig. 1). Sources within this region include a large petrochemical plant, a coal-fired power station, and a number of pyrometallurgical smelters (Conradie et al., 2016). Jouberton is a low-cost urban settlement near the town of Klerksdorp in the North West Province, as indicated in Fig. 1 (approximately 180 km south-west of the Johannesburg–Pretoria conurbation). The main anthropogenic activities in this region of South Africa are related to large mining industries and agriculture, while this area is also impacted by regional air pollution associated with the north-eastern interior, as indicated by several studies at the Welgegund atmospheric monitoring site approximately 80 km east of Klerksdorp (e.g. Booyens et al., 2014; Venter et al., 2017).
2.2 Sample collection
All aerosol samples in this study were collected using a set of three five-stage Sioutas Cascade Impactors (Josipovic et al., 2019), each connected to a pump and running in parallel at a flow rate of 9 L min−1. These impactors allowed for the collection of PM in the 2.5–10, 1.0–2.5, 0.50–1.0, 0.25–0.50, and <0.25 µm aerodynamic diameter size ranges. One impactor was equipped with Teflon filters for the determination of inorganic ions, water-soluble organic acids, and trace elements, the second impactor with quartz filters for OC and EC analysis, and the third impactor was loaded with Nuclepore filters for the health tests. The third was beyond the scope of this paper and is not discussed further. In each impactor, 25 mm filters and 37 mm back filters were used. Seventy-two h outdoor (ambient) aerosol samples were collected during two-week periods, while 24 h indoor PM samples were collected for a duration of seven days. These sampling times were chosen in order to collect sufficient amounts of PM for chemical analysis. Filters were placed in petri dishes after sampling, which were sealed and stored in a freezer until they were analysed. A five-decimal Mettler Toledo microbalance was used to weigh filters prior to and after sampling.
Outdoor aerosol samples collected during the three summer campaigns allowed for a spatial assessment of outdoor aerosol characteristics associated with low-income urban settlements located in the north-eastern interior of South Africa, while the one winter campaign at Zamdela was considered indicative of temporal variability associated with outdoor aerosols in these settlements. Indoor measurements conducted at Jouberton through a summer and winter campaign allowed for comparison between outdoor and indoor aerosol characteristics. In spite of the above-mentioned challenges associated with sampling in low-income settlements in South Africa, the results presented in this paper can be considered a good representation of the chemical composition of aerosols in these settlements.
At Kwadela, outdoor aerosol measurements were conducted at Kwadela Primary School from 30 March to 14 April 2015. Outdoor aerosol samples were collected inside the churchyard at Kwazamokuhle (the same site where compliance air quality monitoring is being conducted) from 23 February until 7 March 2016. Measurements at Zamdela were conducted at the Theha Setjhaba primary school. The summer sampling campaign at Zamdela was conducted from 9 to 23 March 2017, while the winter campaign occurred from 15 to 30 July 2016. The summer and winter indoor sampling campaigns at Jouberton were performed at three houses from 18 April to 19 May 2016 and 1 to 16 August 2016, respectively. Although these three houses were electrified, paraffin was also burned as an alternative source of energy. Sampling was only conducted at two of the three houses during the winter indoor campaign due to logistical restraints. In addition, instrument failure contributed to one of the Sioutas not being available for sampling during the winter sampling campaign at Jouberton. It was decided to use the two available Sioutas to collect PM samples for OC and EC analysis, as well as the health tests during this campaign. These summer sampling periods can be considered representative of summer since a recent study indicated that October to March can be classified as summer months in South Africa (Van der Walt and Fitchett, 2020).
In total, 134 aerosol samples were collected for this study, which included 43 outdoor samples at Kwadela (9), Kwazamokuhle (12), and Zamdela (24), while 91 indoor samples were collected at Jouberton.
2.3 Chemical analyses
2.3.1 Inorganic ions and water-soluble organic acids
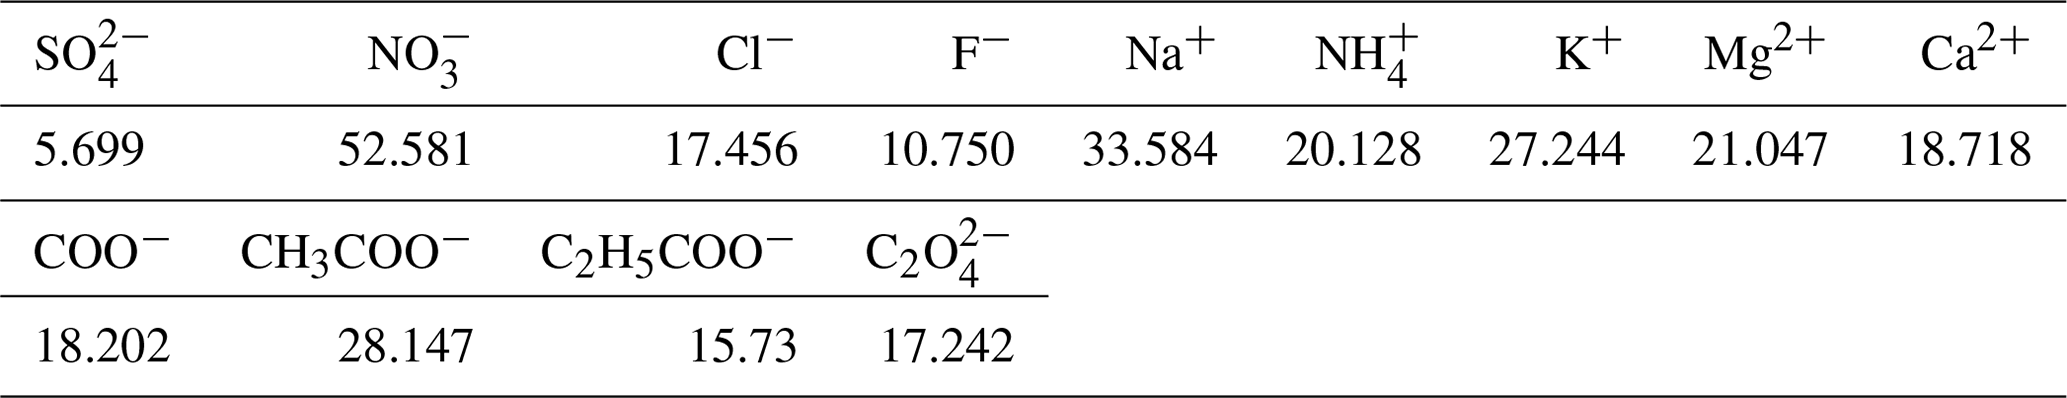
Similar to the method described by Van Zyl et al. (2014) and Venter et al. (2014, 2017), sampled Teflon filters were divided into two halves by a specially designed punch to allow for the analyses of trace elements, inorganic ions, and water-soluble organic acids. Inorganic ions and water-soluble organic acids in the collected PM samples were extracted with 5 or 10 mL (depending on sample load) deionised water (resistivity ≈18.2MΩ) in an ultrasonic bath for 30 min. The extracted aqueous samples were then analysed by suppressed conductivity with a Dionex ICS 3000 ion chromatograph (IC), with an IonPac AS18 (2 mm × 50 mm) analytical column, and an IonPac AG18 (2 mm × 50 mm) guard column. Inorganic ionic species determined include SO, NO, Cl−, F−, Na+, NH, K+, Mg2+, and Ca2+, while water-soluble organic acids (OA) include formic (COO−), acetic (CH3COO−), propionic (C2H5COO−), and oxalic acid (C2O). Standard stock solutions for each ionic species analysed were obtained from Industrial Analytical. The detection limits (DLs) of each of these species are presented in Table 1 below.
Table 1DLs (ppb) of inorganic ions and water-soluble organic acids determined in this study.
2.3.2 Trace elements
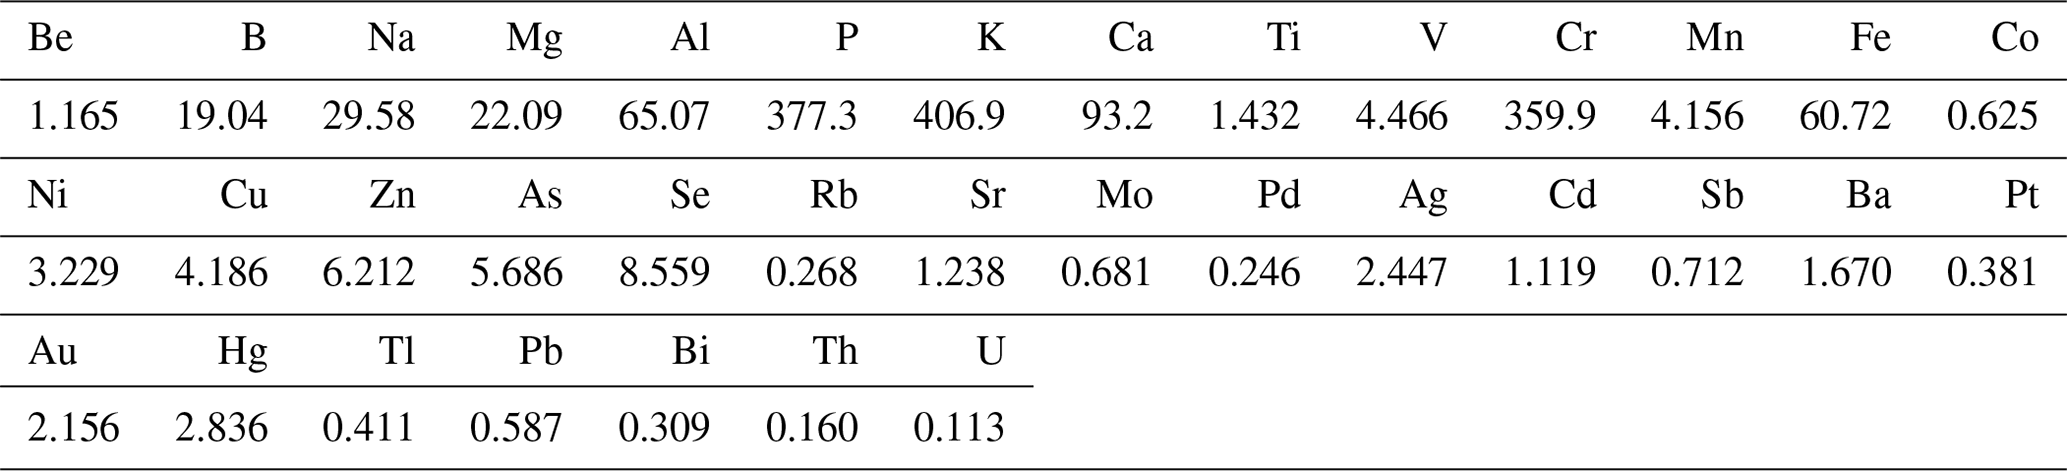
The other half of the sampled Teflon filter was subjected to hot acid leaching (Mouli et al., 2006), which entailed placing the filter in a 100 mL Erlenmeyer flask with 20 mL concentrated HNO3 and 40 mL deionised water. The mixture was boiled for 5 min and then refluxed for 3 h after the addition of 5 mL concentrated HCl. The extract was cooled and then diluted in 100 mL deionised water for subsequent analysis with an Agilent 7500c inductively coupled plasma mass spectrometer (ICP-MS). In total, 35 trace elements could be detected, which included Be, B, Na, Mg, Al, P, K, Ca, Ti, V, Cr, Mn, Fe, Cu, Co, Ni, Zn, As, Se, Rb, Sr, Mo, Pd, Ag, Cd, Sb, Ba, Pt, Au, Hg, Tl, Pb, Bi, Th, and U. Trace element concentrations below the DL of the ICP-MS (DLs listed in Table 2) were considered to have concentrations of half the detection limit of the species considered, which is a precautionary assumption that is commonly used in health-related environmental studies (e.g. Van Zyl et al., 2014). Be and Tl levels were below the detection limit of the analytical technique in all three size fractions for particulate samples collected during all sampling campaigns, while concentrations of Cd, Sb, Ba, Cu, As, Se, Rb, Sr, Mo, Pd, Ag, Pb, Au, Hg, Ti, Co, Pt, Bi, Th, and U were very low and below the detection limit in 75 % or more of the collected samples. Similar to inorganic ions and water-soluble OAs, trace element concentrations could also not be determined during the winter indoor campaign.
Table 2DLs (ppb × 10−2) of trace elements determined in this study.
2.3.3 Carbonaceous aerosol
OC and EC concentrations were determined from aerosols collected pre-fired on quartz filters with a two-step thermal procedure developed by Cachier et al. (1989) at the Laboratoire d'Aerologie. This procedure entailed halving the filters with one part of the filter heated in a pre-combustion oven under pure oxygen for 2 h at a relatively low temperature (340 ∘C) to drive off all OC, after which, the sample was oxidised in order to determine the EC content with a G4 ICARUS carbon analyser equipped with a non-dispersive infrared detector (NDIR). The other part of the filter was directly analysed for total carbon content with the carbon analyser (Adon et al., 2020). OC content could then be obtained from the difference between the measured total carbon (TC) and EC concentrations. The detection limit for the analysis was 2 µgC cm−2.
3.1 Mass concentration
The mass concentrations determined for the PM1, PM1−2.5, and PM2.5−10 size fractions and for PM10 (combination of mass concentrations of the three size fractions) at each site during the different sampling campaigns are presented in Fig. 2 (S denotes a summer campaign and W designates a winter campaign). It is evident from Fig. 2 that indoor PM2.5−10 samples collected during winter at Jouberton had the highest mean mass concentration (59.6 µg m−3), while the highest average PM10 mass concentration was also recorded during this sampling campaign (108.3 µg m−3). Moderately lower mean PM mass concentrations were determined during the summer indoor campaign in comparison to the winter indoor campaign. In general, PM mass concentrations were higher for indoor samples compared to aerosol mass concentrations determined for outdoor samples. The average PM mass concentrations determined for outdoor samples collected during winter at Zamdela were moderately lower than the mean aerosol mass concentration determined during the summer indoor campaign, and was higher (with higher mean mass concentrations in each size fraction) than the average PM mass concentrations measured during the three summer outdoor campaigns for which similar mean aerosol mass concentrations were recorded.
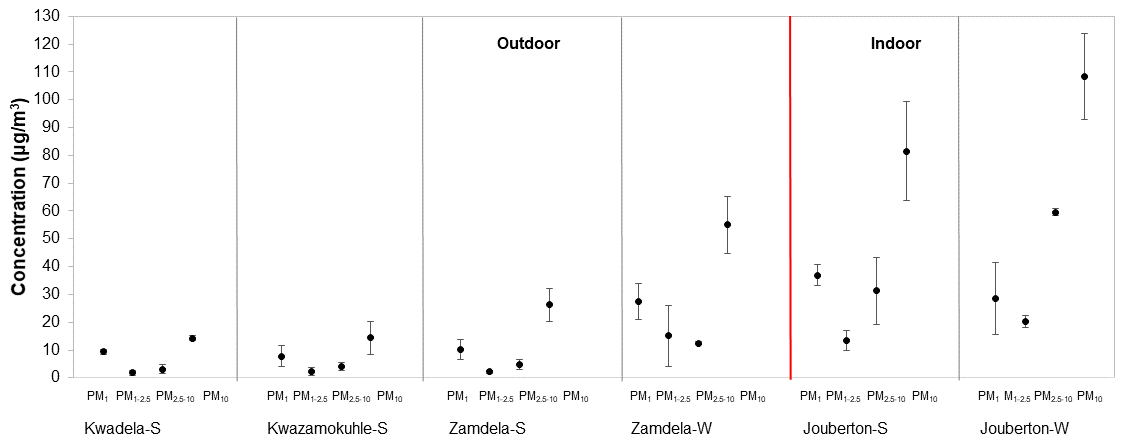
Figure 2Mean aerosol mass concentrations (± SD) measured in PM1, PM1−2.5 and PM2.5−10 at each site (S denotes a summer campaign and W designates a winter campaign). Average PM10 mass concentrations are also indicated.
The PM mass concentrations determined in this study correspond to levels determined for PM in other recent studies in low-income settlements, which also include measurements at Kwadela and Kwazamokuhle (Adesina et al., 2020; Langerman et al., 2018; Xulu et al., 2020; Language et al., 2016; Kapwata et al., 2018). These studies also reported similar trends in PM mass concentrations, i.e. higher mass concentrations in winter compared to summer, while indoor PM mass concentration was also generally higher (in some instances, significantly higher) than outdoor mass concentrations. As mentioned above (Sect. 2.1), higher concentrations of pollutant species in winter in this part of South Africa can be attributed to pollution build-up associated with meteorological conditions and increased household combustion for space heating.
Comparisons of aerosol mass concentrations of different size fractions indicate that the PM1 size fraction had the highest mass concentration in all outdoor aerosol samples collected during winter and summer, as well as in indoor samples collected during summer. However, the PM2.5−10 size fraction had the highest mass concentration for indoor samples collected during winter, as mentioned above. The lowest mass concentrations were determined for the PM1−2.5 size fractions during all the sampling campaigns at all the sites, with the exception of winter outdoor samples collected at Zamdela, where the PM2.5−10 size fraction had the lowest mass concentration. Ultrafine PM is indicative of secondary aerosol formation, while coarse particulates are generally associated with terrigenous sources (e.g. wind-blown dust). These mass concentration profiles observed for the size fractions of aerosols collected during each sampling campaign in this study will be explored in subsequent sections through an assessment of the size-resolved chemical composition of PM.
3.2 Inorganic ions and water-soluble organic acids
In Fig. 3, the concentrations of each ionic species determined in the three size fractions at each site during the respective sampling campaigns are presented, Fig. 4a presents the concentrations of each of these ionic species for PM10, and Fig. 4b presents the normalised concentration distribution of each of these ionic species in the three size fractions. Concentrations of COO−, CH3COO−, C2H5COO−, and C2O were combined and presented as a total for water-soluble OA (Conradie et al., 2016). As mentioned previously (Sect. 2.1), inorganic ions and water-soluble OAs were not determined during the winter indoor campaign at Jouberton due to instrument failure.

Figure 3Mean concentrations (± SD) of inorganic ionic species and water-soluble OAs measured in PM1, PM1−2.5, and PM2.5−10 at each site during respective sampling campaigns.

Figure 4(a) Mean concentrations (± SD) of inorganic ionic species and water-soluble OAs in PM10, and (b) normalised concentration distributions of these species in PM1, PM1−2.5, and PM2.5−10 at each site during respective sampling campaigns.
It is evident from Figs. 3 and 4a that the highest concentration was determined for SO at each site during the respective sampling campaigns, while NH and NO were the second most abundant species. Moderately higher Ca2+ levels were also measured, especially during the winter outdoor and the summer indoor campaigns, with the mean Ca2+ concentration determined for the latter sampling campaign being higher than the average NH concentration measured during this campaign. Concentrations of other ionic species were at least an order of magnitude lower compared to SO, NH, and NO levels. The highest SO concentrations were determined during the summer and winter outdoor campaigns conducted at Zamdela, while similar SO levels were determined for the other two summer outdoor campaigns and the summer indoor campaign. NO concentrations determined for the winter outdoor and summer indoor campaigns were significantly higher compared to levels thereof measured during the three summer outdoor campaigns, while the NH concentration recorded for the winter outdoor campaign was significantly higher compared to NH levels determined for other sampling campaigns. NH concentrations were higher than NO levels for the three summer outdoor campaigns, while NO concentrations exceeded NH levels during the winter outdoor and summer indoor campaign. SO concentrations for the four summer (outdoor and indoor) campaigns were nearly 4 times higher compared to NH levels, while being approximately 2 times higher than NH concentrations determined for the winter outdoor campaign. NO concentrations were approximately 3 times lower than SO levels measured during the winter outdoor and summer indoor campaigns, and almost an order of magnitude lower compared to SO concentrations determined for the three summer outdoor campaigns.
SO and NH levels in the PM1 size fraction were an order of magnitude higher compared to their respective concentrations in the two larger size fractions for aerosol samples collected during all sampling campaigns, while OA concentrations in PM1 were approximately 5 times higher than levels thereof in PM1−2.5 and PM2.5−10. NO concentrations in samples collected during the winter outdoor and summer indoor campaign were also an order of magnitude higher in the PM1 size fraction, while also being marginally higher in the submicron fraction for particulates collected during the three summer outdoor campaigns. Elevated levels were also observed for Cl− and K+ in PM1 collected during the winter outdoor campaign, while Cl− also exhibited higher concentrations in PM1 sampled during the summer outdoor campaign at Kwadela. Cl− concentrations were higher in the PM2.5−10 size fraction for the other outdoor and indoor sampling campaigns. K+ levels in PM1 were marginally higher than levels thereof in the other two size fractions for all sampling campaigns. The corresponding increased concentrations of Cl− and K+ in the PM1 size fraction for the winter outdoor campaign can be indicative of the influence of open biomass burning in this region. Ca2+ and Na+ concentrations were relatively evenly distributed in all three size ranges, with the exception of moderately higher Ca2+ and Na+ levels determined in the PM2.5−10 size fraction during the summer indoor campaign. As mentioned previously, very low concentrations were determined for Mg2+ and F− concentrations, which were for most sampling campaigns similar in all three size fractions.
It is evident from the normalised concentration distributions presented in Fig. 4b for all sampling campaigns that PM1 is dominated by SO and NH, with a slightly higher NO contribution in PM1 collected during the summer indoor campaign observed. A comparison between the summer and winter outdoor campaigns also indicates a similar trend. In addition, a higher contribution from NH in the PM1 size fraction is evident for the winter outdoor campaign compared to the three summer outdoor campaigns. SO, NO, and Ca2+ had the highest contributions in the two larger size fractions for all sampling campaigns, with the exception of higher NH contributions in the larger size fractions of winter outdoor samples and higher contributions from Cl− in the larger size fractions in summer outdoor samples collected at Kwadela. In general, it can be concluded that PM1 was dominated by SO, while NO was the major species in the large size fractions. However, Ca2+ had the highest contribution to chemical content in summer indoor PM2.5−10. Recent ambient aerosol measurements conducted at a regional site located in the South African interior (Welgegund) also indicated PM1 being dominated by SO and the larger size fractions by NO (Venter et al., 2018). In addition, PM1 measurements conducted with an aerosol chemical speciation monitor (ACSM) also indicated the highest contributions from SO and NH to the chemical content of submicron particulates (Tiitta et al., 2014). A higher relative contribution of species in the larger size fractions can be attributed to significantly lower SO and NH levels in these size fractions (Fig. 3).
In Table 3, the mean concentrations of ionic species determined in this study is listed in relation to mean median concentrations determined for inorganic ions in other studies in South Africa, conducted at a rural, regional, and industrial site (water-soluble organic acids were not determined in these other studies), which indicate similar levels and concentration distributions for inorganic ions as determined in this study conducted in low-income urban settlements. In all these studies, SO had the highest concentration, while NH and NO were the second and/or third most abundant species. Venter et al. (2018) also indicated significantly higher SO concentrations in the PM1 size fraction compared to its respective levels in larger size fractions, as well as concentrations of other species in all size fractions at a regional (Welgegund) and an industrial site (Marikana). Very low NO concentrations were determined at the rural background site, Botsalano, with K+ at this rural site having concentrations in the same range as NH. As indicated by these previous studies conducted in this region of South Africa, SO occurs predominantly in the ultrafine size fraction and is generally considered a secondary pollutant formed from the oxidation of atmospheric SO2 associated with industrial emissions (Lourens et al., 2011). Particulate NH is almost exclusively a secondary pollutant formed from emissions of gaseous NH3 (Seinfeld and Pandis, 2006). Atmospheric particulate NO is related to the oxidation of gaseous NO2 associated with fossil fuel combustion, vehicular emissions, and domestic fuel burning (Venter et al., 2012). Very low NO concentrations in the ultrafine size fraction can be attributed to high SO levels substituting NO in NH4NO3. Venter et al. (2018) and Tiita et al. (2014) attributed higher contributions from Ca, Na, and Cl in the larger size fractions to larger particulates associated with marine (NaCl) and terrigenous (e.g. wind-blown dust) sources. It is interesting to note that, with the exception of a higher contribution of Ca2+ to ionic composition in summer indoor PM2.5−10, inorganic ions in indoor aerosols had similar concentration distributions to that of ambient aerosols collected in this study and in other studies in this part of South Africa. This signifies the regional impacts on indoor atmosphere of emissions associated with the highly industrialised and densely populated north-eastern interior of South Africa.
Table 3Mean median concentrations (µg m−3) of inorganic ionic species and water-soluble organic acids determined at low-income settlements in this study and in other studies in South Africa and the rest of the world.
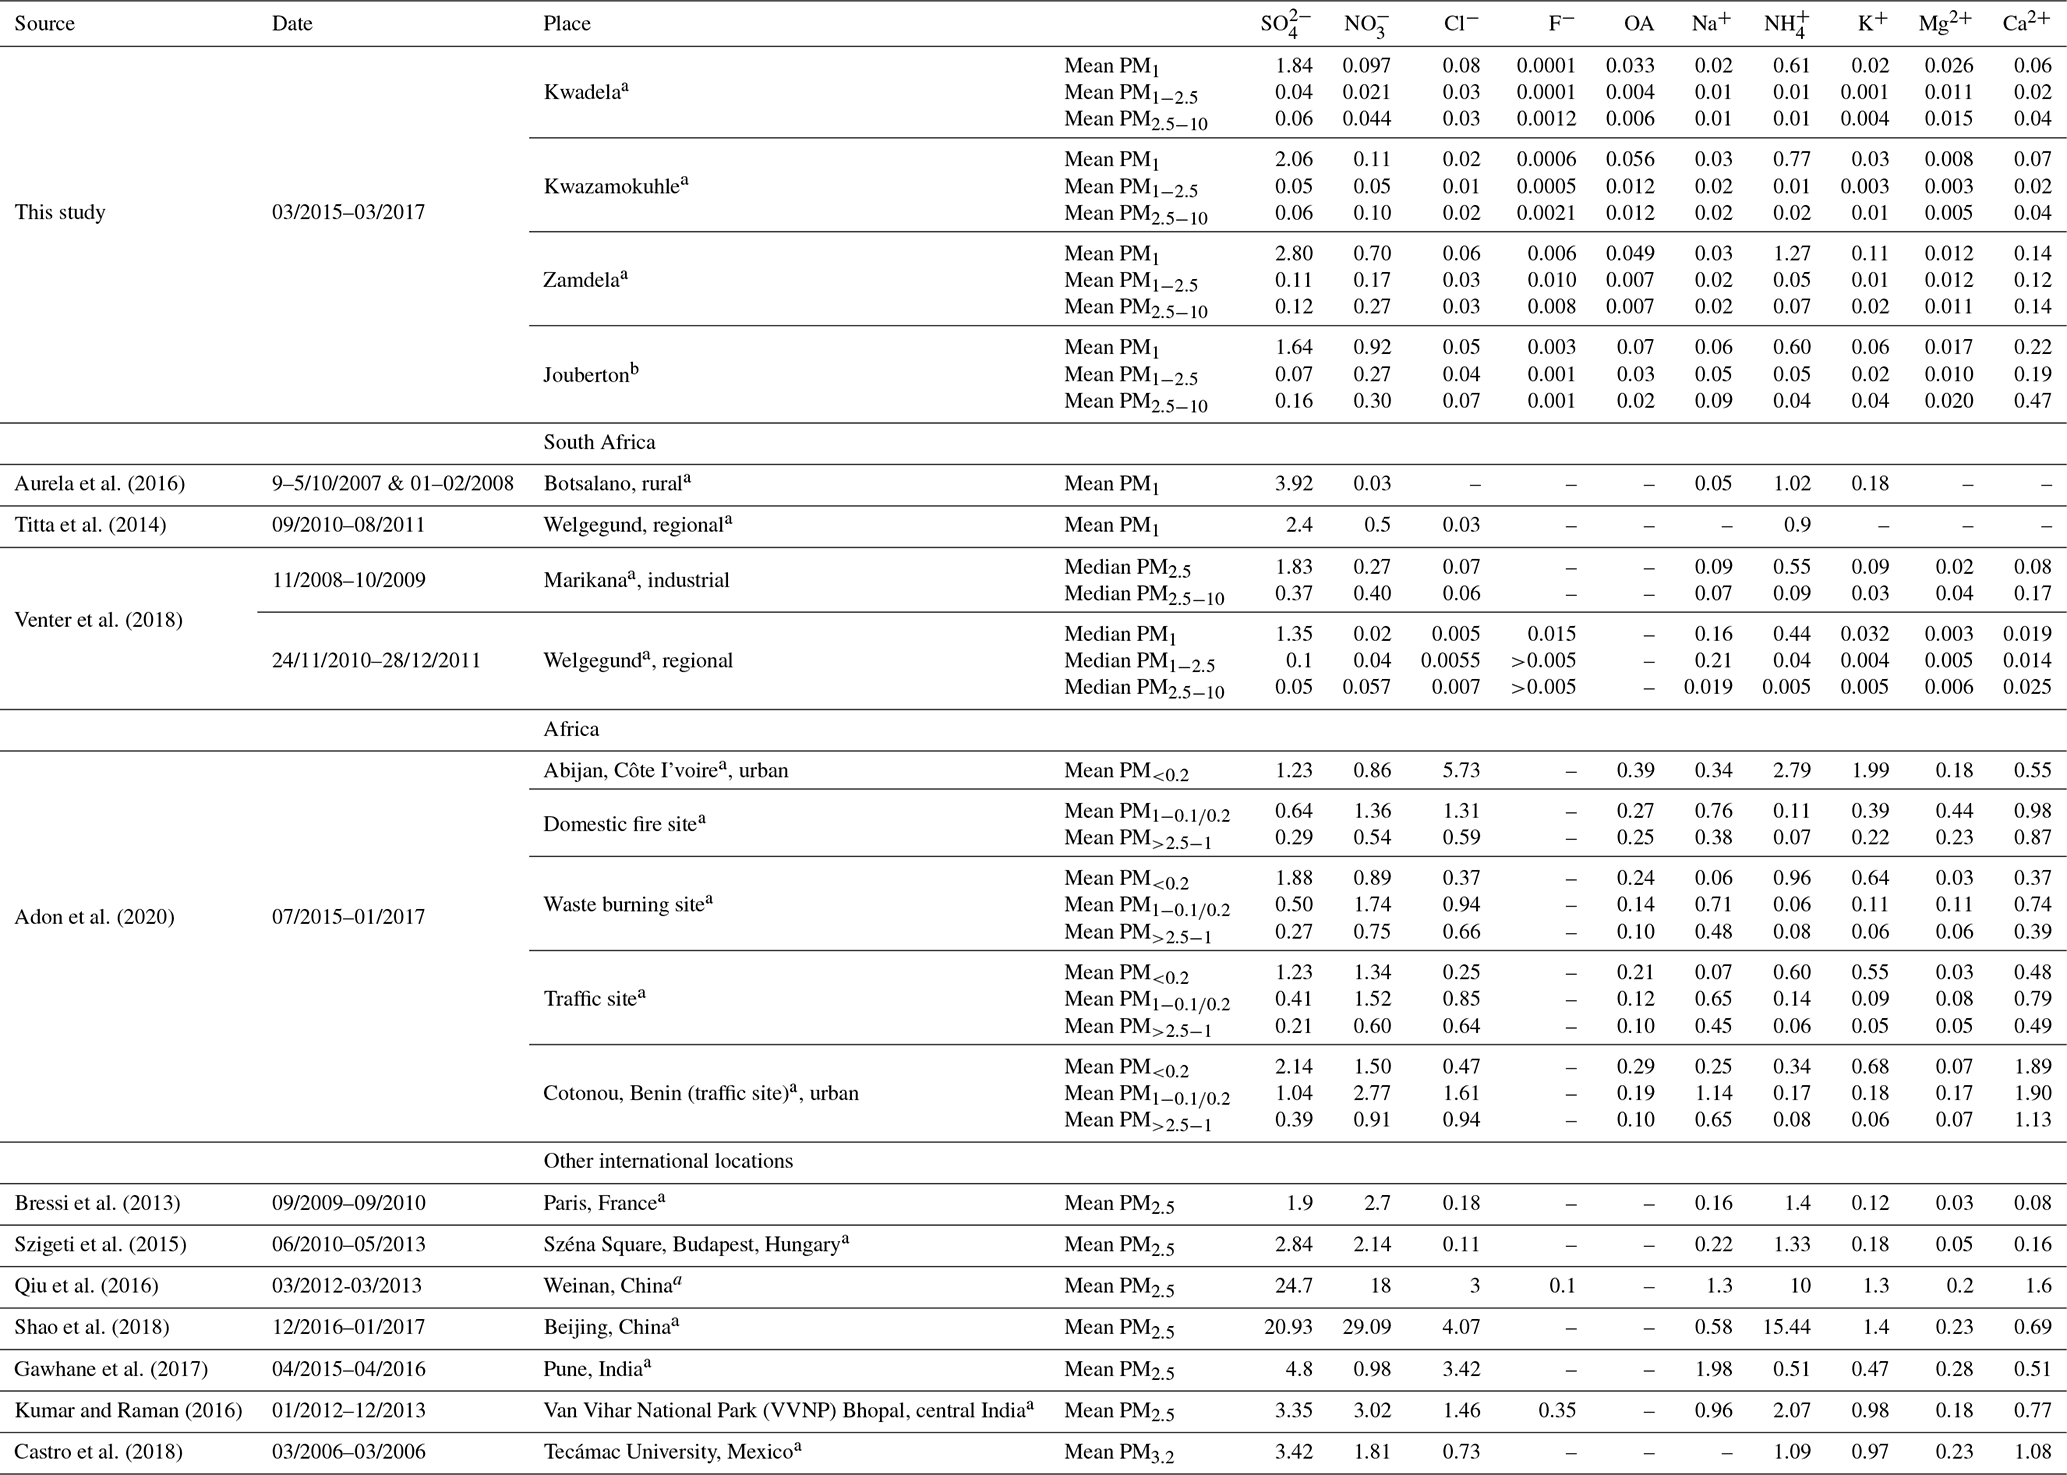
a= Outdoor, b= Indoor.
Also listed in Table 3 are the mean levels determined for inorganic ions and water-soluble organic acids in other parts of Africa and the rest of the world. Aerosol measurements conducted at a site in close proximity to wood burning in Abidjan, Côte d'Ivoire indicated that Cl−, NH, and K+ had the highest concentrations in the PM1 size fraction, with NH levels being at least 3 times higher and Cl− concentrations an order of magnitude higher compared to levels thereof determined in PM1 in this study. SO levels at this West African site impacted by household wood combustion were similar to SO concentrations determined in this study conducted in low-income urban settlements, while the relative contribution of NO compared to SO in PM1 was larger at this site in Abidjan. SO and NO in PM1 were similar to levels determined for these species in PM1 during the summer indoor campaign in this study. Concentrations of other ionic species (including OAs) in the PM1 size fraction of aerosols collected at this site in Abidjan in close proximity to wood burning were an order of magnitude higher than their respective concentrations determined for most of the sampling campaigns conducted in this study. Also, Ca2+ levels determined in PM1 during the winter outdoor and summer indoor campaigns in PM1 were 5 and 2.5 times lower, respectively, than Ca2+ concentrations determined at the domestic burning site in Abidjan. SO and NO had the highest concentrations in PM1 at a waste burning site at Abidjan, while higher contributions are also observed for NH, Cl−, and K+. A comparison with two sites in West Africa in close proximity to vehicular traffic (Abidjan and Cotonou, Benin) indicated that NO dominated the PM1 size fraction, while SO and NH concentrations were similar to levels determined for these species in this study. Larger contributions are also observed for Cl− and K+ at these sites in West Africa, impacted by traffic. Concentrations of all ionic species in the PM2.5−10 size fraction at all these sites in Abidjan and Cotonou were an order of magnitude higher than levels determined for these species in low-income settlements in South Africa. NO and Ca2+ concentrations determined in PM2.5−10 in this study were closer to levels thereof determined at Abidjan and Cotonou, but still lower. In addition, the concentrations of all ionic species in the PM1 size fraction were higher than their corresponding levels in the PM2.5−10 size fraction at all sites in West Africa. The influence of marine air masses on atmospheric composition is evident at these two coastal West African cities.
The mean concentrations determined for inorganic ions in PM2.5 collected at two European (Paris and Budapest), two Chinese (Beijing and Weinan), two Indian (Pune and Bhopal), and one Latin American city (Mexico) are listed in Table 3. SO and NO had the highest concentrations in PM2.5 at the two European cities, with NH being the second most abundant. SO and NH levels at the two European urban sites were similar to concentrations determined for these species at low-income urban settlements, while higher NO levels are reported for the European sites, with NO concentrations at Budapest exceeding SO levels. Concentrations of other ionic species were also higher at the two European urban sites compared to levels thereof determined in this study, with the exception of Ca2+ levels. Similar to the two European cities, SO and NO were also the most abundant species at the two urban sites in China, while NH was the second most abundant species. However, the concentrations of SO, NO, and NH were approximately 10 times higher than levels determined for these species at the European urban sites and at the low-income settlements in this study. Concentrations of other inorganic ions were at least an order of magnitude higher at these two Chinese cities. The highest ionic concentrations were also reported for SO and NO at Bhopal in India, with NH having the second highest concentration. SO levels at Bhopal were slightly higher than levels thereof in low-income settlements in the South African interior, while NO and NH concentrations were substantially higher at Bhopal. SO had the highest concentration at Pune in India, which were 4 times higher than SO levels determined in this study. NO and NH concentrations at Pune were similar to levels thereof in the low-income settlement in South Africa. However, NO and NH levels at Pune were significantly lower compared to Cl− and Na+ concentrations that were the second and third most abundant species respectively at Pune – Cl− levels at Pune were two orders of magnitude higher than levels thereof determined in this study. Concentrations of other inorganic ions were also higher at the Indian urban sites compared to levels of these species at low-income settlements in South Africa. Similar to the concentration distribution observed in the South African sites, SO was the most abundant species, with NO and NH being the second most abundant at the urban site in Mexico. Moderately higher concentrations were reported for SO, NO, and NH in Mexico compared to levels thereof determined in this study, while the concentrations of other inorganic ions were at least an order of magnitude higher at the site in Mexico.
3.3 Acidity
Similar to Tiitta et al. (2014) and Venter et al. (2018) who reported acidity for ambient PM1 sampled at Welgegund in South Africa, the acidity of the outdoor and indoor PM1 collected in low-income urban settlements was estimated by relating the measured NH concentrations ([NH]meas) to the NH levels required to completely neutralise SO, NO, and Cl−. This was calculated as follows:
If [NH]cal≈ [NH]meas particulates can be considered neutralised, whereas if [NH]cal> [NH]meas aerosols could be classified as acidic. This is a relatively simple approach that assumes negligible influences from organic acids, metal species, and other bases on NH levels. Similar to Venter et al. (2018), only the PM1 size fraction that contained the bulk of the ionic concentration (i.e. SO and NH) were considered. In Fig. 5, [NH]meas is plotted in relation to [NH]cal for PM1 collected during outdoor summer, outdoor winter, and indoor sampling campaigns (the three summer campaigns at Kwadela, Kwazamokuhle, and Zamdela were combined and as indicated above, due to instrument failure, ionic species were only measured for indoor particulates collected during the summer campaign). The 1:1 line in this figure corresponds to a bulk neutralised state. It is evident from Fig. 5 that all outdoor and indoor PM1 collected were acidic, with summer outdoor PM1 being closer to a neutralised state compared to outdoor winter and indoor summer PM1. The acidity of outdoor PM1 collected in low-income urban settlements corresponds to previous observations reported by Tiitta et al. (2014) and Venter et al. (2018). However, Venter et al. (2018) indicated that ambient PM1 collected during the dry months, which corresponds to winter as previously mentioned, was closer to the neutralised state, compared to PM1 measured during the wet season, i.e. summer. This difference can be attributed to Welgegund being a regional site with no local point sources that are impacted by aged air masses passing over source regions in the north-eastern interior. Venter et al. (2018) argued that cloud formation processes could contribute to the formation of secondary SO, resulting in increased acidity of PM1 during the wet summer. Ambient measurements in this study were conducted in low-income urban settlements situated within close proximity of large point sources in the north-eastern interior. As previously mentioned, this region is characterised by increased levels of pollutants during winter, which include higher concentrations of ambient SO2 and NO2 contributing to elevated SO and NO levels, especially considering SO being the main acidic ion (Collette et al., 2010; Lourens et al., 2011). The acidity of the summer indoor PM1 at Jouberton was similar to the acidity of the winter outdoor PM1 at Zamdela.
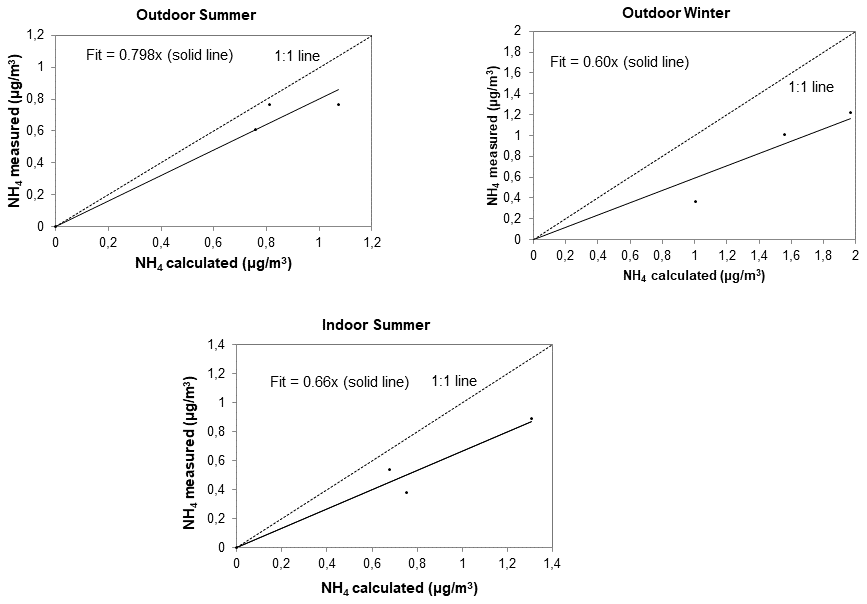
Figure 5[NH]meas in relation to [NH]cal for PM1 collected during outdoor summer, outdoor winter, and indoor sampling campaigns.
3.4 Trace elements
There are limitations associated with using nitric digestion to extract and dissolve metal species for ICP-MS analysis, which mainly relate to the inability of the method to extract Si and silicate minerals. Therefore, Si was not quantified in this study, while lower concentrations of metal species associated with silicates e.g. Fe, Ca, Al, Mg, and K might be reported. Crustal elements determined with ICP-MS could therefore be underrepresented. Notwithstanding the limitation of this analytical method, this technique is generally used to determine trace elements concentrations in atmospheric aerosols (e.g. Venter et al., 2017).
The mean total trace elements concentrations determined in PM1, PM1−2.5, and PM2.5−10 at each site during the respective sampling campaigns are presented with a breakdown of individual trace element concentrations in Fig. 6a, while the normalised trace element compositions are shown in Fig. 6b. The combined concentrations of trace elements that were below the detection limit in 75 % or more collected samples (Sect. 2.3.2 and Fig. A1) are presented as “other” in Fig. 6.
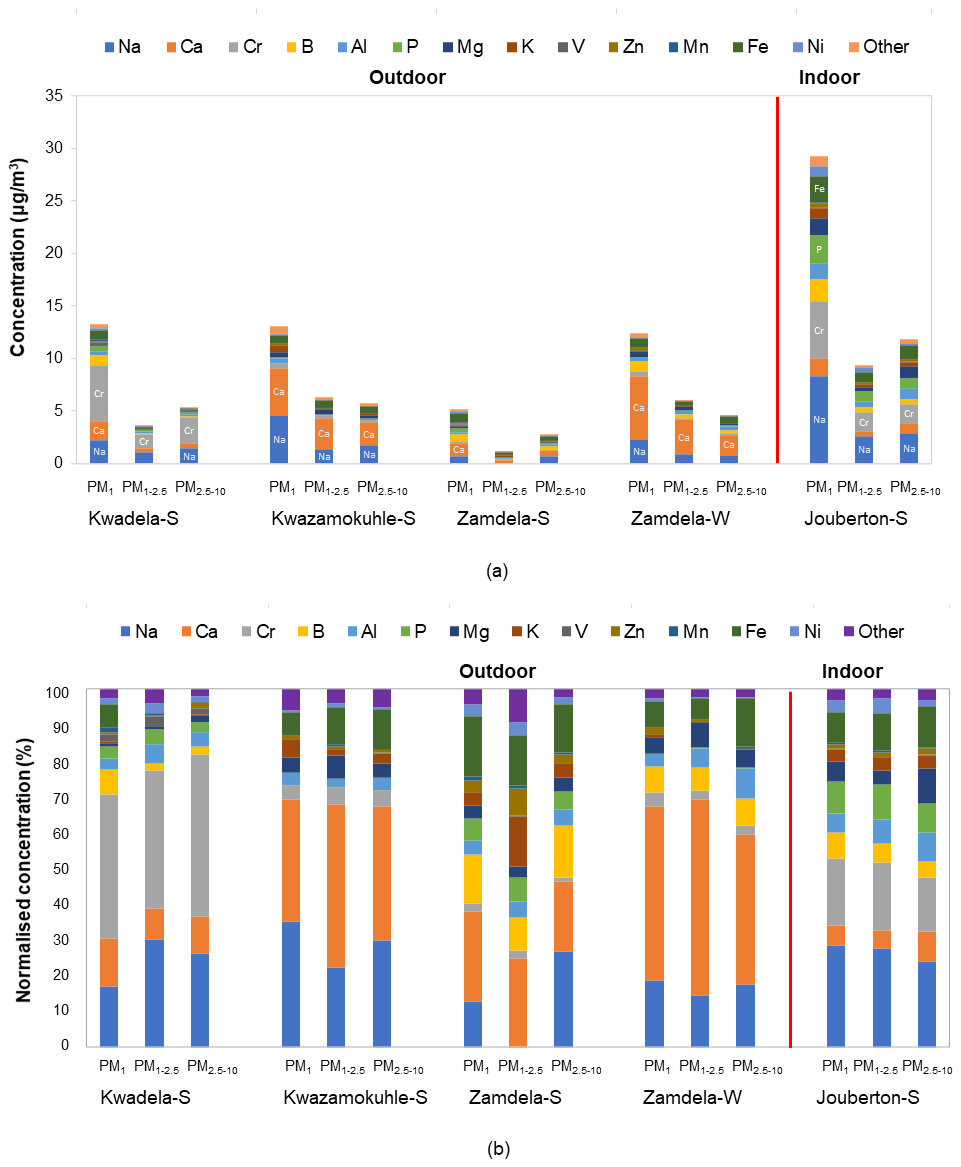
Figure 6(a) Mean trace element concentrations and (b) normalised concentration distributions of individual trace element species determined in PM1, PM1−2.5, and PM2.5−10 at each site during respective sampling campaigns.
The highest total trace element concentrations were determined for aerosols collected during the summer indoor campaign in each size fraction (Fig. 6a). The highest total trace element levels occurred in the PM1 size fraction of indoor particulates, which were significantly higher than total trace element levels determined in the two other size fractions of indoor aerosols as well as total trace element concentrations measured in all three size fractions of aerosols collected during the outdoor campaigns. A comparison between the total trace element concentrations determined during the summer and winter outdoor campaigns at Zamdela indicates higher total trace element levels in all three size fractions during winter. However, the total trace element concentrations determined in the three aerosol size fractions collected during the two summer outdoor campaigns at Kwadela and Kwazamokuhle were similar to levels thereof determined for the winter outdoor campaign. The highest total trace element concentrations also occurred in the PM1 size fraction of aerosols collected during the four outdoor campaigns. Assessments of atmospheric trace elements conducted at Welgegund and Marikana in South Africa indicated higher total trace element concentrations during the dry winter season (Venter et al., 2017; Van Zyl et al., 2014). As mentioned above, Welgegund is a regional site in the South African interior, while Marikana is situated in the highly industrialised western Bushveld Igneous Complex that holds a large number of pyrometallurgical smelters. Measurements conducted at these sites over a period of one year however, did not reveal a very strong seasonal trend for atmospheric trace elements. Furthermore, it seemed from these studies that wet removal of particulates was more significant to seasonal variability than wind-generation thereof.
It is evident from Fig. 6a and b that Na and Ca had the highest concentrations in all three size fractions of aerosols collected during the outdoor campaigns conducted at Kwazamokuhle and Zamdela (with the exception of the PM1−2.5 size fraction of aerosols collected during the summer campaign at Zamdela, for which Ca and K had the largest contribution to total trace element concentration and no Na was detected), while Na and Cr had the highest levels in PM1, PM1−2.5, and PM2.5−10 collected during the summer outdoor campaign at Kwadela and the summer indoor campaign at Jouberton. The higher total trace element concentrations determined during the winter outdoor campaign at Zamdela compared to the summer outdoor campaign conducted at this site is mainly attributed to significantly higher Ca levels measured during winter. Although similar Cr concentrations were determined for the sampling campaigns conducted at Kwadela and Jouberton, the Cr contribution to total trace element concentration was particularly significant at Kwadela in all three size fractions. Relatively high Fe concentrations were also determined in all three size fractions of particulates collected during all sampling campaigns in this study. Moderately higher P concentrations were also evident in aerosol samples collected during the summer indoor campaign, while relatively high contributions to total trace element concentrations were also observed for B in particulates collected at Zamdela.
The mean size distributions of individual trace element species determined at each site during the respective sampling campaigns are presented in Fig. 7. It is evident that ∼40 % and more of each trace element species occurred in the PM1 size fraction of aerosols collected during the outdoor campaigns (with the exception of Mn and V at Kwazamokuhle), while ∼50 % and more of each trace element species were in the PM1 size fraction of summer indoor particulates. In addition, 70 % and more of trace elements detected in aerosol samples collected in low-income settlements (except for Zn and Mg at Kwadela) occurred in the PM1 and PM1−2.5 size fraction. The mean size distributions of trace element species observed in this study correspond to average size distributions of trace elements determined at the regional site Welgegund (Venter et al., 2017), where the largest percentage (>70 %) of individual trace elements occurring in the PM1 and PM1−2.5 size fractions was attributed to the regional impacts of industrial (high temperature) sources. Cr, Mn, V, Zn, and Ni are generally related to pyrometallurgical activities. Van Zyl et al. (2014) indicated that Cr, Mn, V, Zn, and Ni were almost completely in the PM2.5 size fraction of aerosols collected in the highly industrialised Bushveld Igneous Complex within close proximity to several pyrometallurgical smelters. Trace element species occurring in the PM2.5−10 size fraction are generally associated with wind-blown dust and typically include species such as Al, Fe, Mg, and Ca. Trace element species in the PM2.5−10 size fraction at Welgegund were also ascribed to the influence of wind-blown dust (Venter et al., 2017), while Van Zyl et al. (2014) also considered wind-blown dust the major source of Al, B, Fe, Na, K, and Mg in PM2.5−10. Therefore, the regional impacts of industrial activities in the north-eastern interior are also reflected by the mean trace element concentrations, and normalised concentration and size distributions of individual trace element species presented in this study for low-income urban settlements, while the influence of wind-blown dust is also evident.

Figure 7Size distributions of individual trace elements detected at each site during respective sampling campaigns. Species are arranged by increasing concentrations in the PM1 size fraction.
In Table 4, the average trace element concentrations determined in PM10 in this study (combined mean concentrations in PM1, PM1−2.5, and PM2.5−10) in low-income settlements are contextualised with mean trace element concentrations measured in other studies in South Africa and urban areas in other parts of the world. As previously mentioned, Be and Tl were below the detection limit of the analytical technique for the entire sampling period in all the sites, while Sb, Ba, Cu, As, Se, Rb, Sr, Mo, Pd, Ag, Pb, Au, Hg, Ti, Co, Pt, Bi, Th, and U were below the detection limit in 75 % or more of the collected samples. Therefore, concentrations of these species listed in Table 4 are most likely overestimated.
Table 4Mean PM10 trace element concentrations determined during sampling campaigns at low-income settlements in this study, annual average standard limits, and mean trace element concentrations measured in studies conducted in South Africa and other parts of the world. All concentrations are presented in µg m−3. Bold typeface indicates concentrations of species that were below the detection limit of the analytical technique in 75 % or more of the collected samples in all three size fractions (italic typeface indicates species below the detection limit in all samples).

a WHO guideline for Cr(VI) concentrations associated with an excess lifetime risk of 1:1000 000. b WHO air quality guidelines for Europe. c European Commission Air Quality Standards. d National Air Quality Act of the South African Department of Environmental Affairs. e 24 h limit value.
Fe was the most abundant trace element species in particulates collected at Welgegund, Marikana, and Rustenburg in South Africa, while Na had the highest mean concentration in the Vaal Triangle. The city of Rustenburg is, similar to Marikana, located in the western Bushveld Igneous Complex, while the Vaal Triangle is a highly industrialised and densely populated region south of the Johannesburg–Pretoria conurbation. Relatively higher concentrations were reported for Mg, Na, B, Al, and Ca at Marikana, while Mn and Cr were the second and third most abundant species in Rustenburg. Fe and K had the second and third highest concentrations at the Vaal Triangle. Ca, Cr, and Na were the second, third, and fourth most abundant species in Welgegund, with trace element concentrations at Welgegund being generally lower compared to levels thereof determined in urban areas in South Africa, including trace element levels determined in low-income settlements. Relatively high B levels were also reported for Welgegund. Total trace element concentrations determined at other urban areas in South Africa were similar to total trace element levels determined in outdoor aerosols collected in low-income urban settlements. Ca, Na, and Cr concentrations determined in outdoor and indoor particulates in this study were significantly higher than levels thereof determined in the other South African regional and urban sites, especially Na and Cr levels measured in indoor particulates. Although Fe was not the most abundant species in aerosols collected in low-income settlements, its concentrations were similar to levels thereof determined in other South African sites, with the exception of Rustenburg, where a significantly higher Fe concentration was reported. Fe and Ca had the highest concentrations in all three size fractions of particulates collected in Welgegund, which is the only other size-resolved assessment of atmospheric trace elements conducted in South Africa. The highest total trace element concentrations were also determined in PM1 in Welgegund, which were however, dominated by Fe. Ca levels in Welgegund were higher in the PM1−2.5 and PM2.5−10 size fractions.
Total trace element concentrations determined in outdoor aerosols collected in low-income settlements were also similar to the total trace element levels determined in other urban regions in Africa and the rest of the world. However, total trace element concentrations were significantly lower in outdoor and indoor particulates sampled in Barcelona, Spain. With the exception of Ca, most trace element concentrations in Barcelona were at least an order of magnitude lower than levels thereof determined in this study and other studies listed in Table 4. Al, Fe, and Ca were the most abundant species in Bamako, Mali, while the highest concentrations were reported for Na, Ca, Al, and Fe in Dakar, Senegal. Measurements conducted at a regional site within close proximity of Beijing, China indicate that Al, Na, K, Fe, and Ca were the most abundant species. Al was the most abundant species in Bamako and Beijing, with the Al concentration in Bamako being an order of magnitude higher than levels thereof determined in this study. Ca had the highest concentration in particulates collected in Dakar. Ca, Fe, K, and Na had the highest concentrations in particulates collected during outdoor and indoor campaigns in Barcelona. Although trace element concentrations determined in Barcelona were lower than trace element levels determined in low-income urban settlements in this study, higher trace element concentrations are also reported for indoor particulates collected in Barcelona. Wind-blown dust is considered the major source of atmospheric trace elements at these sites in other parts of the world, while the impacts of marine air masses are also evident in coastal cities (e.g. Dakar).
Existing ambient air quality guidelines and standard limit values for trace element species according to the WHO Air Quality guidelines (WHO, 2006), the European commission Air Quality Standards (ECAQ, 2008), and the South African National Air Quality Standards (DEA, 2009) are also listed in Table 4. Since there are only annual average standard values for six of the seven trace elements for which a standard limit value exists, mean trace element levels determined during the respective sampling campaigns at each site in this study cannot be directly compared to these standard limit values. V has a 24 h standard, which can be related to average V levels determined in 24 h samples collected during the indoor campaign. In addition, the relatively high total atmospheric Cr concentrations measured in this study in outdoor and indoor aerosols cannot be directly related to the WHO guideline, which is only for atmospheric Cr(VI) with a lifetime risk of 1:1 000 000.
Average concentrations of Ni, As, and Cd in outdoor and indoor particulates and average Mn levels determined during the indoor campaign were higher than annual standard values for these species. However, As and Cd concentrations are most-likely overestimated due to their levels being below the detection limit of the analytical technique in 75 % or more of the samples. Average Ni concentrations in indoor samples were two orders of magnitude higher than the annual average European standard, while the average concentration thereof in outdoor samples was an order of magnitude higher. Annual average Ni concentrations determined in aerosols collected at Welgegund and Marikana also exceeded annual standard limits, which was attributed to base metal refining in the Bushveld Igneous Complex (Venter et al., 2017; Van Zyl et al., 2014). In addition, the average Ni concentrations in indoor PM10 were an order of magnitude higher than levels thereof determined in Marikana located within close proximity of pyrometallurgical smelters. Mean Mn levels in indoor particulates marginally exceeded the annual average standard. The average V concentration in outdoor and indoor PM10 was well below the 24 h V standard value.
Venter et al. (2017) and Van Zyl et al. (2014) also mentioned atmospheric Pb and Hg concentrations determined in aerosols collected at Welgegund and Marikana, respectively. Pb is the only trace element for which a South African air quality standard exists, while it is foreseen that an air quality standard limit for Hg will be prescribed in the very near future in South Africa. Average Pb and Hg levels determined at each site during the respective sampling campaigns were well below the annual average standard limits of these species. In addition, Pb and Hg levels were only detected in 25 % or less of the collected samples. Pb concentrations were similar to levels determined for Pb at Welgegund, which were at least 2 orders of magnitude lower than Pb concentrations determined at Marikana, the Vaal Triangle, and Rustenburg (Van Zyl et al., 2014; Kgabi, 2006; Kleynhans, 2008). Hg was below the detection limit of the analytical technique for the entire sampling periods at Welgegund and Marikana.
3.5 Carbonaceous aerosols
In Fig. 8, OC and EC concentrations determined in the three aerosol size fractions at each site during the respective sampling campaigns are presented, while the mean ratios calculated are also indicated. The highest average OC and EC concentrations were determined in the PM1 size fraction of all aerosol samples collected during respective sampling campaigns conducted at each site in this study, with mean OC and EC levels being significantly higher (4 times up to an order of magnitude higher) than levels thereof in the PM1−2.5 and PM2.5−10 size fractions of particulates collected during the two indoor campaigns, the winter outdoor campaign, and the summer outdoor campaign at Kwadela. Similar OC and EC levels were measured in PM1−2.5 and PM2.5−10 for all sampling campaigns, with the exception of ∼3 times higher OC and EC concentrations determined in these two larger size fractions during the winter indoor campaign. The lowest average OC and EC concentrations were determined in the PM1−2.5 size fraction for all sampling campaigns.
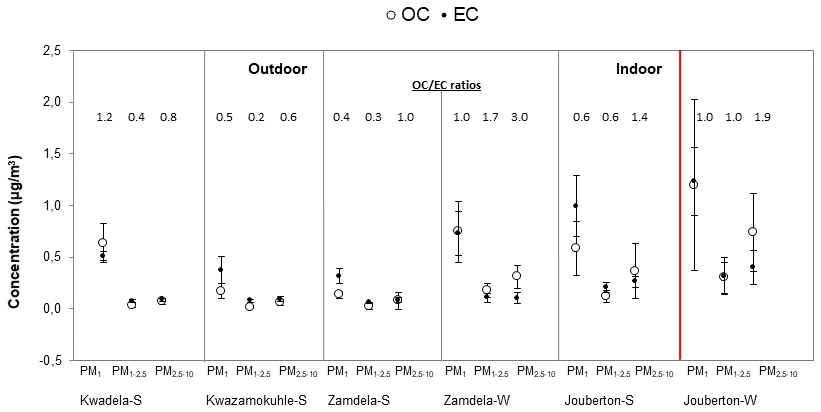
Figure 8Mean OC and EC concentrations (± SD) measured in PM1, PM1−2.5, and PM2.5−10 at each site during respective sampling campaigns, together with mean ratios.
The highest mean OC and EC levels were measured in PM1 collected during the winter indoor campaign. Moderately lower average EC concentrations were determined in the PM1 size fraction of particulates collected during the summer indoor campaign, while mean OC levels in PM1 sampled during the summer indoor campaign were significantly lower than average OC concentrations determined for the winter indoor campaign. Mean OC and EC levels measured in PM1 collected during the winter outdoor sampling campaign at Zamdela were significantly higher than average OC and EC concentrations determined during the summer outdoor campaigns at Zamdela and Kwazamokuhle, where similar OC and EC levels were measured. Mean OC and EC levels in PM1 collected during the summer outdoor campaign at Kwadela were higher than OC and EC concentrations determined in PM1 during the other two summer outdoor campaigns, but lower than OC and EC levels in PM1 sampled during the winter outdoor campaign at Zamdela. Ambient EC concentrations determined during winter at Zamdela were moderately lower than EC levels measured during the summer indoor campaign, while higher average OC concentrations were determined in aerosols collected during the winter outdoor campaign at Zamdela compared to OC levels determined for the summer indoor campaign at Jouberton. Ambient OC and EC concentrations determined in PM2.5 collected at four sites regionally representative of the north-eastern interior of South Africa indicated higher OC and EC concentrations during the dry winter season compared to levels thereof during the wet warmer season, especially at two sites, i.e. Vaal Triangle and Amersfoort, within close proximity of anthropogenic sources (Maritz et al., 2019). Josipovic et al. (2019) also reported higher OC and EC concentrations during the dry season at Vaal Triangle. Higher OC and EC concentrations during winter at these sites were attributed to changes in meteorology (e.g. occurrence of low-level inversion layers) and increased emissions associated with household combustion and open biomass burning.
It is also evident from Fig. 8 and the ratios that EC concentrations were generally higher than OC levels in each size fraction of aerosols collected during the three summer outdoor campaigns at low-income settlements (with the exception of higher OC in PM1 collected at Kwadela). An increase in OC concentrations in relation to EC levels is observed in winter outdoor particulates when compared to summer (ambient) aerosols in all three size fractions (especially in PM1−2.5 and PM2.5−10). EC concentrations were higher than OC levels in the PM1 and PM1−2.5 size fractions of summer indoor aerosols, while an increase in OC levels with regard to EC concentrations is also observed in all three size fractions of indoor particulates collected during winter. Lower ratios are related to fresher emissions of OC and EC (e.g. Aurela et al., 2016), since concentrations of primary emitted EC reduce due to deposition, while secondary formation of OC contribute to increased OC levels in aged air masses. Therefore, ratios reported for aerosol samples collected in low-income urban settlements in this study reflect OC and EC associated with local sources of these pollutants. In addition, ratios calculated in this study also indicate a lower impact from traffic emissions (Adon et al., 2020). ratios reported for PM2.5 at four sites regionally representative of the north-eastern interior of South Africa were lower for sites within close proximity of anthropogenic sources (Maritz et al., 2019). In addition, ratios presented for these sites by Maritz et al. (2019) were significantly higher (ranging between 2.9 and 6.4) than ratios reported in this study for low-income informal settlements, with the exception of the ratio calculated in PM2.5−10 collected during the winter outdoor campaign (3.0), which were similar to the ratio determined at the highly industrialised and densely populated Vaal Triangle site (2.9).
In Fig. 9, , particulate matter (TPM), and , which can also be indicative of sources of aerosols, are presented for particulate samples collected during the respective sampling campaigns at each site. The predominance of SO in the PM1 size fraction is reflected by these ratios, with the ratio also indicating significantly higher SO concentrations than EC levels in PM1. However, substantially lower SO levels in PM1−2.5 and PM2.5−10 are also reflected in these ratios, with EC concentrations exceeding SO levels in most instances in the two larger size fractions. A larger contribution from EC in relation to SO and TPM is also observed in indoor PM1 compared to outdoor PM1. Although the impact of local sources associated with domestic fuel burning is evident for aerosols collected in low-income urban settlements, the regional impacts of emissions related to industrial combustion are also signified by these ratios presented in Fig. 9.
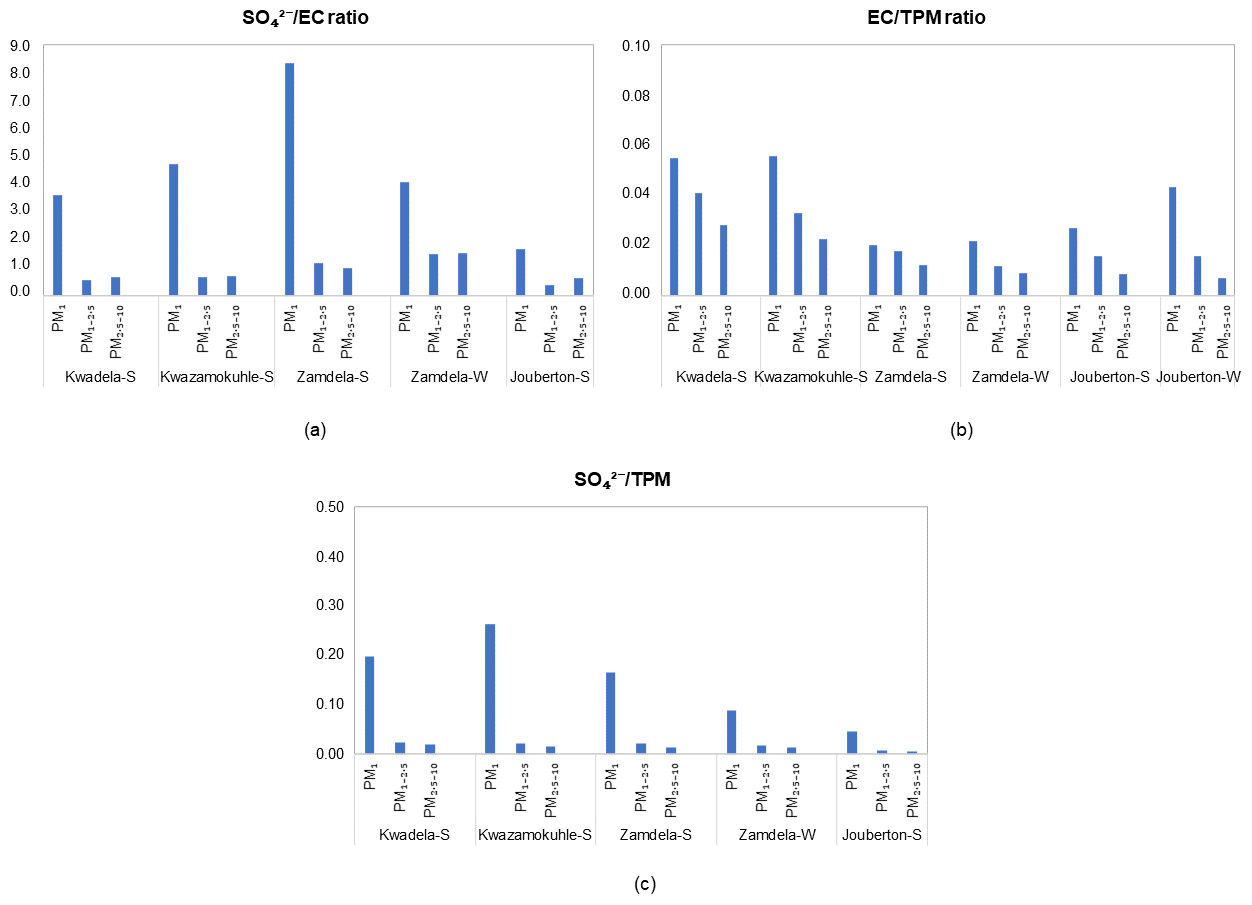
Figure 9Ratios between major compounds in PM1, PM1−2.5, and PM10 collected during outdoor and indoor sampling campaigns. (a) , (b) , and (c) in three size fractions.
In Table 5, OC and EC concentrations determined for low-income settlements in this study are contextualised with other OC and EC measurements conducted in South Africa and other parts of the world. OC levels determined in this study for outdoor and indoor particulates were an order of magnitude lower than OC concentrations determined for ambient PM2.5 collected at four sites located in the north-eastern interior of South Africa, while similar EC concentrations were determined, with the exception of significantly higher EC levels measured at the Vaal Triangle (Maritz et al., 2019; Chiloane et al., 2017). However, OC and EC levels determined for PM1 in this study were similar to OC and EC concentrations reported by Josipovic et al. (2019) for PM1 collected at the Vaal Triangle. Josipovic et al. (2019) also indicated higher OC and EC concentrations in the PM1 size fraction compared to the larger size fractions. OC and EC concentrations measured in PM1−2.5 and PM2.5−10 for low-income settlements were significantly lower (by at least an order of magnitude) than OC and EC levels determined in other sites in South Africa.
Table 5Mean OC and EC concentrations (µg m−3) determined at low-income settlements in this study and in other studies in South Africa and the rest of the world.
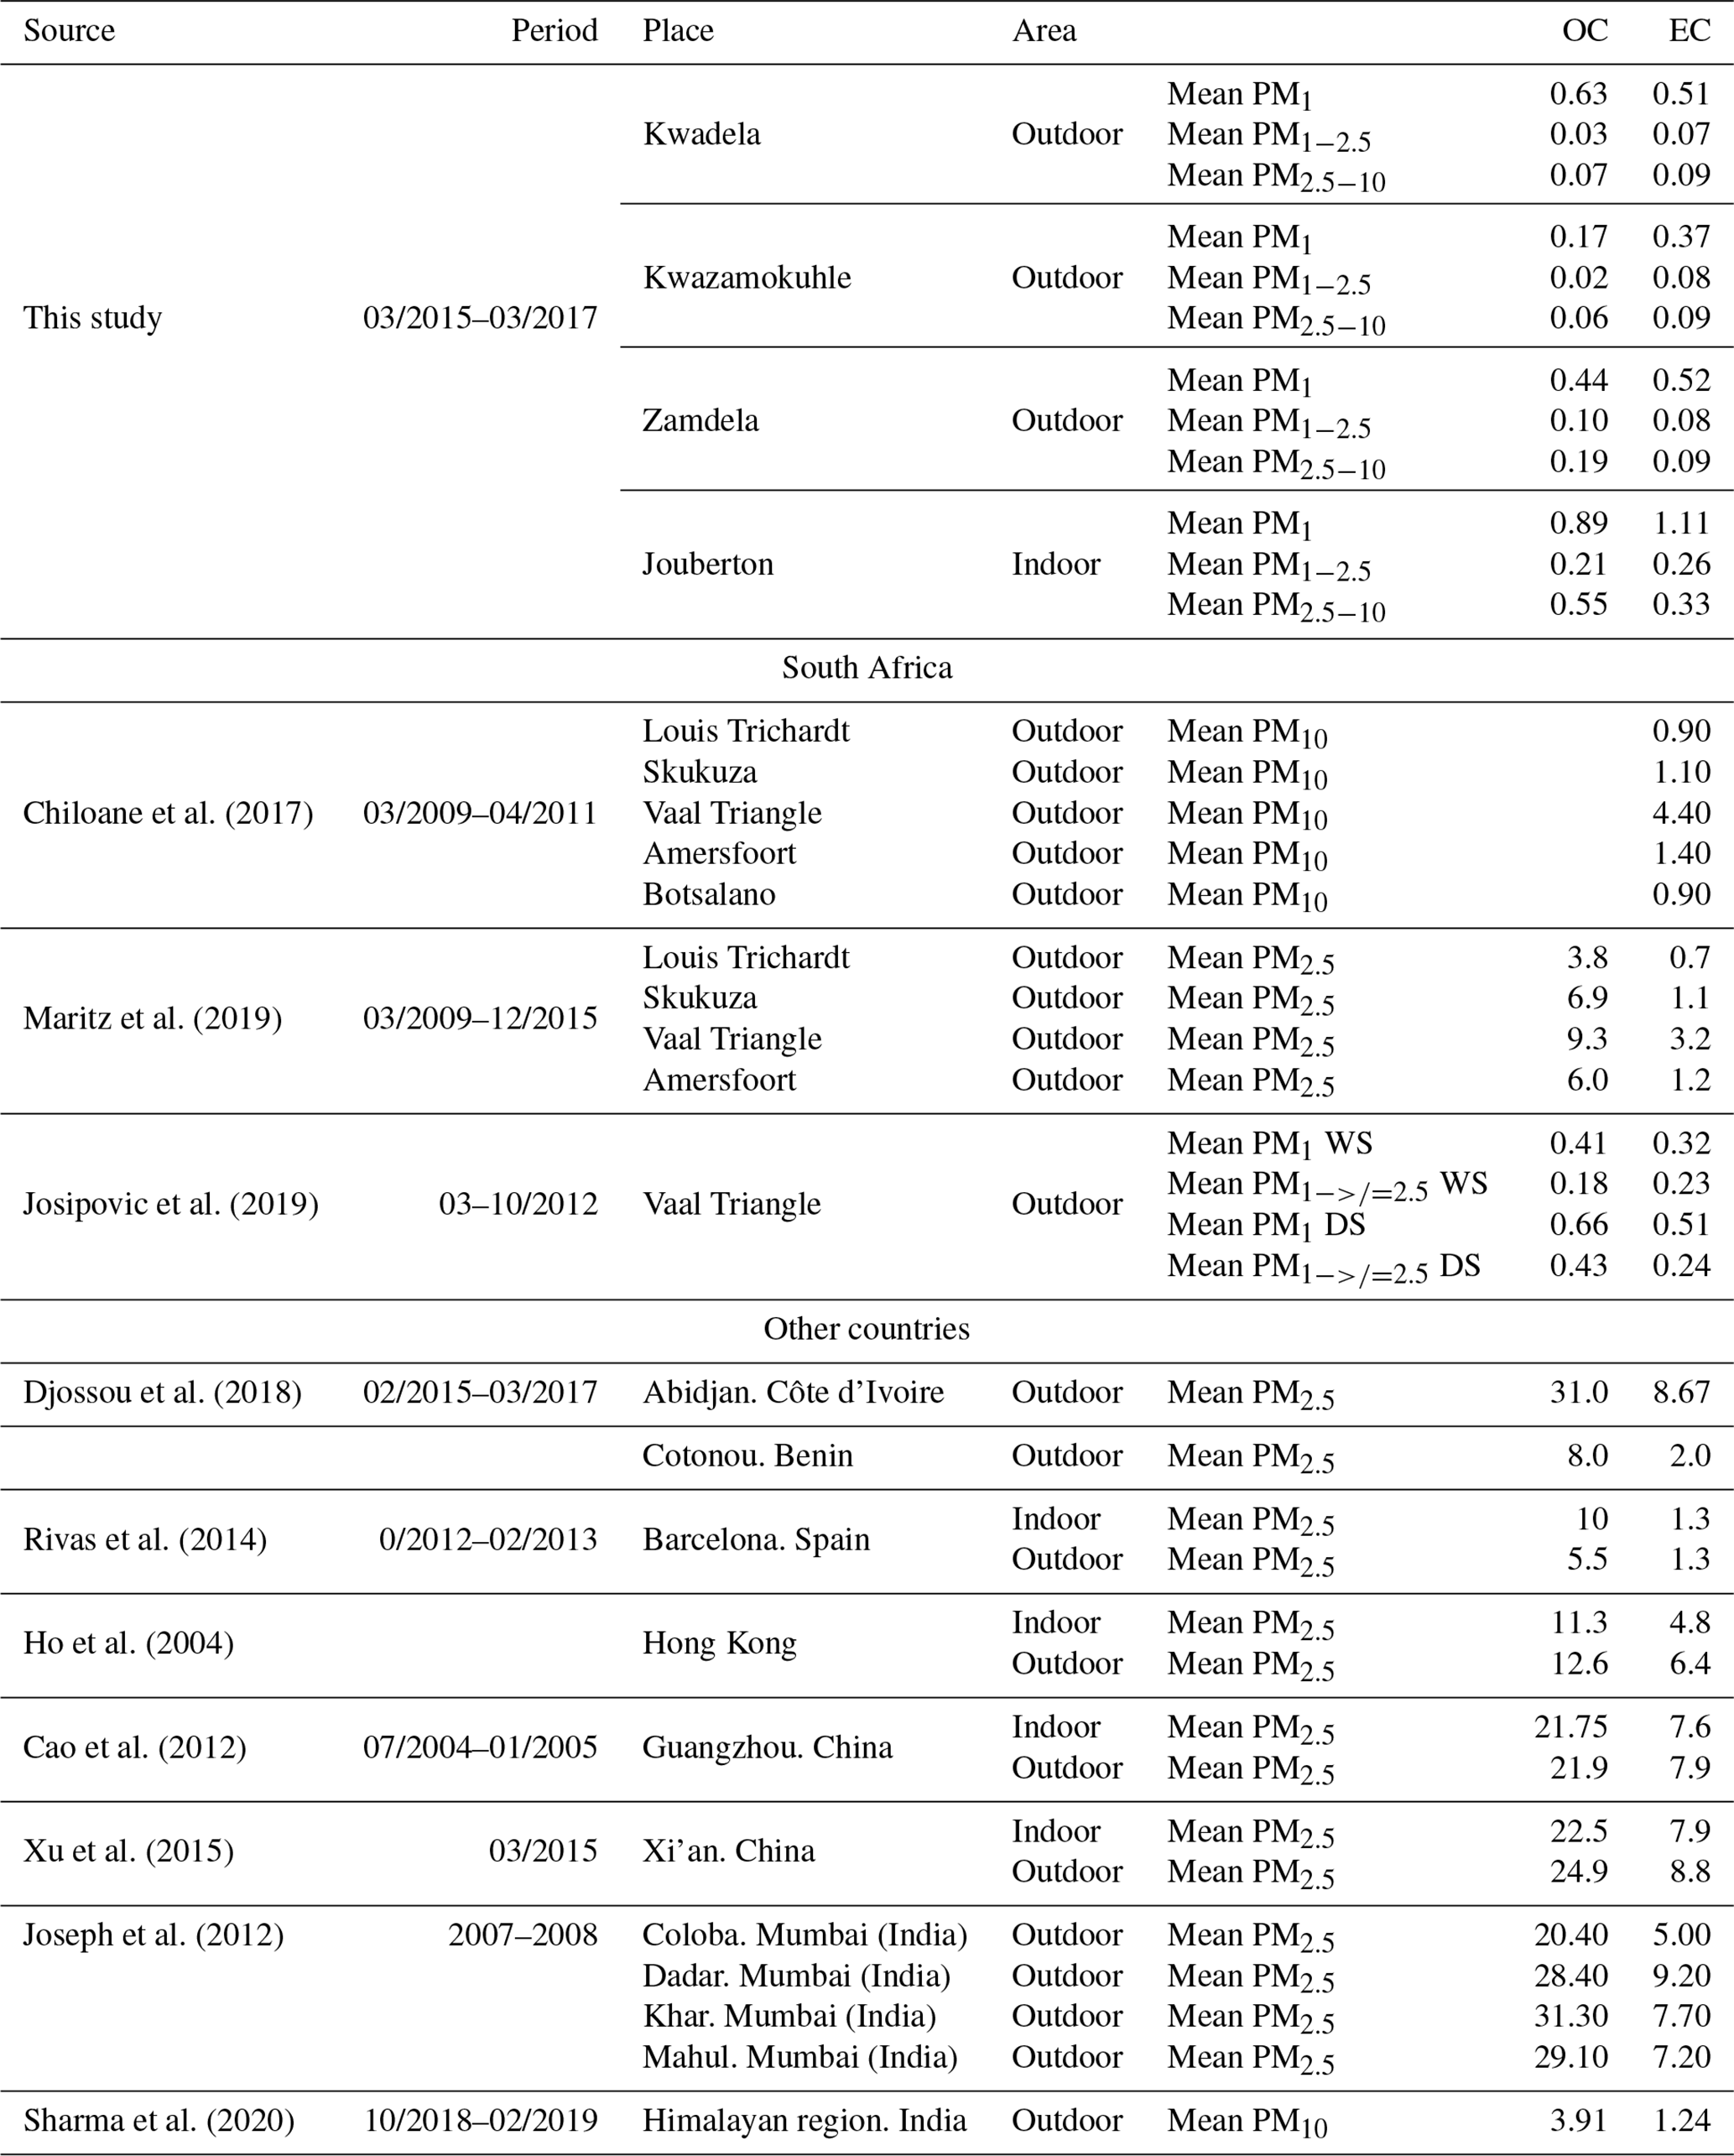
Significantly higher OC and EC concentrations are determined for urban areas in other countries in Africa and the rest of the world, than OC and EC levels determined in this study and other studies in South Africa. OC and EC concentrations determined at Abidjan, Côte d'Ivoire and Cotonou, Benin were between an order and 2 orders of magnitude higher than levels thereof measured in low-income urban settlements, especially with OC concentrations being substantially higher. OC and EC levels in Barcelona, Spain were similar to OC and EC concentrations determined at Cotonou, Benin. OC and EC measured at urban regions in China and India were also between an order and 2 orders of magnitude higher that levels thereof determined in this study. This is also in agreement with studies in other parts of the world where indoor and outdoor OC and EC concentrations were measured with similar levels of OC and EC reported. However, outdoor OC and EC concentrations determined in Barcelona, Spain were approximately 2 times lower than indoor OC and EC concentrations determined in this study. OC and EC levels at a remote site in the Himalayan region in India were significantly lower than that measured in urban areas in other parts of the world. However, OC and EC concentrations for this remote site in the Himalayan region were still higher than levels thereof measured in low-income settlements in this study.
3.6 Aerosol chemical mass closure
Concentrations of inorganic and organic species determined for particulates collected in low-income urban settlements can be used to perform aerosol chemical mass closure. However, as previously mentioned, a limitation of the ICP-MS analytical technique used in this study to determine trace element concentrations is that Si levels cannot be quantified, which is important to establish the contribution of dust to the total aerosol load. There are however, several methods to estimate dust concentrations by utilising concentrations of other species determined with IC and ICP-MS. Two methods commonly used to estimate dust concentrations are the methods described by Guinot et al. (2007) and Terzi et al. (2010) (e.g. Adon et al., 2020).
Guinot et al. (2007) proposed a simplified method to perform chemical mass closure for fine (PM1−2.5) and course (PM2.5−10) particulates, in which the mass of EC, particulate organic matter (POM), inorganic ions, and dust is considered. Experimentally determined OC concentrations are converted to POM levels with a conversion factor, k, which was fixed to 1.8 (Guinot et al., 2007; Adon et al., 2020) in this study. Dust concentrations are calculated from Ca2+ levels and a conversion factor, f, which is the correlation coefficient between Ca2+ concentrations and missing mass, i.e. the mass difference between the weighted mass and the mass reconstructed from analysed species (EC, POM, and inorganic ions). The total mass reported for inorganic ions in this method excludes Ca2+, while water-soluble organic acids are accounted for in the POM mass.
The Terzi et al. (2010) method utilises concentrations of trace elements, considered to be major constituents of dust, to estimate dust levels according to the following expression:
with Si concentrations estimated by the relationship 2.03 × Al according to Chiapello et al. (1997). A conversion factor of 1.8 was also used to convert OC levels to POM concentrations. Trace element species not included in the estimation of dust concentrations were converted to their corresponding oxides and also considered for chemical mass closure.
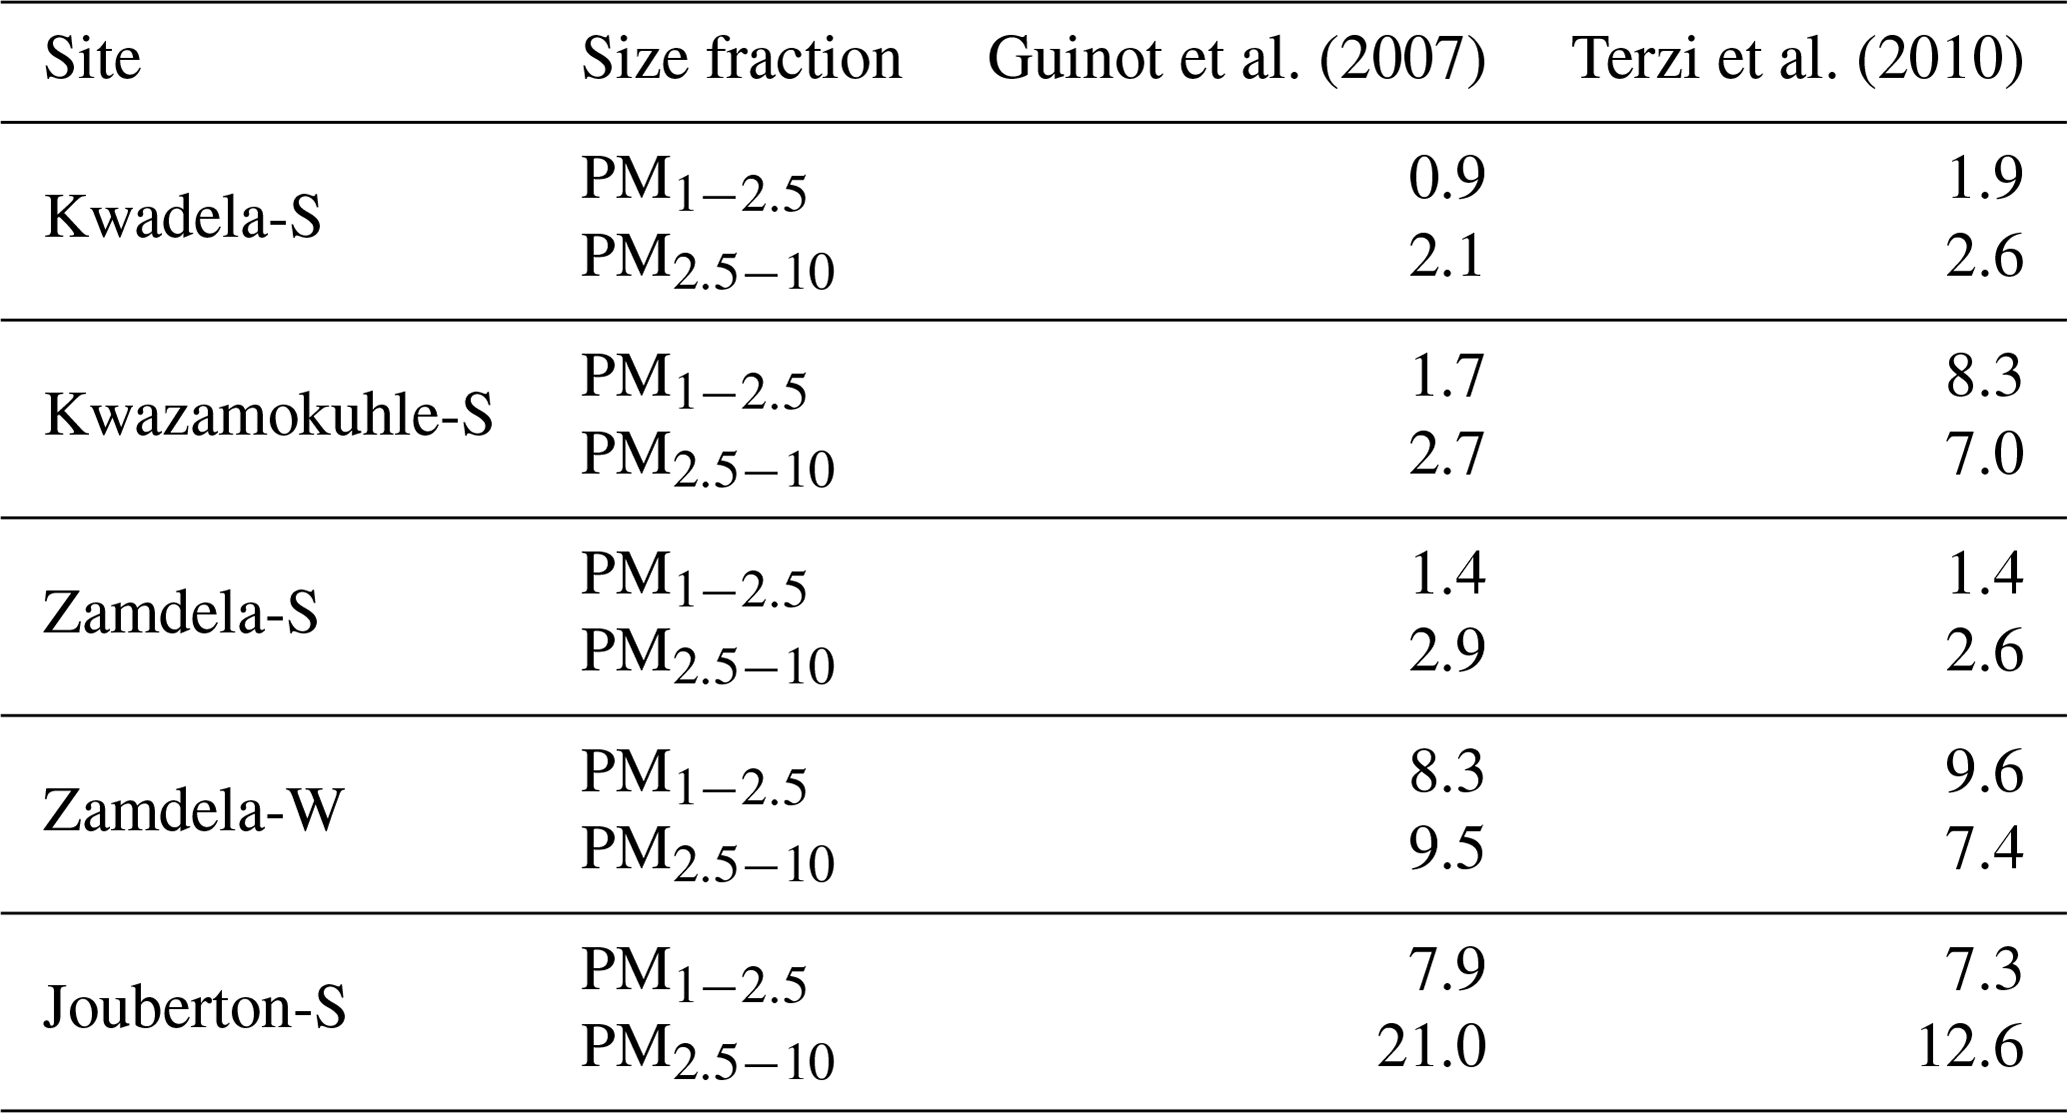
Dust concentrations determined in PM1−2.5 and PM2.5−10 with the two methods are listed in Table 6 (the Guinot et al., 2007, method can only be applied to these two size fractions). As previously mentioned, the concentrations of inorganic ions and trace elements could not be determined for the winter indoor campaign at Jouberton due to instrument failure. Therefore, chemical mass closure could not be performed for this sampling campaign. In general, a relatively good correlation (R2=0.80) is observed between dust concentration calculated with the two methods, with the exception of moderately large differences in dust levels estimated for the Kwazamokuhle summer outdoor campaign and in PM2.5−10 collected during the summer indoor campaign at Jouberton. Higher dust concentrations estimated with the Terzi et al. (2010) method compared to the Guinot et al. (2007) method could be expected due to ICP-MS measuring soluble and insoluble Ca, while the concentrations of other species are also considered in the calculation. However, lower dust concentrations estimated with the method of Terzi et al. (2010) in relation to the method of Guinot et al. (2007) can be attributed to ICP-MS measuring lower concentrations for trace elements included in Eq. (2) due to these species being associated with silicates, as previously mentioned.
Table 6Dust concentrations (µg m−3) estimated according to the methods of Guinot et al. (2007) and Terzi et al. (2010).
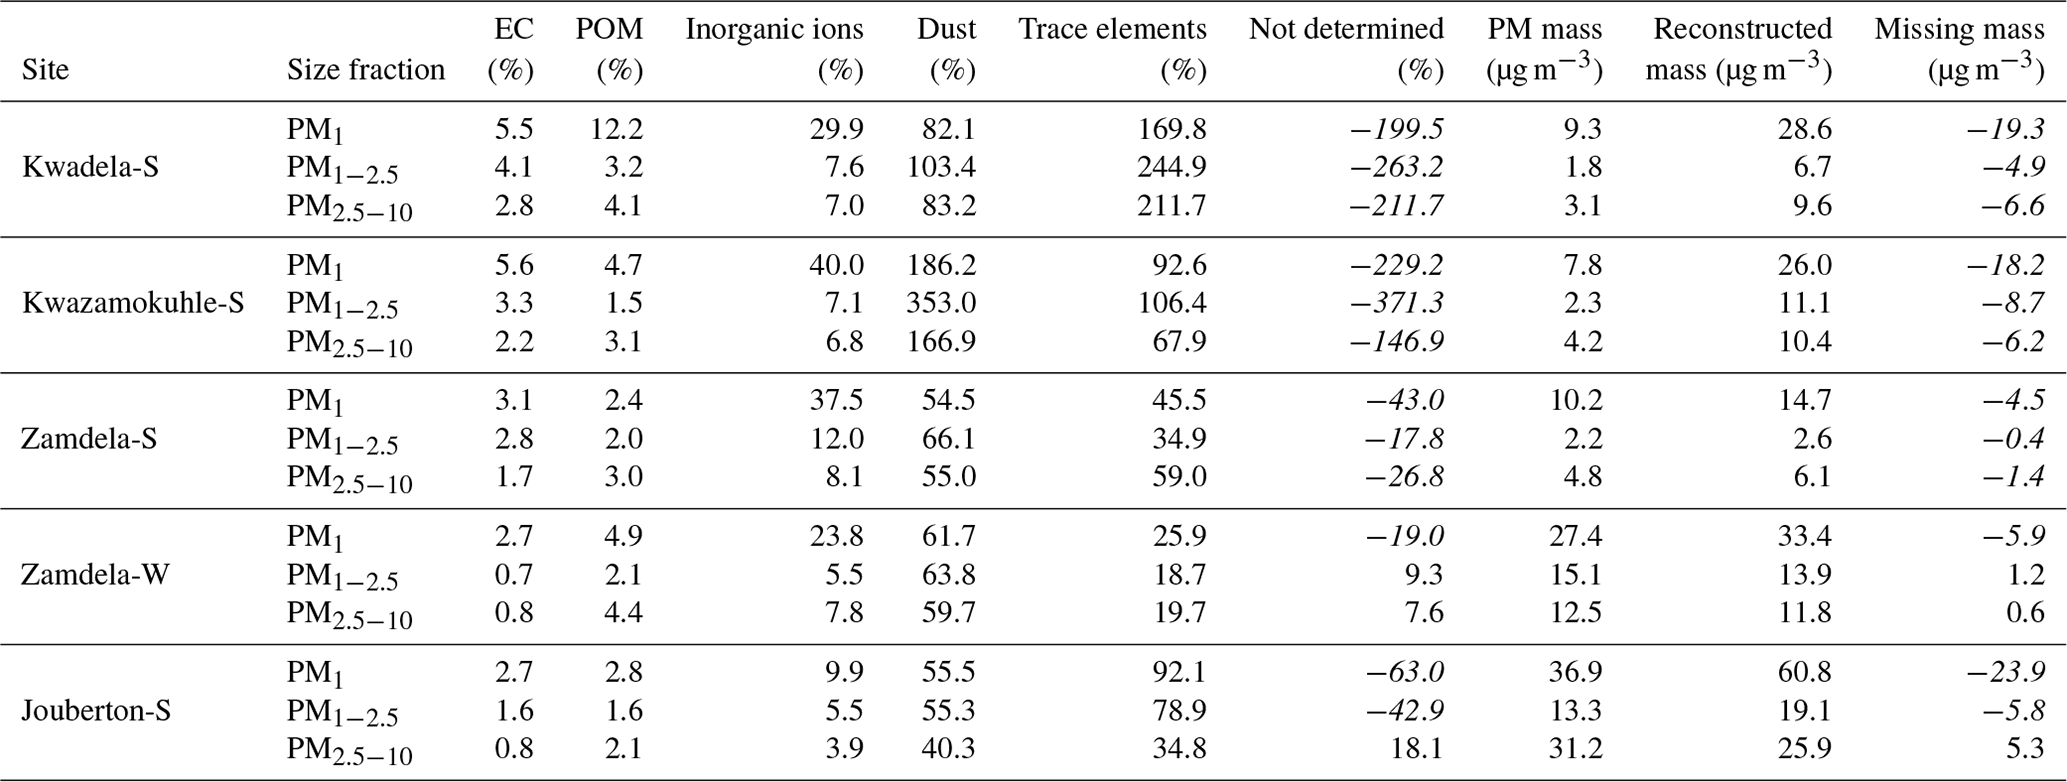
The results from the chemical mass closure performed with the two methods described above are presented in Tables 7 and 8. Percentage contributions from dust and trace elements calculated with the Terzi et al. (2010) methods exceeding 100 % are due to overestimations of the concentrations of these species, as indicated by the negative values of the missing mass (reconstructed mass minus weighted mass). High Ca2+ concentrations contributed to the overestimation of dust at Kwadela and Kwazamokuhle, while high levels of the oxides of Na, Cr, and B especially lead to trace element concentrations being overestimated at these two sites. In addition, high concentrations were calculated for Ca, B, and Na oxides at Zamdela, while the levels of the oxides of B, Na, Cr, and P were high at Jouberton. It is evident that dust is the major constituent in all size fractions of aerosols collected during respective outdoor and indoor campaigns according to these estimations. The second largest contribution was from “not determined” species according to the Guinot et al. (2007) method, while the Terzi et al. (2010) method indicated the second most abundant species to be trace elements. Therefore, the largest fraction of species not determined with the Guinot et al. (2007) method are most likely trace elements. Trace elements were the most abundant species in PM1 and PM1−2.5 collected during the summer indoor campaign, with a substantially higher contribution to aerosol mass. Inorganic ions were the third most abundant species calculated with both methods, with a significantly larger contribution to aerosol mass determined for these species with the Terzi et al. (2010) method in the PM1 size fraction of aerosols collected during the outdoor campaigns. EC and POM had the lowest contribution to aerosol mass in all size ranges of particulates collected during all the respective sampling campaigns. No significant differences are observed in the chemical composition of particulates collected during the winter and summer outdoor campaigns at Zamdela.
Table 7Chemical mass closure according to the method of Guinot et al. (2007).

Table 8Chemical mass closure according to the method of Terzi et al. (2010).
Size-resolved concentrations of inorganic and water-soluble organic ions, trace element species, as well as OC and EC were determined for outdoor and indoor PM collected during winter and summer sampling campaigns conducted in low-income urban settlements in South Africa. Particulate mass concentrations were higher for indoor samples compared to aerosol mass concentrations determined for outdoor samples, while higher PM mass concentrations were measured for samples collected during winter. PM1 had the highest mass concentrations in all outdoor aerosol samples collected during winter and summer, and in indoor samples collected during summer. The highest aerosols mass concentration was, however, determined in the PM2.5−10 size fraction of aerosols sampled during the winter indoor campaign.
Significantly higher concentrations were determined for SO at each site during the respective sampling campaigns, while NH and NO were the second most abundant species. SO and NH almost exclusively occurred in the PM1 size fraction, while NO was the major constituent in the larger size fractions. The highest SO levels were recorded for the winter and summer outdoor campaigns conducted at Zamdela, while significantly higher NO levels were determined for the winter outdoor and summer indoor campaigns. NH concentrations recorded for the winter outdoor campaign were significantly higher than levels thereof determined in PM collected during other sampling campaigns. Estimations of the acidity of PM1 indicated that all outdoor and indoor PM1 was acidic. The concentrations of inorganic ions and water-soluble OAs determined in this study were similar to ambient levels thereof determined in other studies conducted in South Africa, which signifies the regional impacts of anthropogenic emissions in the north-eastern interior of South Africa. The extent to which particulate inorganic ionic content is dominated by SO in South Africa is unique and not observed for other parts of the world. The influence of regional open biomass burning was also observed through increased Cl− and K+ levels in PM1 collected during the winter outdoor campaign.
The highest total trace element concentrations were determined for aerosols collected during the indoor campaign, while total trace element levels in PM1 were substantially higher than levels thereof in the two larger size fractions of particulates collected during all sampling campaigns. More than 70 % of trace element species occurred in the PM1 and PM1−2.5 size fractions, which is also indicative of the regional impacts of industrial sources. Although no significant seasonal pattern was observed for trace element species, higher Ca levels contributed to relatively higher total trace element concentrations during the winter outdoor campaign at Zamdela. Na and Ca had the highest concentrations in all three size fractions of aerosols collected during the outdoor campaigns conducted at Kwazamokuhle and Zamdela, while Na and Cr had the highest levels in particulates collected during the summer outdoor campaign at Kwadela and the indoor campaign at Jouberton. In most other studies conducted in South Africa, Fe was found to be the most abundant species in ambient aerosols, while one other size-resolved study conducted also indicated higher trace element concentrations in the PM1 size fraction. Ni concentrations in outdoor and indoor PM exceeded the annual average European standard, with Ni levels in indoor PM10 being an order of magnitude higher than levels thereof determined at a site within close proximity of large pyrometallurgical smelters. Indoor Mn also marginally exceeded the annual average standard.
OC and EC concentrations were the highest in PM1 collected during each sampling campaign conducted in this study, with the highest OC and EC levels determined in PM1 collected during the winter indoor campaign. OC and EC levels also revealed a seasonal pattern, with significantly higher concentration measured during winter, which corresponds to other studies conducted in South Africa that attributed trends in OC and EC concentrations to changes in meteorological patterns and increased biomass burning during winter. Low ratios determined for particulates collected in low-income urban settlements revealed that EC concentrations were generally higher than OC levels, which is indicative of OC and EC being mainly associated with local sources of these species. OC concentrations determined in this study were an order of magnitude lower than OC concentrations determined for ambient aerosols collected in the north-eastern interior of South Africa, while similar EC levels were measured. However, OC and EC concentrations determined for urban areas in other countries in Africa and the rest of the world were significantly higher than OC and EC levels determined in general for South Africa. An estimation of chemical mass closure according to two methods revealed dust to be the major constituent in all size fractions of particulates collected during the respective outdoor and indoor campaigns, while trace element species were the second most abundant. However, trace elements made the highest contribution to aerosol mass in PM1 and PM1−2.5 collected during the indoor campaign. No clear season pattern was observed in the chemical composition of particulates sampled in low-income urban settlements.
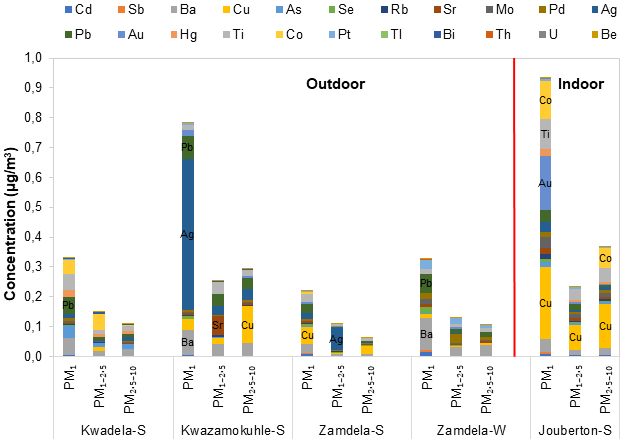
Figure A1Mean concentrations of trace element species for which significantly lower levels were determined in PM1, PM1−2.5, and PM2.5−10 at each site during respective sampling campaigns.
The data set is available at https://doi.org/10.6084/m9.figshare.17197247.v1 (Van Zyl, 2021).
CKS, PGvZ, CL, and JPB were the main investigators in this study and wrote the manuscript. CKS conducted this study as part of her PhD degree and performed most of the experimental work and data processing. The project was led by PGvZ, CL, and JPB who were also study leaders of the PhD. JSS, MDA, and EG assisted with analyses of aerosol samples and BL assisted with aerosol sample collection. RPB and SJP provided infrastructure for sampling campaigns and made conceptual contributions.
The contact author has declared that none of the authors has any competing interests.
Publisher’s note: Copernicus Publications remains neutral with regard to jurisdictional claims in published maps and institutional affiliations.
The Prospective Household cohort study of Influenza, Respiratory Syncytial virus and other respiratory pathogens community burden and Transmission dynamics in South Africa (PHIRST) study is appreciated. Jacques Adon is also thanked for his assistance with OC and EC analysis, as well as Johan Hendriks for conducting ICP-MS analysis.
This research has been supported by the National Research Foundation (NRF) in South Africa and the Atmospheric Research in Southern Africa and Indian Ocean (ARSAIO) project.
This paper was edited by Lea Hildebrandt Ruiz and reviewed by two anonymous referees.
Adesina, J. A., Piketh, S. J., Qhekwana, M., Burger, R., Language, B., and Mkhatshwa, G.: Contrasting indoor and ambient particulate matter concentrations and thermal comfort in coal and non-coal burning households at South Africa Highveld, Sci. Total Environ., 699, 134403, https://doi.org/10.1016/j.scitotenv.2019.134403, 2020.
Adgate, J. L., Mongin, S. J., Pratt, G. C., Zhang, J., Field, M. P., Ramachandran, G., and Sexton, K.: Relationships between personal, indoor, and outdoor exposures to trace elements in PM2.5, Sci. Total Environ., 386, 21–32, https://doi.org/10.1016/j.scitotenv.2007.07.007, 2007.
Adon, A. J., Liousse, C., Doumbia, E. T., Baeza-Squiban, A., Cachier, H., Léon, J.-F., Yoboué, V., Akpo, A. B., Galy-Lacaux, C., Guinot, B., Zouiten, C., Xu, H., Gardrat, E., and Keita, S.: Physico-chemical characterization of urban aerosols from specific combustion sources in West Africa at Abidjan in Côte d'Ivoire and Cotonou in Benin in the frame of the DACCIWA program, Atmos. Chem. Phys., 20, 5327–5354, https://doi.org/10.5194/acp-20-5327-2020, 2020.
Aurela, M., Beukes, J. P., Van Zyl, P. G., Vakkari, V., Teinilä, K., Saarikoski, S., and Laakso, L.: The composition of ambient and fresh biomass burning aerosols at a savannah site, South Africa, S. Afr. J. Sci., 112, 2015–0223, https://doi.org/10.17159/sajs.2016/20150223, 2016.
Booyens, W., Van Zyl, P. G., Beukes, J. P., Ruiz-Jimenez, J., Kopperi, M., Riekkola, M.-L., Josipovic, M., Venter, A. D., Jaars, K., Laakso, L., Vakkari, V., Kulmala, M., and Pienaar, J. J.: Size-resolved characterisation of organic compounds in atmospheric aerosols collected at Welgegund, South Africa, J. Atmos. Chem., 72, 43–64, https://doi.org/10.1007/s10874-015-9304-6, 2015.
Bressi, M., Sciare, J., Ghersi, V., Bonnaire, N., Nicolas, J. B., Petit, J.-E., Moukhtar, S., Rosso, A., Mihalopoulos, N., and Féron, A.: A one-year comprehensive chemical characterisation of fine aerosol (PM2.5) at urban, suburban and rural background sites in the region of Paris (France), Atmos. Chem. Phys., 13, 7825–7844, https://doi.org/10.5194/acp-13-7825-2013, 2013.
Bruce, N., Perez-Padilla, R., and Albalak, R.: Indoor air pollution in developing countries: a major environmental and public health challenge, B. World Health Organ., 78, 1078–1092, 2000.
Cachier, H., Bremond, M.-P., and Buat-Ménard, P.: Determination of Atmospheric Soot Carbon with a Simple Thermal Method, Tellus B, 41, 379–390, https://doi.org/10.3402/tellusb.v41i3.15095, 1989.
Cao, J. J., Huang, H., Lee, S. C., Chow, J. C., Zou, C. W., Ho, K. F., and Watson, J. G.: Indoor Outdoor Relationship for Organic and Elemental Carbon in PM2.5 at Residential Homes in Guangzhou, China, Aerosol Air Qual. Res., 12, 902–910, https://doi.org/10.4209/aaqr.2012.02.0026, 2012.
Castro, T., Peralta, O., Salcedo, D., Santos, J., Saaverda, M. I., Espinoza, M. L., Salcido, A., Celada-Murillo, A.-T., Carreón-Sierra, S., and Álvarez-Ospina, H.: Water-soluble inorganic ions of size-differentiated atmospheric particles from a suburban site of Mexico City, J. Atmos. Chem., 75, 155–169, https://doi.org/10.1007/s10874-017-9369-5, 2018.
Chiapello, I., Bergametti, G., Chatenet, B., Bousquet, P., Dulac, F., and Santos Soares, E.: Origins of African Dust Transported over the Northeastern Tropical Atlantic, J. Geophys. Res.-Atmos., 102, 13701–13709, https://doi.org/10.1029/97JD00259, 1997.
Chiloane, K. E., Beukes, J. P., van Zyl, P. G., Maritz, P., Vakkari, V., Josipovic, M., Venter, A. D., Jaars, K., Tiitta, P., Kulmala, M., Wiedensohler, A., Liousse, C., Mkhatshwa, G. V., Ramandh, A., and Laakso, L.: Spatial, temporal and source contribution assessments of black carbon over the northern interior of South Africa, Atmos. Chem. Phys., 17, 6177–6196, https://doi.org/10.5194/acp-17-6177-2017, 2017.
Conradie, E. H., Van Zyl, P. G., Pienaar, J. J., Beukes, J. P., Galy-Lacaux, C., Venter, A. D., and Mkhatshwa, G. V.: The chemical composition and fluxes of atmospheric wet deposition at four sites in South Africa, Atmos. Environ., 146, 113–131, https://doi.org/10.1016/j.atmosenv.2016.07.033, 2016.
DEA (Department of Environmental Affairs): National Environmental Management: Air Quality Act, 2004 (ACT NO. 39 OF 2004) National ambient air quality standards, Government Gazette, Pretoria, South Africa, 24 December 2009, 6–9, 2009.
Djossou, J., Léon, J.-F., Akpo, A. B., Liousse, C., Yoboué, V., Bedou, M., Bodjrenou, M., Chiron, C., Galy-Lacaux, C., Gardrat, E., Abbey, M., Keita, S., Bahino, J., Touré N'Datchoh, E., Ossohou, M., and Awanou, C. N.: Mass concentration, optical depth and carbon composition of particulate matter in the major southern West African cities of Cotonou (Benin) and Abidjan (Côte d'Ivoire), Atmos. Chem. Phys., 18, 6275–6291, https://doi.org/10.5194/acp-18-6275-2018, 2018.
Duan, J., Tan, J., Wang, S., Hao, J., and Chai, F. G.: Size distributions and sources of elements in particulate matter at curbside, urban and rural sites in Beijing, J. Environ. Sci., 24, 87–94. https://doi.org/10.1016/S1001-0742(11)60731-6, 2012.
ECAQ (European Commission on Air Quality): Air Quality Standards, Directive 2008/50/EC adopted on 21 May 2008 (last updated: September 2019), http://ec.europa.eu/environment/air/quality/standards.htm (last access: 6 November 2021), 2008.
Gawhane, R. D., Rao, P. S. P., Budhavant, K. B., Waghmare, V., Meshram, D. C., and Safai, P. D.: Seasonal variation of chemical composition and source apportionment of PM2.5 in Pune, India, Environ. Sci. Pollut. R., 24, 21065–21072, https://doi.org/10.1007/s11356-017-9761-3, 2017.
Goldstein, A. H. and Galbally, I. E.: Known and Unexplored Organic Constituents in the Earth’s Atmosphere, Environ. Sci. Technol., 41, 1514–14552, https://doi.org/10.1021/es072476p, 2007.
Guinot, B., Cachier, H., and Oikonomou, K.: Geochemical perspectives from a new aerosol chemical mass closure, Atmos. Chem. Phys., 7, 1657–1670, https://doi.org/10.5194/acp-7-1657-2007, 2007.
Ho, K. F., Cao, J. J., Harrison, R. M., Lee, S. C., and Bau, K. K.: Indoor/outdoor relationships of organic carbon (OC) and elemental carbon (EC) in PM2.5 in roadside environment of Hong Kong, Atmos. Environ., 28, 6327–6335, https://doi.org/10.1016/j.atmosenv.2004.08.007, 2004.
Ibrahim, A. S. and Habbani, F. I.: Black Carbon Aerosols Impact of Khartoum Petroleum Refinery at Khartoum State, Sudan Journal of Science, 5, 69–83, 2013.
Joseph, A. E., Unnikrishnan, S., and Kumar, R.: Chemical Characterization and Mass Closure of Fine Aerosol for Different Land Use Patterns in Mumbai City, Aerosol Air Qual. Res., 12, 61–72, https://doi.org/10.4209/aaqr.2011.04.0049, 2012.
Josipovic, M., Leal-Liousee, C., Crobeddu, B., Baeza-Squiban, A., Segakweng C. K., Galy-Lacaux, C., Beukes, J. P., Van Zyl, P. G., and Fourie, G.: Aerosol characterisation including oxidative potential as a proxy of health impact: A case of a residential site in a highly industrialised area, Clean Air Journal, 29, 1–16, https://doi.org/10.17159/caj/2019/29/2.7517, 2019.
Kapwata, T., Language, B., Piketh, S., and Wright, C. Y.: Variation of Indoor Particulate Matter Concentrations and Association with Indoor/Outdoor Temperature: A Case Study in Rural Limpopo, South Africa, Atmosphere, 9, 124. https://doi.org/10.3390/atmos9040124, 2018.
Kgabi, N. A.: Monitoring the levels of toxic metals of atmospheric particulate matter in the Rustenburg district, MSc Thesis, North-West University, Potchefstroom, South Africa, 2006.
Kleynhans, E. H.: Spatial and temporal distribution of trace elements in aerosols in the Vaal triangle, MSc thesis, North-West University, Potchefstroom, South Africa, 2008.
Kulmala, M., Alekseychik, P., Paramonov, M., Laurila, T., Asmi, E., Almut Arneth, A., Zilitinkevich, S., and Kerminenm V-M.: On Measurements of Aerosol Particles and Greenhouse Gases in Siberia and Future Research Needs, Boreal Environ. Res., 16, 337–62, 2011.
Kumar, S. and Raman, R. S.: Inorganic ions in ambient fine particles over a National Park in central India: Seasonality, dependencies between SO, NO, and NH, and neutralization of aerosol acidity, Atmos. Environ., 143, 152–163, https://doi.org/10.1016/j.atmosenv.2016.08.037, 2016.
Laban, T. L., van Zyl, P. G., Beukes, J. P., Vakkari, V., Jaars, K., Borduas-Dedekind, N., Josipovic, M., Thompson, A. M., Kulmala, M., and Laakso, L.: Seasonal influences on surface ozone variability in continental South Africa and implications for air quality, Atmos. Chem. Phys., 18, 15491–15514, https://doi.org/10.5194/acp-18-15491-2018, 2018.
Langerman, K. E., Pauw, C. J., Smith, H. J., and Piketh, S. J.: Moving households to cleaner energy through air quality offsets, International Conference on the Domestic Use of Energy (DUE), 1–8, https://doi.org/10.23919/DUE.2018.8384405, 2018.
Language, B., Piketh, S. J., Wernecke, B., and Burger, R.: Household Air Pollution in South African Low-Income Settlements: A Case Study, Crete, Greece, WIT Trans. Ecol. Envir., 207, 227–236, 2016.
Lourens, A. S. M., Beukes, J. ., Van Zyl, P.G ., Fourie, G. D., Burger, J. W., Pienaar, J. J., Read, C. E., and Jordaan, J. H. L.: Spatial and Temporal assessment of Gaseous Pollutants in the Mpumalanga Highveld of South Africa, South African Journal of Science, S. Afr. J. Sci., 107, 269, https://doi.org/10.4102/sajs.v107i1/2.269, 2011.
Maritz, P., Beukes, J. P., Van Zyl, P. G., Liousse, C., Gardrat, E., Ramandh, A., and Mkhatshwa, G. V.: Temporal and source assessments of organic and elemental carbon at sites in the northern South African interior, J. Atmos. Chem., 76, 263–287, https://doi.org/10.1007/s10874-020-09398-2, 2019.
Mouli, P. C., Mohan, S. V., Balaram, V., Kumar, M. V., and Reddy, S. J.: A study on trace elemental composition of atmospheric aerosols at a semi-arid urban site using ICP-MS technique, Atmos. Environ., 40, 136–146, 2006.
NICD (National Institute for Communicable Diseases): Annual Review, https://www.nhls.ac.za/wp-content/uploads/2019/08/NICD_Annual_Review_2017_18.pdf (last access: October 2021), 2017–2018.
Pacyna, J. M.: Source inventories for atmospheric trace metals, Atmospheric Particles, IUPAC Series on Analytical and Physical Chemistry of Environmental Systems, vol. 5, edited by: Harrison, R. M. and Van Grieken, R. E., Wiley, Chichester, UK, 385–423, ISBN-13 978-0471959359, 1998.
Pope, C. D., Burnett, R. T., Thun, M. J., Calle, E. E., Krewski, D., Ito, K., and Thurston, G. D.: Lung Cancer, Cardiopulmonary Mortality, and Long-Term Exposure to Fine Particulate Air Pollution, J. Am. Med. Assoc., 287, 1132–1141, https://doi.org/10.1001/jama.287.9.1132, 2002.
Pope III, C. A. and Dockery, D. W.: Health Effects of Fine Particulate Air Pollution: Lines that Connect, J. Air Waste Manage., 56, 709–742, https://doi.org/10.1080/10473289.2006.10464485, 2006.
Pöschl, U.: Atmospheric Aerosols: Composition, Transformation, Climate and Health Effects, Angewandte Chemie International Edition, 44, 7520–7540, https://doi.org?10.1002/anie.200501122, 2005.
Qiu, X., Duan, L., Gao, J., Wang, S., Chai, F., Hu, J., Zhang, J., and Yun, Y.: Chemical composition and source apportionment of PM10 and PM2.5 in different functional areas of Lanzhou, China, J. Environ. Sci., 40, 75–83, https://doi.org/10.1016/j.jes.2015.10.021, 2016.
Rivas, I., Vianna, M., Moreno, T., Pandolfi, M., Amato, F., Reche, C., Bouso, L., Àlvarez-Pedrerol, M., Alastuey, A., Sunyer, J., and Querol, X.: Child exposure to indoor air pollutants in schools in Barcelona, Spain, Environmental International, 69, 200–212, https://doi.org/10.1016/j.envint.2014.04.009, 2014.
Sciare, J., Oikonomou, K., Cachier, H., Mihalopoulos, N., Andreae, M. O., Maenhaut, W., and Sarda-Estève, R.: Aerosol mass closure and reconstruction of the light scattering coefficient over the Eastern Mediterranean Sea during the MINOS campaign, Atmos. Chem. Phys., 5, 2253–2265, https://doi.org/10.5194/acp-5-2253-2005, 2005.
Seinfeld, J. H. and Pandis, S.N .: Atmospheric Chemistry and Physics: From Air Pollution to Climate Change, 2nd edn., Canada: John Wiley & Sons, Inc., ISBN-13 978-0471720188, 2006.
Shao, P., Tian, H., Sun, Y., Liu, H., Wu, B., Liu, S., Liu, X., Wu, Y., Liang, W., and Wang, Y.: Characterizing remarkable changes of severe haze events and chemical compositions in multi-size airborne particles (PM1, PM2.5 and PM10) from January 2013 to 2016–2017 winter in Beijing, China. Atmos. Environ., 189, 133–144, https://doi.org/10.1016/j.atmosenv.2018.06.038, 2018.
Sharma, S. K., Choudhary, N., Srivastava, P., Naja, M., Vijayan, N., Kotnala, G., and Mandal, T. K.: Variation of carbonaceous species and trace elements in PM10 at a mountain site in the central Himalayan region of India, J. Atmos. Chem., 77, 49–62, https://doi.org/10.1007/s10874-020-09402-9, 2020.
Szigeti, T., Óvári, M., Dunster, C., Kelly, F. J., Lucarelli, F., and Záray, G.: Changes in chemical composition and oxidative potential of urban PM2.5 between 2010 and 2013 in Hungary, Sci. Total Environ., 518, 534–544, https://doi.org/10.1016/j.scitotenv.2015.03.025, 2015.
Terzi, E., Argyropoulos, G., Bougatioti, A., Mihalopoulos, N., Nikolaou, K., and Samara, C.: Chemical composition and mass closure of ambient PM10 at urban sites, Atmos. Environ., 44, 2231–2239, https://doi.org/10.1016/j.atmosenv.2010.02.019, 2010.
Tiitta, P., Vakkari, V., Croteau, P., Beukes, J. P., van Zyl, P. G., Josipovic, M., Venter, A. D., Jaars, K., Pienaar, J. J., Ng, N. L., Canagaratna, M. R., Jayne, J. T., Kerminen, V.-M., Kokkola, H., Kulmala, M., Laaksonen, A., Worsnop, D. R., and Laakso, L.: Chemical composition, main sources and temporal variability of PM1 aerosols in southern African grassland, Atmos. Chem. Phys., 14, 1909–1927, https://doi.org/10.5194/acp-14-1909-2014, 2014.
Vakkari, V., Kerminen, V.-M., Beukes, J.P., Tiitta, P., Van Zyl, P. G., Josipovic, M., Venter, A. D., Jaars, K., Worsnop, D. R., Kulmala, M., Laakso, L.: Rapid changes in biomass burning aerosols by atmospheric oxidation, Geophys. Res. Lett., 41, 2644–2651, https://doi.org/10.1002/2014GL059396, 2014.
Val, S., Liousse, C., Doumbia, E. H. T., Galy-Lacaux, C., Cachier, H., Marchand, N., Badel, A., Gardrat, E., Sylvestre, A., and Baeza-Squiban, A.: Physico-chemical characterization of African urban aerosols (Bamako in Mali and Dakar in Senegal) and their toxic effects in human bronchial epithelial cells: description of a worrying situation, Particle Fibre Toxicology, 10, 10, https://doi.org/10.1186/1743-8977-10-10, 2013.
Van der Walt, A. J. and Fitchett, J. M.: Statistical classification of South African seasonal divisions on the basis of daily temperature data, S. Afr. J. Sci. 116, 1–15, https://doi.org/10.17159/sajs.2020/7614, 2020.
Van Zyl, P. G.: Segakweng et al. 2021 dataset.xlsx, figshare [data set], https://doi.org/10.6084/m9.figshare.17197247.v1, 2021.
Van Zyl, P. G., Beukes, J. P., Du Toit, G., Mabaso, D., Hendriks, J., Vakkari, V., Tiitta, P., Pienaar, J. J., Kulmala, M., and Laakso, L.: Assessment of atmospheric trace metals in the western Bushveld Igneous Complex, South Africa, S. Afr. J. Sci., 110, 11, https://doi.org/10.1590/sajs.2014/20130280, 2014.
Venter, A. D., Vakkari, V., Beukes, J. P., Van Zyl, P. G., Laakso, H., Mabaso, D., Tiitta, P., Josipovic, M., Kulmala, M., Pienaar, J. J., and Laakso, L.: An air quality assessment in the industrialised western Bushveld Igneous Complex, South Africa, S. Afr. J. Sci., 108, 1059, https://doi.org/10.4102/sajs.v108i9/10.1059, 2012.
Venter, A. D., van Zyl, P. G., Beukes, J. P., Josipovic, M., Hendriks, J., Vakkari, V., and Laakso, L.: Atmospheric trace metals measured at a regional background site (Welgegund) in South Africa, Atmos. Chem. Phys., 17, 4251–4263, https://doi.org/10.5194/acp-17-4251-2017, 2017.
Venter, A. D., Van Zyl, P. G., Beukes, J. P., Swartz, J., Miroslav Josipovic, M., Vakkari, V., Laakso, L., and Kulmala, M.: Size-resolved characteristics of inorganic ionic species in atmospheric aerosols at a regional background site on the South African Highveld, Atmos. Chem., 75, 285–304, https://doi.org/10.1007/s10874-018-9378-z, 2018.
(WHO) World Health Organization. Air quality guidelines – global update 2005, https://wedocs.unep.org/20.500.11822/8712 (last access: June 2021), 2006.
Xu, J., Tai, X., Betha, R., He, J., and Balasubramanian, R.: Comparison of physical and chemical properties of ambient aerosols during the 2009 haze and non-haze periods in Southeast Asia, Environ. Geochem. Hlth., 37, 831–841, https://doi.org/10.1007/s10653-014-9667-7, 2015.
Xulu, N. A., Piketh, S. J., Feig, G. T., Lack, D. A., and Garland, R. M.: Characterizing Light-Absorbing Aerosols in a Low-Income Settlement in South Africa, Aerosol Air Qual. Res., 20, 1812–1832, https://doi.org/10.4209/aaqr.2019.09.0443, 2020.