the Creative Commons Attribution 4.0 License.
the Creative Commons Attribution 4.0 License.
 | 09 Aug 2022
Tropical peat fire emissions: 2019 field measurements in Sumatra and Borneo and synthesis with previous studies
Robert J. Yokelson
Bambang H. Saharjo
Chelsea E. Stockwell
Erianto I. Putra
Thilina Jayarathne
Acep Akbar
Israr Albar
Donald R. Blake
Laura L. B. Graham
Agus Kurniawan
Simone Meinardi
Diah Ningrum
Ati D. Nurhayati
Asmadi Saad
Niken Sakuntaladewi
Eko Setianto
Isobel J. Simpson
Elizabeth A. Stone
Sigit Sutikno
Andri Thomas
Kevin C. Ryan
Mark A. Cochrane
Peat fires in Southeast Asia are a major source of trace gases and particles to the regional-global atmosphere that influence atmospheric chemistry, climate, and air quality. During the November 2015 record-high Ocean Niño Index (ONI, 2.6) our mobile smoke sampling team made the first, or rare, field measurements of numerous trace gases, aerosol optical properties, and aerosol chemistry and mass emissions for fires burning only peat in the Indonesian province of Central Kalimantan (on the island of Borneo). The measurements used Fourier transform infrared spectroscopy (FTIR), whole air sampling (WAS), photoacoustic extinctiometers (PAX, 401 and 870 nm), and detailed off-line analyses of particulate matter (PM) collected on filters. In September–November 2019 we measured peat fire trace gas emissions again, using WAS only, under El Niño–Southern Oscillation (ENSO)-neutral conditions (ONI, 0.3) in more remote areas of Central Kalimantan and also the Indonesian provinces of Riau, Jambi, and South Sumatra, all on the island of Sumatra. The 2019 measurements significantly expanded the geographic range and climate conditions sampled. This paper presents the 2019 results and synthesizes them with the previous fieldwork to converge on more robust regional average emission factors (EFs; grams of compound per kilogram of biomass burned) for authentic peat fires. In addition, samples of peat imported from Indonesia were burned in US laboratories, and the EFs and optical properties were characterized in more detail than in the field by a larger suite of instrumentation. We use the improved knowledge of regional emissions based on the expanded field measurements to select the most representative lab data and compute a synthesized, more “chemically complete” set of EFs and aerosol optical properties for tropical peat fires.
The modified combustion efficiency (MCE) values for the peat smoke sampled in 2019 were within the range of MCEs sampled in 2015, but with a lower average in 2019 (0.718±0.021, range 0.687–0.736) than 2015 (0.772±0.035, range 0.693–0.835). Averaging the new and older data together suggests an updated MCE for tropical peat fires of ∼0.76. Despite the difference in MCE, the study-average methane emission factors (EF CH4) were remarkably similar across the 2 years probing different regions: 9.42±2.51 g kg−1 in 2019 and 9.51±4.74 g kg−1 in 2015. When parsing the 2019 samples by province, the EFs for non-methane organic gases (NMOGs) were about 3 times higher in South Sumatra and Central Kalimantan than in Jambi and Riau, but the overall 2019 study average was only ∼15 % higher than the 2015 study average. South Sumatra peat fires emitted higher amounts of carbonyl and dimethyl sulfide, suggesting a volcanic or marine influence or effects of agricultural chemicals. The lab and fieldwork taken together provide EFs for 230 trace gases including CO2 (1544 g kg−1), CO (315 g kg−1), and CH4 (9.8 g kg−1). These are significant adjustments to IPCC-recommended EFs, −9 %, +50 %, and −53 %, respectively. We also report EFs for numerous NMOGs, 46 N-containing compounds, and 14 sulfur- or halogen-containing species. The use of high-resolution mass spectrometry in the lab allowed measurement of 82 % more NMOG mass than in the field. Gravimetrically measured EF PM2.5 in the field in 2015 (17.3±5.8 g kg−1) was ∼20 % lower than the average from lab studies (22.4±10.4 g kg−1), perhaps due to higher field temperatures. Taken together the lab and field data show that the single-scattering albedo (SSA) was largely independent of wavelength and MCE in the visible (∼0.998), but lower at low MCE at 401 and 405 nm with a value of 0.958 at the study-average MCE. The absorption Ångström exponent (AAE) at the average MCE was 5.7. By far the largest PM component was weakly absorbing insoluble organic carbon.
- Article
(3748 KB) - Full-text XML
- Companion paper 1
- Companion paper 2
-
Supplement
(380 KB) - BibTeX
- EndNote


Global peatlands store an estimated 500–700 Gt of carbon (Gt C), which is similar in mass to the global atmospheric carbon pool (∼850 Gt C) and ∼ 20 %–30 % of the global terrestrial carbon mass (Warren et al., 2017; Watson et al., 2019; Turetsky et al., 2015). About 15 % of global peat is located in the tropics, and about 41 % of tropical peatland and 65 % of tropical peat carbon is located in Southeast Asia where peatland changes due to climate-change-induced rainfall reduction, draining, and subsequent fires are currently the greatest (Warren et al., 2017; Dargie et al., 2017; Fatoyinbo et al., 2017). Deshmukh et al. (2021) found that draining Sumatran peatland decreased CH4 emissions from anaerobic decomposition but increased CO2 emissions from aerobic decomposition and fluvial export of carbon. Draining also increased N2O emissions, potentially by accelerated mineralization of the peat under aerobic conditions producing N2O as a by-product. The net effect of draining was increased global warming. Climate-change-induced reductions in precipitation could also increase peatland greenhouse gas (GHG) emissions by similar mechanisms. Reduction in the water table by draining or reduced rainfall also promotes fire, which converts semi-fossilized peat fuel and other biomass into CO2, CH4, and many other trace gas and aerosol species (Stockwell et al., 2016a; Vetrita et al., 2021; Sinclair et al., 2020). Fire plus non-fire GHG emissions associated with draining peatlands are greater per unit area than for any other land use change considered by the IPCC (Warren et al., 2017).
Peatland fires cause a broad suite of other impacts as well. The direct effect of aerosol emissions can offset GHG warming depending on their optical properties (Stockwell et al., 2016a; H. Lee et al., 2018; Eck et al., 2019; Pokhrel et al., 2016; Liu et al., 2014), and the aerosols also impact cloud cover (Ding et al., 2021) and rainfall (Hodzic and Duvel, 2018; Chen et al., 2017; Lu and Sokolik, 2013). The aerosols and gases emitted by Southeast Asian peatland fires are extensive enough to impact air quality regionally (Aouizerats et al., 2015; Hansen et al., 2019; Kiely et al., 2020; Koplitz et al., 2016; H.-H. Lee et al., 2018; Tosca et al., 2011; Wooster et al., 2018; etc.). On a larger scale, volatile organic compounds (VOCs) from the 2015 Indonesian peatland fires had wide-ranging, significant impacts on the chemistry of the upper troposphere and lower stratosphere (Rosanka et al., 2021), and Southeast Asian fires can contribute to trans-Pacific ozone transport (Xue et al., 2021).
Despite peat fires in the Indonesian provinces on the islands of Sumatra, Kalimantan, and Papua and in Malaysian Borneo being a major, global atmospheric source of trace gases and particles (Akagi et al., 2011; van der Werf et al., 2010), until recently our knowledge of the emissions was limited to the results from burning one sample of peat from South Sumatra in a laboratory study (Christian et al., 2003). In 2012 three peat samples from Kalimantan were burned, also in a laboratory study, and the emissions were sampled with an extensive suite of state-of-the-art instrumentation (e.g., Stockwell et al., 2014, 2015; Jayarathne et al., 2014; Hatch et al., 2015, 2017). Some significant differences were observed in the emissions between the two lab studies and the lack of detailed field measurements at that time made it difficult to ascertain any potential regional differences or determine the most representative tropical peat fire data (Stockwell et al., 2014).
In October–November 2015, as part of an extensive peat fire study that included investigations of land use and fire history, fuels mapping, remote sensing, lidar terrain transects, and a large hydrology component, we conducted ground-based field measurements of trace gases and aerosols in numerous peat fire plumes near Palangka Raya, Central Kalimantan (Applegate et al., 2012; Ichsan et al., 2013; Graham et al., 2014a, b, 2022; Hooijer et al., 2014; Stockwell et al., 2016a; Jayarathne et al., 2018; Putra et al., 2018; Goldstein et al., 2020; Sinclair et al., 2020; Wedeux et al., 2020). We measured trace gas emission factors (EFs; grams of compound produced per kilogram of peat burned) for ∼90 gases using a Fourier transform infrared spectrometer (FTIR) and whole air sampling (WAS) canisters analyzed by gas chromatography (GC). Using photoacoustic extinctiometers (PAX) we measured EFs for scattering and absorption coefficients (EF Bscat, EF Babs, square meters per kilogram of peat burned) at 870 and 401 nm, the single-scattering albedo (SSA) at 870 and 401 nm, the absorption Ångström exponent (AAE), and EFs for black carbon (BC), etc. (Stockwell et al., 2016a). The filter samples provided EFs for elemental carbon (EC), organic carbon (OC), PM2.5, metals, water-soluble ions, and numerous organic aerosol constituents such as polycyclic aromatic hydrocarbons (PAHs) and tracers (Jayarathne et al., 2018). This work provided the first reasonably complete field measurements of the emissions from burning the peat component of authentic peatland fires and provided important updates for peat fire EFs, but it was limited to samples from one province under extreme drought conditions as revealed by the all-time record-high value of the Ocean Niño Index (ONI) during the sampling (2.6; https://origin.cpc.ncep.noaa.gov/products/analysis_monitoring/ensostuff/ONI_v5.php, last access: 26 April 2021).
Following our 2015 field study, another large-scale comprehensive lab experiment included Kalimantan peat fuel in 2016 (e.g., Selimovic et al., 2018; Koss et al., 2018), separate lab peat fire results were reported by Watson et al. (2019), and Smith et al. (2018) reported field measurements of a suite of trace gases emitted by Malaysian peat fires in 2015–2016.
To address the limited geographic range of tropical peat fire field measurements, in September–November 2019 we outfitted sampling teams with our most mobile sampling technique (WAS) to facilitate sampling across three provinces of Sumatra and a more remote area of Central Kalimantan than was sampled in 2015. Twenty-five fires burning just peat (i.e., no surface vegetation contribution) were successfully sampled under ONI-neutral conditions (0.3) at sites reflecting a large variety of land uses. In this paper we report the 2019 field results and compare them to the previous field results. We derive a more robust regional average set of tropical peat fire EFs based on our 2015 and 2019 field studies, literature EF for other field-sampled peat fires in peninsular Malaysia and Kalimantan, and a carefully selected subset of laboratory peat fires. We close by providing updated context and guidance for implementing EFs in atmospheric models.
2.1 Site descriptions
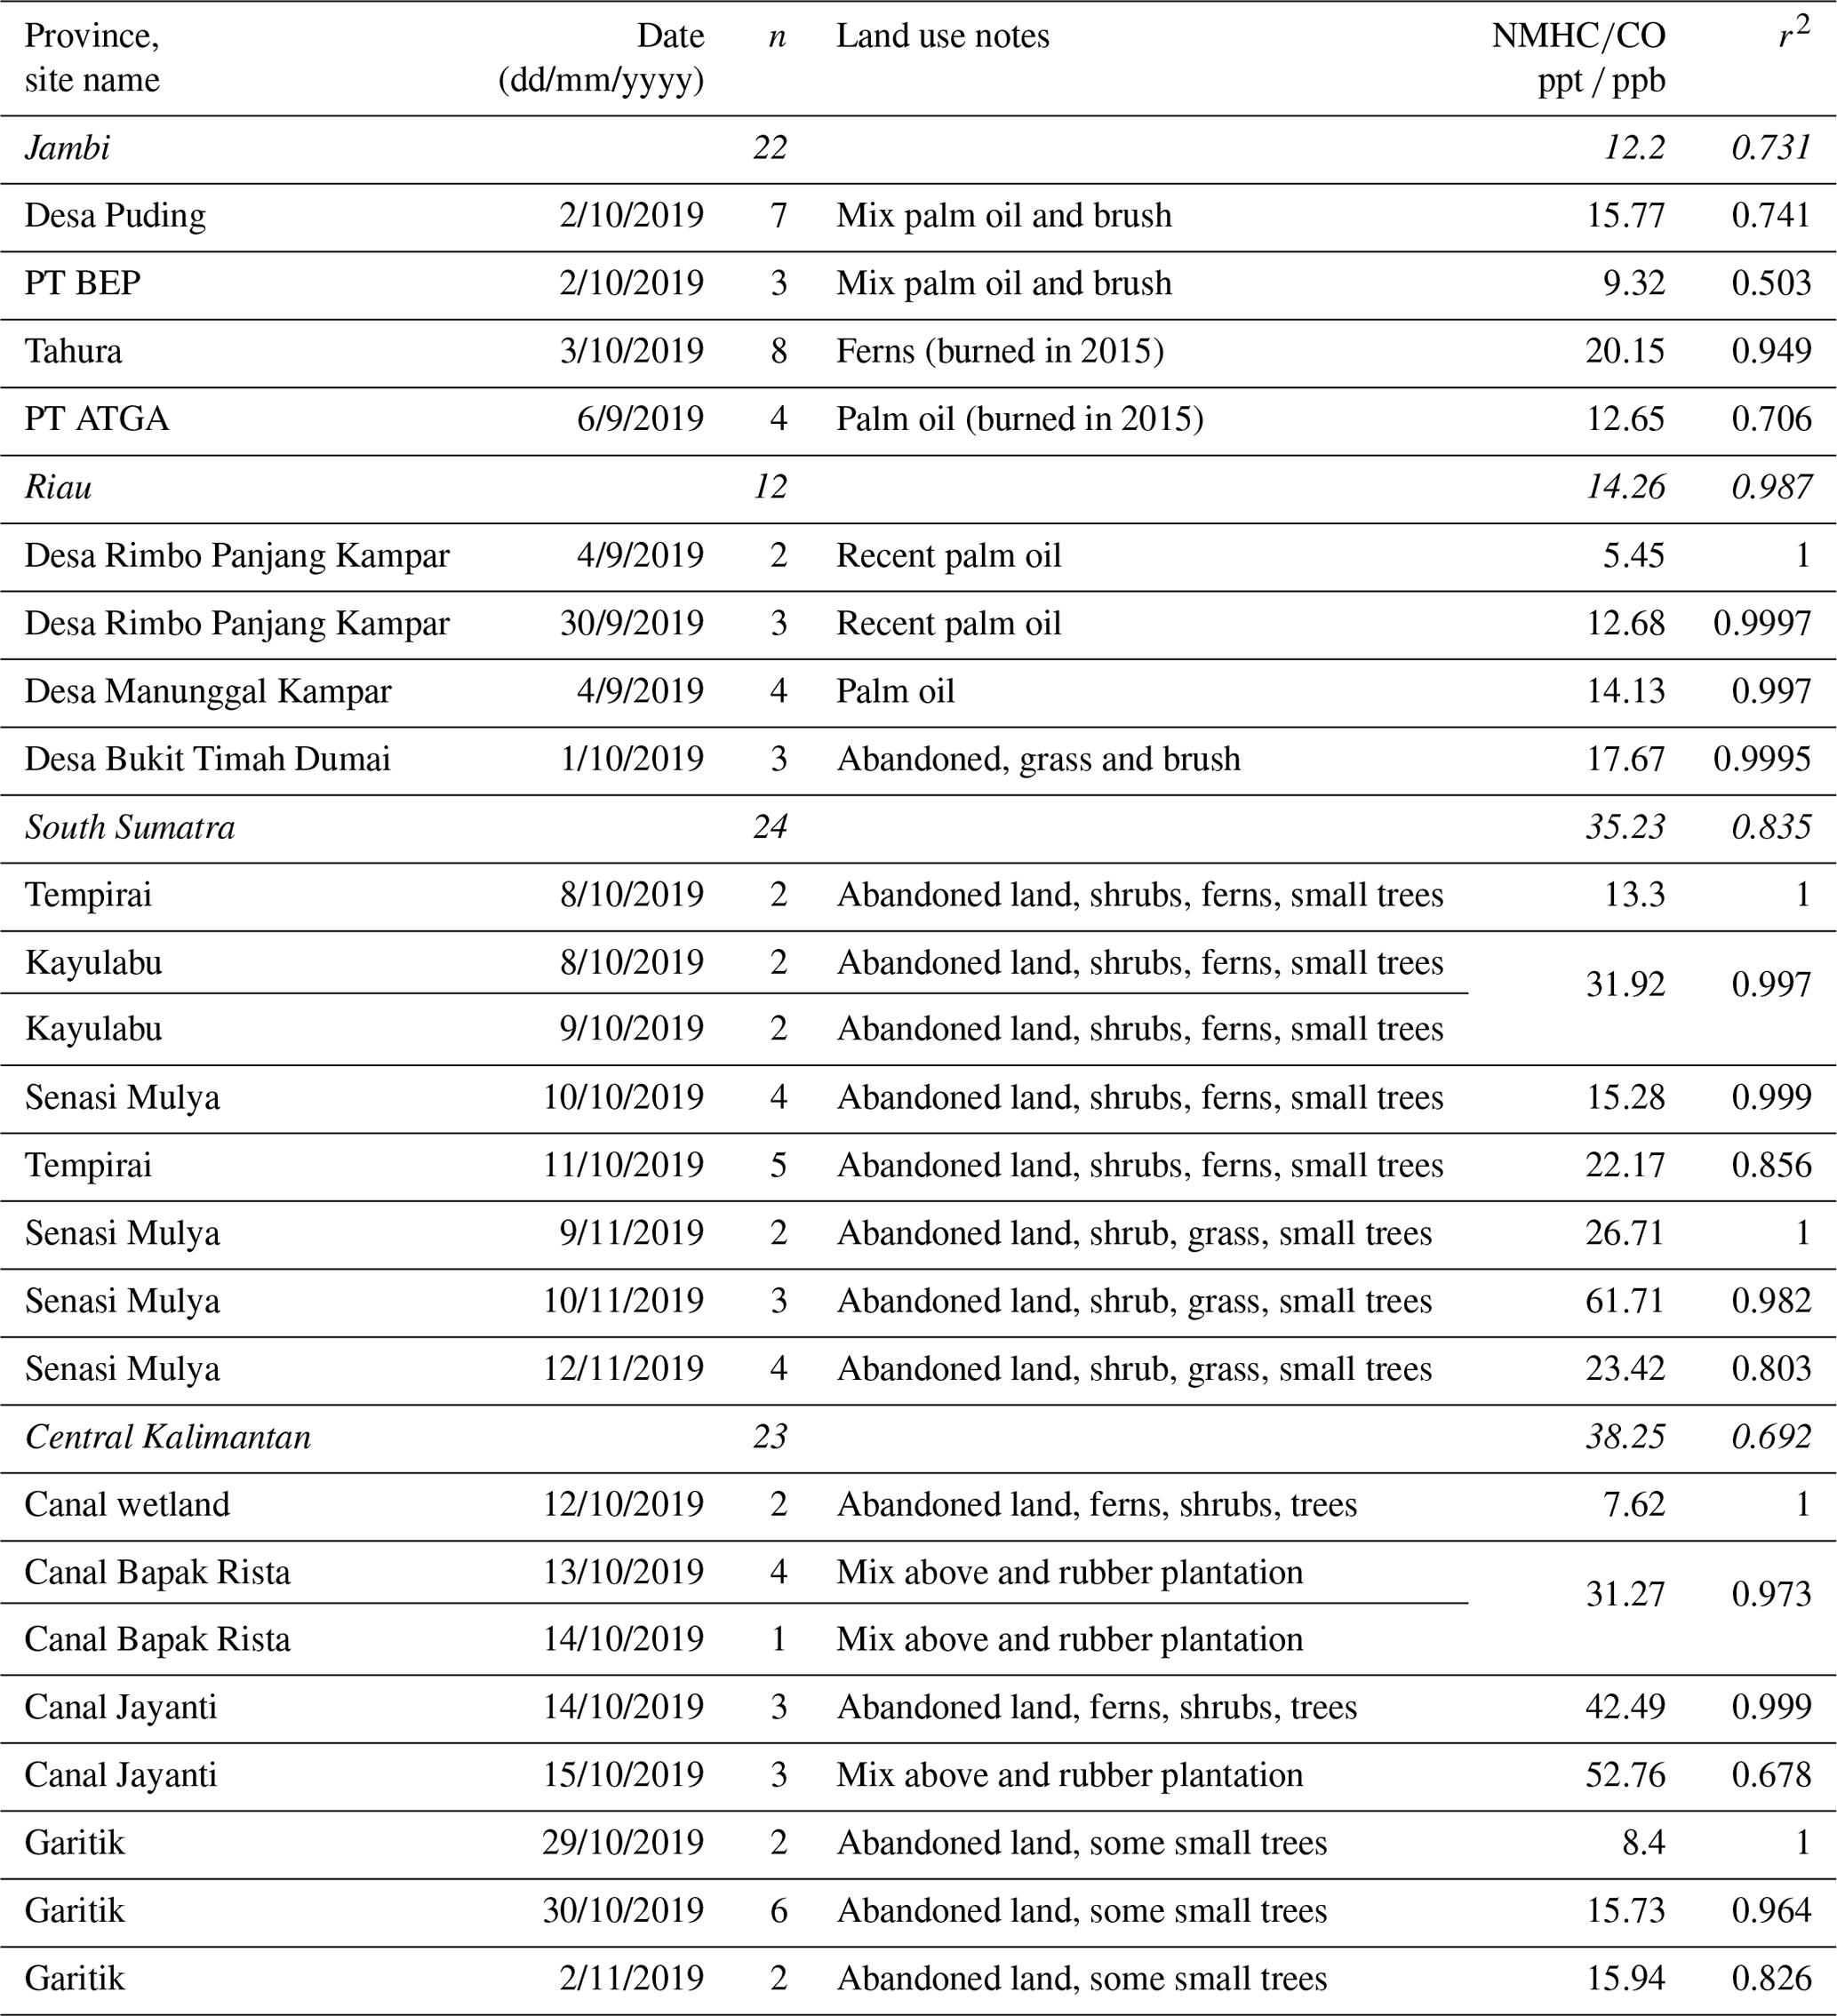
Peat is partially decayed organic matter that, in the tropics, historically most often accumulated in evergreen peat swamp forests (Page et al., 2002). Undisturbed it can be classified as fibric, hemic, or sapric as depth, degree of decomposition, and density all increase (Wüst et al., 2003). However most tropical peat fires now occur at sites disturbed by various types of agriculture, logging, dredging for canals, road building, and previous fires and also abandoned post-agriculture sites, making traditional classification schemes less applicable. Given this complex environment, we targeted sampling peat fires in as wide a variety of locations as possible. We sampled 25 fires over a 3-month period at sites with a variety of land use trajectories ranging from working rubber plantations to abandoned land dominated by shrubs, ferns, or second-growth forest. The map in Fig. 1 showcases the wide geographic distribution of the sampling sites in a regional context. The province, site name, date, number of samples, land use notes, and an emissions metric are shown in Table 1. More extensive site details including peat depth, geo-location, weather, etc. are found in Table S1 in the Supplement. Detailed maps, photos, and additional data and calculations are in the open-access project archive (https://tinyurl.com/yc6yhvx7, last access: 3 August 2022).

Figure 1Location of 2019 peat fire sampling sites.
Table 1Summary of sites and plumes sampled in 2019. The ratio is shown for each plume and also (in italics) based on a plot including all the samples in a province.
2.2 Instrument descriptions and calculations
All the instrumentation, sampling strategies, and calculations pertinent to this study have been described in full previously (Stockwell et al., 2016a; Jayarathne et al., 2018). Here we briefly summarize the WAS approach and EF calculations. We note that after the 2015 field study was published (Stockwell et al., 2016a), the nominal 405 nm wavelength in one PAX was measured more precisely to be 401 nm, which is updated in this work.
2.2.1 Whole air sampling (WAS) in canisters
Previously evacuated 2 L stainless steel canisters were opened and filled quickly to ambient pressure directly in peat fire smoke plumes or adjacent background air. The canisters were then closed and shipped to the University of California, Irvine for measurement of a large number of gases (Simpson et al., 2006). Species quantified included CO2, CO, CH4, and up to 100 non-methane organic gases (NMOGs) by gas chromatography (GC) coupled with flame ionization detection, electron capture detection, and quadrupole mass spectrometer detection as discussed in detail by Simpson et al. (2011). About 70 of the NMOGs are combustion products that were enhanced in the source plumes and reported here. CO2, CO, and CH4 data have an uncertainty of a few percent. The limit of detection for most NMOGs was ∼10 pptv (parts per trillion by volume) or better, usually several hundred times below the concentrations that were sampled. The precision and accuracy vary by compound or compound class and are reported in Simpson et al. (2011). Styrene is known to decay in canisters, and the styrene data should be taken as lower limits. Our sampling strategy purposely targeted sampling many fires to characterize variability rather than intensive characterization of fewer fires. One background sample upwind of the fire and one to three smoke samples in the plume were typical.
2.2.2 Emission ratio and emission factor determination
The samples from each province were treated as a group. Within each of the four groups, the molar emission ratio (ER; e.g., ΔXCO) for all the WAS species X relative to CO was calculated by linear regression. EFs were computed from the complete set of ERs, by the carbon mass balance method, which assumes all major carbon-containing emissions have been measured (Ward and Radke, 1993; Yokelson et al., 1996, 1999):
where FC is the carbon mass fraction of the fuel, MMx is the molar mass of species X, AMC is the atomic mass of carbon (12.01 g mol−1), NCj is the number of carbon atoms in species j, and ΔCj or ΔX referenced to ΔCO are the molar ERs for the respective species. We assumed an ash-free carbon fraction (0.579±0.025) measured earlier as the average of seven samples of Kalimantan peat (ALS Analytics, Tucson) (Stockwell et al., 2014). The ash-free carbon content corrects for the potential inclusion of non-flammable inorganic material (e.g., mineral soil) in peat samples. EFs are proportional to assumed carbon content, making future adjustments to EFs trivial if warranted based on additional carbon content measurements. The denominator of the last term in Eq. (1) estimates total carbon emissions, which we derived from summing the carbon in all the gases measured by WAS. Ignoring the carbon emissions not measurable by WAS (OC, BC, unmeasured NMOGs) likely inflates the EF estimates by less than ∼5 % (Yokelson et al., 2013; Stockwell et al., 2015).
The relative amount of smoldering and flaming combustion during a biomass fire is often estimated from the modified combustion efficiency (MCE). MCE is defined as the ratio and is mathematically equivalent to (Yokelson et al., 1996). In the case of peat fires, all the combustion is by what is often simply termed as smoldering combustion. However, in the analysis of these fires, it is worth considering that “smoldering” actually refers to a mix of distillation of volatiles, pyrolysis of biomass (producing mainly a large variety of NMOGs and organic aerosol), and gasification of char (producing mainly CH4, NH3, CO, CO2, H2, and little visible aerosol) (Yokelson et al., 1996, 1997). Nonetheless, MCE can still be used to explore variability, and MCE may vary with the ratio of glowing combustion to pyrolysis (Yokelson et al., 1997).
3.1 Trace gas emission factors measured in the field
In the 2015 fieldwork the FTIR provided the capability for essentially unlimited real-time or grab sampling. Between the FTIR and WAS a total of 333 grab samples were spread over 35 distinct plumes, and we calculated ERs and EFs for each plume/fire. In 2019 a total of 81 WAS canisters were used to sample fires in four provinces, limiting us to fewer samples per fire and leading us to explore consolidating the data by other factors. Each province was sampled by a dedicated team, and we found that grouping samples by province produced highly correlated ER plots with distinct province-to-province differences. To explore the impact of the analysis approach on study conclusions we used the ratio of total measured non-methane hydrocarbons (NMHCs) to CO since the NMHCs were the most variable major emission (vide infra). Table 1 shows the ratios from plots based on all the samples in a province and from plots based on just the samples in each plume. Provincial averages based on all the individual plumes were not statistically different from averages based on consolidated data. The study average and variability for the four provincial averages based on consolidated data (25±14, 1σ) was similar to the study average and variability computed based on all the individual plumes (22±15). No clear patterns emerged when consolidating samples by vegetation type or land use. For instance, some fern-covered abandoned land tended to have high ratios, but other nominally similar sites did not. Since our study focus was spatial and interannual variability, we opted to report EFs for each of the four provinces for the 2019 samples, but all our raw mixing ratios and explicit EF calculations are available in our open-access archive (https://tinyurl.com/yc6yhvx7, last access: 4 August 2022) should others wish to pursue additional analyses. Note that provincial averages based on more sampling or a detailed knowledge of the spatial and temporal distribution of fire uses/characteristics could be different in this highly complex environment. Table S2 presents the full set of MCEs and EFs calculated for 2019 alongside the Kalimantan field data from 2015 for the same species. Next, we describe the main features of the MCEs and EFs from the four provinces sampled in 2019 and compare them to the MCEs and EFs from 2015.
CH4 is the second-most important greenhouse gas emitted by peat fires after CO2. We plot EF CH4 versus MCE in Fig. 2 to provide a good overview of both regional peat fire CH4 emissions and the annual and interannual variability in MCE. In Fig. 2, the black symbols show the context from our 2015 fieldwork. MCE ranges from 0.693 to 0.835, and EF CH4 ranges from 3.7 to 22.8 g kg−1, averaging 9.51±4.74 g kg−1 (Stockwell et al., 2016a). Shown in green are additional EF CH4 values from previous sampling of 10 peat fire plumes in Malaysia in 2015–2016 by Smith et al. (2018). The Smith et al. (2018) samples have MCEs that overlap the upper two-thirds of the Stockwell et al. (2016a) samples. The Smith et al. (2018) EF CH4 values are within the Stockwell et al. (2016a) range except for one high value of 26 g kg−1, and they have a study average of 11±6 g kg−1, similar to the Stockwell et al. (2016a) study average. Hamada et al. (2013) and Wooster et al. (2018) each report MCE and EF CH4 data based on limited sampling of peat fires in Central Kalimantan in 2009 and 2015, respectively. We calculated MCE and EFs for pure peat fires from the data provided for location 5 in Wooster et al. (2018) as explained in detail elsewhere (https://doi.org/10.5194/acp-2022-211-AC1). The values from these studies also lie in the range reported by Stockwell et al. (2016a). Against this backdrop, our 2019 “provincial average EFs” are shown in red (Fig. 2). Our 2019 MCEs overlap the lower one-third of the Stockwell et al. (2016a) samples ranging from 0.687 to 0.736. The 2019 EF CH4 values are relatively tightly clustered around the average of 9.42±2.51 g kg−1. Thus, a picture emerges of highly variable CH4 emissions, but with a robust, reproducible average based on all field data of 9.8±3.3 g kg−1.
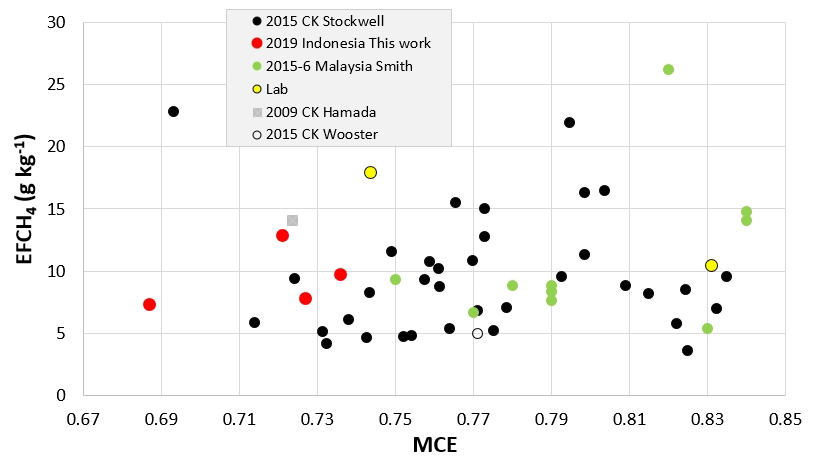
Figure 2The emission factor for CH4 (g kg−1) versus MCE for field studies sampling pure peat fires in the tropics and lab studies of pure tropical peat smoke that also included extensive NMOG data. “CK” indicates the Indonesian province Central Kalimantan. Black: Stockwell et al. (2016a); red: this work (provincial averages); green: Smith et al. (2018); gray: Hamada et al. (2013); unfilled circle: Wooster et al. (2018). Lab data (yellow) shown are from fire no. 55 in FIREX (MCE =0.831) and fire no. 114 in FLAME-4 (MCE =0.744). See text for additional details.
Next, we turn our attention to an overview of the NMOG emissions. Figure 3 shows a plot of the 2019 NMOG EFs from Central Kalimantan, South Sumatra, and Riau versus the 2019 NMOG EFs from Jambi, which had the lowest EFs. The division of the provinces into a high-NMOG-EF and low-NMOG-EF group is apparent. The Riau NMOG EFs were only slightly higher than Jambi (slope = 1.27, r2=0.932). In contrast, both South Sumatra (slope = 2.70, r2=0.936) and Central Kalimantan (slope = 2.77, r2=0.935) had NMOG EFs almost 3 times larger on average. The slopes are similar, but with lower r2 when restricting the analysis to EFs <0.3 g kg−1. Interestingly, the high and low provinces combine to generate 2019 study-average NMOG EFs that are only about 15 % higher than the 2015 study-average NMOG EFs in Stockwell et al. (2016a) (slope = 1.15, r2=0.829) across 57 co-measured species as shown in Fig. 4. Restricting the analysis to EFs <0.35 g kg−1 lowers the r2 to 0.7 and increases the slope to 1.6. Note that we have included highly variable sulfur compounds (see Sect. 3.2) in these plots. Overall, a picture emerges of highly variable emissions, but fairly stable regional averages as additional data become available. Finally, in Fig. 5, we compare the 2019 NMOG EFs from Central Kalimantan to the 2015 NMOG EFs from Central Kalimantan (slope = 1.63, r2=0.781). This gives some measure of the variability to be expected within the same province, but across different years with different drought conditions (ONI 2.6 in 2015 and 0.3 in 2019) and at different levels of disturbance since the 2019 samples were in a less disturbed, more remote section of the province accessible only by boat.

Figure 3NMOG EFs calculated from WAS measurements in 2019 plotted for three provinces versus Jambi province, which had the lowest EFs on average. Riau (blue) EFs are about 27 % larger than Jambi in this framework, and Central Kalimantan (gray) and South Sumatra (orange) EFs are about 2.7 times larger.
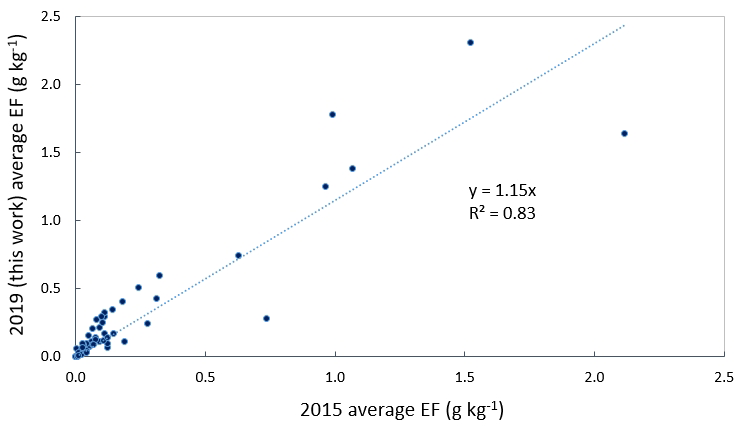
Figure 4The 2019 study-average NMOG EFs (this work, four provinces including Central Kalimantan) versus the 2015 study-average NMOG EFs measured by Stockwell et al. (2016a) in Central Kalimantan for the 57 species measured in both studies.
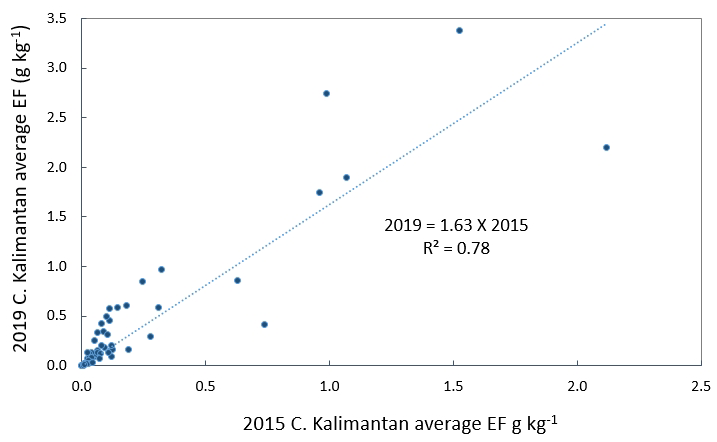
Figure 5NMOG EFs (g kg−1) measured in 2019 in Central Kalimantan (this work) versus NMOG EFs measured in Central Kalimantan in 2015 by Stockwell et al. (2016a).
3.2 Selection of representative lab data and discussion of trace gas EFs
Stockwell et al. (2016a) and others compared and synthesized data from previous lab and field studies and noted the large number of important NMOG data added by online mass spectrometry, which is so far only available in lab studies. With the enhanced knowledge of the range of emissions from real-world peat fires provided by 2009–2019 field measurements we can re-assess which laboratory peat fire data are most representative of authentic peat fires. Table S3 shows the EFs from the previously discussed fieldwork along with selected lab studies. In particular, the oldest study by Christian et al. (2003) stands out as being on the extreme upper edge of field-observed MCE, consistently having EFs higher by a factor of 2 or more for many compounds and relying on a single sample. An examination of old photos also reveals that the peat sample burned was more powdery than the samples in subsequent studies, perhaps due to shipping damage.
Eleven years after the Christian et al. (2003) study, nine peat fires were burned during the Fourth Fire Lab at Missoula Experiment (FLAME-4) in 2012 with more comprehensive emissions measurements provided by a large-scale multi-investigator team (Stockwell et al., 2014, 2015). Three fires each were burned in Canadian peat (nos. 69, 112, 124), North Carolina peat (nos. 61, 113, 150), and Indonesian (Kalimantan) peat (nos. 114, 125, 154). The six extratropical peat fires are of interest for characterizing extratropical peat fire emissions, but given the high variability in this source, we do not use them here to estimate tropical peat fire emissions, nor do we know of extratropical field-based emissions measurements that could help identify the best lab data for this purpose. Of the three fires that burned Indonesian peat one of these (no. 154) was a “room burn” optimized for certain lengthy aerosol experiments, but subject to significant unnatural trace gas losses (Stockwell et al., 2014). Of the two “stack burns” of Indonesian peat, one (no. 125) had an MCE of 0.872, well above the field range of 0.687–0.835 (this study; Stockwell et al., 2016a), perhaps due to over-drying the sample. This leaves just fire no. 114 (MCE 0.744) as ideal for representativeness and supplementing field data. Comprehensive trace gas emissions reported by Stockwell et al. (2015) for this fire are included in Table S3.
The 2016 large-scale Fire Influence on Regional and Global Environments Experiment (FIREX; https://csl.noaa.gov/projects/firex/firelab/, last access: 4 August 2022) Missoula fire lab component also included one stack burn of Indonesian peat (no. 55). This fire had an MCE (0.831) above our updated field-average MCE (0.76), but lower than four of the field fire MCEs. EFs from this fire reported in Selimovic et al. (2018) and Koss et al. (2018) are included in Table S3. Note the EFs from Koss et al. (2018) were scaled up by a factor 1.1394 to reflect the actual fuel carbon fraction (0.5697) rather than the originally assumed fraction (0.50). Figure 2 also shows the lab burns we have selected as representative in EFCH4 versus MCE space. Both lab fires fall within the field range, but fire no. 114 is near the top of the CH4 range, and fire no. 55 is near the top of the MCE range. The average EFs from these two lab fires appear to be reasonably representative, and the value of even a small increase in sample size is illustrated.
It is worth noting a subtle difference between lab fire sampling and field sampling. In the lab we measure the total emissions from about 1 kg of peat as it is burned over a 25–40 min period. The emissions can change dramatically over this time because the ratio of pyrolysis of biomass to gasification of char decreases as uncharred fuel in the limited sample becomes more scarce (Yokelson et al., 1997). This is illustrated in Fig. 6, where the molar ratio of methanol (a pyrolysis product) to methane (enhanced during gasification) decreases from near 0.3 to about 0.013 (a factor of ∼23) as fire no. 114 consumes a finite sample over 25 min. In contrast, in the field we acquire grab samples of a moving fire producing smoke in a mix of fuels at different points along a pyrolysis/gasification trajectory somewhat like that shown in Fig. 6. As expected, the methanol-to-methane molar ratio obtained by integrating over whole representative lab fires (0.11±0.04) is similar to the study-average methanol-to-methane molar ratios measured in the field (0.12±0.01), and both results are near the middle of the range shown in instantaneous values. An assumption we make in this work is that random grab sampling in the field captures the most representative emissions, but fire-integrated lab results can also be representative of real fires and used for species when no field data are available. In addition, the lab trajectory likely gives some insight into the high variability in field samples. For example, at the plume level Stockwell et al. (2016a) observed methanol-to-methane molar ratios of 0.127±0.071 (n=35).
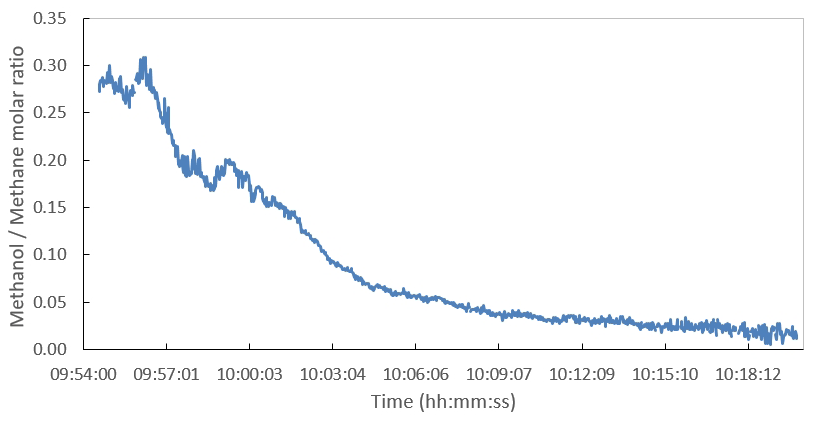
Figure 6Methanol is an indicator of pyrolysis of fresh fuel, while methane indicates gasification of charred fuel. The ratio of methanol to methane drops from near 0.3 to about 0.013 (a factor of ∼23) over 25 min while burning an approximately 1 kg sample of Kalimantan peat as fire no. 114 during FLAME-4 in 2012.
In light of the above discussion, in Table S3 we present an extensive set of field-average trace gas EFs for tropical peat fires based on sampling by FTIR and WAS at a wide variety of Southeast Asian sites (this work; Stockwell et al., 2016a; Smith et al., 2018). For CO2, CO, CH4, and MCE we also include data from Hamada et al. (2013) and Wooster et al. (2018) in the field average. Table S3 also presents lab-average EFs computed using FTIR and high-resolution proton-transfer-reaction time-of-flight mass spectrometry (PTR-TOF-MS) data from the two most representative lab fires identified above. The lab average is based on much less sampling than the field, but it significantly expands the number of measured species due to the broad sensitivity of the high-resolution mass spectrometry technique that was used in the lab. We note that plotting the lab-average EF versus the field-average EF for the ∼25 species measured in both settings shows good overall agreement (Fig. S1; slope = 1.13, r2=0.841). When methane and ammonia are excluded (both are gasification indicators), agreement between lab and field EFs improves further (slope = 1.04, r2=0.88). Next, we summarize the main features of our newly computed averages for tropical peat fire emissions.
The three largest trace gas EFs in our new field average are CO2 (1544±66 g kg−1), CO (315±49 g kg−1), and CH4 (9.8±3.3 g kg−1). These EFs are significantly different from the earlier set of trace gas EFs for tropical peat burning from a single laboratory peat fire (Christian et al., 2003) that were adopted in IPCC guidelines (Table 2.7 in IPCC, 2014). The reductions for the two main greenhouse gases are CO2 (−9 %) and CH4 (−53 %). The increase for CO is 50 %. Not to be overlooked as a major emission is H2, which is produced in similar amounts to CH4 on a molar basis. Not including nitrogen-containing species, which are discussed separately, but including both lab and field data, the next largest EFs after CH4 are (g kg−1): acetic acid (4.45), methanol (2.48), ethane (2.00), ethene (1.50), acetaldehyde (1.50), propane (1.38), benzene (1.30), and propene (1.23). When both a field and lab average are available for the same species, we have preferred the field-average values for hydrocarbons measured by WAS and all species measured by FTIR, where the latter accounted for much more sampling. In general, we prefer the lab value for oxygenated VOCs measured only by WAS in the field (acetaldehyde in the list above) because of relatively high uncertainty for WAS oxygenated VOCs (Simpson et al., 2011) and for the species where no field data are available. Compared to other biomass fuels, the dominance of acetic acid and the ranking of ethane above ethene stand out for peat fires (Akagi et al., 2011; Andreae, 2019), where the latter observation is consistent with relatively high alkane emissions in general from semi-fossilized biomass. The glycolaldehyde-to-acetic-acid ratio was <3 % for peat, about a factor of 10 lower than usual for other biomass fuels, and the peat fire glyoxal emissions were also low, likely due in both cases to the low cellulose content of peat (Richards, 1987). For glyoxal only, we replaced the Koss et al. (2018) data with the data from a specific spectroscopic technique that also used a shorter sample line (Zarzana et al., 2018). Other acids emitted include isocyanic acid (HNCO; 0.574 g kg−1), formic acid (0.430 g kg−1), nitrous acid (HONO; 0.208 g kg−1), and methylbenzoic acid (0.127 g kg−1). Comparing the sum of methylglyoxal plus acrylic acid measured by Koss et al. (2018) to the specific methylglyoxal measured by Zarzana et al. (2018) suggests that acrylic acid accounts for about one-third of the signal at that exact mass and has an EF of 0.0537 g kg−1 with a remaining 0.106 g kg−1 due to methylglyoxal.
The lab-average column in Table S3 includes data for 25 g kg−1 of NMOG not measured in the field, of which 7.83 g kg−1 is a reasonable estimate of the amount of detected, but unassigned (unknown) NMOG mass. The unknown NMOG mass is primarily high-molecular-mass oxygenated VOCs (Stockwell et al., 2015; Hatch et al., 2015, 2017; Koss et al., 2018), and it accounts for roughly 14 % of the total NMOG mass. Listing NMOG species in order of increasing mass in Table S3 facilitates compound location since there are often multiple common names. In addition, this format simplifies determining the most abundant isomers when they are not resolved by the mass spectrometers in the lab studies but are measured by GC in the WAS field samples. While not a direct comparison, reasonable agreement is seen for the mass total and sum of isomers at, for example, C4H8 ( 56, butenes), C5H10 ( 70, mainly pentenes and methyl butenes), C8H10 ( 106, ethylbenzene and xylenes), and C9H12 ( 120, C9 aromatics). In contrast, the mass total is significantly larger at C4H6 ( 54, butadienes), C5H8 ( 68, isoprene and pentadienes), and C10H16 ( 136, monoterpenes). When agreement is poor it may be due largely to the presence of unmeasured isomers. A more direct, more in-depth analysis of isomer speciation addressing over 500 compounds measured by two-dimensional GC is presented for peat fire smoke and other types of biomass burning in Hatch et al. (2015, 2017). Contributing isomers for the PTR-TOF-MS data we show in Table S3 were also characterized using GC-PTR-TOF-MS by Koss et al. (2018).
Turning to nitrogen species, ammonia (NH3 5.34 g kg−1) and hydrogen cyanide (HCN; 4.77 g kg−1) are by far the two major emissions based on field data. The lower EF NH3 in the lab average (1.81 g kg−1) is the largest lab–field difference for any major species. The lab data are based on open-path FTIR, while the larger field values are based on open-path FTIR or specially coated closed-cell FTIR (Stockwell et al., 2016a; Yokelson et al., 2003). Thus, the discrepancy is probably the small sample size in the lab average since the largest reported EF NH3 in the literature is the Christian et al. (2003) lab sample, and including it in the lab average would raise it to 7.85±10.46 g kg−1. The molar ratios of HCN or acetonitrile to CO have important applications as biomass burning (BB) tracers and these ratios (0.0162 and 0.00165, respectively) are higher for peat combustion than other types of BB (Crounse et al., 2009; Akagi et al., 2011; Coggon et al., 2016). Acetonitrile has only been measured in the lab for peat fires to date. The lab data also add EFs for many less abundant nitriles, amines, imines, etc. Acetamide is important as an air toxic and a precursor to another air toxic (isocyanic acid, HNCO; Roberts et al., 2011). Stockwell et al. (2016a) discussed the high acetamide emissions measured in FLAME-4 (4.2 g kg−1) and acetamide atmospheric chemistry in some detail. Recent work on amide atmospheric chemistry is described elsewhere (Zuo et al., 2021; Ni et al., 2021). Adding the FIREX lab data lowers the peat fire acetamide average EF to 2.25 g kg−1. The lower FIREX value is likely more accurate based on improved calibration, but part of the difference likely reflects the lower fuel N in FIREX than FLAME-4, 1.57 % and 2.57 %, respectively. In any case, emissions of acetamide from peat and organic soil fires appear to be much larger than from burning aboveground biomass fuels (Permar et al., 2021; Yokelson et al., 2013), and future field measurements of this compound, potentially incorporating additional techniques, would be valuable.
The largest EF for a sulfur compound was measured by FTIR for SO2 (3.42 g kg−1) in the FIREX lab fire. This observation used an isolated, but weak infrared SO2 band and had a low signal-to-noise ratio, suggesting an uncertainty of at least 50 % (Selimovic et al., 2018). SO2 was not detected by FTIR in the extensive 2015 Central Kalimantan field sampling and only detected by FTIR in one sample of North Carolina, coastal, temperate peat out of the nine global peat samples burned in FLAME-4 (Stockwell et al., 2015) but was emitted at high levels (4.26 g kg−1) in that fire. Apparently, SO2 is occasionally a major emission from peat, likely traced to fuel S variability. Another major sulfur-containing emission measured during the FIREX lab fire was H2S with an EF of 0.254 g kg−1. Both carbonyl sulfide (OCS; 0.14 g kg−1) and dimethyl sulfide (DMS; 0.03 g kg−1) were consistently emitted by peat fires based on WAS field measurements. The South Sumatra average EFs for these two species were more than twice the overall 2015–2019 field averages, with the South Sumatra EF for OCS even larger than the lab EF H2S at 0.356 g kg−1. Within South Sumatra the sum of OCS and DMS ratioed to CO (, ppt ppb) varied by a factor of 6 (0.18–1.16) among sites in the province. Variability was high within all three villages sampled and almost a factor of 4 at Senasi Mulya (0.298–1.16). Large-scale influences on soil S likely include volcanoes and marine sediments (Gras et al., 1999), while fine-scale variability could result from the application of agricultural chemicals or manipulation during canal or road building. was correlated with (r2=0.88), suggesting that combustion chemistry also influenced the variability. FLAME-4 and FIREX both reported methanethiol (0.04 g kg−1), and thiophene and methyl thiophene (both ∼0.03 g kg−1) were also observed in FIREX. These three additional lab EFs for sulfur compounds are similar to DMS in magnitude.
Singly substituted, halogenated methane compounds measured in the field consistently had fairly reproducible EFs, with chloromethane (0.157±0.014 g kg−1) about a factor of 10 higher than iodomethane (0.0157 g kg−1) and bromomethane (0.0139 g kg−1). The sum of field-measured EFs for S compounds was well correlated with chloromethane (slope = 0.89, r2=0.82) when excluding South Sumatra, potentially implicating a link to the use of agricultural chemicals. The observed ΣS chloromethane mass ratio in South Sumatra was higher at ∼2.7, and including it in the above analysis reduced r2 to 0.13. This is consistent with a large, additional, non-agricultural sulfur source in South Sumatra.
Air toxics in peat smoke and some exposure and risk estimates for the 2015 fire season in Palangka Raya were discussed at length in Stockwell et al. (2016a). Here we simply list seven of the major gas-phase hazardous air pollutants (HAPs) that are emitted by peat fires: HCN (4.77 g kg−1), formaldehyde (0.818 g kg−1), benzene (1.30 g kg−1), 1,3-butadiene (0.151 g kg−1), acrolein (0.31 g kg−1), acetamide (2.25 g kg−1), and HNCO (0.574 g kg−1). The latter three are based on lab data, and a mass spectrometry deployment in the field would be useful for a better assessment. Interpreting BB HAP emissions in light of recommended exposure limits is also discussed elsewhere (Akagi et al., 2014; O'Dell et al., 2020).
3.3 PM2.5 size distribution, emission factors, chemistry, aging, and optical properties
In this section we compare the available representative gravimetric measurements of EF PM2.5 for tropical peat burning; summarize a few key physical and chemical features, optical properties, and aging results; and provide references for further details. We compare only gravimetrically measured EFs because uncertainty in density and the size-dependent mass scattering efficiency impacts the other available PM emissions estimates that are based on light scattering. Even a gravimetrically calibrated, light-scattering PM measurement can be impacted by size distribution changes at the fire source or with smoke aging (Akagi et al., 2012; Carrico et al., 2016; Kleinman et al., 2020). Carrico et al. (2016) show a typical fresh peat smoke size distribution from FLAME-4 in their Fig. 3d with peak diameter near 100 nm, much smaller than the dust often used to calibrate light-scattering instruments. Figure 4 in Carrico et al. (2016) shows the initial smoke size distribution evolving from a peak diameter of 95 nm to a peak of 60 nm over ∼15 min during lab peat fire no. 125 in FLAME-4. At the same time the methanol-to-methane molar ratio measured by FTIR decreased by a factor of 3, indicating a decrease in the pyrolysis-to-gasification ratio (Stockwell et al., 2014). The decrease in pyrolysis/gasification likely contributes to the emission of smaller, less scattering particles as also implied for another typical BB fuel in Fig. 5 of Carrico et al. (2016). It is unclear if size changes could impact suggestions that PM mass emissions change with peat fire age in the field (Roulsten et al., 2018). It is also unclear if any fire-age dependence of PM mass emissions could bias random sampling in the field or how to determine fire age operationally. The concept of fire age has limitations when applied to a field fire moving into fresh fuels. A final remark on size is that the small size of peat smoke particles, along with their low solubility (vide infra), would tend to reduce their efficiency as cloud condensation nuclei (Carrico et al., 2016; Chen et al., 2017). Of the many biomass fuel types burned during FLAME-4, peat was the only fuel that produced no detectable ice-nucleating particles (Levin et al., 2016).
In Fig. 7 we compare gravimetric measurements of EF PM2.5 versus MCE from the extensive field measurements of Jayarathne et al. (2018) and the fire-integrated lab measurements from FLAME-4 (fire no. 114; Jayarathne et al., 2014), Christian et al. (2003), and Watson et al. (2019). The Watson et al. (2019) average EF PM2.5 for four lab peat fires is 22.6±3.1 g kg−1. The other two lab fires included are more variable at 6 g kg−1 (Christian et al., 2003) and 38 g kg−1 (Jayarathne et al., 2014), but they average to 22 g kg−1. All the lab data taken together average 22.4±10.4 g kg−1. This is ∼30 % higher than the more extensive field average of 17.3±5.8 g kg−1 (Jayarathne et al., 2018). While this difference is not statistically significant, somewhat lower “real” EF in the field could occur from decreased partitioning of organic gases to organic aerosol (increased evaporation) at the higher field temperatures (33–37 ∘C field versus ∼ 15–20 ∘C lab) (May et al., 2013; Selimovic et al., 2019, 2020). Wooster et al., (2018) reported a gravimetrically calibrated optical field measurement of EF PM2.5 for their peat-only location near 12.5 g kg−1, which is also below the lab average.
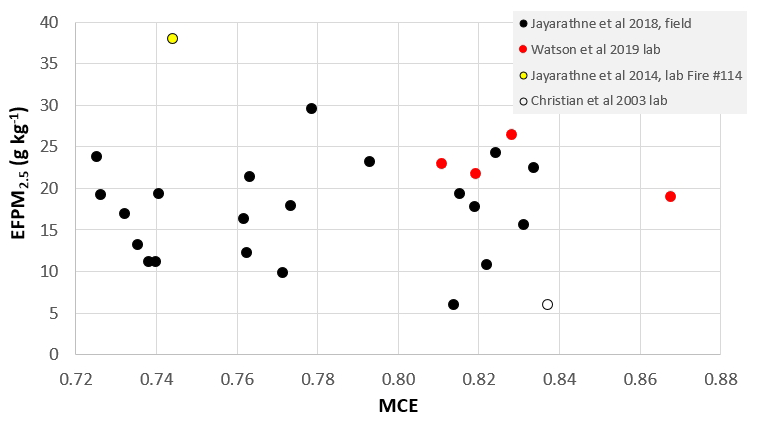
Figure 7Gravimetric determination of EFPM2.5 versus MCE for tropical peat fires. See text for details.
Extensive chemical analysis of tropical peat fire PM2.5 is provided for the field measurements of Jayarathne et al. (2018). Extensive chemical analysis of laboratory tropical peat fire PM2.5 is presented in Jen et al. (2019; FIREX fire no. 55) and Watson et al. (2019). Detailed chemical analysis of lab tropical peat fire PM10 is presented in Iinuma et al. (2007). Here we summarize the main features. Peat fire PM2.5 is mainly organic and insoluble. Jayarathne et al. (2018) found that organic carbon (OC) alone accounted for 72±11 % of PM2.5 mass (EF OC ∼12.5 g kg−1), with only 16 % of OC being water-soluble (WSOC). The low WSOC is consistent with high alkane content and low sugar content (Jayarathne et al., 2018; Jen et al., 2019; Iinuma et al., 2007). The field-measured ratio of organic aerosol (OA) to OC was 1.26±0.04, which is lower than for other types of fresh BB aerosol (1.4–1.8) due to the semi-fossilized peat fuel and resulting water-insoluble, aliphatic-rich OC (Jayarathne et al., 2018).
Thermal-optically measured elemental carbon (EC) was 1.1±0.5 % of PM2.5 mass (∼0.19 g kg−1), with low EC expected for smoldering combustion (Jayarathne et al., 2018; Christian et al., 2003; Selimovic et al., 2018). Even lower optically equivalent black carbon (BC; Li et al., 2019; Bond and Bergstrom, 2006; Subramanian et al., 2007) emissions were reported based on photoacoustic field measurements at 870 nm by Stockwell et al. (2016a). They reported EF BC of 0.0055±0.0016 g kg−1 (n=7) and an approximate OC-to-BC ratio of ∼2900. The photoacoustic lab measurement of EF BC for Kalimantan peat (fire no. 55) by Selimovic et al. (2018) was also low, at 0.0026 g kg−1 (n=1). Combining these photoacoustic measurements gives an EF BC of 0.0052±0.0018 g kg−1 (n=8). Even this relatively low photoacoustically determined EF BC could be an overestimate due to partitioning-driven coating formation on soot entrained from the background (Li et al., 2019; May et al., 2013) or the weakly absorbing microscopic charcoal particles that can naturally occur in smoke plumes even without flaming (Han et al., 2007, 2010).
Water-soluble ions and metals account for a small fraction of PM2.5 mass (Jayarathne et al., 2018; Iinuma et al., 2007; Watson et al., 2019). The dominant water-soluble ions measured in the field by Jayarathne et al. (2018) as milligrams per gram of PM2.5 were ammonium (5.1), chloride (4.2), and sulfate (1.4). Metals are often used as tracers in PM source apportionment studies (e.g., Khanum et al., 2021), and 15 metals were quantified in peat fire smoke in the field by Jayarathne et al. (2018), with these metals accounting for <0.15 % of PM2.5 mass. The dominant metals in the peat smoke field data were (reported as milligrams per gram of PM2.5) Cu (0.74), Zn (0.40), and Fe (0.27). These same three metals are of interest for their major role in important neurodegenerative diseases (Ben-Shushan et al., 2021), and other studies have linked BB smoke metals to neurological hazards (Scieszka et al., 2021). Ocean fertilization via deposition of soluble aerosol Fe from dust and combustion can impact ocean productivity and in some cases may promote deep-ocean C sequestration that tends to offset GHG emissions (Coale et al., 1996; Conway et al., 2019; Ito et al., 2021; Winckler et al., 2016). Pyrogenic aerosol Fe (from smelting, BB and fossil fuel combustion, etc.) contributes to oceanic dissolved Fe depending on initial aerosol Fe concentration and oxidation state as well as co-emitted gases and aging in complex ways (Chen et al., 2012; Ito et al., 2021). Pyrogenic Fe was found to account for the large majority of deposited and dissolved Fe in Indonesia and other areas of the Southern Hemisphere (Conway et al., 2019; Ito et al., 2019). Studies targeting Australia, Siberia, the Bay of Bengal, and other locations have suggested that BB alone (in particular, large fire episodes) can be a major regional source of ocean-dissolved Fe (Ito et al., 2020; Ito, 2011; Bikkina and Sarin, 2013). The data we present on peat smoke iron content and co-emitted gases could inform future assessments. For instance, our measured Fe mass fraction in peat smoke aerosol (; Jayarathne et al., 2018) is near the low end of the range previously assumed for biomass burning ( to ) (Ito et al., 2021) or typical BB average values (; Luo et al., 2008; Yamasoe et al., 2000). Our data suggest that about 1.6 Gg of total Fe was emitted by Indonesian peat fires in 2015 (Jayarathne et al., 2018). It is possible that the large spatial and temporal variability in BB emissions could provide some constraints on its ocean impacts, perhaps partly via satellite-based chlorophyll retrievals (Graham et al., 2015). Data for many metals and other PM2.5 constituents are also available for lab peat fires in Table S6 of Watson et al. (2019). Jayarathne et al. (2018) also reported and discussed field-measured values for a large suite of PAHs, alkanes, selected sugars, lignin decomposition products, and sterols.
Ahern et al. (2019) aged tropical peat fire smoke in dual smog chambers during FLAME-4, and Watson et al. (2019) aged tropical peat fire smoke in an oxidative flow reactor. Both studies reported insignificant net mass gain resulted from the combined effects of secondary organic aerosol formation and primary organic aerosol evaporation. However, Chen et al. (2018) reported that the formation of secondary organic aerosol in peatland fire smoke did increase the degree of oxygenation and promote hygroscopicity, and they reviewed related literature.
Stockwell et al. (2016a) performed real-time co-sampling of seven Central Kalimantan peat fires with FTIR and PAX to measure and scale PM1.0 optical properties. They reported the SSA and EFs for absorption and scattering at 870 and 401 nm and the AAE. Liu et al. (2014) reported the SSA at 781, 532, and 405 nm and the AAE for the representative FLAME-4 lab fire no. 114. For the same lab fire, Pokhrel et al. (2016) reported the SSA at 660, 532, and 405 nm and the AAE. In Fig. 8a we plot the field and lab data for initial peat-smoke SSA versus MCE. Consistent with low BC emissions, the near-IR and visible SSA is always close to one regardless of wavelength or MCE, with an average visible initial SSA that is based on all the lab and field data of 0.998 at the field-average MCE of 0.76. The measurements of peat smoke optical properties cited above were made on dried aerosol. We are not aware of measurements of particle growth and scattering increases at high humidity for pure peat smoke (f(RH); Gras et al., 1999), but the growth may be small for pure, fresh peat smoke due to the above-mentioned low hygroscopicity.
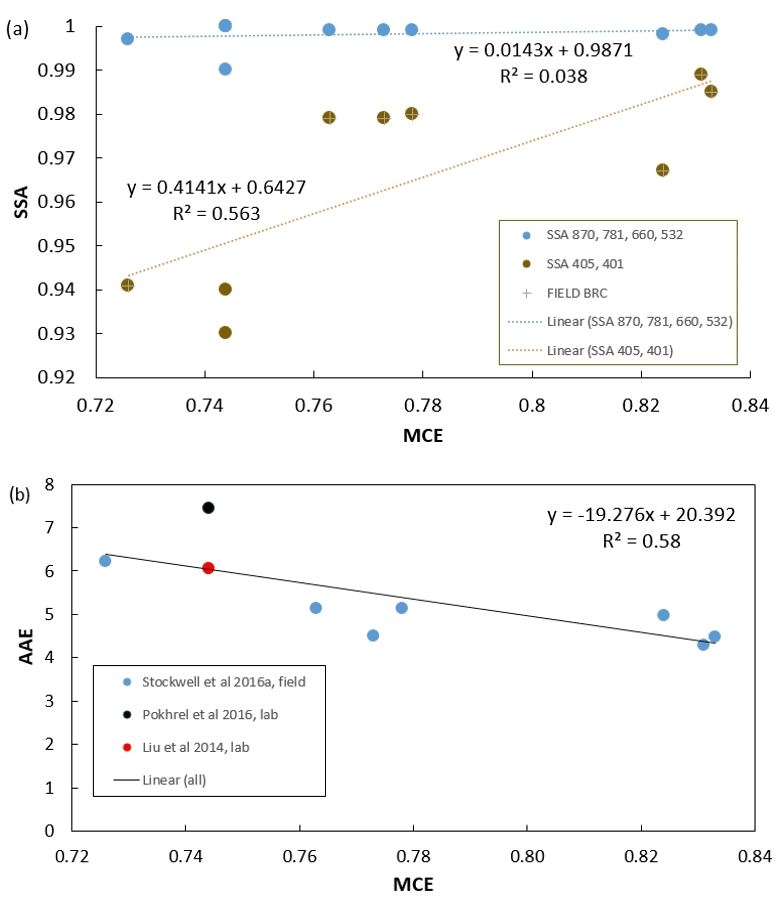
Figure 8(a) SSA versus MCE measured in the range 870–532 nm (blue). The lab data in this wavelength range (Liu et al., 2014; Pokhrel et al., 2016) are at MCE 0.744, and a value of one is reported in three cases. SSA versus MCE measured at 405 or 401 nm (brown). + indicates field data from Stockwell et al. (2016a). The visible through near-IR SSA near one is consistent with extremely small BC content. More UV absorption by BrC is seen at lower MCE. (b) The AAE versus MCE with the equation used to calculate an average peat fire AAE at the field-average MCE of 0.76.
During late October 1997, as part of the Pacific Atmospheric Chemistry Experiment 5 (PACE-5) campaign, airborne sampling of peatland fire smoke/regional haze was conducted in coastal South Kalimantan during an intense El Niño event (Sawa et al., 1999; Stockwell et al., 2016a). Gras et al. (1999) estimated the SSA for the 1997 Kalimantan regional smoke as 0.98, which implies a modest contribution from non-peat BB fuels since they tend to burn with more flaming and BC emissions and lower SSA (0.7–0.96; Christian et al., 2003; Reid et al., 2005; Liu et al., 2014; Pokhrel et al., 2016; Selimovic et al., 2018). During the 2015 intense El Niño event Eck et al. (2019) measured a visible SSA of 0.975 for the Palangka Raya AERONET site in Central Kalimantan that was inundated with fairly fresh smoke and estimated that 80 %–85 % of regional smoke was from burning peat. For source apportionment purposes it should be kept in mind that several hours of smoke aging usually increases the SSA (Abel et al., 2003; Yokelson et al., 2009; Kleinman et al., 2020).
In contrast to the minimally varying fresh peat smoke visible SSA, Fig. 8a also shows that the SSA at 405 or 401 nm has an MCE dependence, a finding consistent with the previously noted tendency for higher emissions of brown carbon (BrC) at lower MCE (Liu et al., 2014; Selimovic et al., 2018). Based on a fit of all the lab (n=2) and field (n=7) measurements, the 405–401 nm SSA is 0.958 at the field-average MCE (0.76) for tropical peat fires. In Fig. 8b, a similar analysis suggests an AAE of 5.7 at the field-average MCE. This AAE indicates that about 97 % of absorption at 401–405 nm is due to brown carbon (Lack and Langridge, 2013). Field measurements of BB smoke have usually reported AAE decreases over the course of hours to days (Selimovic et al., 2020, and references therein).
3.4 Context and guidance for using peat fire emission factors
Peat and peatland are not the same thing. Peat is only one component of the total peatland biomass fuel, but it is often the largest component, especially as the dry season progresses, and the water table drops. Carbon-14 analysis of PM that impacted Singapore during the 2015 El Niño suggested that 85 % of PM was due to burning “ancient” peat (Wiggins et al., 2018), in good agreement with the Kalimantan SSA-based estimate of the peat fraction of regional biomass fuel consumption by Eck et al. (2019) mentioned above and the estimate of ∼83 % by Kaiser et al. (2016). The EFs and optical properties in this study are for the initial emissions from burning tropical peat. EFs, fuel consumption, and other properties for burning the other co-located, “aboveground” biomass fuels can be found elsewhere (Reid et al., 2005; Akagi et al., 2011; Liu et al., 2014; Pokhrel et al., 2016; Stockwell et al., 2016b; Andreae 2019; Volkova et al., 2021). Extensive data are available for some aboveground fuels (e.g., tropical forest and crop residue fires), but smoke characteristics for some other aboveground fuels are not measured yet (e.g., ferns). The combined emissions from burning both peat and aboveground fuels have been measured, but only for a few fires and just four species (Wooster et al., 2018). Note that land use/cover can change quickly in the tropics (Miettinen et al., 2016). Next, we discuss some complications and uncertainties regarding the use of the peat fire EFs in this study.
In a bottom-up approach EFs are multiplied by a total fuel consumption to generate total emissions for a desired region and time (Seiler and Crutzen, 1980). The mass of fuel consumed for peat is most often estimated from area burned multiplied by depth burned multiplied by peat bulk density. Estimated this way, mass burned can be directly paired with EFs (g kg−1) to calculate total emissions. Our 2019 emissions measurements, synthesized with other work, enable more robust and comprehensive regional average EFs to be calculated for burning peat. However, it should be kept in mind that for a single fire or group of fires burning peat, EFs could commonly vary by at least 5 % for CO2, 20 % for CO, 25 % for CH4, a factor of 3 for NMOGs and PM, and more for sulfur compounds.
Burned areas, especially small burned areas in SE Asia, are known to be difficult to detect due to high regional cloud cover; orbital gaps; rapid growth of new vegetation, which is strongly associated with shallow burn depth (Cypert, 1961; Kotze, 2013); and other factors (Atwood et al., 2016; Liu et al., 2020; Reddington et al., 2016; Reid et al., 2013; Vetrita et al., 2021). An additional complication with peat fires is that the peat, if present, does not ignite everywhere that the surface fire burns (Graham et al., 2022). Typically, fine (small diameter, e.g., litter, grass) aboveground fuels must burn to ignite medium aboveground fuels, which then ignite the heavy aboveground fuels (e.g., logs) that can sustain combustion long enough to initiate a sustainable peat fire. Land cover types prone to surface fires that include burning large fuels anecdotally seem more likely to ignite peat, but this has not been studied quantitatively to our knowledge. In any case, a fire's total area is almost always significantly larger than the underlying peat fire area. To some extent, the underestimate of surface fires can cancel the error associated with assuming the peat ignites under the whole surface fire area. Synthetic aperture radar (SAR) can detect areas of burned peatland if the surface is dry, even under clouds or thick smoke, and has potential to improve estimates of peat burned (Vetrita et al., 2021).
Depth burned is typically highly variable across any peat fire and hard to measure (Ballhorn et al., 2009). Depth burned tends to increase strongly with months into the dry season as drought causes the water table to drop (Shawki et al., 2017; Sinclair et al., 2020; Graham et al., 2022). For instance, Graham et al. (2022) observed 7 times greater peat burn depth in September than in August as the dry season progressed. Depth burned tends to decrease when successive fires burn in the same location (Konecny et al., 2016). Average burn depths are normally reported as an average for the peat fire area and in theory should not be applied to the whole surface fire area. However, using too large a depth and/or applying it to too large an area may cancel the tendency to underestimate surface fire area. Finally, much of the peat may burn well after the combustion of the surface fuels that leads to a fire detection is complete. Peat fires progress as glowing fronts that spread slowly laterally and downward; i.e., depth increases with time since ignition at a given point. Tropical peat has been reported to burn for up to 20 d at a site (Roulston et al., 2018), long after the surface vegetation was consumed. The duration of peat consumption can vary with fuel moisture, wind, etc. The bulk density of peat can vary from 0.08 to 0.16 g cm−2 and was found to be higher for areas that burn more often, which offsets the finding that these previously burned areas also tended to burn less deep (Sinclair et al., 2020). In light of the above discussion, we note that studies by Kiely et al. (2019, 2020) assume a peat fire to surface fire area of 40 % and find improved model performance when assuming burn depth scales with soil moisture, as is also done in van der Werf et al. (2010).
Top-down approaches typically involve, as one example, estimating a flux of smoke PM using modeled meteorological fields, assumed plume rise, and a remotely sensed surrogate for PM (e.g., aerosol optical depth, AOD) and then computing the ratio of PM produced to remotely sensed fire radiative power (FRP) to derive emission coefficients (ECs) that can be applied to hotspots without knowledge of fuel consumption (Lu et al., 2019). Alternatively, FRP may be used to infer mass consumption of fuel and obtain emissions of interest using EFs. When ECs cannot be measured for a species they can be estimated from EF ratios. Sources of uncertainty include missing hotspots (especially problematic for peat combustion) and/or missing smoke due to clouds, cloud mask, orbital gaps, and small or thin plumes; uncertain wind speed; and evolving or uncertain ratios between ECs or EFs or of PM to AOD or gases (Lu et al., 2021; Shi et al., 2019; Wooster et al., 2021). In summary, depending on the bottom-up or top-down approach employed, missed fires, unknown fuels, and other issues can be important, but the larger, more robust suite of EFs for trace gases and PM2.5 we present here should help reduce overall uncertainty.
With the completion of this study, authentic “fires of opportunity” burning in Southeast Asian tropical peat deposits have now been sampled in the field over a broad range of climate conditions and geographic locations. Combined with earlier field sampling of burning peat in SE Asia, we now have more robust field-based knowledge of the average emissions and the natural variability for EF PM2.5 (17.3±5.8 g kg−1), PM2.5 chemistry, dry aerosol optical properties, and ∼90 trace gas EFs including HAPs and the major GHGs. Adjustments to IPCC-recommended EFs for peat burning are supported as follows: CO2 (−9 % to 1544 g kg−1), CO (+50 % to 315 g kg−1), and CH4 (−53 % to 9.8 g kg−1). Many (i.e., more than a factor of 10) other EFs have been added or changed significantly since the 2003 study of a single sample used by the IPCC; e.g., EF NH3 decreased from 19.9 to 5.34 g kg−1. Further benefits could result from deploying broadband aerosol absorption and advanced mass-spectrometric techniques in the field. For the time being, we have used our improved field characterization as criteria to select the most representative data from parallel, intensive lab measurements of burning tropical peat that included advanced MS and other powerful techniques. We then combined the selected lab data with the field data to develop a more extensive body of recommended EFs for 230 gases and numerous aerosol constituents and recommended aerosol optical properties. The complete results are presented in the tables in the Supplement or in the cited literature, with highlights presented in the text and abstract. We note that the use of multiple techniques and platforms was critical in providing broad characterization. Lab-based MS made it possible to increase the mass of quantified NMOG by about 82 % (an additional 25 g kg−1) and to estimate that about 86 % of the total NMOG emissions detected in a full PTR-TOF-MS mass scan can currently be named and quantified. MS is the only source of data for some important HAPs such as acrolein (0.31 g kg−1), HNCO (0.574 g kg−1), and acetonitrile (0.735 g kg−1), which is also a BB tracer. The GC analysis of field WAS samples quantified the main GHG emissions and the large emissions of H2 (1.22 g kg−1) and alkanes (5.6 g kg−1), where the latter are more substantial for peat than other BB types. WAS also contributed detailed speciation of the hydrocarbon isomers at several exact masses and was the most convenient way to explore regional variability in the field. FTIR in both the field and lab provided an additional overview of the main GHG emissions; overlap with both MS and WAS; and quantification of HCN (4.77 g kg−1, a BB tracer), SO2, NOx (0.31 g kg−1), formaldehyde (0.82 g kg−1), some sticky/reactive species such as ammonia (5.34 g kg−1) and HCl (0.035 g kg−1), the major emission acetic acid (4.45 g kg−1), and glycolaldehyde (0.11 g kg−1; which appears at the same exact mass), etc. FTIR measurements in series after PM collection on filters in the field enabled off-line quantification of numerous particle constituents as emission factors (Jayarathne et al., 2018). The ability of the compact PAX systems to measure both absorption and scattering in smoke from off-road, burning peat deposits supported recommendations for low BC emissions (0.0052±0.0018 g kg−1), high BrC emissions (∼97 % of absorption at ∼ 401–405 nm), SSA as a function of wavelength, and AAE (5.7). Field and lab experiments consistently measured organic-dominated, mostly insoluble initial PM, and multiple lab experiments measured minimal post-emission OA net mass gain with aging of “pure” peat smoke.
The main application of these new data is to improve estimates of the initial emissions and smoke properties from the substantial peat component of peatland fires. Updated guidance for using the data is provided. Similar data for the initial smoke from some major peatland surface fuel types such as crop residue and tropical forests are available elsewhere (Akagi et al., 2011; Andreae, 2019; Liu et al., 2014; Pokhrel et al., 2016; Stockwell et al., 2016b). The emissions from some surface fuels unique to SE Asia such as ferns still need better characterization. In addition, an airborne campaign is strongly needed in this region to characterize the initial smoke from representative landscape fuel mixtures, evolution of typical mixed-fuel smoke, peatland fire smoke interactions with urban and biogenic emissions, and the general properties of multisource regional haze.
The raw WAS data and calculations used in this paper along with detailed site notes, photographs, and maps can be found online (at https://doi.org/10.17605/OSF.IO/EAN3G; Yokelson, 2022).
The supplement related to this article is available online at: https://doi.org/10.5194/acp-22-10173-2022-supplement.
The overall combined lab and field approach to peat fire emissions research was designed by RJY, MAC, BHS, and EIP. The fieldwork (training, locating appropriate fires, carrying out the scientific sampling protocols, field notes, auxiliary data, etc.) was accomplished by BHS, EIP, AA, IA, LLBG, AK, DN, ADN, AS, NS, ES, SS, AT, MAC, KCR, CES, and TJ. Lab analyses were provided by DRB, SM, IJS, EAS, TJ, CES, and RJY. RJY performed the initial data analysis and wrote the first paper draft. All authors commented on or approved the final paper.
The contact author has declared that none of the authors has any competing interests.
Publisher's note: Copernicus Publications remains neutral with regard to jurisdictional claims in published maps and institutional affiliations.
This article is part of the special issue “The role of fire in the Earth system: understanding interactions with the land, atmosphere, and society (ESD/ACP/BG/GMD/NHESS inter-journal SI)”. It is a result of the EGU General Assembly 2020, 3–8 May 2020.
Purchase and preparation of the PAXs were supported by NSF grant no. AGS-1349976 to Robert J. Yokelson. This work would not have been possible without the excellent support provided by the BOS office in Palangka Raya, notably Grahame Applegate, and the BOSF field team.
This research has been primarily supported by NASA, Earth Sciences Division (grant nos. NNX13AP46G and NNX14AP45G).
This paper was edited by Bryan N. Duncan and reviewed by two anonymous referees.
Abel, S. J., Haywood, J. M., Highwood, E. J., Li, J., and Buseck, P. R.: Evolution of biomass burning aerosol properties from an agricultural fire in southern Africa, Geophys. Res. Lett., 30, 1783, https://doi.org/10.1029/2003GL017342, 2003.
Ahern, A. T., Robinson, E. S., Tkacik, D. S., Saleh, R., Hatch, L. E., Barsanti, K. C., Stockwell, C. E., Yokelson, R. J., Presto, A. A., Robinson, A. L., Sullivan, R. C., and Donahue, N. M.: Production of secondary organic aerosol during aging of biomass-burning smoke from fresh fuels and its relationship to VOC precursors, J. Geophys. Res.-Atmos., 124, 3583–3606, https://doi.org/10.1029/2018JD029068, 2019.
Akagi, S. K., Yokelson, R. J., Wiedinmyer, C., Alvarado, M. J., Reid, J. S., Karl, T., Crounse, J. D., and Wennberg, P. O.: Emission factors for open and domestic biomass burning for use in atmospheric models, Atmos. Chem. Phys., 11, 4039–4072, https://doi.org/10.5194/acp-11-4039-2011, 2011.
Akagi, S. K., Craven, J. S., Taylor, J. W., McMeeking, G. R., Yokelson, R. J., Burling, I. R., Urbanski, S. P., Wold, C. E., Seinfeld, J. H., Coe, H., Alvarado, M. J., and Weise, D. R.: Evolution of trace gases and particles emitted by a chaparral fire in California, Atmos. Chem. Phys., 12, 1397–1421, https://doi.org/10.5194/acp-12-1397-2012, 2012.
Akagi, S. K., Burling, I. R., Mendoza, A., Johnson, T. J., Cameron, M., Griffith, D. W. T., Paton-Walsh, C., Weise, D. R., Reardon, J., and Yokelson, R. J.: Field measurements of trace gases emitted by prescribed fires in southeastern US pine forests using an open-path FTIR system, Atmos. Chem. Phys., 14, 199–215, https://doi.org/10.5194/acp-14-199-2014, 2014.
Andreae, M. O.: Emission of trace gases and aerosols from biomass burning – an updated assessment, Atmos. Chem. Phys., 19, 8523–8546, https://doi.org/10.5194/acp-19-8523-2019, 2019.
Aouizerats, B., van der Werf, G. R., Balasubramanian, R., and Betha, R.: Importance of transboundary transport of biomass burning emissions to regional air quality in Southeast Asia during a high fire event, Atmos. Chem. Phys., 15, 363–373, https://doi.org/10.5194/acp-15-363-2015, 2015.
Applegate, G., Hooijer, A., Mulyadi. D., Ichsan, N., and van der Vat, M.: The impact of drainage and degradation on tropical peatland hydrology, and its implications for effective rehabilitation, in: International Peat Society 14th International Peat Congress, Peatlands in Balance, Stockholm, Sweden, 3–8 June 2012, Indonesia–Australia Forest Carbon Partnership, 418, 7 pp., https://peatlands.org/document/the-impact-of-drainage-and-degradation-on-tropical-peatland (last access: 4 August 2022), 2012.
Atwood, E. C., Englhart, S., Lorenz, E., Halle, W., Wiedemann, W., and Siegert, F.: Detection and characterization of low temperature peat fires during the 2015 fire catastrophe in Indonesia using a new high-sensitivity fire monitoring satellite sensor (FireBird), PLoS ONE, 11, e0159410, https://doi.org/10.1371/journal.pone.0159410, 2016.
Ballhorn, W., Siegert, F., Mason, M., and Limin, S.: Derivation of burn scar depths and estimation of carbon emissions with LIDAR in Indonesian peatlands, P. Natl. Acad. Sci. USA, 106, 21213–21218, https://doi.org/10.1073/pnas.0906457106, 2009.
Ben-Shushan, S. and Miller, Y.: Neuropeptides: Roles and activities as metal chelators in neurodegenerative diseases, J. Phys. Chem. B, 125, 2796–2811, https://doi.org/10.1021/acs.jpcb.0c11151, 2021.
Bikkina, S. and Sarin, M. M.: Atmospheric dry-deposition of mineral dust and anthropogenic trace metals to the Bay of Bengal, J. Marine Syst., 126, 56–68, 2013.
Bond, T. C. and Bergstrom, R.: Light absorption by carbonaceous particles: An investigative review, Aerosol Sci. Tech., 40, 27–67, https://doi.org/10.1080/02786820500421521, 2006.
Carrico, C., Prenni, A., Kreidenweis, S., Levin, E., McCluskey, C., DeMott, P., McMeeking, G., Nakao, S., Stockwell, C., and Yokelson, R. J.: Rapidly evolving ultrafine and fine mode biomass smoke physical properties: Comparing laboratory and field results, J. Geophys. Res., 121, 5750–5768, https://doi.org/10.1002/2015JD024389, 2016.
Chen, H., Laskin, A., Baltrusaitis, J., Gorski, C. A., Scherer, M. M., and Grassian, V. H.: Coal fly ash as a source of iron in atmospheric dust, Environ. Sci. Technol., 46, 2112–2120, 2012.
Chen, J., Budisulistiorini, S. H., Itoh, M., Lee, W.-C., Miyakawa, T., Komazaki, Y., Yang, L. D. Q., and Kuwata, M.: Water uptake by fresh Indonesian peat burning particles is limited by water-soluble organic matter, Atmos. Chem. Phys., 17, 11591–11604, https://doi.org/10.5194/acp-17-11591-2017, 2017.
Chen, J., Budisulistiorini, S. H., Miyakawa, T., Komazaki, Y., and Kuwata, M.: Secondary aerosol formation promotes water uptake by organic-rich wildfire haze particles in equatorial Asia, Atmos. Chem. Phys., 18, 7781–7798, https://doi.org/10.5194/acp-18-7781-2018, 2018.
Christian, T. J., Kleiss, B., Yokelson, R. J., Holzinger, R., Crutzen, P. J., Hao, W. M., Saharjo, B. H., and Ward, D. E.: Comprehensive laboratory measurements of biomass-burning emissions: 1. Emissions from Indonesian, African, and other fuels, J. Geophys. Res., 108, 4719, https://doi.org/10.1029/2003JD003704, 2003.
Coale, K. H., Johnson, K. S., Fitzwater, S. E., Gordon, R. M., Tanner, S., Chavez, F. P., Ferioli, L., Sakamoto, C., Rogers, P., Millero, F., Steinberg, P., Nightingale, P., Cooper, D., Cochlan, W. P., Landry, M. R., Constantinou, J., Rollwagen, G., Trasvina, A., and Kudela, R.: A massive phytoplankton bloom induced by an ecosystem-scale iron fertilization experiment in the equatorial Pacific Ocean, Nature, 383, 495–501, 1996.
Coggon, M. M., Veres, P. R., Yuan, B., Koss, A., Warneke, C., Gilman, J. B., Lerner, B., Peischl, J., Aikin, K., Stockwell, C., Hatch, L., Ryerson, T. B., Roberts, J. M., Yokelson, R., and de Gouw, J.: Emissions of nitrogen-containing organic compounds from the burning of herbaceous and aroboraceous biomass: fuel composition dependence and the variability of commonly used nitrile tracers, Geophys. Res. Lett., 43, 9903–9912, https://doi.org/10.1002/2016GL070562, 2016.
Conway, T. M., Hamilton, D. S., Shelley, R. U., Aguilar-Islas, A., M., Landing, W. M., Mahowald, N. M., and John, S. G.: Tracing and constraining anthropogenic aerosol iron fluxes to the North Atlantic Ocean using iron isotopes, Nat. Commun., 10, 1–10, https://doi.org/10.1038/s41467-019-10457-w, 2019.
Crounse, J. D., DeCarlo, P. F., Blake, D. R., Emmons, L. K., Campos, T. L., Apel, E. C., Clarke, A. D., Weinheimer, A. J., McCabe, D. C., Yokelson, R. J., Jimenez, J. L., and Wennberg, P. O.: Biomass burning and urban air pollution over the Central Mexican Plateau, Atmos. Chem. Phys., 9, 4929–4944, https://doi.org/10.5194/acp-9-4929-2009, 2009.
Cypert, E.: The effects of fires in the Okefenokee Swamp in 1954 and 1955, Am. Midl. Nat., 66, 485–503, 1961.
Dargie, G. C., Lewis, S. L., Lawson, I. T., Mitchard, E. T. A., Page, S. E., Bocko, Y. E., and Ifo, S. A.: Age, extent and carbon storage of the central Congo Basin peatland complex, Nature, 542, 86–90, https://doi.org/10.1038/nature21048, 2017.
Deshmukh, C. S., Julius, D., Desai, A. R., Asyhari, A., Page, S. E., Nardi, N., Susanto, A. P., Nurholis, N., Hendrizal, M., Kurnianto, S., Suardiwerianto, Y., Salam, Y. W., Agus, F., Astiani, D., Sabiham, S., Gauci, V., and Evans, C. D.: Conservation slows down emission increase from a tropical peatland in Indonesia, Nat. Geosci., 14, 484–490, https://doi.org/10.1038/s41561-021-00785-2, 2021.
Ding, K., Huang, X., Ding, A., Wang, M., Su, H., Kerminen, V.-M., Petäjä, T., Tan, Z., Wang, Z., Zhou, D., Sun, J., Liao, H., Wang, H., Carslaw, K., Wood, R., Zuidema, P., Rosenfeld, D., Kulmala, M., Fu, C., Pöschl, U., Cheng, Y., and Andreae, M. O.: Aerosol-boundary-layer-monsoon interactions amplify semi-direct effect of biomass smoke on low cloud formation in Southeast Asia, Nat. Commun., 12, 6416, https://doi.org/10.1038/s41467-021-26728-4, 2021.
Eck, T. F., Holben, B. N., Giles, D. M., Slutsker, I., Sinyuk, A., Schafer, J. S., Smirnov, A., Sorokin, M., Reid, J. S., Sayer, A. M., Hsu, N. C., Shi, Y. R., Levy, R. C., Lyapustin, A., Rahman, M. A., Liew, S-C., Cortijo, S. V. S., Li, T., Kalbermatter, D., Keong, K. L., Yuggotomo, M. E., Aditya, F., Mohamad, M., Mahmud, M., Chong, T. K., Lim, H.-S., Choon, Y. E., Deranadyan, G., Kusumaningtyas, S. D. A., and Aldrian, E.: AERONET remotely sensed measurements and retrievals of biomass burning aerosol optical properties during the 2015 Indonesian burning season. J. Geophys. Res., 124, 4722–4740, https://doi.org/10.1029/2018JD030182, 2019.
Fatoyinbo, L.: Vast peatlands found in the Congo Basin, Nature, 542, 38–39, 2017.
Goldstein, J. E., Graham, L., Ansori, S., Vetrita, Y., Thomas, A., Applegate, G., Vayda, A. P., Saharjo, B. H., and Cochrane, M. A.: Beyond slash-and-burn: The roles of human activities, altered hydrology and fuels in peat fires in Central Kalimantan, Indonesia, Singap. J. Trop. Geogr., 41, 190–208, https://doi.org/10.1111/sjtg.12319, 2020.
Graham, L., Susanto, L. B., Xaverius, T. W., Eser, F., Didie, E., Salahuddin, T. A., Mahyudi, A., and Applegate, G. B.: KFCP Vegetation Monitoring: Rates of Change for Forest Characteristics, and the Influence of Environmental Conditions, in the KFCP study area, Scientific Report, Kalimantan Forests and Climate Partnership, Indonesia, 2014a.
Graham, L., Manjin, L. B., Juni, S., Waldram, E. T., Massal, M., Ichsan, F., Fatkhurohman, N., and Applegate, G. B.: KFCP Heavy Fuel Load Assessment: Line Intersect Method and Heavy Fuel Load Results, Scientific Report, Kalimantan Forests and Climate Partnership, Indonesia, 2014b.
Graham, L. L. B., Applegate, G. B., Thomas, A., Ryan, K. C., Saharjo, B. H., and Cochrane, M. A.: A field study of tropical peat fire behaviour and associated carbon emissions, Fire, 5, 62, https://doi.org/10.3390/fire5030062, 2022.
Graham, R. M., De Boer, A. M., van Sebille, E., Kohfeld, K. E., and Schlosser, C.: Inferring source regions and supply mechanisms of iron in the Southern Ocean from satellite chlorophyll data, Deep-Sea Res. Pt. I, 104, 9–25, https://doi.org/10.1016/j.dsr.2015.05.007, 2015.
Gras, J. L., Jensen, J. B., Okada, K., Ikegami, M., Zaizen, Y., and Makino, Y.: Some optical properties of smoke aerosol in Indonesia and tropical Australia, Geophys. Res. Lett., 26, 1393–1396, https://doi.org/10.1029/1999GL900275, 1999.
Hamada, Y., Darung, U., Limin, S. H., and Hatano, R.: Characteristics of fire-generated gas emission observed during a large peatland fire in 2009 at Kalimantan, Indonesia, Atmos. Environ., 74, 177–181, https://doi.org/10.1016/j.atmosenv.2013.03.058, 2013.
Han, Y., Cao, J., Chow, J. C., Watson, J. G., An, Z., Jin, Z., Fung, K., and Liu, S.: Evaluation of the thermal/optical reflectance method for discrimination between char- and soot-EC, Chemosphere, 69, 569–574, 2007.
Han, Y. M., Cao, J. J., Lee, S. C., Ho, K. F., and An, Z. S.: Different characteristics of char and soot in the atmosphere and their ratio as an indicator for source identification in Xi'an, China, Atmos. Chem. Phys., 10, 595–607, https://doi.org/10.5194/acp-10-595-2010, 2010.
Hansen, A. B., Witham, C. S., Chong, W. M., Kendall, E., Chew, B. N., Gan, C., Hort, M. C., and Lee, S.-Y.: Haze in Singapore – source attribution of biomass burning PM10 from Southeast Asia, Atmos. Chem. Phys., 19, 5363–5385, https://doi.org/10.5194/acp-19-5363-2019, 2019.
Hatch, L. E., Luo, W., Pankow, J. F., Yokelson, R. J., Stockwell, C. E., and Barsanti, K. C.: Identification and quantification of gaseous organic compounds emitted from biomass burning using two-dimensional gas chromatography–time-of-flight mass spectrometry, Atmos. Chem. Phys., 15, 1865–1899, https://doi.org/10.5194/acp-15-1865-2015, 2015.
Hatch, L. E., Yokelson, R. J., Stockwell, C. E., Veres, P. R., Simpson, I. J., Blake, D. R., Orlando, J. J., and Barsanti, K. C.: Multi-instrument comparison and compilation of non-methane organic gas emissions from biomass burning and implications for smoke-derived secondary organic aerosol precursors, Atmos. Chem. Phys., 17, 1471–1489, https://doi.org/10.5194/acp-17-1471-2017, 2017.
Hodzic, A. and Duvel, J. P.: Impact of biomass burning aerosols on the diurnal cycle of convective clouds and precipitation over a tropical island, J. Geophys. Res., 123, 1017–1036, https://doi.org/10.1002/2017JD027521, 2018.
Hooijer, A. S., Page, S., Navrati, P., Vernimmen, R., van der Vat, M., Tansey, K., Konecny, K., Siegert, F., Ballhorn, U., and Mawdsley, N.: Carbon emissions from drained and degraded peatland in Indonesia and emission factors for measurement, reporting and verification (MRV) of peatland greenhouse gas emissions: A summary of KFCP research results for practitioners, Scientific Report, IAFCP, Jakarta, Indonesia, http://www.forda-mof.org/index.php/content/publikasi/post/344 (last access: 7 August 2022), 2014.
Ichsan, N., Vernimmen, R., Hooijer, A., and Applegate, G.: KFCP hydrology and peat monitoring methodology, Technical Paper, Indonesia–Australia Forest Carbon Parternership, Jakarta, Indonesia, http://pandora.nla.gov.au/pan/145800/20140623-0017/www.iafcp.or.id/uploads/20140318114700.KFCP_Hydrology_and_Peat_Monitoring_Methodology_S1.pdf (last access: 7 August 2022), 2013.
Iinuma, Y., Brüggemann, E., Gnauk, T., Müller, K., Andreae, M. O., Helas, G., Parmar, R., and Herrmann, H.: Source characterization of biomass burning particles: The combustion of selected European conifers, African hardwood, savanna grass, and German and Indonesian peat, J. Geophys. Res., 112, D08209, https://doi.org/10.1029/2006JD007120, 2007.
IPCC: 2013 Supplement to the 2006 IPCC Guidelines for National Greenhouse Gas Inventories: Wetlands, edited by: Hiraishi, T., Krug, T., Tanabe, K., Srivastava, N., Baasansuren, J., Fukuda, M., and Troxler, T. G., IPCC, Switzerland, 354 pp., ISBN 978-92-9169-139-5, 2014.
Ito, A.: Mega fire emissions in Siberia: potential supply of bioavailable iron from forests to the ocean, Biogeosciences, 8, 1679–1697, https://doi.org/10.5194/bg-8-1679-2011, 2011.
Ito, A., Myriokefalitakis, S., Kanakidou, M., Mahowald, N. M., Scanza, R. A., Hamilton, D. S., Baker, A. R., Jickells, T., Sarin, M., Bikkina, S., Gao, Y., Shelley, R. U., Buck, C. S., Landing, W. M., Bowie, A. R., Perron, M. M. G., Guieu, C., Meskhidze, N., Johnson, M. S., Feng, Y., Kok, J. F., Nenes, A., and Duce, R. A.: Pyrogenic iron: the missing link to high iron solubility in aerosols, Sci. Adv., 5, eaau7671, https://doi.org/10.1126/sciadv.aau7671, 2019.
Ito, A., Perron, M. M. G., Proemse, B. C., Strzelec, M., Gault-Ringold, M., Boyd, P. W., and Bowie, A. R.: Evaluation of aerosol iron solubility over Australian coastal regions based on inverse modeling: implications of bushfires on bioaccessible iron concentrations in the Southern Hemisphere, Progress in Earth and Planetary Science, 7, 42, https://doi.org/10.1186/s40645-020-00357-9, 2020.
Ito, A., Ying, Y., Baldo, C., and Shi, Z.: Ocean fertilization by pyrogenic aerosol iron, npj Climate and Atmospheric Science, 4, 30, https://doi.org/10.1038/s41612-021-00185-8, 2021.
Jayarathne, T., Stockwell, C., Yokelson, R., Nakao, S., and Stone, E.: Emissions of fine particle fluoride from biomass burning, Environ. Sci. Technol., 48, 12636–12644, https://doi.org/10.1021/es502933j, 2014.
Jayarathne, T., Stockwell, C. E., Gilbert, A. A., Daugherty, K., Cochrane, M. A., Ryan, K. C., Putra, E. I., Saharjo, B. H., Nurhayati, A. D., Albar, I., Yokelson, R. J., and Stone, E. A.: Chemical characterization of fine particulate matter emitted by peat fires in Central Kalimantan, Indonesia, during the 2015 El Niño, Atmos. Chem. Phys., 18, 2585–2600, https://doi.org/10.5194/acp-18-2585-2018, 2018.
Jen, C. N., Hatch, L. E., Selimovic, V., Yokelson, R. J., Weber, R., Fernandez, A. E., Kreisberg, N. M., Barsanti, K. C., and Goldstein, A. H.: Speciated and total emission factors of particulate organics from burning western US wildland fuels and their dependence on combustion efficiency, Atmos. Chem. Phys., 19, 1013–1026, https://doi.org/10.5194/acp-19-1013-2019, 2019.
Kaiser, J. W., van der Werf, G. R., and Heil, A.: Global climate biomass burning in “State of the climate in 2015”, B. Am. Meteorol. Soc., 97, Si-S275, https://doi.org/10.1175/2016BAMSStateoftheClimate.1, 2016.
Khanum, F., Chaudhry, M. N., Skouteris, G., Saroj, D., and Kumar, P.: Chemical composition and source characterization of PM10 in urban areas of Lahore, Pakistan, Indoor Built Environ., 30, 924–937, https://doi.org/10.1177/1420326X20924073, 2021.
Kiely, L., Spracklen, D. V., Wiedinmyer, C., Conibear, L., Reddington, C. L., Archer-Nicholls, S., Lowe, D., Arnold, S. R., Knote, C., Khan, M. F., Latif, M. T., Kuwata, M., Budisulistiorini, S. H., and Syaufina, L.: New estimate of particulate emissions from Indonesian peat fires in 2015, Atmos. Chem. Phys., 19, 11105–11121, https://doi.org/10.5194/acp-19-11105-2019, 2019.
Kiely, L., Spracklen, D. V., Wiedinmyer, C., Conibear, L., Reddington, C. L., Arnold, S. R., Knote, C., Khan, M. D., Latif, M. T., Syaufina, L., and Adrianto, H.: Air quality and health impacts of vegetation and peat fires in Equatorial Asia during 2004–2015, Environ. Res. Lett., 15, 094054, https://doi.org/10.1088/1748-9326/ab9a6c, 2020.
Kleinman, L. I., Sedlacek III, A. J., Adachi, K., Buseck, P. R., Collier, S., Dubey, M. K., Hodshire, A. L., Lewis, E., Onasch, T. B., Pierce, J. R., Shilling, J., Springston, S. R., Wang, J., Zhang, Q., Zhou, S., and Yokelson, R. J.: Rapid evolution of aerosol particles and their optical properties downwind of wildfires in the western US, Atmos. Chem. Phys., 20, 13319–13341, https://doi.org/10.5194/acp-20-13319-2020, 2020.
Konecny, K., Ballhorn, U., Navratil, P., Jubanski, J., Page, S. E., Tansey, K., Hooijer, A. A., Vernimmen, R., and Siegert, F: Variable carbon losses from recurrent fires in drained tropical peatlands, Glob. Change Biol., 22, 1469–1480, https://doi.org/10.1111/gcb.13186, 2016.
Koplitz, S. N., Mickley, L. J., Marlier, M. E., Buonocore, J. J., Kim, P. S., Liu, T., Sulprizio, M. P., DeFries, R. S., Jacob, D. J., Schwartz, J., Pongsiri, M., and Myers, S. S.: Public health impacts of the severe haze in Equatorial Asia in September–October 2015: demonstration of a new framework for informing fire management strategies to reduce downwind smoke exposure, Environ. Res. Lett., 11, 094023, https://doi.org/10.1088/1748-9326/11/9/094023, 2016.
Koss, A. R., Sekimoto, K., Gilman, J. B., Selimovic, V., Coggon, M. M., Zarzana, K. J., Yuan, B., Lerner, B. M., Brown, S. S., Jimenez, J. L., Krechmer, J., Roberts, J. M., Warneke, C., Yokelson, R. J., and de Gouw, J.: Non-methane organic gas emissions from biomass burning: identification, quantification, and emission factors from PTR-ToF during the FIREX 2016 laboratory experiment, Atmos. Chem. Phys., 18, 3299–3319, https://doi.org/10.5194/acp-18-3299-2018, 2018.
Kotze, D. C.: The effects of fire on wetland structure and functioning, Afr. J. Aquat. Sci., 38, 237–247, https://doi.org/10.2989/16085914.2013.828008, 2013.
Lack, D. A. and Langridge, J. M.: On the attribution of black and brown carbon light absorption using the Ångström exponent, Atmos. Chem. Phys., 13, 10535–10543, https://doi.org/10.5194/acp-13-10535-2013, 2013.
Lee, H., Jeong, S-J., Kalashnikova, O., Tosca, M., Kim, S-W., and Kug, J-S.: Characterization of wildfire-induced aerosol emissions from the maritime continent peatland and central African dry savannah with MISR and CALIPSO aerosol products, J. Geophys. Res., 123, 3116–3125, https://doi.org/10.1002/2017JD027415, 2018.
Lee, H.-H., Iraqui, O., Gu, Y., Yim, S. H.-L., Chulakadabba, A., Tonks, A. Y.-M., Yang, Z., and Wang, C.: Impacts of air pollutants from fire and non-fire emissions on the regional air quality in Southeast Asia, Atmos. Chem. Phys., 18, 6141–6156, https://doi.org/10.5194/acp-18-6141-2018, 2018.
Levin, E., McMeeking, G., DeMott, P., McCluskey, C., Carrico, C., Nakao, S., Jayarathne, T., Stone, E., Stockwell, C., Yokelson, R. J., and Kreidenweis, S.: Ice nucleating particle emissions from biomass combustion and the potential importance of soot aerosol, J. Geophys. Res., 121, 5888–5903, https://doi.org/10.1002/2016JD024879, 2016.
Li, H., Lamb, K. D., Schwarz, J. P., Selimovic, V., Yokelson, R. J., McMeeking, G. R., and May, A.: Inter-comparison of black carbon measurement methods for simulated open biomass burning emissions, Atmos. Environ., 206, 156–169, https://doi.org/10.1016/j.atmosenv.2019.03.010, 2019.
Liu, S., Aiken, A. C., Arata, C., Manvendra, K. D., Stockwell, C. E., Yokelson, R. J., Stone, E. A., Jayarathne, T., Robinson, A. L., DeMott, P. J., and Kreidenweis, S. M.: Aerosol single scattering albedo dependence on biomass combustion efficiency: Laboratory and field studies, Geophys. Res. Lett., 41, 742–748, https://doi.org/10.1002/2013GL058392, 2014.
Liu, T., Mickley, L. J., Marlier, M. E., DeFries, R. S., Khan, M. F., Latif, M. T., and Karambelas, A.: Diagnosing spatial biases and uncertainties in global fire emissions inventories: Indonesia as a regional case study, Remote Sens. Environ., 237, 111557, https://doi.org/10.1016/j.rse.2019.111557, 2020.
Lu, X., Zhang, X., Li, F., and Cochrane, M. A.: Investigating smoke aerosol emission coefficients using MODIS active fire and aerosol products – A case study in the CONUS and Indonesia, J. Geophys. Res.-Biogeo., 124, 1413–1429, https://doi.org/10.1029/2018JG004974, 2019.
Lu, X., Zhang, X., Li, F., Cochrane, M. A., and Ciren, P.: Detection of fire smoke plumes based on aerosol scattering using VIIRS data over global fire-prone regions, Remote Sens., 13, 196, https://doi.org/10.3390/rs13020196, 2021.
Lu, Z. and Sokolik, I. N.: The effect of smoke emission amount on changes in cloud properties and precipitation: A case study of Canadian boreal wildfires of 2007, J. Geophys. Res., 118, 11777–11793, https://doi.org/10.1002/2013JD019860, 2013.
Luo, C., Mahowald, N., Bond, T., Chuang, P. Y., Artaxo, P., Siefer, R., Chen, Y., and Schauer, J.: Combustion iron distribution and deposition, Global Biogeochem. Cy., 22, GB1012, https://doi.org/10.1029/2007GB002964, 2008.
May, A. A., Levin, E. J. T., Hennigan, C. J., Riipinen, I., Lee, T., Collett, J. L., Jimenez, J. L., Kreidenweis, S. M., and Robinson, A. L.: Gas-particle partitioning of primary organic aerosol emissions: 3. Biomass burning, J. Geophys. Res.-Atmos., 118, 11327–11338, https://doi.org/10.1002/jgrd.50828, 2013.
Miettinen, J., Shi, C., and Liew, S. C.: Land cover distribution in the peatlands of Peninsular Malaysia, Sumatra, and Borneo in 2015 with changes since 1990, Global Ecology and Conservation, 6, 67–78, https://doi.org/10.1016/j.gecco.2016.02.004, 2016.
Ni, S., Bai, F., and Pan, X-M.: Effects of amides on the formation of atmospheric HONO and the nucleation of nitric acid hydrates, SSRN, https://doi.org/10.2139/ssrn.3982283, 2021.
O'Dell, K., Hornbrook, R. S., Permar, W., Levin, E. J. T., Garofalo, L. A., Apel, E. C., Blake, N. J., Jarnot, A., Pothier, M. A., Farmer, D. K., Hu, L., Campos, T., Ford, B., Pierce, J. R., and Fischer, E. V.: Hazardous air pollutants in fresh and aged western US wildfire smoke and implications for long-term exposure, Environ. Sci. Technol., 54, 11838–11847, https://doi.org/10.1021/acs.est.0c04497, 2020.
Page, S. E., Siegert, F., Rieley, J. O., Boehm, H. D. V., Jaya, A., and Limin, S.: The amount of carbon released from peat and forest fires in Indonesia during 1997, Nature, 420, 61–65, https://doi.org/10.1038/nature01131, 2002.
Permar, W., Wang, Q., Selimovic, V., Wielgasz, C., Yokelson, R. J., Hornbrook, R. S., Hills, A. J., Apel, E. C., Ku, I.-T., Zhou, Y., Sive, B. C., Sullivan, A. P., Collett Jr., J. L., Campos, T. L., Palm, B. B., Peng, Q., Thornton, J. A., Garofalo, L. A., Farmer, D. K., Kreidenweis, S. M., Levin, E. J. T., DeMott, P. J., Flocke, F., Fischer, E. V., and Hu, L.: Emissions of trace organic gases from western U.S. wildfires based on WE-CAN aircraft measurements, J. Geophys. Res., 126, e2020JD033838, https://doi.org/10.1029/2020JD033838, 2021.
Pokhrel, R. P., Wagner, N. L., Langridge, J. M., Lack, D. A., Jayarathne, T., Stone, E. A., Stockwell, C. E., Yokelson, R. J., and Murphy, S. M.: Parameterization of single-scattering albedo (SSA) and absorption Ångström exponent (AAE) with for aerosol emissions from biomass burning, Atmos. Chem. Phys., 16, 9549–9561, https://doi.org/10.5194/acp-16-9549-2016, 2016.
Putra, E. I., Cochrane, M. A., Vetrita, Y., Graham, L., and Saharjo, B. H.: Determining critical groundwater level to prevent degraded peatland from severe peat fire, IOP Conf. Ser. Earth Environ. Sci., 149, 012027, https://doi.org/10.1088/1755-1315/149/1/012027, 2018.
Reddington, C. L., Spracklen, D. V., Artaxo, P., Ridley, D. A., Rizzo, L. V., and Arana, A.: Analysis of particulate emissions from tropical biomass burning using a global aerosol model and long-term surface observations, Atmos. Chem. Phys., 16, 11083–11106, https://doi.org/10.5194/acp-16-11083-2016, 2016.
Reid, J. S., Eck, T. F., Christopher, S. A., Koppmann, R., Dubovik, O., Eleuterio, D. P., Holben, B. N., Reid, E. A., and Zhang, J.: A review of biomass burning emissions part III: intensive optical properties of biomass burning particles, Atmos. Chem. Phys., 5, 827–849, https://doi.org/10.5194/acp-5-827-2005, 2005.
Reid, J. S., Hyer, E. J., Johnson, R., Holben, B. N., Yokelson, R. J., Zhang, J., Campbell, J. R., Christopher, S. A., Di Girolamo, L., Giglio, L., Holz, R. E., Kearney, C., Miettinen, J., Reid, E. A., Turk, F. J., Wang, J., Xian, P., Zhao, G., Balasubramanian, R., Chew, B. N., Janai, S., Lagrosas, N., Lestari, P., Lin, N.-H., Mahmud, M.. Nguyen, A. X., Norris, B., Oahn, N. T. K., Oo, M., Salinas, S. V., Welton, E. J., and Liew, S. C.: Observing and understanding the Southeast Asian aerosol system by remote sensing: An initial review and analysis for the Seven Southeast Asian Studies (7SEAS) program, Atmos. Res., 122, 403–468, https://doi.org/10.1016/j.atmosres.2012.06.005, 2013.
Richards, G. N.: Glycolaldehyde from pyrolysis of cellulose, J. Anal. Appl. Pyrol., 10, 251–255, 1987.
Roberts, J. M., Veres, P. R., Cochran, A. K., Warneke, C., Burling, I. R., Yokelson, R. J., Lerner, B., Holloway, J. S., Fall, R., and de Gouw, J.: Isocyanic acid in the atmosphere: Sources, concentrations and sinks, and potential health effects, P. Natl. Acad. Sci. USA, 108, 8966–8971, https://doi.org/10.1073/pnas.1103352108, 2011.
Rosanka, S., Franco, B., Clarisse, L., Coheur, P.-F., Pozzer, A., Wahner, A., and Taraborrelli, D.: The impact of organic pollutants from Indonesian peatland fires on the tropospheric and lower stratospheric composition, Atmos. Chem. Phys., 21, 11257–11288, https://doi.org/10.5194/acp-21-11257-2021, 2021.
Roulston, C., Paton-Walsh, C., Smith, T. E. L., Guerette, E. A., Evers, S., Yule, C. M., Rein, G., and Van der Werf, G. R.: Fine particle emissions from tropical peat fires decrease rapidly with time since ignition, J. Geophys. Res.-Atmos., 123, 5607–5617, https://doi.org/10.1029/2017jd027827, 2018.
Sawa, Y., Matsueda, H., Tsutsumi, Y., Jensen, J. B., Inoue, H. Y., and Makino, Y.: Tropospheric carbon monoxide and hydrogen measurements over Kalimantan in Indonesia and northern Australia during October, 1997, Geophys. Res. Lett., 26, 1389–1392, https://doi.org/10.1029/1999GL900247, 1999.
Scieszka, D., Hunter, R., Begay, J., Bitsui, M., Lin, Y., Galewsky, J., Morishita, M., Klaver, Z., Wagner, J., Harkema, J. R., Herbert, G., Lucas, S., McVeigh, C., Bolt, A., Bleske, B., Canal, C. G., Mostovenko, E., Ottens, A. K., Gu, H., Campen, M. J., and Noor, S.: Neuroinflammatory and neurometabolomic consequences from inhaled wildfire smoke-derived particulate matter in the western United States, Toxicol. Sci., 186, 149–162, https://doi.org/10.1093/toxsci/kfab147, 2021.
Seiler, W. and Crutzen, P. J.: Estimates of gross and net fluxes of carbon between the biosphere and atmosphere from biomass burning, Climatic Change, 2, 207–247, 1980.
Selimovic, V., Yokelson, R. J., Warneke, C., Roberts, J. M., de Gouw, J., Reardon, J., and Griffith, D. W. T.: Aerosol optical properties and trace gas emissions by PAX and OP-FTIR for laboratory-simulated western US wildfires during FIREX, Atmos. Chem. Phys., 18, 2929–2948, https://doi.org/10.5194/acp-18-2929-2018, 2018.
Selimovic, V., Yokelson, R. J., McMeeking, G. R., and Coefield, S.: In situ measurements of trace gases, PM, and aerosol optical properties during the 2017 NW US wildfire smoke event, Atmos. Chem. Phys., 19, 3905–3926, https://doi.org/10.5194/acp-19-3905-2019, 2019.
Selimovic, V., Yokelson, R. J., McMeeking, G. R., and Coefield, S.: Aerosol mass and optical properties, smoke influence on O3, and high NO3 production rates in a western US city impacted by wildfires, J. Geophys. Res., 125, e2020JD032791, https://doi.org/10.1029/2020JD032791, 2020.
Shawki, D., Field, R. D., Tippett, M. K., Saharjo, B. H., Albar I., Atmoko, D., and Voulgarakis, A.: Long-lead prediction of the 2015 fire and haze episode in Indonesia, Geophys. Res. Lett., 44, 9996–10005, https://doi.org/10.1002/2017GL073660, 2017.
Shi, Y. R., Levy, R. C., Eck, T. F., Fisher, B., Mattoo, S., Remer, L. A., Slutsker, I., and Zhang, J.: Characterizing the 2015 Indonesia fire event using modified MODIS aerosol retrievals, Atmos. Chem. Phys., 19, 259–274, https://doi.org/10.5194/acp-19-259-2019, 2019.
Simpson, I. J., Rowland, F. S., Meinardi, S., and Blake, D. R.: Influence of biomass burning during recent fluctuations in the slow growth of global tropospheric methane, Geophys. Res. Lett., 33, L22808, https://doi.org/10.1029/2006GL027330, 2006.
Simpson, I. J., Akagi, S. K., Barletta, B., Blake, N. J., Choi, Y., Diskin, G. S., Fried, A., Fuelberg, H. E., Meinardi, S., Rowland, F. S., Vay, S. A., Weinheimer, A. J., Wennberg, P. O., Wiebring, P., Wisthaler, A., Yang, M., Yokelson, R. J., and Blake, D. R.: Boreal forest fire emissions in fresh Canadian smoke plumes: C1-C10 volatile organic compounds (VOCs), CO2, CO, NO2, NO, HCN and CH3CN, Atmos. Chem. Phys., 11, 6445–6463, https://doi.org/10.5194/acp-11-6445-2011, 2011.
Sinclair, A. L., Graham, L. L. B., Putra, E. I., Saharjo, B. H., Applegate, G., Grover, S. P., and Cochrane, M. A.: Effects of distance from canal and degradation history on peat bulk density in a degraded tropical peatland, Sci. Total Environ., 699, 134199, https://doi.org/10.1016/j.scitotenv.2019.134199, 2020.
Smith, T. E. L., Evers, S., Yule, C. M., and Gan, J. Y.: In situ tropical peatland fire emission factors and their variability, as determined by field measurements in peninsula Malaysia, Global Biogeochem. Cy., 32, 18–31, https://doi.org/10.1002/2017gb005709, 2018.
Stockwell, C. E., Yokelson, R. J., Kreidenweis, S. M., Robinson, A. L., DeMott, P. J., Sullivan, R. C., Reardon, J., Ryan, K. C., Griffith, D. W. T., and Stevens, L.: Trace gas emissions from combustion of peat, crop residue, domestic biofuels, grasses, and other fuels: configuration and Fourier transform infrared (FTIR) component of the fourth Fire Lab at Missoula Experiment (FLAME-4), Atmos. Chem. Phys., 14, 9727–9754, https://doi.org/10.5194/acp-14-9727-2014, 2014.
Stockwell, C. E., Veres, P. R., Williams, J., and Yokelson, R. J.: Characterization of biomass burning emissions from cooking fires, peat, crop residue, and other fuels with high-resolution proton-transfer-reaction time-of-flight mass spectrometry, Atmos. Chem. Phys., 15, 845–865, https://doi.org/10.5194/acp-15-845-2015, 2015.
Stockwell, C. E., Jayarathne, T., Cochrane, M. A., Ryan, K. C., Putra, E. I., Saharjo, B. H., Nurhayati, A. D., Albar, I., Blake, D. R., Simpson, I. J., Stone, E. A., and Yokelson, R. J.: Field measurements of trace gases and aerosols emitted by peat fires in Central Kalimantan, Indonesia, during the 2015 El Niño, Atmos. Chem. Phys., 16, 11711–11732, https://doi.org/10.5194/acp-16-11711-2016, 2016a.
Stockwell, C. E., Christian, T. J., Goetz, J. D., Jayarathne, T., Bhave, P. V., Praveen, P. S., Adhikari, S., Maharjan, R., DeCarlo, P. F., Stone, E. A., Saikawa, E., Blake, D. R., Simpson, I. J., Yokelson, R. J., and Panday, A. K.: Nepal Ambient Monitoring and Source Testing Experiment (NAMaSTE): emissions of trace gases and light-absorbing carbon from wood and dung cooking fires, garbage and crop residue burning, brick kilns, and other sources, Atmos. Chem. Phys., 16, 11043–11081, https://doi.org/10.5194/acp-16-11043-2016, 2016b.
Subramanian, R., Roden, C. A., Boparai, P., and Bond, T. C.: Yellow beads and missing particles: Trouble ahead for filter-based absorption measurements, Aerosol Sci. Tech., 41, 630–637, https://doi.org/10.1080/02786820701344589, 2007.
Tosca, M. G., Randerson, J. T., Zender, C. S., Nelson, D. L., Diner, D. J., and Logan, J. A.: Dynamics of fire plumes and smoke clouds associated with peat and deforestation fires in Indonesia, J. Geophys. Res., 116, D08207, https://doi.org/10.1029/2010JD015148, 2011.
Turetsky, M. R., Benscoter, B., Page, S., Rein, G., van der Werf, G. R., and Watts, A.: Global vulnerability of peatlands to fire and carbon loss, Nat. Geosci., 8, 11–14, https://doi.org/10.1038/ngeo2325, 2015.
van der Werf, G. R., Randerson, J. T., Giglio, L., Collatz, G. J., Mu, M., Kasibhatla, P. S., Morton, D. C., DeFries, R. S., Jin, Y., and van Leeuwen, T. T.: Global fire emissions and the contribution of deforestation, savanna, forest, agricultural, and peat fires (1997–2009), Atmos. Chem. Phys., 10, 11707–11735, https://doi.org/10.5194/acp-10-11707-2010, 2010.
Vetrita, Y., Cochrane, M. A., Suwarsono, Priyatna, M., Sukowati, K. A. D., and Khomarudin, M. R.: Evaluating accuracy of four MODIS-derived burned area products for tropical peatland and non-peatland fires, Environ. Res. Lett., 16, 035015, https://doi.org/10.1088/1748-9326/abd3d1, 2021.
Volkova, L., Krisnawati, H., Adinugroho, W. C., Imanuddin, R., Qirom, M. A., Santosa, P. B., Halwany, W., and Weston, C. J.: Identifying and addressing knowledge gaps for improving greenhouse gas emissions estimates from tropical peat forest fires, Sci. Total Environ., 763, 142933, https://doi.org/10.1016/j.scitotenv.2020.142933, 2021.
Ward, D. E. and Radke, L. F.: Emissions measurements from vegetation fires: A comparative evaluation of methods and results, in: Fire in the Environment: The Ecological, Atmospheric, and Climatic Importance of Vegetation Fires, edited by: Crutzen, P. J. and Goldammer, J. G., J. Wiley & Sons, Chichester, UK, 53–76, ISBN 978-0471936046, ISBN 0-471-93604-9, 1993.
Warren, M., Hergoualc'h, K., Kauffman, J. B., Murdiyarso, D., and Kolka, R.: An appraisal of Indonesia's immense peat carbon stock using national peatland maps: uncertainties and potential losses from conversion, Carbon Balance and Management, 12, 12, https://doi.org/10.1186/s13021-017-0080-2, 2017.
Watson, J. G., Cao, J., Chen, L.-W. A., Wang, Q., Tian, J., Wang, X., Gronstal, S., Ho, S. S. H., Watts, A. C., and Chow, J. C.: Gaseous, PM2.5 mass, and speciated emission factors from laboratory chamber peat combustion, Atmos. Chem. Phys., 19, 14173–14193, https://doi.org/10.5194/acp-19-14173-2019, 2019.
Wedeux, B., Dalponte, M., Schlund, M., Hagen, S., Cochrane, M., Graham, L., Usup, A., Thomas, A., and Coomes, D.: Dynamics of a human-modified tropical peat swamp forest revealed by repeat Lidar surveys, Global Change Biol., 26, 3947–3964, https://doi.org/10.1111/gcb.15108, 2020.
Wiggins, E. B., Czimczik, C. I., Santos, G. M., Chen, Y., Xu, X., Holden, S. R., Randerson, J. T., Harvey, C. F., Kai, F. M., and Yu, L. E.: Smoke radiocarbon measurements from Indonesian fires provide evidence for burning of millennia-aged peat, P. Natl. Acad. Sci. USA, 115, 12419–12424, https://doi.org/10.1073/pnas.1806003115, 2018.
Winckler, G., Anderson, R. F., Jaccard, S. L., and Marcantonio, F.: Ocean dynamics, not dust, control equatorial Pacific productivity over the past 500,000 years, P. Natl. Acad. Sci. USA, 113, 6119–6124, https://doi.org/10.1073/pnas.1600616113, 2016.
Wooster, M., Gaveau, D., Salim, M., Zhang, T., Xu, W., Green, D., Huijnen, V., Murdiyarso, D., Gunawan, D., Borchard, N., Schirrmann, M., Main, B., and Sepriando, A.: New tropical peatland gas and particulate emissions factors indicate 2015 Indonesian fires released far more particulate matter (but less methane) than current inventories imply, Remote Sens., 10, 495, https://doi.org/10.3390/rs10040495, 2018.
Wooster, M. J., Roberts, G. J., Giglio, L., Roy, D., Freeborn, P., Boschetti, L., Justice, C., Ichoku, C., Schroeder, W., Davies, D., Smith, A., Setzer, A., Csiszar, I., Strydom, T., Frost, P., Zhang, T., Xu, W., de Jong, M., Johnston, J., Ellison, L., Vadrevu, K., McCarty, J., Tanpipat, V., Schmidt, C., and San-Miguel, J.: Satellite remote sensing of active fires: History and current status, applications and future requirements, Remote Sens. Environ., 267, 112694, https://doi.org/10.1016/j.rse.2021.112694, 2021.
Wüst, R. A., Bustin, R. M., and Lavkulich, L. M.: New classification systems for tropical organic-rich deposits based on studies of the Tasek Bera Basin, Malaysia, Catena, 53, 133–163, 2003.
Xue, L., Ding, A., Cooper, O., Huang, X., Wang, W., Zhou, D., Wu, Z., McClure-Begley, A., Petropavloskikh, I., Andreae, M. O., and Fu, C.: ENSO and Southeast Asian biomass burning modulate subtropical trans-Pacific ozone transport, Natl. Sci. Rev., 8, nwaa132, https://doi.org/10.1093/nsr/nwaa132, 2021.
Yamasoe, M., Artaxo, P., Miguel, A., and Allen, A.: Chemical composition of aerosol particles from direct emissions of vegetation fires in the Amazon Basin: Water-soluble species and trace elements, Atmos. Environ., 34, 1641–1653, 2000.
Yokelson, R.: Indonesian peat fire emissions 2019, OSF [data set], https://doi.org/10.17605/OSF.IO/EAN3G, 2022.
Yokelson, R. J., Griffith, D. W. T., and Ward, D. E.: Open path Fourier transform infrared studies of large-scale laboratory biomass fires, J. Geophys. Res., 101, 21067–21080, https://doi.org/10.1029/96JD01800, 1996.
Yokelson, R. J., Ward, D. E., Susott, R. A., Reardon, J., and Griffith, D. W. T.: Emissions from smoldering combustion of biomass measured by open-path Fourier transform infrared spectroscopy, J. Geophys. Res., 102, 18865–18877, https://doi.org/10.1029/97JD00852, 1997.
Yokelson, R. J., Goode, J. G., Ward, D. E., Susott, R. A., Babbitt, R. E., Wade, D. D., Bertschi, I., Griffith, D. W. T., and Hao, W. M.: Emissions of formaldehyde, acetic acid, methanol, and other trace gases from biomass fires in North Carolina measured by airborne Fourier transform infrared spectroscopy, J. Geophys. Res., 104, 30109–30125, https://doi.org/10.1029/1999jd900817, 1999.
Yokelson, R. J., Christian, T. J., Bertschi, I. T., and Hao, W. M.: Evaluation of adsorption effects on measurements of ammonia, acetic acid, and methanol, J. Geophys. Res., 108, 4649, https://doi.org/10.1029/2003JD003549, 2003.
Yokelson, R. J., Crounse, J. D., DeCarlo, P. F., Karl, T., Urbanski, S., Atlas, E., Campos, T., Shinozuka, Y., Kapustin, V., Clarke, A. D., Weinheimer, A., Knapp, D. J., Montzka, D. D., Holloway, J., Weibring, P., Flocke, F., Zheng, W., Toohey, D., Wennberg, P. O., Wiedinmyer, C., Mauldin, L., Fried, A., Richter, D., Walega, J., Jimenez, J. L., Adachi, K., Buseck, P. R., Hall, S. R., and Shetter, R.: Emissions from biomass burning in the Yucatan, Atmos. Chem. Phys., 9, 5785–5812, https://doi.org/10.5194/acp-9-5785-2009, 2009.
Yokelson, R. J., Burling, I. R., Gilman, J. B., Warneke, C., Stockwell, C. E., de Gouw, J., Akagi, S. K., Urbanski, S. P., Veres, P., Roberts, J. M., Kuster, W. C., Reardon, J., Griffith, D. W. T., Johnson, T. J., Hosseini, S., Miller, J. W., Cocker III, D. R., Jung, H., and Weise, D. R.: Coupling field and laboratory measurements to estimate the emission factors of identified and unidentified trace gases for prescribed fires, Atmos. Chem. Phys., 13, 89–116, https://doi.org/10.5194/acp-13-89-2013, 2013.
Zarzana, K. J., Selimovic, V., Koss, A. R., Sekimoto, K., Coggon, M. M., Yuan, B., Dubé, W. P., Yokelson, R. J., Warneke, C., de Gouw, J. A., Roberts, J. M., and Brown, S. S.: Primary emissions of glyoxal and methylglyoxal from laboratory measurements of open biomass burning, Atmos. Chem. Phys., 18, 15451–15470, https://doi.org/10.5194/acp-18-15451-2018, 2018.
Zuo, C., Zhao, X., Wang, H., Ma, X., Zheng, S., Xu, F., and Zhang, Q.: A theoretical study of hydrogen-bonded molecular clusters of sulfuric acid and organic acids with amides, J. Environ. Sci., 100, 328–339, https://doi.org/10.1016/j.jes.2020.07.022, 2021.
- Article
(3748 KB) - Full-text XML