the Creative Commons Attribution 4.0 License.
the Creative Commons Attribution 4.0 License.
 | 08 Aug 2022
Evaluation of aerosol optical depths and clear-sky radiative fluxes of the CERES Edition 4.1 SYN1deg data product
David W. Fillmore
David A. Rutan
Seiji Kato
Fred G. Rose
Thomas E. Caldwell
Aerosol optical depths (AODs) used for the Edition 4.1 Clouds and the Earth's Radiant Energy System (CERES) Synoptic 1∘ (SYN1deg) product are evaluated. AODs are derived from Moderate Resolution Imaging Spectroradiometer (MODIS) observations and assimilated by an aerosol transport model (the Model for Atmospheric Transport and Chemistry – MATCH). As a consequence, clear-sky AODs closely match with those derived from MODIS instruments. AODs under all-sky conditions are larger than AODs under clear-sky conditions, which is supported by ground-based AErosol RObotic NETwork (AERONET) observations. When all-sky MATCH AODs are compared with Modern-Era Retrospective analysis for Research and Applications (Version 2; MERRA-2) AODs, MATCH AODs are generally larger than MERRA-2 AODs, especially over convective regions (e.g., the Amazon, central Africa, and eastern Asia). This variation is largely due to the differing methods of assimilating the MODIS AOD data product and the use of quality flags in our assimilation. Including AODs with larger retrieval uncertainty makes AODs over the convective regions larger. When AODs are used for clear-sky irradiance computations and computed downward shortwave irradiances are compared with ground-based observations, the computed instantaneous irradiances are 1 %–2 % larger than observed irradiances. The comparison of top-of-atmosphere clear-sky irradiances with those derived from CERES observations suggests that AODs used for surface radiation observation sites are 0.01–0.03 larger, which is within the uncertainty of instantaneous MODIS AODs. However, the comparison with AERONET AODs suggests that AODs used for computations over desert sites are 0.08 larger. The cause of positive biases in downward shortwave irradiance and in AOD for the desert sites is possibly due to the dust particle size and distribution, as defined by the MATCH transport model, and the transfer of that information into the radiative transfer model.
- Article
(14349 KB) - Full-text XML
- BibTeX
- EndNote


Accurate estimates of the radiative effects of clouds and aerosols are essential for an understanding the radiative forcing to the Earth's climate system (Bauer and Menon, 2012; Boucher et al., 2013). In addition, through the reflection and absorption of solar radiation as well as the absorption and emission of terrestrial thermal radiation, clouds and aerosols affect the radiative heating of both the atmosphere and the surface, which in turn governs the atmospheric circulation and the hydrological cycle (e.g., Stephens et al., 2020; L'Ecuyer et al., 2015). Under the Earth Observing System (EOS) program, the National Aeronautics and Space Administration (NASA) has placed into orbit a series of satellites devoted to long-term observations of the climate state. Among these are Terra and Aqua, the flagship satellites of the EOS. Central to observation of climate evolution are the Moderate Resolution Imaging Spectroradiometer (MODIS) and the Clouds and the Earth's Radiant Energy System (CERES) instrument pairs that fly on both the Terra (March 2000–present) and Aqua (July 2002–present) platforms (Wielicki et al., 1996). Additional CERES instruments have been launched (October 2011) upon the Suomi National Polar-orbiting Partnership (NPP) satellite along with the MODIS successor, the Visible Infrared Imager Radiometer Suite (VIIRS), and on the NOAA-20 satellite (November 2017). In addition to observations from these satellites, the CERES mission also integrates observations from the Geostationary Operational Environmental Satellites (GOES) (West and East), as well as other geostationary satellites around the globe, for full diurnal coverage of clouds and radiation.
The CERES instruments measure broadband radiances over the solar spectrum (shortwave), the thermal infrared (longwave radiance is obtained from a total channel minus the shortwave channel), and the near-infrared atmospheric window, with frequent onboard calibration. CERES measurements, in conjunction with MODIS information, are used to infer broadband irradiances through empirical angular distribution models (ADMs). Geosynchronous satellite imagery observes the diurnal cycle of clouds, which is not fully sampled by the polar-orbiting satellites upon which CERES and MODIS reside.
While top-of-atmosphere (TOA) irradiances are derived from broadband radiances measured by CERES instruments (Loeb et al., 2005; Su et al., 2015a, b), surface and atmospheric irradiances are computed with a radiative transfer model. Inputs used for the computations include cloud properties derived from MODIS and geostationary satellites, aerosol optical depth (AOD) derived from MODIS radiances, and surface albedo derived from MODIS and CERES observations (Rutan et al., 2009). Temperature and humidity profiles are provided by a reanalysis product produced by the NASA Goddard Modeling and Assimilation Office (GMAO).
Irradiances at the surface produced by the CERES team have been compared with surface observations (Rutan et al., 2015; Kato et al., 2013, 2018). These comparisons are for all-sky conditions (i.e., including any clouds). Irradiances under clear-sky conditions are not explicitly separated from all-sky conditions in the evaluations. There are several factors that impede efforts at rigorous validation of clear-sky irradiances with surface observations: (1) a clear-sky condition at a given site does not persist over a long time period (e.g., a month or longer), (2) there are mismatches between clear-sky conditions determined by satellite- and ground-based instruments, and (3) the field-of-view size between CERES instruments and ground-based radiometers differ.
Despite difficulties in evaluating computed clear-sky irradiances, they play an important role in quantifying aerosol and cloud radiative effects (Loeb and Su, 2010; Soden and Chung, 2017). Therefore, the uncertainty in surface irradiances needs to be understood in order to assess the uncertainty in the aerosol and cloud radiative effect. This work is the first attempt by the CERES team to evaluate clear-sky surface irradiances provided by its data products. One of the essential variables in computing clear-sky irradiances is AOD. In this paper, we evaluate the AOD used for irradiance computations in the CERES project and analyze how the error propagates to clear-sky surface irradiances. Computations of surface irradiances provided by the Edition 4.1 SYN1deg data products use AOD derived by a chemical transport model (the Model for Atmospheric Transport and Chemistry – MATCH; Collins et al., 2001) that assimilates MODIS-derived AOD. In Sect. 2, we explain in the MATCH aerosol transport model and the assimilation of AOD with MODIS. We then compare MATCH AOD to the MODIS and Modern-Era Retrospective analysis for Research and Applications (Version 2; MERRA-2) aerosol products as well as to AOD from the AErosol RObotic NETwork (AERONET; Holben et al., 1998). Section 3 discusses differences found between the various estimates of AOD. Section 4 looks at clear-sky surface irradiance calculations from the SYN1deg product compared to observed values as well as the impact of AOD and particle size on the results. Conclusions are presented in Sect. 5.
The Model for Atmospheric Transport and Chemistry (MATCH) is a transport model of intermediate complexity driven by off-line meteorological fields from the National Centers for Environmental Prediction (NCEP) reanalysis. It is run on a 194×96 () spatial grid with a vertical resolution of 28 σ–p levels. Temporally, the meteorological fields are linearly interpolated to 30 min time steps at which time the chemical processes are run. One exception is that the sulfur model is interpolated again to run at 2 min subscale time steps. MATCH is one of the many aerosol transport models that participated in the AeroCom model intercomparison project (Textor et al., 2006, 2007; Kinne et al., 2006) and the AeroCom carbon intercomparison project (Koch et al., 2009; Huneeus et al., 2011).
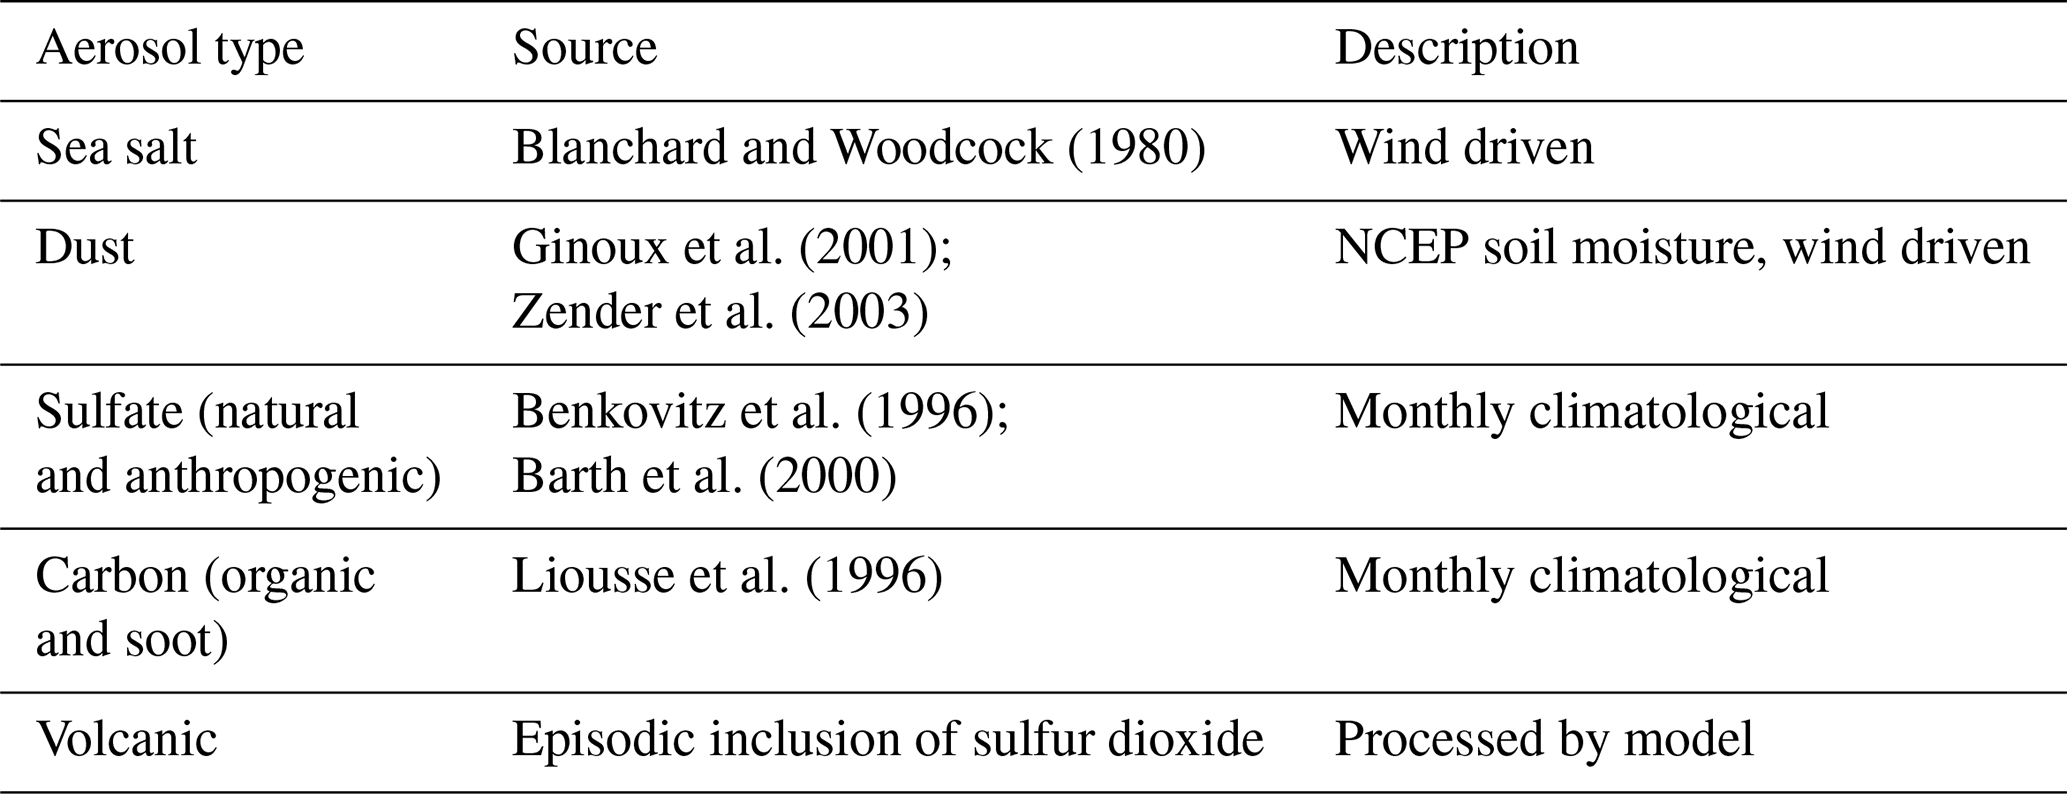
Aerosol types included in MATCH are dust, sulfate, sea salt, soot, sulfates, carbon, and volcanic particles (Table 1). Model physics included in MATCH are parameterizations for convection and boundary layer processes that include prognostic cloud and precipitation schemes for aqueous chemistry and the scavenging of soluble species. MATCH also includes the ability to resolve the transport of aerosols via convection, boundary layer transport, and scavenging and deposition of soluble gases and aerosols. MATCH can simulate most cloud processes currently in use in a global climate model (GCM) (e.g., cloud fraction, cloud water and ice content, fraction of water converted to rain and snow, and evaporation of condensate and precipitate). It also includes vertical turbulent-eddy processes. These processes are then used for convective transport, wet scavenging, wet deposition, and dry deposition of the MATCH aerosols. These various parameterizations were originally developed for the NCAR Community Climate Model (CCM) and subsequently incorporated into the MATCH model. Descriptions of these parameterizations are given by Rasch et al. (1997, 2001), Collins et al. (2001), and additional papers described therein.
The MATCH aerosol suite includes a detailed mineral dust scheme in the Dust Entrainment and Deposition model (Zender et al., 2003) and a diagnostic parameterization for sea salt aerosol based on the 10 m wind speed (Blanchard and Woodcock, 1980). The sulfur cycle and the chemical reactions for sulfate aerosol creation rely on monthly climatological oxidant fields and emission inventories (Table 1) for sulfur oxides and oceanic dimethyl sulfide (photochemistry and nitrate aerosol are omitted). The reaction scheme is similar to that of the Model for Ozone and Related Chemical Tracers (MOZART; Emmons et al., 2010). Carbon aerosols (both organic compounds and soot) evolve with simple mean lifetime e foldings from surface fluxes specified through natural, biomass burning, and fossil fuel burning emission inventories (monthly climatologies sources are given in Table 1).
The optical properties of the various aerosol types (e.g., mass extinction coefficient and single-scattering albedo), which are key parameters for aerosol assimilation, are drawn from the standard Optical Properties of Clouds and Aerosols (OPAC; Hess et al., 1998) database. However, scattering properties of maritime and dust aerosols used in the radiative transfer calculations in the SYN1deg product are not from MATCH. Instead, aerosol types from MATCH are mapped to a similar set of scattering properties (see Table 2) embedded in the Langley Fu–Liou radiative transfer (LFLRT) code (Fu and Liou, 1993; Fu et al., 1998; Rose et al., 2013). These include OPAC, as in MATCH, for all but the small and large dust particles. Dust scattering and absorption properties in the LFLRT code are from Sinyuk et al. (2003).
Table 2Mapping of MATCH aerosol types into radiative transfer code.
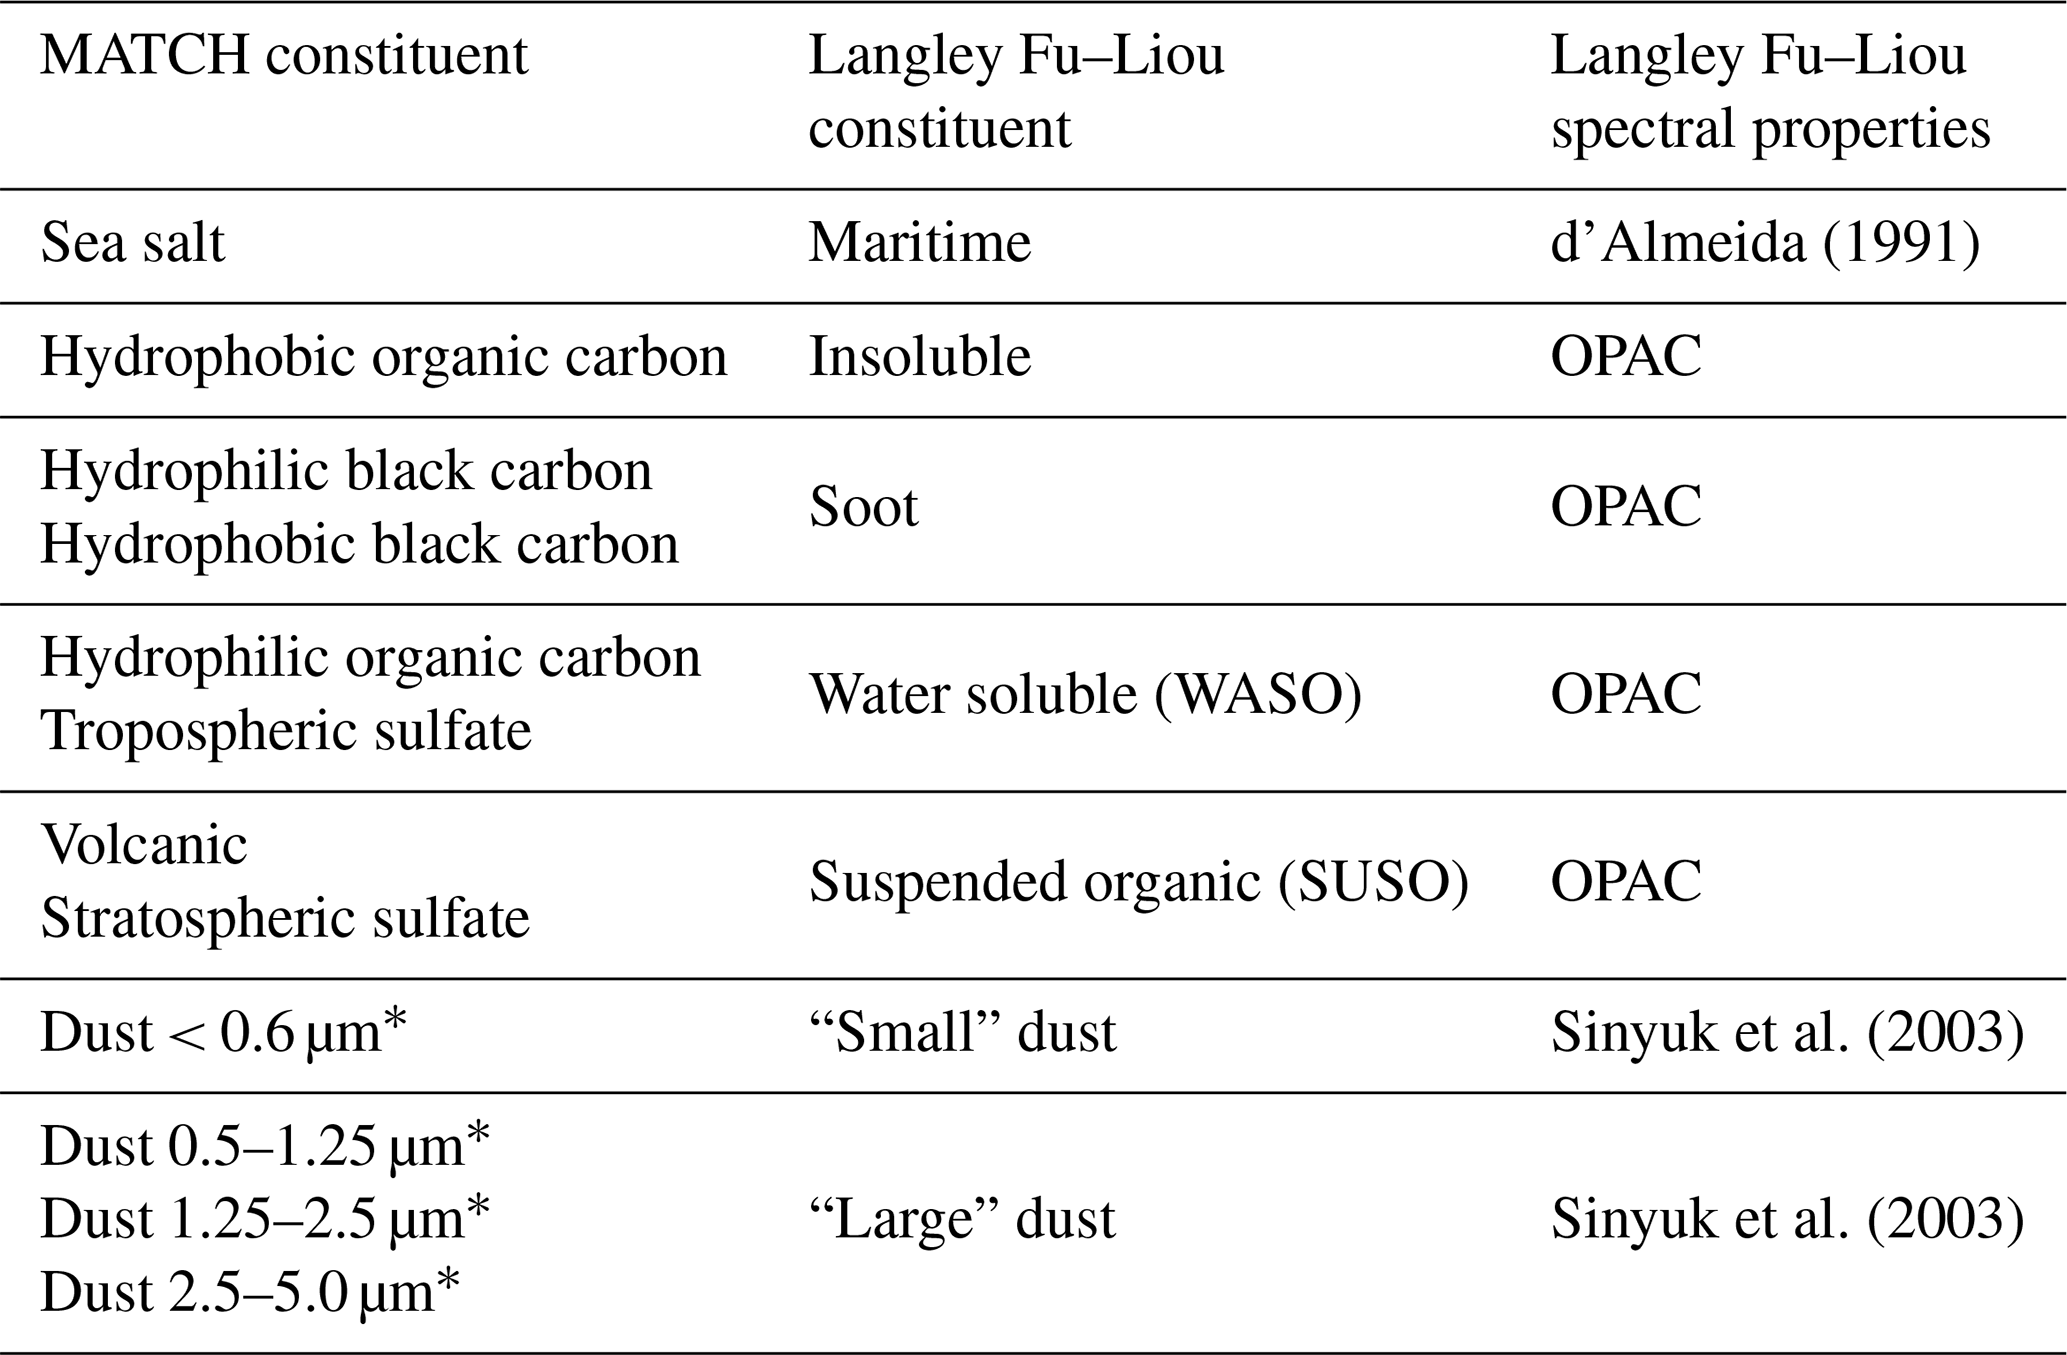
* Effective radius.
Figure 1 shows the single-scattering albedo (SSA) and asymmetry parameter (ASY) for the seven constituents in the LFLRT code at 500 µm. Constituents with constant SSA and/or ASY are given as numbers, whereas those that vary with relative humidity are plotted. The spectral properties for sea salt shown in Fig. 1 were taken directly from tables in d'Almeida et al. (1991). Note that the asymmetry parameter of maritime aerosol decreases with humidity. This is likely an error in the original Table A.30 of d'Almeida et al. (1991). We also note that large dust particles (>0.5 µm reff) modeled by MATCH are aggregated into a single set of optical properties in the LFLRT. The optical properties are themselves an integrated estimate from a range of dust particle properties. This is a potential source of error, particularly for regions where large dust particles are common.
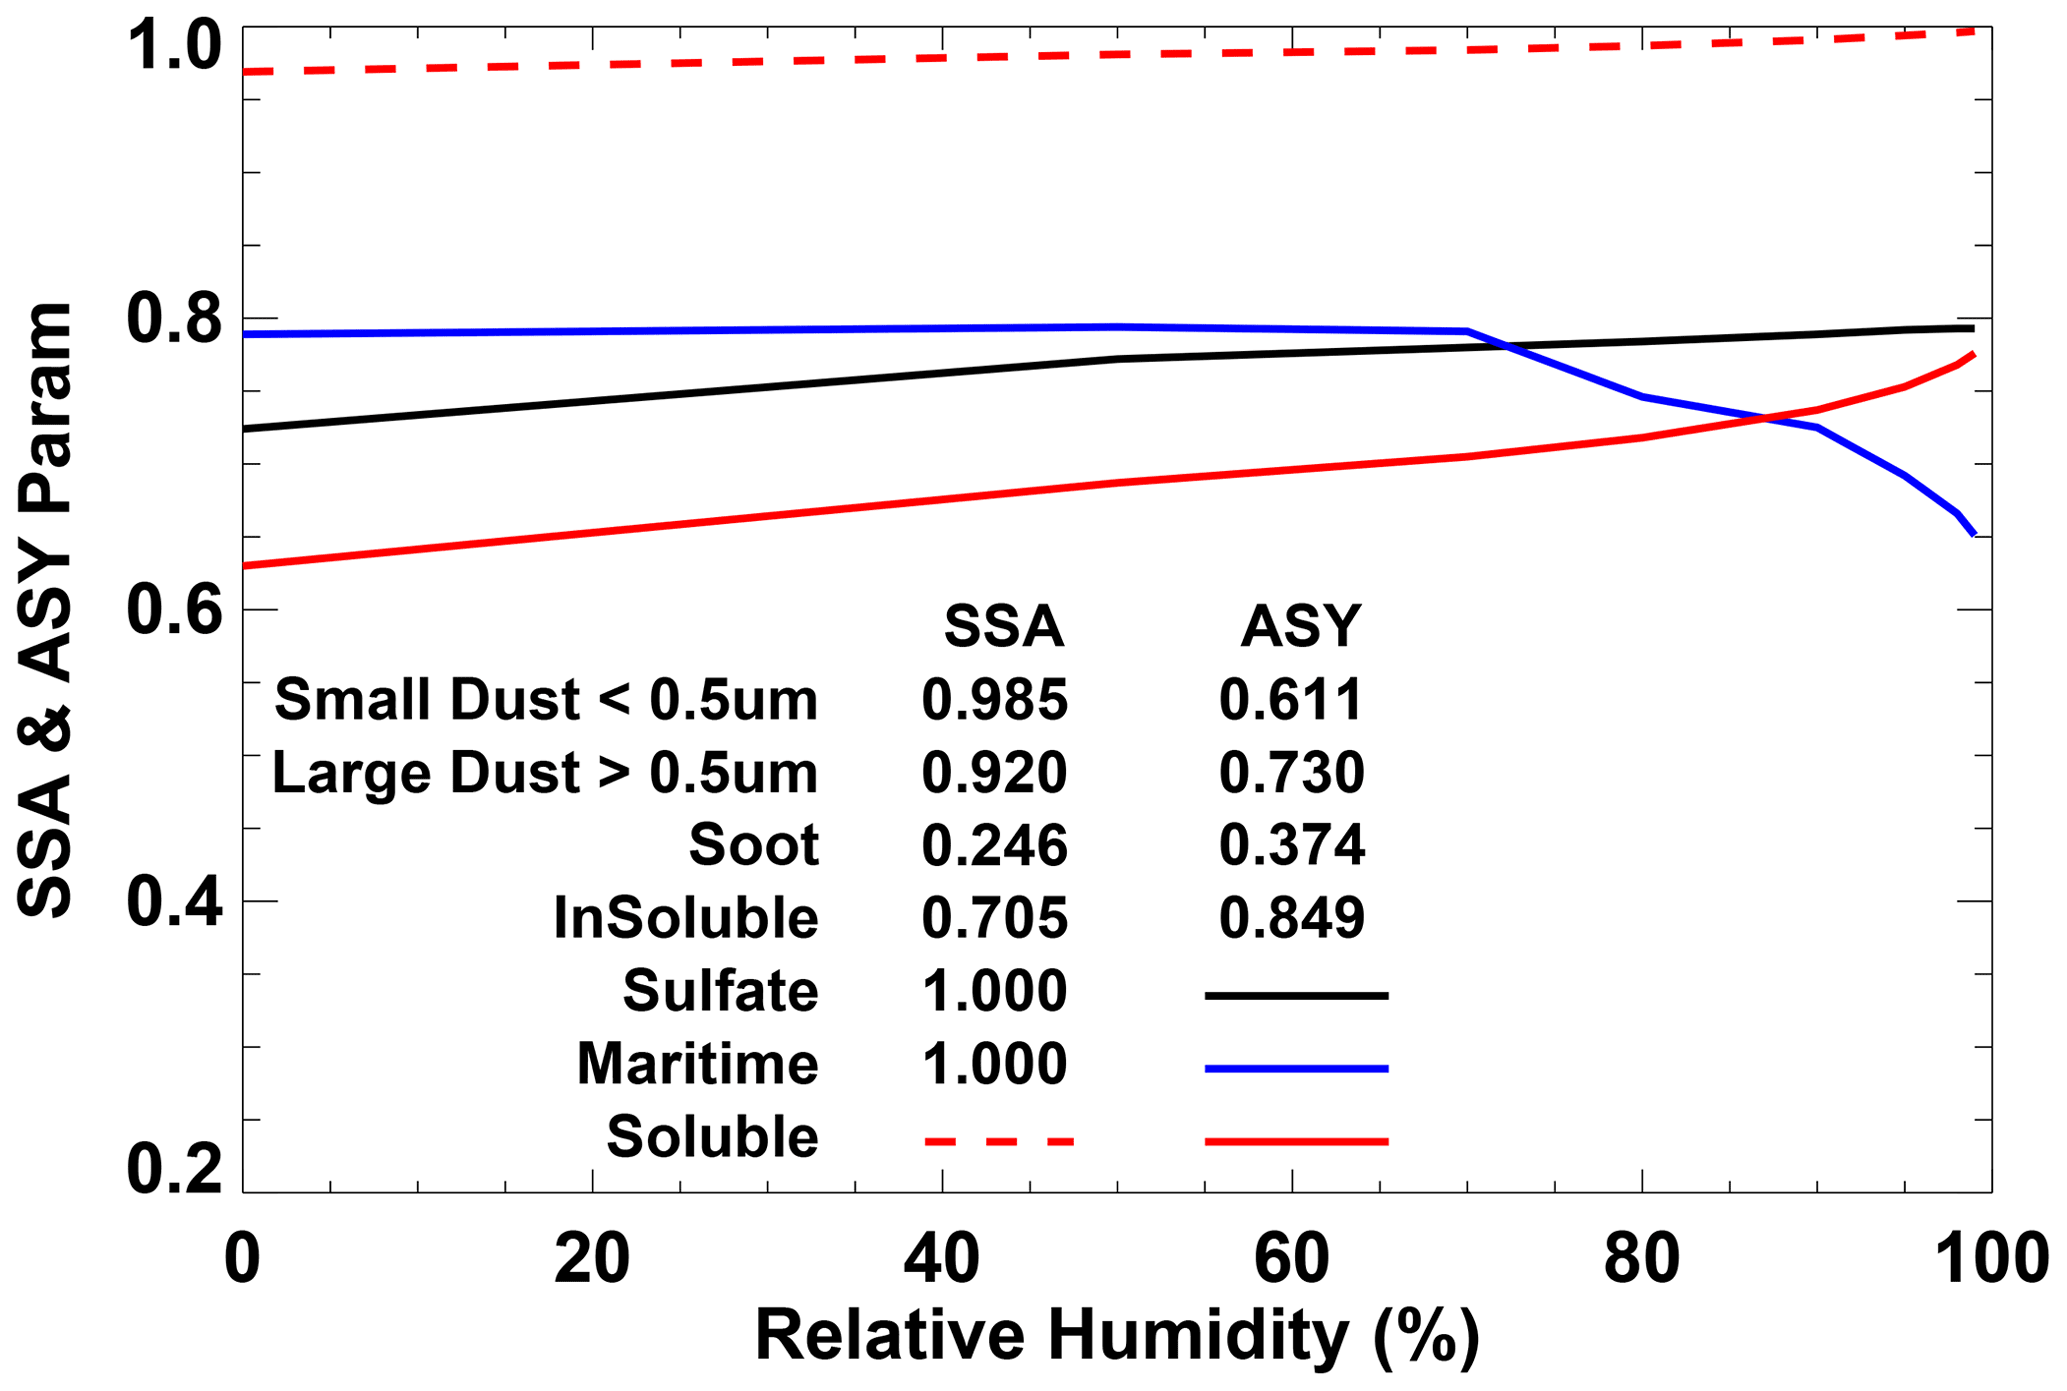
Figure 1The single-scattering albedo (SSA) and asymmetry parameter (ASY) for the seven aerosol types available in the Langley Fu–Liou model SYN1deg calculations. Only those that vary with relative humidity are plotted; others are listed as constants. All values are for properties at 550 µm. (Dust particle size refers to reff.)
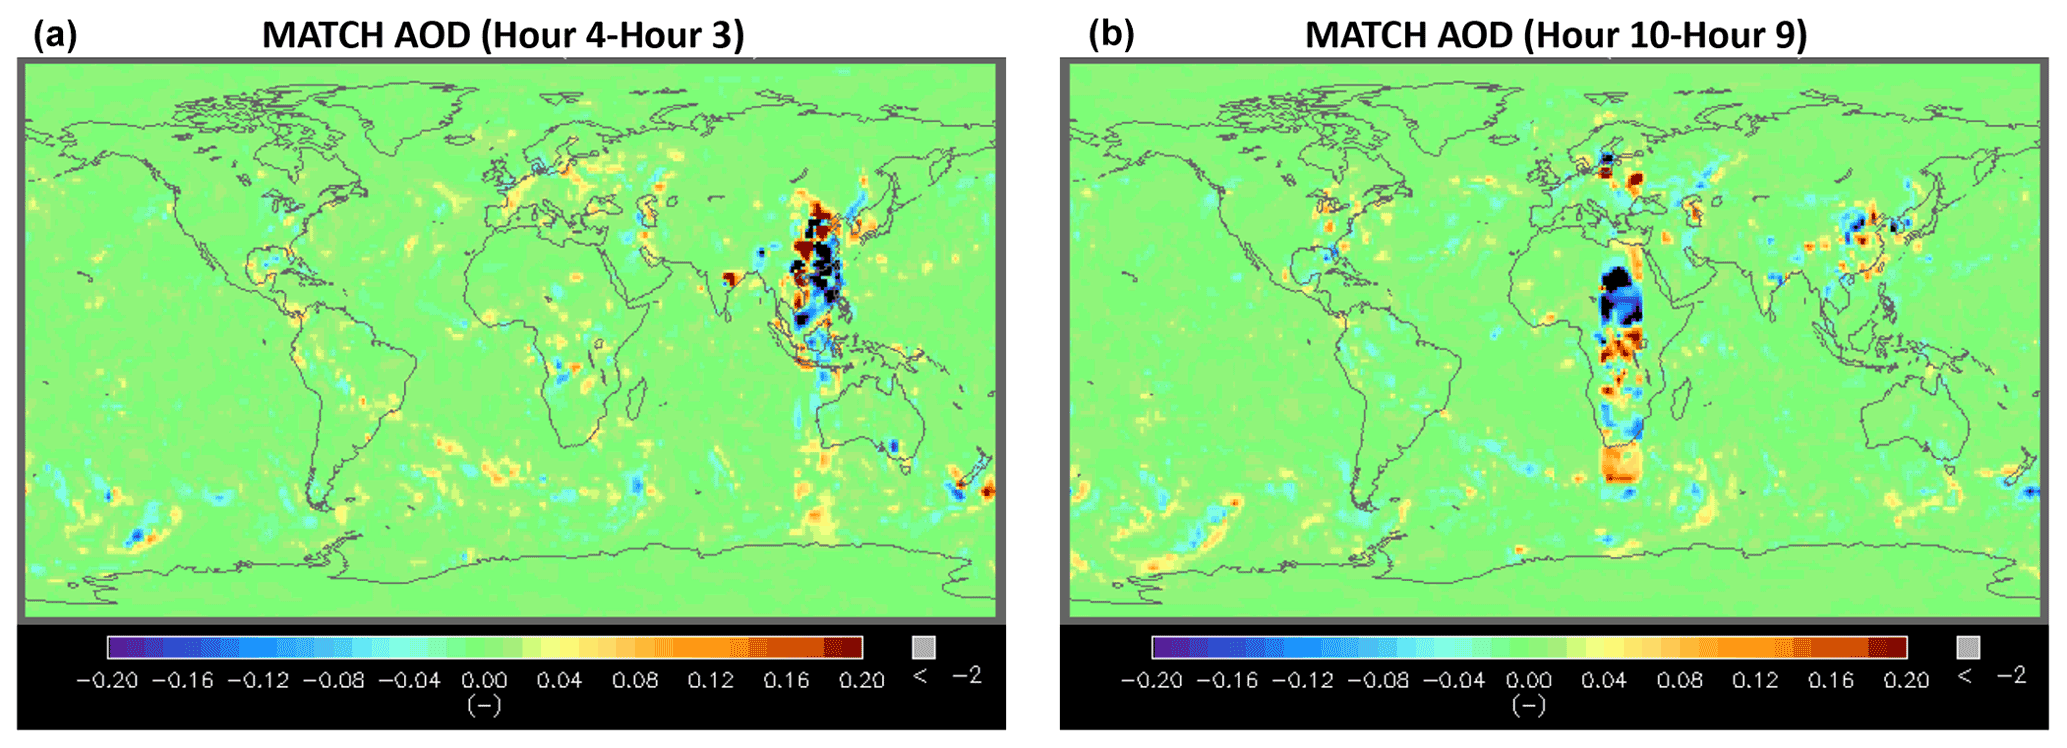
Figure 2The difference in MATCH AOD due to the assimilation of MODIS AOD. Panel (a) shows 04:00 UT minus 03:00 UT on 1 February 2020, and panel (b) shows 10:00 UT minus 09:00 UT on 1 February 2020. AOD is adjusted at the local solar noon within the 15∘ longitudinal band by the MODIS AOD assimilation. Wind-blown dust and sea salt differences are also apparent outside the 15∘ longitudinal band.
2.1 MATCH assimilation of MODIS AODs
One major advantage of the MATCH model is its ability to reliably assimilate satellite-based retrievals of AOD to constrain the climatologically forced aerosols generated within the chemical transport portion of the code. Edition 4 MATCH algorithms ingest MODIS Collection 6.1 AOD (Remer et al., 2005), beginning in March 2000 from the Terra satellite and June 2002 from both the Terra and Aqua satellites. MATCH assimilates MODIS AOD at the green wavelength of 550 nm, and it combines AOD derived by the Dark Target (Levy et al., 2013) and Deep Blue algorithms (Hsu et al., 2006). A global daily mean AOD in a grid is derived from Terra and Aqua observations by simply averaging available Terra and Aqua AODs derived from Dark Target and Deep Blue in a grid box. Unlike the Dark Target and Deep Blue merged product (MOD08), we do not use a quality assurance confidence (QAC) score to screen AOD.
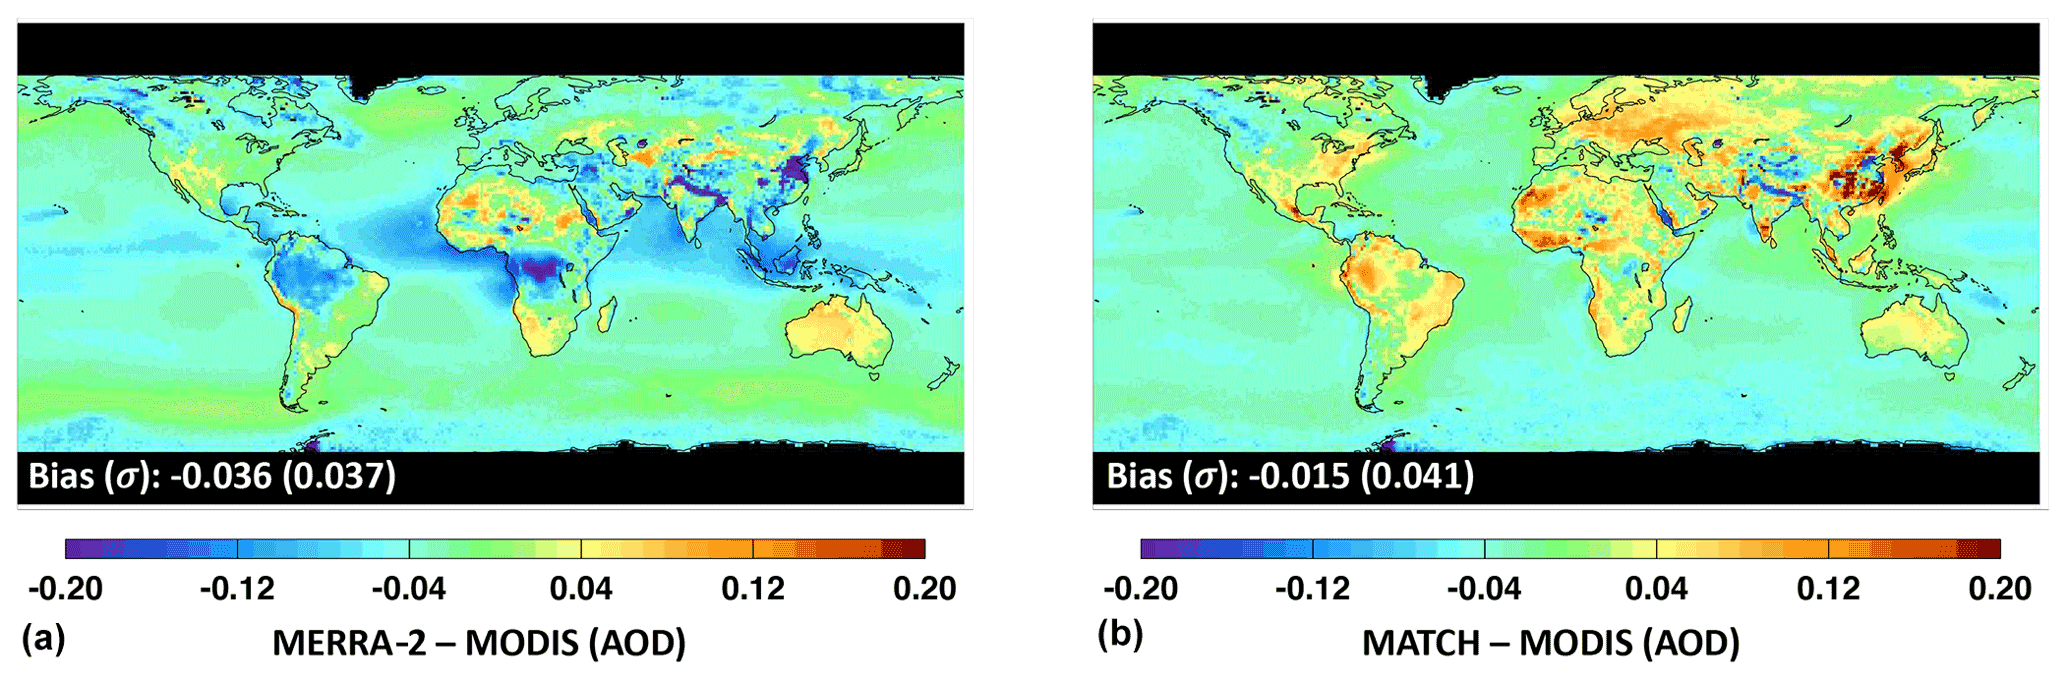
Figure 3Climatological mean aerosol optical depth (AOD, i.e., ; see Sect. 2.2 for the definition and an explanation of the notation used) difference in (a) MERRA-2 − MODIS and (b) MATCH − MODIS averaged over the period from March 2000 through February 2020. MERRA-2 and MATCH daily mean AODs are sampled when the daily mean MODIS AOD from the same grid is available. Sampled daily mean AODs are subsequently averaged. MODIS AODs are averages of the MODIS Dark Target and Deep Blue algorithms from both the Terra (MOD08) and Aqua (MYD08) data products.
The assimilation process begins by combining the Dark Target and Deep Blue AOD from MODIS (both Terra and Aqua when available) and creating daily averages. As MATCH progresses through time, the AODs at local solar noon are assimilated by taking a 15∘ longitude width of retrieved AOD from the daily mean map. Examples of the magnitude of AOD adjustments by the assimilation are shown in Fig. 2. Figure 2a shows hourly AOD field differences for 04:00 UT minus 03:00 UT on 1 February 2020. Similarly, Fig. 2b shows 10:00 UT minus 09:00 UT of the same day. The 15∘ vertical band is clearly visible, where red (blue) colors indicate that total column aerosol is increased (decreased) by the MODIS AOD assimilation. Following the AOD adjustment, aerosol masses in the atmospheric column through the troposphere are scaled to closely match the AOD derived from MODIS. Neither the vertical profile nor the relative abundance of the aerosol species is adjusted. Once aerosol mass is adjusted at the local noon for the regions where MODIS AOD is available, the adjusted aerosol mass is carried on to the next time step. Besides the MODIS adjustments, wind-driven sea salt creation and deposition are found along frontal boundaries in the North Atlantic and southern oceans. The maps also indicate hourly increases and decreases in high-aerosol-loading areas, such as those found around China and Southeast Asia. Episodic events such as intense fires or volcanic eruptions are not specifically included in the MATCH aerosol package. Such events are captured by the assimilation of MODIS AOD, and total column aerosol loading is adjusted upward. The adjustment is applied to AOD only. The aerosol type (and, thus, scattering properties) is not adjusted to reflect the reality of the scattering or absorbing aerosol during such an event.
2.2 MATCH and MERRA-2 comparison
In this section, we compare AODs between MATCH and MERRA-2 (Randles et al., 2017) in which MODIS clear-sky radiances are assimilated. MERRA-2 also assimilates surface-observed AOD from AERONET; ship-based AOD observations; and Advanced Very High Resolution Radiometer (AVHRR) and Multi-angle Imaging SpectroRadiometer (MISR) retrievals for the years 2000–2002 and 2000–2014, respectively. We compare AODs in two different ways: first, MATCH and MERRA-2 AODs are compared with MODIS AODs, which tests the consistency of daily means when MODIS AOD is available (i.e., clear sky somewhere in the grid box at Terra and Aqua overpass time); second, MATCH and MERRA-2 AODs are compared under all-sky conditions, which is only possible with modeled AODs.
Figure 3 shows differences in the climatological mean AOD between MERRA-2 and MODIS (panel a) and MATCH and MODIS (panel b). To compute the monthly mean AOD differences, both MERRA-2 and MATCH daily mean AODs are sampled when daily mean MODIS AOD (MODIS products MOD08 and MYD08) from the same grid is available (hereinafter ). Sampled daily mean AODs () are subsequently averaged (hereinafter , where the angle brackets indicate a simple arithmetic mean). Although both products assimilate MODIS observations, each shows fairly significant differences from MODIS values. Differences arise because MODIS daily mean AOD is a clear-sky product at the Terra and Aqua overpass times, whereas MERRA-2 and MATCH daily mean AOD includes the AOD from other times of the day. When the non-overpass time is also clear, MATCH should be close to MODIS ; however, when clouds are present in MATCH during non-overpass times, modeled AOD are used. Hence, the daily mean AOD can deviate from MODIS . In addition, AOD differences for MERRA-2 at Terra and Aqua overpass times might be larger than MATCH even under clear-sky conditions as MERRA-2 assimilates observed AOD data other than MODIS AOD when and where these events might occur.
While MATCH shows large positive differences over land, especially China and Southeast Asia, Australia, the Amazon, and North Africa, MERRA-2 shows significant negative differences over the major rain forest regions of South America, Africa, and the tropical western Pacific. Both products are closer to MODIS AOD over ocean compared with over land except that MERRA-2 shows a negative difference across the Indian Ocean and off the west coast of Africa in the Atlantic Ocean. When MODIS is available in the grid box, MATCH weighs MODIS AOD heavily in its assimilation at local solar noon so that MATCH AOD is nearly identical to MODIS AOD at the local noon in clear-sky regions. Consequently, the difference in the climatological global mean MATCH and MODIS (−0.015) is smaller than the difference in MERRA-2 and MODIS (−0.036).
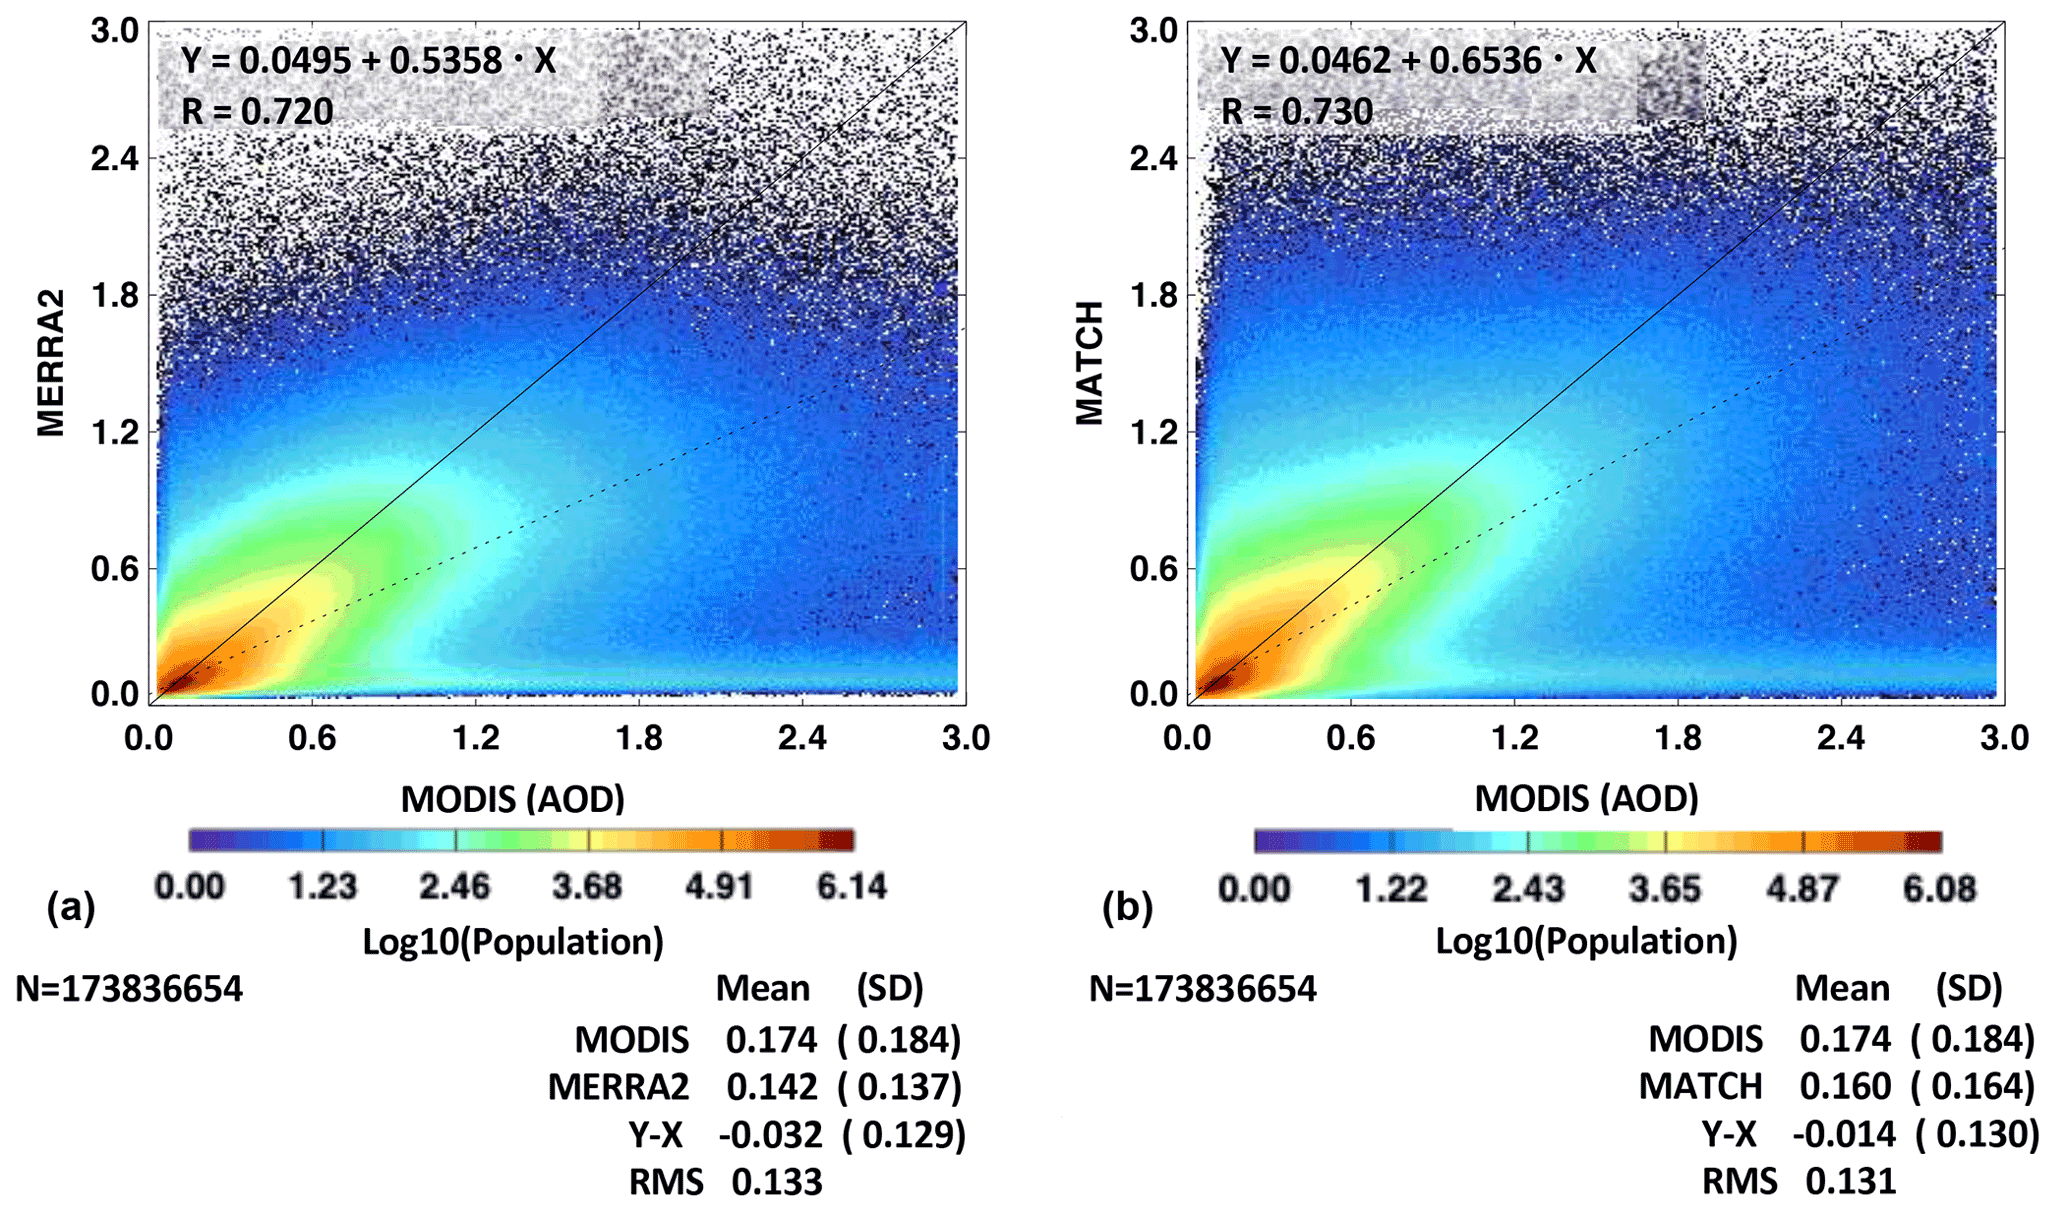
Figure 4Scatterplot of daily mean AOD from (a) MERRA-2 and (b) MATCH versus AOD derived from MODIS on Terra and Aqua for March 2000 through February 2020. MODIS AODs are daily averages derived by the Dark Target and Deep Blue algorithms. Only days and grid boxes that have MODIS AOD (i.e., , as defined in the text) are used.
Figure 4 shows the difference in more clearly. In Fig. 4, values are compared directly using a log-density plot, where each point represents a comparison for the daily average of a given grid box: MERRA-2 versus MODIS is shown in Fig. 4a, and MATCH versus MODIS is shown in Fig. 4b. Figure 4 indicates that MATCH has a smaller bias with respect to the MODIS AOD than the MERRA-2 AOD but has approximately the same root-mean-square (RMS) difference as the MERRA-2 .
We now consider the differences between the MATCH and MERRA-2 climatological AOD fields for all-sky and estimated clear-sky conditions more directly. Figure 5 shows climatological mean maps of MATCH AOD (panels a and c) and its difference from MERRA-2 (panels b and d) for all-sky (panels a and b) and estimated clear-sky (panels c and d) conditions for March 2000 through February 2020. A clear-sky-area-weighted monthly mean AOD is derived by averaging the daily mean AOD weighted by the clear fraction (hereinafter , where the overbar indicates a monthly mean); here, the clear fraction is derived from MODIS on Terra and Aqua (Loeb et al., 2020; Minnis et al., 2020). MATCH all-sky AOD (hereinafter ) is larger than MERRA-2 , particularly over the rain forest regions of the globe as well as India and China. Although the difference is smaller, the difference in shows a similar spatial pattern (Fig. 5d) to the all-sky difference. This is consistent with Fig. 3, showing that MERRA-2 underestimates AOD with respect to MODIS . A larger difference in MATCH AOD over convective regions (e.g., the Amazon, central Africa, and Southeast Asia) is caused by how Dark Target and Deep Blue AOD are merged. As mentioned earlier, we do not use QAC to screen AOD. Convective clouds introduce a larger uncertainty to AOD because of a 3D radiative effect or poor fit to observations with retrieved AOD (Robert Levy, personal communication, 2020). For these situations, AODs associated with QAC scores less than two are screened out in the MOD08 Dark Target and Deep Blue merged product (Levy et al., 2013).
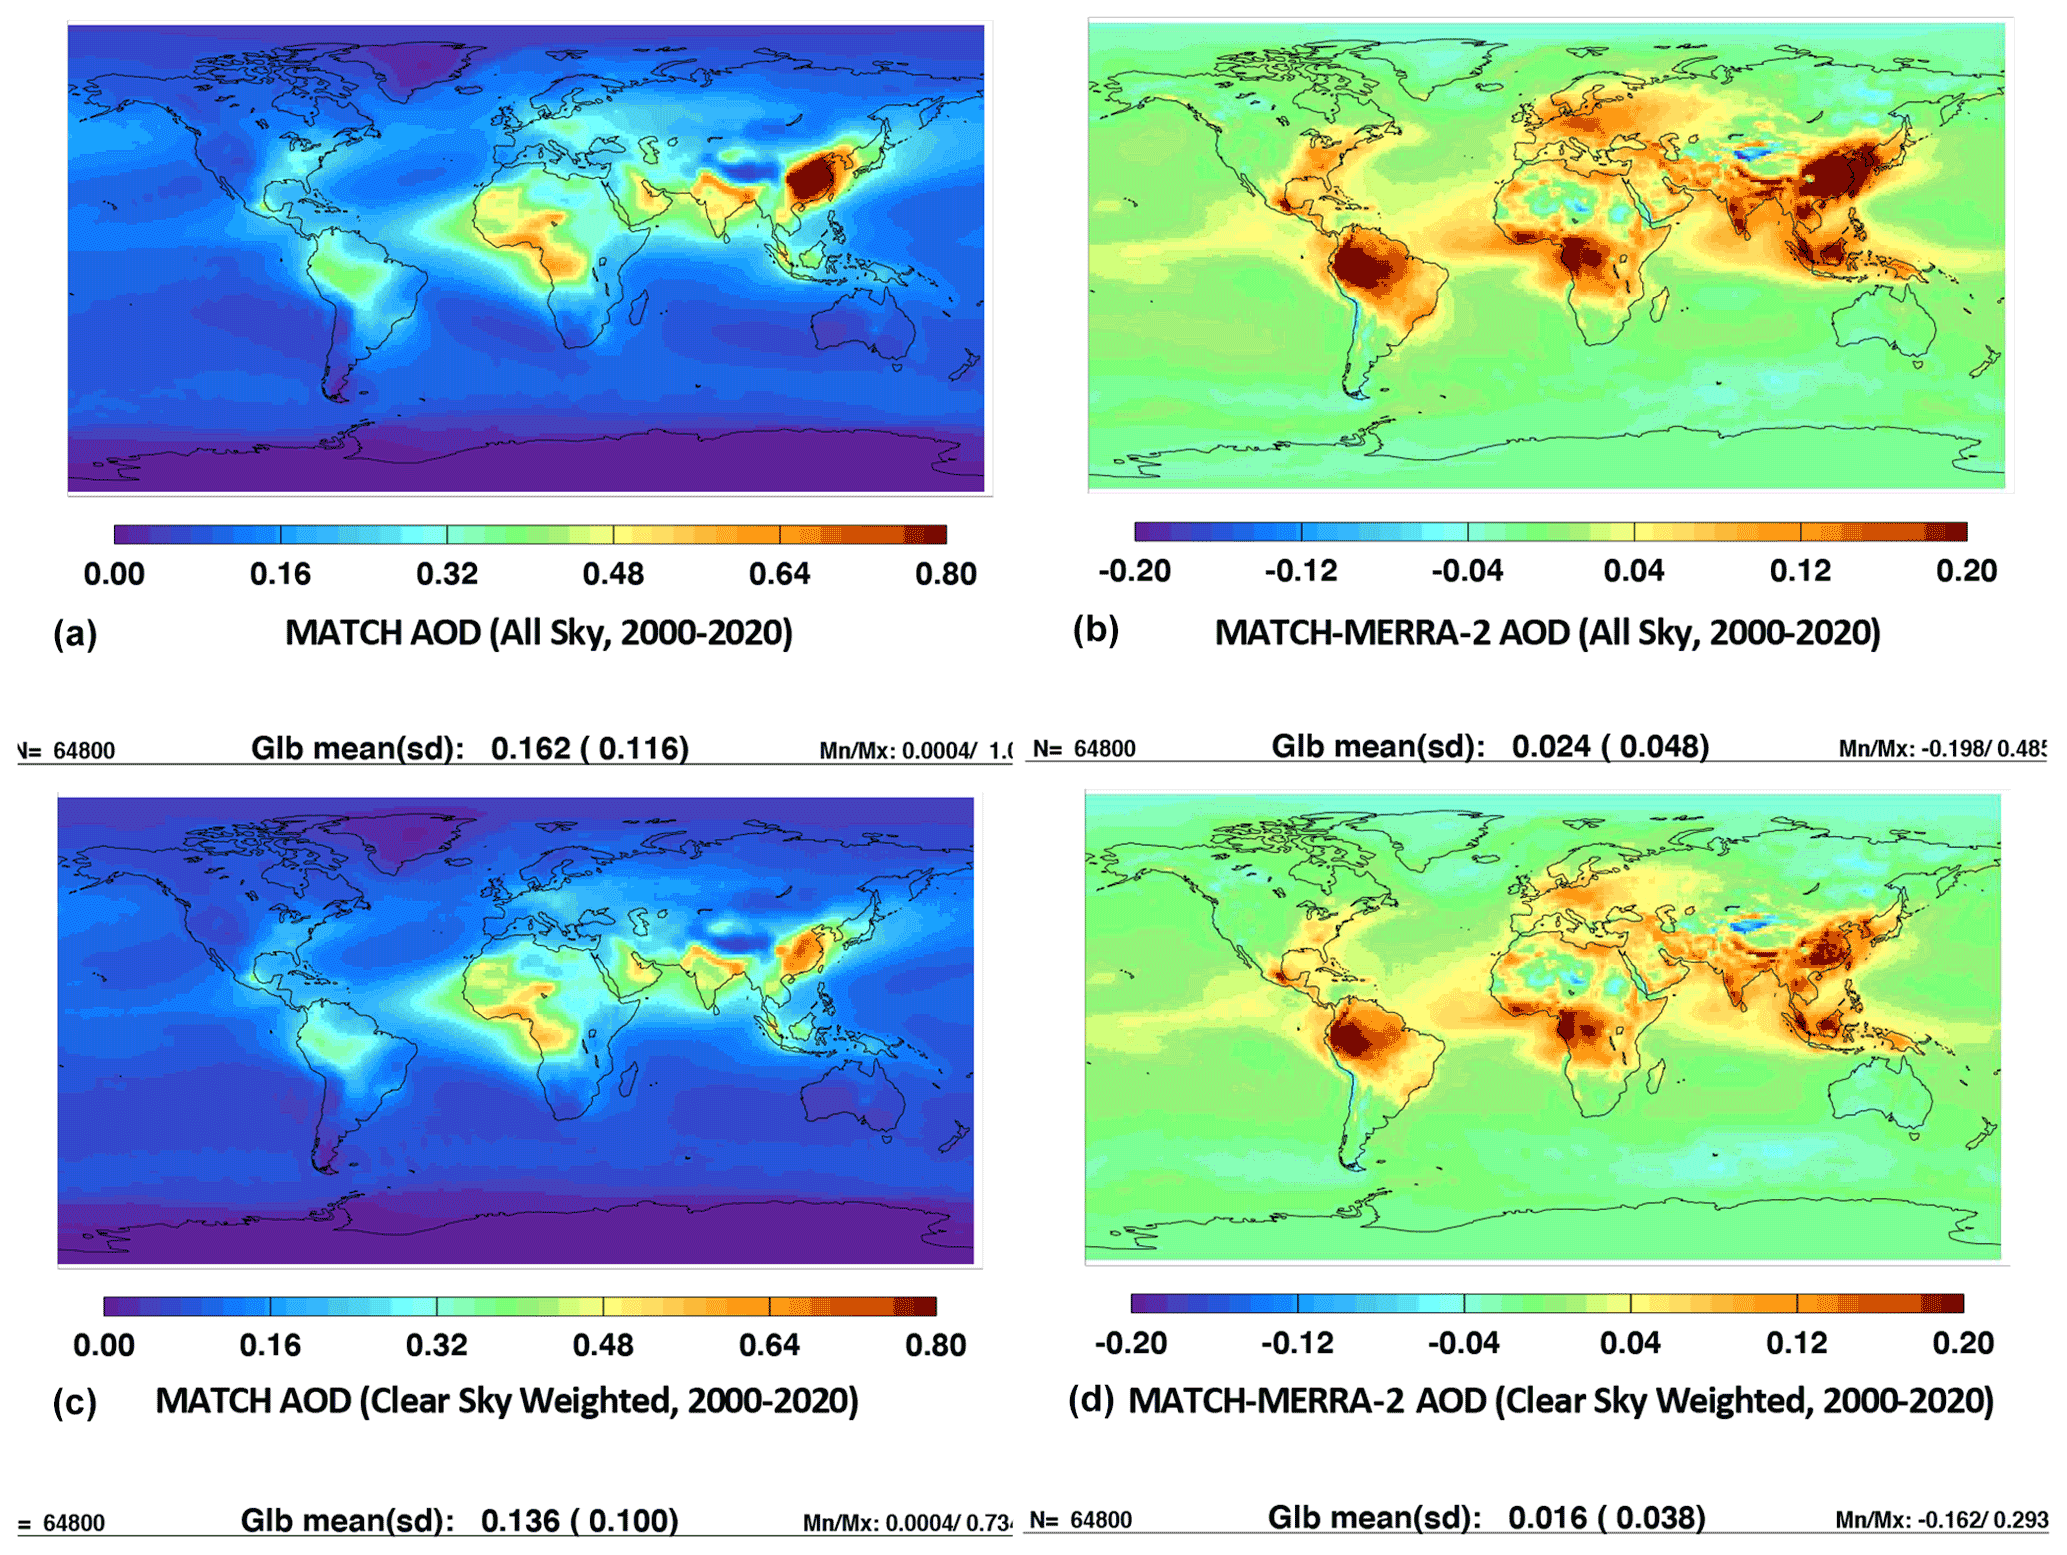
Figure 5(a, c) Climatological mean AOD from MATCH and (b, d) the difference between MATCH and MERRA-2 (MATCH − MERRA-2). Panels (a) and (b) show the all-sky results (), and panels (c) and (d) show maps of the clear-sky-area-weighted average of AOD (). Clear-sky-weighted monthly mean AOD is derived by averaging the daily mean AOD weighted by the daily gridded mean clear fraction, where the clear fraction is derived from the MODIS-based cloud fraction on Terra and Aqua.
2.3 Comparison with AERONET
The above results indicate that both MATCH and MERRA-2 are generally smaller than MODIS . The larger difference between MATCH and MERRA-2 over convective regions originated from the merged AOD product used for the assimilation. Of primary importance to radiative transfer calculations within the SYN1deg product is the ability of the MATCH model to accurately represent the total column AOD. To test the overall accuracy, we use observations from the AERosol RObotic NETwork (AERONET). AERONET is a global federation of ground-based remote sensing sites developed by NASA and now supported by a number of institutions around the world (Holben et al.. 1998). Each site maintains a CIMEL sun photometer that scans the daytime sky every 20 min. Collected data are processed according to standards of calibration and processing maintained by the AERONET project. Here, we utilize Level 2.0, data that have been screened for clouds and quality assured (Smirnov et al., 2000).
Figure 6 shows an hourly time series of AOD from MATCH, MERRA-2, and AERONET for January 2010 at the Beijing (China) AERONET site. Figure 6a shows the cloud fraction time series derived from MODIS and geostationary imagers (GEOS) from the SYN1deg Edition 4.1 product (Rutan et al., 2015), and Fig. 6b shows the AOD time series. Generally, both models produce a large variability in AOD at this site fairly well over the course of the month. While both MERRA-2 and MATCH AODs increase near times when the cloud fraction approaches 100 %, the increase in the MATCH AOD, which correlates relatively well with the increase in AERONET AOD, is larger than the increase in MERRA-2 AOD. Although the temporal correlation coefficient of the MATCH and AERONET AODs is smaller at this site during summer months than during winter months (not shown), a good temporal correlation between MATCH and AERONET AODs is consistent across most of the locations and times that we considered. To show this statistically, in the following, we extend this analysis to a number of AERONET sites grouped geographically based on general aerosol type.
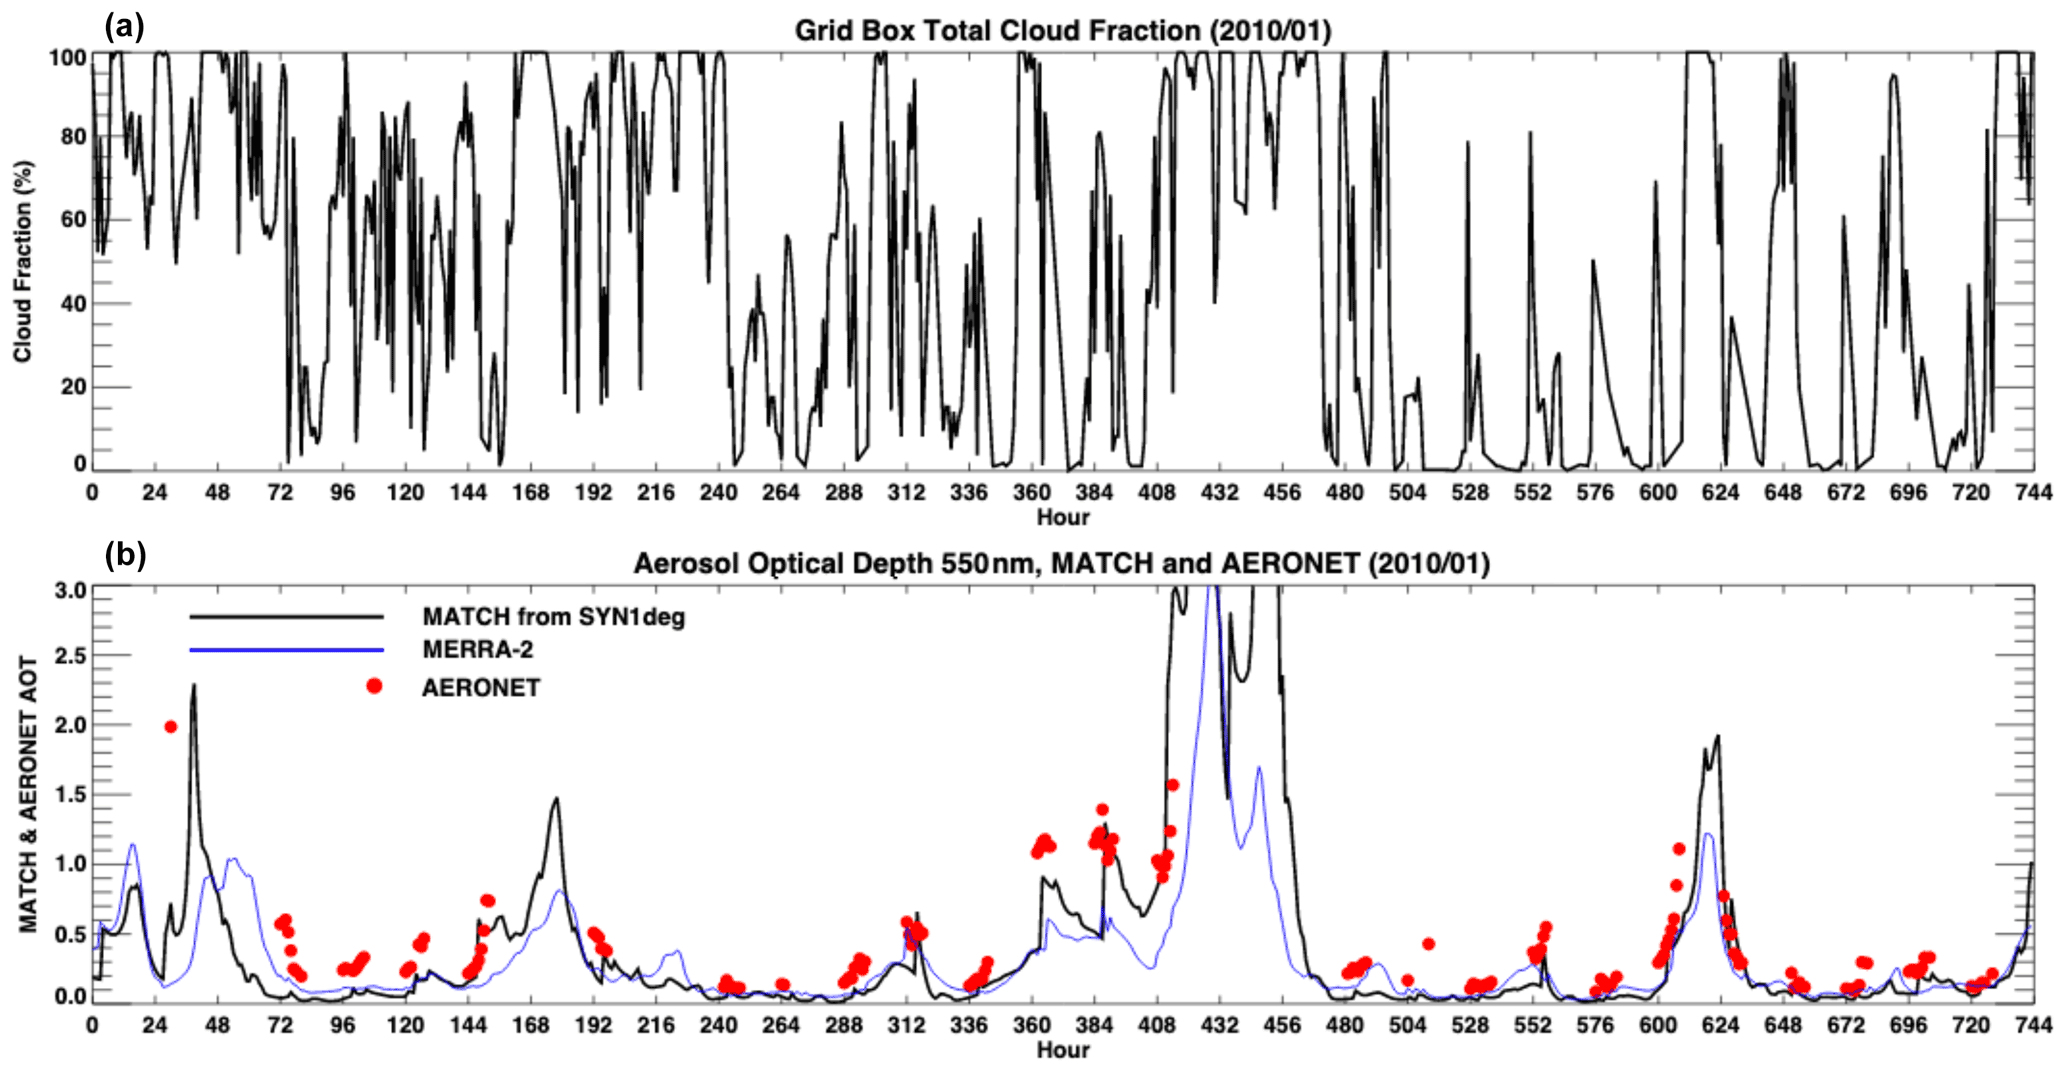
Figure 6Hourly time series of the (a) grid box cloud fraction from the SYN1deg Edition 4.1 CERES product and (b) AOD. Results are from the grid box containing the AERONET Beijing (China) site. The black line represents MATCH, the blue line represents MERRA-2, and the red dots represent AERONET observations. MATCH and, to a lesser degree, MERRA-2 often have large increases in AOD when the cloud fraction nears 100 %.
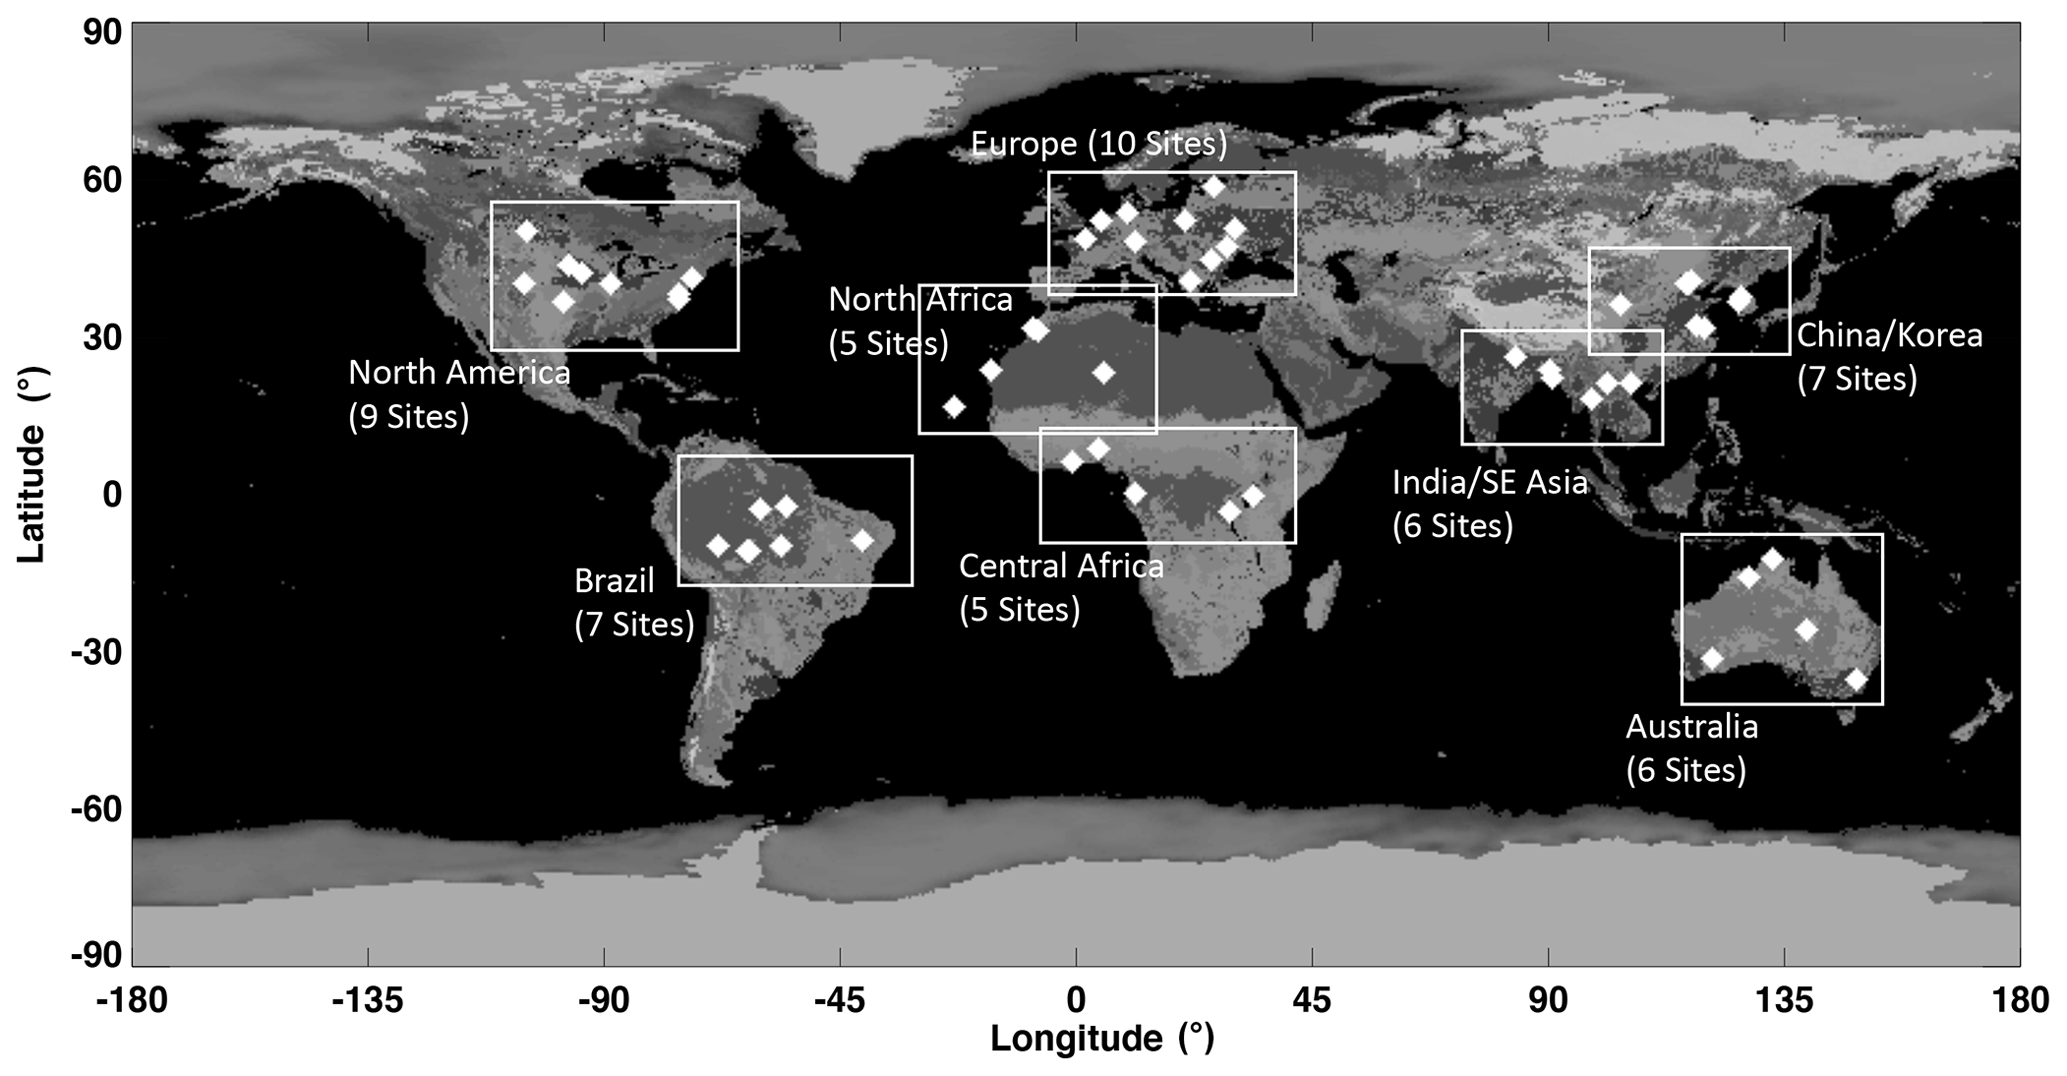
Figure 7The location of AERONET sites and how they are grouped for calculations of the mean, bias, and RMS with respect to the MATCH and MERRA-2 optical depths found in Tables 3 and 4.
AODs from AERONET are nominally provided at eight spectral channels every 20 min, given favorable conditions. We use two channels to derive observed AOD at 550 nm for comparison with the AOD provided by the MATCH model. Because the SYN1deg radiative transfer calculation is done hourly, we average any observations within a given hour period centered on the 30th minute for each site co-located within a SYN1deg grid box. The AERONET sites chosen are shown in Fig. 7, with a complete listing of all sites given in Appendix A. Although we examine 55 sites over more than 20 years, we aggregate the statistics within continental regions which naturally isolates them by general climatic conditions. Tables 3 and 4 show comparisons for each site grouping for clear-sky (less than 1 % cloud identified by MODIS and geostationary satellites in the SYN1deg grid box) conditions and for all-sky (any cloud condition within the SYN1deg grid box) conditions, respectively. Using clear-sky scenes identified by MODIS only gives the same statistical results with a lower number of samples. Statistics shown in Tables 3 and 4 are the average observed value, mean bias (MATCH − observation), root-mean-square (RMS) difference, and the correlation coefficient (R) over the time period from March 2000 through February 2020. The actual time period varies depending on the site due to AERONET data availability. The RMS difference and correlation coefficient are computed by each site with hourly mean values where observations are available from March 2000 through February 2020. For comparison purposes, we show the same statistics derived from observations compared to MERRA-2 AODs using the identical hours. We note, however, that MERRA-2 assimilates AERONET, whereas MATCH AODs are independent of AERONET AODs. MATCH AOD for the Brazil group is biased high by 0.02, and the China/Korea group has no appreciable bias compared with AERONET AODs. These two regions have a relatively large bias in from MATCH compared with MODIS AODs (Fig. 3b). In contrast, the negative bias values of MERRA-2 AODs compared with AERONET AODs for Brazil, central Africa, and China/Korea groups are consistent with the negative bias in MERRA-2 compared with MODIS AODs (Fig. 3a). For the China/Korea group, the RMS difference between MATCH AODs and AERONET AODs is 0.18, and the correlation coefficient is 0.7. These values are worse than their counterparts from MERRA-2 versus AERONET AODs: summertime agreement between MATCH and AERONET AODs is worse if a similar plot to Fig. 6 is created for summertime, as hygroscopic aerosols are dominant under high-relative-humidity conditions.
Table 3Hourly AERONET station statistics for MATCH and MERRA-2 for continental groups under clear-sky conditions*.
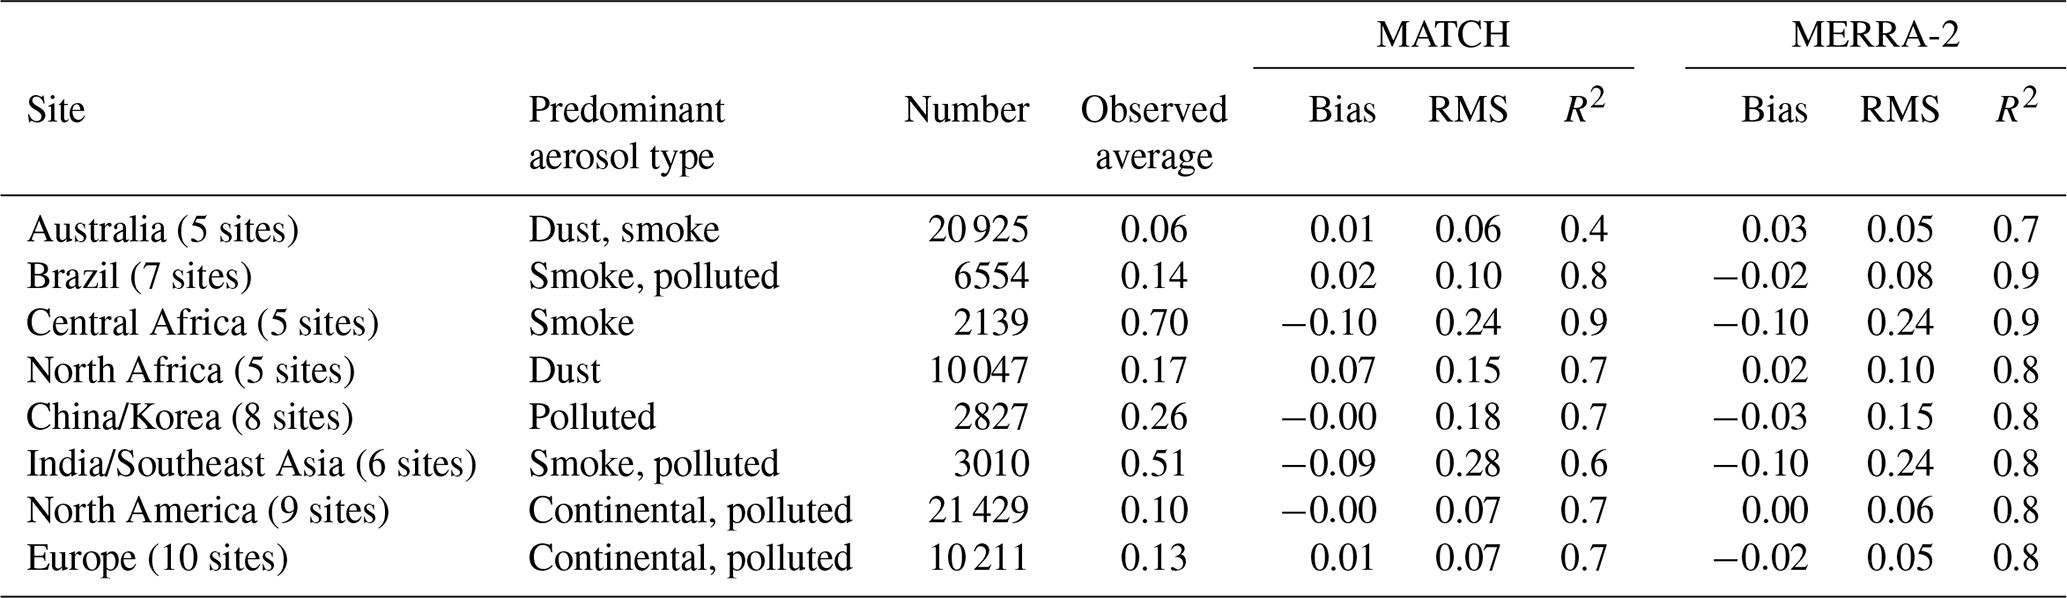
* The time period used is from March 2000 through April 2020, although the actual period varies by site depending on AERONET data availability. Clear sky is identified by MODIS and geostationary satellites, and the cloud fraction is less than 1 % over a SYN1deg grid box.
Table 4Hourly AERONET station statistics for MATCH and MERRA-2 for continental groups under all-sky conditions*.
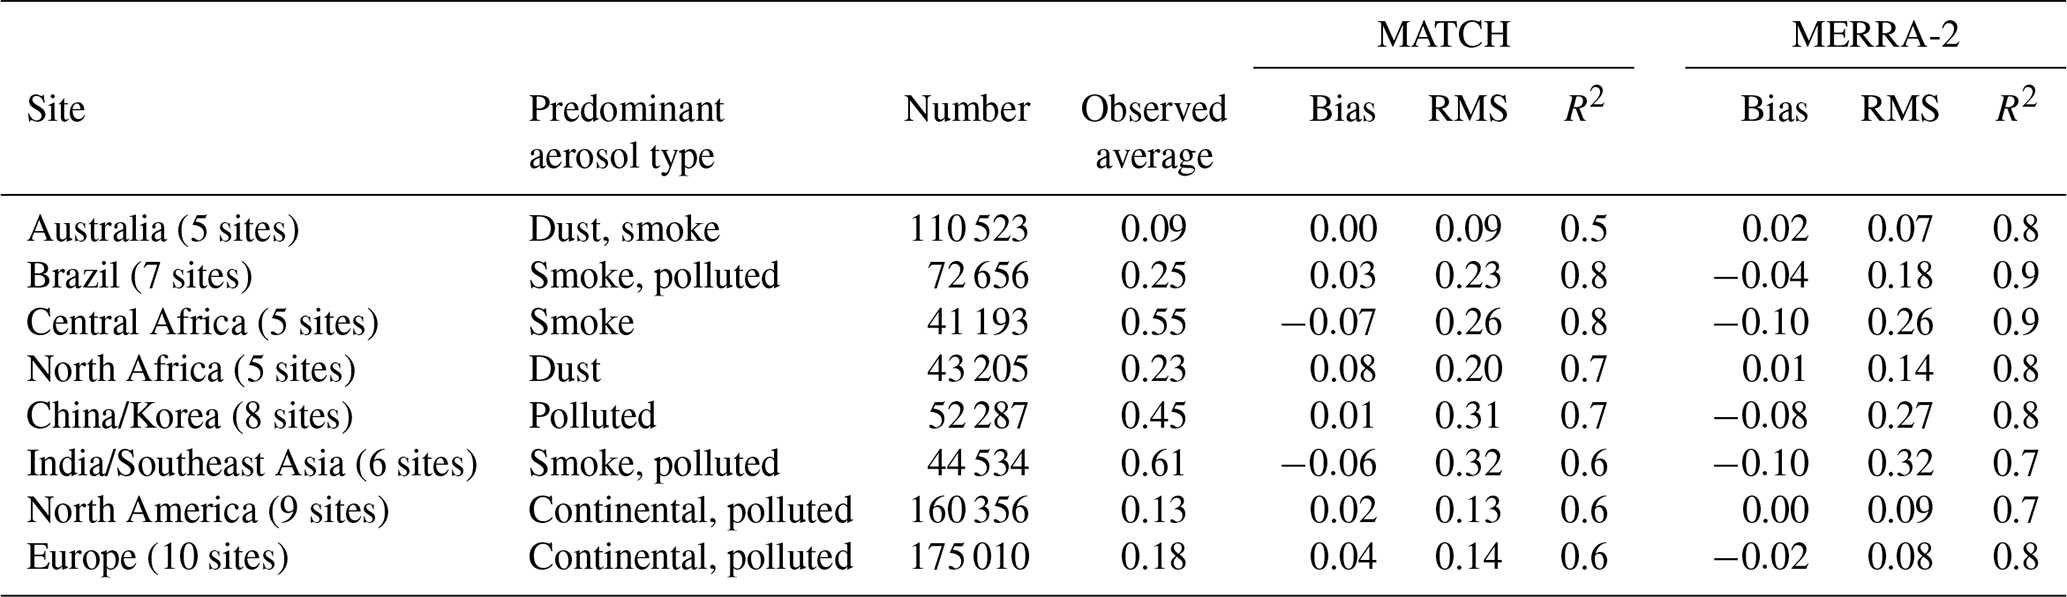
* The time period used for the statistics is from March 2000 through April 2020, although the total sample varies by site depending on AERONET data availability.
The sign of the MATCH AODs compared to AERONET AODs for all-sky conditions is generally consistent with the sign of their clear-sky counterparts. The RMS difference under all-sky conditions is generally larger than the clear-sky RMS difference, while the correlation coefficient is nearly the same. The biases for MERRA-2 comparisons are generally comparable to MATCH, although the RMS values for MERRA-2 tend to be slightly smaller and correlations tend to be higher, due in part to the assimilation of AERONET into the MERRA-2 model.
Results for all points across all sites and times are shown in Fig. 8. The color density plots are on a log scale and indicate that the vast majority of observations have an AOD of less than 1 for both the clear- and all-sky conditions observed within the SYN1deg grid box. Biases are less than 10 % of the mean value, but the RMS is large relative to the mean observed value. The overall correlation is approximately 0.8. The clear-sky hours (where SYN1deg estimated less than 1 % cloud in the grid box based on MODIS and GEOS observations) represent a little more than 10 % of the overall points. When MATCH AOD is compared to MERRA-2 AOD (not shown), MATCH is biased approximately 10 % higher.
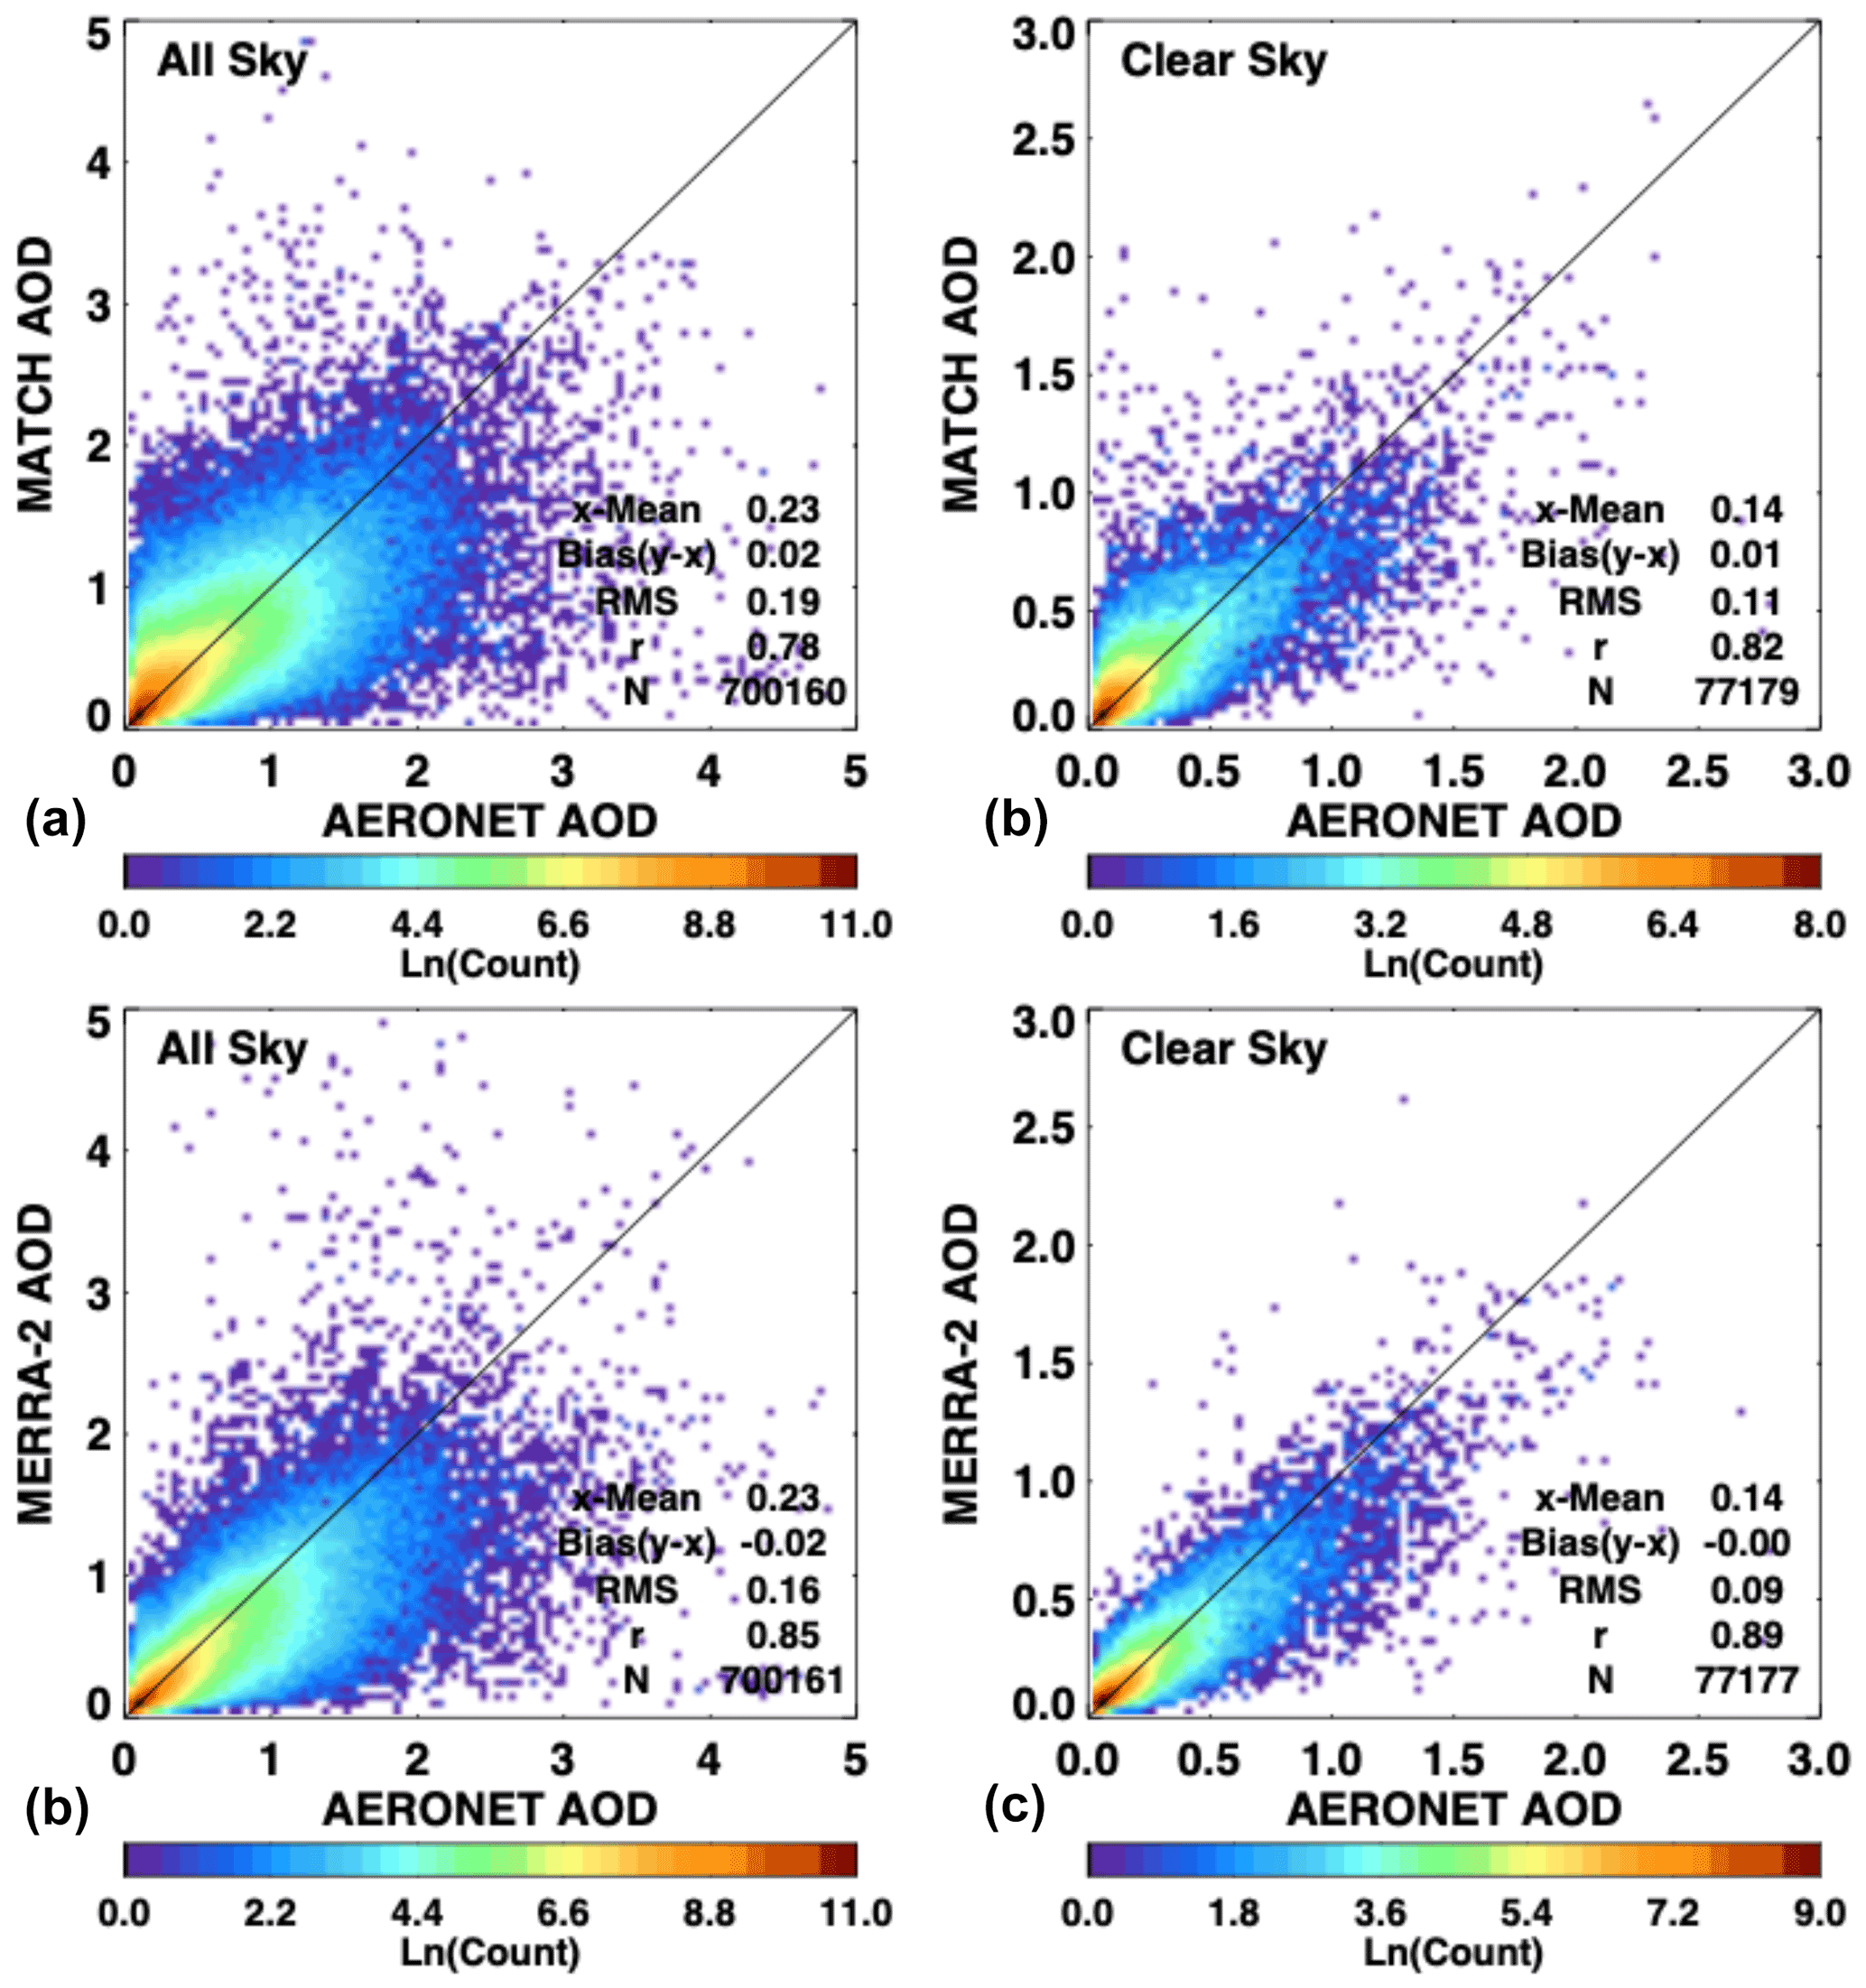
Figure 8All-sky (a, c) and clear-sky (b, d) comparisons of observed (AERONET) hourly mean optical depths to estimates from the MATCH model for more than 20 years at the 55 AERONET sites shown in Fig. 7.
In this section, we investigate the reason for the AOD differences shown in the previous section. In addition, we estimate the effect of the AOD differences on surface irradiances when MATCH AODs are used for surface irradiance computations.
Generally, cloud contamination in MODIS AODs is caused by unresolved sub-pixel-scale clouds (Kaufman et al., 2005; Martins et al., 2002). Therefore, the difference shown over convective regions seems to be caused by the uncertainty due to 3D radiative effects that impact retrieved AODs by unknown amounts (Wen et al., 2007), by errors in estimating the fraction of hygroscopic aerosols, or by errors in estimating water uptake by hygroscopic aerosols (Su et al., 2008; Marshak et al., 2021). Larger AODs are screened out in the MOD08 data product, whereas the CERES team uses all retrieved AODs regardless of the QAC score, likely increasing MATCH AOD overall. The comparison with AERONET AODs is not decisive to determine how to screen MODIS AODs because MATCH AODs are positively biased and MERRA-2 AODs are negatively biased for the Brazil group. The result underscores the difficulty involved in deriving accurate AODs, which appear to involve requirements in addition to the identification of clear-sky scenes. Levy et al. (2013) list the factors lowering the QAC score as (1) pixels are thrown out due to cloud masking, (2) the retrieval solution does not fit the observation well, and (3) the solution is not physically plausible given the observed situation. Therefore, even though the difficulty in identifying clear-sky scenes is driven by cloud contamination by trade cumulus (Loeb et al., 2018), the difficulty in deriving AODs exists over convective regions (Varnai et al., 2017) as well.
Larger positive biases of MATCH AODs compared with AERONET AODs exist over Africa (Tables 3, 4). For North Africa, the bias is known to be caused by excessive dust generated by the MATCH algorithm. Even though modeled aerosols are not often used over North Africa owing to the abundance of clear-sky conditions, the dust problem leads to a larger positive AOD bias. In addition, MATCH uses fixed aerosol sources in time. Therefore, it tends to miss large aerosol events, such as forest fires, until clear-sky conditions occur, allowing observations of the event by MODIS. This leads to a larger RMS difference and lower correlation coefficient with AERONET AODs compared with those from MERRA-2 versus AERONET.

Figure 9(a) The 15 min mean precipitable water distributions from microwave radiometer observations at the Atmospheric Radiation Measurement (ARM) Southern Great Plains (SGP) E13 site under all-sky and clear-sky conditions. (b) The 15 min mean AOD distributions from AERONET sun photometer measurements at 550 nm. “Clear sky” is defined here as a 15 min time period where the surface radiometry-based cloud fraction, from the Long et al. (2006) methodology, equals zero.
Because MODIS AODs are not generally available under overcast conditions, the reliance on modeled AOD increases as the cloud fraction over a grid increases. Figure 6, which shows that AERONET AOD increases with cloud fraction derived from satellites, indicates that as the cloud fraction over a grid increases, AOD over the clear-sky portion of the grid increases. In addition, Fig. 6 suggests that modeled AODs under near-overcast conditions are significantly larger than clear-sky AODs that are constrained by MODIS observations. Because we are unable to evaluate AODs for overcast conditions, we assess AOD changes with cloud fraction using ground-based observations. Figure 9 shows the distribution of AERONET AODs for clear-sky and all-sky conditions as well as the precipitable water derived from a microwave radiometer separated by these two conditions. Clear-sky is identified by the Long–Ackerman algorithm (Long et al., 2006) that uses surface direct and diffuse irradiances. Figure 9 shows that AOD and precipitable water under all-sky conditions are significantly larger than those under clear-sky conditions. When we use the cloud fraction derived from satellite observations and plot AOD and precipitable water as a function of the cloud fraction using the same grid box where the ground site is located, AOD and precipitable water increase with the cloud fraction (Fig. 10). Therefore, the increasing AOD with cloud fraction shown in Fig. 6 is qualitatively explained by the increasing AOD of hygroscopic aerosols with relative humidity. However, Fig. 10 indicates that either the growth of MATCH AOD is too strong or the modeled MATCH AOD under all-sky conditions is too large.
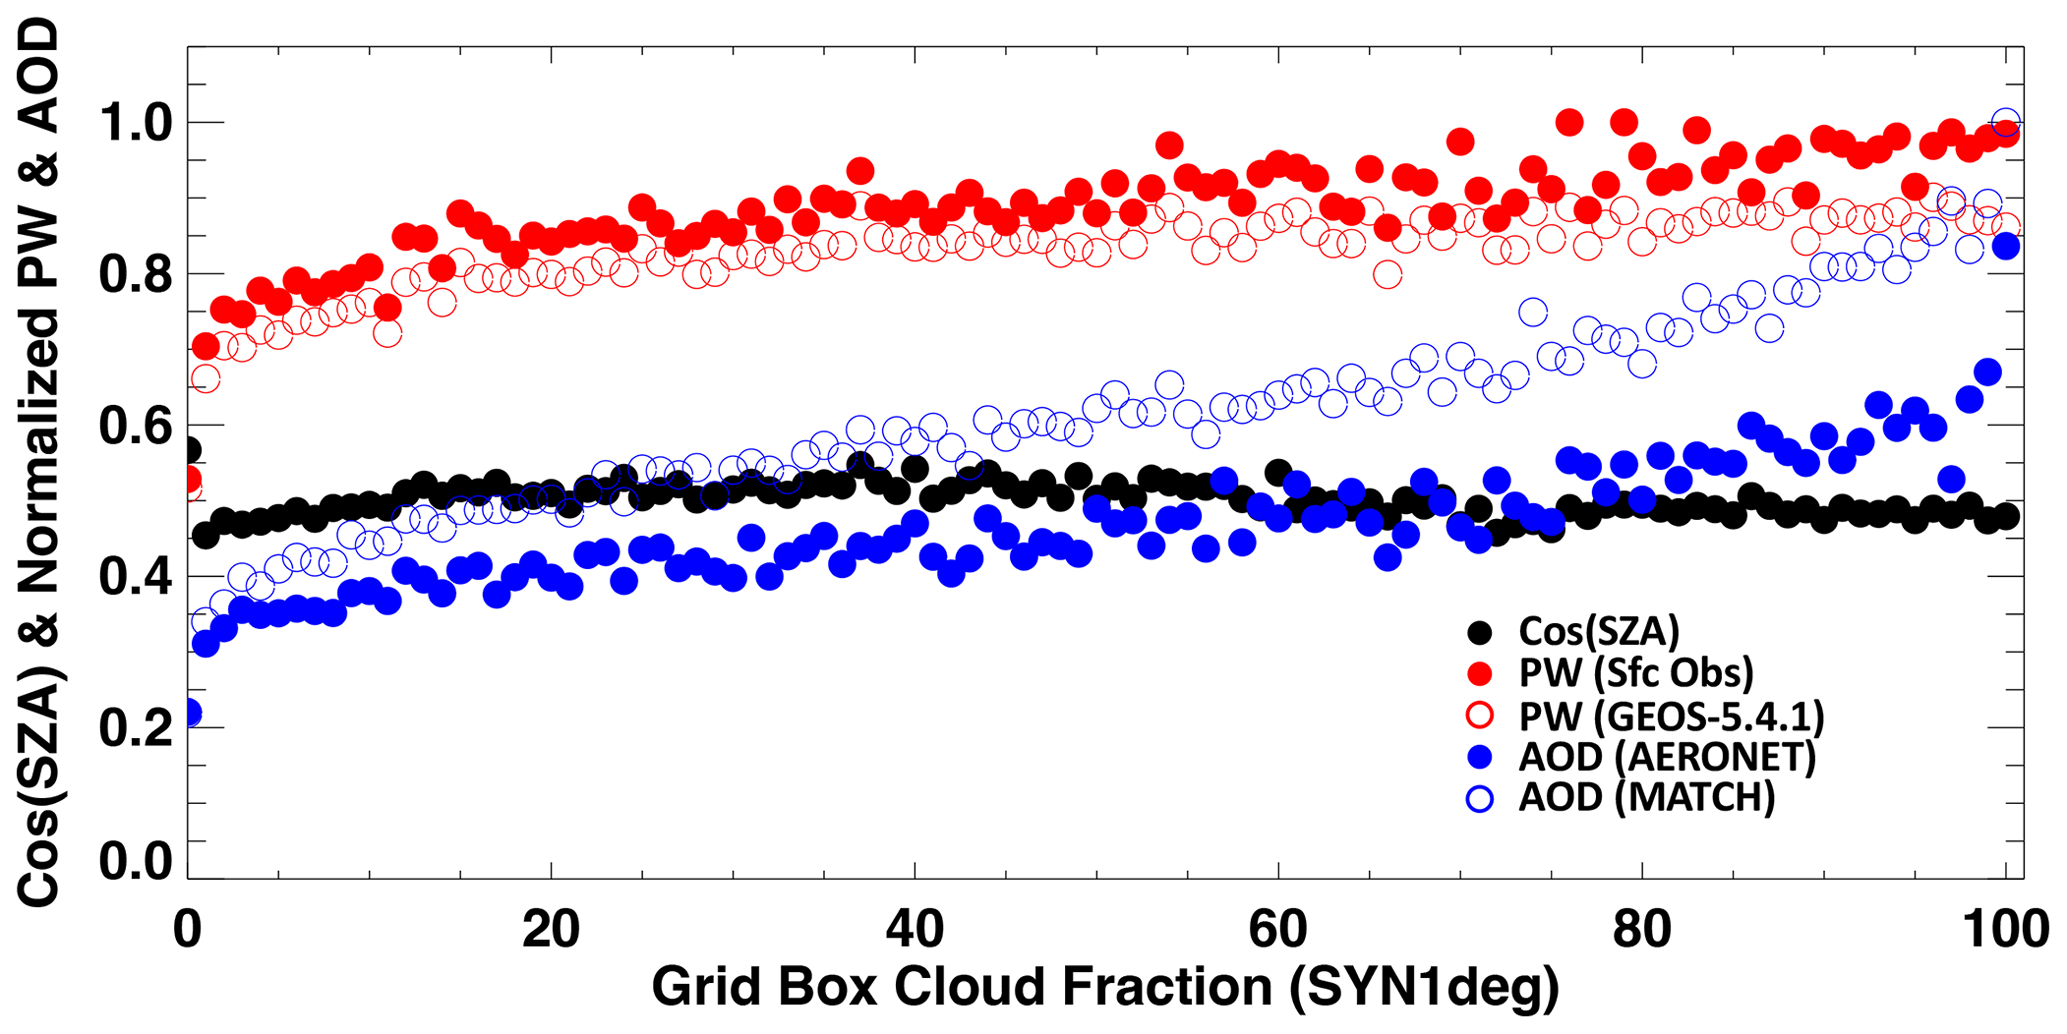
Figure 10AOD and precipitable water (PW) as a function of cloud fraction over the grid box where the ARM SGP E13 and SURFRAD (SURFace RADiation program) Bondville, IL, sites are located. Closed and open blue circles are AOD derived from AERONET and MATCH AOD, respectively. Closed red circles are observed PW from either a microwave radiometer or CIMEL sun photometer, and open red circles are PW from the GEOS-5.4.1 reanalysis. Cloud fractions are derived from MODIS and geostationary satellites. Black dots are the mean cosine solar zenith angle of the time of AOD and PW observations. AOD and PW are normalized to their maximum value for display.
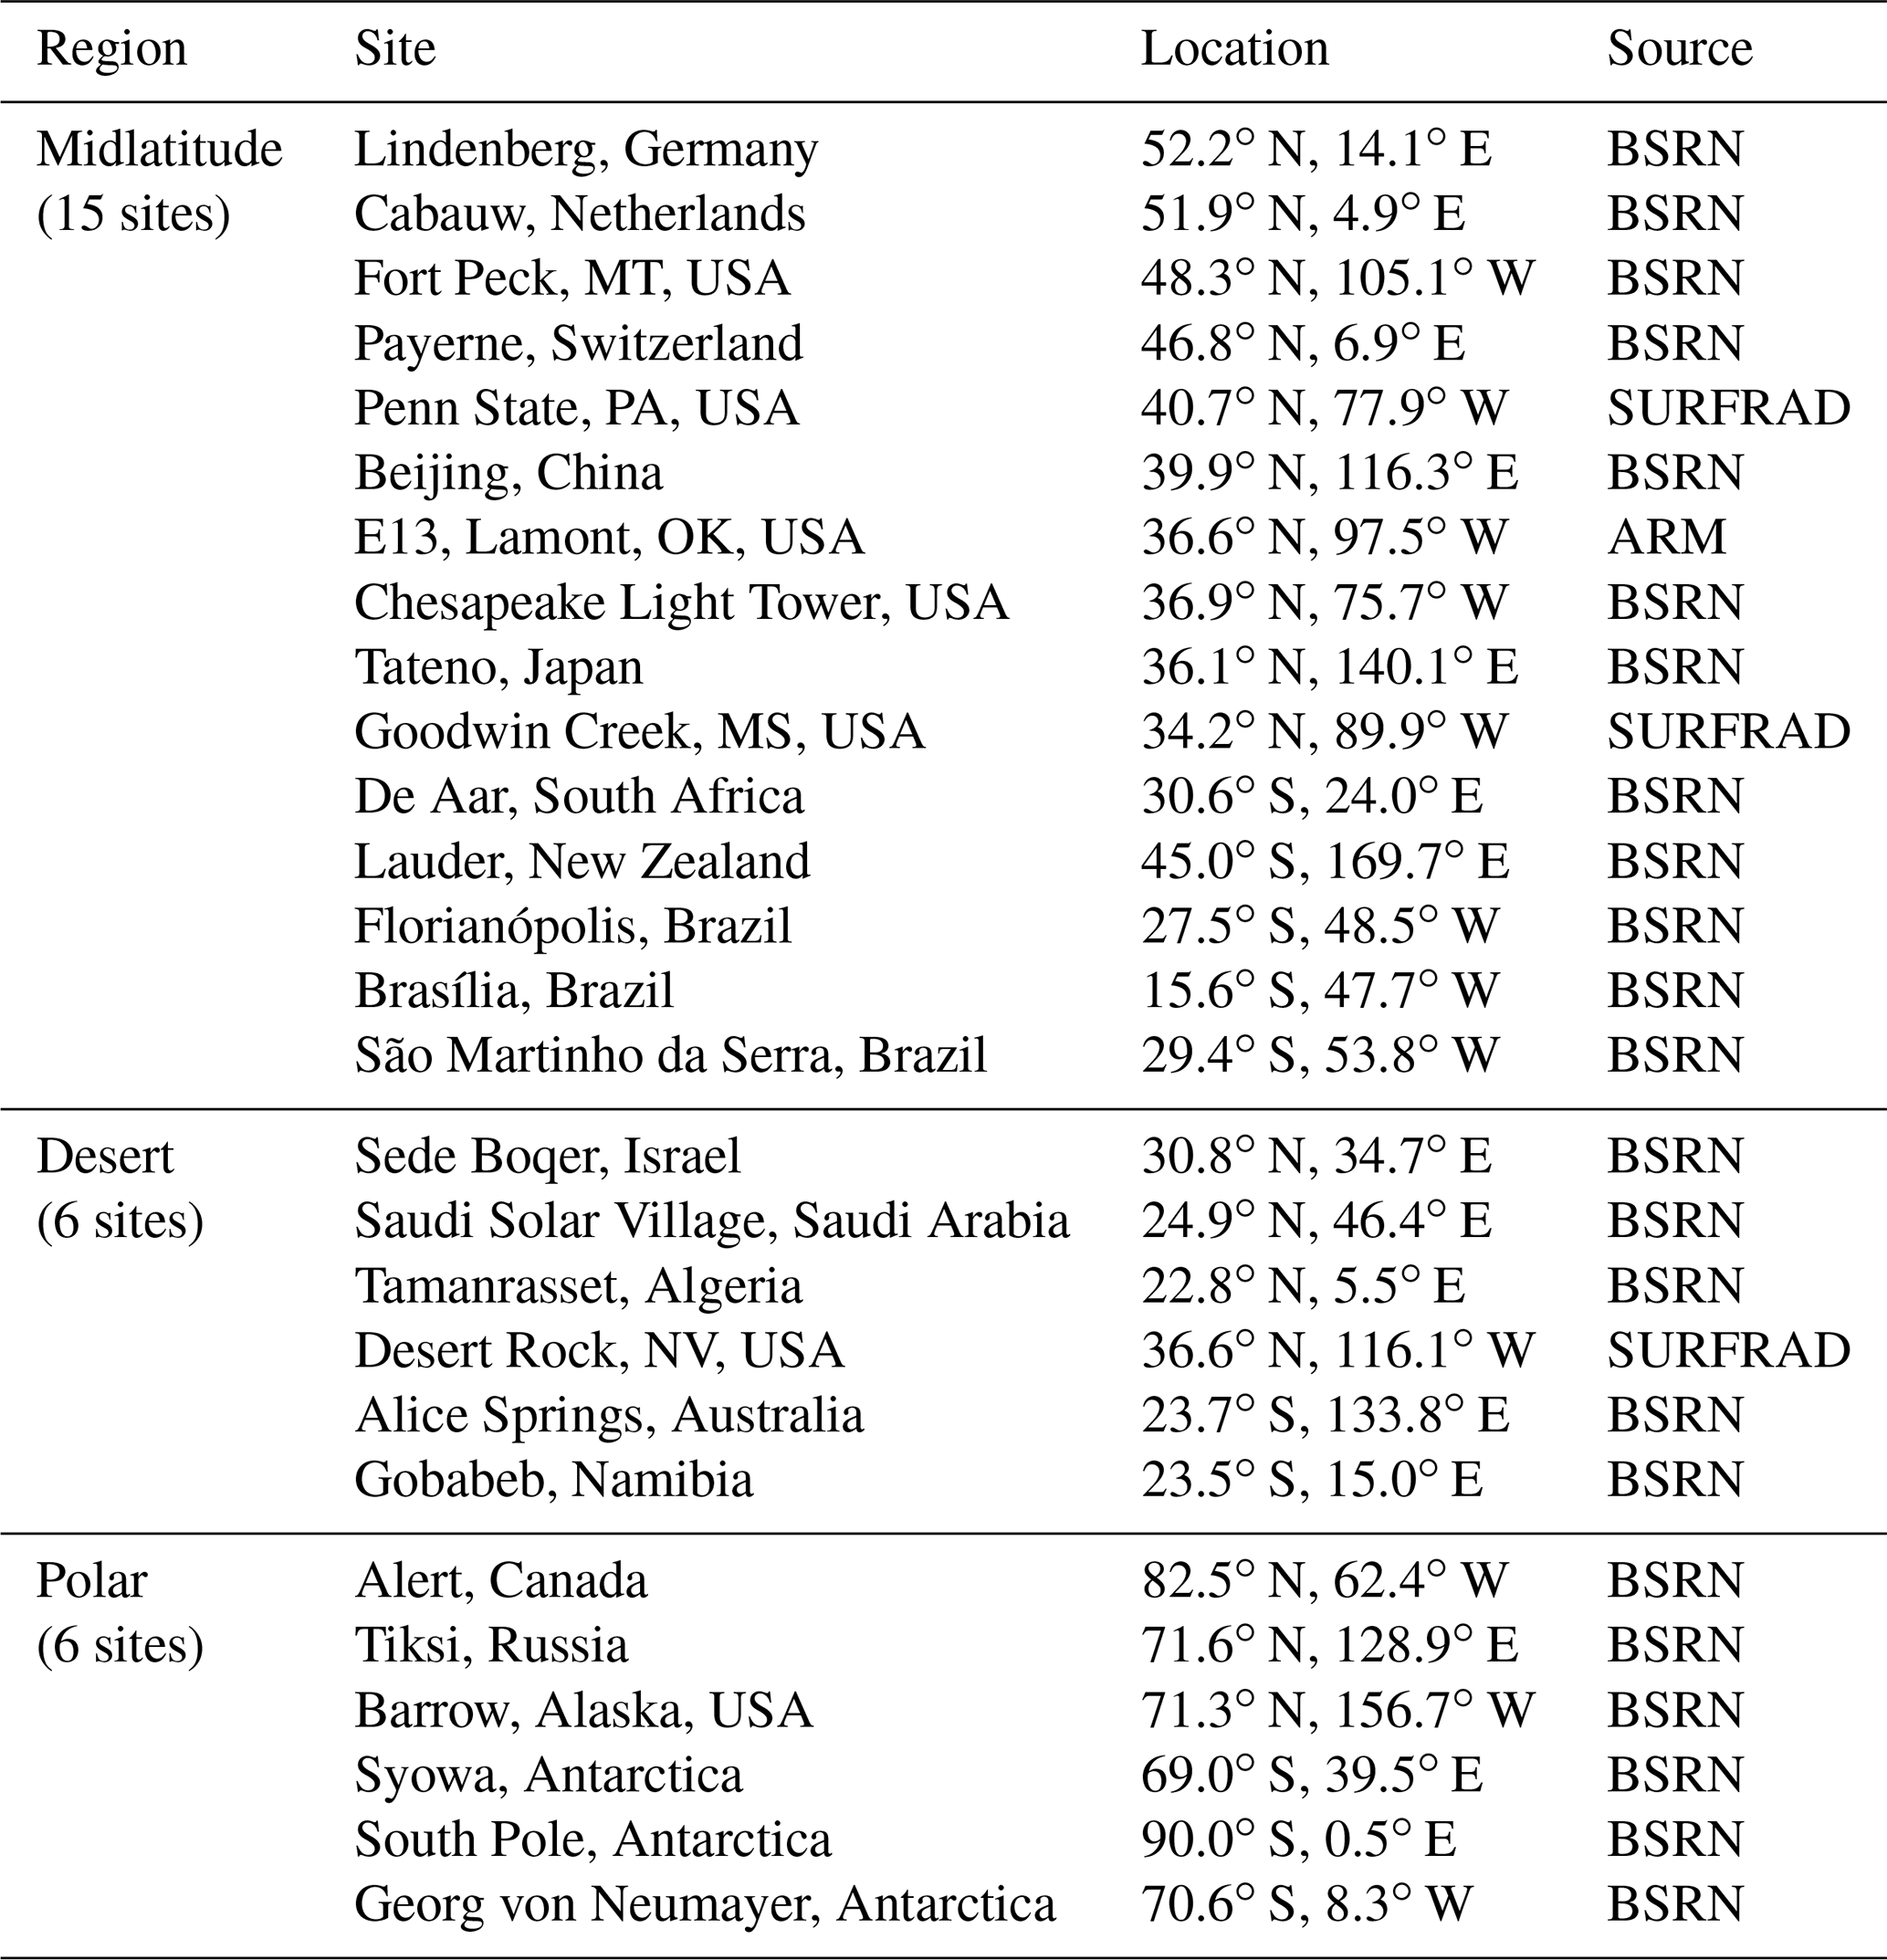
We consider the impact of MATCH aerosols on computed surface irradiances by comparing calculated hourly mean surface downward irradiances from the Edition 4.1 SYN1deg-1Hour product to observations of downward irradiance. In a grid box with an approximate size of 111 km2, 100 % clear sky sampled over 1 h as determined by MODIS or geostationary satellites is relatively rare. Nonetheless, by grouping sites based on general surface conditions and analyzing 20 years of data, sufficient samples are found. Figure 11 shows the sites, grouped by color, including 15 land sites labeled “midlatitude” (green), 6 sites labeled “desert” (red), 6 sites labeled “polar” (white), and 46 buoys (blue). Surface-observed shortwave irradiance from the land sites comes from the Baseline Surface Radiation Network (Ohmura et al., 1998; Driemel et al., 2018), and buoy data are made available from the Pacific Marine Environmental Lab (PMEL) (McPhaden, 2002; McPhaden et al., 2009) and the Woods Hole Oceanographic Institute (WHOI) (Colbo and Weller, 2009). A complete listing is given in Appendix A.
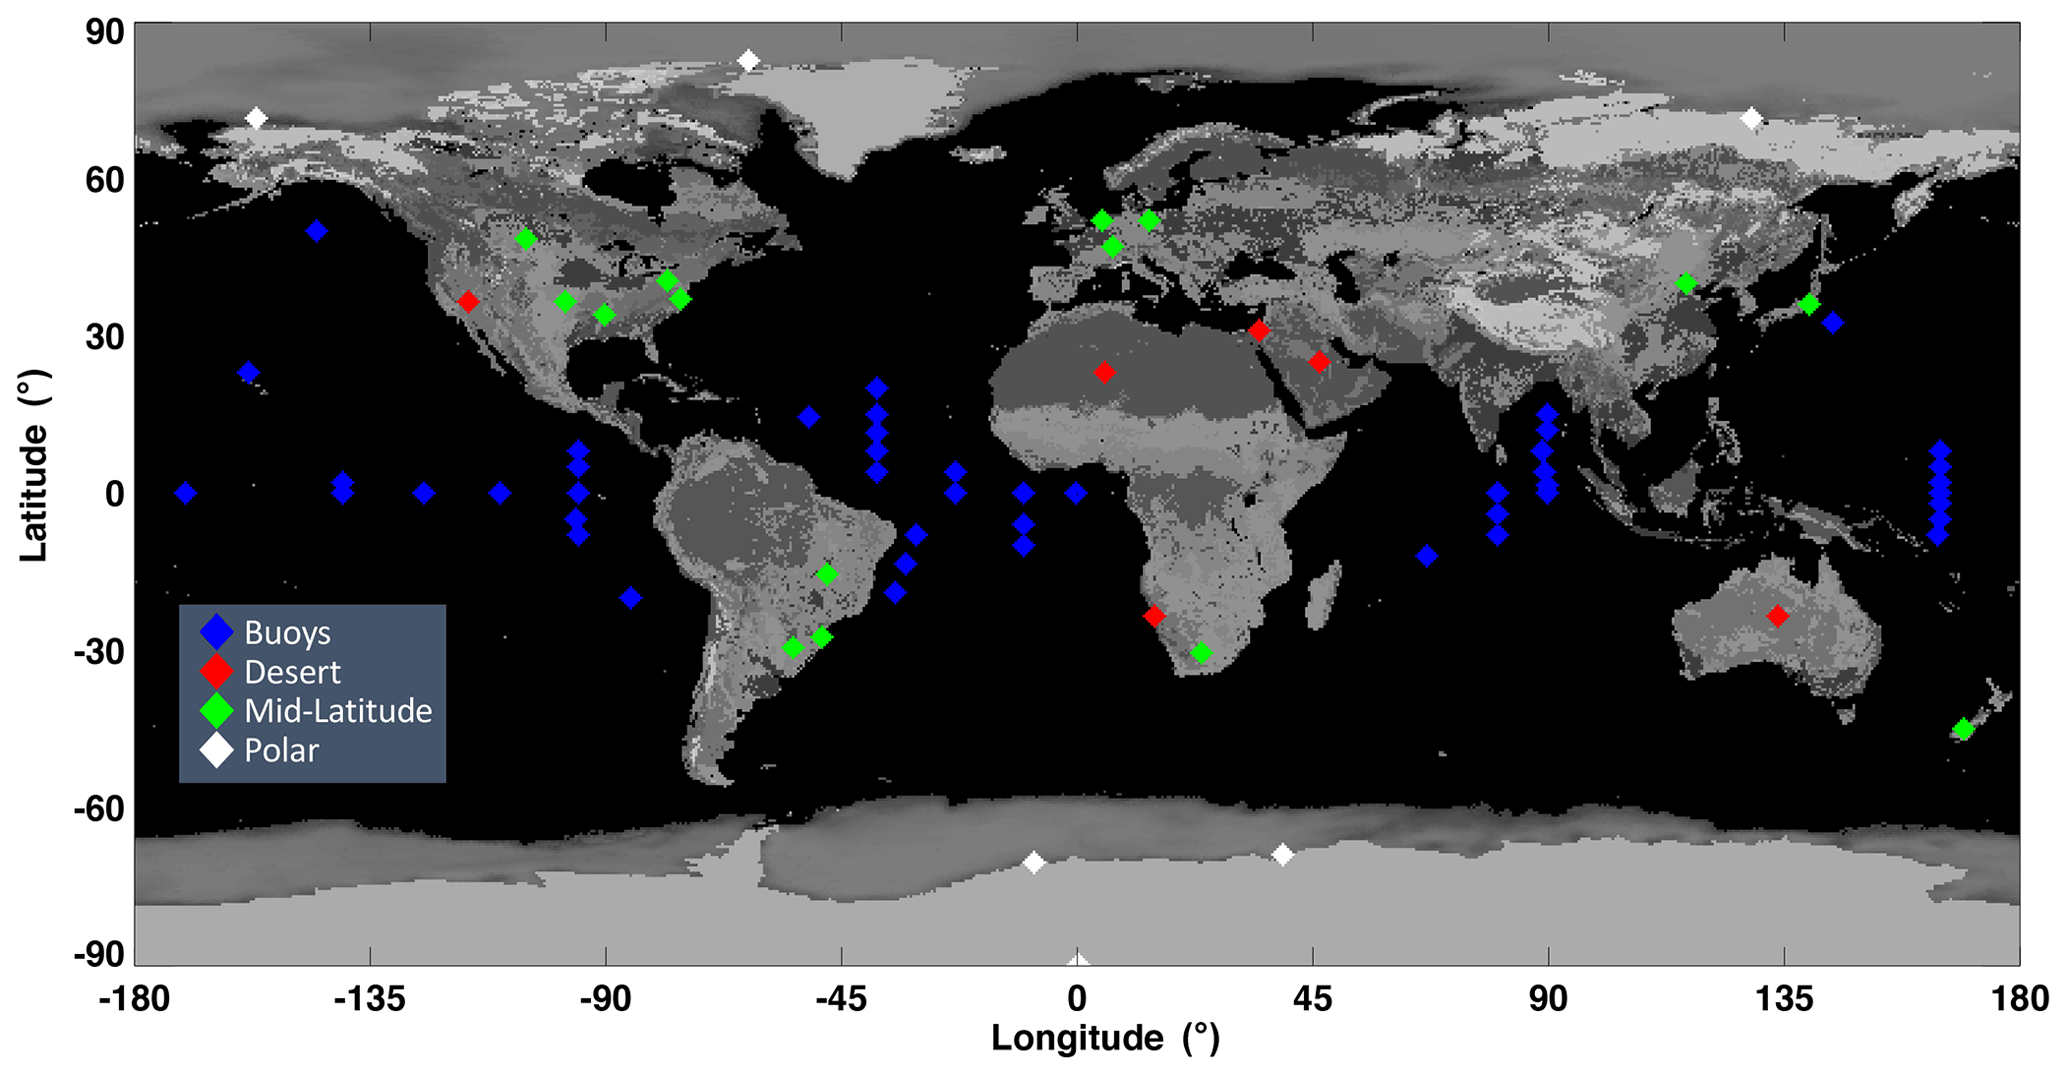
Figure 11The location of surface observations of downwelling shortwave irradiance used to compare the SYN1deg Edition 4.1 calculations to observations for all available hours (from March 2000 through December 2019) for which the SYN1deg cloud analysis determines the hour and grid box to be 100 % clear sky.
4.1 Shortwave comparisons
We begin with a simple sensitivity calculation of AOD on surface downward shortwave irradiance (DSI). Figure 12 shows a series of radiative transfer calculations using the online Langley Fu–Liou radiative transfer code (https:// cloudsgate2.larc.nasa.gov/cgi-bin/fuliou/runfl.cgi, last access: 3 August 2022) with an open shrub spectral albedo (broadband albedo of 0.14 at μ0=1.0), “continental” aerosol, and no clouds. Values on the solid black line are calculated DSI with an AOD of 0.09 at six different solar zenith angles. Calculations were then done for AODs of 0.0 and 0.18 at the same solar zenith angles, representing 100 % error bounds of mean AODs derived from AERONET, as found in Tables 3 and 4 for the Australian sites where the RMS is approximately equal to the observed average of AOD. Orange and red shaded areas indicate a potential bias in DSI at a given solar zenith angle (SZA). Irradiance values scale nearly linearly with Cos(SZA) between these limits. Figure 12 shows that the error remains nearly constant until a μ0=0.5, where it begins to decrease as insolation decreases. However, due to small downward irradiances at large solar zenith angles, the percentage error increases.
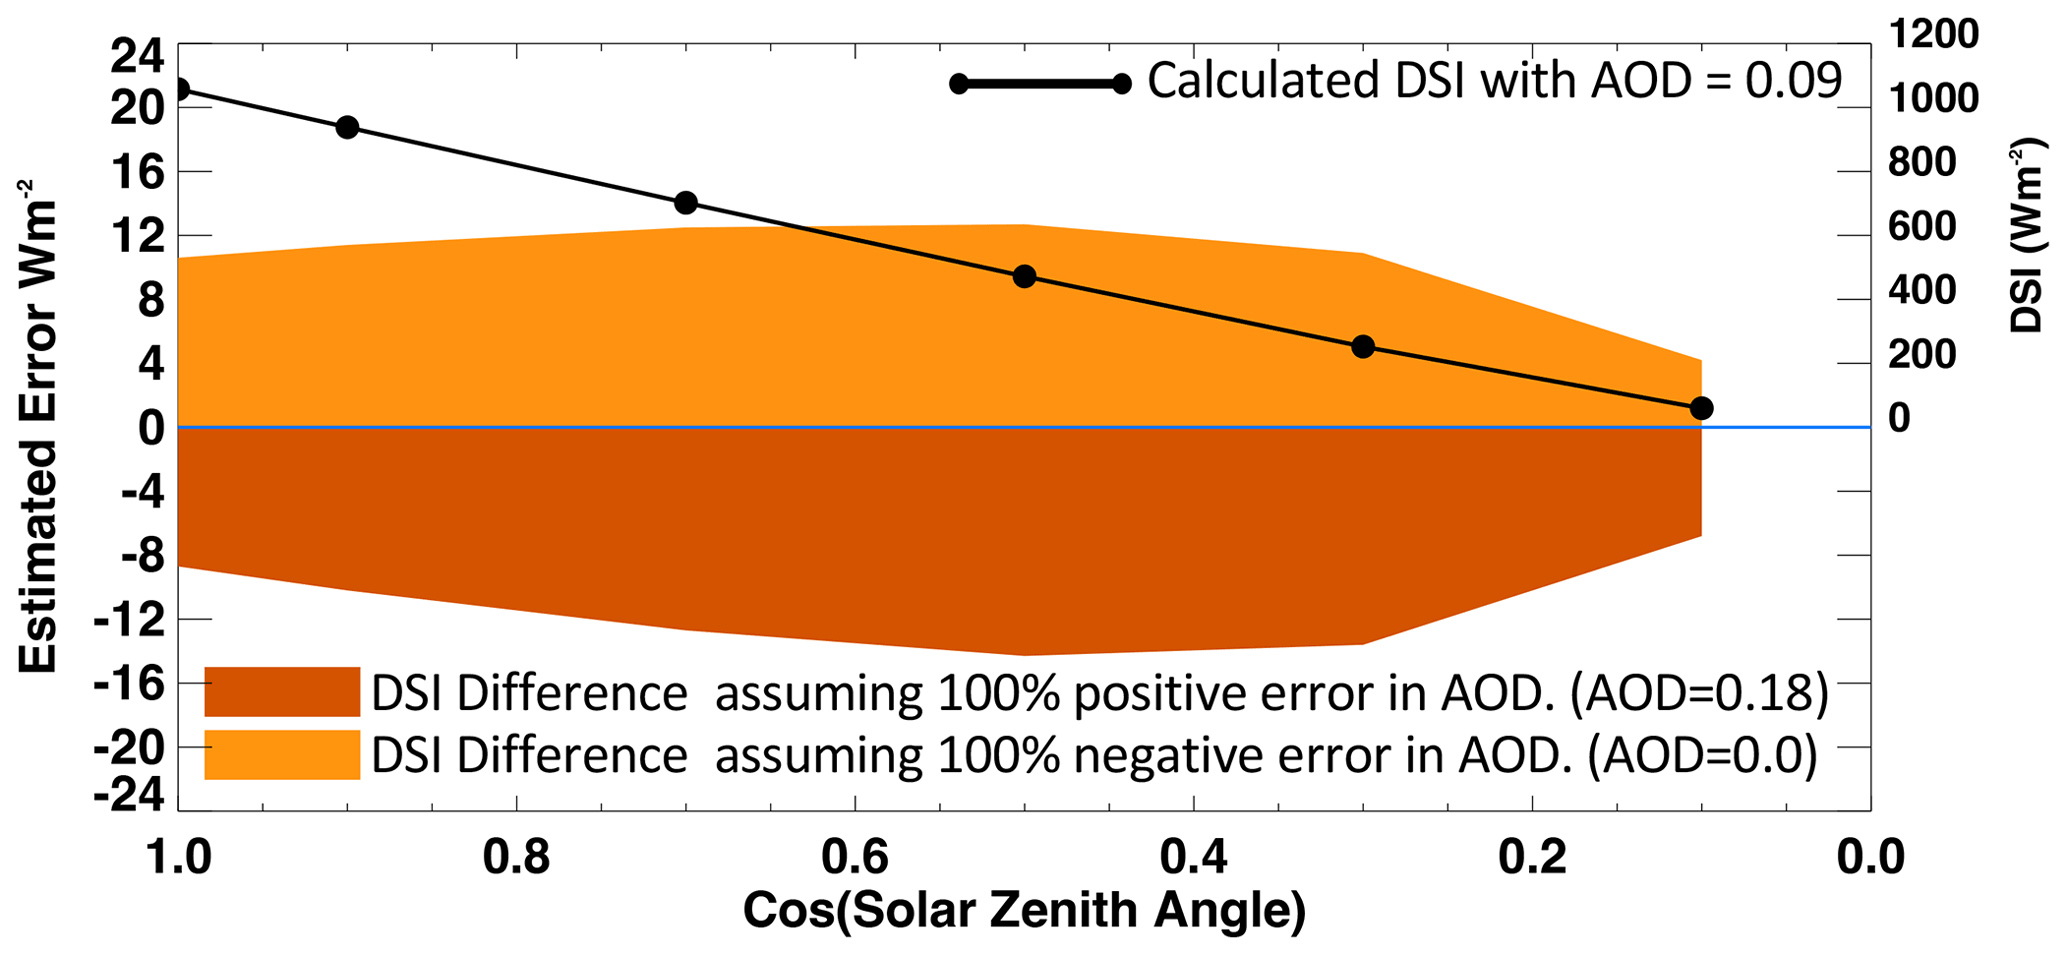
Figure 12Calculated DSI error at the surface computed with the LFLRT model due to the error in AODs. AOD is assumed to be 0.09. The respective light and dark orange shading indicate positive and negative errors (in W m−2; left axis) due to 100 % AOD errors. The shaded areas are computed with AODs of 0.0 (a −100 % error) and 0.18 (a +100 % error) at the same solar zenith angles, representing 100 % error bounds. Values on the solid black line are calculated DSI (right axis) with an AOD of 0.09 at six solar zenith angles.
Figure 13 shows hourly comparisons of computed clear-sky downward shortwave irradiance compared to observations for the groups of sites shown in Fig. 11. In general, the calculated irradiance is larger than observed. We find that in every grouping, SYN1deg calculations tend to be too transmissive, overestimating DSI by between 3 W m−2 (polar sites) and 15 W m−2 (ocean buoys) with midlatitude and desert sites each overestimating DSI by ∼10 W m−2. This points to the possibility that MATCH is weighted too far towards scattering aerosols and has too few absorbing aerosols.

Figure 13Comparisons of DSI at the surface from the SYN1deg Edition 4.1 calculations (y axis for all plots) and Baseline Surface Radiation Network (BSRN) and buoy surface sites (x axis all plots). Data are from March 2000 through February 2020 and only include hours when a 1∘ grid box is 100 % clear sky according to the SYN1deg cloud fraction.
Clear-sky scenes used for Fig. 13 are those identified by MODIS and geostationary satellites over the 1∘ grid box where the ground site is located. Thus, when satellites did not detect clouds over the 1 h period within the grid box, we compared computed and observed hourly mean downward shortwave irradiances. DSI is nominally measured by a shaded pyranometer combined with the direct insolation measured by a pyrheliometer on a solar tracker. Although satellites may indicate clear sky, clouds might have been present within the field of view of the pyranometer, increasing diffuse radiation. This would increase observed DSI; hence, modeled irradiance would be smaller. To verify, we used the ground-based cloud-screening algorithm developed by Long and Ackerman (Long et al., 2006) to further screen clouds. For the land groupings, Table 5 shows the bias (RMS) in the DSI where both the satellite and surface-observed cloud fractions equal 0.0. Although the mean bias did not change significantly, the RMS in both the midlatitude and desert sites was reduced by half due to the more stringent cloud screening.
Table 5Bias (RMS) of the clear-sky surface shortwave calculation compared with observation* (in W m−2).
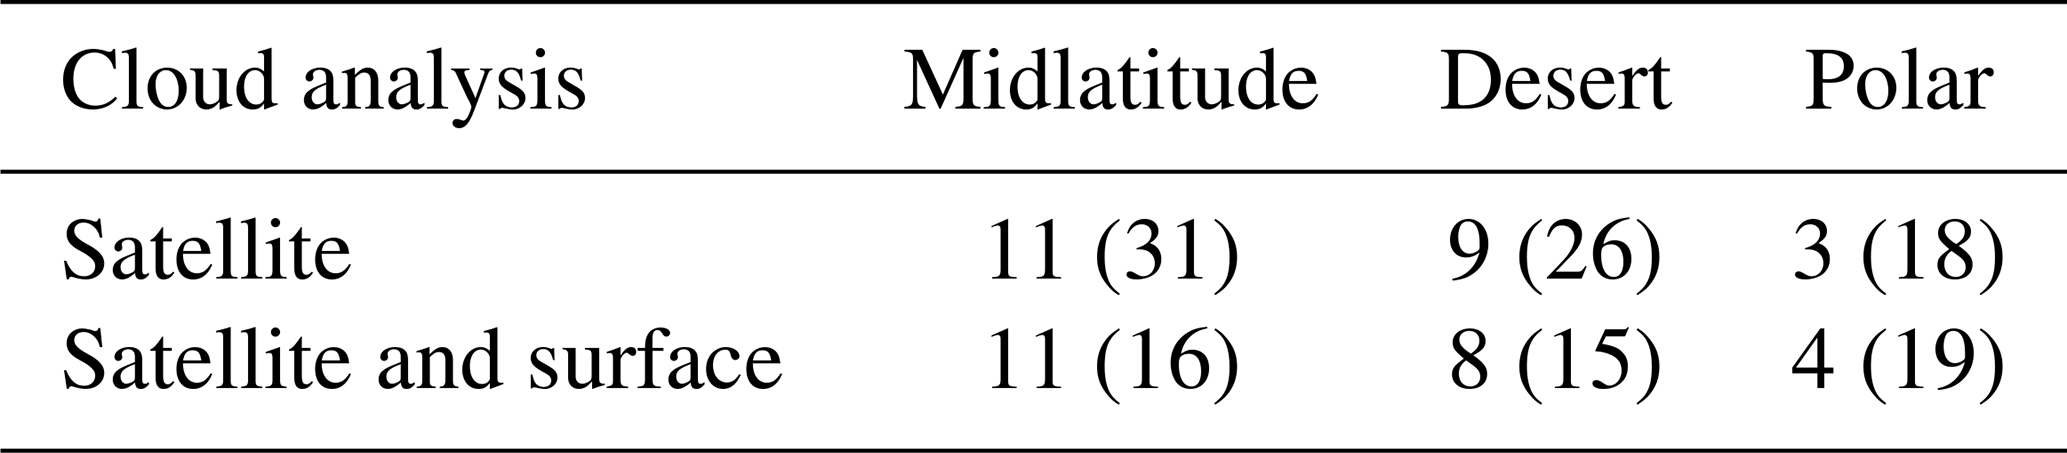
* Sample is based on 20 years of calculations when either satellite or satellite and surface cloud analysis indicates 0 % cloud.
4.2 Longwave comparisons
In this section, we consider the implications of errors in AOD and aerosol type on longwave LFLRT calculations as found in the SYN1deg product. Figure 14 shows SYN1deg surface downward longwave irradiance (DLI) calculations compared to surface observations similar to those shown in Fig. 13. Except for the polar region, where DLI is very sensitive to near-surface air temperature, the bias and standard deviations of the DLI are smaller than the shortwave equivalents in terms of both watts per square meter (W m−2) and the percentage of the mean observation. Depending on aerosol type, DLI is less sensitive to total AOD. For example, a doubling of AOD (0.2 to 0.4) for a continental aerosol type results in a DLI change of only 0.2 W m−2. However, Table 6 outlines the sensitivity of DLI (and DSI) to changes in dust particle size and shows that a change in aerosol type results in up to a 10 W m−2 change in DLI.
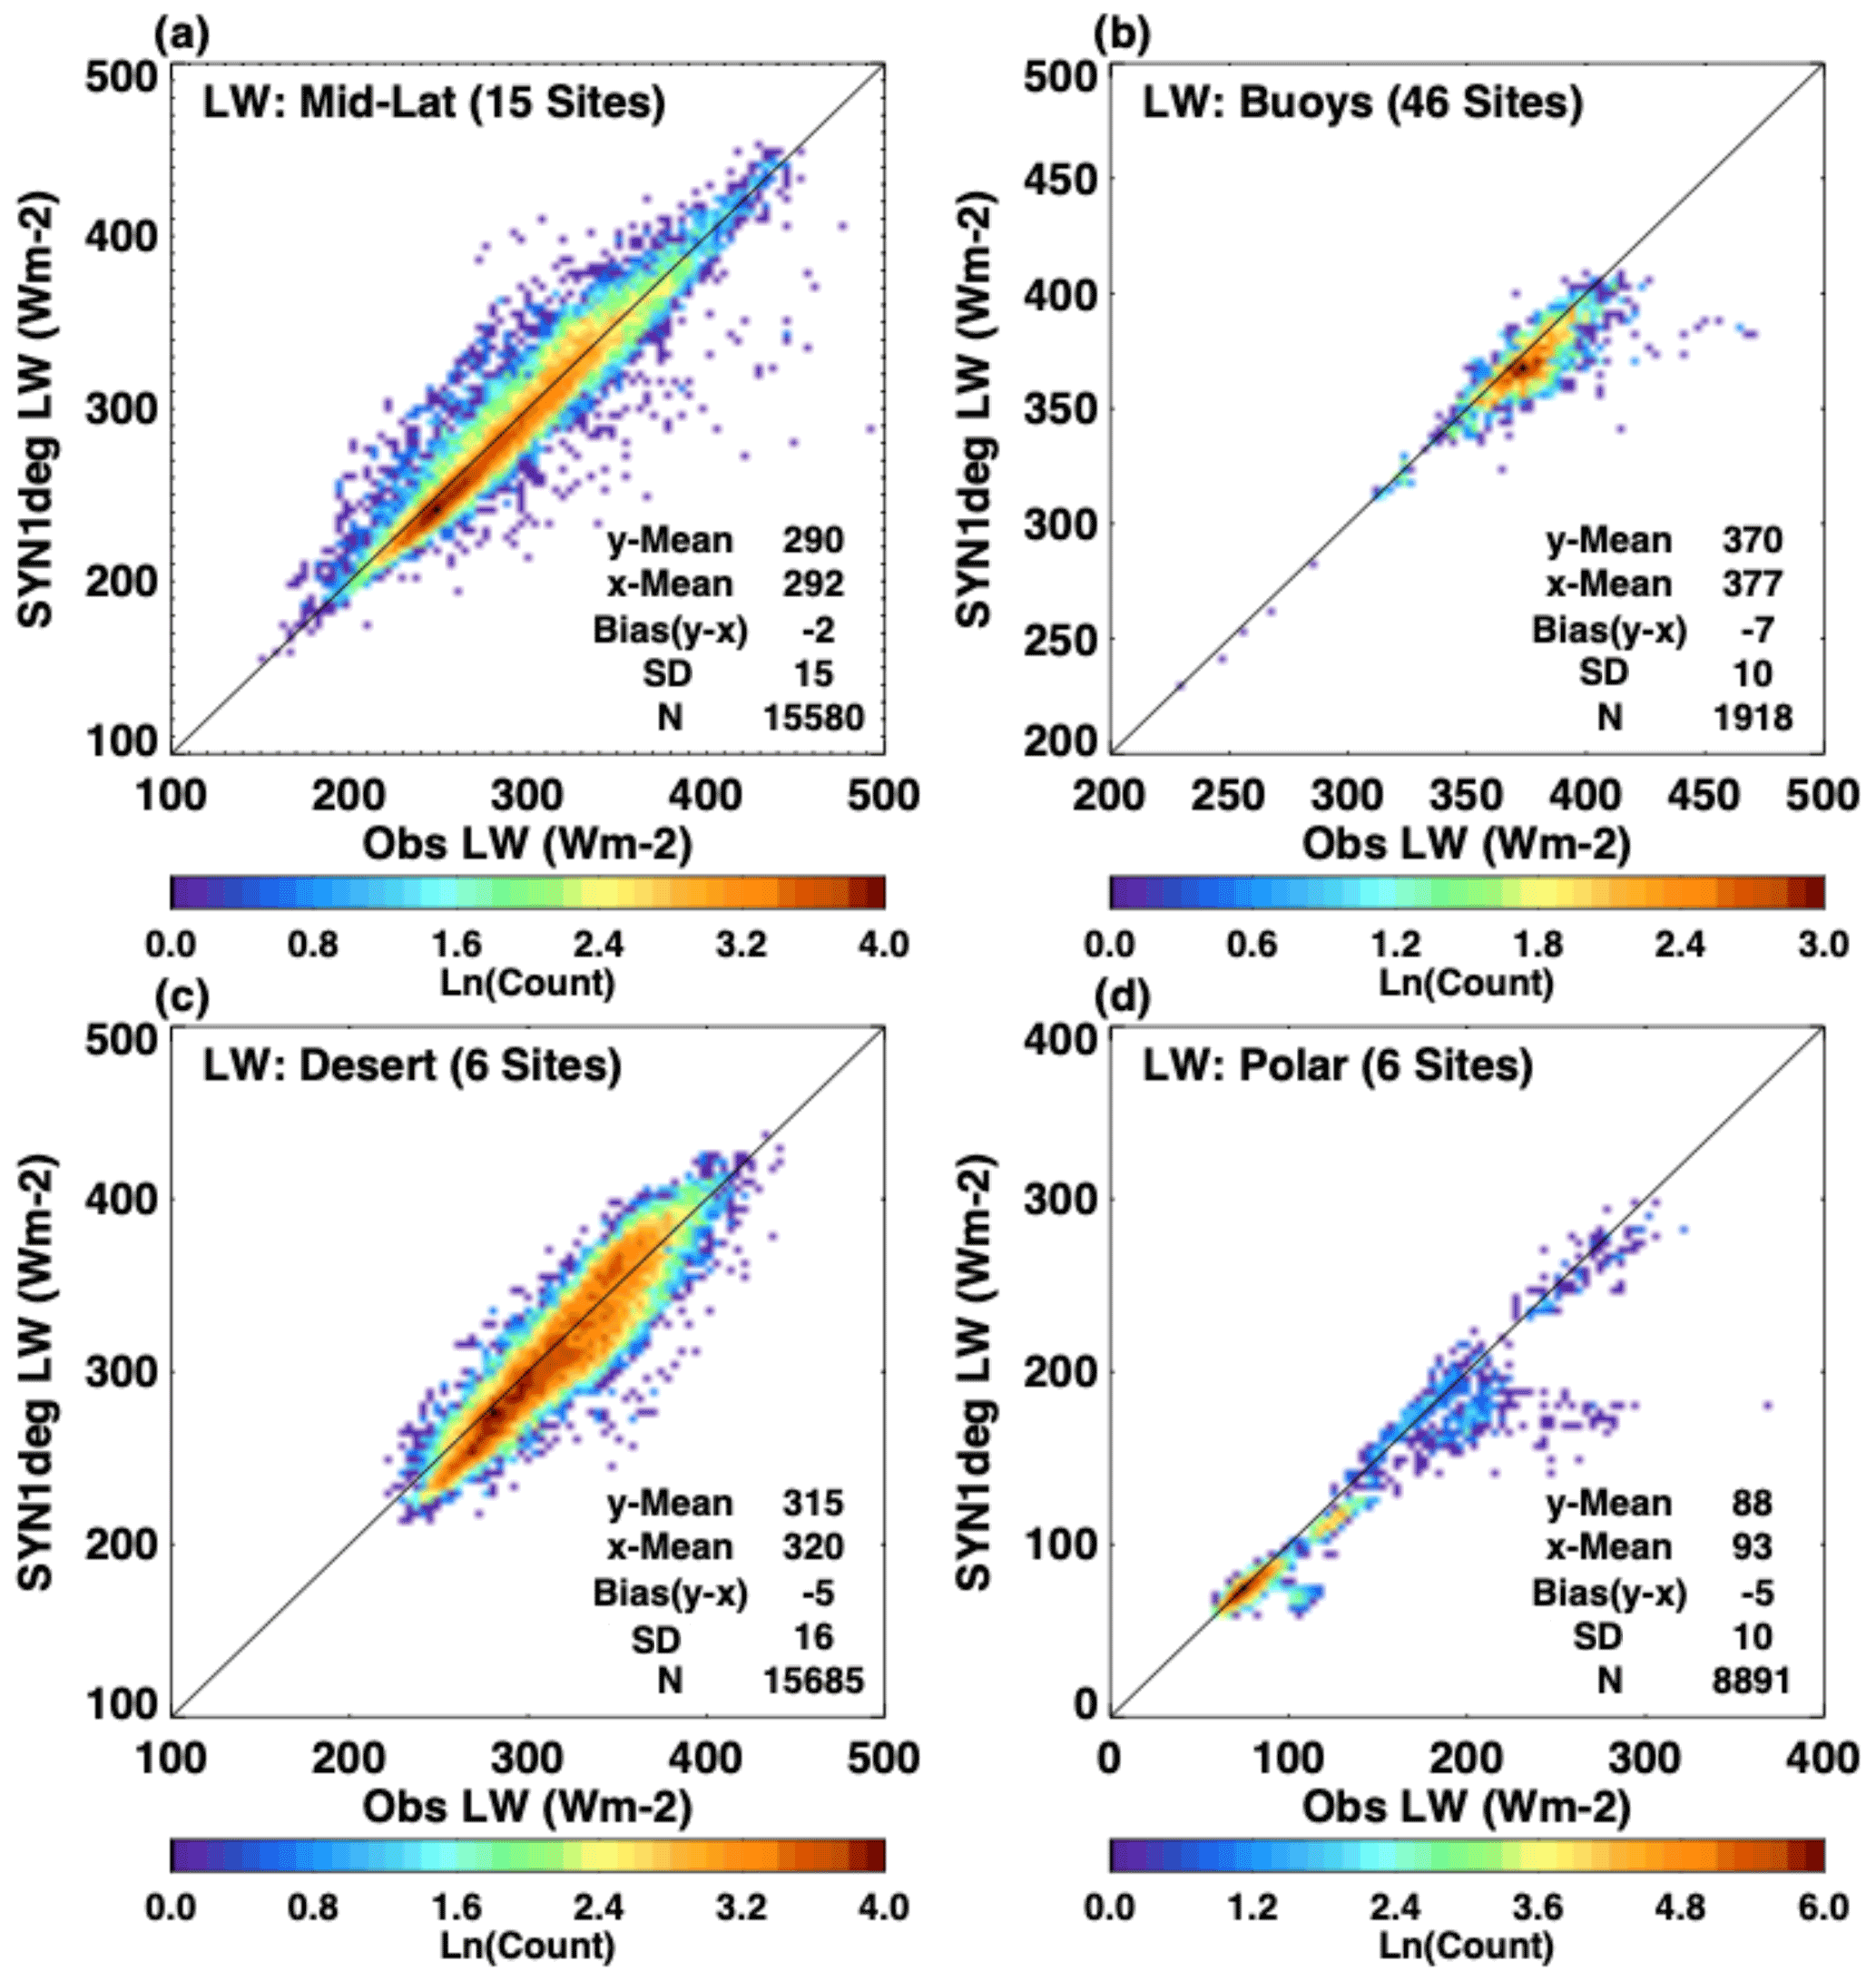
Figure 14Comparisons of longwave downward irradiance at the surface from the SYN1deg Edition 4.1 calculations (y axis for all plots) and BSRN and buoy surface sites (x axis all plots). Data are from March 2000 through February 2020 and only include hours when a 1∘ × 1∘ grid box is 100 % clear sky according to the SYN1deg cloud fraction.
Table 6The effect of dust particle size on surface irradiance calculations*.
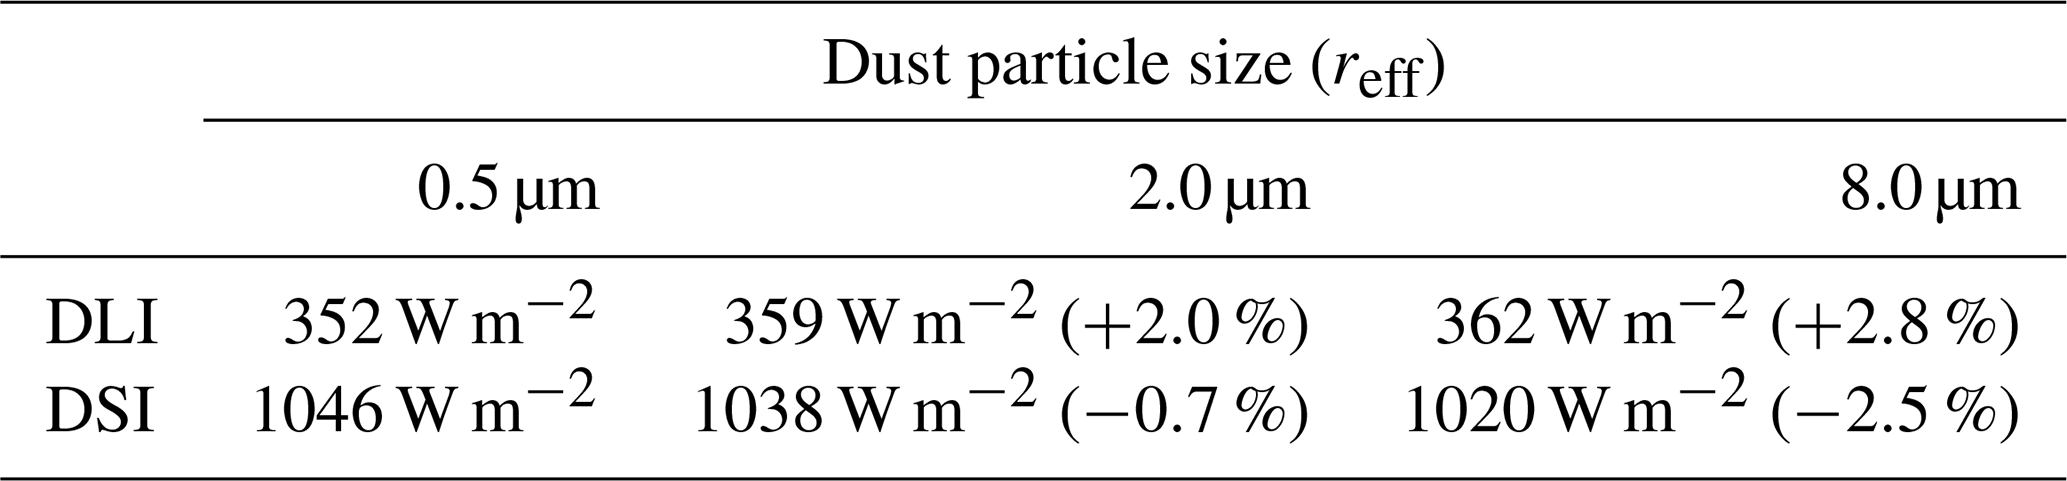
* The radiative transfer code is run for a midlatitude summer atmosphere, open shrub surface albedo, aerosol scale height of 1.5 km, clear sky, and cosine solar zenith angle of 1.0. AOD is fixed at 0.2 for all calculations.
DLI is, thus, more sensitive to aerosol type in certain regions of the globe where there is substantial dust. To see the potential impact on DLI, Fig. 15 shows calculated longwave downward radiative forcing (clear minus pristine calculations) at 57 AERONET sites across the 20 years of SYN1deg data under consideration. The northwestern African sites (where dust is found seasonally) are shown as red boxes, and one clearly sees larger longwave forcing at these sites. Given the importance of particle size for the longwave effect, we check MATCH particle size against AERONET fine-/coarse-mode retrievals for several of the African AERONET sites. Figure 16 plots canonical mean observations of fine- and coarse-mode AOD from three AERONET sites along with groupings of AOD species from the MATCH model output. To undertake a comparison with the AERONET fine-mode observations, we plot the sum of the MATCH AOD due to organic carbon (OC), black carbon (BC), and sulfate (SO4). We compare the sum of MATCH AOD large dust particles (>1 µm) along with sea salt (although sea salt is essentially zero over land) to the coarse-mode AERONET optical depth. All AOD values are at 550 nm.
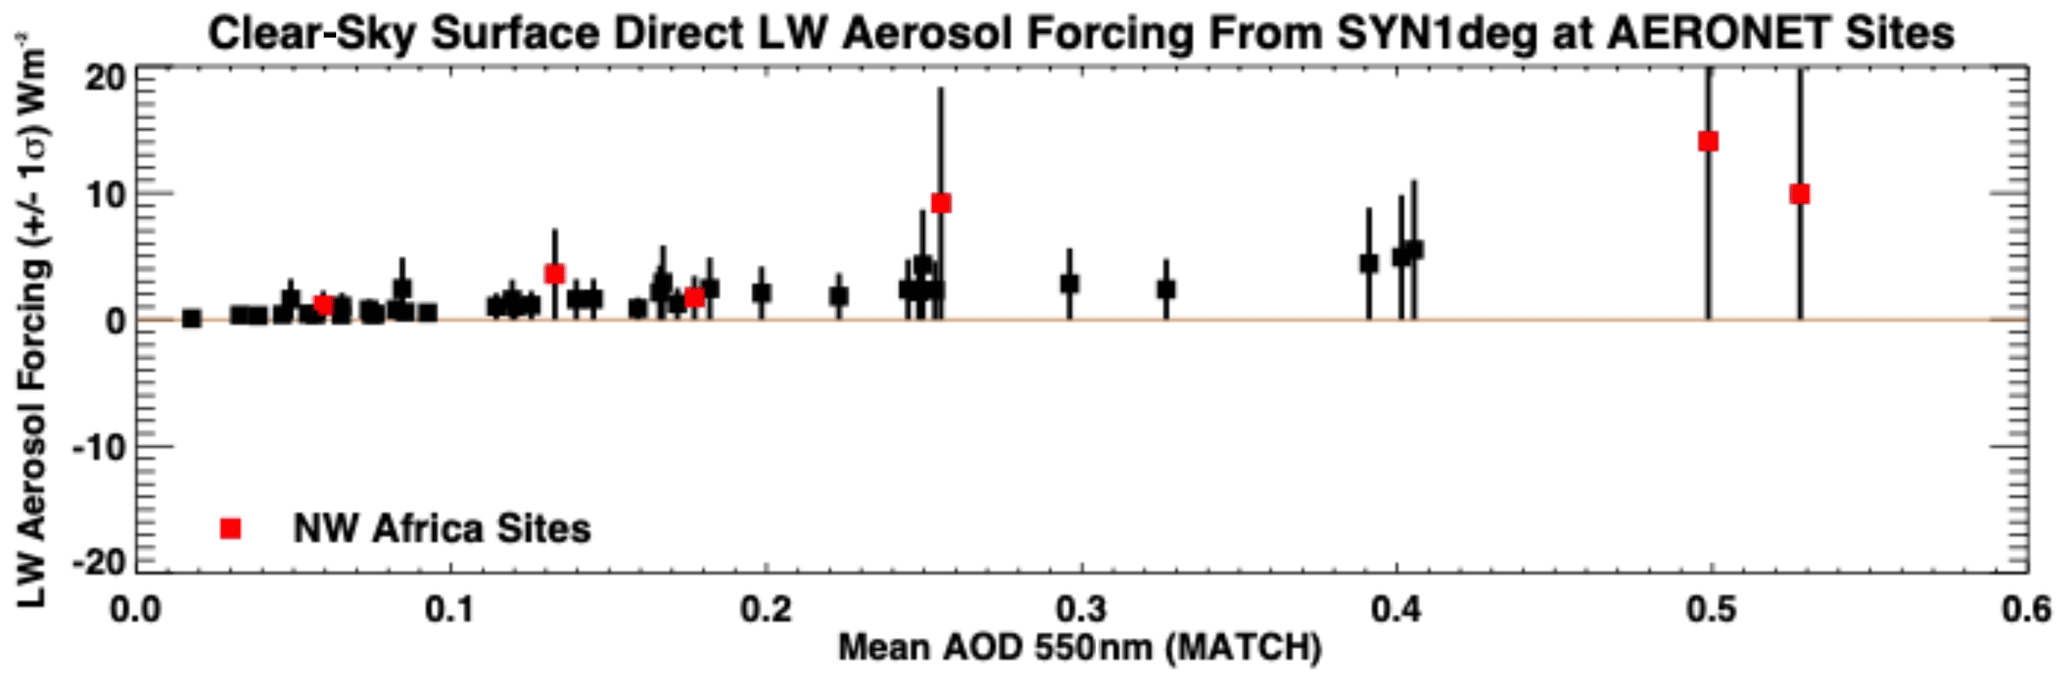
Figure 15The clear-sky direct radiative effect (clear minus pristine) in downward longwave irradiance averaged from 2000 through 2020, when AERONET observations are available. Boxes indicate the average, and the vertical bar is ±1 standard deviation. Black boxes indicate all 57 AERONET sites, and red boxes indicate sites in northwestern Africa.
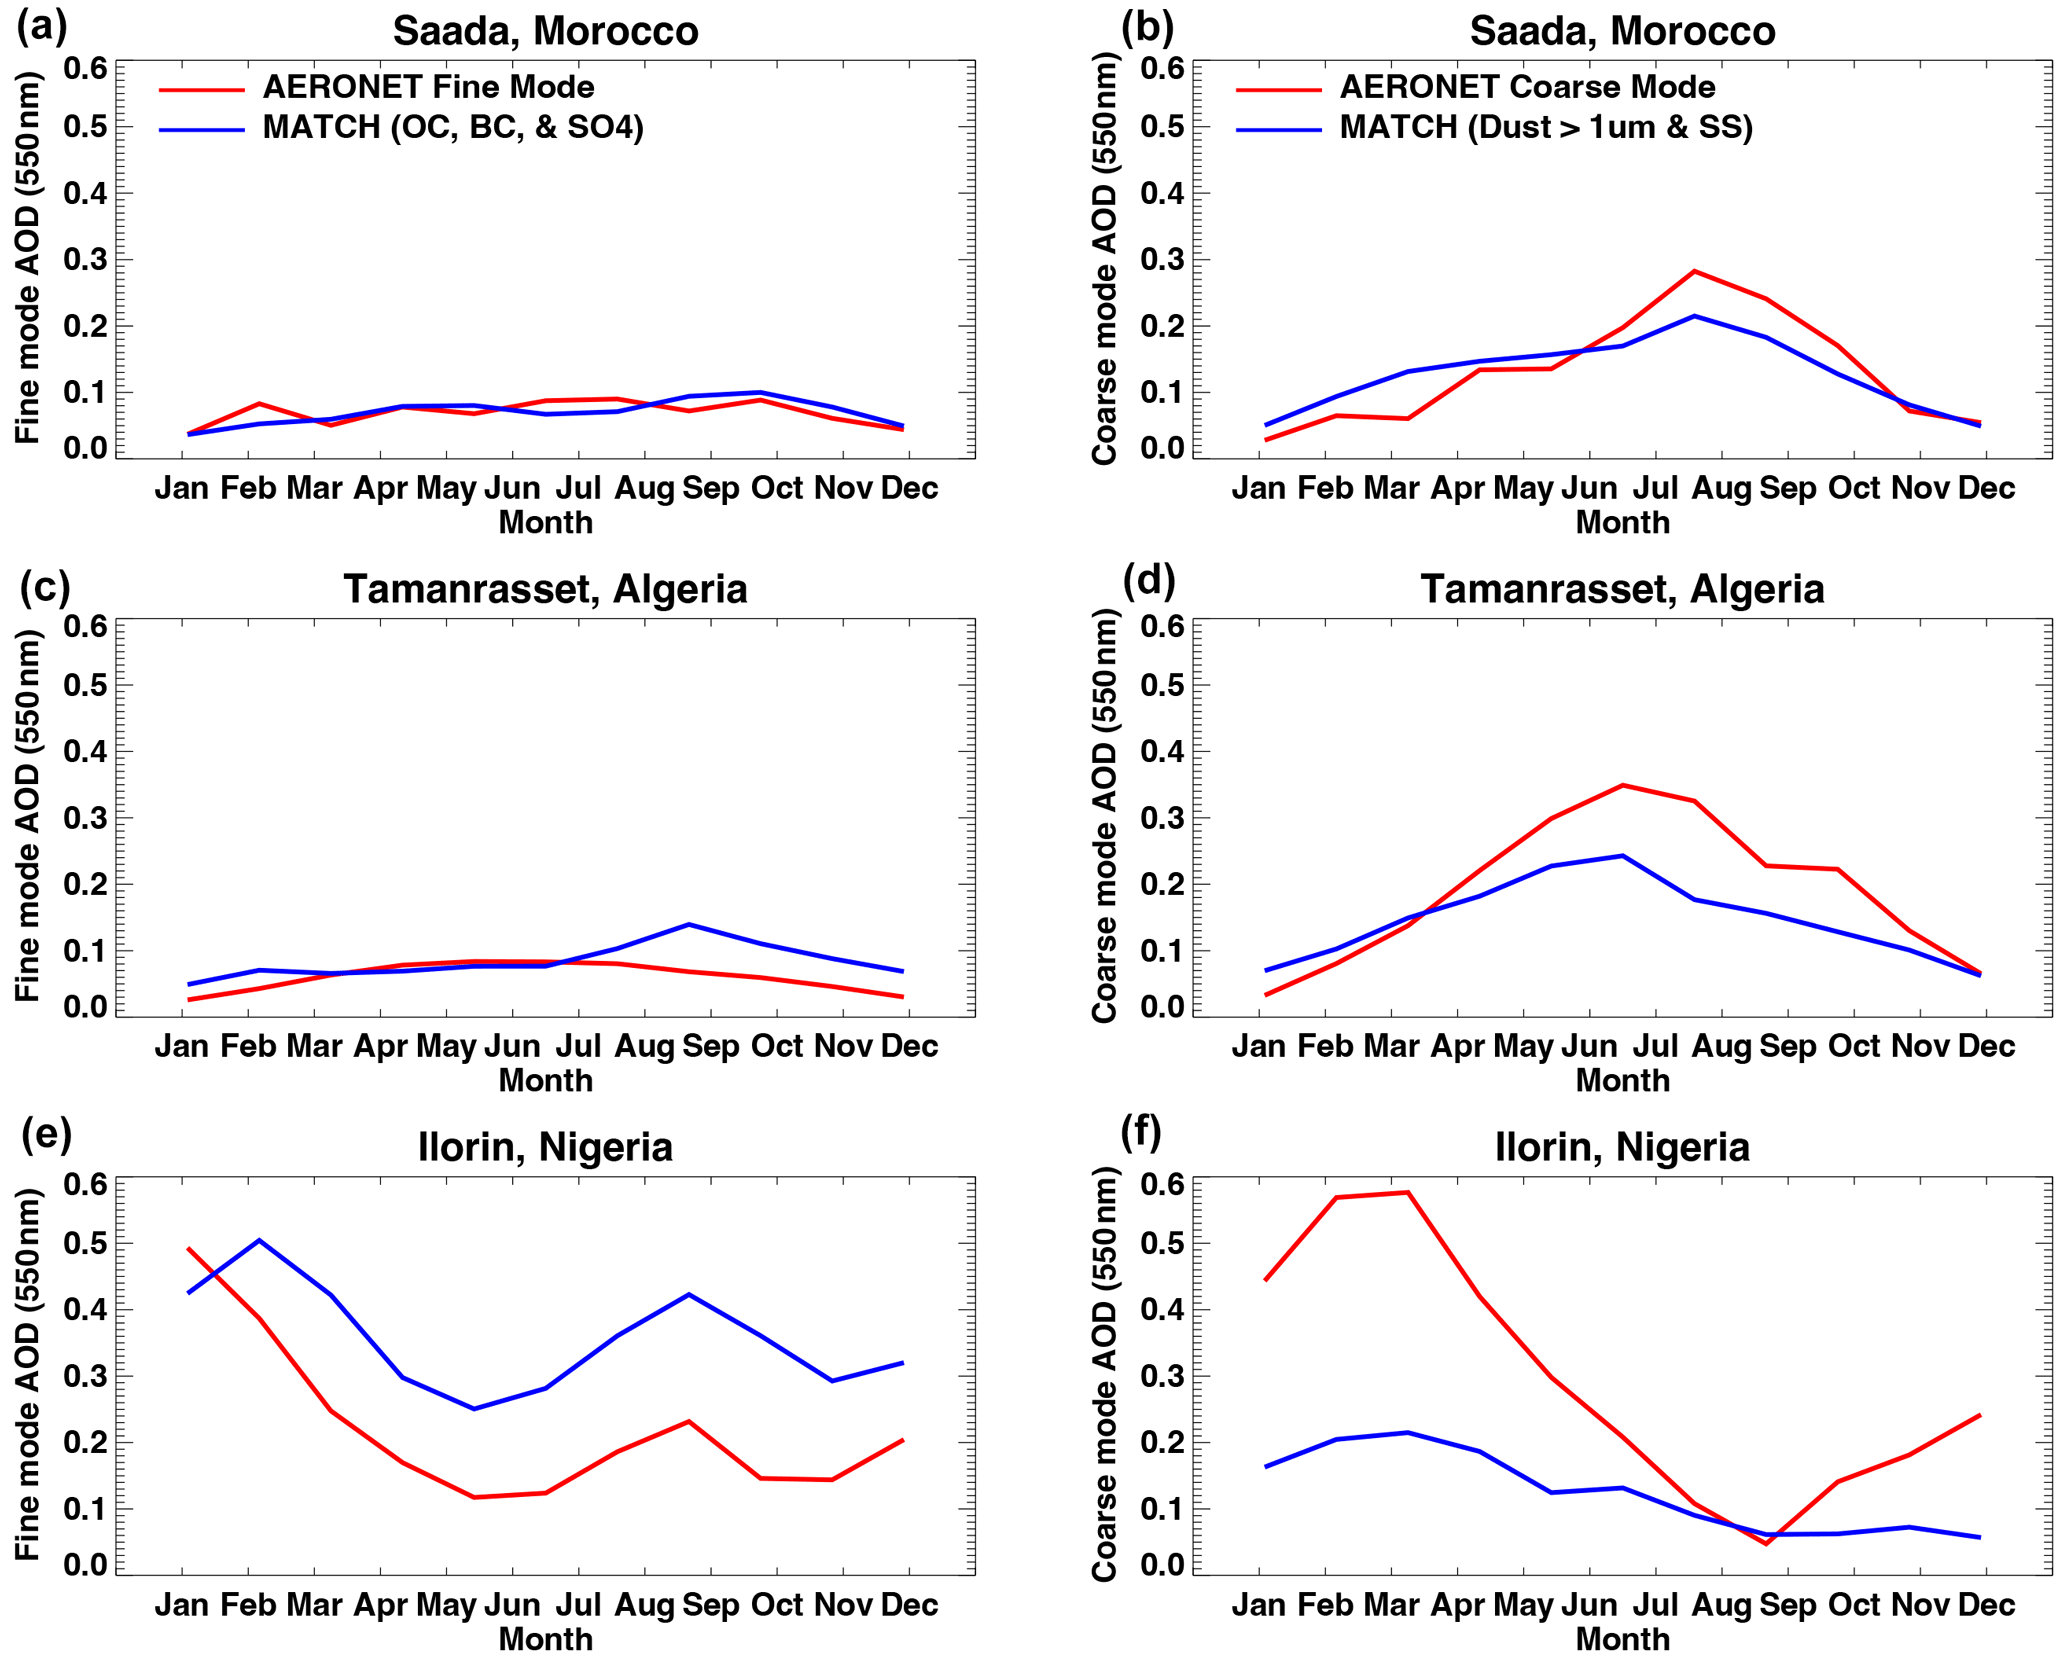
Figure 16Canonical monthly means across 20 years (2000–2020) showing AERONET fine-mode (a, c, e) and coarse-mode (b, d, f) AOD at 550 nm compared with MATCH constituents. MATCH values represent summations of organic carbon (OC), black carbon (BC), and sulfate (SO4) for fine-mode comparisons, and they represent large dust particles (>1 µm) and sea salt for coarse-mode comparisons.
Figure 16 indicates that resultant fine-mode and coarse-mode comparisons are encouraging, but the agreement is site dependent. In general, MATCH is capturing seasonal changes in fine-mode and coarse-mode particles at these sites, but the magnitude of the AOD values is biased.
4.3 CERES TOA and Energy Balanced and Filled (EBAF) surface product comparison
CERES instruments observe TOA irradiances, which can be used to assess the bias in computed irradiance. Global annual mean clear-sky TOA irradiances derived from CERES observation averaged over 20 years from March 2000 through February 2020 are 53 W m−2 for reflected shortwave irradiance and 268 W m−2 for emitted longwave irradiance. The corresponding computed reflected shortwave flux is 51 W m−2, and the emitted longwave flux is 267 W m−2. Insight into the surface irradiance errors may be gained by considering how surface irradiance is modified via the tuning algorithm to match TOA irradiance in the CERES Energy Balanced and Filled (EBAF) surface product (Kato et al., 2018). After known biases are taken out, the adjustment of temperature and specific humidity profiles, surface and aerosol properties are derived based on their preassigned uncertainty and the difference between computed and observed TOA shortwave and longwave irradiance using the Lagrange multiplier approach. To match the computed shortwave and longwave fluxes, AOD is increased from 0.136 to 0.156 (global annual mean values) and precipitable water is decreased from 2.29 to 2.22 cm (global annual mean values). These adjustments change the downward shortwave irradiance from 244 to 243 W m−2.
Table 7Radiative flux, aerosol optical depth (AOD), precipitable water, and surface albedo change to match observed TOA radiative fluxes.
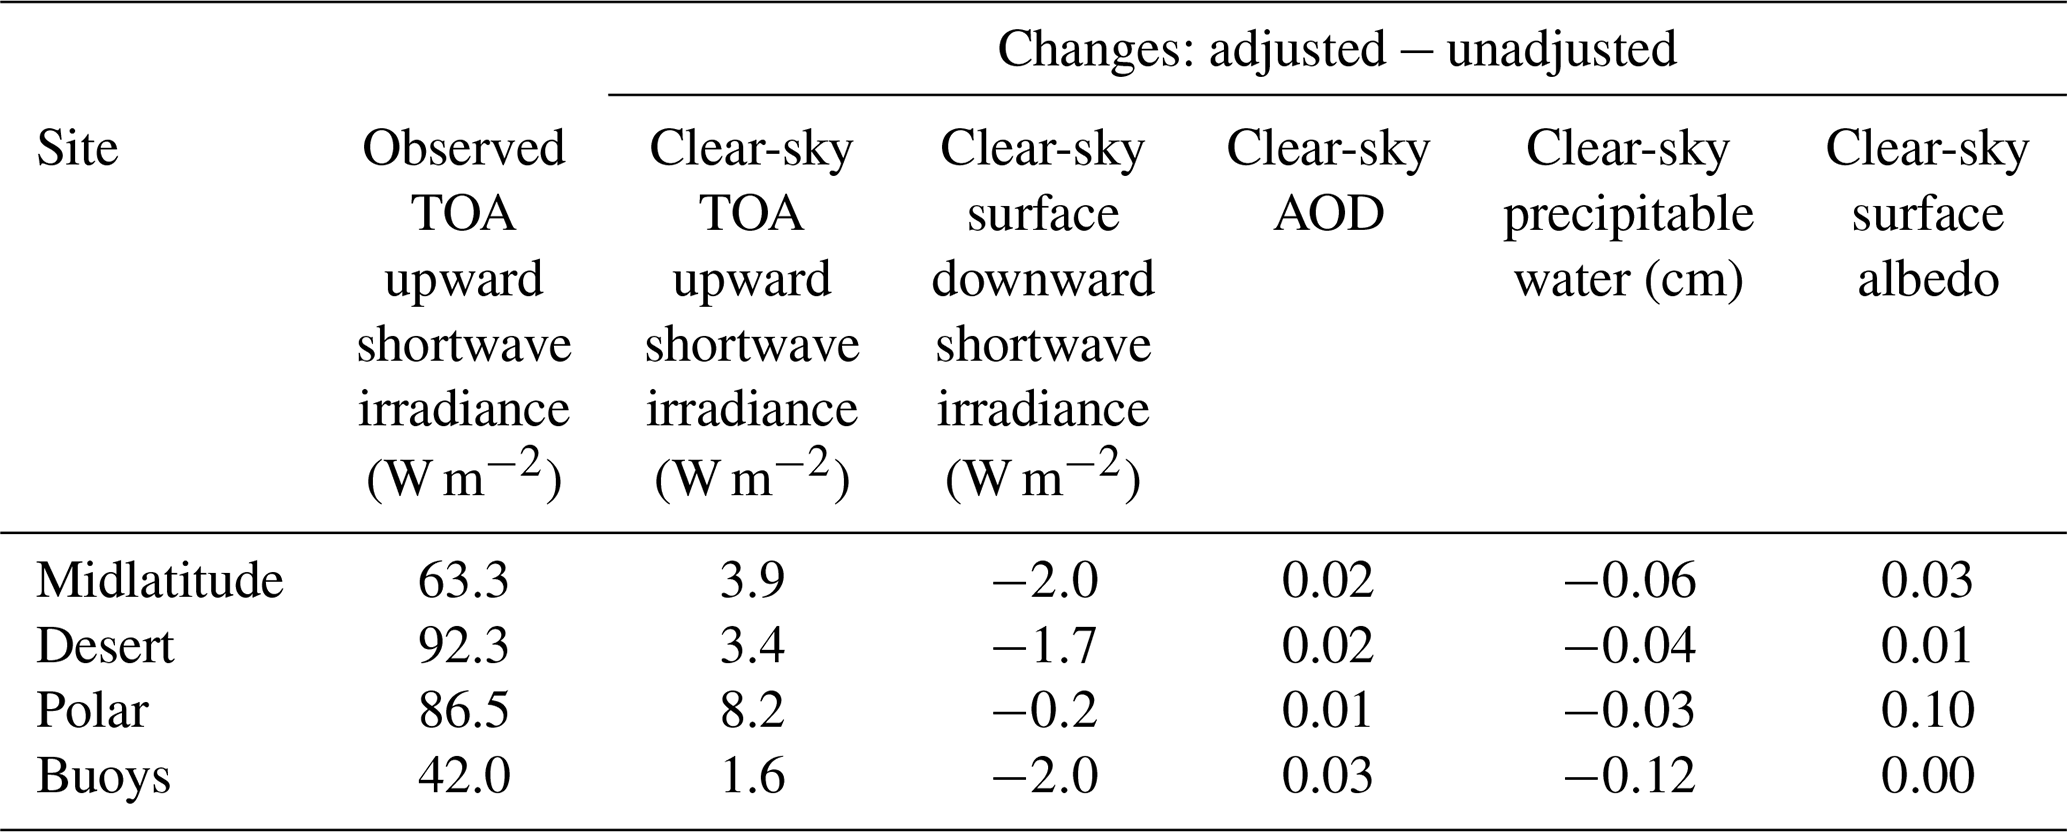
To analyze how the EBAF tuning process changes surface irradiance, AOD, and precipitable water, we computed the mean change separated by surface group shown in Fig. 11. Generally, AOD increases and precipitable water decreases to increase reflected shortwave flux, which in turn decreases surface downward shortwave irradiance over these regions (Table 7). For the midlatitude group, on average, AOD is increased by 0.02, precipitable water is decreased by 0.06 cm, and surface albedo is increased by 0.03. These adjustments reduce the diurnally averaged downward shortwave irradiance at the surface by 2 W m−2. We do not have exact matches of BSRN and AERONET surface sites, but Tables 3 and 4 show that MATCH AODs have either no bias (North America, China, and Southeast Asia) or are slightly negatively biased by 0.01 (Europe). Therefore, increasing MATCH AODs by 0.02 on average for the midlatitude group seems justifiable. However, a decrease of 2 W m−2 for the diurnally averaged downward shortwave is smaller than the 11 W m−2 bias shown in Fig. 13a, although instantaneous irradiances are used for Fig. 13. The positive bias found in the downward shortwave irradiance for the North African group (Fig. 13c) is not consistent with the positive bias in the AOD shown in Table 3 under clear-sky conditions.
The adjustment made to match TOA shortwave irradiance in the EBAF product is within the uncertainty of MODIS-derived AOD of ±0.05 over land and ±0.03 over ocean (Remer et al., 2008; Levy et al., 2010, 2013). However, these values are expected errors of instantaneous AOD retrieval derived from the comparison of AODs with AERONET. Therefore, the bias averaged over ground sites and many years is expected to be much smaller. Although, the 0.03 AOD adjustment over ocean might be the upper limit of the uncertainty of MODIS AODs over ocean, the 16 W m−2 bias in the instantaneous downward shortwave irradiance seems to be larger than the 2 W m−2 reduction in the diurnally averaged downward shortwave irradiance.
While we cannot identify the cause of the discrepancy between AOD comparison and downward shortwave irradiance comparison with surface observations, potential issues are as follows: (1) the aerosol type and optical properties used in irradiance computations and (2) the bias in downward shortwave irradiance measured by pyranometer, especially diffuse irradiance at smaller solar zenith angles. Because of the temperature gradient within a pyranometer, the downward shortwave irradiance measured by this instrument tends to be biased low under clear-sky condition (Haeffelin et al., 2001). Note that a study by Ham et al. (2020) indicated that the bias in the diurnally averaged surface downward shortwave irradiance computed by a four-stream model should be smaller than 1 %.
We evaluated MATCH AODs used to produce the CERES SYN1deg product. AODs derived from Terra and Aqua by the Dark Target and Deep Blue algorithms were merged to produce daily gridded AODs. Daily gridded AODs were used for assimilation by MATCH at local solar noon. As a consequence, monthly mean AODs under clear-sky conditions identified by MODIS closely agree with those derived from MATCH, although MATCH uses climatological aerosol sources. Because AODs are not screened by QAC, MATCH AODs are larger over convective regions (e.g., the Amazon, central Africa, and Southeast Asia) for both clear-sky and all-sky conditions.
MATCH AODs under all-sky conditions are larger than those under clear-sky conditions. Time series of AERONET AODs indicate that AODs generally increase with cloud fraction, which is consistent with, primarily, water uptake by hygroscopic aerosols (Varnai et al., 2017). In addition, surface observations at the ARM SGP site suggest larger AODs and larger precipitable water values under all-sky conditions than those under clear-sky conditions. AOD biases from AERONET AODS in MATCH are comparable to biases of MERRA-2 AOD from AERONET AODS for both all-sky and clear-sky conditions. However, MERRA-2, which uses AERONET AODs to train the algorithm, has better temporal correlation with AERONET AODs than MATCH AODs.
Once MATCH AODs are used for surface irradiance computations, downward shortwave irradiances are positively biased by 1 % to 2 % compared with those observed at surface sites. TOA reflected clear-sky shortwave irradiances are negatively biased compared with those derived from CERES observations. Increasing AODs by ∼0.02 and surface albedos by 0.03 as well as decreasing precipitable water by 0.06 cm over midlatitude surface sites makes computed reflected TOA irradiances agree with those derived from CERES. These adjustments reduce downward shortwave irradiances at the surface by 2 W m−2. Decreasing MATCH AODs for the desert group is needed to match computed reflected shortwave irradiances at TOA with those derived from CERES. However, decreasing MATCH AODs is not consistent with generally larger MATCH AODs compared with AERONET. This discrepancy is partially explained via Tables 2 and 6. Table 2 shows that we map all large dust particles from MATCH (>0.5 µm reff) into a single aggregate set of dust scattering properties in the radiative transfer code. Table 6, which shows surface irradiance down for the 0.5, 2.0, and 8.0 µm particle sizes separately, supports the idea that averaging all large dust particles could lead to too much DSI and too little DLI, as found in our irradiance comparisons in Figs. 13 and 14, particularly in regions where larger dust particles are found, such as deserts. This issue will be addressed in the next full release of the CERES SYN1deg product.
A great deal of the data used in this study were collected by dedicated site scientists measuring critical climate variables around the world. The tables included in this Appendix outline the sites, the in situ measurements taken and their locations, and the dates of available data. Table A1 lists the locations of the AERONET sites, our source for observed AOD, which can be found online at https://aeronet.gsfc.nasa.gov/new_web/index.html (last access: 3 February 2022).
Sources of surface-observed downwelling irradiance are outlined in Table A2 (land) and Table A3 (buoys). For land, we utilize data from the Baseline Surface Radiation Network (BSRN; Driemel et al., 2018; Ohmura et al., 1998); the US Department of Energy's Atmospheric Radiation Measurement (ARM) program; and the NOAA SURFRAD network, available from the NOAA Air Resources Laboratory/Surface Radiation Research Branch (Augustine et al., 2000). Buoy observations come from two sources through four separate projects. The Upper Ocean Processes Group at the Woods Hole Oceanographic Institute have maintained the Stratus, North Tropical Atlantic Site (NTAS), and Hawaii Ocean Time-series (HOTS) buoys for more than a decade, providing valuable time series of radiation observations in climatically important regions of the ocean. These data can be retrieved from: http://uop.whoi.edu/index.html (last access: 18 July 2022). We would also like to acknowledge the Project Office of the NOAA Pacific Marine Environmental Laboratory (PMEL) where three groups of buoy data were downloaded: (1) the Tropical Atmosphere Ocean/Triangle Trans-Ocean Buoy Network (TAO/TRITON; McPhaden, 2002) data for the Pacific; the Prediction and Research Moored Array in the Tropical Atlantic (PIRATA; Servain et al., 1998) data for the tropical Atlantic Ocean; and the Research Moored Array for African–Asian–Australian Monsoon Analysis and Prediction (RAMA; McPhaden et al., 2009) data for the Indian Ocean. Also downloaded from PMEL are the long-term buoy observations for the PAPA and Kuroshio Extension Observatory sites.
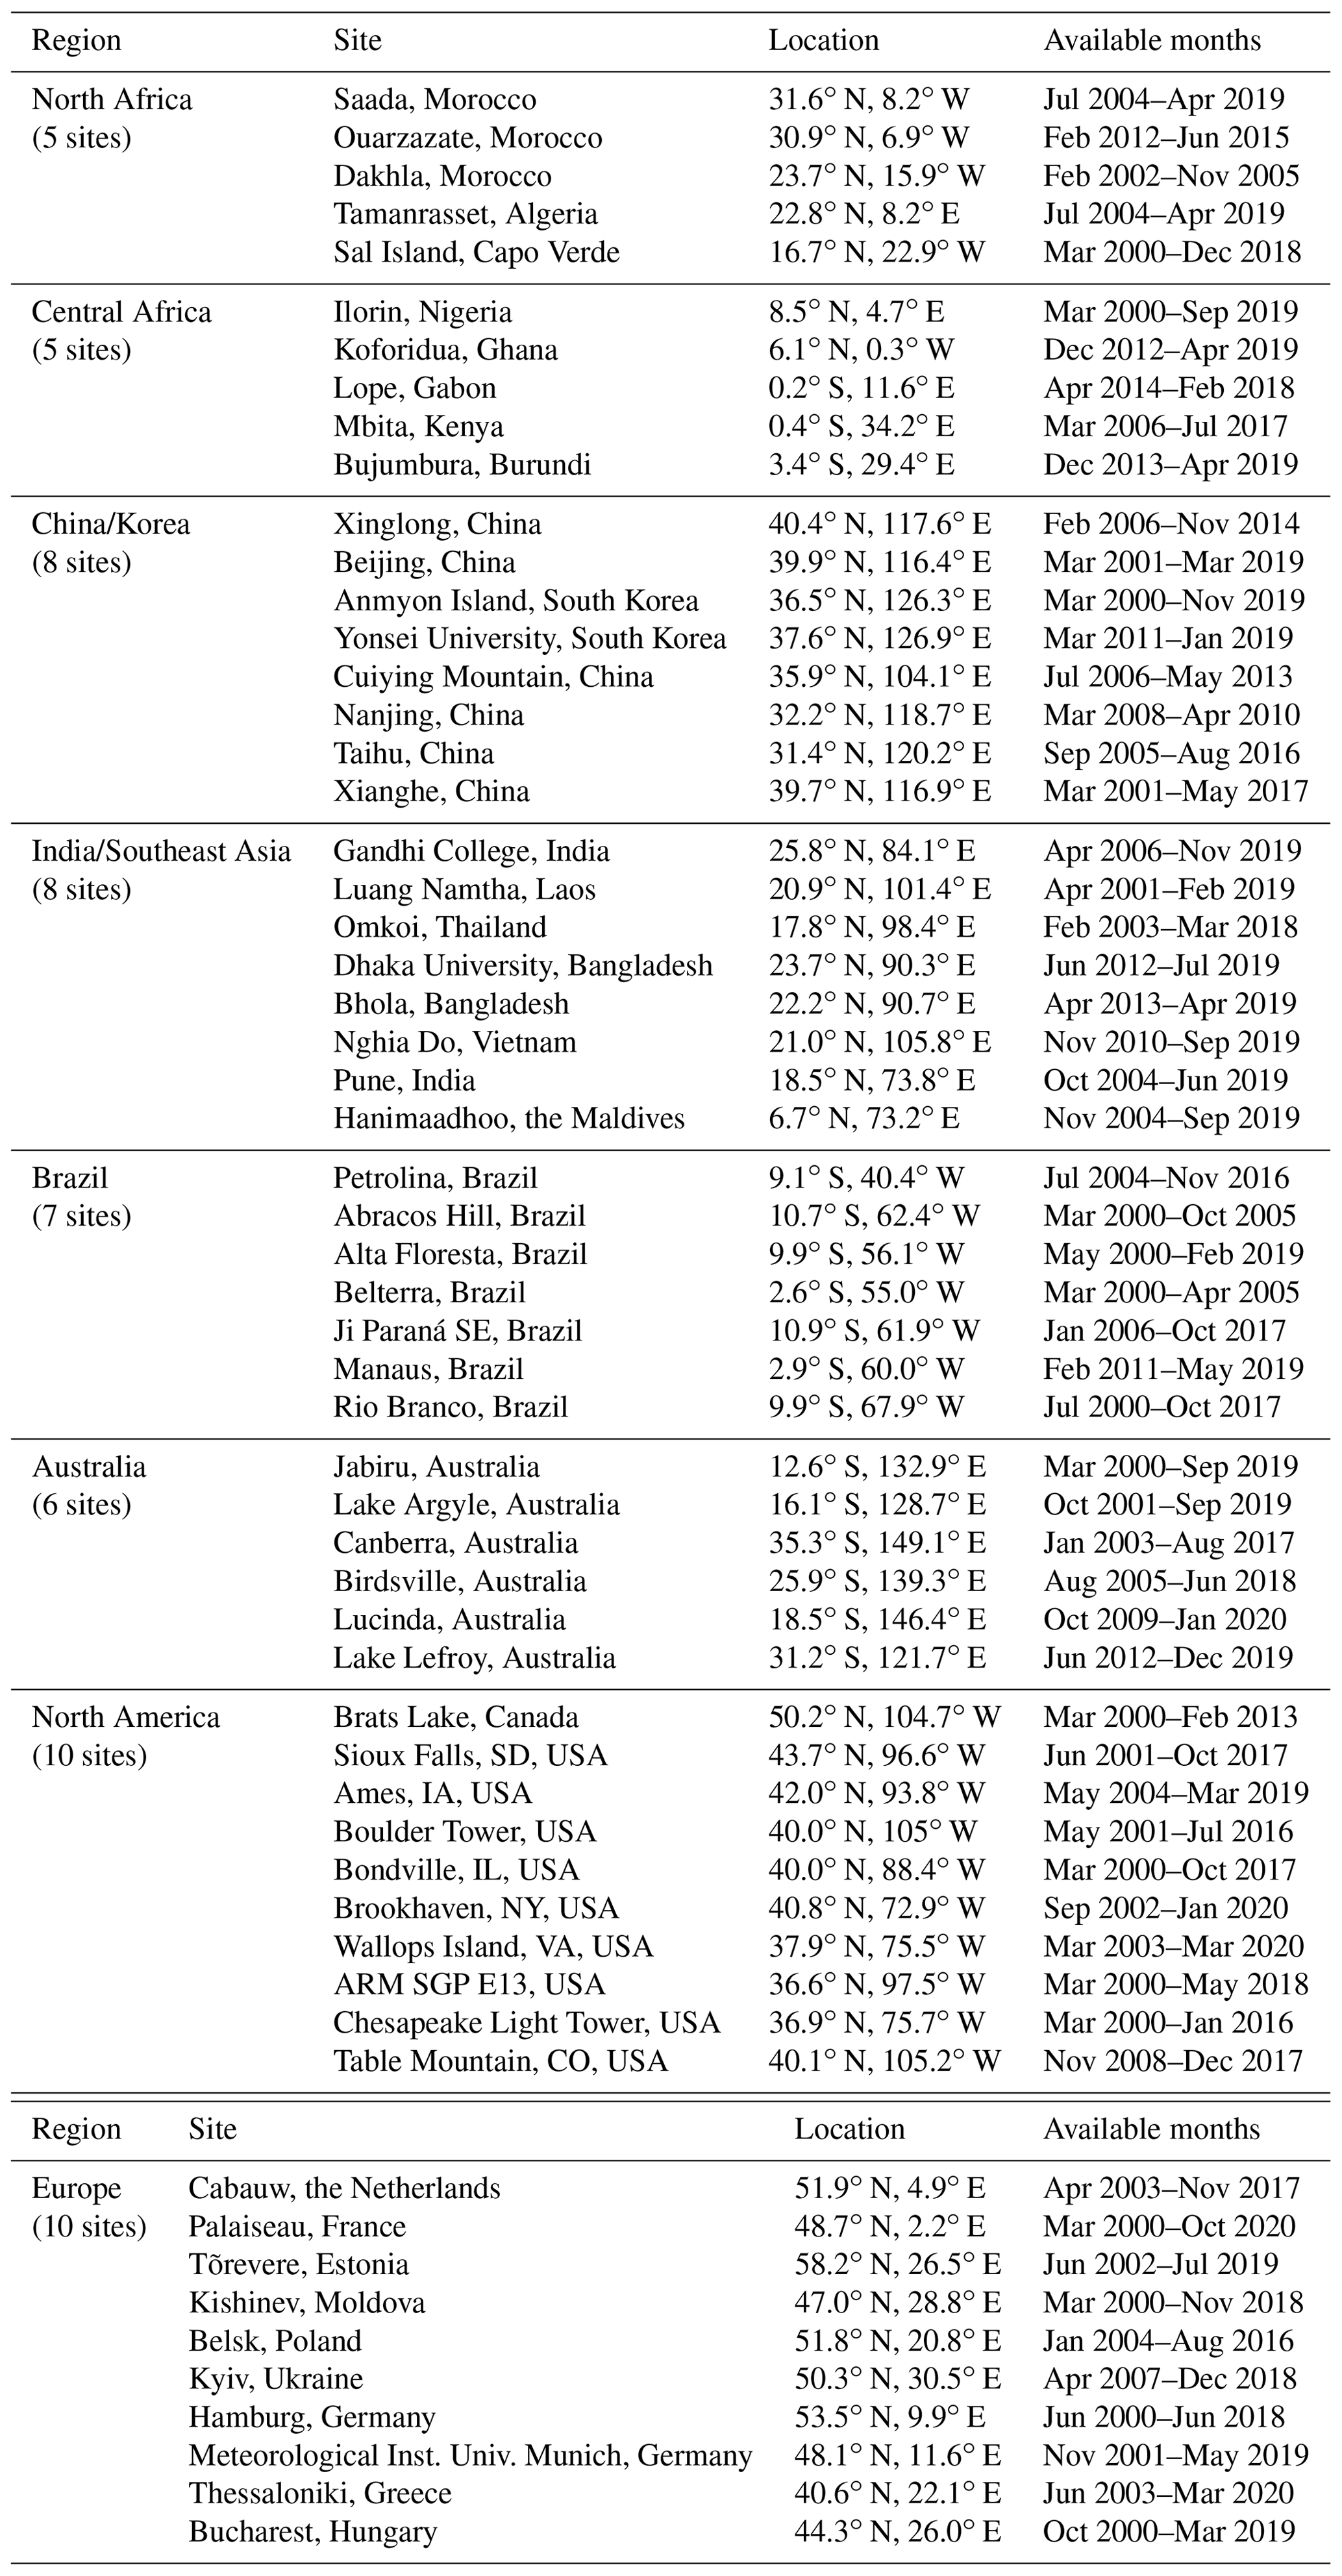
Table A2Surface irradiance validation sites (land).
The abbreviations used in the table are as follows: BSRN – Baseline Surface Radiation Network (http://bsrn.awi.de/, last access: 1 August 2022); SURFRAD – NOAA SURFace RADiation program (http://www.esrl.noaa.gov/gmd/grad/surfrad/, last access: 1 August 2022); ARM – US Department of Energy, Atmospheric Radiation Measurement program (http://www.arm.gov/, last access: 1 September 2021).
Table A3Surface observation sites for ocean buoy locations.
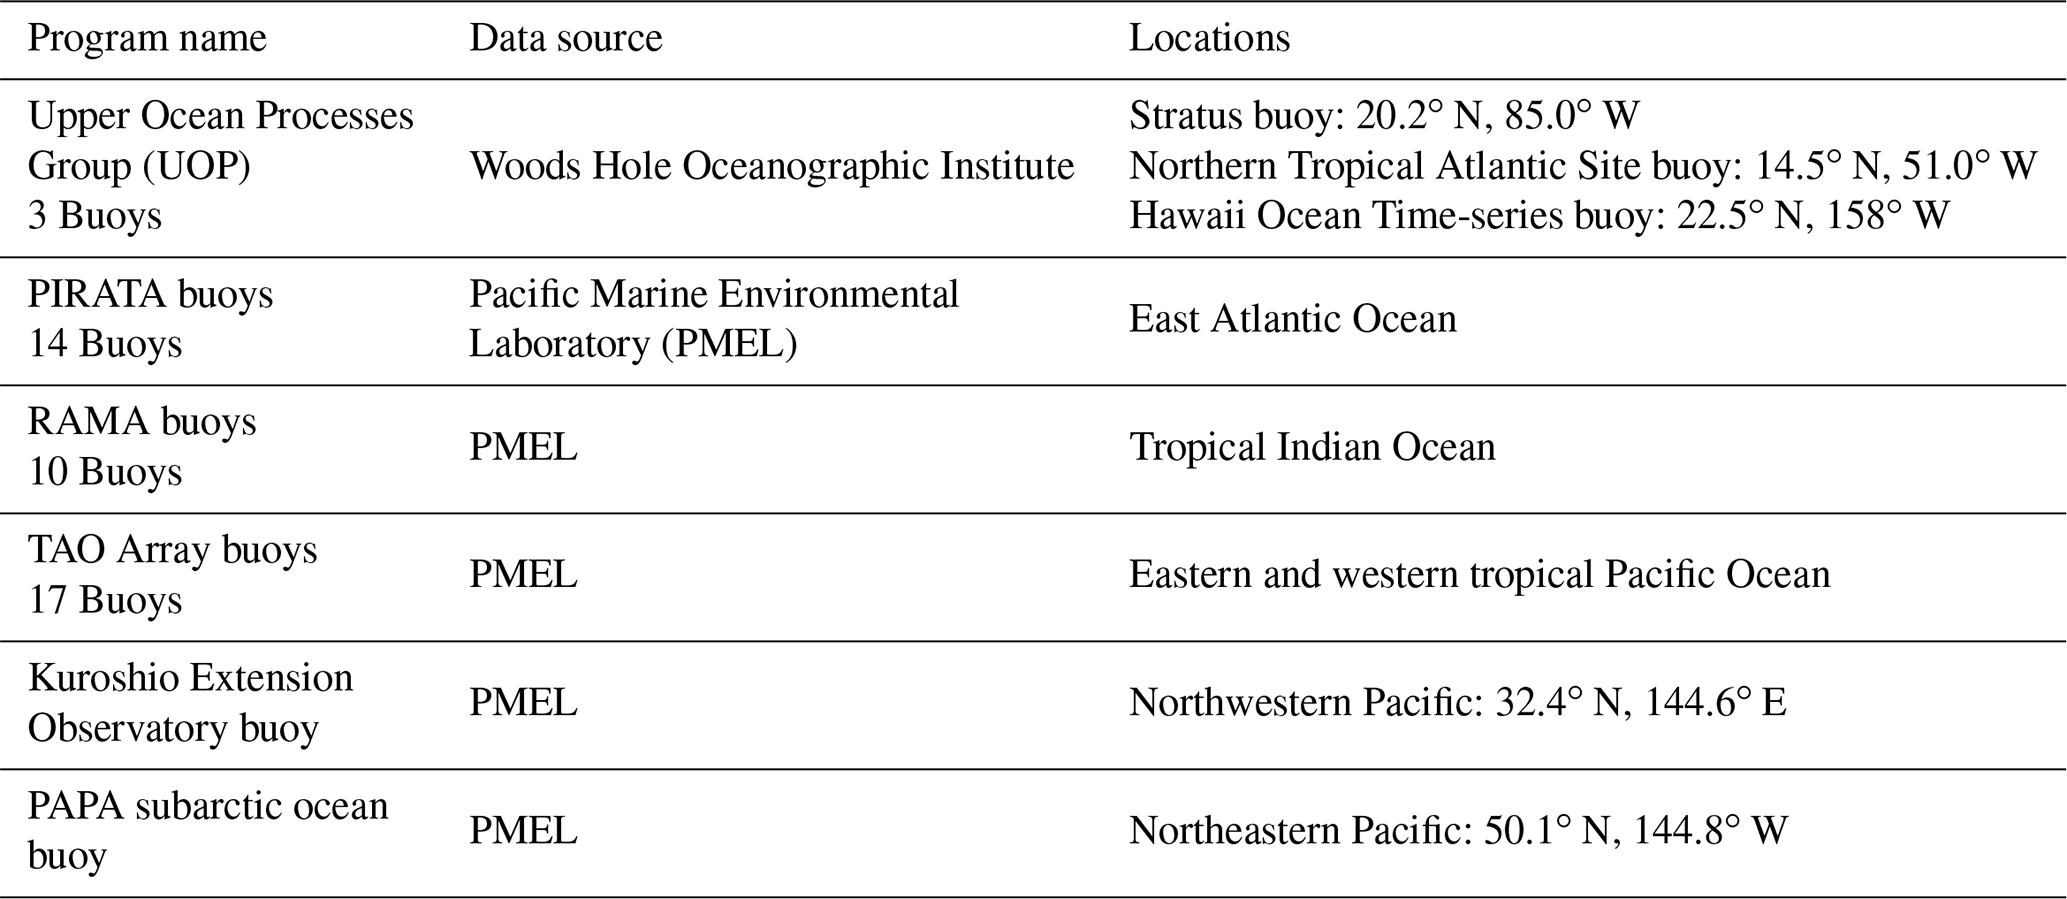
UOP: http://uop.whoi.edu/projects/projects.htm (last access: 18 July 2022). PMEL: http://www.pmel.noaa.gov/tao/data_deliv/deliv.html (last access: 1 August 2022).
The underlying code to process both MATCH and SYN1deg are publicly available upon request from the authors (Seiji Kato – SYN1deg surface and atmospheric radiation budget code; David Fillmore – MATCH code). However, each code requires significant data inputs. These data are provided from various institutions through data sharing agreements via the NASA Langley Atmospheric Science Data Center (ASDC). These data agreements do not extend beyond the ASDC, although they might be replicated as the data are also publicly available.
All surface observation and SYN1deg data are publicly available. Websites from which the surface observations can be accessed are listed in Appendix A. SYN1deg data may be accessed at https://ceres.larc.nasa.gov/data/ (NASA, 2022).
DF was one of the original developers of the MATCH model. DF, DR, and SK wrote significant parts of this paper. DR and FR provided the statistical analysis and plots for the paper. FR and TC developed and implemented significant portions of the SYN1deg code, and DF, FR, and TC developed and implemented the MATCH processing code. DR, SK, DF, and FR reviewed and edited the manuscript.
The contact author has declared that none of the authors has any competing interests.
Publisher'note: Copernicus Publications remains neutral with regard to jurisdictional claims in published maps and institutional affiliations.
This work was funded by the NASA CERES project. The products and the validation could not have been accomplished without the help of the CERES TISA team. These data were obtained from the NASA Langley Research Center EOSDIS Distributed Active Archive Center. We also wish to acknowledge the hard work put in by the many dedicated scientists maintaining surface instrumentation in many diverse climates to obtain high-quality observations of downwelling shortwave and longwave surface flux; these groups are noted in Appendix A. We would also like to thank the anonymous reviewers for their in-depth reading and assessment of the paper which led to significant improvements of the manuscript.
This research has been supported by the National Aeronautics and Space Administration (CERES project).
This paper was edited by Nikos Hatzianastassiou and reviewed by three anonymous referees.
Augustine, J. A., DeLuisi, J. J., and Long, C. N.: SURFRAD – A national surface radiation budget network for atmospheric research, B. Am. Meteorol. Soc., 81, 2341–2358, 2000.
Barth, M. C., Rasch, P. J., Kiehl, J. T., Benkovitz, C. M., and Schwartz, S. E.: Sulfur chemistry in the NCAR CCM: Description, evaluation, features and sensitivity to aqueous chemistry, J. Geophys. Res., 106, 20311–20322, 2000.
Bauer, S. E. and Menon, S.: Aerosol direct, indirect, semidirect, and surface albedo effects from sector contributions based on the IPCC AR5 emissions for preindustrial and present-day conditions, J. Geophys. Res., 117, D01206, https://doi.org/10.1029/2011JD016816, 2012.
Benkovitz, C. M., Scholtz, M. T., Pacyna, J., Tarrason, L., Dignon, J., Voldner, E. C., Spiro, P. A., Logan, J. A., and Graedel, T. E.: Global gridded inventories of anthropogenic emissions of sulfur and nitrogen, J. Geophys. Res.-Atmos., 101, 29239–29253, 1996.
Blanchard, D. C. and Woodcock, A. H.: The production, concentration and vertical distribution of the sea-salt aerosol, Ann. NY Acad. Sci., 338, 330–347, https://doi.org/10.1111/j.1749-6632.1980.tb17130.x, 1980.
Boucher, O., Randall, D., Artaxo, P., Bretherton, C., Feingold, G., Forster, P., Kerminen, V.-M., Kondo, Y., Liao, H., Lohmann, U., Rasch, P., Satheesh, S. K., Sherwood, S., Stevens, B., and Zhang, X. Y.: Clouds and Aerosols, in: Climate Change 2013: The Physical Science Basis, Contribution of Working Group I to the Fifth Assessment Report of the Intergovernmental Panel on Climate Change, chap. 7, edited by: Stocker, T. F., Qin, D., Plattner, G.-K., Tignor, M., Allen, S. K., Boschung, J., Nauels, A., Xia, Y., Bex, V., and Midgley, P. M., Cambridge University Press, Cambridge, UK and New York, NY, USA, https://pure.mpg.de/rest/items/item_2007900_4/component/file_2007948/content (last access: 1 August 2022), 2013.
Colbo, K. and Weller, R. A.: Accuracy of the IMET sensor package in the subtropics, J. Atmos. Ocean. Tech., 26, 1867–1890, https://doi.org/10.1175/2009JTECHO667.1, 2009.
Collins, W. D., Rasch, P. J., Eaton, B. E., Khattatov, V., Lamarque, J.-F., and Zender, C. S.: Simulating aerosols using a chemical transport model with assimilation of satellite aerosol retrievals: Methodology for INDOEX, J. Geophys. Res., 106, 7313–7336, 2001.
d'Almeida, G. A., Koepke, P., and Shettle, E. P.: Atmospheric Aerosols: Global Climatology and Radiative Characteristics, A. Deepak Publishing, 561 pp., ISBN 10:0937194220, ISBN 13:978-0937194225, 1991.
Driemel, A., Augustine, J., Behrens, K., Colle, S., Cox, C., Cuevas-Agulló, E., Denn, F. M., Duprat, T., Fukuda, M., Grobe, H., Haeffelin, M., Hodges, G., Hyett, N., Ijima, O., Kallis, A., Knap, W., Kustov, V., Long, C. N., Longenecker, D., Lupi, A., Maturilli, M., Mimouni, M., Ntsangwane, L., Ogihara, H., Olano, X., Olefs, M., Omori, M., Passamani, L., Pereira, E. B., Schmithüsen, H., Schumacher, S., Sieger, R., Tamlyn, J., Vogt, R., Vuilleumier, L., Xia, X., Ohmura, A., and König-Langlo, G.: Baseline Surface Radiation Network (BSRN): structure and data description (1992–2017), Earth Syst. Sci. Data, 10, 1491–1501, https://doi.org/10.5194/essd-10-1491-2018, 2018.
Emmons, L. K., Walters, S., Hess, P. G., Lamarque, J.-F., Pfister, G. G., Fillmore, D., Granier, C., Guenther, A., Kinnison, D., Laepple, T., Orlando, J., Tie, X., Tyndall, G., Wiedinmyer, C., Baughcum, S. L., and Kloster, S.: Description and evaluation of the Model for Ozone and Related chemical Tracers, version 4 (MOZART-4), Geosci. Model Dev., 3, 43–67, https://doi.org/10.5194/gmd-3-43-2010, 2010.
Fu, Q. and Liou, K.-N.: Parameterization of the radiative properties of cirrus clouds, J. Atmos. Sci., 50, 2008–2025, 1993.
Fu, Q., Lesins, G., Higgins, J., Charlock, T., Chylek, P., and Michalsky, J.: Broadband water vapor absorption of solar radiation tested using ARM data, Geophys. Res. Lett., 25, 1169–1172, 1998.
Ginoux, P., Chin, M., Tegen, I., Prospero, J. M., Holben, B., Dubovik, O., and Lin, S-J.: Sources and distributions of dust aerosols simulated with the GOCART model, J. Geophys. Res.-Atmos., 106, 20255–20273, https://doi.org/10.1029/2000JD000053, 2001.
Haeffelin, M., Kato, S., Smith, A. M., Rutledge, C. K., Charlock, T. P., and Mahan, J. R.: Determination of the thermal offset of the Eppley precision spectral pyranometer, Appl. Optics, 40, 472–484, 2001.
Ham, S., Kato, S., and Rose, F. G.: Examining biases in diurnally-integrated shortwave irradiances due to two- and four-stream approximations in cloudy atmosphere, J. Atmos. Sci., 77, 551–581, https://doi.org/10.1175/JAS-D-19-0215.1, 2020.
Hess, M., Koepke, P., and Schult, I.: Optical Properties of Aerosols and Clouds: The software package OPAC, B. Am. Meteorol. Soc., 79, 831–844, https://doi.org/10.1175/1520-0477(1998)079<0831:OPOAAC>2.0.CO;2, 1998.
Holben, B. N., Eck, T. F., Slutsker, I., Tanre, D., Buis, J. P., Setzer, A., Vermote, E., Reagan, J. A., Kaufman, Y., Nakajima, T., Lavenu, F., Jankowiak, I., and Smirnov, A.: AERONET – A federated instrument network and data archive for aerosol characterization, Remote Sens. Environ., 66, 1–16, 1998.
Hsu, N. C., Tsay, S.-C., King, M. D., and Herman, J. R.: Deep Blue Retrievals of Asian Aerosol Properties During ACE-Asia, IEEE T. Geosci. Remote, 44, 3180–3195, https://doi.org/10.1109/TGRS.2006.879540, 2006.
Huneeus, N., Schulz, M., Balkanski, Y., Griesfeller, J., Prospero, J., Kinne, S., Bauer, S., Boucher, O., Chin, M., Dentener, F., Diehl, T., Easter, R., Fillmore, D., Ghan, S., Ginoux, P., Grini, A., Horowitz, L., Koch, D., Krol, M. C., Landing, W., Liu, X., Mahowald, N., Miller, R., Morcrette, J.-J., Myhre, G., Penner, J., Perlwitz, J., Stier, P., Takemura, T., and Zender, C. S.: Global dust model intercomparison in AeroCom phase I, Atmos. Chem. Phys., 11, 7781–7816, https://doi.org/10.5194/acp-11-7781-2011, 2011.
Kato, S., Loeb, N. G., Rose, F. G., Doelling, D. R., Rutan, D. A., Caldwell, T. E., Yu, L., and Weller, R. A.: Surface Irradiances Consistent with CERES-Derived Top-of-Atmosphere Shortwave and Longwave Irradiances, J. Climate, 26, 2719–2740, 2013.
Kato, S., Rose, F. G., Rutan, D. A., Thorsen, T. J., Loeb, N. G., Doelling, D. R., Huang, X., Smith, W. L., Su, W., and Ham, S.: Surface Irradiances of Edition 4.0 Clouds and the Earth's Radiant Energy System (CERES) Energy Balanced and Filled (EBAF) Data Product, J. Climate, 31, 4501–4527, 2018.
Kaufman, Y. J., Remer, L. A., Tanre, D., Li, R. R., Kleidman, R., Matoo, S., Levy, R. C., Eck, T. F., Holben, B. N., Ichoku, C., Martins, J. V., and Koren, I.: A critical examination of the residual cloud contamination and diurnal sampling effects on MODIS estimates of aerosol over ocean, IEEE T. Geosci. Remote, 43, 2886–2897, https://doi.org/10.1109/TGRS.2005.858430, 2005.
Kinne, S., Schulz, M., Textor, C., Guibert, S., Balkanski, Y., Bauer, S. E., Berntsen, T., Berglen, T. F., Boucher, O., Chin, M., Collins, W., Dentener, F., Diehl, T., Easter, R., Feichter, J., Fillmore, D., Ghan, S., Ginoux, P., Gong, S., Grini, A., Hendricks, J., Herzog, M., Horowitz, L., Isaksen, I., Iversen, T., Kirkevåg, A., Kloster, S., Koch, D., Kristjansson, J. E., Krol, M., Lauer, A., Lamarque, J. F., Lesins, G., Liu, X., Lohmann, U., Montanaro, V., Myhre, G., Penner, J., Pitari, G., Reddy, S., Seland, O., Stier, P., Takemura, T., and Tie, X.: An AeroCom initial assessment – optical properties in aerosol component modules of global models, Atmos. Chem. Phys., 6, 1815–1834, https://doi.org/10.5194/acp-6-1815-2006, 2006.
Koch, D., Schulz, M., Kinne, S., McNaughton, C., Spackman, J. R., Balkanski, Y., Bauer, S., Berntsen, T., Bond, T. C., Boucher, O., Chin, M., Clarke, A., De Luca, N., Dentener, F., Diehl, T., Dubovik, O., Easter, R., Fahey, D. W., Feichter, J., Fillmore, D., Freitag, S., Ghan, S., Ginoux, P., Gong, S., Horowitz, L., Iversen, T., Kirkevåg, A., Klimont, Z., Kondo, Y., Krol, M., Liu, X., Miller, R., Montanaro, V., Moteki, N., Myhre, G., Penner, J. E., Perlwitz, J., Pitari, G., Reddy, S., Sahu, L., Sakamoto, H., Schuster, G., Schwarz, J. P., Seland, Ø., Stier, P., Takegawa, N., Takemura, T., Textor, C., van Aardenne, J. A., and Zhao, Y.: Evaluation of black carbon estimations in global aerosol models, Atmos. Chem. Phys., 9, 9001–9026, https://doi.org/10.5194/acp-9-9001-2009, 2009.
L'Ecuyer T. S., Beaudoing, H. K., Rodell, M., Olson, W., Lin, B., Kato, S., Clayson, C. A., Wood, E., Sheffield, J., Adler, R., Huffman, G., Bosilovich, M., Gu, G., Robertson, F., Houser, P. R., Chambers, D., Famiglietti, J. S., Fetzer, E., Liu, W. T., Gao, X., Schlosser, C. A., Clark, E., Lettenmaier, D. P., and Hilburn, K.: The observed state of the energy budget in the early twenty-first century, J. Climate, 28, 8319–8346, https://doi.org/10.1175/Jcli-D-14-00556.1, 2015.
Levy, R. C., Remer, L. A., Kleidman, R. G. , Mattoo, S., Ichoku, C., Kahn, R., and Eck, T. F.: Global evaluation of the collection 5 MODIS dark-target aerosol products over land, Atmos. Chem Phys., 10, 10399–10420, https://doi.org/10.5194/acp-10-10399-2010, 2010.
Levy, R. C., Mattoo, S., Munchak, L. A., Remer, L. A., Sayer, A. M., Patadia, F., and Hsu, N. C.: The Collection 6 MODIS aerosol products over land and ocean, Atmos. Meas. Tech., 6, 2989–3034, https://doi.org/10.5194/amt-6-2989-2013, 2013.
Liousse, C., Penner, J. E., Chuang, C., Walton, J. J., Eddleman, H., and Cachier, H.: A global three-dimensional model study of carbonaceous aerosols, J. Geophys. Res.-Atmos, 101, 19411–19432, 1996.
Loeb, N. G. and Su, W.: Direct Aerosol Radiative Forcing Uncertainty Based on a Radiative Perturbation Analysis, J. Climate, 23, 5288–5293, https://doi.org/10.1175/2010JCLI3543.1, 2010.
Loeb, N. G., Kato, S., Loukachine, K., and Smith, N. M.: Angular Distribution Models for Top-of-Atmosphere Radiative Flux Estimation from the Clouds and the Earth's Radiant Energy System Instrument on the Terra Satellite. Part I: Methodology, J. Atmos. Ocean. Tech., 22, 338–351, 2005.
Loeb, N. G., Doelling, D. R., Wang, H., Su, W., Nguyen, C., Corbett, J. G., Liang, L., Mitrescu, C., Rose, F. G., and Kato, S.: Clouds and the Earth's Radiant Energy System (CERES) Energy Balanced and Filled (EBAF) top-of-atmosphere (TOA) Edition-4.0 data product, J. Climate, 31, 895–918, https://doi.org/10.1175/JCLI-D-17-0208.1, 2018.
Loeb, N. G., Rose, F. G., Kato, S., Rutan, D. A., Su, W., Wang, H., Doelling, D. R., Smith, W. L., and Gettelman, A.: Toward a Consistent Definition between Satellite and Model Clear-Sky Radiative Fluxes, J. Climate, 33, 61–75, https://doi.org/10.1175/JCLI-D-19-0381.1, 2020.
Long, C. N., Ackerman, T. P., Gaustad, K. L., and Cole, J. N. S.: Estimation of fractional sky cover from broadband shortwave radiometer measurements, J. Geophys. Res., 111, D11204, https://doi.org/10.1029/2005JD006475, 2006.
Marshak, A., Ackerman, A., da Silva, A. M., Eck, T., Holben, B., Kahn, R., Kleidman, R., Knobelspiesse, K., Levy, R., Lyapustin, A., Oreopoulos, L., Remer, L., Torres, O., Várnai, T., Wen, G., and Yorks, J.: Aerosol properties in cloudy environments from remote sensing observations, B. Am. Meteorol. Soc., 102, E2177–E2197, https://doi.org/10.1175/BAMS-D-20-0225.1, 2021.
Martins, J. V., Tanre, D., Remer, L., Kaufman, Y., Mattoo, S., and Levy, R.: MODIS cloud screening for remote sensing of aerosols over oceans using spatial variability, Geophys. Res. Lett., 29, 1619, https://doi.org/10.1029/2001GL013252, 2002.
McPhaden, M. J.: TAO/TRITON tracks Pacific Ocean warming in early 2002, CLIVAR Exchanges, No. 24, International CLIVAR Project Office, Southampton, UK, 7–9, https://eprints.soton.ac.uk/19305/1/ex24.pdf (last access: 1 August 2022), 2002.
McPhaden, M. J., Meyers, G., Ando, K., Masumoto, Y., Murty, V. S. N., Ravichandran, M., Syamsudin, F., Vialard, J., Yu, L., and Yu, W.: RAMA: The Research Moored Array for African–Asian–Australian Monsoon Analysis and Prediction, B. Am. Meteorol. Soc., 90, 459–480, https://doi.org/10.1175/2008BAMS2608.1, 2009.
Minnis, P., Sun-Mack, S., Chen, Y., Chang, F., Yost, C. R., Smith, W. L., Heck, P. W., Arduini, R. F., Bedka, S. T., Yi, Y., Hong, G., Jin, Z., Painemal, D., Palikonda, R., Scarino, B. R., Spangenberg, D. A., Smith, R. A., Trepte, Q. Z., Yang, P., and Xie, Y.: CERES MODIS Cloud Product Retrievals for Edition 4 – Part I: Algorithm Changes, IEEE T. Geosci. Remote, 59, 2744–2780, https://doi.org/10.1109/TGRS.2020.3008866, 2020.
NASA: CERES Data Products, https://ceres.larc.nasa.gov/data/, last access: 3 August 2022.
Ohmura A., Dutton, E., Forgan, B., Frohlich, C., Gilgen, H., Hegne, H., Heimo, A., Konig-Langlo, G., McArthur, B., Muller, G., Philipona, R., Whitlock, C., Dehne, K., and Wild, M.: Baseline Surface Radiation Network (BSRN/WCRP): New precision radiometry for climate change research, B. Am. Meteorol. Soc., 79, 2115–2136, 1998.
Randles, C. A., Da Silva, A. M., Buchard, V., Colarco, P. R., Darmenov, A., Govindaraju, R., Smirnov, A., Holben, A., Ferrare, R., Hair, J., Shinozuka, Y., and Flynn, C. J.: The MERRA-2 aerosol reanalysis, 1980 onward. Part I: System description and data assimilation evaluation, J. Climate, 30, 6823–6850, https://doi.org/10.1175/JCLI-D-16-0609.s1, 2017.
Rasch, P. J., Mahowald, N. M., and Eaton, B. E.: Representations of transport, convection, and the hydrologic cycle in chemical transport models: Implications for the modeling of short-lived and soluble species, J. Geophys. Res., 102, 127–138, 1997.
Rasch, P. J., Collins, W. D., and Eaton, B. E.: Understanding the Indian Ocean Experiment (INDOEX) aerosol distributions with an aerosol assimilation, J. Geophys. Res., 106, 7337–7355, 2001.
Remer, L. A., Kaufman, Y. J., Tanré, D., Mattoo, S., Chu, D. A., Martins, J. V., Li, R.-R., Ichoku, C., Levy, R. C., Kleidman, R. G., Eck, T. F., Vermote, E., and Holben, B. N.: The MODIS aerosol algorithm, products, and validation, J. Atmos. Sci., 62, 947–973, 2005.
Remer, L. A., Kleidman, R. G., Levy, R. C., Kaufman, Y. J., Tanre, D., Mattoo, S., Vanderlei Martins, J., Ichoku, C., Koren, I., Yu, H., and Holben, B. N.: Global aerosol climatology from the MODIS satellite sensors, J. Geophys. Res.-Atmos., 113, D14S07, https://doi.org/10.1029/2007JD009661, 2008.
Rose, F. G, Rutan, D. A., Charlock, T., Smith, G. L., and Kato, S.: An Algorithm for the Constraining of Radiative Transfer Calculations to CERES-Observed Broadband Top-of-Atmosphere Irradiance, J. Atmos. Ocean. Tech., 30, 1091–1106, https://doi.org/10.1175/JTECH-D-12-00058.1, 2013.
Rutan, D., Rose, F., Roman, M., Manalo-Smith, N., Schaaf, C., and Charlock, T.: Development and assessment of broadband surface albedo from Clouds and the Earth's Radiant Energy System clouds and radiation swath data product, J. Geophys. Res., 114, D08125, https://doi.org/10.1029/2008JD010669, 2009.
Rutan, D., Kato, S., Doelling, D. R., Rose, F. G., Nguyen, L. T., and Caldwell, T.: CERES Synoptic Product: Methodology and Validation of Surface Radiant Flux, J. Atmos. Ocean. Tech., 32, 1121–1143, https://doi.org/10.1175/JTECH-D-14-00165.1, 2015.
Servain, J., Busalacchi, A. J., McPhaden, M. J., Moura, A. D., Reverdin, G., Vianna, M., and Zebiak, S. E.: A Pilot Research Moored Array in the Tropical Atlantic (PIRATA), B. Am. Meteorol. Soc., 79, 2019–2031, https://doi.org/10.1175/1520-0477(1998)079<2019:APRMAI>2.0.CO;2, 1998.
Sinyuk, A., Torres, O., and Dubovik, O.: Combined use of satellite and surface observations to infer the imaginary part of refractive index of Saharan dust, Geophys. Res. Lett., 30, 1081, https://doi.org/10.1029/2002GL016189, 2003.
Smirnov, A., Holben, B. N., Eck, T. F., Dubovik, O., and Slutsker, I.: Cloud-screening and quality control algorithms for the AERONET database, Remote Sens. Environ., 73, 337–349, 2000.
Soden, B. and Chung, E.-S.: The Large-Scale Dynamical Response of Clouds to Aerosol Forcing, J. Climate, 30, 8783–8794, https://doi.org/10.1175/JCLI-D-17-0050.1, 2017.
Stephens, G. L., Slingo, J. M., Rignot, E., Reager, J. T., Hakuba, M. Z., Durack, P. J., Worden, J., and Rocca, R.: Earth's water reservoirs in a changing climate, P. Roy. Soc. A, 476, 20190458, https://doi.org/10.1098/rspa.2019.0458, 2020.
Su, W., Schuster, G. L., Loeb, N. G., Rogers, R. R., Ferrare, R. A., Hostetler, C. A., Hair, J. W., and Obland, M. D.: Aerosol and cloud interaction observed from high spectral resolution lidar data, J. Geophys. Res.-Atmos., 113, D24202, https://doi.org/10.1029/2008JD010588, 2008.
Su, W., Corbett, J., Eitzen, Z., and Liang, L.: Next-generation angular distribution models for top-of-atmosphere radiative flux calculation from CERES instruments: methodology, Atmos. Meas. Tech., 8, 611–632, https://doi.org/10.5194/amt-8-611-2015, 2015a.
Su, W., Corbett, J., Eitzen, Z., and Liang, L.: Next-generation angular distribution models for top-of-atmosphere radiative flux calculation from CERES instruments: validation, Atmos. Meas. Tech., 8, 3297–3313, https://doi.org/10.5194/amt-8-3297-2015, 2015b.
Textor, C., Schulz, M., Guibert, S., Kinne, S., Balkanski, Y., Bauer, S., Berntsen, T., Berglen, T., Boucher, O., Chin, M., Dentener, F., Diehl, T., Easter, R., Feichter, H., Fillmore, D., Ghan, S., Ginoux, P., Gong, S., Grini, A., Hendricks, J., Horowitz, L., Huang, P., Isaksen, I., Iversen, I., Kloster, S., Koch, D., Kirkevåg, A., Kristjansson, J. E., Krol, M., Lauer, A., Lamarque, J. F., Liu, X., Montanaro, V., Myhre, G., Penner, J., Pitari, G., Reddy, S., Seland, Ø., Stier, P., Takemura, T., and Tie, X.: Analysis and quantification of the diversities of aerosol life cycles within AeroCom, Atmos. Chem. Phys., 6, 1777–1813, https://doi.org/10.5194/acp-6-1777-2006, 2006.
Textor, C., Schulz, M., Guibert, S., Kinne, S., Balkanski, Y., Bauer, S., Berntsen, T., Berglen, T., Boucher, O., Chin, M., Dentener, F., Diehl, T., Feichter, J., Fillmore, D., Ginoux, P., Gong, S., Grini, A., Hendricks, J., Horowitz, L., Huang, P., Isaksen, I. S. A., Iversen, T., Kloster, S., Koch, D., Kirkevåg, A., Kristjansson, J. E., Krol, M., Lauer, A., Lamarque, J. F., Liu, X., Montanaro, V., Myhre, G., Penner, J. E., Pitari, G., Reddy, M. S., Seland, Ø., Stier, P., Takemura, T., and Tie, X.: The effect of harmonized emissions on aerosol properties in global models – an AeroCom experiment, Atmos. Chem. Phys., 7, 4489–4501, https://doi.org/10.5194/acp-7-4489-2007, 2007.
Varnai, T., Marshak, A., and Eck, T. F.: Observation-based study on aerosol optical depth and particle size in partly cloudy regions, J. Geophys. Res.-Atmos., 122, 10013–10024, https://doi.org/10.1002/2017JD027028, 2017.
Wen, G., Marshak, A., Cahalan, R. F., Remer, L. A., and Kleidman, R. G.: 3-D aerosol-cloud radiative interaction observed in collocated MODIS and ASTER images of cumulus cloud fields, J. Geophys. Res., 112, D13204, https://doi.org/10.1029/2006JD008267, 2007.
Wielicki, B. A., Barkstrom, B. R., Harrison, E. F., Lee III, R. B., Smith, G. L., and Cooper, J. E.: Clouds and the Earth's Radiant Energy System (CERES): An Earth Observing System Experiment, B. Am. Meteorol. Soc., 77, 853–868, 1996.
Zender, C. S., Huishen, B., and Newman, D.: Mineral Dust Entrainment and Deposition (DEAD) model: Description and 1990s dust climatology, J. Geophys. Res., 108, 4416, https://doi.org/10.1029/2002JD002775, 2003.
- Abstract
- Introduction
- Description of the MATCH transport model
- Discussion of AOD differences
- Clear-sky comparisons of SYN1deg and surface-observed irradiances
- Conclusions
- Appendix A: Surface observation sites used for validation
- Code availability
- Data availability
- Author contributions
- Competing interests
- Disclaimer
- Acknowledgements
- Financial support
- Review statement
- References