the Creative Commons Attribution 4.0 License.
the Creative Commons Attribution 4.0 License.
 | 01 Jul 2021
Oxidation of low-molecular-weight organic compounds in cloud droplets: global impact on tropospheric oxidants
Rolf Sander
Bruno Franco
Catherine Wespes
Andreas Wahner
Domenico Taraborrelli
In liquid cloud droplets, superoxide anion () is known to quickly consume ozone (O3(aq)), which is relatively insoluble. The significance of this reaction as a tropospheric O3 sink is sensitive to the abundance of and therefore to the production of its main precursor, the hydroperoxyl radical (HO2(aq)). The aqueous-phase oxidation of oxygenated volatile organic compounds (OVOCs) is the major source of HO2(aq) in cloud droplets. Hence, the lack of explicit aqueous-phase chemical kinetics in global atmospheric models leads to a general underestimation of clouds as O3 sinks. In this study, the importance of in-cloud OVOC oxidation for tropospheric composition is assessed by using the Chemistry As A Boxmodel Application (CAABA) and the global ECHAM/MESSy Atmospheric Chemistry (EMAC) model, which are both capable of explicitly representing the relevant chemical transformations. For this analysis, three different in-cloud oxidation mechanisms are employed: (1) one including the basic oxidation of SO2(aq) by O3(aq) and H2O2(aq), which thus represents the capabilities of most global models; (2) the more advanced standard EMAC mechanism, which includes inorganic chemistry and simplified degradation of methane oxidation products; and (3) the detailed in-cloud OVOC oxidation scheme Jülich Aqueous-phase Mechanism of Organic Chemistry (JAMOC). By using EMAC, the global impact of each mechanism is assessed focusing mainly on tropospheric volatile organic compounds (VOCs), HOx (), and O3. This is achieved by performing a detailed HOx and O3 budget analysis in the gas and aqueous phase. The resulting changes are evaluated against O3 and methanol (CH3OH) satellite observations from the Infrared Atmospheric Sounding Interferometer (IASI) for 2015. In general, the explicit in-cloud oxidation leads to an overall reduction in predicted OVOC levels and reduces EMAC's overestimation of some OVOCs in the tropics. The in-cloud OVOC oxidation shifts the HO2 production from the gas to the aqueous phase. As a result, the O3 budget is perturbed with scavenging being enhanced and the gas-phase chemical losses being reduced. With the simplified in-cloud chemistry, about 13 Tg yr−1 of O3 is scavenged, which increases to 336 Tg yr−1 when JAMOC is used. The highest O3 reduction of 12 % is predicted in the upper troposphere–lower stratosphere (UTLS). These changes in the free troposphere significantly reduce the modelled tropospheric ozone columns, which are known to be generally overestimated by EMAC and other global atmospheric models.
- Article
(8082 KB) - Full-text XML
- Companion paper
- BibTeX
- EndNote


Aqueous-phase chemistry in cloud droplets differs significantly from gas-phase chemistry, mainly due to photolysis enhanced by scattering effects within cloud droplets (Bott and Zdunkowski, 1987; Mayer and Madronich, 2004), faster reaction rates, and chemical reactions that do not occur in the gas phase (Herrmann, 2003; Epstein and Nizkorodov, 2012). Moreover, the conversion of nitrogen monoxide (NO) to nitrogen dioxide (NO2) by peroxy radicals (RO2) essentially does not take place in liquid droplets because NO is very insoluble (Lelieveld and Crutzen, 1990). Compared to gas-phase chemistry, models of aqueous-phase chemistry still suffer from large uncertainties, and most global models only include rudimentary implementations (Ervens, 2015). In general, warm (liquid) clouds can act as a sink for ozone (O3) and its precursors in the troposphere. Figure 1 gives an overview of the inorganic aqueous-phase chemistry for O3(aq) according to the mechanism by Staehelin et al. (1984). When O3 is taken up into cloud droplets, it is mainly destroyed via
The superoxide anion () is in equilibrium with its conjugate acid, the hydroperoxyl radical (HO2(aq)):
Here, HO2(aq) is either scavenged from the gas phase or produced by photo-oxidation inside the cloud droplet. The realistic representation of clouds as O3 sinks is thus sensitive to a proper representation of HO2(aq) in cloud droplets.

Figure 1Graphical representation of inorganic aqueous-phase ozone chemistry based on Staehelin et al. (1984).
The importance of aqueous-phase chemistry for tropospheric O3 has already been the topic of many earlier studies. Lelieveld and Crutzen (1990) proposed that clouds strongly influence O3, HOx (), and NOx (). They concluded that under high-NOx conditions, the net O3 production is decreased by as much as 40 % at particular regions affected by clouds. However, Liang and Jacob (1997) suggested that Lelieveld and Crutzen (1990) grossly overestimated the impact of clouds on O3 because they made the assumption that the methyl peroxy radical (CH3O2) could have the same solubility as HO2. They predicted that clouds reduce tropospheric O3 by less than 3 % in the tropics and at mid-latitudes during summer. A major aqueous-phase source of HO2(aq) is the oxidation of water-soluble oxygenated volatile organic compounds (OVOCs). However, by not considering additional in-cloud HO2(aq) sources, Liang and Jacob (1997) underestimated concentrations dampening the in-cloud destruction of O3(aq). Due to these changes in the gas-phase oxidation budgets, clouds indirectly impact the formation of secondary organic aerosols (SOAs). Further, the in-cloud oxidation of OVOC leads to the formation and destruction of SOA precursors. Therefore, clouds can act as SOA sources (Blando and Turpin, 2000), and modelling studies suggest that clouds may contribute on the same order of magnitude to the SOA formation as gas-phase sources (Ervens et al., 2011; Ervens, 2015; Lin et al., 2012).
It is thus desirable to properly represent aqueous-phase chemistry in global models. Unfortunately, the detailed representation of aqueous-phase chemistry comes at a high computational cost. Thus, compared to gas-phase chemistry, aqueous-phase chemistry is poorly represented in most regional and global models. Further, it is often limited to basic sulfur dioxide (SO2(aq)) oxidation as the only in-cloud O3(aq) destruction pathway in the aqueous phase (Ervens, 2015). The reduced Chemical Aqueous Phase Radical Mechanism (CAPRAM-RED) is based on CAPRAM 3.0i (Tilgner and Herrmann, 2010) and represents about 200 reactions (Deguillaume et al., 2009). So far, it has been applied in 2-D applications using the regional chemistry transport model COSMO-MUSCAT (Deguillaume et al., 2009; Schrödner et al., 2014). On a global scale, Myriokefalitakis et al. (2011) studied the formation of oxalate using an explicit aqueous-phase mechanism using about 50 reactions in an offline 3-D model. When investigating present online global modelling capabilities, the global ECHAM/MESSy Atmospheric Chemistry (EMAC) model constitutes an exception. The technical advances implemented by Tost et al. (2006) allow an explicit representation of aqueous-phase processes. EMAC's standard aqueous-phase mechanism represents more than 150 reactions and even includes a simplified degradation scheme of methane oxidation products (Tost et al., 2007). However, an extensive and explicit in-cloud OVOC oxidation scheme suitable for EMAC and other global models in general has not been available. By neglecting in-cloud OVOC oxidation, aqueous-phase HO2(aq) concentrations are very likely underestimated. Thus, it is expected that global atmospheric models underestimate clouds as O3 sinks. In order to make a detailed in-cloud OVOC oxidation scheme readily available for box as well as for regional and global simulations that is affordable with modern supercomputing facilities, we have developed the Jülich Aqueous-phase Mechanism of Organic Chemistry (JAMOC) and implemented it into the atmospheric chemistry mechanism Module Efficiently Calculating the Chemistry of the Atmosphere (MECCA) in our companion paper by Rosanka et al. (2021). In JAMOC, the phase transfer of species containing up to 10 carbon atoms is taken into account, and a selection of species containing up to 4 carbon atoms is considered to react in the aqueous phase, resulting in more than 1000 reactions. Isoprene (C5H8), the most abundantly emitted volatile organic compound (VOC), is not explicitly dissolved but many of its oxidation products explicitly react inside cloud droplets. Here, OVOC reactions with hydroxyl radicals (OH(aq)) are implemented as the main daytime oxidation pathway, whereas nitrate radicals (NO3(aq)) represent the main nighttime oxidant.
In this study, JAMOC is implemented into the global model EMAC (Sect. 2) and its importance for tropospheric VOCs, HOx, and O3 is addressed. The performance of JAMOC is compared to the performance of an aqueous-phase mechanism including only minimal aqueous-phase chemistry and to that of the standard mechanism of EMAC (each presented in Sect. 2.1). In order to understand the mechanism behind the impact of in-cloud OVOC oxidation on a single air parcel, a box-model study is performed in Sect. 3. Afterwards, the impact on a global scale is analysed (Sect. 4). The analysis focuses on a selection of VOCs, HOx, and O3. The multiphase chemistry of JAMOC is expected to impact tropospheric organic acids, which will be the topic of a further study. When considering the global O3 budget, odd oxygen (Ox) is analysed to account for rapid cycling between species of the Ox family. In the scope of this study, Ox is defined as
where PANs are peroxyacyl nitrates, PNs are alkyl peroxy nitrates, ANs are alkyl nitrates, and NPs are nitrophenols. In Sect. 4, all EMAC simulations performed are evaluated against satellite observations of O3 and methanol (CH3OH) obtained from the Infrared Atmospheric Sounding Interferometer (IASI). Model uncertainties are discussed in Sect. 5, followed by a general conclusion (Sect. 6).
The aqueous- and gas-phase mechanisms are presented in Sect. 2.1. They are used within two different modelling frameworks: a box model and a global atmospheric model. The box model, used to investigate the local impact on an air parcel, is presented in Sect. 2.2, and the global chemical atmospheric model is presented in Sect. 2.3. Section 2.4 provides an overview of all simulations performed in this study.
2.1 The chemical mechanisms
The study is based on the comparison of three different aqueous-phase mechanisms (Sect. 2.1.1). While they are characterised by different levels of complexity, especially in terms of the species and reactions taken into account, they are all coupled to the same gas-phase mechanism (Sect. 2.1.2).
2.1.1 Aqueous phase
The first aqueous-phase mechanism includes the uptake of a few soluble compounds, their acid–base equilibria, and the oxidation of SO2(aq) by O3(aq) and H2O2(aq). This mechanism was applied by Jöckel et al. (2006) and is considered to represent the capabilities of most global models (Ervens, 2015). The second aqueous-phase mechanism includes an advanced scheme, representing more than 150 reactions (Tost et al., 2007; Jöckel et al., 2016). It includes in-cloud HOx(aq) chemistry and the destruction of O3(aq) by , but it misses a detailed in-cloud OVOC oxidation scheme. This mechanism can be considered the current standard mechanism used in EMAC. The last aqueous-phase mechanism is the complex OVOC oxidation scheme JAMOC developed in our companion paper by Rosanka et al. (2021). This mechanism is based on the box-model mechanism Cloud Explicit Physico-chemical Scheme (CLEPS 1.0; Mouchel-Vallon et al., 2017). In order to make it applicable for global models, Rosanka et al. (2021) reduced the number of aqueous-phase species to a selection containing up to 4 carbon atoms. JAMOC represents the photo-oxidation of all species containing 1 and 2 carbon atoms represented in CLEPS but limits the photo-oxidation of species with 3 or 4 carbon atoms to the major products from C5H8 oxidation (i.e. methylglyoxal, methacrolein, and methyl vinyl ketone) and the in-cloud sources of methylglyoxal. Still, the phase transfer of soluble species containing up to 10 carbon atoms is represented in JAMOC. In addition to CLEPS, Rosanka et al. (2021) extended JAMOC by (1) simulating hydration and dehydration explicitly; (2) taking the oligomerisation of formaldehyde, glyoxal, and methylglyoxal into account; (3) adding further aqueous-phase photolysis reactions; and (4) considering the gas-phase photo-oxidation of new outgassed species. Overall, JAMOC represents the phase transfer of 350 species, 43 equilibria (acid–base and hydration), and more than 280 photo-oxidation reactions. A complete description of JAMOC, including a list of all reactions, is available in Rosanka et al. (2021). Even though Fenton's chemistry is an in-cloud source of OH(aq), this chemistry is not considered in this study (switched off in JAMOC) due to missing global iron (Fe) distributions and emissions in EMAC. The associated uncertainties for excluding this OH(aq) sources are discussed in Sect. 5.
2.1.2 Gas phase
The Mainz Organic Mechanism (MOM; Sander et al., 2019) is used to model gas-phase chemistry, containing an extensive oxidation scheme for isoprene (Taraborrelli et al., 2009, 2012; Nölscher et al., 2014), monoterpenes (Hens et al., 2014), and aromatics (Cabrera-Perez et al., 2016). In addition, comprehensive reaction schemes are considered for the modelling of the chemistry of NOx, HOx, CH4, and anthropogenic linear hydrocarbons. VOCs are oxidised by OH, O3, and NO3, whereas RO2 reacts with HO2, NOx, and NO3 and undergoes self- and cross-reactions (Sander et al., 2019). When the complex in-cloud OVOC oxidation scheme JAMOC is coupled to MOM, MOM is modified following the gas-phase additions as described in Rosanka et al. (2021).
2.2 Chemistry box model CAABA
Each of the three mechanisms is implemented in the Chemistry As A Boxmodel Application (CAABA; Sander et al., 2019) in order to investigate their implications for a single air parcel under predefined atmospheric conditions. The MECCA submodel in CAABA is capable of numerically integrating the multiphase chemical mechanism as one single system of ordinary differential equations (ODEs) with appropriate phase-transfer reactions (Sander, 1999; Kerkweg et al., 2007). The Kinetic PreProcessor (KPP version 2.2.3; Sandu and Sander, 2006) is used in MECCA to integrate these ODE systems. Further, photolysis, emissions and dry deposition of chemical species, and the exchange with other air masses outside the box (entrainment) are represented in a simplified manner.
In this study, an air parcel during summer is simulated at a mid-latitude with a constant temperature of 278 K and a relative humidity of 100 %. The same initial conditions are used as proposed in Rosanka et al. (2021, see their Table 3), but the NO emissions are neglected in this study. In order to represent a realistic atmospheric cloud event and investigate the impact of the newly developed aqueous-phase mechanism, three atmospheric conditions are modelled during the simulated day. First, CAABA is initialised at 00:00 UTC, and no cloud droplets are present until 12:00 UTC. At 12:00 UTC a cloud is formed with droplet radii of 20 µm and a liquid water content of 0.3 g m−3. After 1 h, the cloud evaporates and all species outgas. The rest of the day is simulated using the same conditions as before the cloud event.
2.3 Global model EMAC
The ECHAM/MESSy Atmospheric Chemistry (EMAC) model is a numerical chemistry and climate simulation system that includes submodels describing tropospheric and middle atmospheric processes and their interaction with oceans, land, and human influences (Jöckel et al., 2010). It uses the second version of the Modular Earth Submodel System (MESSy2) to link multi-institutional computer codes. The core atmospheric model is the fifth-generation European Centre Hamburg general circulation model (ECHAM5; Roeckner et al., 2003). For the present study, EMAC (ECHAM5 version 5.3.02, MESSy version 2.54.0) is used at T63L90MA resolution, i.e. with a spherical truncation of T63 (corresponding to a quadratic Gaussian grid of approximately 1.875∘ by 1.875∘ in latitude and longitude) with 90 vertical hybrid pressure levels up to 0.01 hPa.
In contrast to CAABA, gas- and aqueous-phase chemistry are calculated separately. In order to model the gas-phase mechanism MOM in the troposphere and stratosphere, the submodel MECCA is used. The SCAVenging submodel (SCAV; Tost et al., 2006) is used to simulate the removal of trace gases and aerosol particles by clouds and precipitation. SCAV calculates the transfer of species into and out of rain and cloud droplets using the Henry's law equilibrium, acid dissociation equilibria, oxidation–reduction reactions, heterogeneous reactions on droplet surfaces, and aqueous-phase photolysis reactions (Tost et al., 2006). In this study, SCAV is used to calculate the three aqueous-phase mechanisms presented in Sect. 2.1.1. Like MECCA, SCAV treats the aqueous-phase mechanism as an ODE system and uses KPP (version 1) to solve it. This operator splitting is necessary because the ODE systems resulting from the combination of gas-phase and in-cloud aqueous-phase mechanisms would suffer from (1) a higher stiffness due to fast acid–base equilibria and phase-transfer reactions and (2) load imbalances on high-performance computing (HPC) systems due to the sparsity of clouds. In both MECCA and to some degree SCAV, tagging systems are used to calculate detailed gas- and aqueous-phase Ox and HOx budgets. These systems allow the estimation of the full implications of the aqueous-phase mechanism for atmospheric chemistry. The tagging system of MECCA is more sophisticated and allows for obtaining reaction rates from multiple reactions and combining them into a single tracer (Gromov et al., 2010). For the tropospheric Ox budget, the gas-phase chemical production and loss and the scavenging and wet deposition are taken into account by using MECCA and SCAV, respectively. Additionally, the dry deposition of Ox and many MOM species is calculated by the submodel Dry DEPosition (DDEP; Kerkweg et al., 2006) using its default scheme.
The MESSy submodel Model of Emissions of Gases and Aerosols from Nature (MEGAN) is used to model biogenic VOC emissions (Guenther et al., 2006). Global isoprene emissions are scaled to the best estimate of Sindelarova et al. (2014), which is 595 Tg yr−1. Biomass burning emission fluxes are calculated using the MESSy submodel BIOBURN, which calculates these fluxes based on biomass burning emission factors and dry matter combustion rates. For the latter, Global Fire Assimilation System (GFAS) data are used, which are based on satellite observations of fire radiative power from the Moderate Resolution Imaging Spectroradiometer (MODIS) satellite instruments (Kaiser et al., 2012). The biomass burning emission factors for VOCs are based on Akagi et al. (2011).
The submodel SORBIT (Jöckel et al., 2010) is used to sample the model state along sun-synchronous satellite orbits, at the time of the satellite overpass, and to compare the model outputs to satellite observations obtained from the Infrared Atmospheric Sounding Interferometer (IASI, Clerbaux et al., 2009) on board the Metop-A (IASI-A) and Metop-B (IASI-B) satellites. In particular, Fast Optimal Retrievals on Layers for IASI Ozone (FORLI-O3, version 20151001; see Hurtmans et al., 2012, for a description of the retrievals) is used for the comparison of tropospheric O3 columns. In general, when analysing tropospheric burdens and budgets, the standard EMAC tropopause definition is used. Here, the tropopause is defined in the extratropics using potential vorticity, whereas temperature lapse rates are used in the tropics (Jöckel et al., 2006). However, when comparing modelled tropospheric O3 columns to IASI-FORLI measurements, the troposphere is defined as ranging from the ground to 300 hPa in order to limit the influences of the stratospheric O3 but to include the altitude of maximum sensitivity of IASI in the troposphere (Wespes et al., 2017). Moreover, this allows the avoiding of larger errors that affect the O3 retrievals in the upper troposphere–lower stratosphere (UTLS) (Wespes et al., 2016) and that result in a positive column bias (Boynard et al., 2016). The evaluation of simulation results against global observational datasets of VOC abundance can be performed for only a few species. Daily global distributions of methanol total columns are available from IASI-A and IASI-B observations, using a neural-network-based retrieval approach (Franco et al., 2018). Due to the limited vertical information on methanol that is contained in the IASI spectra, only total columns have been retrieved. Since the neural-network-based retrievals do not rely on scene-dependent a priori information, no averaging kernels are produced and the retrieved total columns are meant to be compared at face value with model data (see Franco et al., 2018, and references therein). For this purpose, the IASI methanol measurements have been daily averaged on the EMAC T63 spatial grid. The comparisons with IASI O3 and methanol data are associated with some observational uncertainties. IASI retrievals are obtained in the thermal infrared range, resulting in an especially high sensitivity to clouds. Appropriate filters are applied in order to account for cloud-contaminated IASI scene observations. These filters are based on defined cloud cover thresholds, using information from the EUMETCast operational processing system (August et al., 2012). The fractional cloud cover threshold depends on the species observed. For O3 and methanol, all observations with a fractional cloud cover above 13 % (Wespes et al., 2017) and 25 % (Franco et al., 2018) have been excluded, respectively. The IASI methanol retrievals are less sensitive to the presence of residual clouds since no radiative transfer model is used, resulting in a higher threshold for methanol. Of course, it cannot be completely ruled out that individual IASI measurements are locally affected by residual clouds that passed the filtering. However, due to the huge dataset used for the seasonal averages, it is considered that such an effect is diluted and is globally negligible.
2.4 Simulations performed
In both modelling frameworks, multiple simulations are performed. In CAABA, the impact of each aqueous-phase mechanism on a single air parcel is investigated. For comparison, the same day is simulated in CAABA using the same initial conditions but excluding the specific cloud event at 12:00 UTC. The global impact is investigated by performing a reference and two sensitivity simulations with EMAC. Global simulations without any in-cloud aqueous-phase chemistry lead to unrealistic concentrations of O3 and other chemical species (Tost et al., 2007). Therefore, the reference simulation includes the minimal scavenging mechanism (in the following called Scm). The two sensitivity simulations use the standard EMAC (in the following called ScSta) and the detailed OVOC oxidation aqueous-phase mechanism (in the following called ScJAMOC). For consistency, the same simulation names are used for the CAABA simulations. In EMAC, the years 2014 and 2015 are simulated, where 2014 is discarded as spin-up. A summary of the gas- and aqueous-phase mechanisms used in each CAABA and EMAC simulation performed in this study is given in Table 1. All simulations were performed at the Jülich Supercomputing Centre with the JURECA and JUWELS clusters (Jülich Supercomputing Centre, 2018, 2019).
Jöckel et al. (2006)Tost et al. (2007)Rosanka et al. (2021)Table 1Characteristics of the gas- and aqueous-phase mechanism used for each simulation performed in this study using CAABA and EMAC.
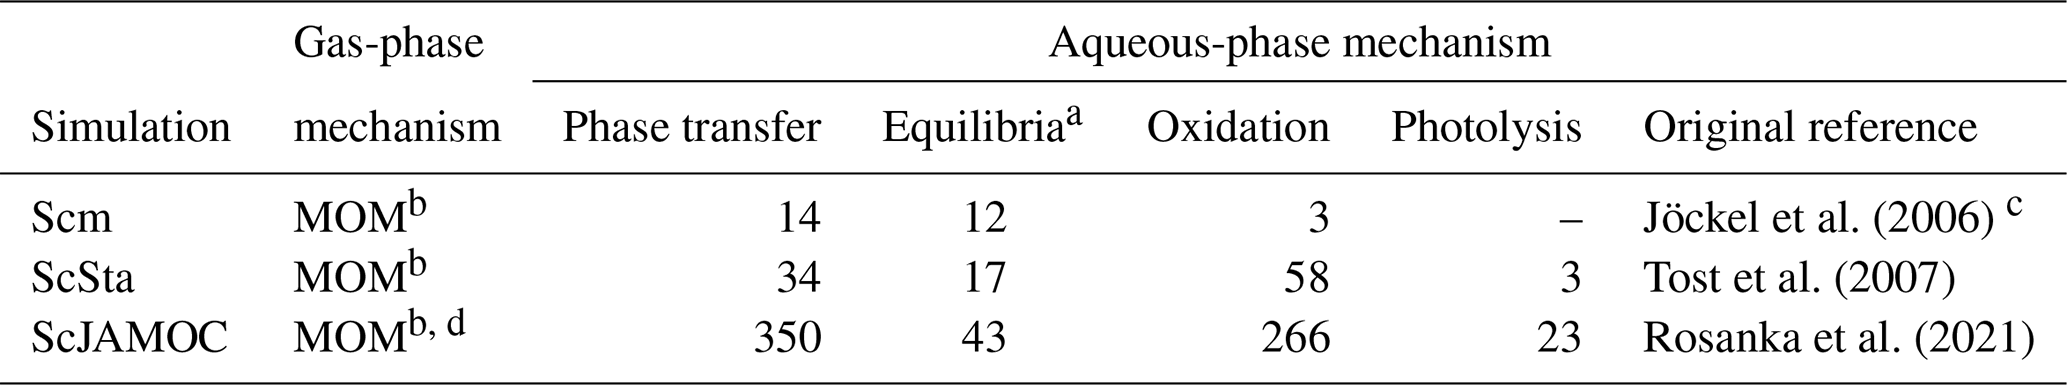
a Acid–base and hydration equilibria. b Mainz Organic Mechanism (MOM; Sander et al., 2019). c Representative of most global models (see Table 1 in Ervens, 2015). d Modified to represent the gas-phase photo-oxidation of gem-diols and oxalic acid (see Sect. 2.1.2 and Rosanka et al., 2021).
Figure 2 shows the time evolution of selected gas-phase species for the different aqueous-phase mechanisms Scm, ScSta, and ScJAMOC for the cloud scenario of CAABA (see Sect. 2.2). For comparison, the results of the no-cloud scenario are also shown. Both Scm and ScSta have only little impact on most of the OVOCs explicitly treated in JAMOC. For some OVOCs, the phase transfer considered in Scm and ScSta leads to reduced gas-phase concentrations during the cloud event. After the cloud evaporates, gas-phase concentrations are slightly higher compared to the no-cloud scenario, since the OVOCs transferred into the cloud droplet generally do not oxidise. Within ScSta, a subset of these OVOCs (containing one carbon atom) are oxidised, leading to a slight reduction compared to Scm. In contrast, ScJAMOC efficiently removes OVOCs, leading to reduced OVOC concentrations overall. Glyoxal, one of the OVOC examples presented in Fig. 2, is completely removed from the gas phase and quickly hydrated within the cloud droplet. The irreversible oxidation of its hydrated forms and oligomers leads to a reduction in in-cloud glyoxal concentrations. In the gas-phase, glyoxal itself is produced by the oxidation of hydrocarbons. Due to low aqueous-phase HOx concentrations during the cloud event, the oxidation of these hydrocarbons is reduced. After the cloud evaporates, the higher hydrocarbon concentrations lead to some glyoxal being produced.

Figure 2Time evolution for gas-phase mixing ratios of the sum of all the OVOCs explicitly reacting in JAMOC (∑OVOCs; see Eq. A1 in Appendix A), glyoxal, glycolaldehyde, methylglyoxal, HO2, OH, NOx, and O3 within the box model CAABA. The time when the cloud is present (between 12:00 and 13:00 UTC) is indicated by blue background shading. Nighttime is indicated by grey background shading. Mixing ratios are provided for no-cloud event (black line), Scm (green line), ScSta (purple line), and ScJAMOC (red line). The characteristics of each simulation are provided in Table 1. Note that lines may overlap.
Each mechanism leads to changes in most gas-phase radical concentrations. As soon as the cloud droplets form, gas-phase HOx is reduced due to the uptake of radicals and radical precursors within the first few minutes. This becomes evident when inspecting the results of Scm: in this mechanism, the uptake of HOx is not taken into account. Here, the gas-phase HO2 concentration is still reduced due to the uptake of a few HO2 sources (e.g. formaldehyde). In the case of the other mechanisms, the uptake of HOx is explicitly considered and leads to an additional reduction in gas-phase concentrations when the cloud forms. In the case of ScJAMOC and, to some extent, of ScSta, the additional partitioning of OVOCs into the cloud droplet leads to a further decrease in gas-phase HOx concentrations. The reduction in OH is in line with other modelling studies for cloud events (Tilgner et al., 2013). When the cloud evaporates, radicals and radical sources are transferred to the gas phase. For ScJAMOC, the efficient in-cloud oxidation of radical sources induces significantly lower HOx concentrations after the cloud evaporates. The photolysis of OVOCs and their oxidation within cloud droplets cause an increase in HOx(aq) of about 50 %. In ScJAMOC, CAABA predicts average in-cloud concentrations of and M for OH(aq) and HO2(aq), respectively. These predictions are of similar magnitude compared to the results of CLEPS (see Fig. 4 in Mouchel-Vallon et al., 2017) and observations and predictions by Tilgner et al. (2013) and Arakaki et al. (2013).
When the cloud forms, gas-phase O3 is reduced in comparison to the no-cloud scenario because of its reactive uptake into the cloud droplet. Within Scm, O3(aq) only reacts with SO2(aq), leading to only a little reduction in gas-phase O3. This reduction is more pronounced for ScSta and ScJAMOC due to additional aqueous-phase sinks and the uptake of HO2 into the cloud droplet. For ScJAMOC, the reduction in O3 is larger due to the additional aqueous-phase HO2(aq) sources from OVOC oxidation. In the gas phase, the significantly reduced HO2 concentrations cause NOx to increase (HO2 being the major sink of NOx). However, it mostly dampens the production of O3 after the cloud event.
This section evaluates the importance of in-cloud OVOC oxidation on a global scale by focusing on VOCs (Sect. 4.1), and HOx (Sect. 4.2). The importance for tropospheric O3 is discussed in Sect. 4.3.
4.1 Impact on tropospheric VOCs
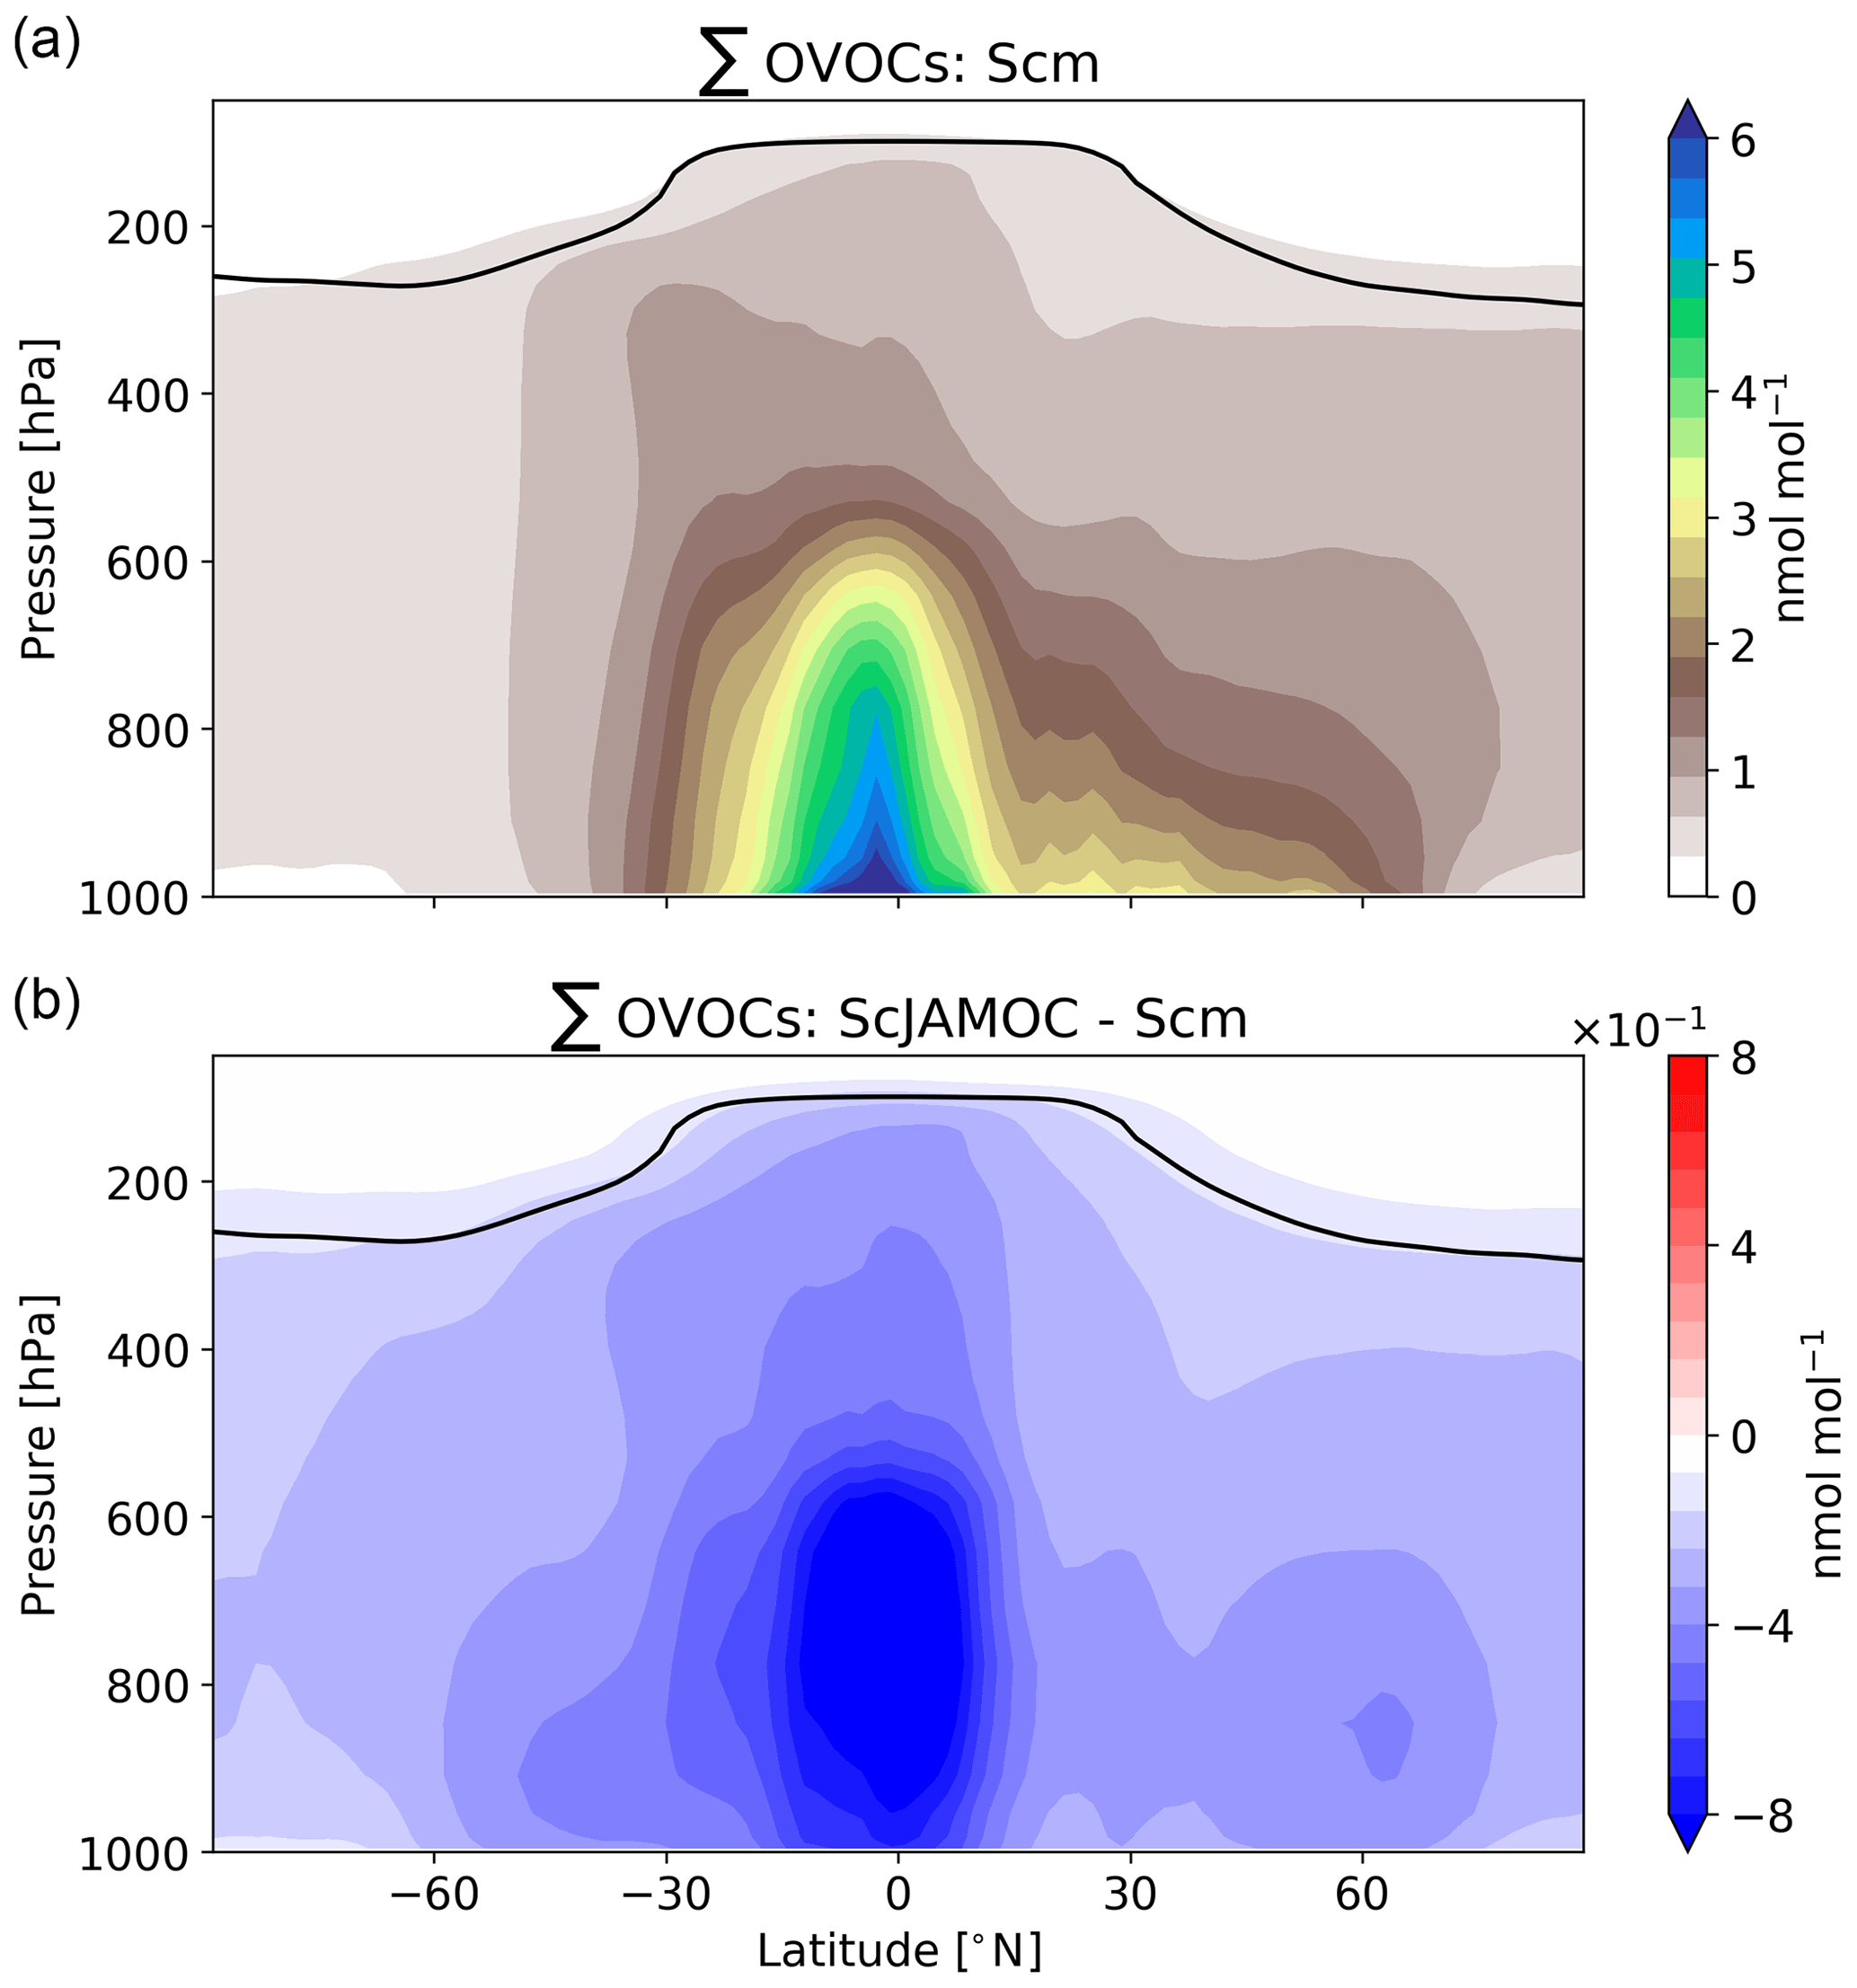
The extensive aqueous-phase OVOC oxidation scheme JAMOC considers many VOC sinks. These significantly influence the concentrations of tropospheric VOCs. In general, VOCs can be split into primarily emitted VOCs and OVOCs mostly formed from secondary production (e.g. oxidation of primarily emitted VOCs). The main global source of primarily emitted VOCs is biogenic processes. The largest biogenic emissions take place in the equatorial region (e.g. Amazon Basin, Central Africa) with additional emissions in the Northern Hemisphere (NH) and Southern Hemisphere (SH) extratropics. Isoprene, the most abundant biogenic VOC, is only slightly influenced by ScJAMOC. The yearly mean tropospheric burden increases from 204 (Scm) to 213 Gg (ScJAMOC). This increase is caused by changes in OH concentrations, the main isoprene oxidant (see Sect. 4.2). Primarily emitted VOCs are quickly oxidised in the lower troposphere, leading to low concentrations in the free troposphere. The top panel of Fig. 3 shows the zonal mean mixing ratio of the sum of all OVOCs that are explicitly treated in JAMOC (∑OVOCs; see Eq. A1 in Appendix A) for Scm. High OVOC concentrations are predicted in the lower troposphere and at lower latitudes, consistent with strong terrestrial biogenic emissions at the Earth surface. By the general upward transport in the equatorial region, OVOCs are transported into the free troposphere. Due to deep convection events in the same region, OVOCs are even transported into the dry tropical upper troposphere. The lower panel of Fig. 3 shows the changes in the sum of OVOCs explicitly treated in JAMOC (∑OVOCs; see Eq. A1 in Appendix A) obtained by comparing Scm and ScJAMOC. Overall, the tropospheric OVOC burden is reduced with the largest change in the tropical free troposphere. The frequent occurrence of clouds in this region and the high OVOC concentrations lead to an efficient removal of gas-phase OVOCs. The ubiquity of clouds in the NH extratropics allows for additional removal of OVOCs from the gas phase. These results are in line with the box-model results presented above (see Fig. 2). The efficient removal of OVOCs in warm clouds significantly affects the OVOC levels in the dry tropical upper troposphere. Here, these OVOCs act as an important HOx source, potentially influencing the production of O3 (Jaeglé et al., 2001).
Table 2Mean gas-phase tropospheric burden in 2015 for a selection of VOCs for Scm and the changes induced by ScSta and ScJAMOC. The characteristics of each simulation are provided in Table 1. Burden values are given in gigagrams (Gg).
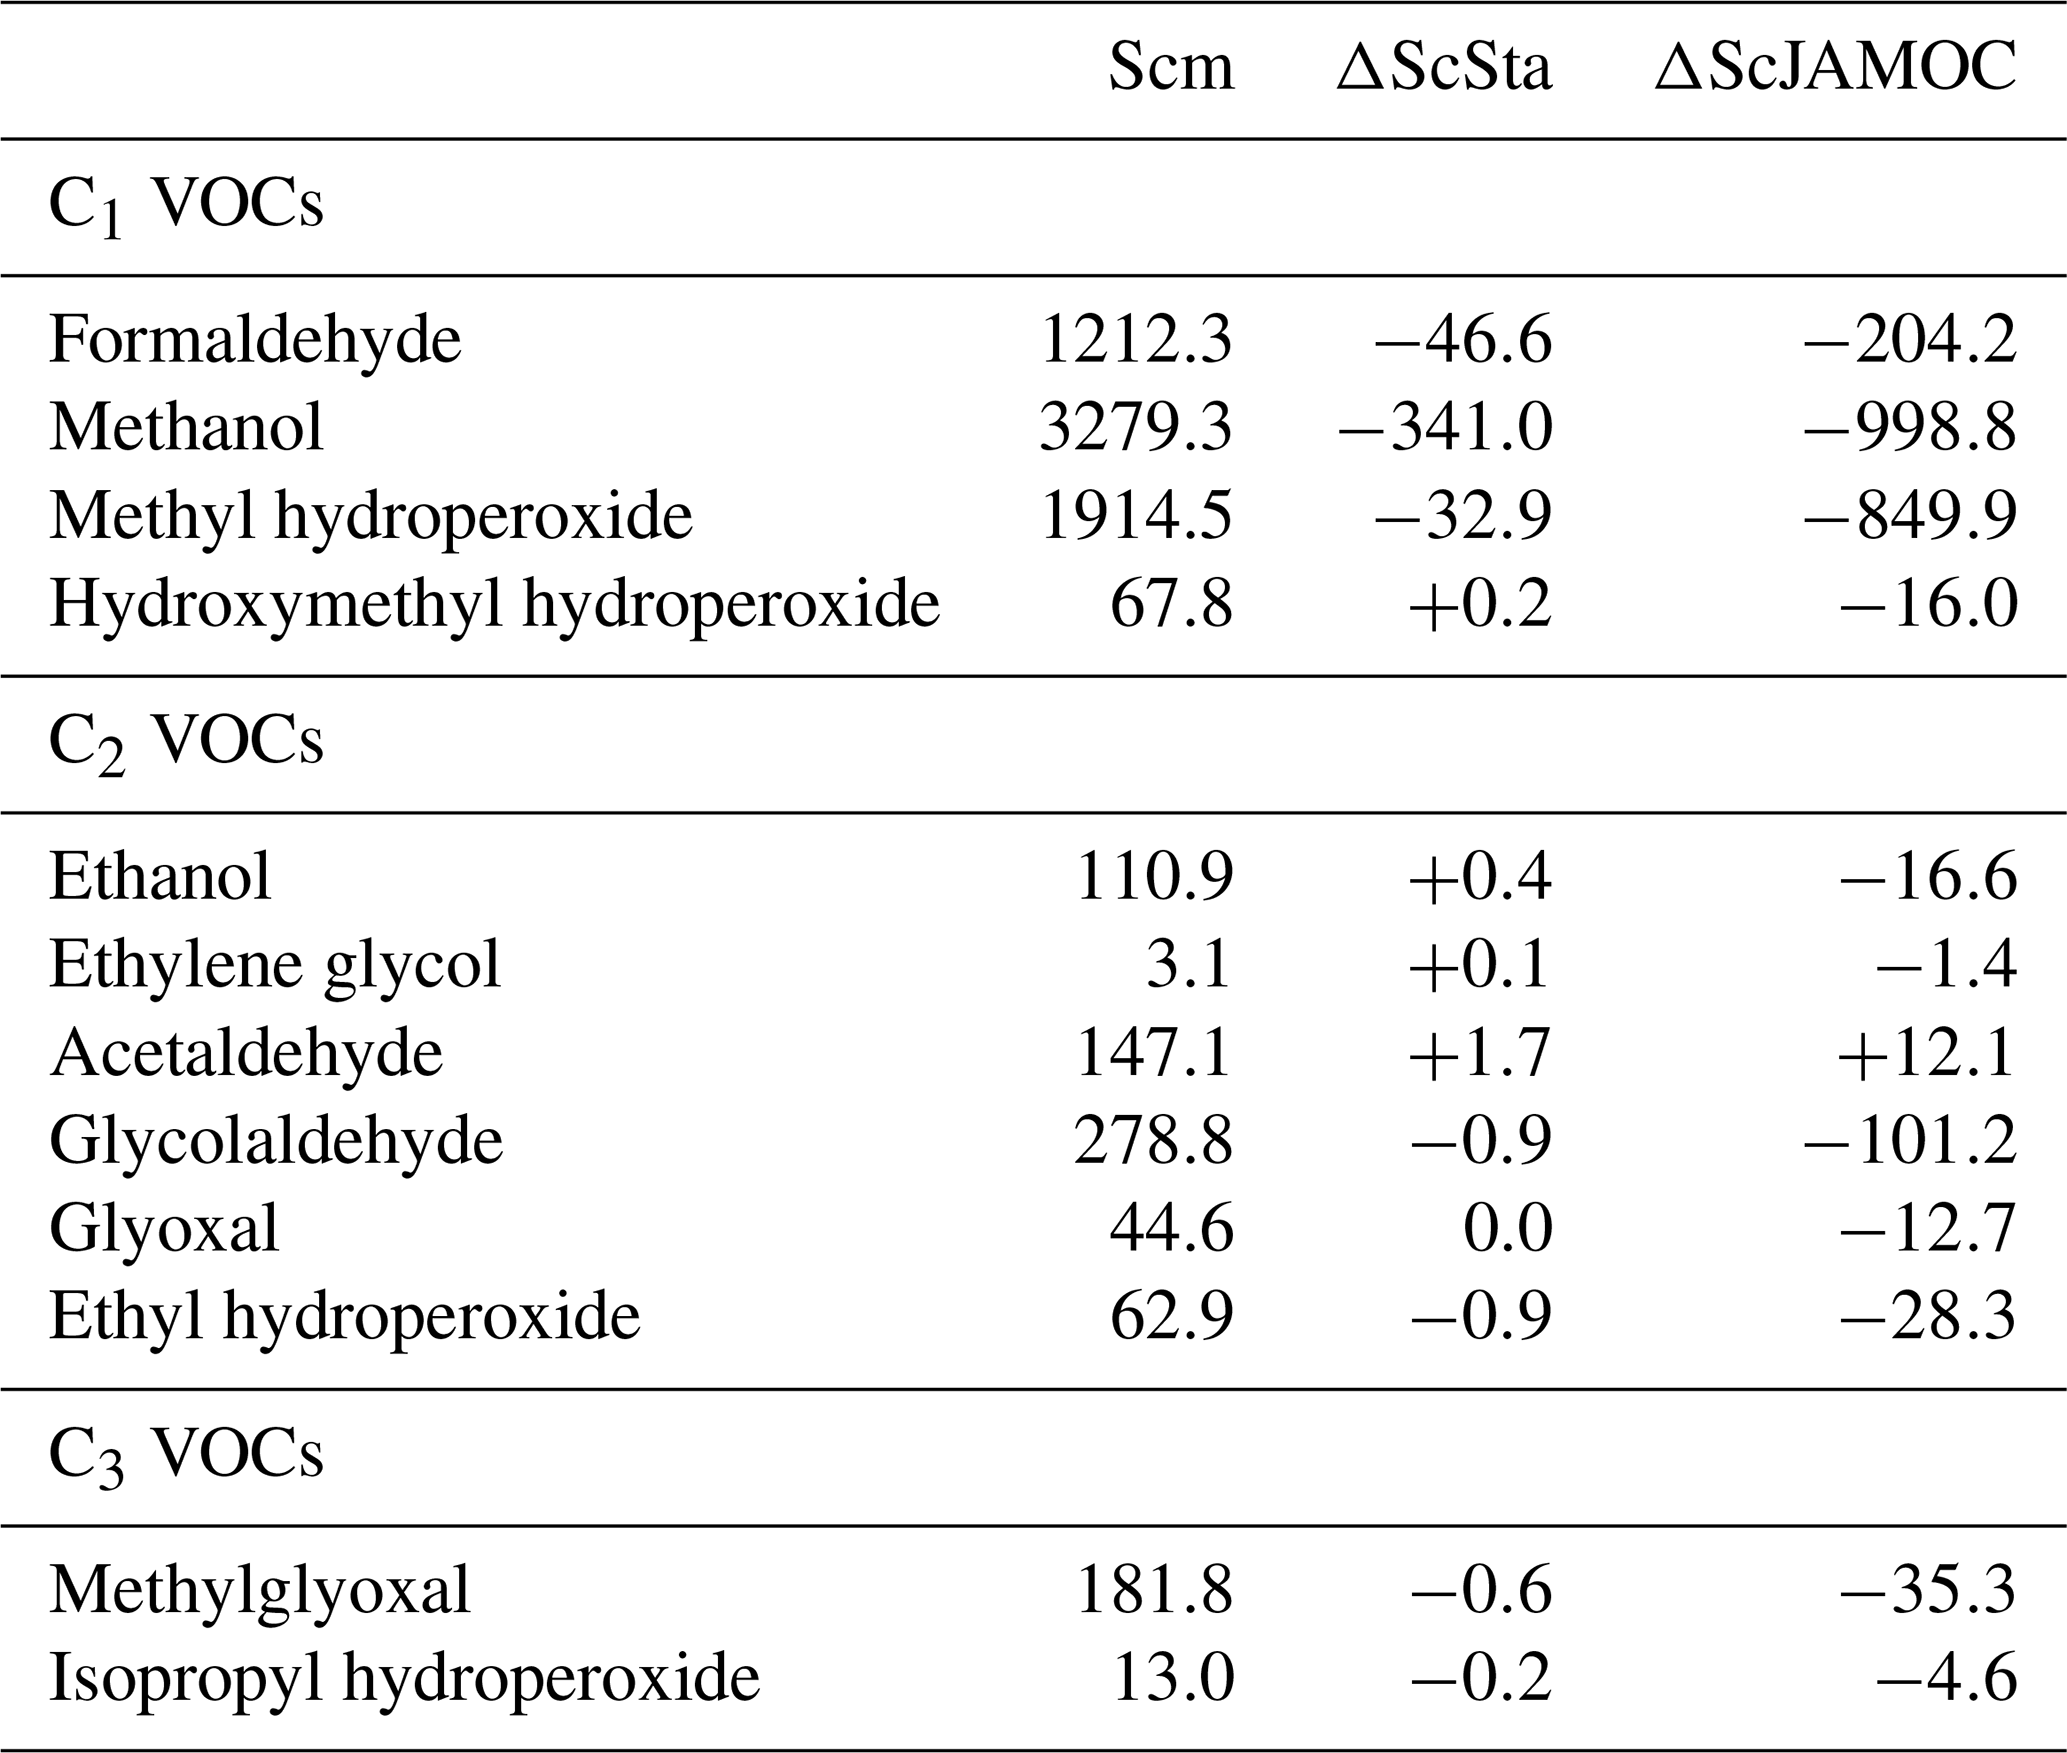
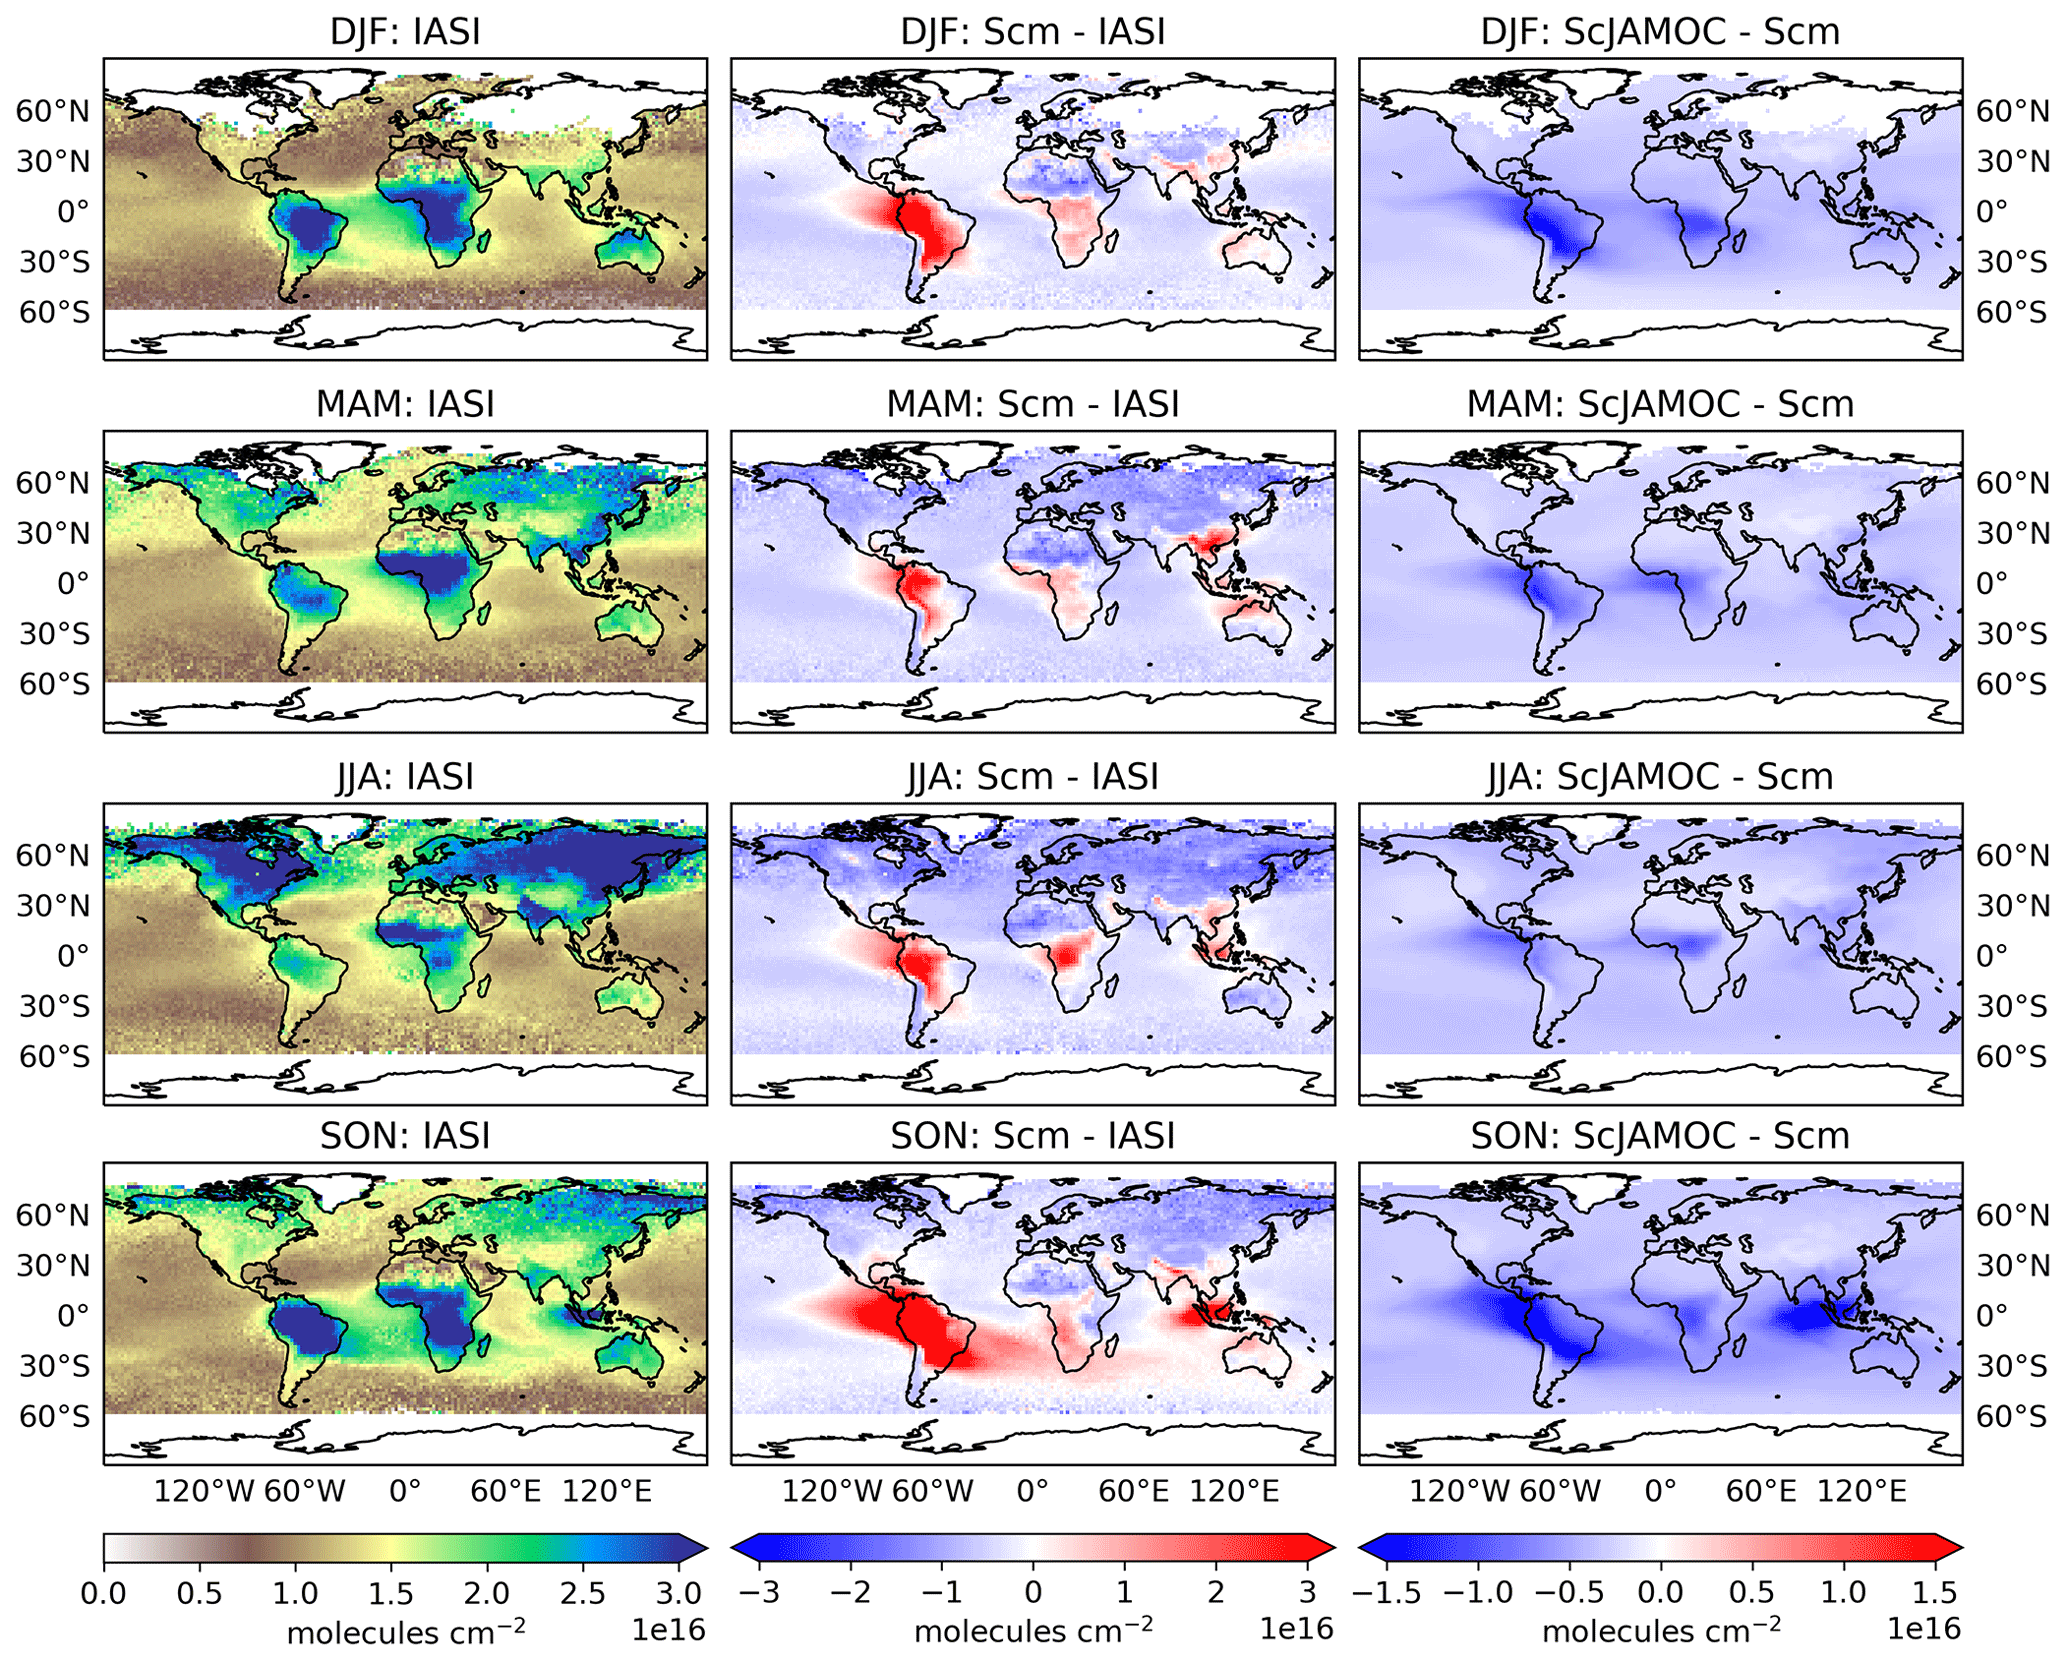
Figure 4Seasonal-mean (seasons are December–February, DJF; March–May, MAM; June–August, JJA; September–November, SON) integrated methanol column obtained from IASI satellite observations (left), of the Scm simulation in comparison to IASI observations (centre), and of ScJAMOC in comparison to Scm (right). The characteristics of each simulation are provided in Table 1.
Table 2 provides an overview of the annual tropospheric burden for a selection of VOCs explicitly treated in JAMOC. As shown in Fig. 3, the global burden of most VOCs is reduced due to the uptake and oxidation processes implemented in ScJAMOC. Because of the low number of VOCs containing one carbon atom treated in ScSta, changes between Scm and ScSta are only minor. The burden of some VOCs even increases in ScSta, which is caused by reduced HOx concentrations (see Sect. 4.2). The impact in ScJAMOC differs for each VOC, with some VOCs in terms of absolute changes being efficiently removed, whereas others are only slightly impacted. The varying efficiency of the VOCs removal by clouds is explained by differences in their Henry's law constants, accommodation coefficients, and aqueous-phase reactivities. The burden of methanol, the OVOC containing one carbon atom for which the highest absolute change is predicted, is reduced by about 1000 Gg. For methyl hydroperoxide the total change is lower but the relative reduction is higher, which is due to slightly higher solubility and overall higher reaction rate constants for the oxidation by OH(aq) and NO3(aq). Formaldehyde is reduced by about 16 %. Even though ethanol has a Henry's law constant similar to that of methanol, the relative reduction is still significantly smaller, due to slower aqueous-phase oxidation. Ethylene glycol has slow aqueous-phase oxidation but very high solubility, which results in a substantial reduction in its tropospheric burden. The opposite holds for ethyl hydroperoxide, which is 4 times less soluble but undergoes fast aqueous-phase oxidation. This leads to a relative change that is similar to the one of ethylene glycol. Acetaldehyde is the only OVOC for which an enhanced burden is predicted. This is partially due to newly implemented in-cloud sources but in particular to the aqueous-phase oxidation of methylglyoxal yielding pyruvic acid, which is a known source of acetaldehyde (Berges and Warneck, 1992).
Figure 4 shows the seasonal-mean methanol column for the IASI observations. In addition, the differences of Scm vs. IASI and ScJAMOC vs. Scm are shown. The highest methanol columns occur close to its major biogenic sources (e.g. Amazon Basin, boreal forests). When using Scm, EMAC underestimates methanol at mid-latitudes and overestimates it close to methanol's main tropical biogenic sources (see centre column, Fig. 4). Both these model inconsistencies are caused by an incorrect spatial distribution of biogenic emissions. The submodel MEGAN, used to simulate biogenic methanol emissions (see Sect. 2.3), estimates yearly biogenic methanol emissions of 104 Tg yr−1, which is close to the 103 Tg yr−1 estimated by Millet et al. (2008, their Table 2). However, the spatial distribution of biogenic emissions from MEGAN is different to their predictions. Compared to Millet et al. (2008), MEGAN significantly overestimates biogenic emissions in the Amazon Basin but underestimates emissions at middle and high latitudes. EMAC simulates the Amazon Basin as too dry in the dry season (September–November, SON) and consequently too hot (Hagemann and Stacke, 2015). The biogenic emissions in MEGAN are temperature-dependent, and generally higher temperatures induce higher emissions. Thus, the positive bias in surface temperatures in EMAC leads to an overestimation in the Amazon Basin. Additionally, uncertainties for all coefficients used in MEGAN, related to the emissions of methanol and primarily emitted VOCs (e.g. isoprene) further influence the incorrect emission distribution. EMAC also underestimates methanol over the oceans. In the current simulation setup, the ocean is represented to only act as a methanol sink but should be considered a source as well over certain oceans (e.g. over the Pacific; see Millet et al., 2008). However, EMAC models the ocean as a net sink with an uptake of about 2.1 Tg yr−1, which is smaller than the predicted net sink from Millet et al. (2008) of 16 Tg yr−1. It is thus expected that there is an additional deficiency in the representation of the gas-phase chemistry of methanol in MOM. Still, when using ScJAMOC, the model bias for methanol is partially resolved (see right column of Fig. 4). In areas where the sources are expected to be modelled correctly (i.e. Central Africa, East Asia), the additional in-cloud OVOC oxidation leads to a reduction in methanol partially resolving the model bias in these regions. However, ScJAMOC is not able to completely resolve the model bias over the Amazon Basin. The positive model bias away from its major sources (i.e. over oceans) is reduced and partially resolved. Especially during the NH autumn (SON), the strong model bias over the East Pacific and the South Atlantic Ocean is reduced. At the same time, a high overestimation for Scm is observed southeast of India over the Indian Ocean. The strong El Niño event in 2015/16 led to droughts, draining the already-dry Indonesian peatland. This drying, in combination with widespread deforestation, led to strong Indonesian fires, emitting large amounts of VOCs (Parker et al., 2016). This positive model bias is strongly reduced when in-cloud methanol oxidation is taken into account (ScJAMOC). A detailed analysis of the Indonesian peatland fires in 2015 and the importance of detailed in-cloud OVOC oxidation during such a pollution event is presented by Rosanka et al. (2020b).

Figure 5Mean integrated tropospheric glyoxal column for Scm (a) and in comparison to ScJAMOC (b). The characteristics of each simulation are provided in Table 1.
To the best of our knowledge, glyoxal satellite retrievals from the Ozone Monitoring Instrument (OMI; Levelt et al., 2006) are only available up to 2014, while the TROPOspheric Monitoring Instrument (TROPOMI) started its operations in late 2017. Levelt et al. (2018) report that this is due to detector degradation and the challenging nature of glyoxal retrievals. A detailed analysis for the year 2007 is performed by Alvarado et al. (2014). Figure 5 gives the yearly mean integrated glyoxal column for Scm and the changes introduced by ScJAMOC. In the gas phase, glyoxal is an oxidation product of hydrocarbons. Therefore, high glyoxal concentrations are predicted by EMAC close to strong biogenic hydrocarbon sources (e.g. Amazon Basin). As found with the CAABA box model, atmospheric glyoxal levels are significantly reduced by the chemical loss in cloud droplets with ScJAMOC (see Table 2). When comparing these results to satellite retrievals from Alvarado et al. (2014, their Fig. 9), it can be concluded that the spatial distribution is reasonably well captured by Scm. However, glyoxal levels are generally overestimated in regions where biogenic emissions dominate. The additional sink introduced into ScJAMOC leads to a significant reduction in the model bias, especially in the Amazon Basin and over Central Africa. However, the model bias is not yet fully resolved in the Amazon Basin. Here, the too-high biogenic hydrocarbon emissions from MEGAN are the cause of an overestimated production of glyoxal. It is important to keep in mind that the comparability with these satellite retrievals is limited due to a different year simulated. It is still expected that the yearly mean spatial distributions of biogenic emissions are comparable for both years and mainly vary in their magnitudes. To conclude, when using JAMOC (ScJAMOC) the representation of methanol and glyoxal gas-phase concentrations is significantly improved within EMAC.
4.2 Impact on tropospheric HOx
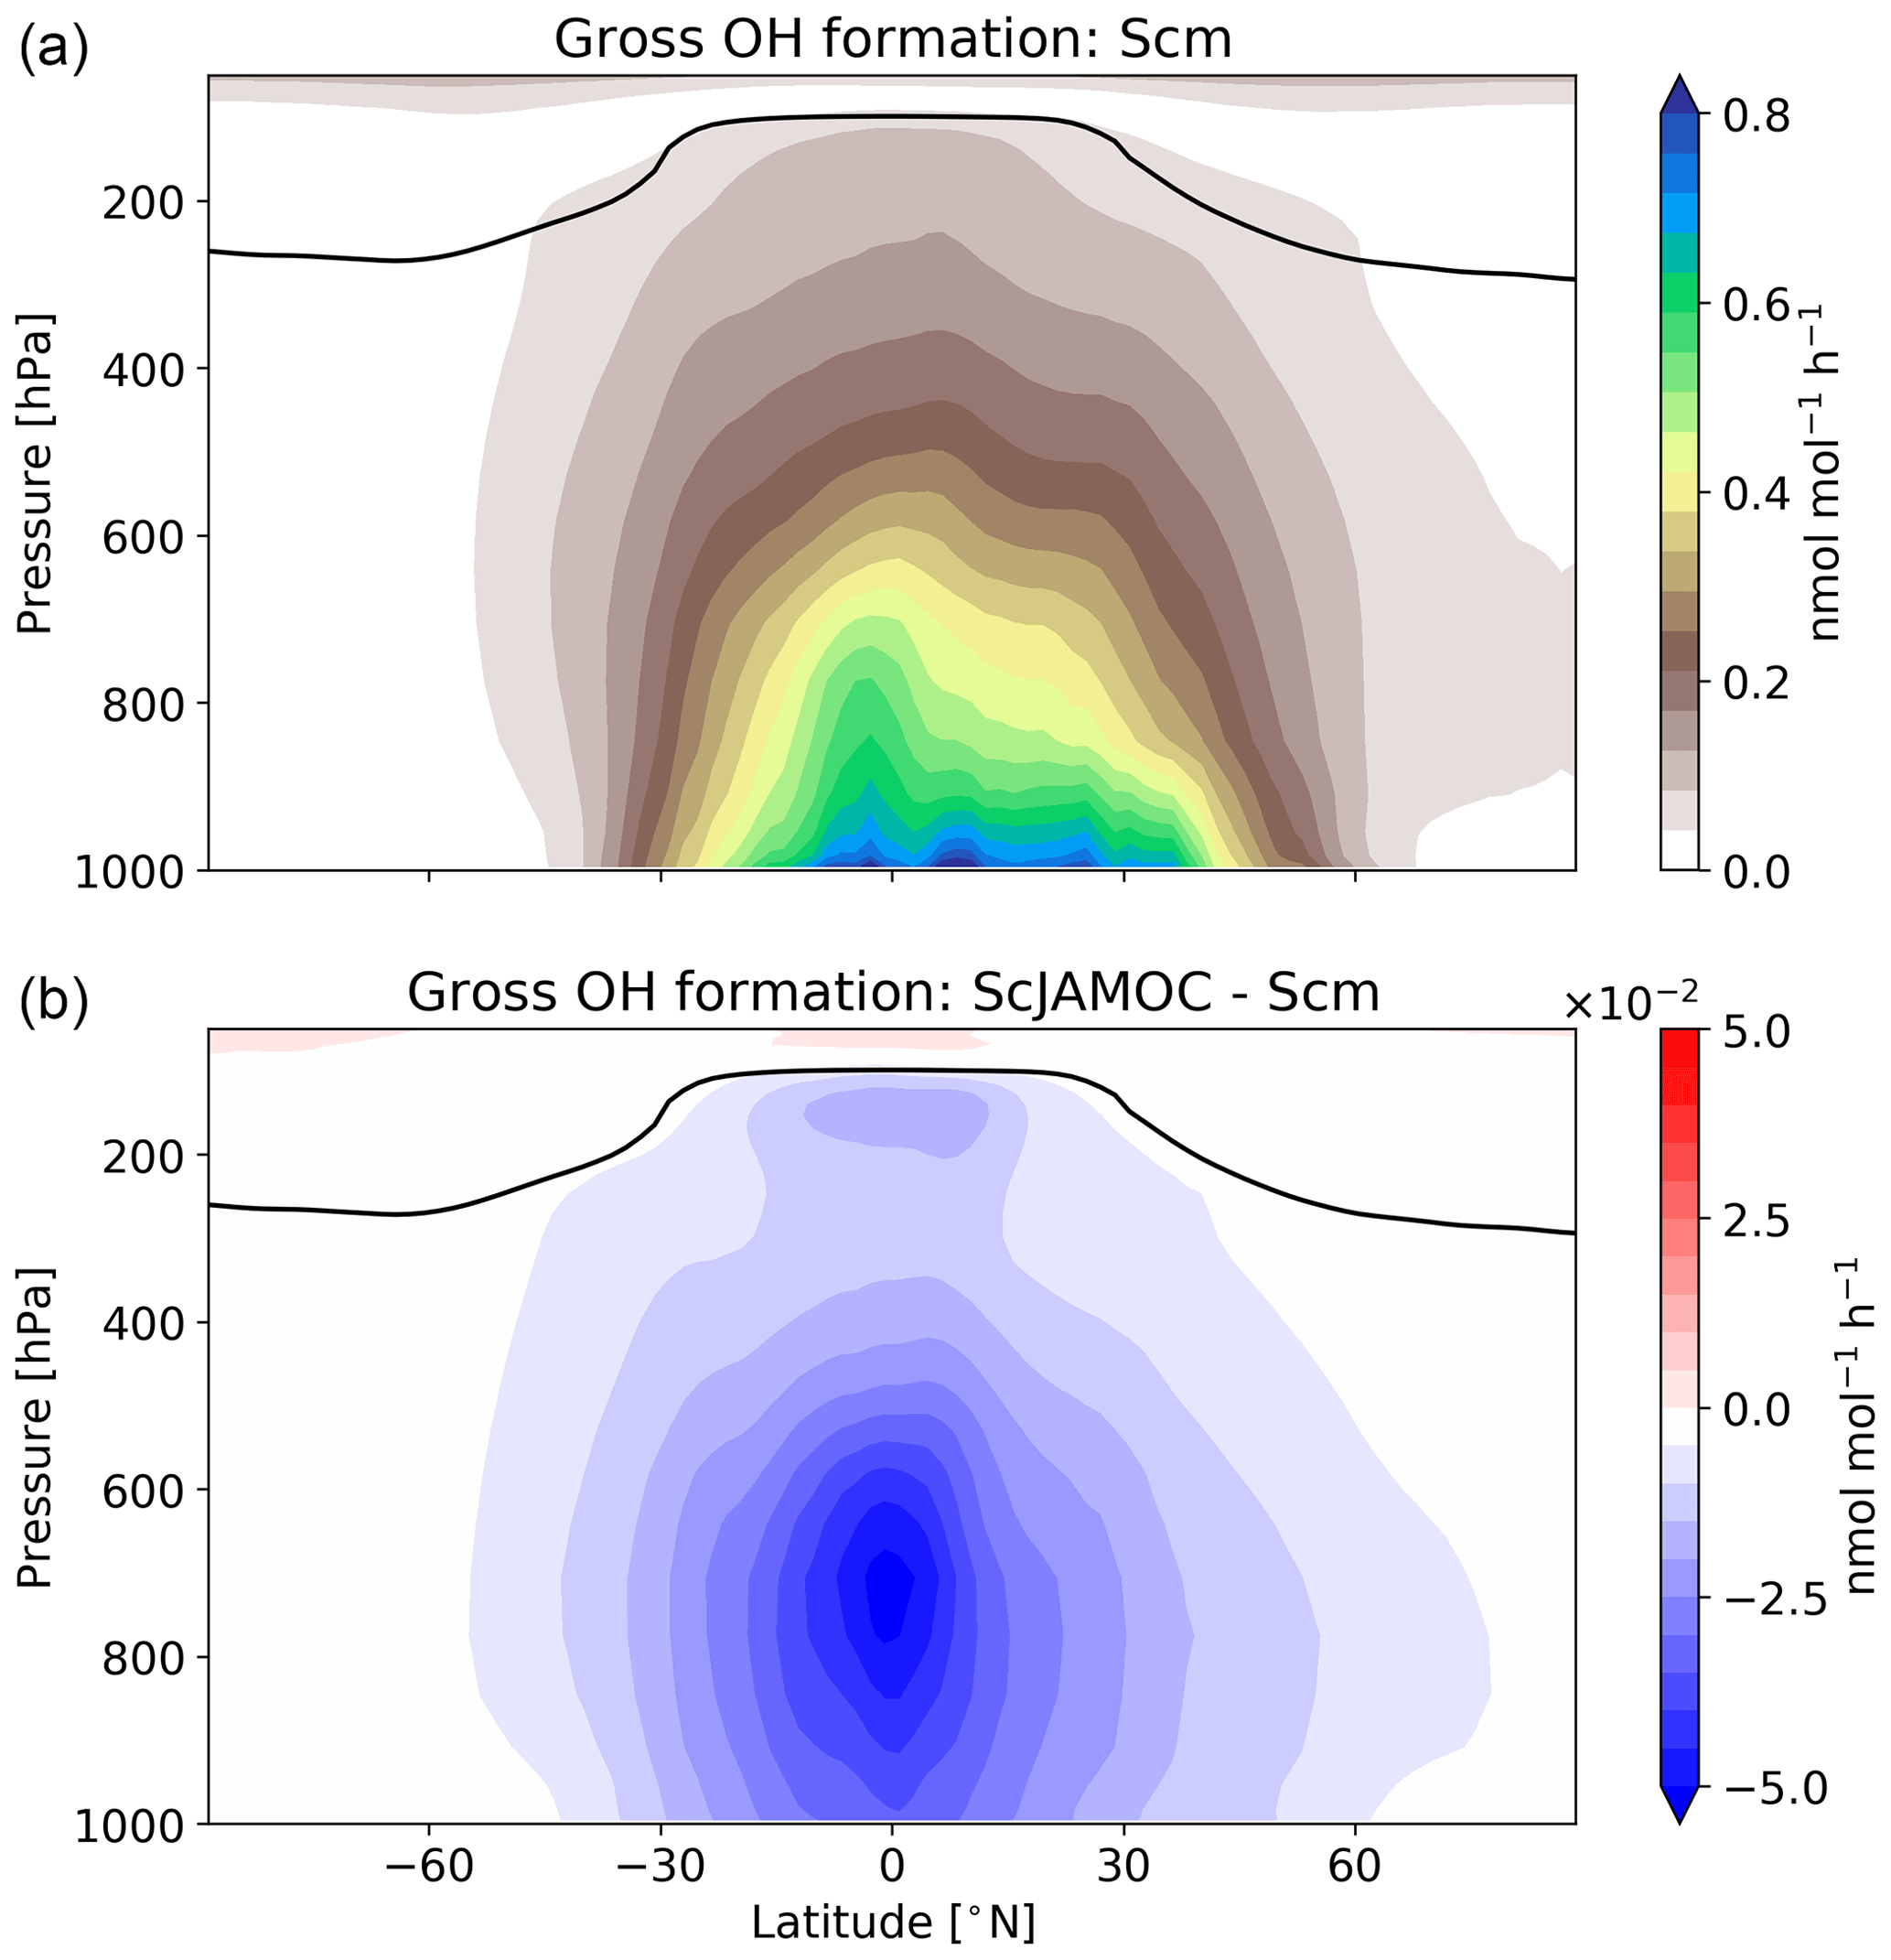
VOCs play an important role in the production and loss of OH and HO2. Thus, the additional uptake of VOCs will influence the tropospheric OH budget. In the troposphere, OH is primarily produced by the reaction of O(1D) with H2O. Here, the main source of O(1D) is the photolysis of O3. Figure 6 gives the zonal mean of the total OH production of Scm and the changes predicted by ScJAMOC. OH is mainly produced in the lower troposphere by both its primary and its secondary sources, whereas in the upper troposphere secondary sources dominate. Table 3 gives an overview of the tropospheric gas-phase OH sources and sinks. With ScJAMOC, the gross OH formation decreases by about 7.3 % from 280.2 to 259.8 Tmol yr−1. This finding is consistent with the box-model results (Fig. 2). The uptake and oxidation of VOCs in the aqueous phase reduce the contribution of VOCs to the OH production. However, the major reduction in the OH production is caused by overall reduced tropospheric O3 concentrations. Specifically, the two largest O3 sinks, namely the OH production induced by O3 photolysis and the reaction of O3 with HO2, are reduced by 8.5 %. O3 has a long atmospheric lifetime, leading to low spatial variability in the reduction in tropospheric O3. However, the reduction in VOC concentrations has high spatial variability (see Fig. 3), largely determining the spatial distribution of the reduction in the total OH formation by ScJAMOC (Fig. 6b). The removal of VOCs containing one carbon atom presents the largest contribution to the reduction. The reduction in HOx leads to an additional reduction in the destruction of OH from HOx cross-reactions (HO2+OH and OH+OH). The OH budget presented in this study compares well with earlier EMAC studies by Lelieveld et al. (2016), which used the standard in-cloud EMAC mechanism (ScSta). The relative contributions of each OH source and sink in ScSta are comparable with their reported budgets. However, the authors report a lower tropospheric gross OH formation of 251.2 Tmol yr−1 while using the same tropopause definition. This difference is mainly related to the different years simulated (leading to different emissions) and a lower model resolution used (T42L31, approximately 2.8 by 2.8∘ in latitude and longitude with 31 vertical layers). Specifically, the lower number of tropospheric levels is expected to influence tropospheric budgets.
Lelieveld et al. (2016)Table 3Global tropospheric mean gas- and aqueous-phase source and sink fluxes of OH for Scm and the changes induced by ScSta and ScJAMOC. The characteristics of each simulation are provided in Table 1. All values are given in Tmol yr−1. The aqueous-phase budget is only based on cloud droplets. Rain droplets are not taken into account. For comparison, the tropospheric OH budget presented by Lelieveld et al. (2016) is shown in the last column. Please note that Lelieveld et al. (2016) simulated a different year and used EMAC at a lower model resolution.
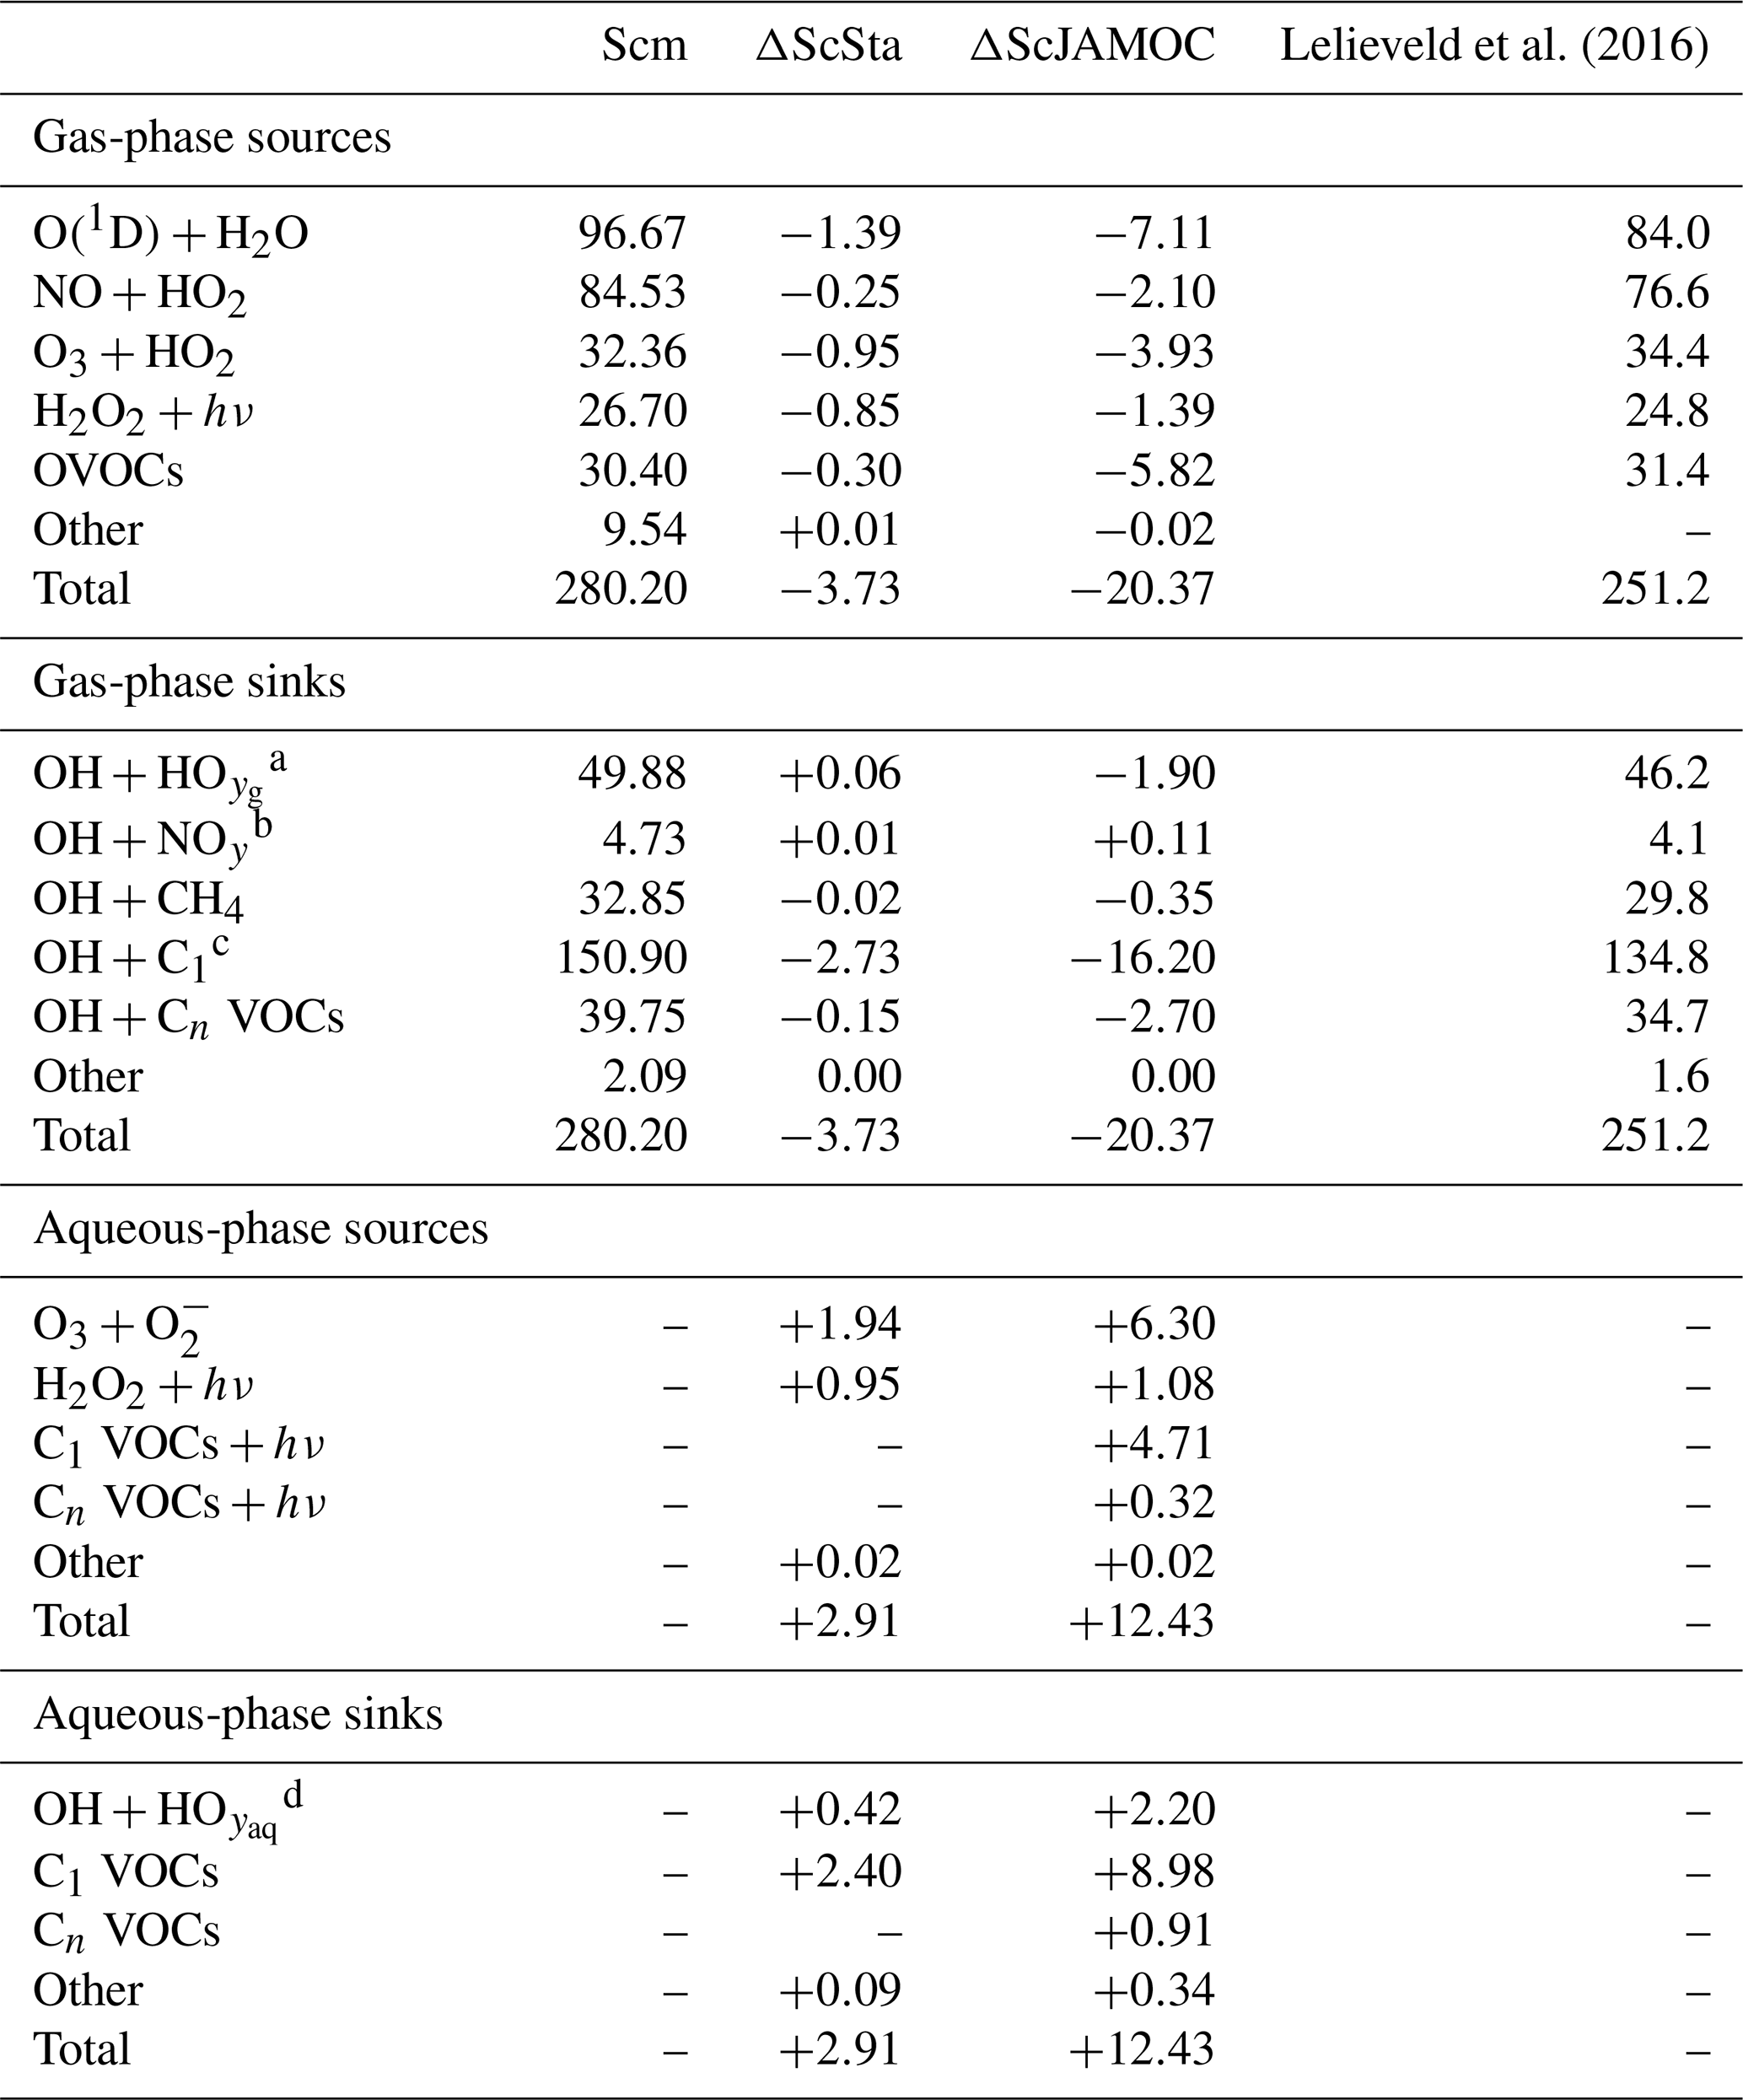
a , radical–radical reactions. b NOy≡NO, NO2, HNO2. HNO3, HNO4, NH3, N-reaction products. c C1≡CO, VOCs with one C atom. d , H2O2, radical–radical reactions.
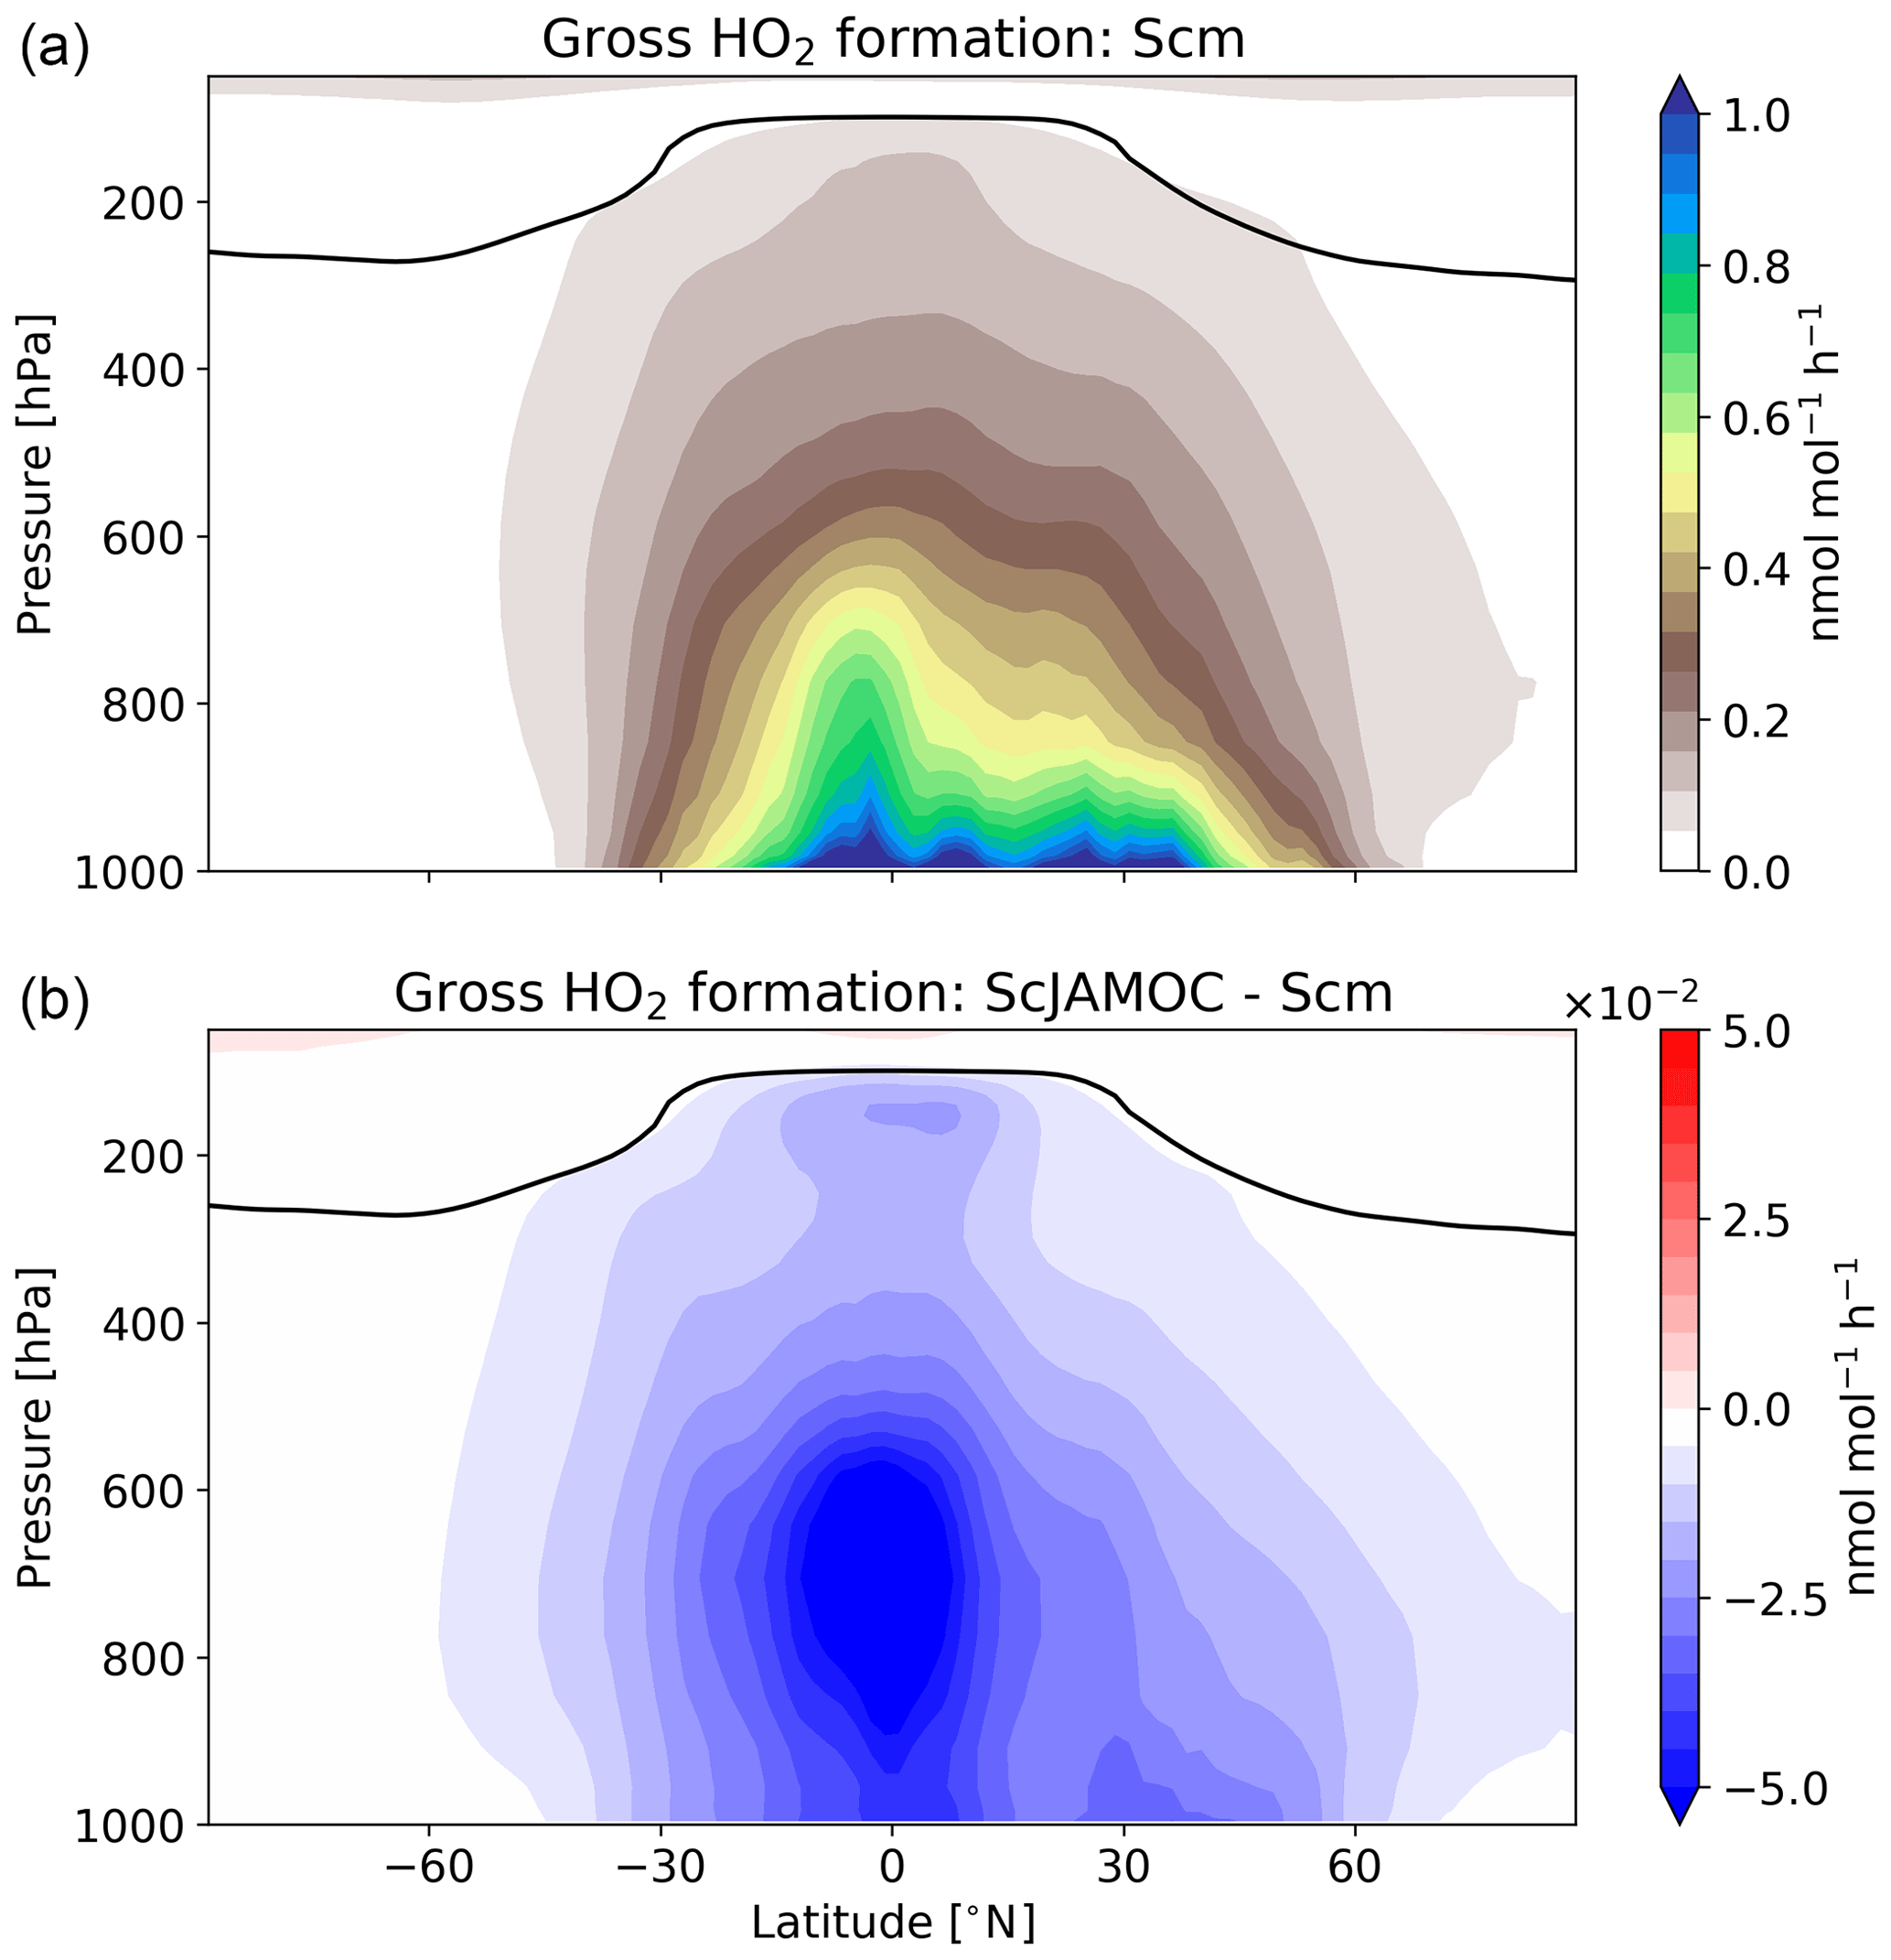
Figure 7Zonal-mean gross HO2 formation for Scm (a) and in comparison to ScJAMOC (b). The characteristics of each simulation are provided in Table 1. The yearly mean tropopause is depicted by a black line.
Figure 7 shows the zonal HO2 production for Scm and the changes predicted in ScJAMOC. Due to the fast interconversion within the HOx family, the spatial distribution and magnitude of the HO2 production are similar to the production of OH. Table 4 gives the gas-phase HO2 budget for each simulation. The HO2 production changes from about 315 to 290 Tmol yr−1 for Scm and ScJAMOC, respectively. Lower VOC concentrations lead to a reduction in the HO2 production. Here, the influence of VOCs containing one carbon atom is the highest (see Table 2). Thus, VOCs become less important as an HO2 sink. The highest reduction is caused by the reduced availability of HO2, significantly reducing radical–radical reactions as an HO2 sink.
Table 4Global tropospheric mean gas- and aqueous-phase source and sink fluxes of HO2 for Scm and the changes induced by ScSta and ScJAMOC. The characteristics of each simulation are provided in Table 1. All values are given in Tmol yr−1. The aqueous-phase budget is only based on cloud droplets. Rain droplets are not taken into account.
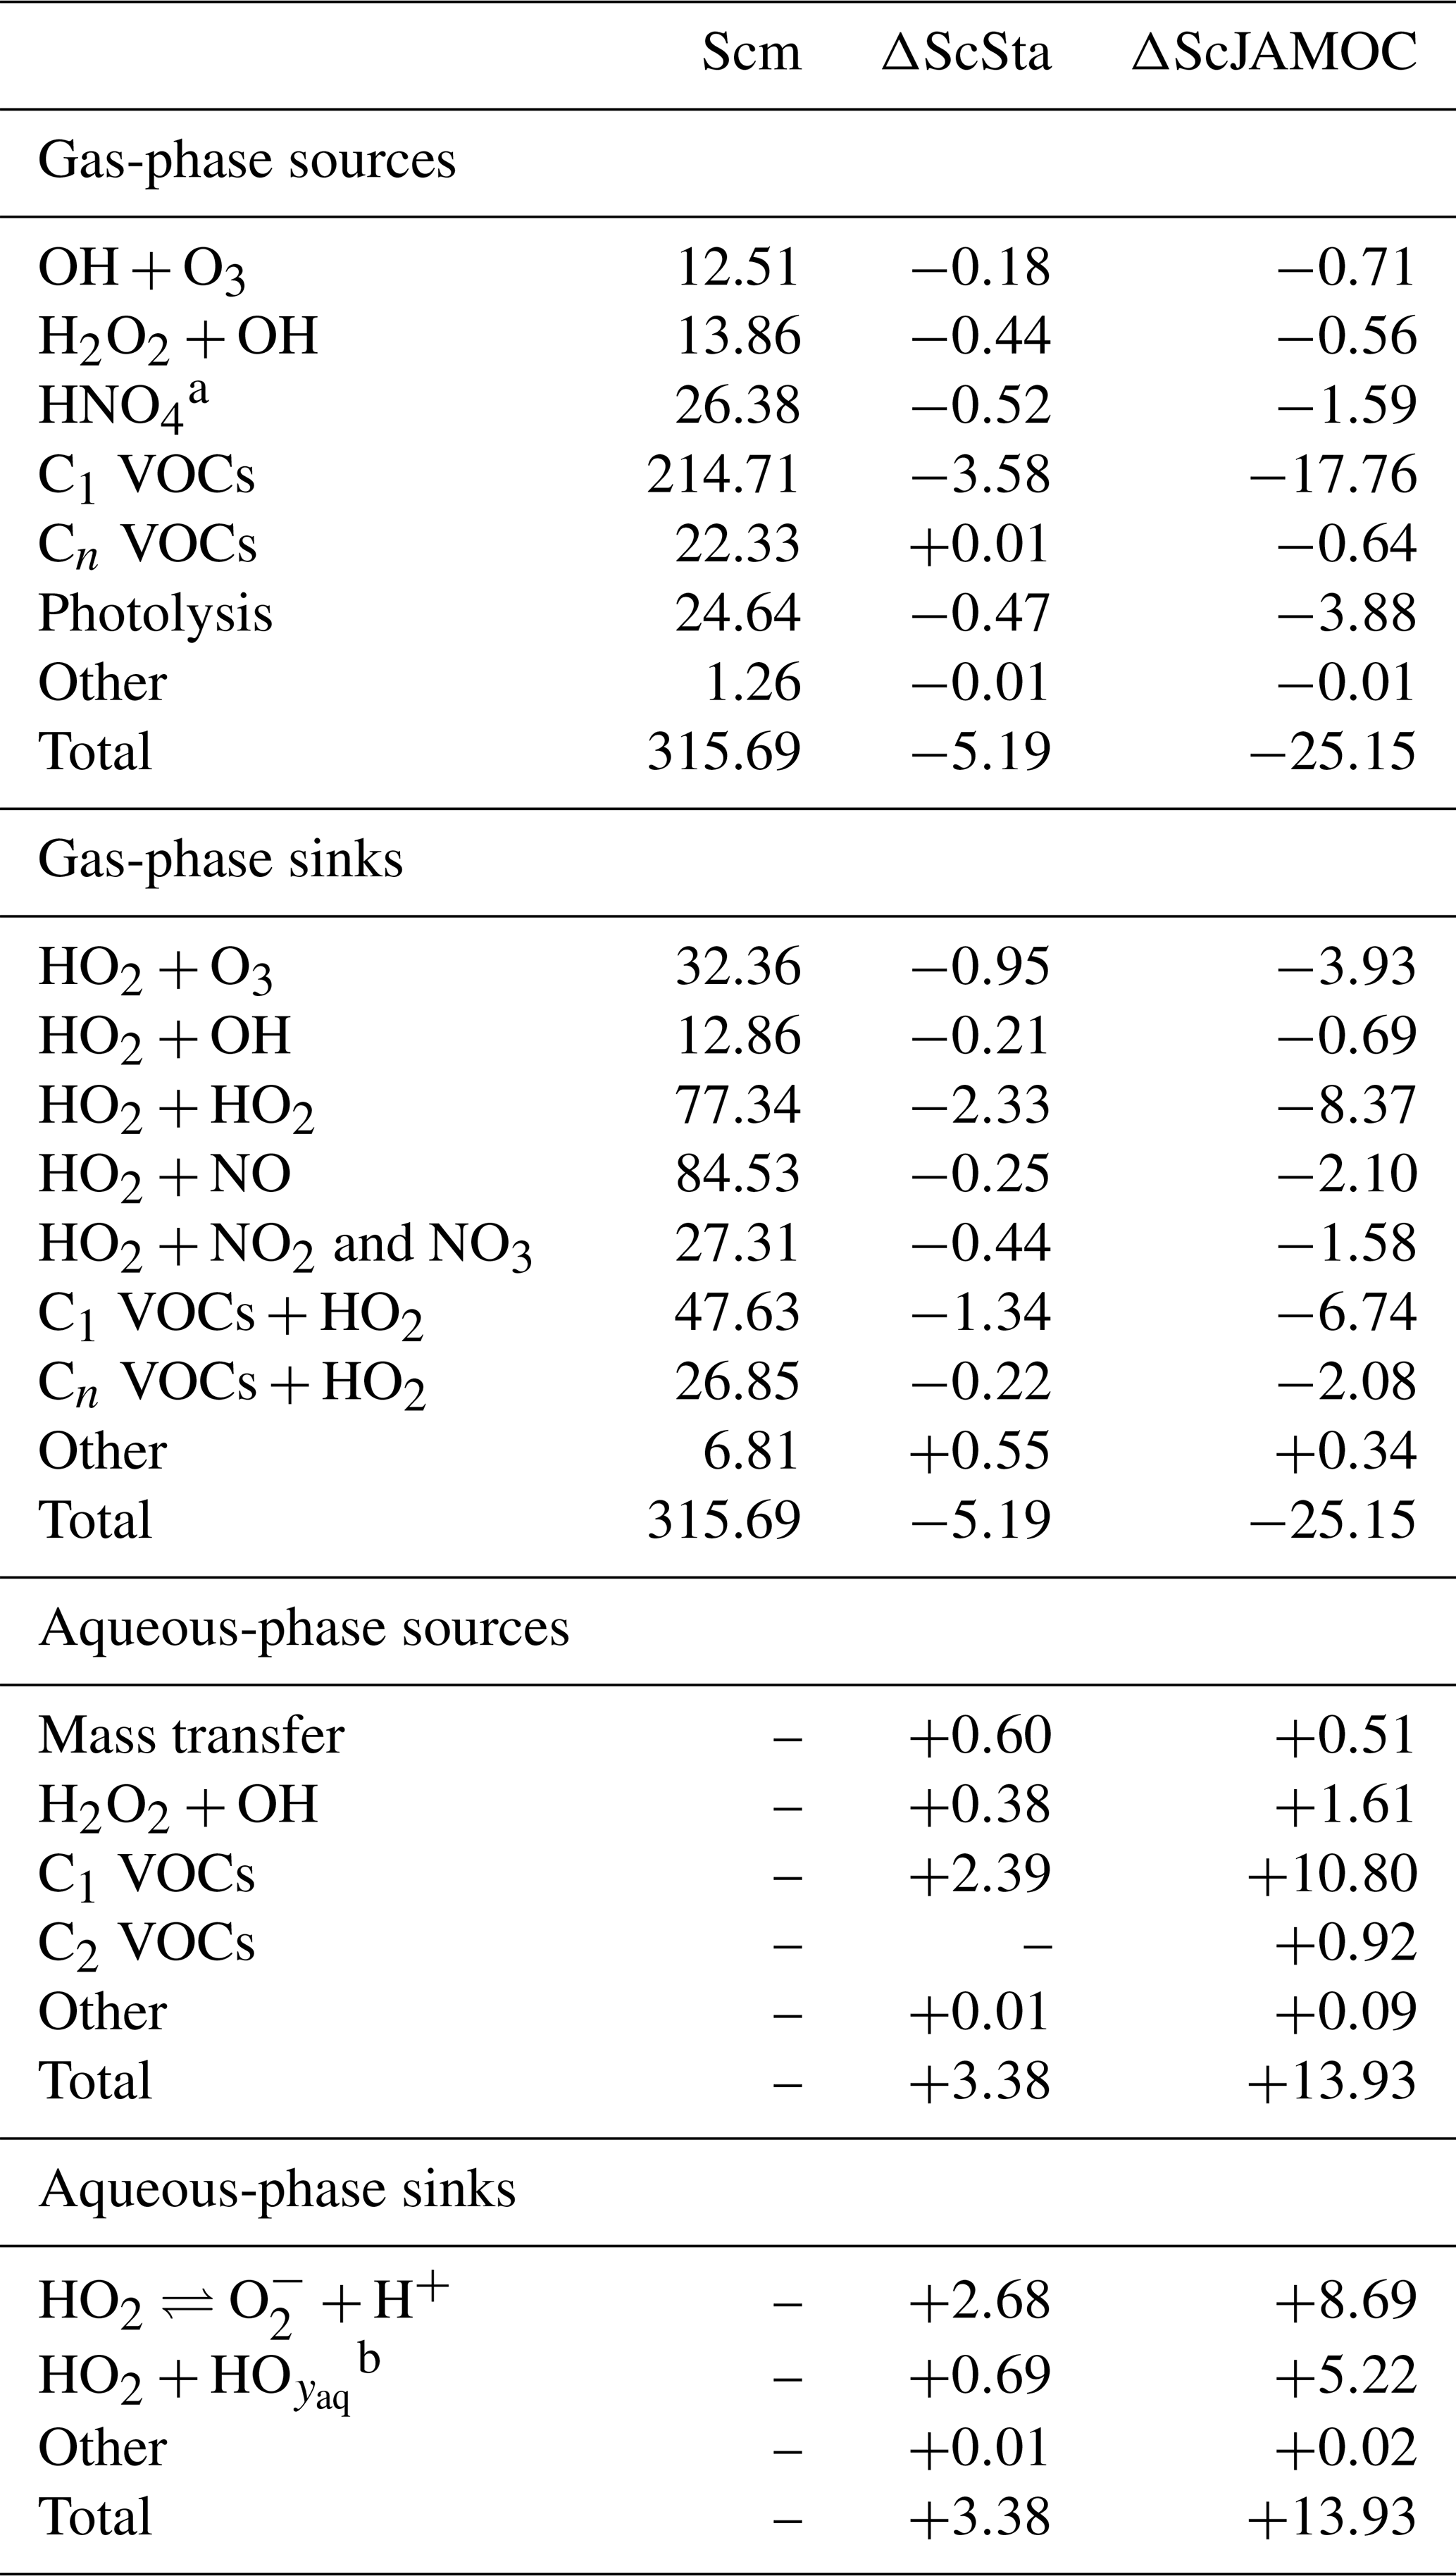
a . b , radical–radical reactions.
Tables 3 and 4 also provide the in-cloud budgets for OH(aq) and HO2(aq). The representation of the aqueous-phase chemistry of OH(aq) in clouds strongly affects the HO2(aq) production. The aqueous-phase budget of OH(aq) differs significantly between ScSta and ScJAMOC, which explicitly treat in-cloud HOx(aq) kinetics. ScJAMOC has the highest total OH(aq) production with more than 12 Tmol yr−1, which is about 4 times higher than in ScSta. The higher increase, compared to the box model (Sect. 3), is attributed to the specific box-model scenario (Sect. 2.2 and Rosanka et al., 2021, their Table 3). In both ScSta and ScJAMOC, most OH(aq) is formed by the destruction of O3(aq). In ScJAMOC, the photolysis of OVOCs leads to the second-highest formation of OH(aq). Here, OVOCs containing one carbon atom contribute the most, of which most OH(aq) is formed from methyl hydroperoxide. Due to higher radical concentrations, the reactions of OH(aq) with O3(aq) and radical–radical reactions in ScJAMOC contribute about 4 times as much to the loss of HOx(aq) compared to in ScSta. The oxidation of OVOCs is the major OH(aq) sink, with OVOCs containing one carbon atom contributing the most. This oxidation leads to the most significant production of HO2(aq), followed by OVOC photolysis. Due to increased aqueous-phase OH(aq) and H2O2(aq) concentrations, the oxidation of H2O2(aq) increases by a factor of 4 in ScJAMOC. The destruction of O3(aq) leads to a reduction in . This equilibrium is therefore the dominant HO2(aq) sink for both ScSta and ScJAMOC, since HO2(aq) is in equilibrium with (Reaction R2). To the best of our knowledge, no in-cloud HOx(aq) budget has been presented so far in the literature on a global scale. The novel in-cloud aqueous-phase budgets can thus not be compared to earlier studies.
4.3 Impact on tropospheric O3
The efficient oxidation of OVOCs by cloud droplets leads to elevated aqueous-phase HO2(aq) concentrations accelerating the in-cloud O3(aq) destruction. This has a significant impact on tropospheric O3 levels predicted by EMAC. Table 5 gives the Ox budget for the three simulations. The chemical production increases for ScSta compared to Scm. Slightly elevated NOx concentrations lead to an increased contribution of methylperoxy radicals and RO2 reactions with NO, compensating for the reduced production from HO2. For ScJAMOC, the chemical production decreases by about 150 Tg yr−1 (2.6 %), mainly caused by an overall reduction in HO2 (see Sect. 4.2) and in RO2 radicals due to the uptake and explicit oxidation of VOCs. The chemical loss on the other hand is reduced by about 90 (1.7 %) and about 420 Tg yr−1 (8.0 %) for ScSta and ScJAMOC, respectively. This reduction is mainly attributed to an overall reduction in tropospheric levels of O3 and HOx. The loss by dry deposition reduces by about 50 Tg yr−1 (5.6 %) for ScJAMOC, due to generally reduced surface O3 concentrations. The largest change in the Ox budget is related to scavenging processes. Ox scavenging increases from about 150 (Scm) to about 260 (73.3 %) and 480 Tg yr−1 (220.0 %) for ScSta and ScJAMOC, respectively. Here, the biggest increase occurs for O3 scavenging, due to the accelerated O3(aq) destruction by enhanced HO2(aq) (Reaction R1), which in turn enhances the O3 uptake. These changes in the Ox budget terms lead to a reduced O3 burden. Compared to the literature, the O3 burden from ScJAMOC is closer to the observational estimate from satellite retrievals for the same time period of 287–311 Tg in the 60∘ S–60∘ N latitudinal band and closer to the global tropospheric burden of 324 Tg derived from the IASI-FORLI observations (Gaudel et al., 2018, their Table 5). However, it is important to take into account that different tropopause definitions are used in the extratropics. In Gaudel et al. (2018), the tropopause definition for IASI-FORLI is the WMO tropopause altitude definition, based on the temperature lapse rate (WMO, 1957). In this study, potential vorticity is used as the tropopause definition in the extratropics (see Sect. 2.3). All three Ox budgets (Table 5) compare well with a recent multi-model comparison of Young et al. (2018, see their Fig. 3). The chemical loss and chemical production get closer to the multi-model mean of 4442 and 4937 Tg yr−1, respectively. The tropospheric O3 burden in ScJAMOC is now lower than the multi-model mean of 337 Tg but closer to the observational estimate from Ziemke et al. (2011). The increased stratospheric–tropospheric exchange (STE) is still lower than the multi-model mean (535 Tg yr−1) and the observational estimate of 489 Tg yr−1 by Olsen et al. (2013). The tropospheric O3 lifetime is reduced by 1 d, due to higher relative changes in the Ox loss than in the tropospheric O3 burden.
Table 5Detailed tropospheric Ox budget for Scm and the changes induced by ScSta and ScJAMOC. The characteristics of each simulation are provided in Table 1. The gross terms as well as the relative contributions of the major contributors are given. For comparison, the range of Ox budgets in other models and the multi-model mean values from the Tropospheric Ozone Assessment Report (TOAR) are also shown. Please note that the models in the multi-model comparison and from TOAR differ in their resolution, tropopause definition, Ox definition, and chemical mechanism used.
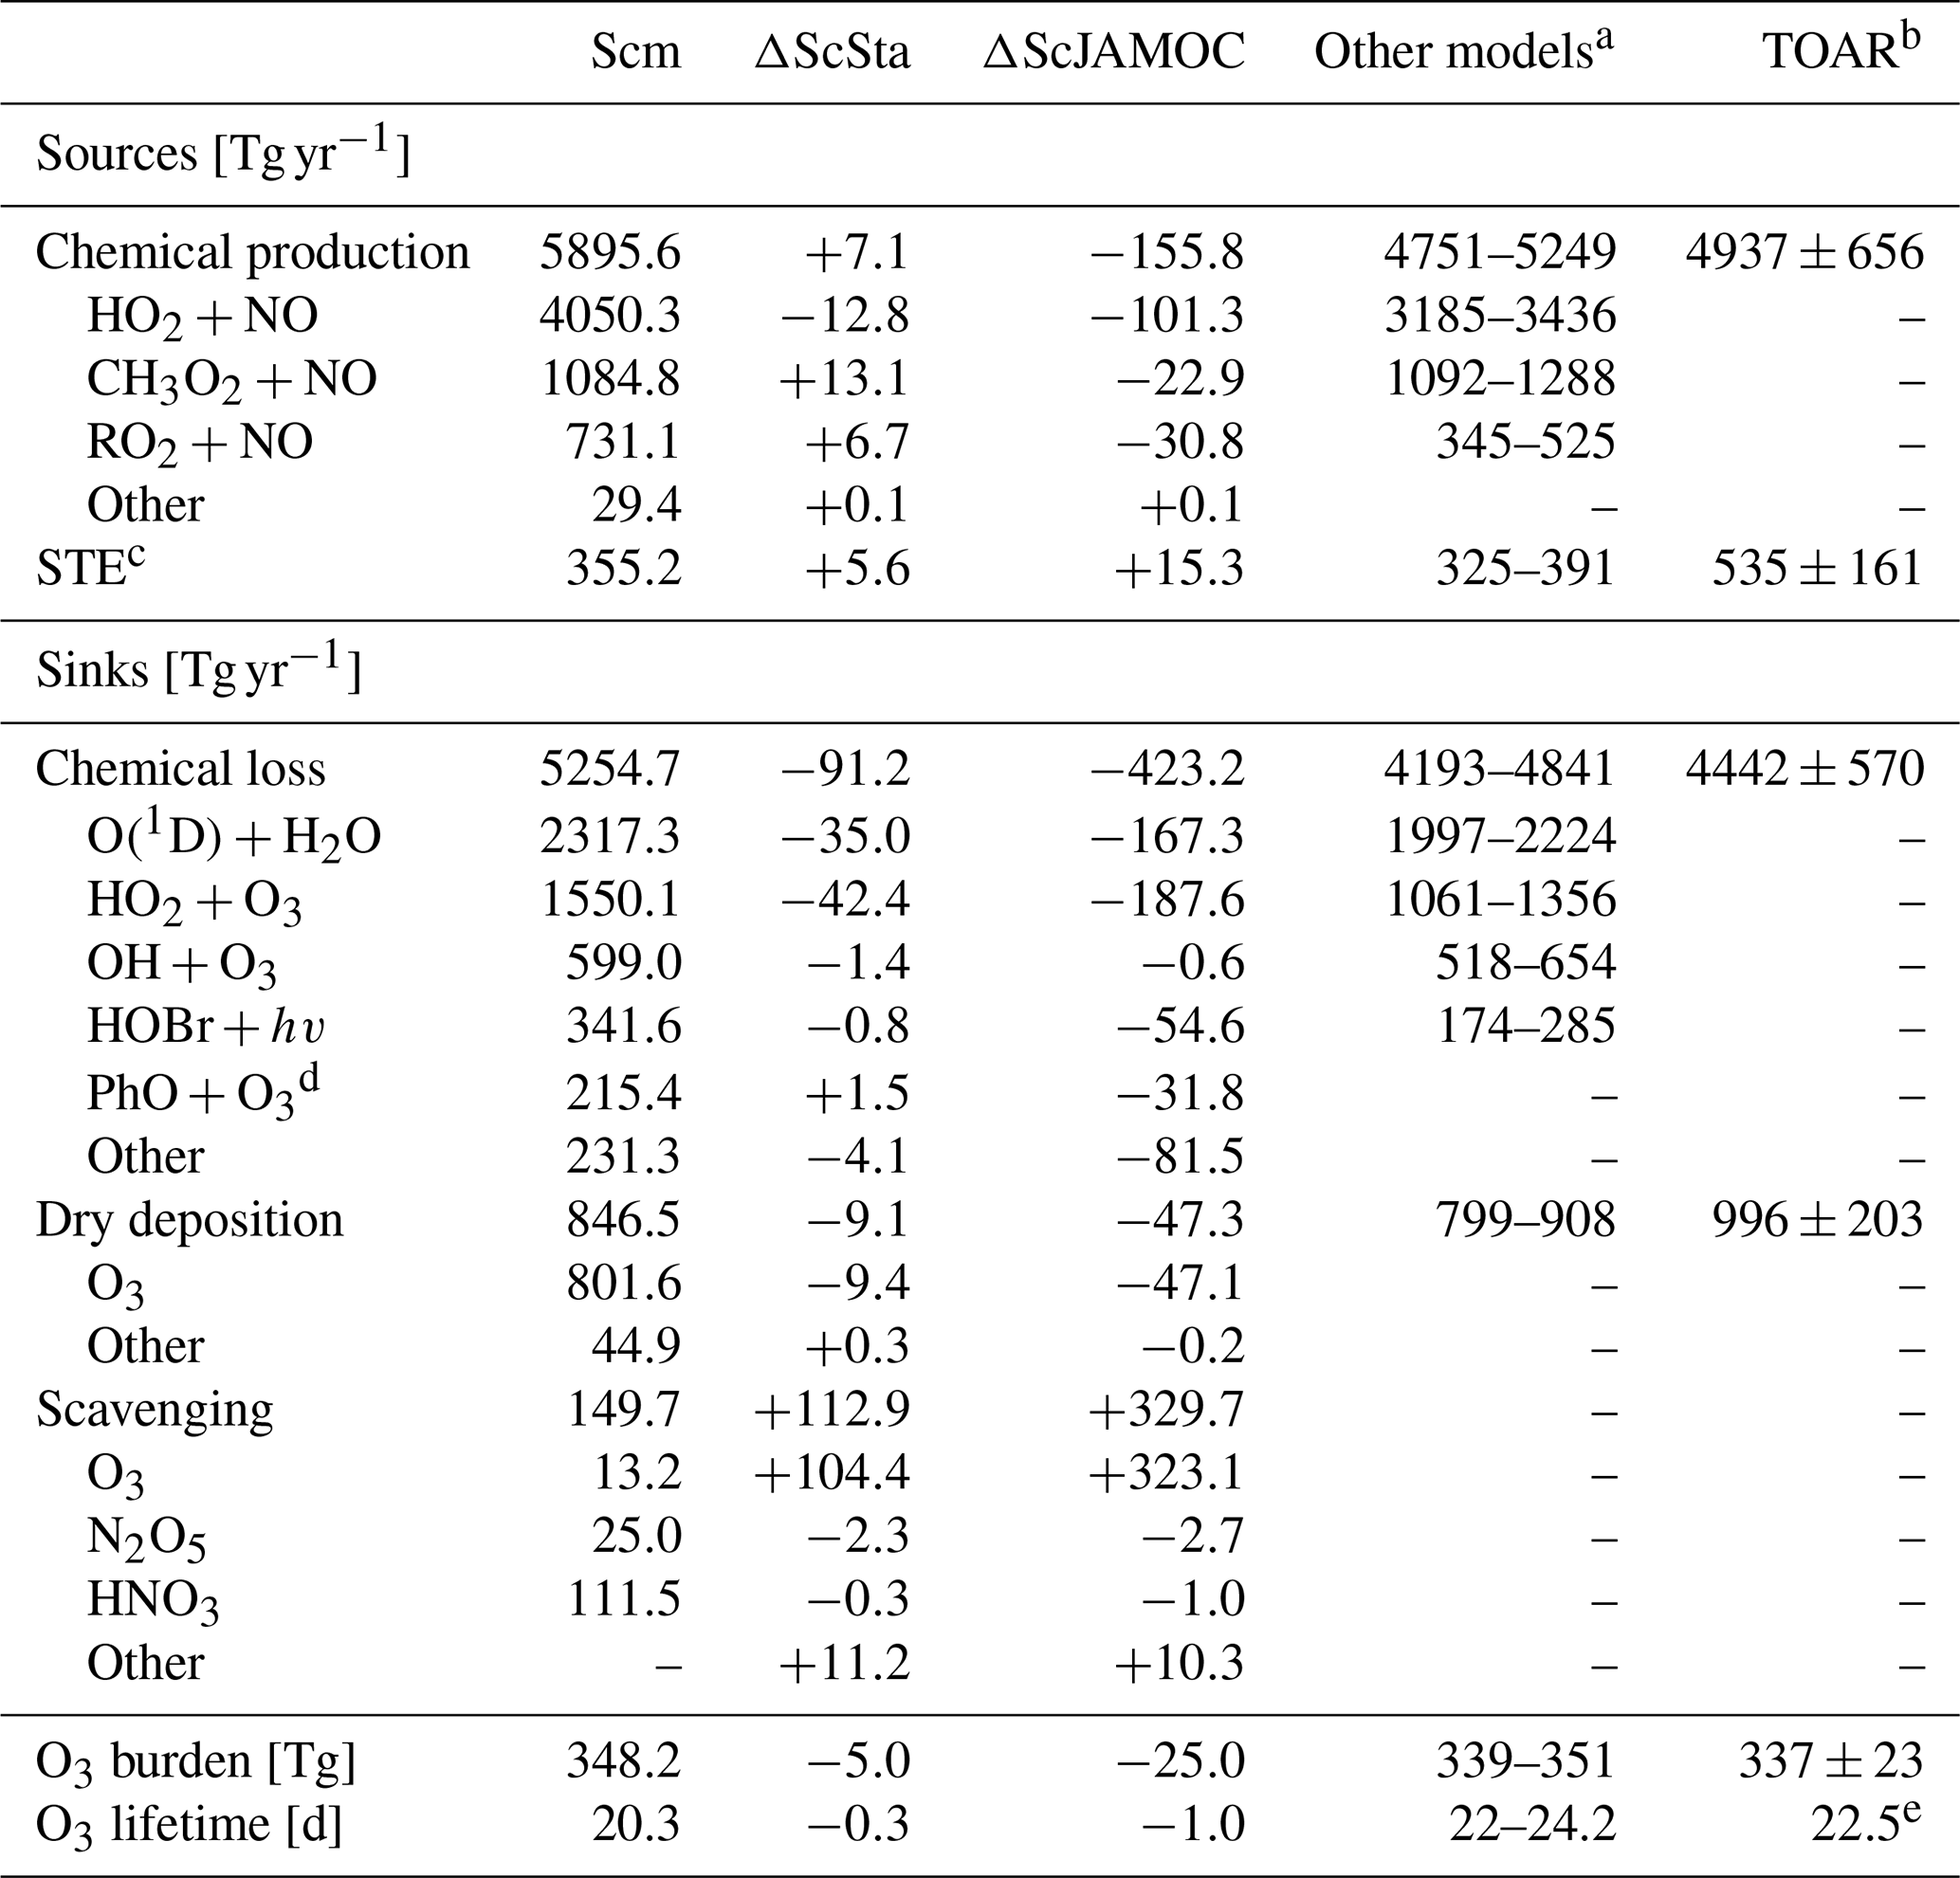
a Based on Sherwen et al. (2016), Hu et al. (2017), and Griffiths et al. (2020). b Values obtained from Young et al. (2018) and Gaudel et al. (2018). c Stratospheric–tropospheric exchange. d O3 loss due to reaction with phenoxy radicals from oxidation of aromatics (Taraborrelli et al., 2021). e Calculated based on mean burden and the mean total production.
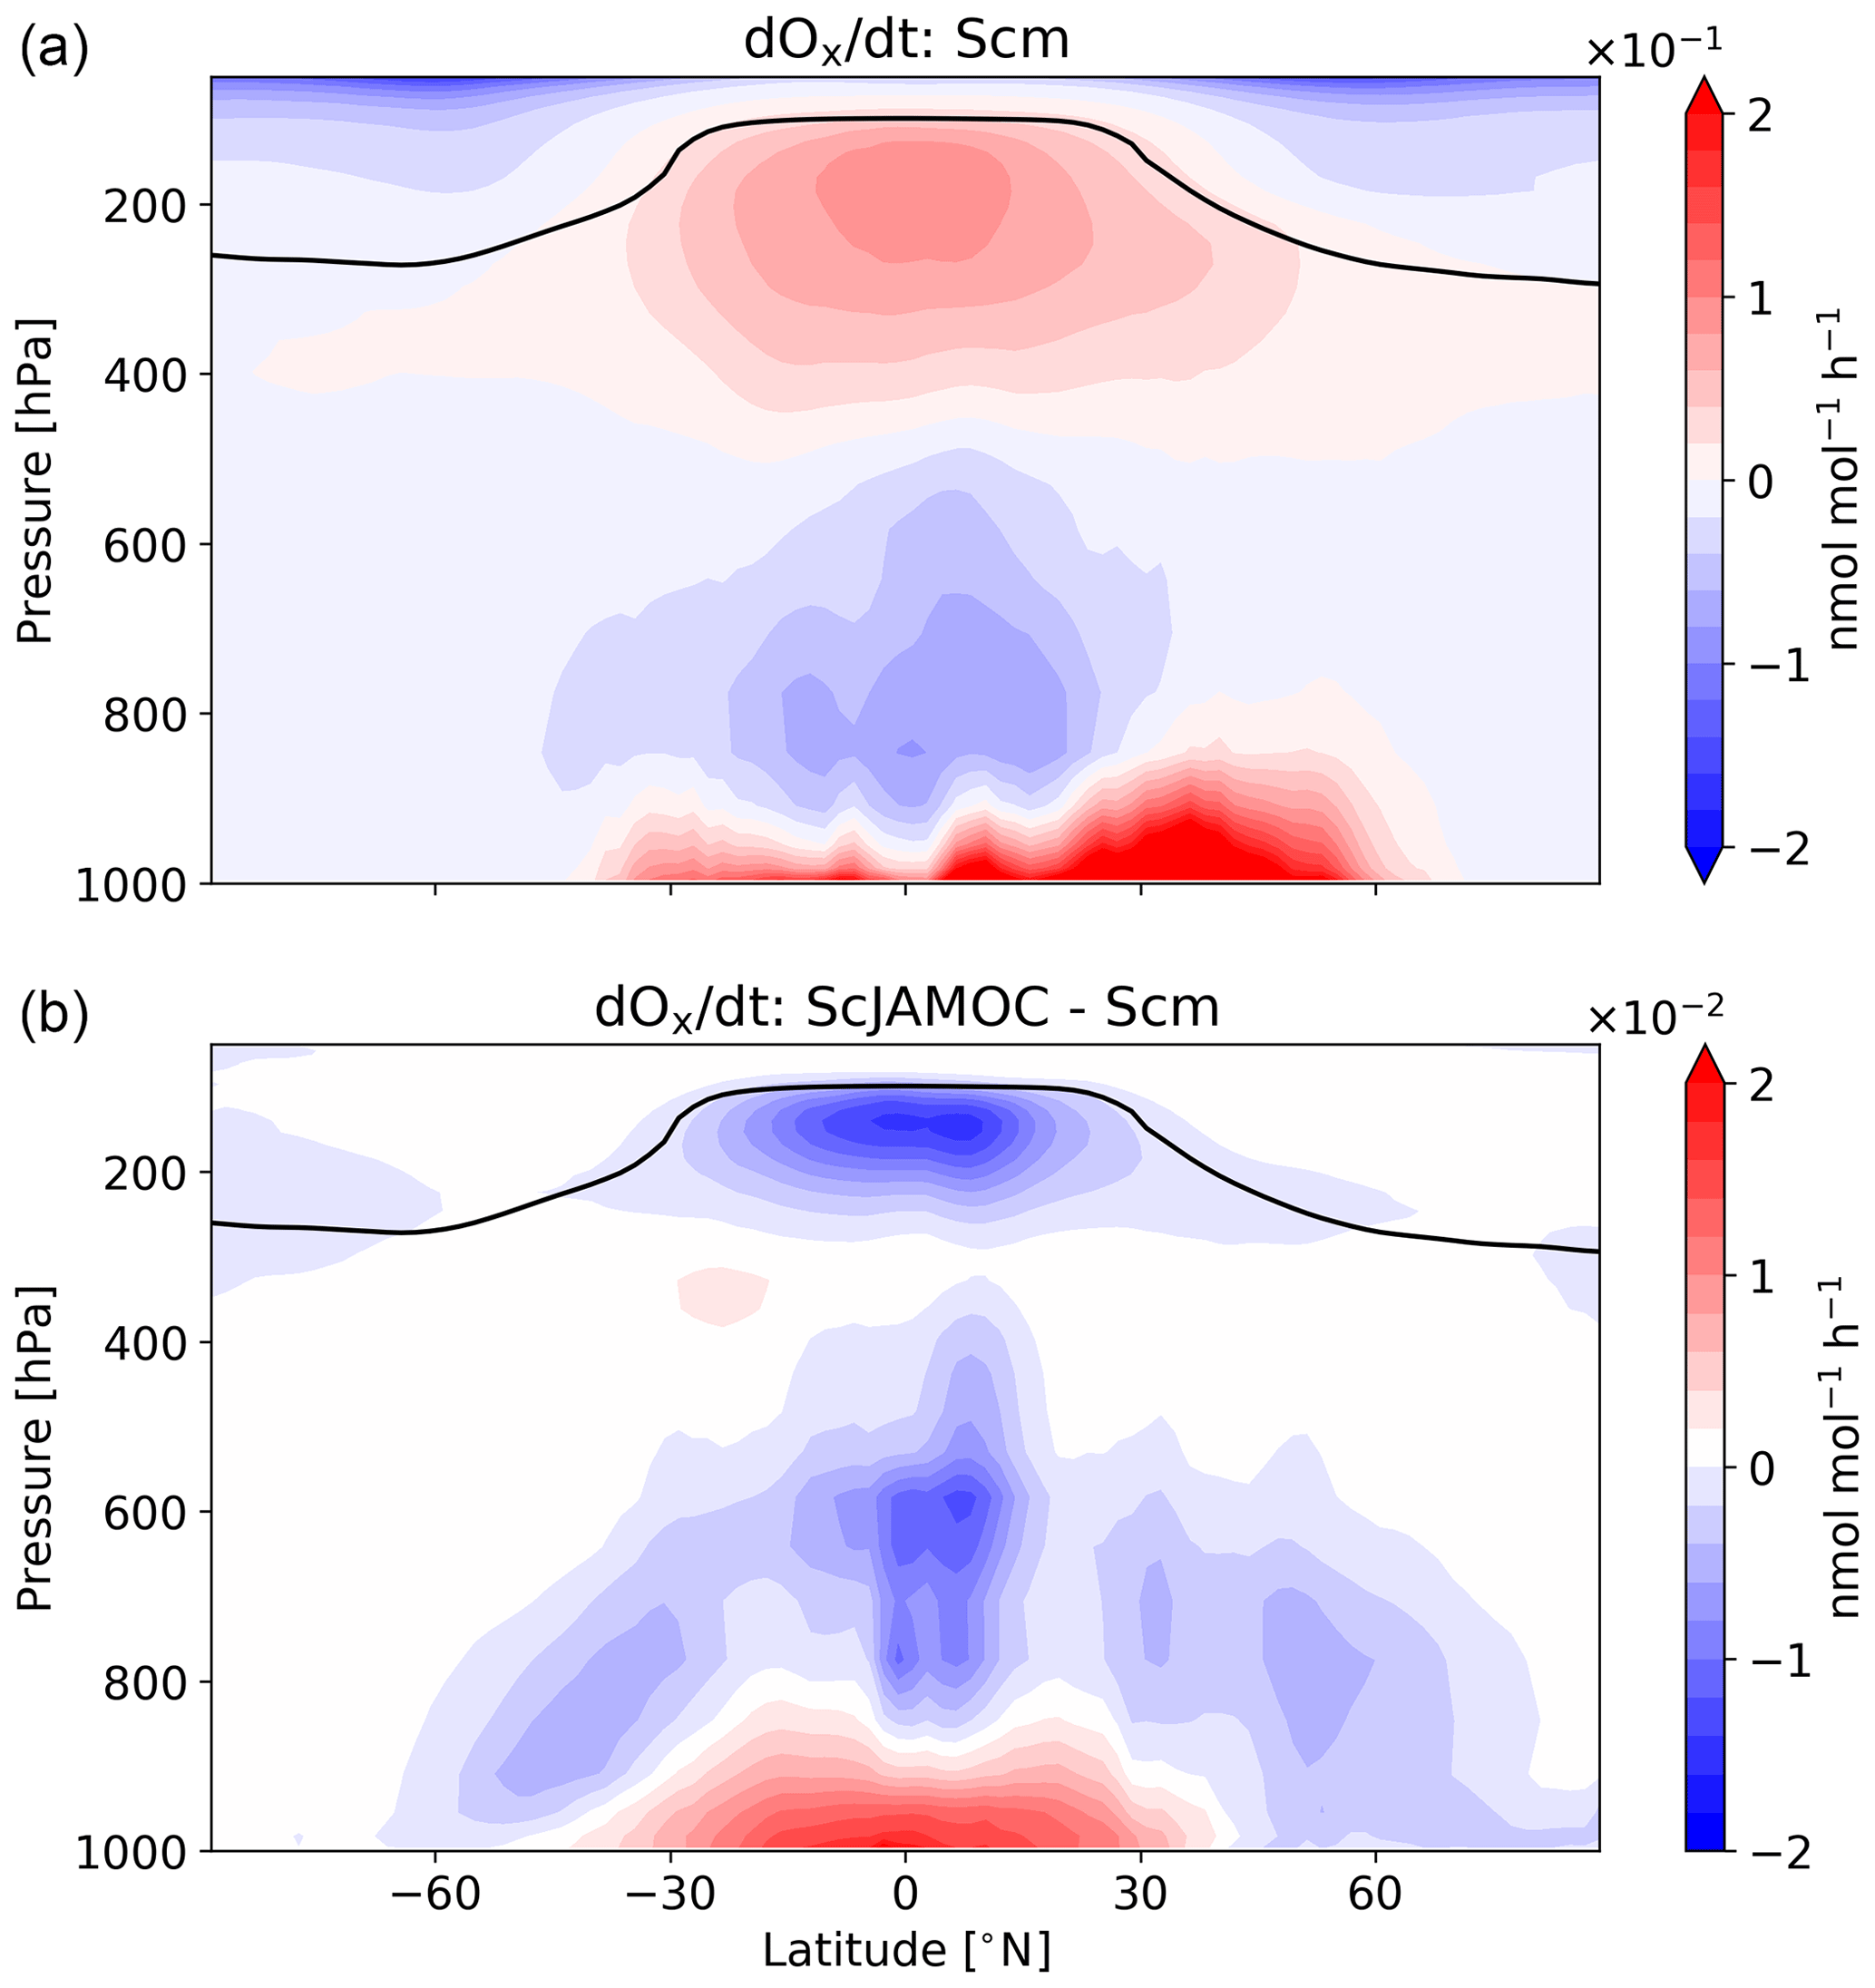
Figure 8Mean zonal net Ox change for Scm (a) and in comparison to ScJAMOC (b). The characteristics of each simulation are provided in Table 1. The yearly mean tropopause is depicted by a black line. Deposition in the lowest model layer is not taken into account.
Figure 8 gives the zonal net Ox production for Scm and the changes in ScJAMOC. In general, Ox is produced where NOx concentrations are high (close to the surface and in the upper troposphere). In the free troposphere, above the planetary boundary layer (PBL), the increased destruction of O3 over the ocean leads to an overall net Ox loss in the zonal mean. The changes in the chemical production and in the loss of Ox and the increase in scavenging lead to changes in the net Ox production in ScJAMOC. At the surface, the net Ox production increases. Here, the efficient uptake of O3 sink precursors overcompensates for the reduction in the chemical production and leads to a reduced chemical loss. This increase mainly occurs over continental regions. In the free troposphere above the PBL, the net Ox change is reduced, leading to increased Ox destruction. This is directly caused by the efficient uptake of HO2, VOCs, and O3 precursors in this cloud-dominated region in ScJAMOC. In the tropical UTLS, VOCs are an important HO2 source. The efficient removal of VOCs in the lower troposphere reduces the total VOC mass transported into this region (see Fig. 3). The chemical production of Ox is therefore reduced in the tropical UTLS, due to limited availability of HO2.
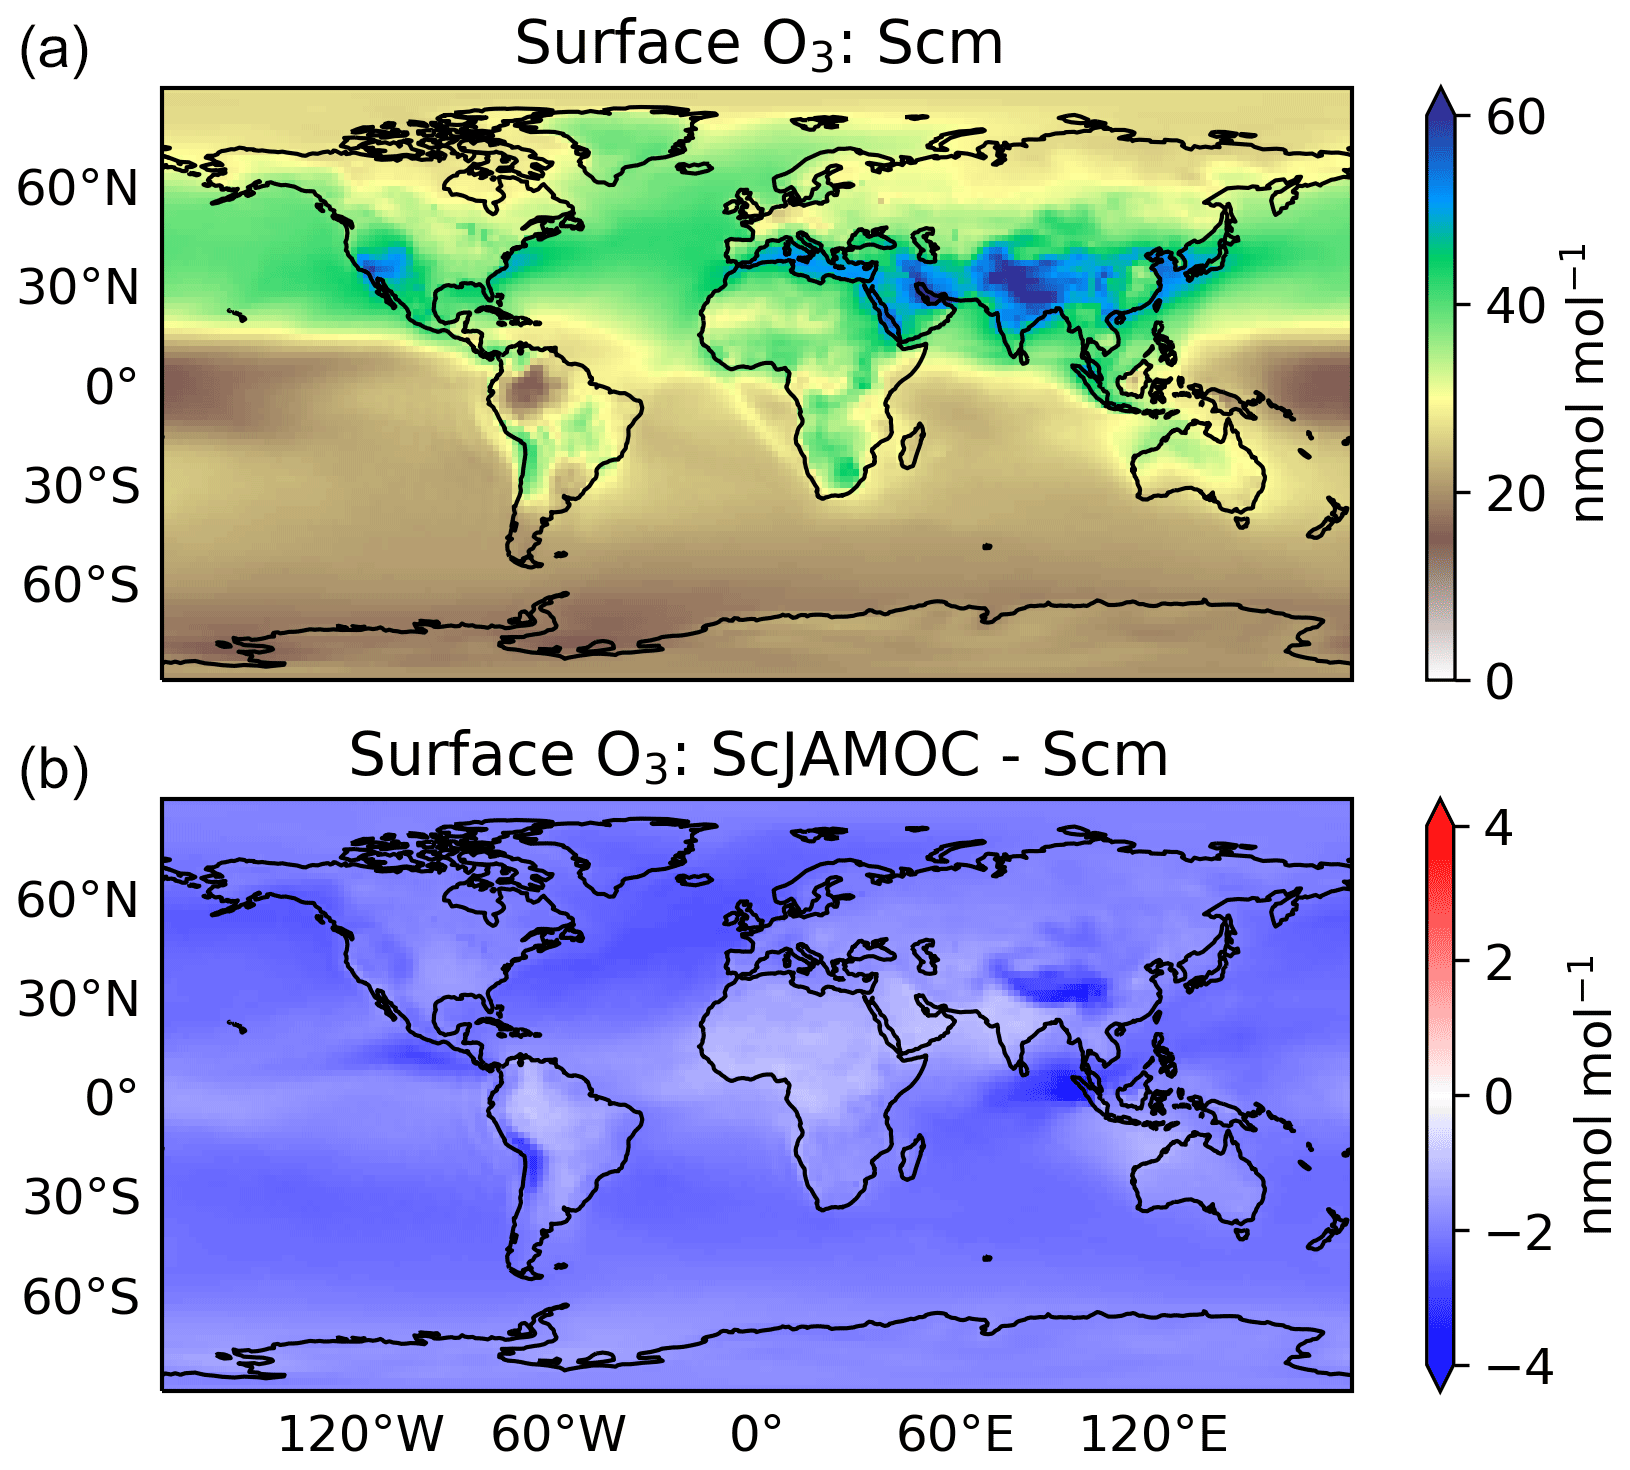
Figure 9Mean surface O3 mixing ratios for Scm (a) and in comparison to ScJAMOC (b). The characteristics of each simulation are provided in Table 1.
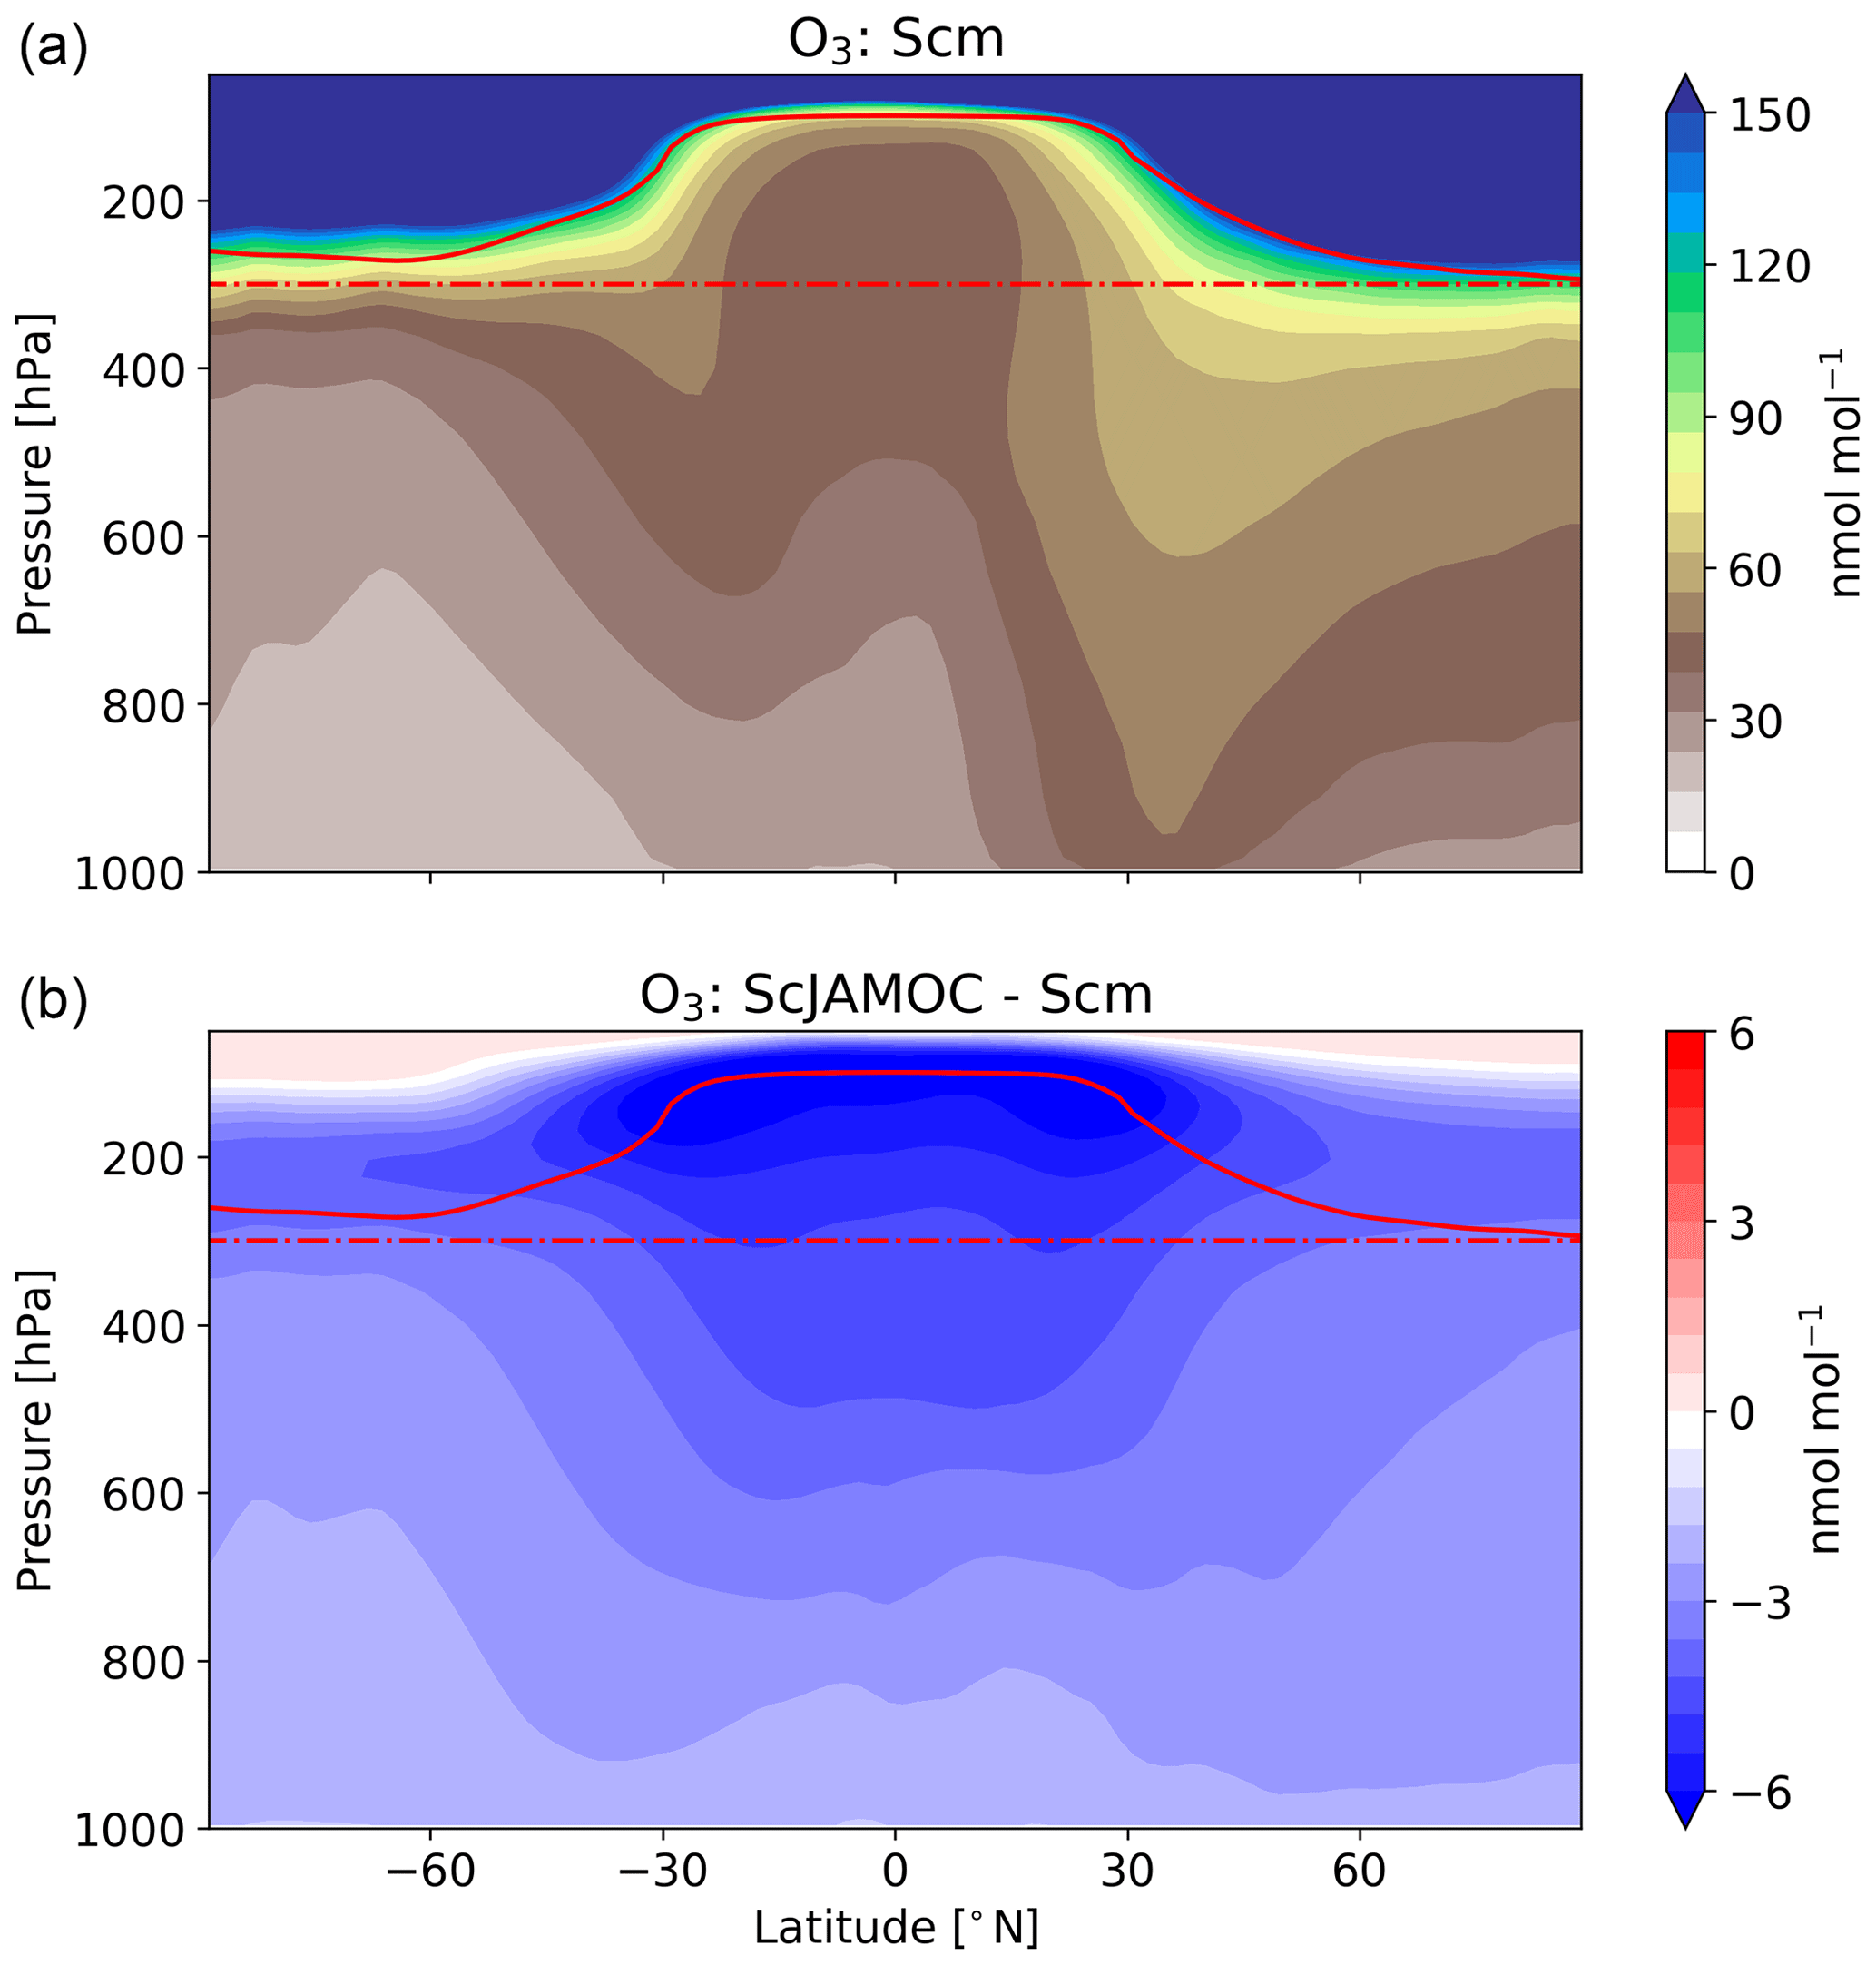
Figure 10Mean zonal O3 mixing ratios for Scm (a) and in comparison to ScJAMOC (b). The characteristics of each simulation are provided in Table 1. The yearly mean tropopause is depicted by a solid red line. In addition, the 300 hPa tropopause layer used for the O3 IASI-FORLI comparison (see Fig. 11) is depicted by a dash-dotted red line.
Figures 9 and 10 give the yearly mean surface mixing ratio and the zonal mean O3 mixing ratios for Scm and the changes in ScJAMOC. In general, O3 concentrations are higher in the NH with the highest values found over continental areas. Overall, surface O3 slightly decreases for ScJAMOC with the maximum mean reduction of about 4 nmol mol−1. The decrease in surface O3 is very low where the net Ox production increases. The highest reduction in O3 is predicted in the UTLS, where tropospheric O3 concentrations are the highest. Here, O3 is reduced by more than 12 % for ScJAMOC. Even though the total lower tropospheric change is similar in both hemispheres, the relative reduction is higher in the SH (NH, about 4 %; SH, about 10 %).
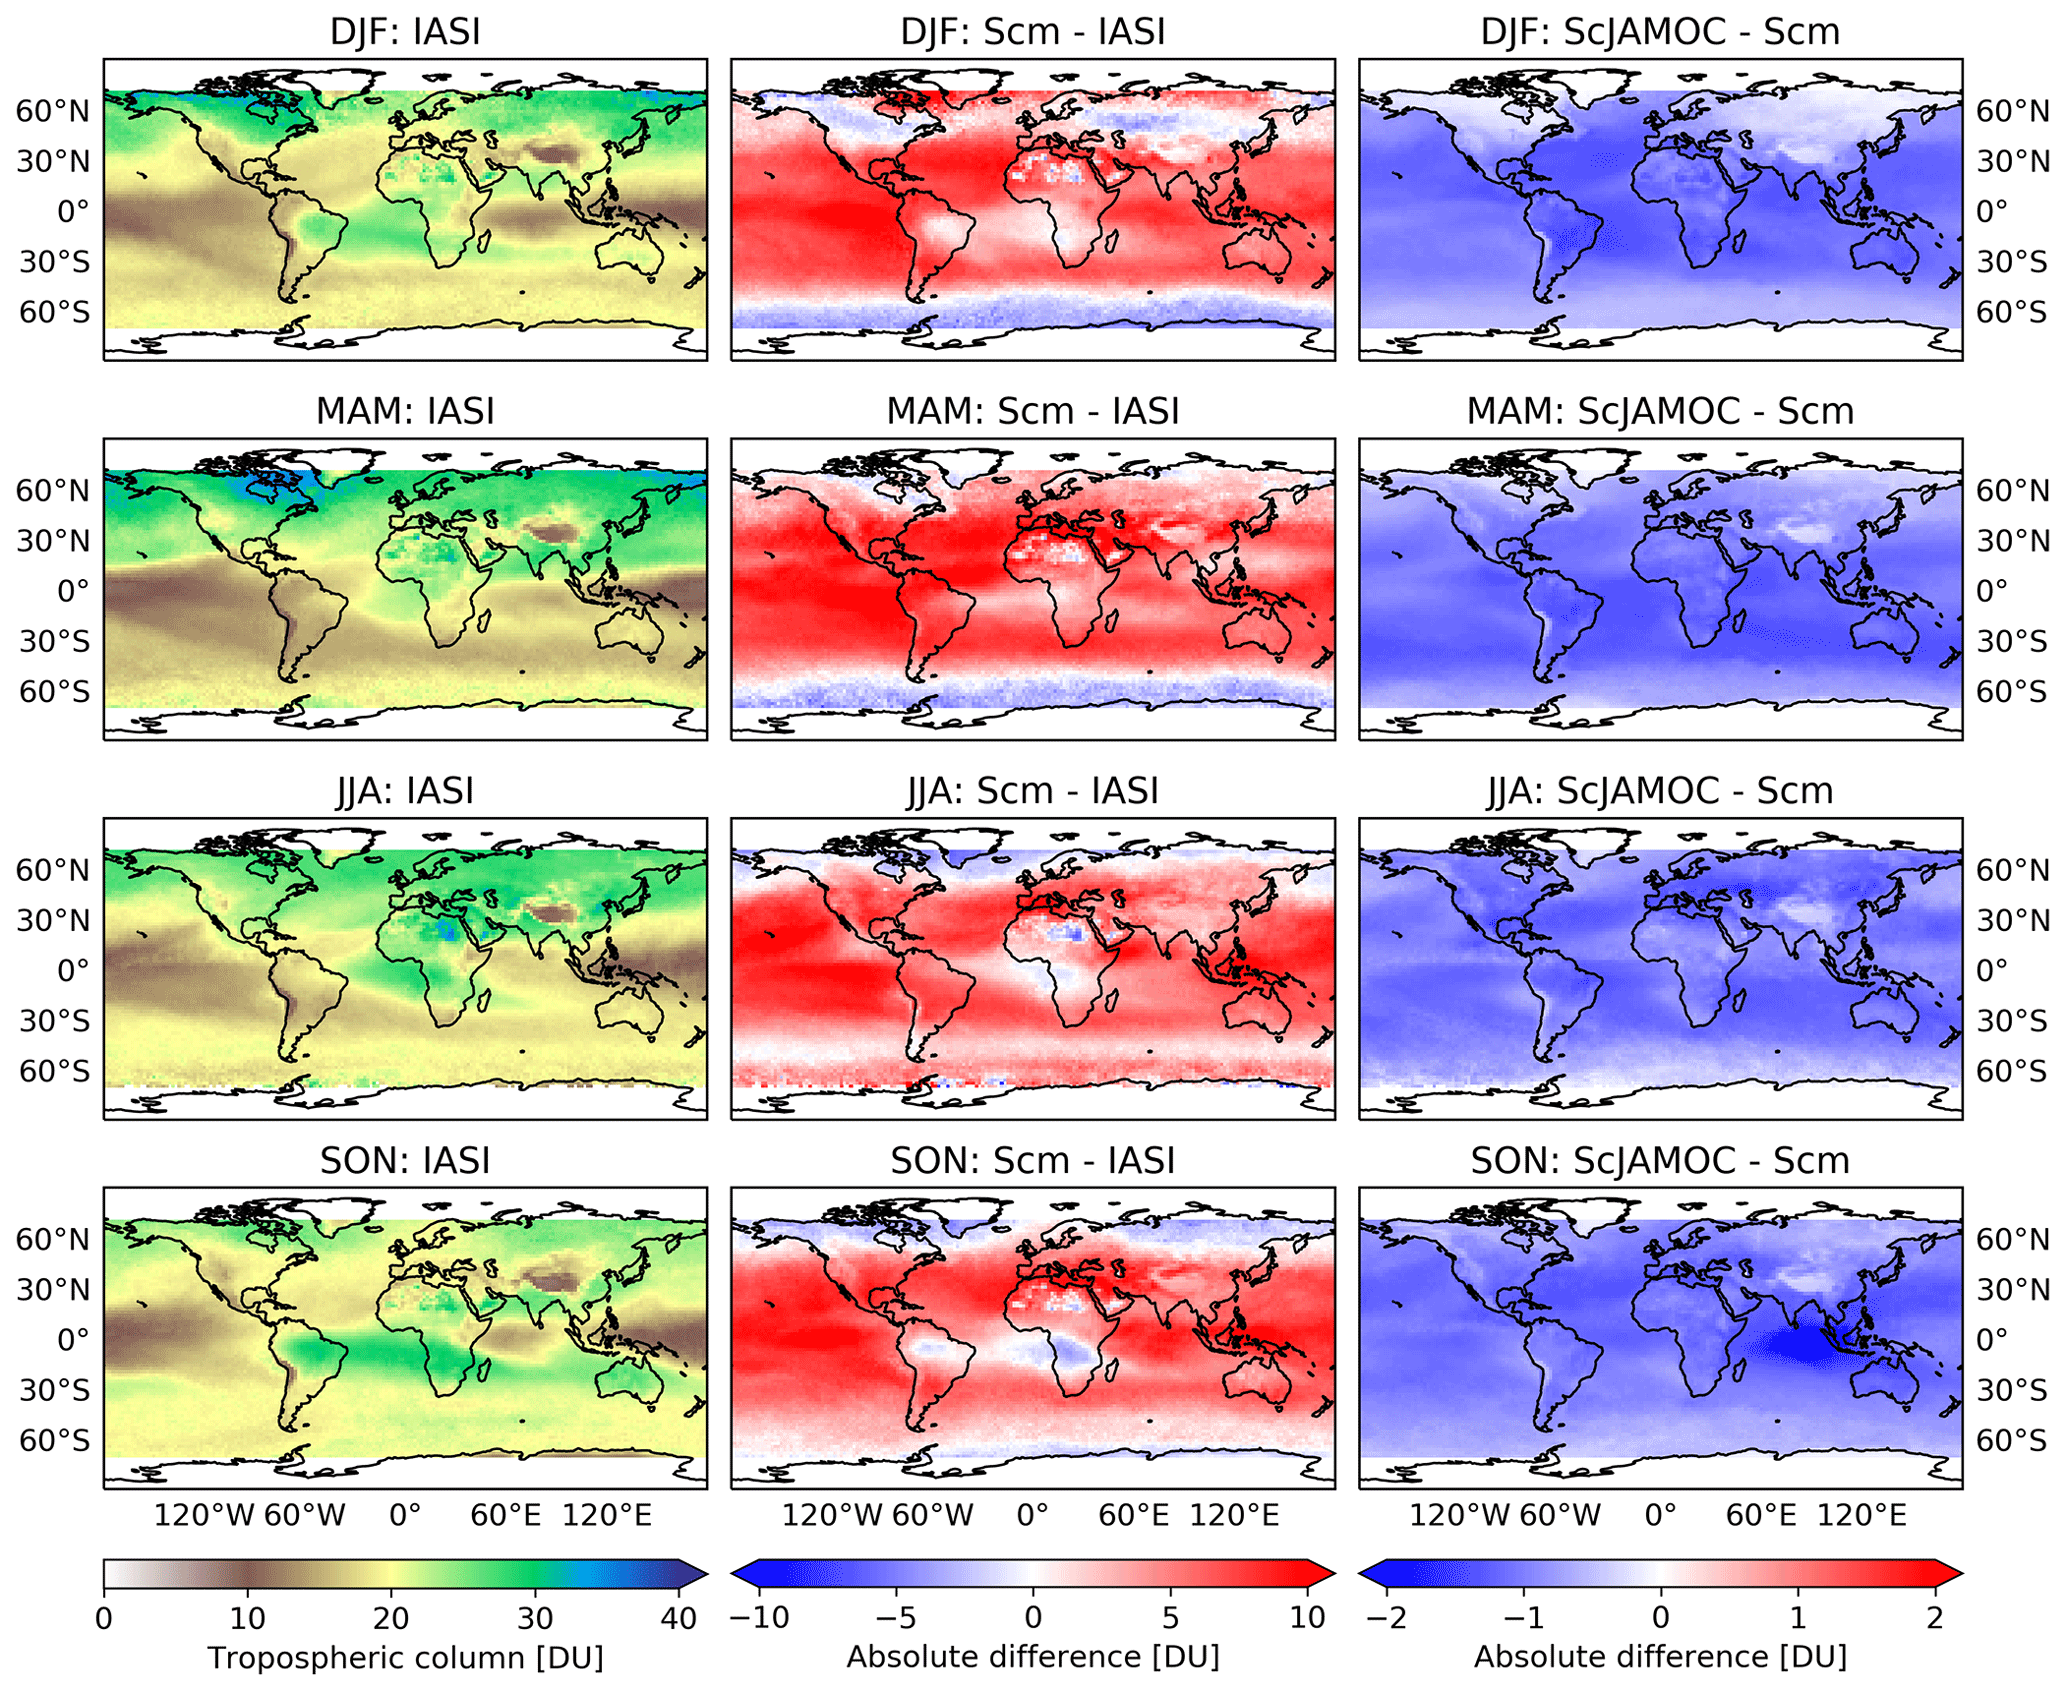
Figure 11Seasonal (December–February, DJF; March–May, MAM; June–August, JJA; September–November, SON) tropospheric O3 column comparison between IASI-FORLI satellite observations and EMAC: IASI-FORLI satellite observations (left), Scm simulation in comparison to IASI-FORLI observations (centre), and ScJAMOC in comparison to Scm (right). The characteristics of each simulation are provided in Table 1. For this comparison, the tropopause is defined at 300 hPa.
Figure 11 shows the seasonal, tropospheric integrated O3 columns from IASI-FORLI O3 retrievals. In addition, the differences in Scm with respect to IASI-FORLI and in ScJAMOC with respect to Scm are shown. As explained previously, the comparison is performed here by using the tropospheric O3 column integrated between the Earth surface and 300 hPa (see Sect. 2.3). To meaningfully compare the model profile to the IASI observation, the non-uniform sensitivity of the IASI-FORLI retrievals to the O3 vertical distribution was accounted for by applying the averaging kernels. They provide the model vertical distribution of O3 as would be seen by IASI. For this purpose, the model profiles sampled at the place and time of the IASI overpasses (see Sect. 2.3) were first vertically interpolated to the IASI pressure levels. Then the smoothing of the model profiles to the lower vertical resolution of IASI was performed following Rodgers (2000). In order to take the specific scene of each IASI observation into account, the averaging kernels of the different observations contained in the model grid cell have all been considered to smooth the gridded model profile, similarly to previous model–FORLI-O3 comparison studies (Wespes et al., 2012; Supplement in Wespes et al., 2016). The smoothed model profiles are finally averaged to derive the smoothed gridded model profile. In Scm, EMAC generally overestimates tropospheric O3 in the tropics and at mid-latitudes regionally by more than 10 DU. This general overestimation is lower but consistent with an earlier EMAC study by Jöckel et al. (2016). They report an overestimation of up to 15 DU (see their Fig. 29), based on a comparison of a nudged simulation with OMI O3 retrievals using EMAC's standard aqueous-phase mechanism (here ScSta). These differences can be attributed to a much simplified gas-phase chemical mechanism, a lower spatial resolution (inducing artificial dilution of NOx point sources; Fiore et al., 2003), and different emission datasets. At higher latitudes, especially during the NH winter (December–February, DJF) and spring (March–May, MAM), EMAC slightly underestimates tropospheric O3. In ScJAMOC, the overall modelled O3 bias compared to IASI-FORLI is reduced by 1–2 DU, improving the representation of O3 in EMAC. Here, due to the long lifetime of O3, the reduction in tropospheric O3 is not limited to the typical cloud-dominated and precipitation regions. This demonstrates the importance of a proper representation of in-cloud O3(aq) and OVOC oxidation chemistry in global models. By not taking these processes into account, as is the case in most global models (Ervens, 2015), tropospheric O3 is overestimated. It is expected that the bias reduction is even more pronounced for the complete troposphere (when using the standard EMAC definition, see Sect. 2.3), since the highest relative reduction in O3 is predicted in the UTLS above 300 hPa (Fig. 10). Similarly to methanol, Scm strongly overestimates the tropospheric O3 column west of Indonesia over the Indian Ocean in the NH autumn. This overestimation is also linked to the strong Indonesian peatland fires (Parker et al., 2016). Due to the ongoing Asian monsoon, the emitted VOCs are quickly transported to higher altitudes, where they act as O3 precursors. The efficient upward transport of the biomass burning tracers isocyanic acid (HNCO) and hydrogen cyanide (HCN) during the summer monsoon phase has already been investigated in earlier EMAC simulations by Rosanka et al. (2020a). In the same region, surface O3 is also substantially reduced in ScJAMOC (Fig. 9). These results indicate that soluble OVOCs are efficiently removed by clouds. As a consequence, the reactive uptake of O3 is enhanced and O3 production dampens. This leads to a reduction in the modelled bias for this region and period when using JAMOC.
In our companion paper (Rosanka et al., 2021), uncertainties related to the kinetic data used in JAMOC are discussed. The global model simulations performed in this study suffer from additional uncertainties mainly attributed to (1) the representation of VOC emissions and (2) missing sources of key oxidants. Each uncertainty will be briefly discussed in this section.
As demonstrated for methanol (see Sect. 4.1), a satisfactory reproduction of tropospheric VOC concentrations strongly depends on the realistic representation of VOC emissions. As pointed out earlier, the highest uncertainty is introduced by the biogenic emission submodel MEGAN. For instance, isoprene emissions are very sensitive to temperature and light. These uncertainties are not well quantified. Drought stress also affects isoprene emissions, and it is estimated to reduce the emissions by 17 %–50 % globally (Jiang et al., 2018; Sindelarova et al., 2014). Additionally, biomass burning emissions in Indonesia are potentially underestimated. Parker et al. (2016) pointed out that in the monsoon period of 2015, a high fraction of the Indonesian fire emissions originates from peatland, which is known to produce significantly high VOC emissions (Akagi et al., 2011). In the GFAS retrievals used for biomass burning, the dominant fire type in Indonesia is assigned to tropical forest fires with the exceptions of a few grid points. The strength of VOC emissions for the Indonesian fire period in 2015 is therefore underestimated. It is thus expected that when using JAMOC and a realistic combination of peatland and tropical forest fire types, the overestimation of tropospheric O3 in this region and time period will be further reduced (see Sect. 4.3 and Fig. 11).
Fenton chemistry is a major source of in-cloud OH(aq) (Deguillaume et al., 2004). Even though these reactions are available in JAMOC, Fenton chemistry is not taken into account in this study, due to missing global iron (Fe) distributions and emissions in EMAC. However, Scanza et al. (2018) present an approach to implementing these into a global model. Realising this approach in EMAC would make Fenton chemistry feasible in the future. From the literature, no global modelling study is known that couples this OH(aq) source to a detailed in-cloud OVOC oxidation scheme, making it difficult to estimate its impact on a global scale. In the highly idealised box-modelling study of Mouchel-Vallon et al. (2017), most OH(aq) (63 %) is produced from Fenton chemistry (see their supplemental material SM5). This indicates the importance of Fenton chemistry in areas with high iron concentrations. The major source of atmospheric iron is mineral dust. Fossil fuel and biomass burning also emit some iron. Thus, iron concentrations are high close to deserts with the highest concentrations in the Sahara, Lut Desert, Thar Desert, and Arabian Desert (Wang et al., 2015, their Fig. 6). Not considering this OH(aq) source catalysed by iron might lead to an underestimation of OVOC oxidation rates in the aqueous phase. In particular Central Africa, a region with high biogenic VOC emissions, might be influenced by Fe being transported from the Sahara. In addition, mineral dust will be transported over the tropical Atlantic to the Amazon Basin. Here, the missing OH(aq) source could be responsible for the underestimation of in-cloud OVOC oxidation and thus the destruction of O3(aq).
To conclude, the impact of the in-cloud OVOC chemistry on the tropospheric composition estimated in this study is influenced by some model and observational uncertainties. However, the findings of the simulations performed in this study are still consistent with earlier studies and improve the representation of a selection of OVOCs and the EMAC bias towards high O3 concentrations. Due to their complexity, reducing the model uncertainties introduced by biogenic and biomass burning emissions and missing aqueous-phase Fenton chemistry is outside the scope of this study. Model representation of the latter is expected to substantially increase the oxidation rate of OVOCs in the cloud droplets and aerosols. Additional global modelling studies need to be performed to address these issues.
In this study, the influence of in-cloud oxidation of soluble OVOCs on the tropospheric gas-phase composition was studied. This was achieved by implementing the extensive aqueous-phase OVOC oxidation scheme JAMOC, initially presented by Rosanka et al. (2021), into the global model EMAC. The mechanism considers a selection of VOCs containing up to 4 carbon atoms; their acid–base and/or hydration–dehydration equilibria; and their reactions with OH(aq), NO3(aq), and other oxidants (if available). Additionally, the phase transfer of species containing up to 10 carbon atoms is taken into account. In addition to the EMAC simulations, a representative cloud droplet was simulated in the box model CAABA in order to understand all processes involved.
When in-cloud OVOC oxidation is taken into account, VOCs are efficiently removed from the gas phase, leading to generally reduced tropospheric VOC burdens. The reduction in modelled methanol and glyoxal concentrations is in line with satellite retrievals. The overall reduction in VOC concentrations leads to lower formation rates of HOx in the gas phase. Higher in-cloud HO2(aq) concentrations, formed from OVOC oxidation, lead to accelerated destruction of O3(aq) in clouds. In addition, the chemical production and loss of O3 in the gas phase are reduced due to lower VOC and HOx concentrations. This results in a reduced O3 burden and decreases EMAC's bias towards too-high O3 concentrations. In ScJAMOC, many secondary organic aerosol (SOA) precursors are explicitly treated, impacting the formation of SOAs (Blando and Turpin, 2000; Ervens et al., 2011; Ervens, 2015). The potentially enhanced SOA formation will further influence tropospheric HOx chemistry and NO2 photolysis, resulting in a higher reduction in tropospheric O3 and EMAC's O3 bias. However, studying the influence of in-cloud OVOC oxidation on SOA formation is outside the scope of this study.
The findings in this study demonstrate the importance of in-cloud chemistry on tropospheric O3. Most atmospheric global models do not take detailed aqueous-phase chemistry into account (Ervens, 2015). With the minimal oxidation of SO2(aq) by O3(aq), which is representative of most global models, only about 13 Tg yr−1 of O3 is scavenged by clouds. With explicit in-cloud OVOC oxidation considered, O3 scavenging increases to about 336 Tg yr−1. This estimate neglects the O3 sink in deliquescent aerosols, which might turn out to be significant as well. The predicted O3 loss by clouds is significantly higher than the global estimates by Liang and Jacob (1997), and regional changes might be on the same order of magnitude as predicted by Lelieveld and Crutzen (1990). To conclude, global models, which neglect explicit in-cloud OVOC oxidation, significantly underestimate clouds as O3 sinks and show a general tendency to overestimate tropospheric O3.
The simulation results are archived at the Jülich Supercomputing Centre (JSC) and are available on request. The IASI O3 data processed with FORLI-O3 v0151001 can be downloaded from the AERIS portal at http://iasi.aeris-data.fr/O3/ (last access: 2 August 2020) (IASI, 2020). The IASI methanol columns are archived at ULB and available on request.
SR and DT designed the study. SR performed the simulations and analysed the data with contributions from DT. BF and CW acted as IASI data providers and analysts. SR and DT discussed the results with contributions from RS, BF, and AW. The manuscript was prepared by SR with the help of all co-authors.
The authors declare that they have no competing interests.
This article is part of the special issue “The Modular Earth Submodel System (MESSy) (ACP/GMD inter-journal SI)”. It is not associated with a conference.
The work described in this paper has received funding from the Initiative and Networking Fund of the Helmholtz Association through the project Advanced Earth System Modelling Capacity (ESM). The content of this paper is the sole responsibility of the authors, and it does not represent the opinion of the Helmholtz Association, and the Helmholtz Association is not responsible for any use that might be made of the information contained. The authors gratefully acknowledge the ESM project for funding this work by providing computing time on the ESM partition of the supercomputer JUWELS at the Jülich Supercomputing Centre (JSC). The authors gratefully acknowledge the computing time granted through JARA on the supercomputer JURECA at Forschungszentrum Jülich. IASI is a joint mission of EUMETSAT and the Centre National d'Etudes Spatiales (CNES, France). The authors acknowledge the AERIS data infrastructure for providing access to the IASI data in this study and ULB-LATMOS, in particular Daniel Hurtmans, for the development of the retrieval algorithms. The research in Belgium is funded by the Belgian Federal Science Policy Office (BELSPO) and the European Space Agency (ESA–BELSPO Prodex arrangement IASI.FLOW and Satellite Application Facility on Atmospheric Composition Monitoring (ACSAF)).
This research has been supported by the Initiative and Networking Fund of the Helmholtz Association through the project Advanced Earth System Modelling Capacity (ESM) (grant no. DB001549).
The article processing charges for this open-access
publication were covered by the Forschungszentrum Jülich.
This paper was edited by John Orlando and reviewed by Hartmut Herrmann and one anonymous referee.
Akagi, S. K., Yokelson, R. J., Wiedinmyer, C., Alvarado, M. J., Reid, J. S., Karl, T., Crounse, J. D., and Wennberg, P. O.: Emission factors for open and domestic biomass burning for use in atmospheric models, Atmos. Chem. Phys., 11, 4039–4072, https://doi.org/10.5194/acp-11-4039-2011, 2011. a, b
Alvarado, L. M. A., Richter, A., Vrekoussis, M., Wittrock, F., Hilboll, A., Schreier, S. F., and Burrows, J. P.: An improved glyoxal retrieval from OMI measurements, Atmos. Meas. Tech., 7, 4133–4150, https://doi.org/10.5194/amt-7-4133-2014, 2014. a, b
Arakaki, T., Anastasio, C., Kuroki, Y., Nakajima, H., Okada, K., Kotani, Y., Handa, D., Azechi, S., Kimura, T., Tsuhako, A., and Miyagi, Y.: A General Scavenging Rate Constant for Reaction of Hydroxyl Radical with Organic Carbon in Atmospheric Waters, Environ. Sci. Technol., 47, 8196–8203, https://doi.org/10.1021/es401927b, 2013. a
August, T., Klaes, D., Schlüssel, P., Hultberg, T., Crapeau, M., Arriaga, A., O'Carroll, A., Coppens, D., Munro, R., and Calbet, X.: IASI on Metop-A: Operational Level 2 retrievals after five years in orbit, three Leaders in Spectroscopy, J. Quant. Spectrosc. Ra., 113, 1340–1371, https://doi.org/10.1016/j.jqsrt.2012.02.028, 2012. a
Berges, M. G. M. and Warneck, P.: Product Quantum Yields for the 350 nm Photodecomposition of Pyruvic Acid in Air, Berichte der Bunsengesellschaft für physikalische Chemie, 96, 413–416, https://doi.org/10.1002/bbpc.19920960334, 1992. a
Blando, J. D. and Turpin, B. J.: Secondary organic aerosol formation in cloud and fog droplets: a literature evaluation of plausibility, Atmos. Environ., 34, 1623–1632, https://doi.org/10.1016/S1352-2310(99)00392-1, 2000. a, b
Bott, A. and Zdunkowski, W.: Electromagnetic energy within dielectric spheres, J. Opt. Soc. Am. A, 4, 1361–1365, https://doi.org/10.1364/JOSAA.4.001361, 1987. a
Boynard, A., Hurtmans, D., Koukouli, M. E., Goutail, F., Bureau, J., Safieddine, S., Lerot, C., Hadji-Lazaro, J., Wespes, C., Pommereau, J.-P., Pazmino, A., Zyrichidou, I., Balis, D., Barbe, A., Mikhailenko, S. N., Loyola, D., Valks, P., Van Roozendael, M., Coheur, P.-F., and Clerbaux, C.: Seven years of IASI ozone retrievals from FORLI: validation with independent total column and vertical profile measurements, Atmos. Meas. Tech., 9, 4327–4353, https://doi.org/10.5194/amt-9-4327-2016, 2016. a
Cabrera-Perez, D., Taraborrelli, D., Sander, R., and Pozzer, A.: Global atmospheric budget of simple monocyclic aromatic compounds, Atmos. Chem. Phys., 16, 6931–6947, https://doi.org/10.5194/acp-16-6931-2016, 2016. a
Clerbaux, C., Boynard, A., Clarisse, L., George, M., Hadji-Lazaro, J., Herbin, H., Hurtmans, D., Pommier, M., Razavi, A., Turquety, S., Wespes, C., and Coheur, P.-F.: Monitoring of atmospheric composition using the thermal infrared IASI/MetOp sounder, Atmos. Chem. Phys., 9, 6041–6054, https://doi.org/10.5194/acp-9-6041-2009, 2009. a
Deguillaume, L., Leriche, M., Monod, A., and Chaumerliac, N.: The role of transition metal ions on HOx radicals in clouds: a numerical evaluation of its impact on multiphase chemistry, Atmos. Chem. Phys., 4, 95–110, https://doi.org/10.5194/acp-4-95-2004, 2004. a
Deguillaume, L., Tilgner, A., Schrödner, R., Wolke, R., Chaumerliac, N., and Herrmann, H.: Towards an operational aqueous phase chemistry mechanism for regional chemistry-transport models: CAPRAM-RED and its application to the COSMO-MUSCAT model, J. Atmos. Chem., 64, 1–35, https://doi.org/10.1007/s10874-010-9168-8, 2009. a, b
Epstein, S. A. and Nizkorodov, S. A.: A comparison of the chemical sinks of atmospheric organics in the gas and aqueous phase, Atmos. Chem. Phys., 12, 8205–8222, https://doi.org/10.5194/acp-12-8205-2012, 2012. a
Ervens, B.: Modeling the Processing of Aerosol and Trace Gases in Clouds and Fogs, Chem. Rev., 115, 4157–4198, https://doi.org/10.1021/cr5005887, 2015. a, b, c, d, e, f, g, h
Ervens, B., Turpin, B. J., and Weber, R. J.: Secondary organic aerosol formation in cloud droplets and aqueous particles (aqSOA): a review of laboratory, field and model studies, Atmos. Chem. Phys., 11, 11069–11102, https://doi.org/10.5194/acp-11-11069-2011, 2011. a, b
Fiore, A. M., Jacob, D. J., Mathur, R., and Martin, R. V.: Application of empirical orthogonal functions to evaluate ozone simulations with regional and global models, J. Geophys. Res.-Atmos., 108, 4431, https://doi.org/10.1029/2002JD003151, 2003. a
Franco, B., Clarisse, L., Stavrakou, T., Müller, J.-F., Van Damme, M., Whitburn, S., Hadji-Lazaro, J., Hurtmans, D., Taraborrelli, D., Clerbaux, C., and Coheur, P.-F.: A General Framework for Global Retrievals of Trace Gases From IASI: Application to Methanol, Formic Acid, and PAN, J. Geophys. Res.-Atmos., 123, 13963–13984, https://doi.org/10.1029/2018JD029633, 2018. a, b, c
Gaudel, A., Cooper, O. R., Ancellet, G., Barret, B., Boynard, A., Burrows, J. P., Clerbaux, C., Coheur, P. F., Cuesta, J., Cuevas, E., Doniki, S., Dufour, G., Ebojie, F., Foret, G., Garcia, O., Granados Muños, M. J., Hannigan, J. W., Hase, F., Huang, G., Hassler, B., Hurtmans, D., Jaffe, D., Jones, N., Kalabokas, P., Kerridge, B., Kulawik, S. S., Latter, B., Leblanc, T., Le Flochmoën, E., Lin, W., Liu, J., Liu, X., Mahieu, E., McClure-Begley, A., Neu, J. L., Osman, M., Palm, M., Petetin, H., Petropavlovskikh, I., Querel, R., Rahpoe, N., Rozanov, A., Schultz, M. G., Schwab, J., Siddans, R., Smale, D., Steinbacher, M., Tanimoto, H., Tarasick, D. W., Thouret, V., Thompson, A. M., Trickl, T., Weatherhead, E., Wespes, C., Worden, H. M., Vigouroux, C., Xu, X., Zeng, G., and Ziemke, J.: Tropospheric Ozone Assessment Report: Present-day distribution and trends of tropospheric ozone relevant to climate and global atmospheric chemistry model evaluation, LK 01, Elementa, 6, 39, https://doi.org/10.1525/elementa.291, 2018. a, b, c
Griffiths, P. T., Keeble, J., Shin, Y. M., Abraham, N. L., Archibald, A. T., and Pyle, J. A.: On the Changing Role of the Stratosphere on the Tropospheric Ozone Budget: 1979–2010, Geophys. Res. Lett., 47, e2019GL086 901, https://doi.org/10.1029/2019GL086901, 2020. a
Gromov, S., Jöckel, P., Sander, R., and Brenninkmeijer, C. A. M.: A kinetic chemistry tagging technique and its application to modelling the stable isotopic composition of atmospheric trace gases, Geosci. Model Dev., 3, 337–364, https://doi.org/10.5194/gmd-3-337-2010, 2010. a
Guenther, A., Karl, T., Harley, P., Wiedinmyer, C., Palmer, P. I., and Geron, C.: Estimates of global terrestrial isoprene emissions using MEGAN (Model of Emissions of Gases and Aerosols from Nature), Atmos. Chem. Phys., 6, 3181–3210, https://doi.org/10.5194/acp-6-3181-2006, 2006. a
Hagemann, S. and Stacke, T.: Impact of the soil hydrology scheme on simulated soil moisture memory, Clim. Dynam., 44, 1731–1750, https://doi.org/10.1007/s00382-014-2221-6, 2015. a
Hens, K., Novelli, A., Martinez, M., Auld, J., Axinte, R., Bohn, B., Fischer, H., Keronen, P., Kubistin, D., Nölscher, A. C., Oswald, R., Paasonen, P., Petäjä, T., Regelin, E., Sander, R., Sinha, V., Sipilä, M., Taraborrelli, D., Tatum Ernest, C., Williams, J., Lelieveld, J., and Harder, H.: Observation and modelling of HOx radicals in a boreal forest, Atmos. Chem. Phys., 14, 8723–8747, https://doi.org/10.5194/acp-14-8723-2014, 2014. a
Herrmann, H.: Kinetics of Aqueous Phase Reactions Relevant for Atmospheric Chemistry, Chem. Rev., 103, 4691–4716, https://doi.org/10.1021/cr020658q, 2003. a
Hu, L., Jacob, D. J., Liu, X., Zhang, Y., Zhang, L., Kim, P. S., Sulprizio, M. P., and Yantosca, R. M.: Global budget of tropospheric ozone: Evaluating recent model advances with satellite (OMI), aircraft (IAGOS), and ozonesonde observations, Atmos. Environ., 167, 323–334, https://doi.org/10.1016/j.atmosenv.2017.08.036, 2017. a
Hurtmans, D., Coheur, P.-F., Wespes, C., Clarisse, L., Scharf, O., Clerbaux, C., Hadji-Lazaro, J., George, M., and Turquety, S.: FORLI radiative transfer and retrieval code for IASI, three Leaders in Spectroscopy, J. Quant. Spectrosc. Ra., 113, 1391–1408, https://doi.org/10.1016/j.jqsrt.2012.02.036, 2012. a
IASI: O3 total column from IASI (Level 2), available at: http://iasi.aeris-data.fr/O3/, last access: 2 August 2020. a
Jaeglé, L., Jacob, D. J., Brune, W. H., and Wennberg, P. O.: Chemistry of HOx radicals in the upper troposphere, Atmos. Environ., 35, 469–489, https://doi.org/10.1016/S1352-2310(00)00376-9, 2001. a
Jiang, X., Guenther, A., Potosnak, M., Geron, C., Seco, R., Karl, T., Kim, S., Gu, L., and Pallardy, S.: Isoprene emission response to drought and the impact on global atmospheric chemistry, Atmos. Environ., 183, 69–83, https://doi.org/10.1016/j.atmosenv.2018.01.026, 2018. a
Jöckel, P., Tost, H., Pozzer, A., Brühl, C., Buchholz, J., Ganzeveld, L., Hoor, P., Kerkweg, A., Lawrence, M. G., Sander, R., Steil, B., Stiller, G., Tanarhte, M., Taraborrelli, D., van Aardenne, J., and Lelieveld, J.: The atmospheric chemistry general circulation model ECHAM5/MESSy1: consistent simulation of ozone from the surface to the mesosphere, Atmos. Chem. Phys., 6, 5067–5104, https://doi.org/10.5194/acp-6-5067-2006, 2006. a, b, c
Jöckel, P., Kerkweg, A., Pozzer, A., Sander, R., Tost, H., Riede, H., Baumgaertner, A., Gromov, S., and Kern, B.: Development cycle 2 of the Modular Earth Submodel System (MESSy2), Geosci. Model Dev., 3, 717–752, https://doi.org/10.5194/gmd-3-717-2010, 2010. a, b
Jöckel, P., Tost, H., Pozzer, A., Kunze, M., Kirner, O., Brenninkmeijer, C. A. M., Brinkop, S., Cai, D. S., Dyroff, C., Eckstein, J., Frank, F., Garny, H., Gottschaldt, K.-D., Graf, P., Grewe, V., Kerkweg, A., Kern, B., Matthes, S., Mertens, M., Meul, S., Neumaier, M., Nützel, M., Oberländer-Hayn, S., Ruhnke, R., Runde, T., Sander, R., Scharffe, D., and Zahn, A.: Earth System Chemistry integrated Modelling (ESCiMo) with the Modular Earth Submodel System (MESSy) version 2.51, Geosci. Model Dev., 9, 1153–1200, https://doi.org/10.5194/gmd-9-1153-2016, 2016. a, b
Jülich Supercomputing Centre: JURECA: Modular supercomputer at Jülich Supercomputing Centre, J. Large-scale Res. Facil., 4, A132, https://doi.org/10.17815/jlsrf-4-121-1, 2018. a
Jülich Supercomputing Centre: JUWELS: Modular Tier-0/1 Supercomputer at the Jülich Supercomputing Centre, J. Large-scale Res. Facil., 5, A135, https://doi.org/10.17815/jlsrf-5-171, 2019. a
Kaiser, J. W., Heil, A., Andreae, M. O., Benedetti, A., Chubarova, N., Jones, L., Morcrette, J.-J., Razinger, M., Schultz, M. G., Suttie, M., and van der Werf, G. R.: Biomass burning emissions estimated with a global fire assimilation system based on observed fire radiative power, Biogeosciences, 9, 527–554, https://doi.org/10.5194/bg-9-527-2012, 2012. a
Kerkweg, A., Buchholz, J., Ganzeveld, L., Pozzer, A., Tost, H., and Jöckel, P.: Technical Note: An implementation of the dry removal processes DRY DEPosition and SEDImentation in the Modular Earth Submodel System (MESSy), Atmos. Chem. Phys., 6, 4617–4632, https://doi.org/10.5194/acp-6-4617-2006, 2006. a
Kerkweg, A., Sander, R., Tost, H., Jöckel, P., and Lelieveld, J.: Technical Note: Simulation of detailed aerosol chemistry on the global scale using MECCA-AERO, Atmos. Chem. Phys., 7, 2973–2985, https://doi.org/10.5194/acp-7-2973-2007, 2007. a
Lelieveld, J. and Crutzen, P. J.: Influences of cloud photochemical processes on tropospheric ozone, Nature, 343, 227–233, https://doi.org/10.1038/343227a0, 1990. a, b, c, d
Lelieveld, J., Gromov, S., Pozzer, A., and Taraborrelli, D.: Global tropospheric hydroxyl distribution, budget and reactivity, Atmos. Chem. Phys., 16, 12477–12493, https://doi.org/10.5194/acp-16-12477-2016, 2016. a, b, c, d
Levelt, P. F., van den Oord, G. H. J., Dobber, M. R., Malkki, A., Huib Visser, Johan de Vries, Stammes, P., Lundell, J. O. V., and Saari, H.: The ozone monitoring instrument, IEEE T. Geosci. Remote, 44, 1093–1101, https://doi.org/10.1109/TGRS.2006.872333, 2006. a
Levelt, P. F., Joiner, J., Tamminen, J., Veefkind, J. P., Bhartia, P. K., Stein Zweers, D. C., Duncan, B. N., Streets, D. G., Eskes, H., van der A, R., McLinden, C., Fioletov, V., Carn, S., de Laat, J., DeLand, M., Marchenko, S., McPeters, R., Ziemke, J., Fu, D., Liu, X., Pickering, K., Apituley, A., González Abad, G., Arola, A., Boersma, F., Chan Miller, C., Chance, K., de Graaf, M., Hakkarainen, J., Hassinen, S., Ialongo, I., Kleipool, Q., Krotkov, N., Li, C., Lamsal, L., Newman, P., Nowlan, C., Suleiman, R., Tilstra, L. G., Torres, O., Wang, H., and Wargan, K.: The Ozone Monitoring Instrument: overview of 14 years in space, Atmos. Chem. Phys., 18, 5699–5745, https://doi.org/10.5194/acp-18-5699-2018, 2018. a
Liang, J. and Jacob, D. J.: Effect of aqueous phase cloud chemistry on tropospheric ozone, J. Geophys. Res.-Atmos., 102, 5993–6001, https://doi.org/10.1029/96JD02957, 1997. a, b, c
Lin, G., Penner, J. E., Sillman, S., Taraborrelli, D., and Lelieveld, J.: Global modeling of SOA formation from dicarbonyls, epoxides, organic nitrates and peroxides, Atmos. Chem. Phys., 12, 4743–4774, https://doi.org/10.5194/acp-12-4743-2012, 2012. a
Mayer, B. and Madronich, S.: Actinic flux and photolysis in water droplets: Mie calculations and geometrical optics limit, Atmos. Chem. Phys., 4, 2241–2250, https://doi.org/10.5194/acp-4-2241-2004, 2004. a
Millet, D. B., Jacob, D. J., Custer, T. G., de Gouw, J. A., Goldstein, A. H., Karl, T., Singh, H. B., Sive, B. C., Talbot, R. W., Warneke, C., and Williams, J.: New constraints on terrestrial and oceanic sources of atmospheric methanol, Atmos. Chem. Phys., 8, 6887–6905, https://doi.org/10.5194/acp-8-6887-2008, 2008. a, b, c, d
Mouchel-Vallon, C., Deguillaume, L., Monod, A., Perroux, H., Rose, C., Ghigo, G., Long, Y., Leriche, M., Aumont, B., Patryl, L., Armand, P., and Chaumerliac, N.: CLEPS 1.0: A new protocol for cloud aqueous phase oxidation of VOC mechanisms, Geosci. Model Dev., 10, 1339–1362, https://doi.org/10.5194/gmd-10-1339-2017, 2017. a, b, c
Myriokefalitakis, S., Tsigaridis, K., Mihalopoulos, N., Sciare, J., Nenes, A., Kawamura, K., Segers, A., and Kanakidou, M.: In-cloud oxalate formation in the global troposphere: a 3-D modeling study, Atmos. Chem. Phys., 11, 5761–5782, https://doi.org/10.5194/acp-11-5761-2011, 2011. a
Nölscher, A., Butler, T., Auld, J., Veres, P., Muñoz, A., Taraborrelli, D., Vereecken, L., Lelieveld, J., and Williams, J.: Using total OH reactivity to assess isoprene photooxidation via measurement and model, Atmos. Environ., 89, 453–463, https://doi.org/10.1016/j.atmosenv.2014.02.024, 2014. a
Olsen, M. A., Douglass, A. R., and Kaplan, T. B.: Variability of extratropical ozone stratosphere–troposphere exchange using microwave limb sounder observations, J. Geophys. Res.-Atmos., 118, 1090–1099, https://doi.org/10.1029/2012JD018465, 2013. a
Parker, R. J., Boesch, H., Wooster, M. J., Moore, D. P., Webb, A. J., Gaveau, D., and Murdiyarso, D.: Atmospheric CH4 and CO2 enhancements and biomass burning emission ratios derived from satellite observations of the 2015 Indonesian fire plumes, Atmos. Chem. Phys., 16, 10111–10131, https://doi.org/10.5194/acp-16-10111-2016, 2016. a, b, c
Rodgers, C. D.: Inverse Methods for Atmospheric Sounding, World Scientific, Singapore, https://doi.org/10.1142/3171, 2000. a
Roeckner, E., Bäuml, G., Bonaventura, L., Brokopf, R., Esch, M., Giorgetta, M., Hagemann, S., Kirchner, I., Kornblueh, L., Manzini, E., Rhodin, A., Schlese, U., Schulzweida, U., and Tompkins, A.: The atmospheric general circulation model ECHAM 5. Part I: Model description, Tech. Rep. 349, Max-Planck-Institute for Meteorology, Hamburg, 2003. a
Rosanka, S., Vu, G. H. T., Nguyen, H. M. T., Pham, T. V., Javed, U., Taraborrelli, D., and Vereecken, L.: Atmospheric chemical loss processes of isocyanic acid (HNCO): a combined theoretical kinetic and global modelling study, Atmos. Chem. Phys., 20, 6671–6686, https://doi.org/10.5194/acp-20-6671-2020, 2020a. a
Rosanka, S., Franco, B., Clarisse, L., Coheur, P.-F., Wahner, A., and Taraborrelli, D.: Organic pollutants from tropical peatland fires: regional influences and its impact on lower stratospheric ozone, Atmos. Chem. Phys. Discuss. [preprint], https://doi.org/10.5194/acp-2020-1130, in review, 2020b. a
Rosanka, S., Sander, R., Wahner, A., and Taraborrelli, D.: Oxidation of low-molecular-weight organic compounds in cloud droplets: development of the Jülich Aqueous-phase Mechanism of Organic Chemistry (JAMOC) in CAABA/MECCA (version 4.5.0), Geosci. Model Dev., 14, 4103–4115, https://doi.org/10.5194/gmd-14-4103-2021, 2021. a, b, c, d, e, f, g, h, i, j, k, l
Sander, R.: Modeling Atmospheric Chemistry: Interactions between Gas-Phase Species and Liquid Cloud/Aerosol Particles, Surv. Geophys., 20, 1–31, https://doi.org/10.1023/A:1006501706704, 1999. a
Sander, R., Baumgaertner, A., Cabrera-Perez, D., Frank, F., Gromov, S., Grooß, J.-U., Harder, H., Huijnen, V., Jöckel, P., Karydis, V. A., Niemeyer, K. E., Pozzer, A., Riede, H., Schultz, M. G., Taraborrelli, D., and Tauer, S.: The community atmospheric chemistry box model CAABA/MECCA-4.0, Geosci. Model Dev., 12, 1365–1385, https://doi.org/10.5194/gmd-12-1365-2019, 2019. a, b, c, d
Sandu, A. and Sander, R.: Technical note: Simulating chemical systems in Fortran90 and Matlab with the Kinetic PreProcessor KPP-2.1, Atmos. Chem. Phys., 6, 187–195, https://doi.org/10.5194/acp-6-187-2006, 2006. a
Scanza, R. A., Hamilton, D. S., Perez Garcia-Pando, C., Buck, C., Baker, A., and Mahowald, N. M.: Atmospheric processing of iron in mineral and combustion aerosols: development of an intermediate-complexity mechanism suitable for Earth system models, Atmos. Chem. Phys., 18, 14175–14196, https://doi.org/10.5194/acp-18-14175-2018, 2018. a
Schrödner, R., Tilgner, A., Wolke, R., and Herrmann, H.: Modeling the multiphase processing of an urban and a rural air mass with COSMO–MUSCAT, source apportionment and modelling of urban air pollution, Urban Climate, 10, 720–731, https://doi.org/10.1016/j.uclim.2014.02.001, 2014. a
Sherwen, T., Schmidt, J. A., Evans, M. J., Carpenter, L. J., Großmann, K., Eastham, S. D., Jacob, D. J., Dix, B., Koenig, T. K., Sinreich, R., Ortega, I., Volkamer, R., Saiz-Lopez, A., Prados-Roman, C., Mahajan, A. S., and Ordóñez, C.: Global impacts of tropospheric halogens (Cl, Br, I) on oxidants and composition in GEOS-Chem, Atmos. Chem. Phys., 16, 12239–12271, https://doi.org/10.5194/acp-16-12239-2016, 2016. a
Sindelarova, K., Granier, C., Bouarar, I., Guenther, A., Tilmes, S., Stavrakou, T., Müller, J.-F., Kuhn, U., Stefani, P., and Knorr, W.: Global data set of biogenic VOC emissions calculated by the MEGAN model over the last 30 years, Atmos. Chem. Phys., 14, 9317–9341, https://doi.org/10.5194/acp-14-9317-2014, 2014. a, b
Staehelin, J., Buehler, R. E., and Hoigné, J.: Ozone decomposition in water studied by pulse radiolysis. 2. Hydroxyl and hydrogen tetroxide (HO4) as chain intermediates, J. Phys. Chem.-US, 88, 5999–6004, https://doi.org/10.1021/j150668a051, 1984. a, b
Taraborrelli, D., Lawrence, M. G., Butler, T. M., Sander, R., and Lelieveld, J.: Mainz Isoprene Mechanism 2 (MIM2): an isoprene oxidation mechanism for regional and global atmospheric modelling, Atmos. Chem. Phys., 9, 2751–2777, https://doi.org/10.5194/acp-9-2751-2009, 2009. a
Taraborrelli, D., Lawrence, M. G., Crowley, J. N., Dillon, T. J., Gromov, S., Groß, C. B. M., Vereecken, L., and Lelieveld, J.: Hydroxyl radical buffered by isoprene oxidation over tropical forests, Nat. Geosci., 5, 190–193, https://doi.org/10.1038/ngeo1405, 2012. a
Taraborrelli, D., Cabrera-Perez, D., Bacer, S., Gromov, S., Lelieveld, J., Sander, R., and Pozzer, A.: Influence of aromatics on tropospheric gas-phase composition, Atmos. Chem. Phys., 21, 2615–2636, https://doi.org/10.5194/acp-21-2615-2021, 2021. a
Tilgner, A. and Herrmann, H.: Radical-driven carbonyl-to-acid conversion and acid degradation in tropospheric aqueous systems studied by CAPRAM, atmospheric Chemical Mechanisms: Selected Papers from the 2008 Conference, Atmos. Environ., 44, 5415–5422, https://doi.org/10.1016/j.atmosenv.2010.07.050, 2010. a
Tilgner, A., Bräuer, P., Wolke, R., and Herrmann, H.: Modelling multiphase chemistry in deliquescent aerosols and clouds using CAPRAM3.0i, J. Atmos. Chem., 70, 221–256, https://doi.org/10.1007/s10874-013-9267-4, 2013. a, b
Tost, H., Jöckel, P., Kerkweg, A., Sander, R., and Lelieveld, J.: Technical note: A new comprehensive SCAVenging submodel for global atmospheric chemistry modelling, Atmos. Chem. Phys., 6, 565–574, https://doi.org/10.5194/acp-6-565-2006, 2006. a, b, c
Tost, H., Jöckel, P., Kerkweg, A., Pozzer, A., Sander, R., and Lelieveld, J.: Global cloud and precipitation chemistry and wet deposition: tropospheric model simulations with ECHAM5/MESSy1, Atmos. Chem. Phys., 7, 2733–2757, https://doi.org/10.5194/acp-7-2733-2007, 2007. a, b, c, d
Wang, R., Balkanski, Y., Boucher, O., Bopp, L., Chappell, A., Ciais, P., Hauglustaine, D., Peñuelas, J., and Tao, S.: Sources, transport and deposition of iron in the global atmosphere, Atmos. Chem. Phys., 15, 6247–6270, https://doi.org/10.5194/acp-15-6247-2015, 2015. a
Wespes, C., Emmons, L., Edwards, D. P., Hannigan, J., Hurtmans, D., Saunois, M., Coheur, P.-F., Clerbaux, C., Coffey, M. T., Batchelor, R. L., Lindenmaier, R., Strong, K., Weinheimer, A. J., Nowak, J. B., Ryerson, T. B., Crounse, J. D., and Wennberg, P. O.: Analysis of ozone and nitric acid in spring and summer Arctic pollution using aircraft, ground-based, satellite observations and MOZART-4 model: source attribution and partitioning, Atmos. Chem. Phys., 12, 237–259, https://doi.org/10.5194/acp-12-237-2012, 2012. a
Wespes, C., Hurtmans, D., Emmons, L. K., Safieddine, S., Clerbaux, C., Edwards, D. P., and Coheur, P.-F.: Ozone variability in the troposphere and the stratosphere from the first 6 years of IASI observations (2008–2013), Atmos. Chem. Phys., 16, 5721–5743, https://doi.org/10.5194/acp-16-5721-2016, 2016. a, b
Wespes, C., Hurtmans, D., Clerbaux, C., and Coheur, P.-F.: O3 variability in the troposphere as observed by IASI over 2008–2016: Contribution of atmospheric chemistry and dynamics, J. Geophys. Res.-Atmos., 122, 2429–2451, https://doi.org/10.1002/2016JD025875, 2017. a, b
WMO: Meteorology-A three-dimensional science: Second sessionof the commission for aerology, WMO Bull., Geneva, 134–138, 1957. a
Young, P. J., Naik, V., Fiore, A. M., Gaudel, A., Guo, J., Lin, M., Neu, J., Parrish, D., Rieder, H., Schnell, J. L., Tilmes, S., Wild, O., Zhang, L., Ziemke, J., Brandt, J., Delcloo, A., Doherty, R. M., Geels, C., Hegglin, M. I., Hu, L., Im, U., Kumar, R., Luhar, A., Murray, L., Plummer, D., Rodriguez, J., Saiz-Lopez, A., Schultz, M. G., Woodhouse, M. T., and Zeng, G.: Tropospheric Ozone Assessment Report: Assessment of global-scale model performance for global and regional ozone distributions, variability, and trends, Elementa, 6, 10, https://doi.org/10.1525/elementa.265, 2018. a, b
Ziemke, J. R., Chandra, S., Labow, G. J., Bhartia, P. K., Froidevaux, L., and Witte, J. C.: A global climatology of tropospheric and stratospheric ozone derived from Aura OMI and MLS measurements, Atmos. Chem. Phys., 11, 9237–9251, https://doi.org/10.5194/acp-11-9237-2011, 2011. a
- Abstract
- Introduction
- Modelling approach
- Box-model results
- Global impact on atmospheric composition
- Model uncertainties
- Conclusions
- Appendix A: Definition of ∑OVOCs
- Data availability
- Author contributions
- Competing interests
- Special issue statement
- Acknowledgements
- Financial support
- Review statement
- References