the Creative Commons Attribution 4.0 License.
the Creative Commons Attribution 4.0 License.
 | 29 Jun 2021
Large seasonal and interannual variations of biogenic sulfur compounds in the Arctic atmosphere (Svalbard; 78.9° N, 11.9° E)
Sehyun Jang
Ki-Tae Park
Young Jun Yoon
Kitae Kim
Hyun Young Chung
Eunho Jang
Silvia Becagli
Bang Yong Lee
Rita Traversi
Konstantinos Eleftheriadis
Radovan Krejci
Ove Hermansen
Seasonal to interannual variations in the concentrations of sulfur aerosols (< 2.5 µm in diameter; non sea-salt sulfate: NSS-SO; anthropogenic sulfate: Anth-SO; biogenic sulfate: Bio-SO; methanesulfonic acid: MSA) in the Arctic atmosphere were investigated using measurements of the chemical composition of aerosols collected at Ny-Ålesund, Svalbard (78.9∘ N, 11.9∘ E) from 2015 to 2019. In all measurement years the concentration of NSS-SO was highest during the pre-bloom period and rapidly decreased towards summer. During the pre-bloom period we found a strong correlation between NSS-SO (sum of Anth-SO and Bio-SO) and Anth-SO. This was because more than 50 % of the NSS-SO measured during this period was Anth-SO, which originated in northern Europe and was subsequently transported to the Arctic in Arctic haze. Unexpected increases in the concentration of Bio-SO aerosols (an oxidation product of dimethylsulfide: DMS) were occasionally found during the pre-bloom period. These probably originated in regions to the south (the North Atlantic Ocean and the Norwegian Sea) rather than in ocean areas in the proximity of Ny-Ålesund. Another oxidation product of DMS is MSA, and the ratio of MSA to Bio-SO is extensively used to estimate the total amount of DMS-derived aerosol particles in remote marine environments. The concentration of MSA during the pre-bloom period remained low, primarily because of the greater loss of MSA relative to Bio-SO and the suppression of condensation of gaseous MSA onto particles already present in air masses being transported northwards from distant ocean source regions (existing particles). In addition, the low light intensity during the pre-bloom period resulted in a low concentration of photochemically activated oxidant species including OH radicals and BrO; these conditions favored the oxidation pathway of DMS to Bio-SO rather than to MSA, which acted to lower the MSA concentration at Ny-Ålesund. The concentration of MSA peaked in May or June and was positively correlated with phytoplankton biomass in the Greenland and Barents seas around Svalbard. As a result, the mean ratio of MSA to the DMS-derived aerosols was low (0.09 ± 0.07) in the pre-bloom period but high (0.32 ± 0.15) in the bloom and post-bloom periods. There was large interannual variability in the ratio of MSA to Bio-SO (i.e., 0.24 ± 0.11 in 2017, 0.40 ± 0.14 in 2018, and 0.36 ± 0.14 in 2019) during the bloom and post-bloom periods. This was probably associated with changes in the chemical properties of existing particles, biological activities surrounding the observation site, and air mass transport patterns. Our results indicate that MSA is not a conservative tracer for predicting DMS-derived particles, and the contribution of MSA to the growth of newly formed particles may be much larger during the bloom and post-bloom periods than during the pre-bloom period.
- Article
(2397 KB) - Full-text XML
-
Supplement
(2241 KB) - BibTeX
- EndNote


Aerosols alter the radiative properties of the Earth's surface by means of direct (e.g., scattering and absorption of solar radiation) and indirect (e.g., cloud lifetime) effects and thereby contribute to climate change (Albrecht, 1989; Haywood and Boucher, 2000; Sekiguchi et al., 2003). Moreover, acidification of the Arctic Ocean has been enhanced because of the increasing addition of anthropogenic CO2, facilitated by ocean freshening and greater air–sea CO2 exchange (Lee et al., 2011); and ocean acidification potentially impacts on the net production and fluxes of marine trace gases and so affects climate (Hoppkins et al., 2020). The recent acceleration of Arctic warming has highlighted the role of natural aerosols in influencing the radiative properties of the Arctic atmosphere (Dall'Osto et al., 2017; Willis et al., 2018). Nonetheless, current knowledge of the effect of aerosols on climate regulation and the mechanisms of formation of natural aerosols is far from comprehensive, and more alarmingly it is ambiguous (Mahowald et al., 2011; IPCC, 2013). Sulfurous compounds including SO2, methanesulfonic acid, and hydroperoxymethyl thioformate in the atmosphere are the oxidation products of dimethyl sulfide (DMS). These effectively form new particles through homogeneous nucleation and clustering reactions that are closely linked to water vapor and ammonia (negative ion-induced ternary nucleation) and contribute to particle growth (Kulmala, 2003; Kulmala et al., 2004; Veres et al., 2020). Sulfuric acid is widely recognized as a driver of new particle formation (NPF) (Kulmala, 2003), whereas methanesulfonic acid (MSA) particles tend to condense onto particles that are already present (existing particles) and so contribute to particle growth (Wyslouzil, et al., 1991; Leaitch et al., 2013; Hayashida et al., 2017). However, recent studies have provided evidence for MSA involvement in new particle formation – for example, the reaction of MSA with amines or ammonia in the presence of water results in particle formation and growth (Dawson et al., 2012; H. Chen et al., 2015, 2016). MSA also indirectly contributes to NPF by enhancing the formation of H2SO4-amines clusters (Bork et al., 2014). Some studies have reported that MSA only increased the mass of particles and not their number (Hoffmann et al., 2016; Yan et al., 2020b), suggesting a minor role for MSA in NPF. The growth of particles following NPF is particularly crucial in generating cloud condensation nuclei (CCN), which eventually lead to cloud formation. As a result, naturally produced gas molecules can promote NPF and subsequent growth of particles in the presence of sulfate and MSA (DMS oxidation products) (Chang et al., 2011a; Burkart et al., 2017). Hence, data on the quantities of non sea-salt sulfate (NSS-SO) and MSA and their variations are crucial in elucidating NPF and particle growth and ultimately the role of ocean phytoplankton in modulation of the radiative properties of the Arctic atmosphere.
The origins of sulfate aerosols include sea-salt sulfate (SS-SO), anthropogenic SO2, volcanic SO2, boreal production of natural precursor, and DMS (Bates et al., 1992a). Among those, DMS is produced through multiple biological processes occurring in pelagic and sympagic ecosystems (e.g., Kettle and Andreae, 2000; Stefels et al., 2007; Kim et al., 2010; Lee et al., 2012; Levasseur, 2013; Park et al., 2014a, 2019). Some of the DMS is ultimately released into the atmosphere through air–sea gas exchange processes. Airborne DMS is rapidly oxidized to SO2 via hydrogen abstraction by OH radicals, nitrate, and chlorine; to hydroperoxymethyl thioformate via hydrogen shift by OH radicals; and to MSA via OH addition by OH radicals and in part by halogen oxides (von Glasow and Crutzen, 2004; Barnes et al., 2006; Veres et al., 2020). Seasonal variations in the product ratio of DMS oxidized to MSA and biogenic sulfate (Bio-SO) over the Arctic region reflect the complexity of aerosol chemistry. The product ratio of DMS oxidation is highly variable and is affected by air temperature, relative humidity, precipitation, and solar radiation (Hynes et al., 1986; Yin et al., 1990; Bates et al., 1992b). Among those factors involved, air temperature is known to largely determine the oxidation pathways of DMS. At ambient temperatures the proportions of MSA and Bio-SO are typically 0.25 and 0.75, respectively (Hynes et al., 1986). DMS is well known to be oxidized more to MSA at lower temperatures. The observed latitudinal variations in the product ratio of DMS oxidation are largely consistent with those predicted from the temperature dependence of the oxidation pathway of DMS (Hynes et al., 1986; Berresheim et al., 1990; Bates et al., 1992b), although equally available are reports on an absence of temperature dependence (Ayers et al., 1991; Prospero et al., 1991; Chen et al., 2012). The product ratio of DMS oxidation is a result of the net effect of multiple processes, including concentration of atmospheric oxidants and meteorological factors influencing DMS oxidation. Therefore, the ratio could vary considerably among seasons and years.
To investigate DMS oxidation pathways in the Arctic atmosphere we measured sulfate aerosol concentrations at 3 d intervals from 2015 to 2019; this provided comprehensive datasets encompassing seasonal and interannual variations in sulfate and MSA concentrations in aerosol particles in the Arctic atmosphere. In particular, S isotope ratios were measured for all aerosol samples and were used to partition the total NSS-SO into anthropogenic sulfate (Anth-SO) and Bio-SO (the oxidative product of biogenic DMS). We also calculated the product ratio of MSA to biogenic sulfur aerosols (MSA + Bio-SO: Bio-S-aerosol). Analysis of Anth-SO, Bio-SO, and MSA concentration data, in conjunction with data on air mass back trajectories, enabled the identification of the sources of S aerosols and elucidation of factors governing variations in their concentrations.
2.1 Sampling site and aerosol sampling
Aerosol samples were collected at 50 m above sea level at the Gruvebadet observatory (78.9∘ N, 11.9∘ E; Fig. 1a) at Ny-Ålesund, Svalbard. Sampling covered the phytoplankton pre-bloom (defined as March to the second week of April), bloom (third week of April to the second week of June), and post-bloom periods (third week of June onwards). Division of these periods was subjectively made based on the mean chlorophyll-a (Chl-a) concentration in the Greenland and Barents seas near Svalbard. The period during which the concentration of Chl-a was > 0.5 mg m−3 was defined as the phytoplankton bloom period, whereas the periods when the concentration of Chl-a was < 0.5 mg m−3 prior to and following the bloom were defined as the pre-bloom and post-bloom periods, respectively.

Figure 1(a) Location of the aerosol sampling site (black star; Gruvebadet observatory; 78.9∘ N, 11.9∘ E) and the ocean domains (70–80∘ N, 25∘ W–50∘ E for Region 1; 50–70∘ N, 25∘ W–50∘ E for Region 2) defined for this study. Mean Chl-a concentration for (b) March and April, (c) May and June, and (d) July and August over the period of 2015–2019, overlaid with air mass trajectory clusters that represent the dominant pathways of air masses reaching the observation site.
Aerosol samples were collected at 3 d intervals using a high-volume sampler (HV-1000R; SIBATA, Japan) outfitted with a PM2.5 impactor (collecting particles < 2.5 µm in aerodynamic equivalent diameter). The aerosol sampler was mounted on the roof of the Gruvebadet observatory. Particulate matter in the atmosphere was collected on a quartz filter over approximately 72 h at a flow rate of 1000 L min−1, corresponding to a total air volume of 4320 m3. The method of aerosol sampling has been described elsewhere (Park et al., 2017).
2.2 Atmospheric DMS mixing ratio and major ions in aerosol samples
The analytical system enabling measurement of atmospheric DMS mixing ratio at parts per trillion levels is equipped with a DMS trapping component, a gas chromatograph, and a pulsed flame photometric detector. The detection limit of the DMS system was close to 1.5 pptv with a sampling air volume of 6 L, and the description of the system can be found elsewhere (Jang et al., 2016).
For determination of concentrations of major ions, a disk filter (47 mm diameter) was taken from a whole quartz filter (20.3 cm × 25.4 cm), soaked in 50 mL of Milli-Q water and sonicated in a bath for 60 min; aliquots of this solution were used for analysis. Milli-Q water used for the ion extraction was produced using a water purification system (Milli-Q Direct 16, Merck Millipore, USA). The concentrations of water-extractable inorganic anions and cations including MSA were measured using ion chromatography (Dionex ICS-1100, Thermo Fisher Scientific Inc., USA) fitted with an IonPac AS 19 column (Thermo Fisher Scientific Inc., USA). The instrumental detection limits were 0.02 µg L−1 for MSA and 0.02 µg L−1 for SO. From replicate injections, the analytical precision was determined to be < 5 % (relative standard deviation).
2.3 Stable S isotope ratio in sulfate aerosols
For measurement of stable S isotope ratio (δ34S) in an aerosol sample, half of the quartz filter was soaked in 50 mL Milli-Q water and sonicated for 60 min. Then, 50–100 µL of 1 M HCl was added to the solution (resulting in a pH of 3–4), after which 100 µL of 1 M BaCl2 solution was injected into the solution, leading to gradual precipitation of BaSO4. Following the completion of precipitation over 24 h, the BaSO4 precipitates were filtered onto a membrane filter and dried for another 24 h prior to S isotope ratio measurement. Each membrane filter was packed into a tin capsule and analyzed using an isotope ratio mass spectrometer (IsoPrime100; IsoPrime Ltd, UK) and an elemental analyzer (Vario MICRO cube; Elementar Co., Germany). Each filter treatment was carried out in a laminar flow hood to minimize contamination. International standard reference materials were used to measure the abundance of S isotope in the aerosols. We used NBS-127 (20.3 ± 0.4 ‰), IAEA-S1 (silver sulfide; −0.3 ± 0.3 ‰), and IAEA-S2 (silver sulfide; 22.7 ± 0.2 ‰) (Coplen and Krouse, 1998; Halas and Szaran, 2001; Santamaria-Fernandez et al., 2008) to prepare the calibration curve. NBS-127 was used as the primary standard reference material and was measured with every five samples.
The resulting S isotope ratio of an aerosol sample (δ34S) was expressed (Eq. 1) as parts per thousand (‰) relative to the 34S 32S ratio of a standard (Vienna-Canyon Diablo Troilite) (Krouse and Grinenko, 1991).
Among known sources, both Anth-SO and Bio-SO are the main sources of sulfate aerosols in the Arctic environment (Udisti et al., 2016; Park et al., 2017). Data on the S isotope ratio of aerosol particles and the concentrations of major ions enabled estimation of the contributions of biogenic DMS (fBio), anthropogenic SOx (fAnth), and SS-SO (fSS) to the total SO concentration. The concentration of SS-SO was estimated using the seawater ratio of SO to Na+ (0.252; Keene et al., 1986). The NSS-SO fraction of the total SO was then calculated by subtracting the fraction of SS-SO from the total SO. The fraction of biogenic SO was estimated by solving the following equations:
To solve Eqs. (2)–(4) we used the reported S isotope values of SS-SO (21.0 ± 0.1 ‰), Anth-SO (5 ± 1 ‰), and Bio-SO (18 ± 2 ‰) (Norman et al., 1999; Böttcher et al., 2007; Lin et al., 2012). Based on measurements of the S isotope ratio on aerosol samples, then we calculated the fraction of MSA () in the total biogenic sulfur aerosols to evaluate the oxidative pathway of DMS to MSA or to Bio-SO. In calculating RBio, some data (∼ 23 data) having low Bio-SO values (< 25 ng m−3) were not included because unusually low Bio-SO values resulted in biases in the RBio values (Table S1 in the Supplement).
2.4 Black carbon
An aethalometer (model AE31; Magee Scientific Co., USA) installed at the Zeppelin station was used to analyze the concentration of equivalent black carbon by measuring light-absorbing particles at a wavelength of 880 nm, as described by Eleftheriadis et al. (2009). The good congruence between the concentrations of Anth-SO and black carbon measured during the pre-bloom period (March to April) indicates that variations in black carbon were reasonably consistent with variations in Anth-SO, reflecting that both Anth-SO and black carbon had common sources (i.e., fossil fuel combustion and forest burning) (Text S1; Figs. S1 and S2) (Massling et al., 2015; L. Chen et al., 2016).
2.5 Air mass origin, chlorophyll-a concentration, and meteorological parameters
Both 8 d and monthly mean Chl-a concentration level-3 MODIS Aqua data were downloaded from the NASA OceanColor website (http://oceancolor.gsfc.nasa.gov/, last access: 5 August 2020) at a 4 km resolution. The three-dimensional 5 d (120 h) back trajectories were calculated using the Hybrid Single-Particle Lagrangian Integrated Trajectory model from the NOAA Air Resources Laboratory (Draxler and Hess, 1998). Meteorological parameters including solar radiation, relative humidity, and air temperature at each time point were also calculated along the air mass trajectories. The calculations were made based on meteorological data from the Global Data Assimilation System (at 1∘ latitude × 1∘ longitude resolution) produced by the National Centers for Environmental Prediction. Air masses were modeled to arrive at an altitude of 50 m above sea level at the Gruvebadet station at each hour of the study period. To identify the major air mass pathways prior to reaching the Gruvebadet station, the calculated air mass trajectories were grouped into several clusters using the k-means clustering algorithm. Monthly mean air temperature data at 900 hPa were obtained from the European Centre for Medium-Range Weather Forecasts Reanalysis 5 at a 30 km resolution. Sea level pressure data were obtained from the National Oceanic and Atmospheric Administration Physical Sciences Laboratory (http://psl.noaa.gov/, last access: 30 July 2020).
The retention time for air masses in each domain type (including the ocean, marginal ice zone, multi-year ice, and land) was calculated based on the sea ice index at 25 km resolution provided by the National Snow and Ice Data Center (Choi et al., 2019). Note that the marginal ice zone and multi-year ice represent the areas in which the sea ice cover is 15 %–80 % and > 80 %, respectively (Stroeve et al., 2016). The air mass exposure to chlorophyll (EChl) was calculated to estimate the biological exposure history of air masses arriving at the observation site (Arnold et al., 2010; Park et al., 2018), according to Eq. (5):
where Chl is the 8 d mean Chl-a concentration within a radius of 25 km at a given time point (t) along the 5 d air mass back trajectory, and n is the total number of time points for which valid Chl-a values were available.
3.1 Atmospheric DMS mixing ratio
The mixing ratio of atmospheric DMS, the precursor of Bio-SO and MSA, showed considerable (several orders of magnitude) variability at daily to weekly intervals during the bloom and post-bloom periods (Figs. 2a and 3b). As confirmed in other studies (e.g., Arnold et al., 2010; Park et al., 2013; Mungall et al., 2016), the atmospheric DMS mixing ratio generally corresponded to the phytoplankton biomass in the oceans surrounding Svalbard (Figs. 2a and S3). During the bloom period the maximum monthly mean mixing ratio of DMS occurred in May 2015 (68.4 ± 86.8 pptv); an increase in the DMS mixing ratio continued until August of that year, reflecting the persistent phytoplankton biomass producing DMS in the vicinity of Svalbard. Based on our atmospheric DMS concentration data, we conclude that DMS was ubiquitous in the Arctic atmosphere from the phytoplankton bloom to post-bloom periods (Park et al., 2013).
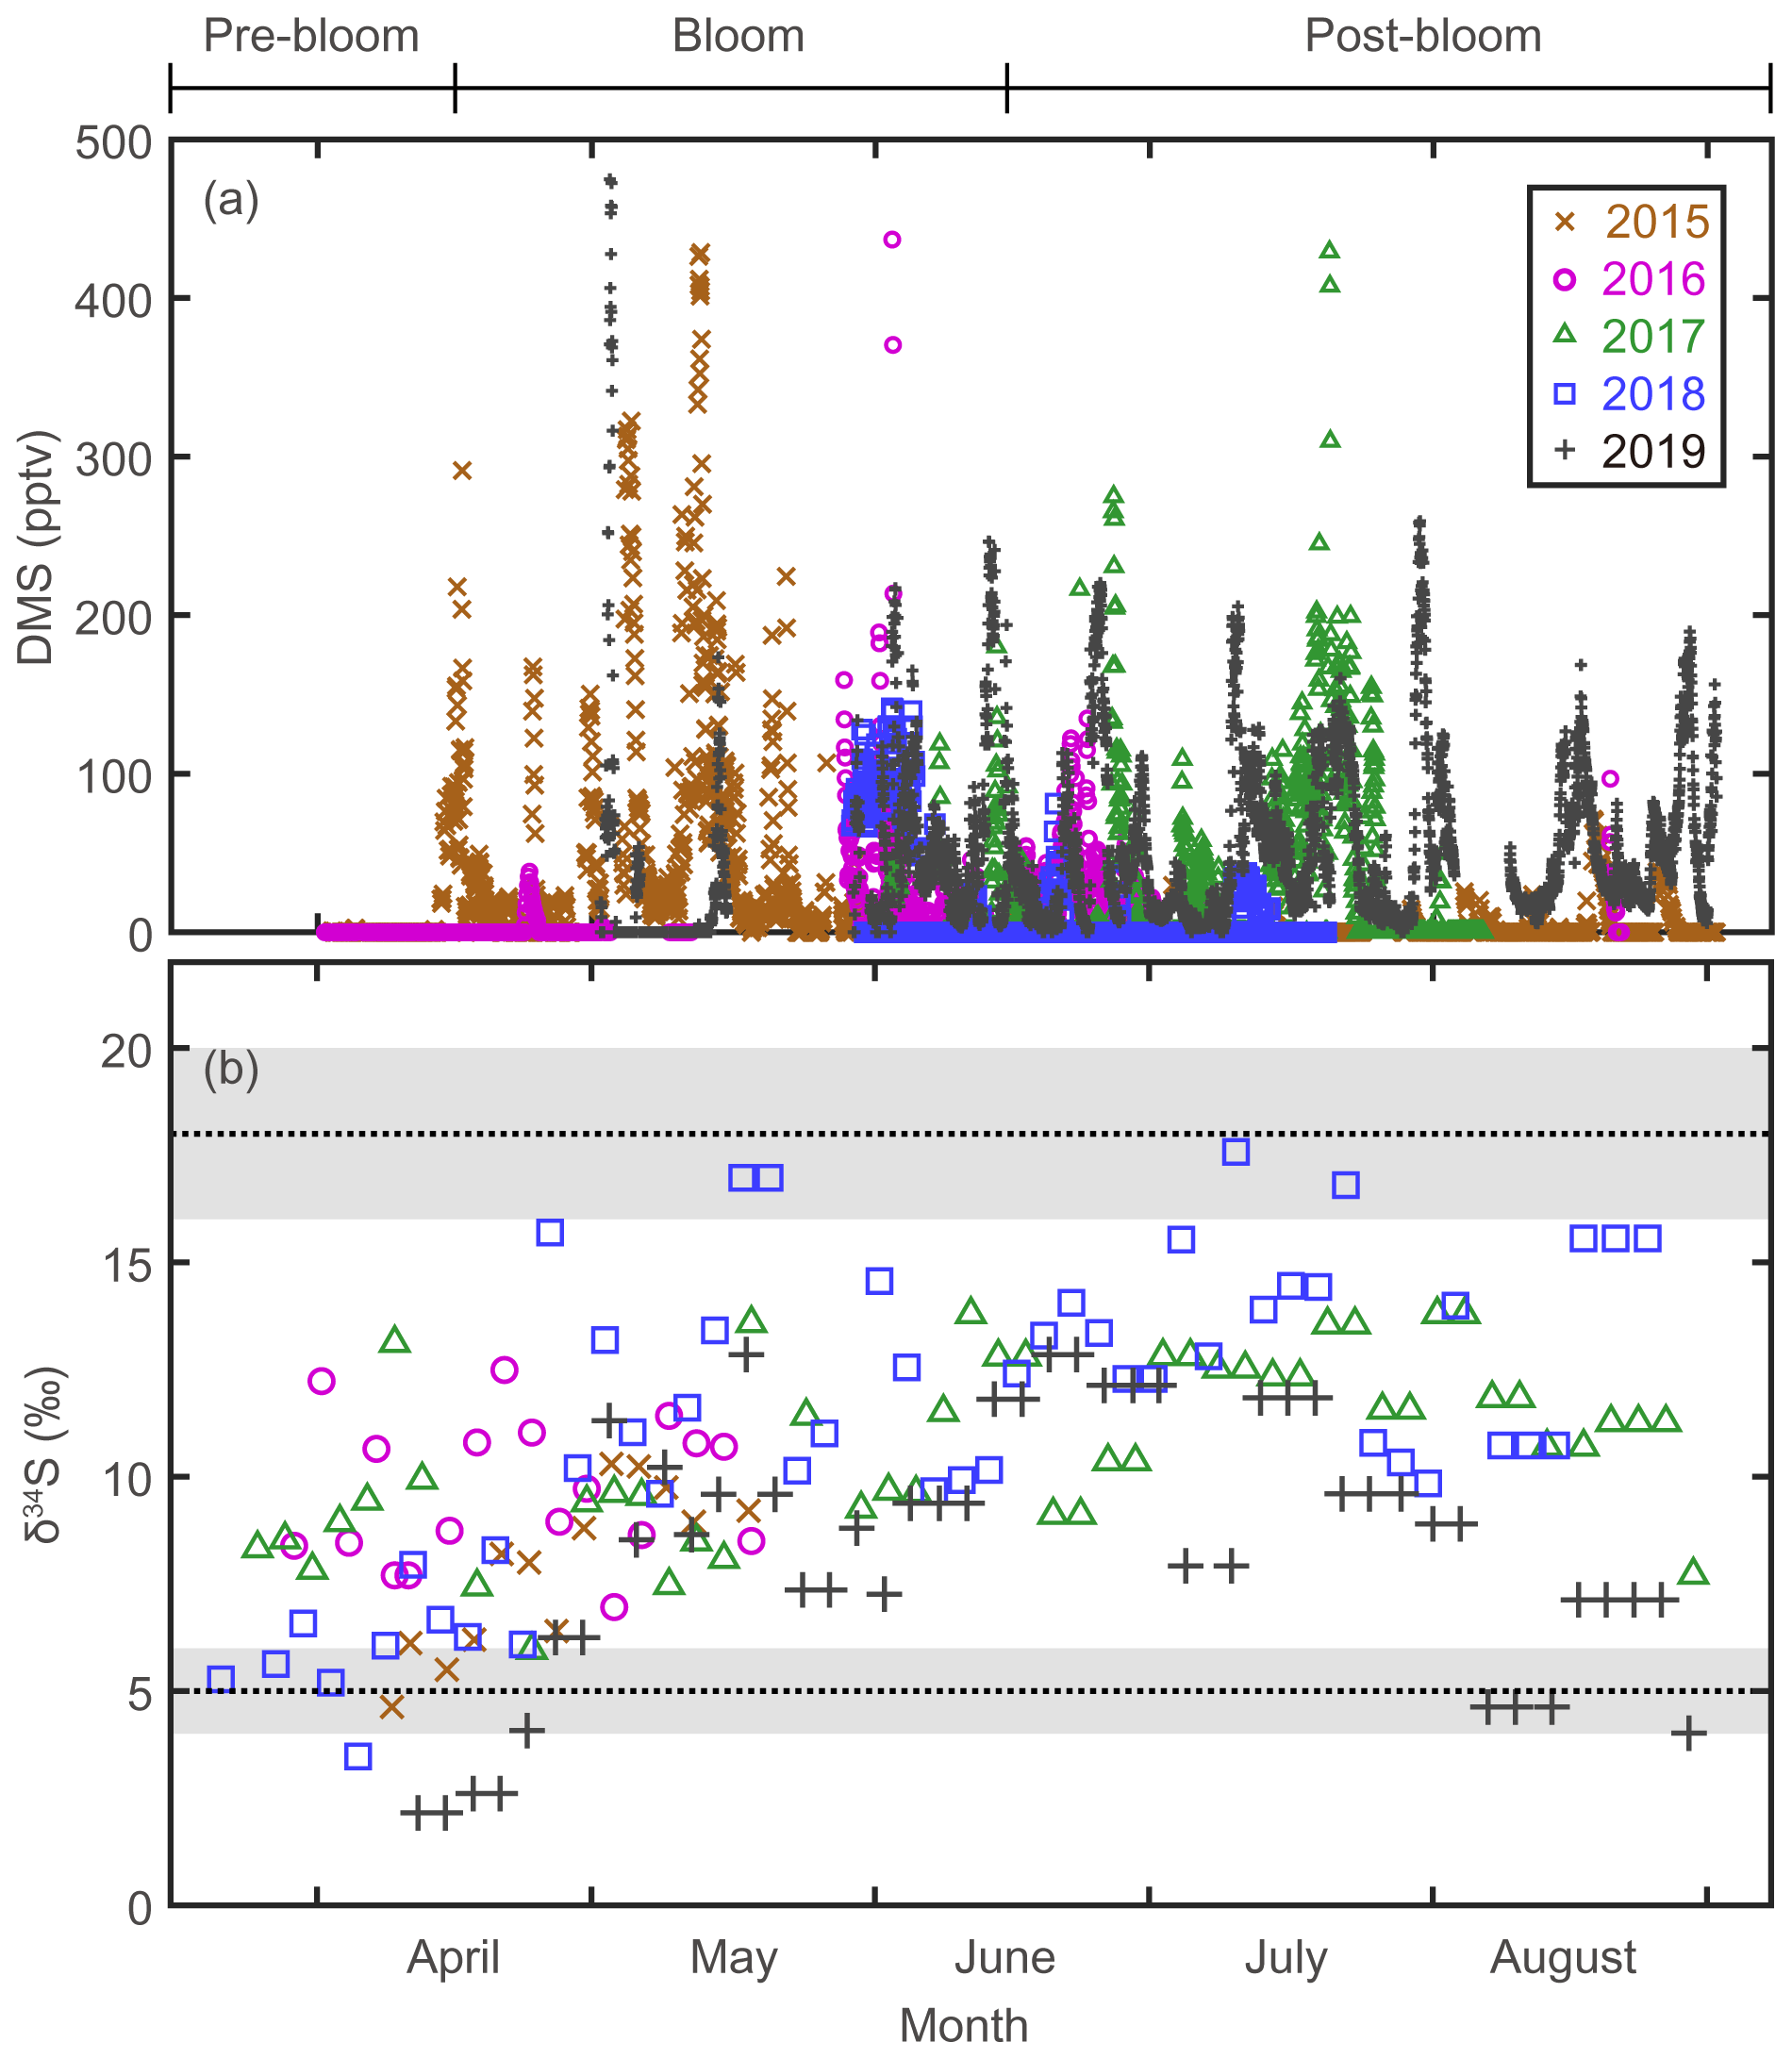
Figure 2(a) Atmospheric DMS mixing ratios measured at the Zeppelin station, Svalbard, in 2015, 2016, 2017, 2018, and 2019. (b) Stable isotope composition of sulfate aerosols. Three end-member values; δ34S ‰ for sea-salt sulfates; δ34S ‰ for anthropogenic sulfate; and δ34S ‰ for biogenic sulfates.
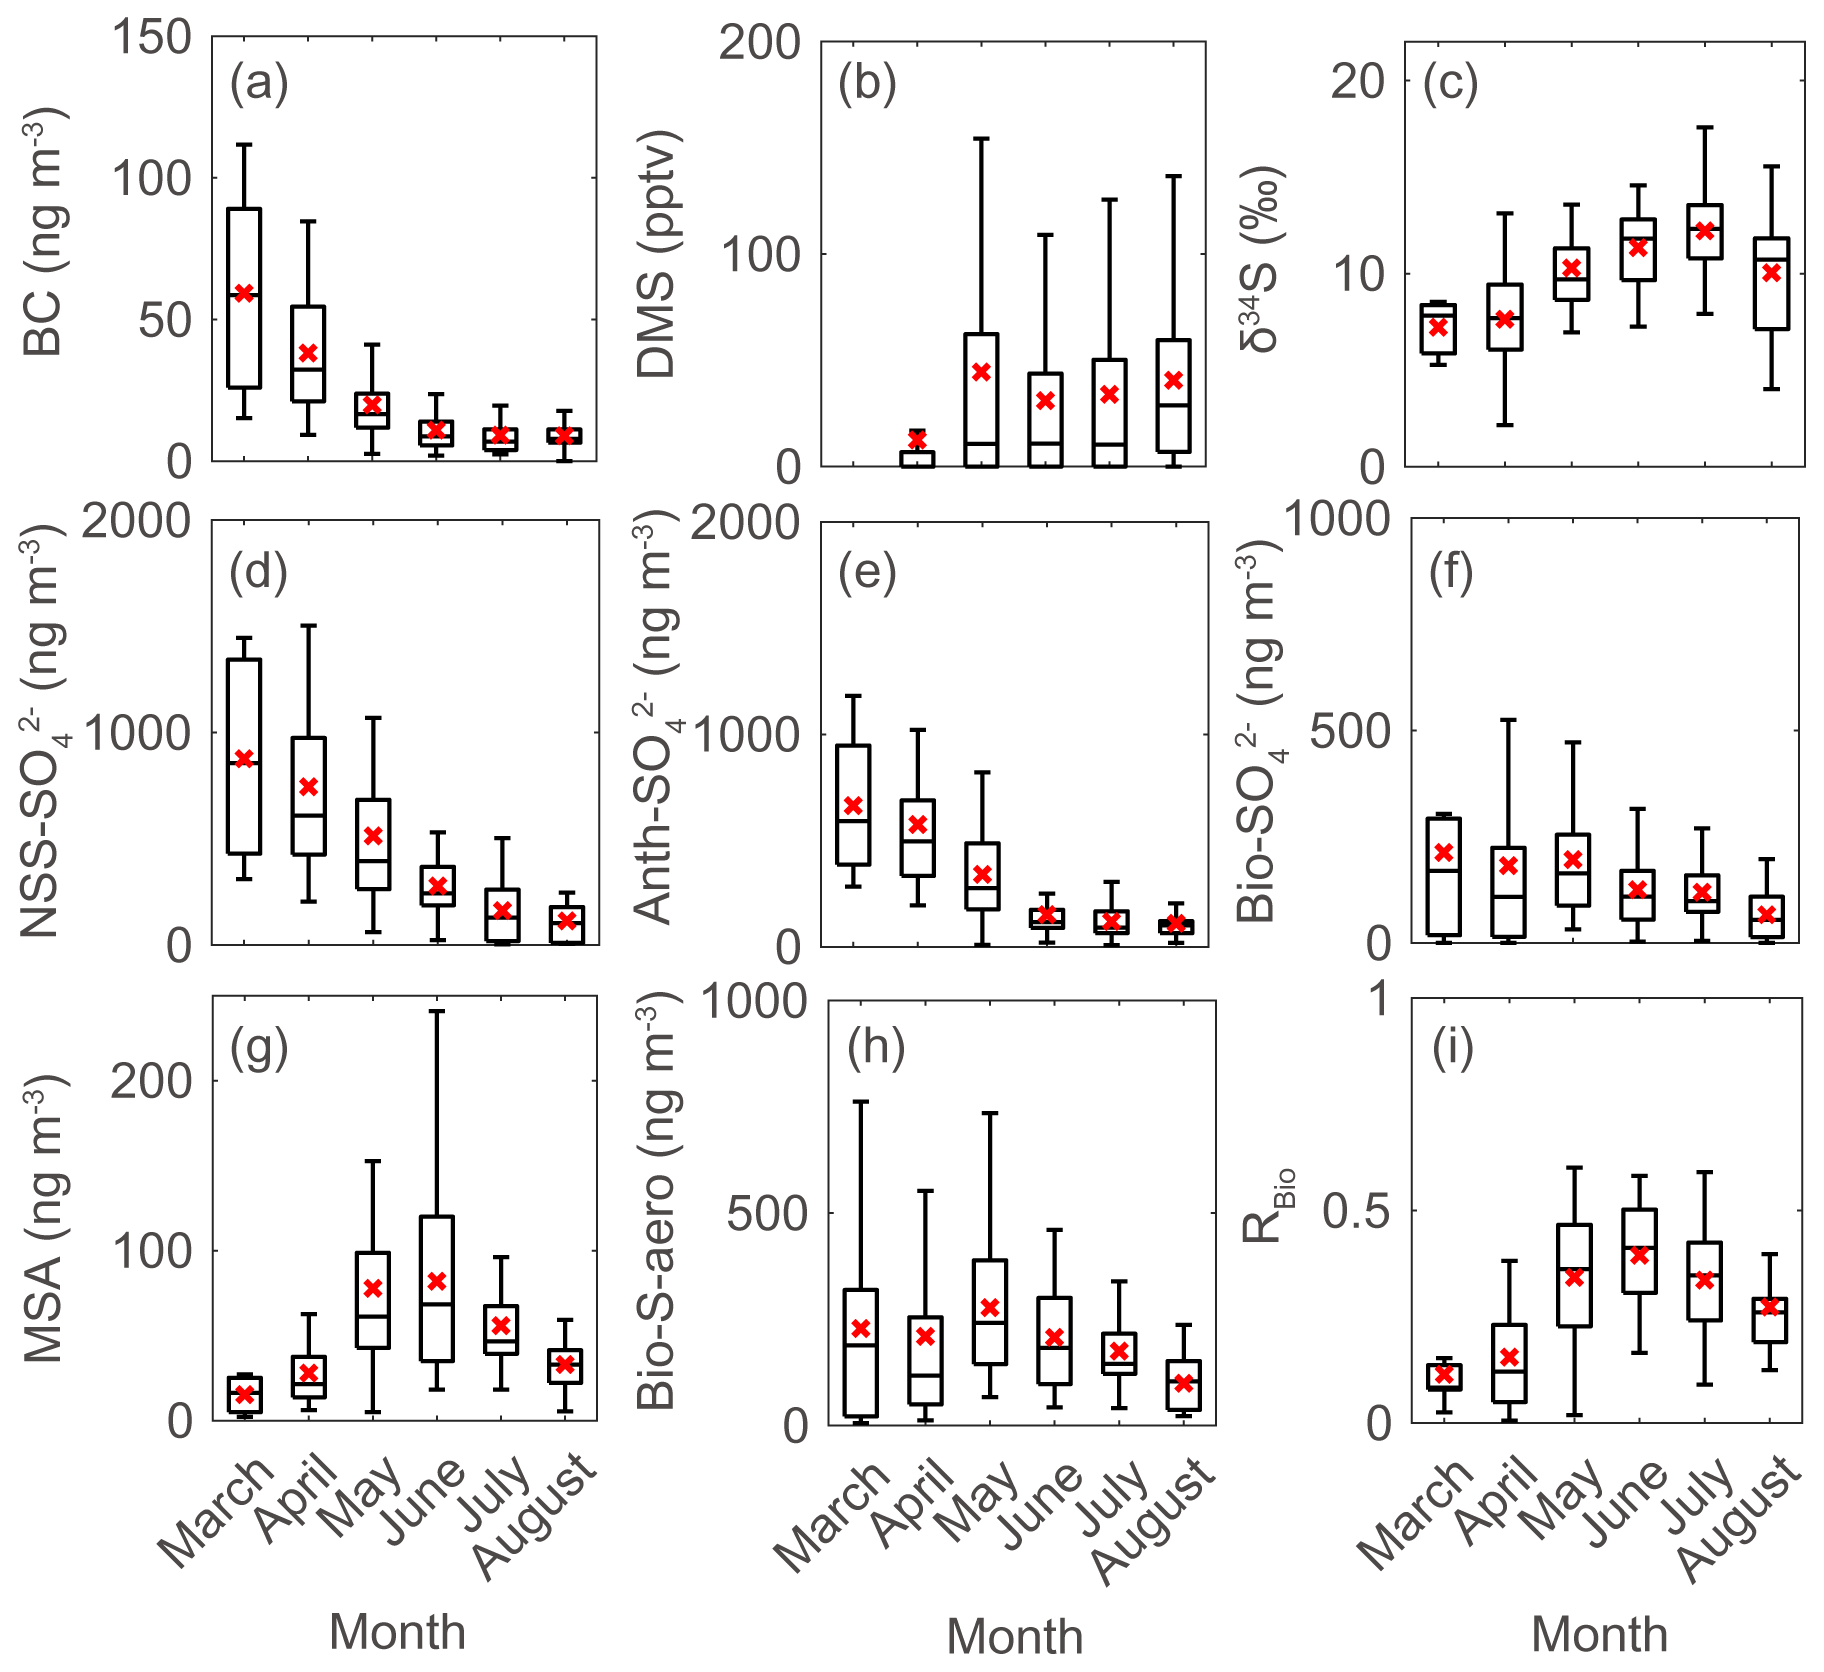
Figure 3Monthly data during the measurement years (2015–2019) for (a) black carbon (BC), (b) atmospheric DMS mixing ratio, (c) sulfur isotope measurements (δ34S), (d) NSS-SO, (e) Anth-SO, (f) Bio-SO, (g) MSA, (h) Bio-S-aerosol, and (i) MSA-to-Bio-S-aerosol ratio (RBio) during the measurement years (2015–2019). Solid lines and red crosses represent the median and mean values of the data, respectively.
3.2 S isotopic composition (δ34S) and sources of sulfate aerosols
The δ34S values for sulfate aerosols ranged from 2.2 ‰ to 17.6 ‰ between March and August (Fig. 2b). In all years of measurement, the δ34S values were low in April or earlier months, rapidly increased towards May to June, and remained high towards August (Fig. 3c). As warming progressed, the trend of increasing δ34S in the sulfate aerosols was broadly consistent with the increasing mixing ratio of atmospheric DMS. The δ34S values for the pre-bloom, bloom, and post-bloom periods averaged over 5 years were 7.5 ± 2.6 ‰, 9.5 ± 2.8 ‰, and 11.3 ± 2.8 ‰, respectively, reflecting an increasing enrichment in the heavier 34S towards summer. The maximum monthly mean δ34S (13.5 ± 2.6 ‰) occurred in July 2018, whereas the lowest mean (3.7 ± 1.8 ‰) occurred in April 2019. The mean pre-bloom δ34S value in 2017 (9.2 ± 1.8 ‰) was higher than in 2018 (5.9 ± 1.2 ‰), whereas the mean bloom and post-bloom δ34S values were marginally lower in 2017 (11.0 ± 2.0 ‰) than in 2018 (12.5 ± 2.8 ‰).
On monthly scales the greatest contribution of Bio-SO occurred in August 2018 (59.4 ± 17.2 %) (Fig. S4). The proportion of Bio-SO among all SO particles was 18.1 ± 16.6 % during the pre-bloom period and then sharply increased to 37.2 ± 21.0 % during the bloom and post-bloom periods, whereas the contribution of anthropogenic SO2 was 79.2 ± 16.9 % during the pre-bloom period and 57.9 ± 21.4 % during the bloom and post-bloom periods. Anth-SO was found to be the largest contributor to total SO during all three periods (Fig. S4), which was consistent with the previous findings (Li and Barrie, 1993; Norman et al., 1999; Udisti et al., 2016).
3.3 NSS-SO, Anth-SO, and biogenic sulfur aerosols
There were considerable seasonal and interannual variations in the concentrations of S aerosols including NSS-SO, Anth-SO, and Bio-S-aerosol (Figs. 3d–h, 4 and 5). In all years of the study the seasonal mean NSS-SO concentration reached a maximum during the pre-bloom period (857 ± 520 ng m−3), decreased rapidly towards summer, and eventually dropped to a quarter of the maximum value during the post-bloom period (212 ± 120 ng m−3). We also found that the NSS-SO concentration in the months prior to May varied by as much as a factor of 3 (1015 ± 586 in 2015 versus 291 ± 93 ng m−3 in 2019). The highest monthly mean NSS-SO concentration (1309 ± 131 ng m−3) was recorded in March 2017, and the lowest was in July 2018 (165 ± 128 ng m−3). The concentration of Anth-SO showed a temporal trend similar to that of NSS-SO, with the highest monthly mean concentration (678 ± 450 ng m−3) occurring during the pre-bloom period, followed by a trend of decrease for the bloom (369 ± 236 ng m−3) and post-bloom (114 ± 78 ng m−3) periods.
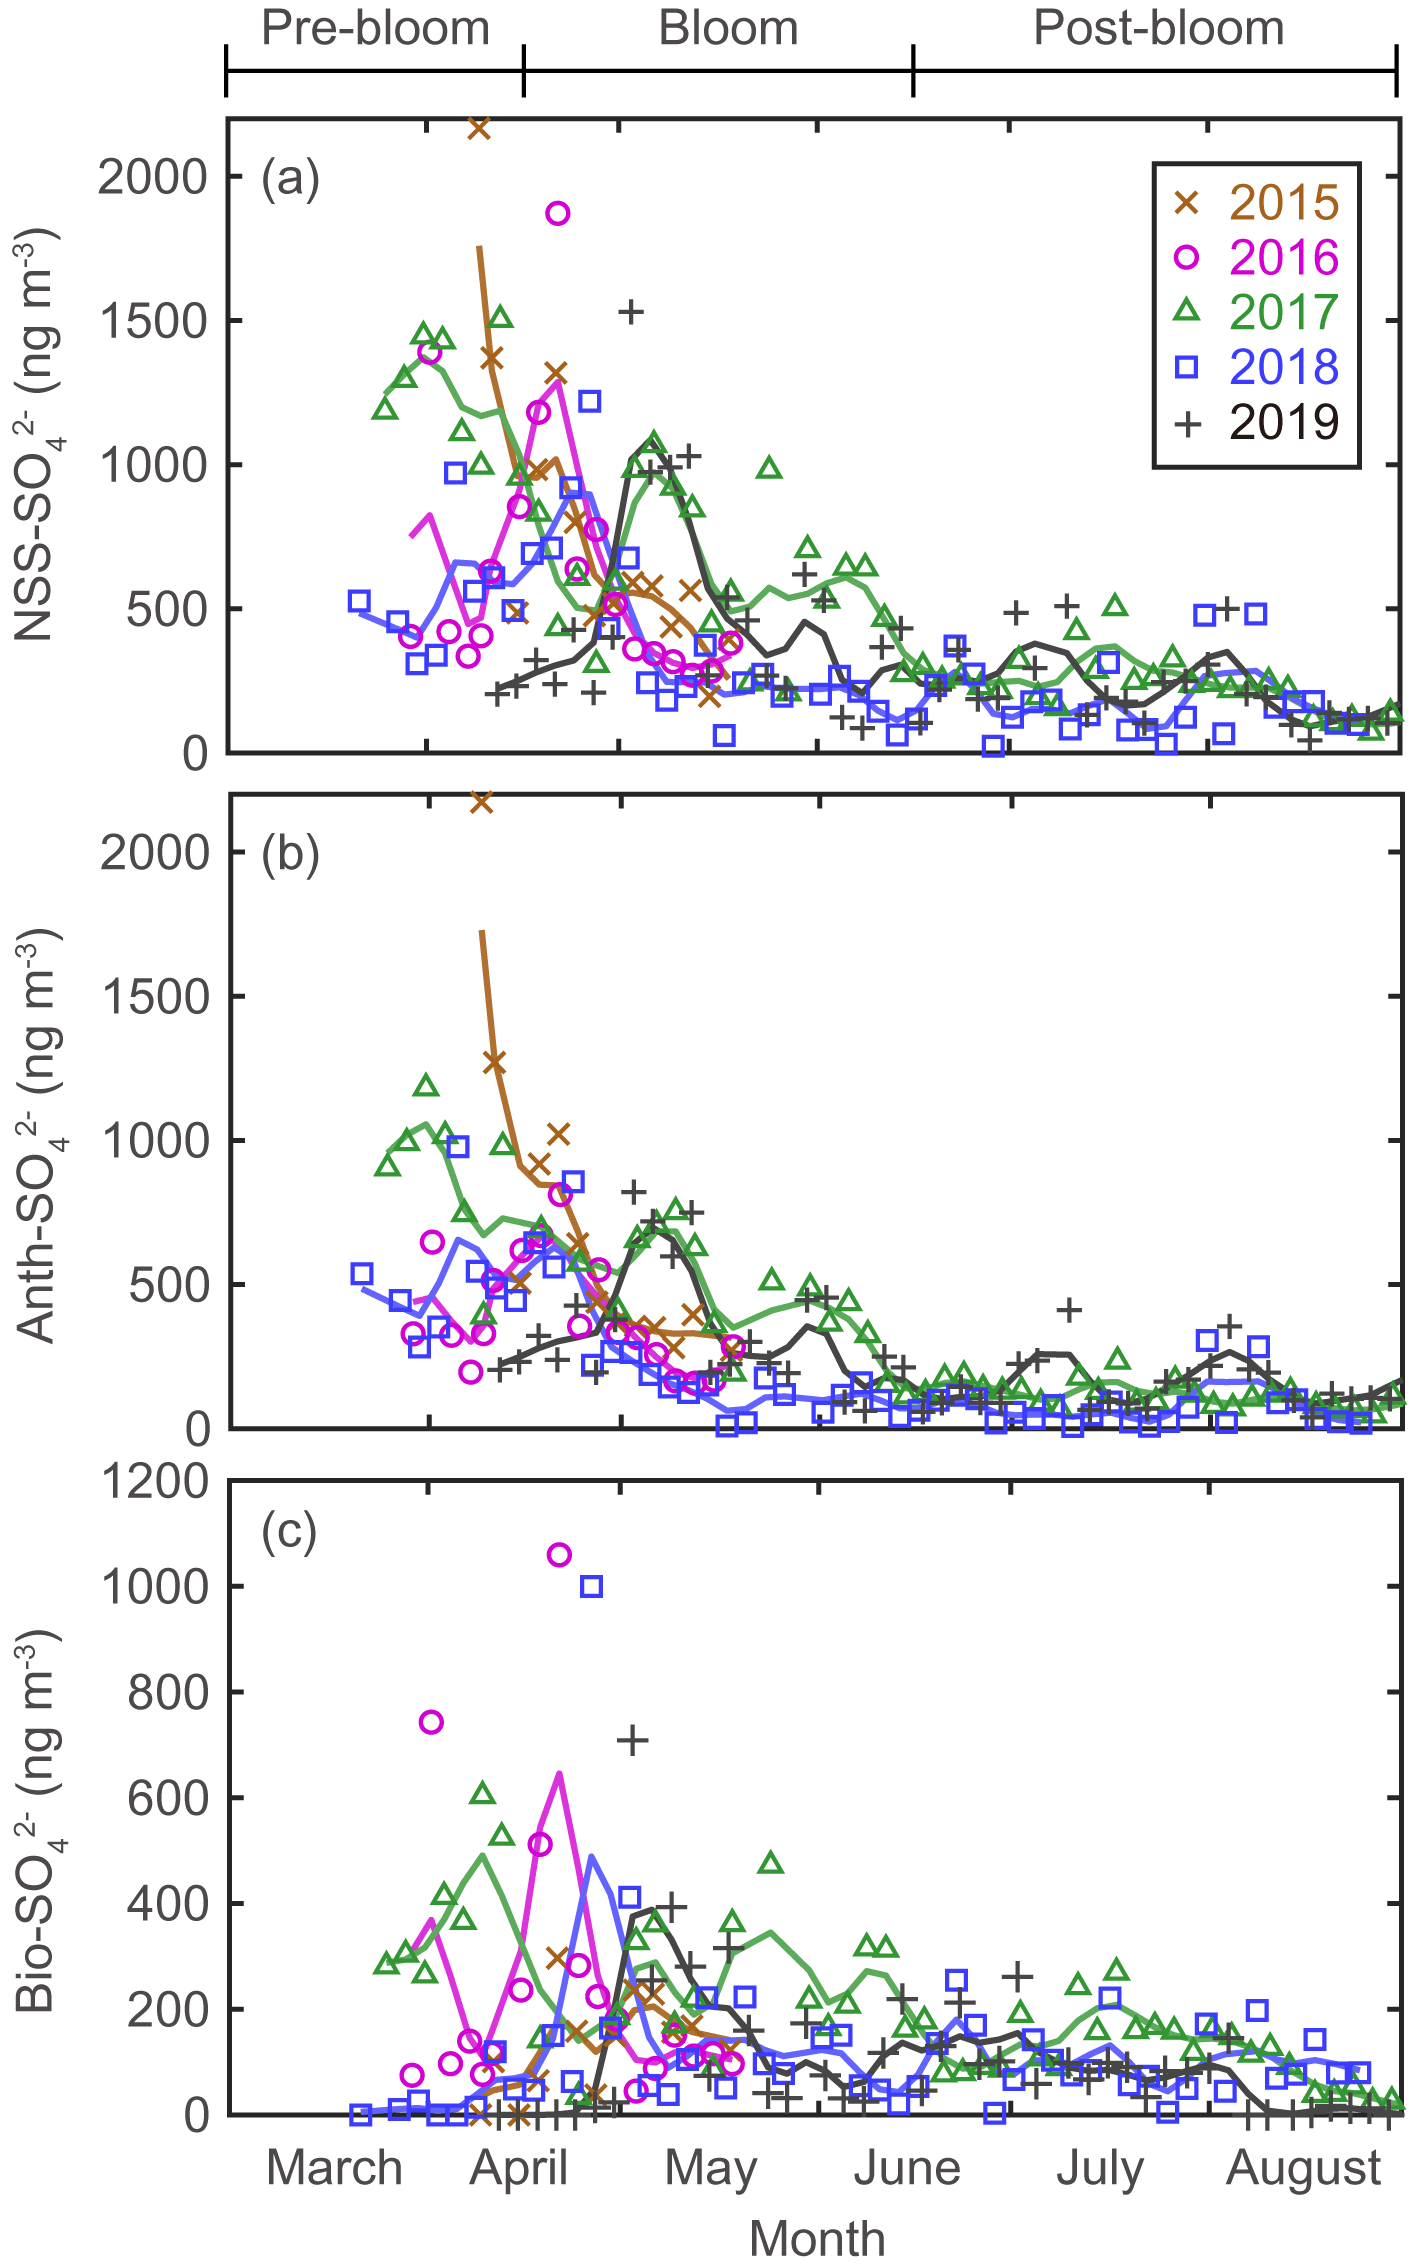
Figure 4Aerosol concentrations for (a) NSS-SO (total SO minus SS-SO), (b) Anth-SO, and (c) Bio-SO. The colored solid lines indicate 15 d moving average values.
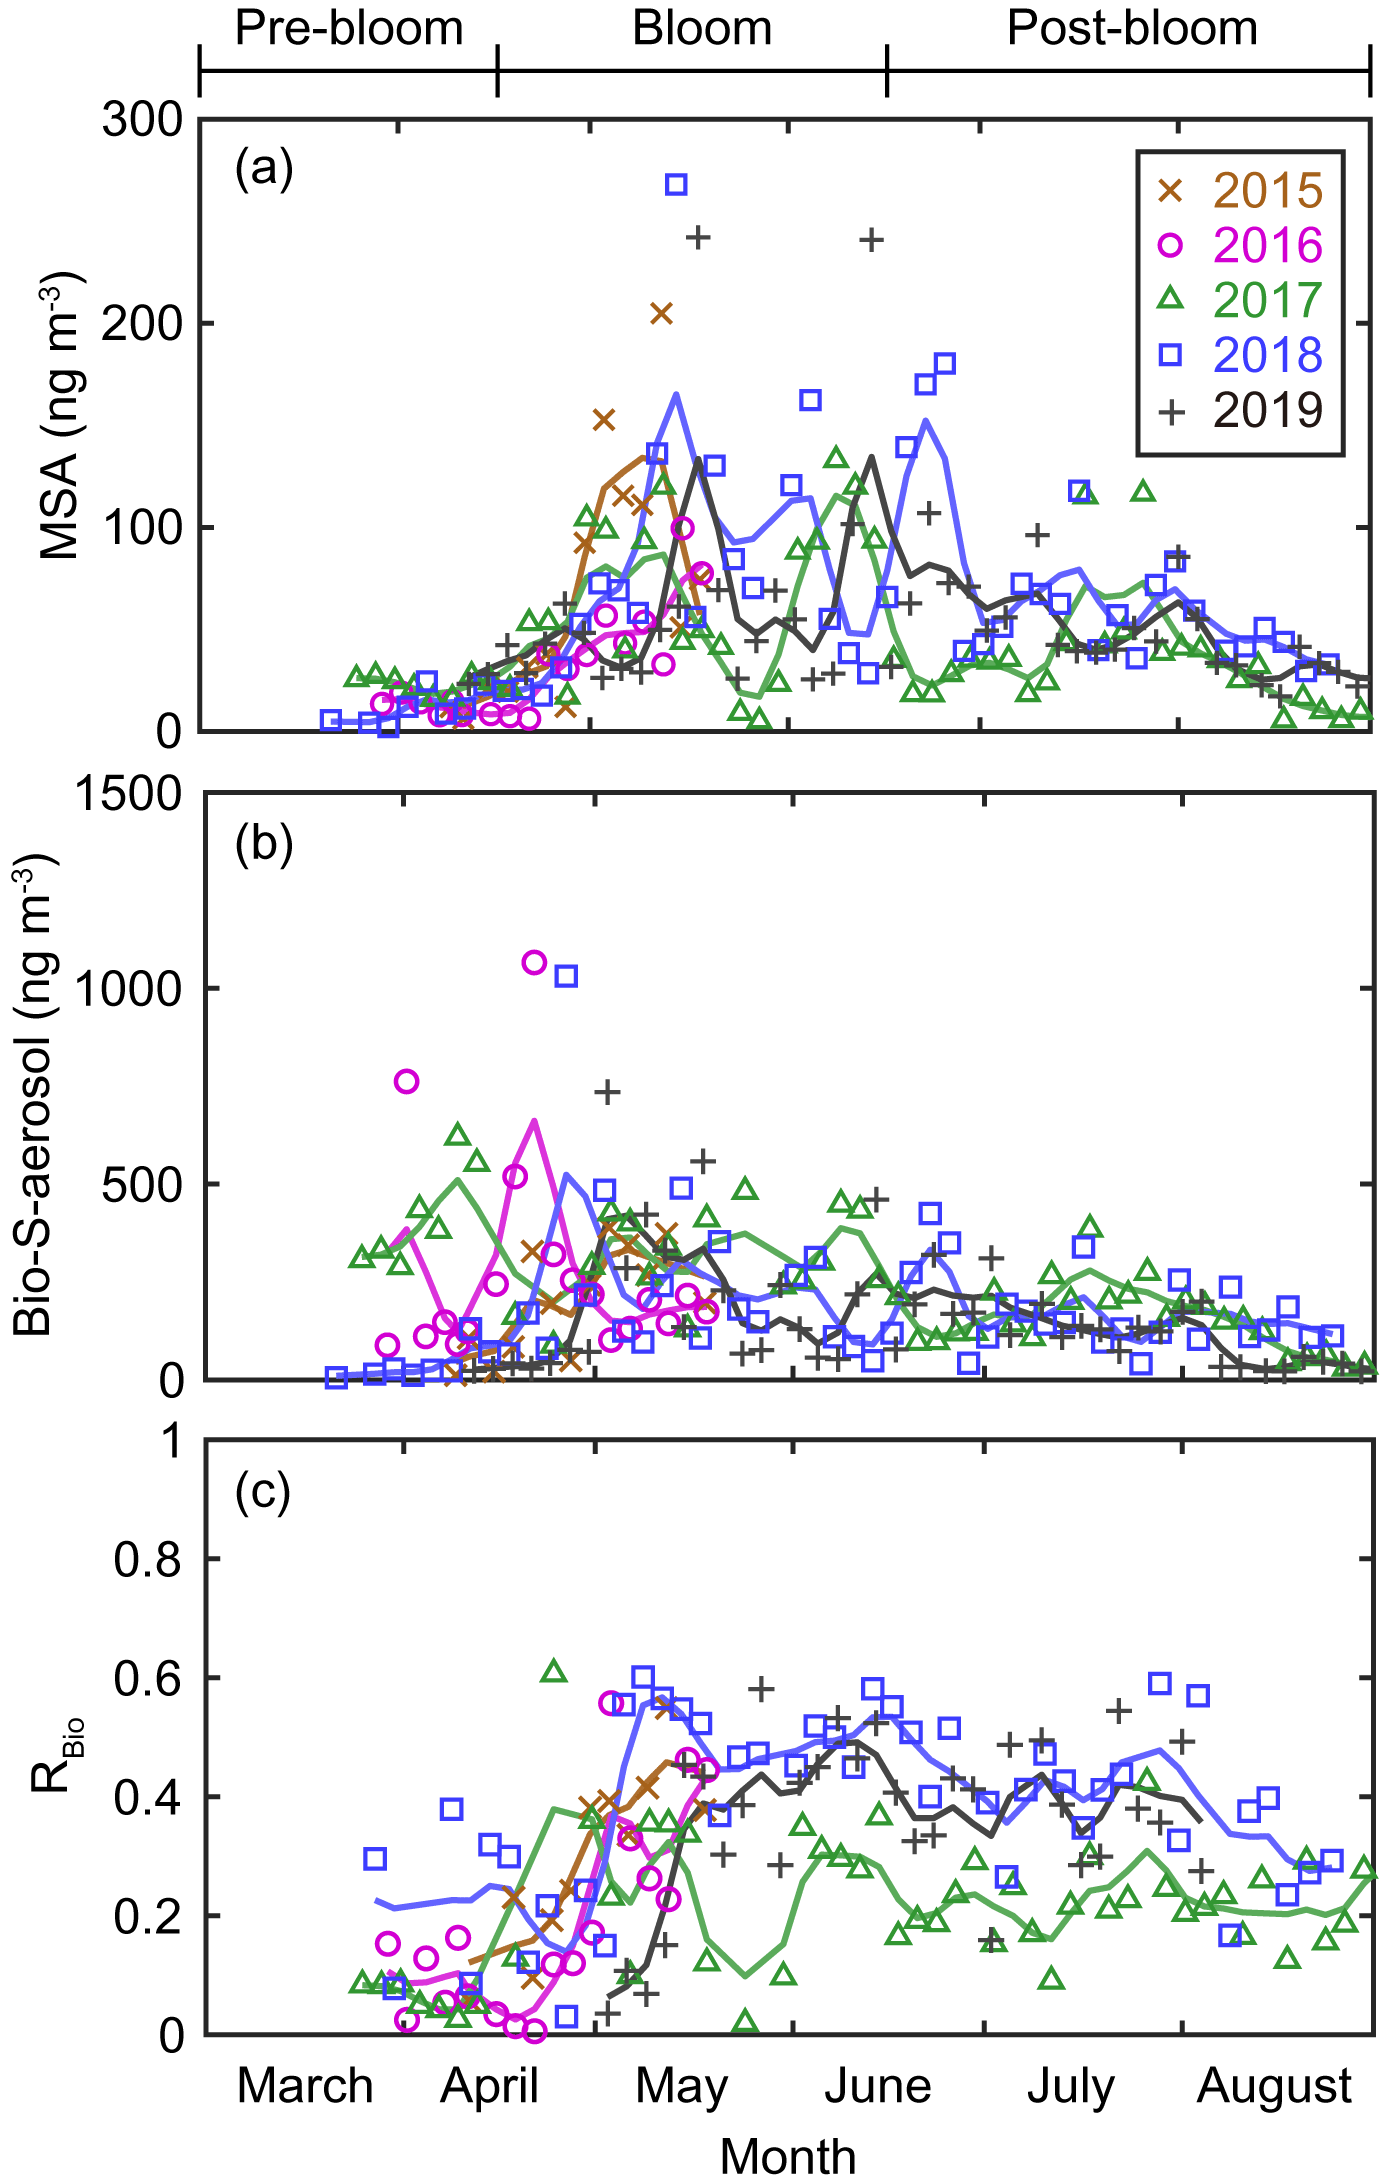
Figure 5Aerosol concentrations of (a) MSA and (b) Bio-S-aerosol (MSA + Bio-SO). (c) Variations in the ratio of MSA to Bio-S-aerosol (RBio). The colored solid lines indicate 15 d moving mean values.
During the pre-bloom period, when the chlorophyll-a concentration remained lower than 0.5 mg m−3 in waters around Svalbard, the concentration of Bio-SO was unexpectedly high (180 ± 213 ng m−3), reaching 743 ng m−3 in 2016 (Fig. 4c). During the phytoplankton bloom period, the seasonal mean concentration of Bio-SO was highest (184 ± 190 ng m−3). As summer approached, the Bio-SO concentration decreased slightly during the post-bloom periods (98 ± 68 ng m−3; Fig. 4c). In contrast to the trend for Bio-SO, the MSA concentration remained low (< 30 ng m−3) during the pre-bloom period and rapidly increased during the transition from the pre-bloom to bloom periods (Figs. 3g and 5a). An elevated MSA concentration was maintained during much of the bloom and post-bloom periods, and then it decreased slightly to near the detection limit by the end of August. The highest monthly mean MSA concentrations were found in May (81.4 ± 58.1 ng m−3) and June (81.9 ± 56.5 ng m−3), which broadly agree with previous MSA measurements at Svalbard (Becagli et al., 2019). The annual mean concentrations of MSA (March to August) varied slightly among years (46.2 ± 35.9 ng m−3 in 2017, 63.5 ± 52.9 ng m−3 in 2018, and 55.4 ± 45.5 ng m−3 in 2019). The Bio-S-aerosol concentration increased with the onset of the spring bloom and stayed at moderate levels until June (Figs. 3h and 5b). The concentration of Bio-S-aerosol during the bloom period (252 ± 197 ng m−3) was slightly higher than that during post-bloom period (149 ± 91 ng m−3), and the highest monthly concentration of Bio-S-aerosol was found in April or May in all measurement years. The total concentrations of Bio-S-aerosol during the bloom and post-bloom periods were comparable in all 3 years (214 ± 124 ng m−3 in 2017, 204 ± 174 ng m−3 in 2018, and 160 ± 153 ng m−3 in 2019).
3.4 Ratio of MSA to Bio-S-aerosol (RBio)
In all years of this study the RBio values derived from δ34S data were lowest during the pre-bloom period and increased in the transition to the spring bloom, as biogenic DMS production peaked (Figs. 3i and 5c). The RBio value varied by a factor of 3 over seasons, showing maximum values during the bloom period (0.32 ± 0.17) and lowest values during the pre-bloom period (0.09 ± 0.07). The highest mean RBio (0.49 ± 0.05) was found in June 2018, whereas the lowest RBio (0.08 ± 0.01) was found in March 2017. There were large interannual variations in the seasonal mean RBio (0.24 ± 0.11 in 2017, 0.40 ± 0.14 in 2018, and 0.36 ± 0.14 in 2019) during the bloom and post-bloom periods.
Similar RBio values were also reported at Ny-Ålesund. For example, Udisti et al. (2016) reported a MSA-to-Bio-SO ratio of 0.33 (RBio=0.25) during the spring–summer period in 2014. This ratio was derived from a multi-seasonal asymptotic value in a plot between the MSA-to-NSS-SO ratio and the MSA concentration. Implicit in this calculation is the assumption that the fraction of Bio-SO in the total NSS-SO aerosols is overwhelming when the MSA-to-NSS-SO ratio approaches the asymptotic value (Udisti et al., 2016; Park et al., 2017). Other investigators also reported comparable RBio values in other Arctic environments: 0.18–0.20 at the central Arctic Ocean (Chang et al., 2011b; Leck and Persson 1996), 0.28 at the eastern Antarctic Plateau (Udisti et al., 2012), and 0.28 at Alert (Norman et al., 1999). These RBio values were all derived from a multi-seasonal asymptotic value in a plot between the MSA-to-NSS-SO ratio and MSA concentration. The analytical accessibilities associated with measurements of MSA and NSS-SO concentration (i.e., less laborious and requires fewer aerosols than is needed for the technique measuring the S isotope ratio) make data on the MSA-to-NSS-SO ratio more widely available.
4.1 Factors affecting variations in the S aerosol concentration in the Arctic atmosphere
Seasonal variations in NSS-SO aerosols were strongly associated with variations in Anth-SO. In particular, the tight association of these parameters indicates that Anth-SO aerosols were the largest contributor to NSS-SO during the pre-bloom period, when the intrusion of Arctic haze is considerable (Figs. S4 and S5). During the transition from the pre-bloom to bloom periods, the input of Anth-SO particles to our study area rapidly decreased because of weakening of the northward transport of air masses (containing Anth-SO) from Europe and increasing removal of Anth-SO aerosols by increasing precipitation as the seasons progress (Li and Barrie, 1993) (Fig. 4b). The decreasing input of Anth-SO particles to the observation site during the bloom and post-bloom periods was also independently confirmed by the trend of decrease in the measured black carbon concentration at our observation site (Figs. 3a and S2).
The large interannual variability in NSS-SO from March to April was strongly associated with changes in the trajectory of the air masses reaching Svalbard and the sea level pressure along those air mass trajectories (Fig. 6). More explicitly, the higher concentrations of NSS-SO particles in 2015 (1015 ± 586 ng m−3) resulted from the greater input of pollutants (Anth-SO) from northern Europe via the intensified southwesterly wind, whereas the opposite occurred in 2018 and 2019 (634 ± 266 for 2018 and 291 ± 93 ng m−3 for 2019).
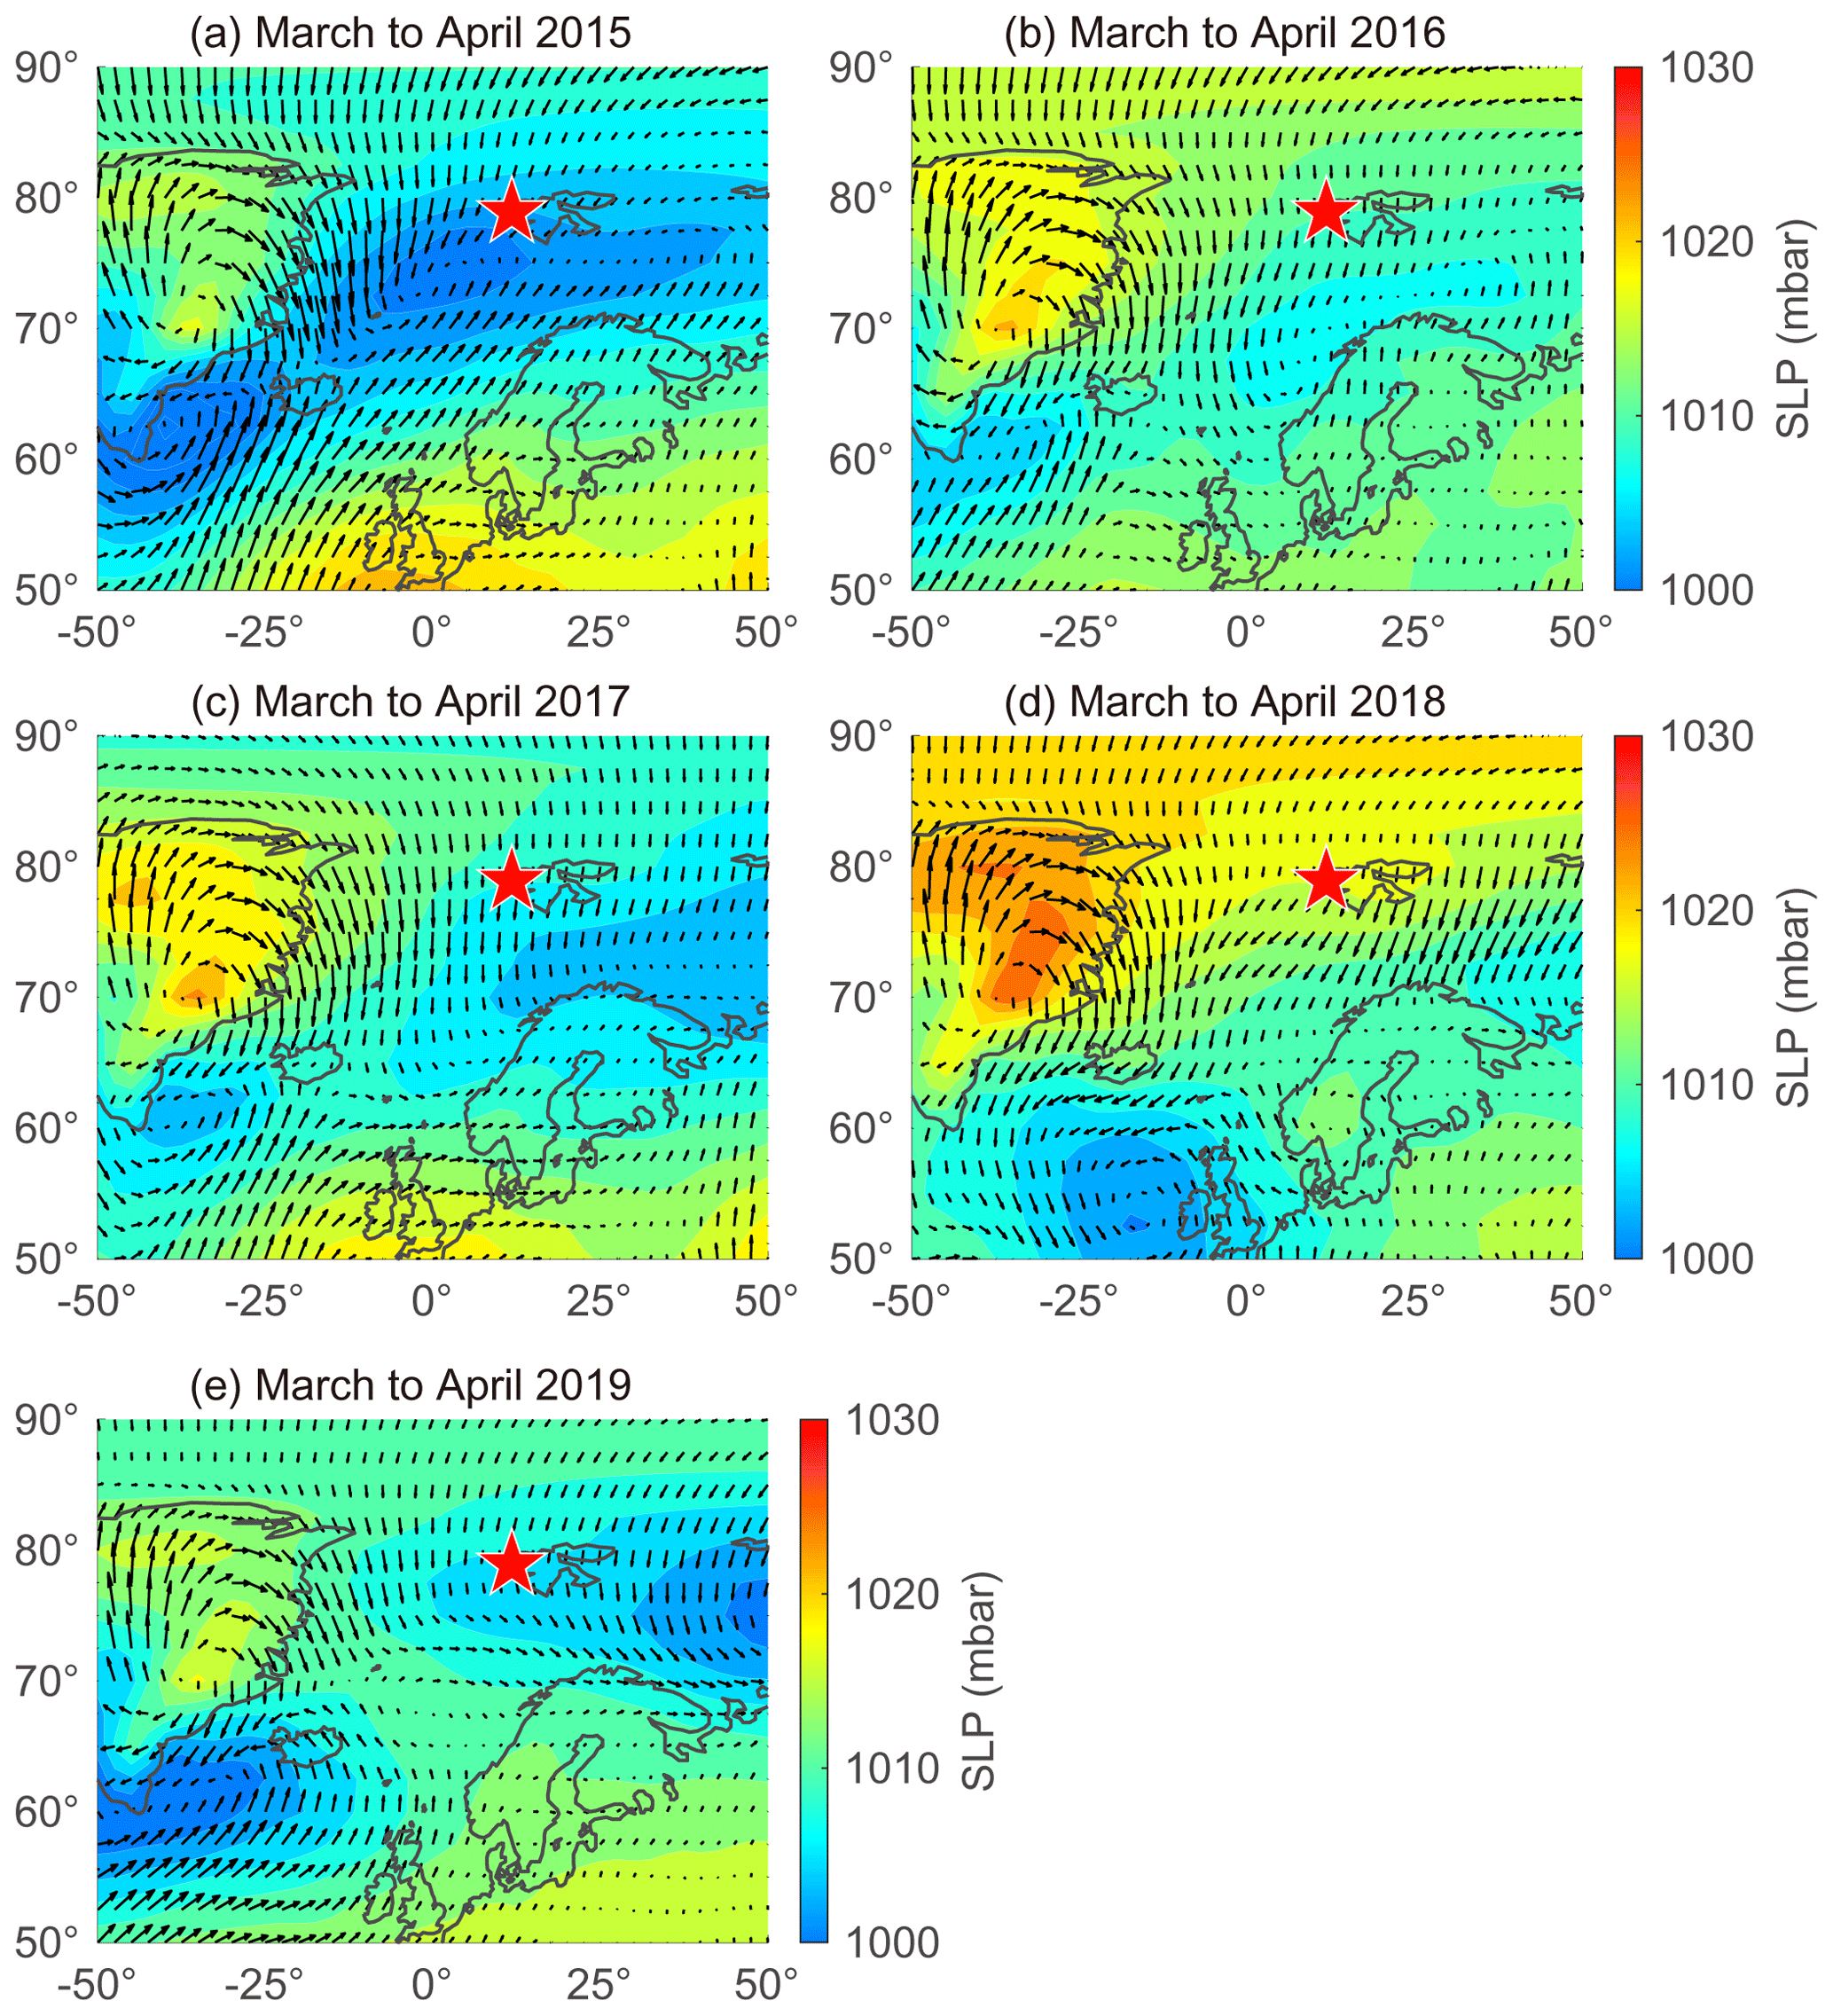
Figure 6Sea level pressure (SLP) overlaid with wind vectors during March to April in (a) 2015, (b) 2016, (c) 2017, (d) 2018, and (e) 2019. Red stars indicate the location of the sampling site (Gruvebadet observatory; 78.9∘ N, 11.9∘ E).
Unusual elevation of the Bio-SO concentration was occasionally found in the oceans surrounding Svalbard during the pre-bloom period in 2016 and 2017, despite low biological activity (as indicated by DMS mixing ratios of < 10 pptv) (Figs. 4c and S6). The spikes in the Bio-SO concentration likely originate from Bio-SO aerosols that were produced in distant ocean regions (e.g., the North Atlantic Ocean, the Norwegian Sea, and further south of 50–70∘ N and 25∘ W–50∘ E) and then carried into the Arctic via a northward transport of air masses. Analysis of air mass back-trajectory data showed that the elevated values of Bio-SO during the pre-bloom period in 2016 and 2017 resulted from air masses from lower-latitude regions reaching Svalbard rather than originating locally from the oceans around Svalbard, while the much lower Bio-SO concentrations in 2018 probably resulted from an absence of air masses originating from distant DMS source regions during the pre-bloom period (Figs. 4c and S7).
The MSA concentration remained low during the pre-bloom period (i.e., no apparent high peaks), largely because of the greater removal of MSA relative to Bio-SO aerosols during long-range transport to Svalbard from the distant source regions to the south. For example, MSA tends to more easily condense onto existing particles (Hoppel, 1987; Pszenny et al., 1989) because of its higher vapor pressure and is thus more rapidly removed from the atmosphere with larger particles through wet deposition; this results in greater loss of MSA relative to SO. Greater enrichment of MSA occurs in super-micron-sized particles than in submicron particles (Legrand and Pasteur, 1998). The higher ratios of MSA to NSS-SO in rainwater and fresh snow than in aerosol particles is also indicative of the greater removal of MSA (Berresheim et al., 1991; Jaffrezo et al., 1994). The production mechanism of MSA (via DMS oxidation by OH radicals) (Gondwe et al., 2004) could also lower the MSA concentration during the pre-bloom period, when the low levels of OH radicals (as a result of low light conditions) resulted in less MSA production. The elevations of MSA occurred in May or June, when the production of OH radicals was high and associated with increasing solar radiation and biological production (Fig. S8 and S9a).
The concentrations of Bio-S-aerosol during the bloom and post-bloom periods were comparable in all 3 years (214 ± 124 ng m−3 in 2017, 204 ± 174 ng m−3 in 2018, and 160 ± 153 ng m−3 in 2019), despite differing phytoplankton biomass (derived from Chl-a) among those years (Fig. S9b). This mismatch has been reported previously and suggests that estimations of marine organic aerosols based on Chl-a data only are unreliable (Rinaldi et al., 2013). In particular, the summer DMS-driven aerosols produced from the Barents Sea were not proportional to the Chl-a concentrations (Becagli et al., 2016). Different compositions of phytoplankton species in different ocean domains (Greenland Sea versus Barents Sea) could also result in changes in DMS production because phytoplankton have differing cellular levels of dimethylsulfoniopropionate (DMSP; a precursor of DMS) and the DMSP cleavage enzyme (enabling the transformation of DMSP to DMS) (Park et al., 2014b). The DMS production capacity in the Greenland Sea (where prymnesiophytes dominate) was found to be 3-fold higher than that in the Barents Sea (where diatoms dominate) (Park et al., 2018). Other studies have also reported that the concentrations of MSA or Bio-SO do not always follow the atmospheric DMS mixing ratio, highlighting the involvement of other factors in the oxidation of DMS to MSA or Bio-SO (Read et al., 2008; Yan et al., 2020a). Therefore, the amounts of DMS produced and its oxidation products may not be solely explained by variations in the ocean biomass.
In the Arctic summer atmosphere the low abundance of large particles (i.e., Aitken and accumulation mode) could probably enhance the formation of new particles via the gas-to-particle conversion process and the ultimate initiation of CCN formation (Boy et al., 2005; Dall'Osto et al., 2018). The concurrent increase in biogenic sulfate aerosols and small-sized particles (3–10 and 10–100 nm, respectively) reported for the Arctic atmosphere in May (Park et al., 2017) is a prime example that biogenic DMS is a major contributor to NPF. A model study reported that DMS enhanced the mass of sulfate particles in the size range 50–100 nm in regions north of 70∘ N (Ghahremaninezhad et al., 2019). During the bloom and post-bloom periods a decline in anthropogenic sources and an increase in oceanic DMS source strength resulted in the transition of major sulfate sources from Anth-SO to Bio-SO, which highlights the increasing importance of biogenic sulfur aerosols in the summer Arctic atmosphere. Biogenic organic aerosols in the high Arctic were reported to contribute considerably to the concentrations of ultrafine and CCN particles from summer to early autumn when anthropogenic source is lowest (Dall'Osto et al., 2017; Lange et al., 2019). Nonetheless, Anth-SO contributed considerably to the total SO budget during the post-bloom period, indicating that even in summer the Anth-SO transported from Europe or local emissions can exert a significant influence on the sulfate budget in the Arctic atmosphere (Fig. S4) (L. Chen et al., 2016; Gogoi et al., 2016; Dekhtyareva et al., 2018).
4.2 Factors influencing the DMS oxidation pathways to either MSA or Bio-SO (RBio)
4.2.1 Seasonal variations in RBio
Our data spanning 5 years show two distinctive trends in RBio among seasons or years. The first is that the values of RBio during the bloom and post-bloom periods (0.32 ± 0.15) were a factor of 3 higher than the pre-bloom values (0.09 ± 0.07) (Fig. 5c). The large seasonal difference in RBio could be explained by known factors including the concentration of OH radicals (directly influenced by light intensity), air temperature (determining the oxidation pathway of DMS to either MSA or Bio-SO), the chemical properties of existing particles (e.g., the black carbon concentration) (e.g., Saltzman et al., 1986; Gondwe et al., 2004; Yan et al., 2020b), and biological activities near observation site. Among those, a major factor is the concentration of OH radicals. BrO radicals also help facilitate the addition pathway in the oxidation of DMS, even at concentrations > 1 pptv level (von Glasow and Crutzen, 2004). It has been hypothesized that the reactive bromines produced photochemically and heterogeneously at sea ice and snowpack surfaces lead to the BrO enrichment over ice-covered regions (Abbatt et al., 2012; Fernandez et al., 2019). Therefore, a high light intensity would favor the oxidation pathway of DMS to MSA, because this pathway is effectively mediated by photochemically activated species including OH and BrO. The solar radiation (51.3 ± 36.1 W m−2) over the distant DMS source regions during the pre-bloom period was much lower than over the Greenland Sea and the Barents Sea during the bloom (243.0 ± 63.4 W m−2) and post-bloom (222.5 ± 70.5 W m−2) periods (Fig. 7). The low OH radical and reactive bromine concentrations during the pre-bloom period probably lowered the production of MSA from DMS oxidation (i.e., weakening the addition pathway) and thereby resulted in the lower RBio value (0.09 ± 0.07) than was found during the bloom (0.32 ± 0.17) and post-bloom (0.32 ± 0.13) periods (Table S2). Consequently, solar radiation was likely to be a major driver of the seasonal RBio change in the Arctic atmosphere.

Figure 7Five-year (2015, 2016, 2017, 2018, and 2019) mean radiation (red) and RBio (blue) during the pre-bloom, bloom, and post-bloom periods. The solid line and dotted line represent median and mean value of each data in a box plot, respectively.
The chemical properties of existing particles could influence the seasonal variations in RBio. Explicitly, the uptake of gaseous MSA onto particles was found to be sensitive to the chemical properties of those particles (Yan et al., 2020b). In particular, hydrophobic and acidic particles in the atmosphere tended to hinder the adhesion of gaseous MSA to particles, while alkaline sea-salt particles tended to accelerate the adhesion process (Pszenny, 1992; Jefferson et al., 1998; Yan et al., 2020b). Elemental carbon particles emitted from fossil fuel combustion are highly hydrophobic, and sulfates in the aerosol particles are acidic. However, only a small proportion of the anthropogenic particles formed in the polluted coastal and urban sites was found to be associated with MSA (Gaston et al., 2010; Yan et al., 2020b) formed from the oxidation of aqueous DMS catalyzed by iron and vanadium (Gaston et al., 2010; Moffett et al., 2020). Therefore, the air masses (rich in black carbon and sulfate) that originate from northern Europe probably have PM2.5 particles containing low MSA concentrations, despite the fact that those air masses swept through productive ocean areas during the pre-bloom period (Fig. 5a). In contrast, during the bloom period we found an elevation of the MSA concentration, primarily as a result of two reinforcing processes: the greater DMS oxidation to MSA, and the enhanced condensation of gaseous MSA to the existing particles under less hydrophobic and acidic conditions. For each group of RBio values, the lower concentrations of black carbon and sulfate resulted in the greater uptake of gaseous MSA and thereby resulted in higher RBio values (Fig. 8). We also found significant inverse correlations between black carbon and RBio (; Fig. 9a) and between total SO and RBio (; Fig. 9b); these tight correlations substantiate the importance of the chemical properties of atmospheric particles in determining the rate of uptake of gaseous MSA by the particles present in air. The number of samples measured during the bloom and post-bloom periods was higher in the groups having large RBio values (Fig. 8c).
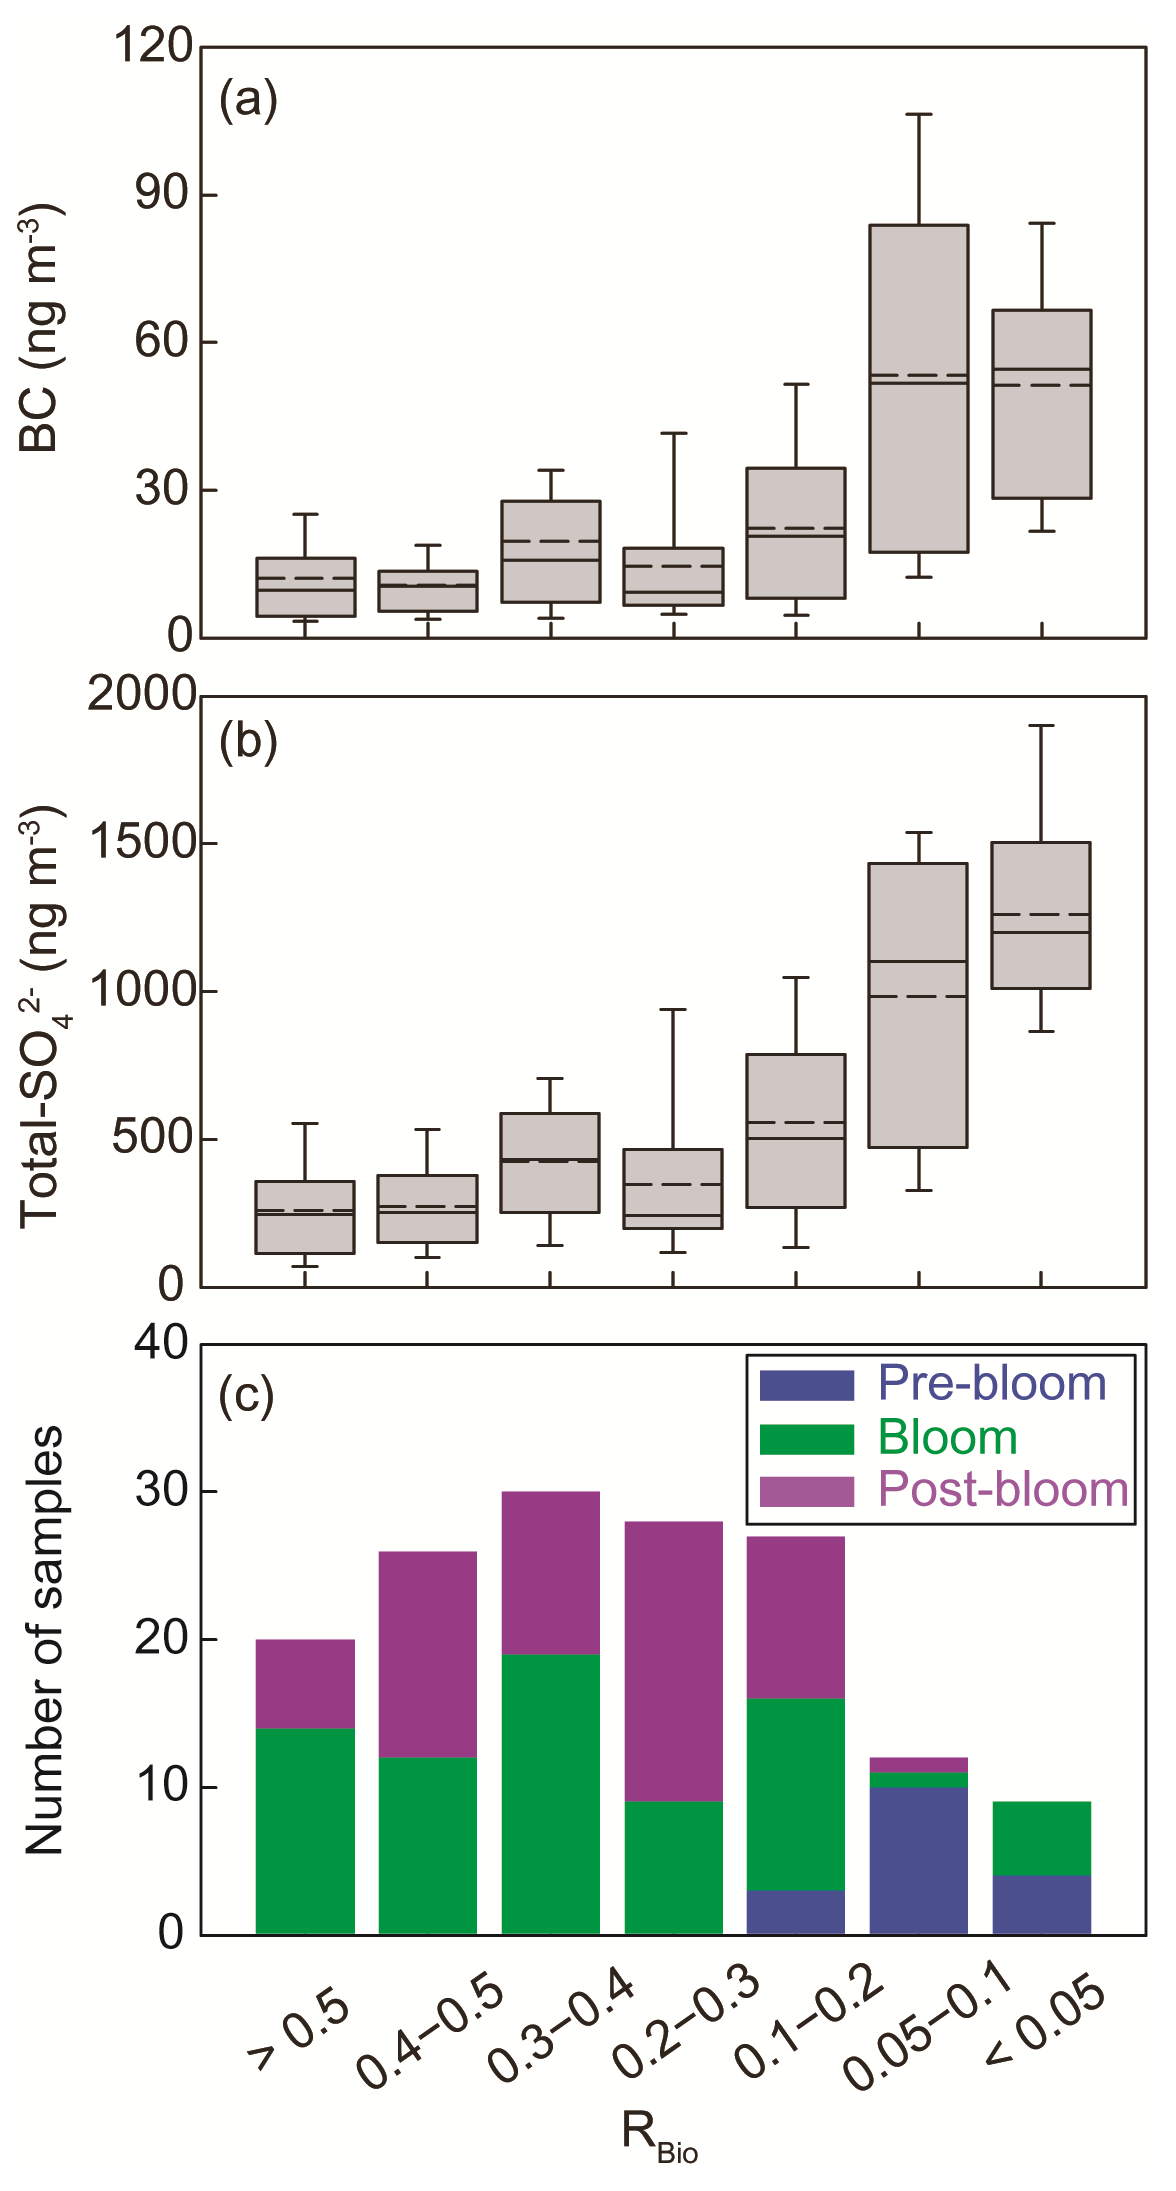
Figure 8Plots of the seasonal (a) black carbon (BC) concentration versus RBio, (b) the total SO concentration versus RBio, and (c) the number of samples included in each RBio group. The solid and dotted lines represent the median and mean values of the data in the box plots, respectively.
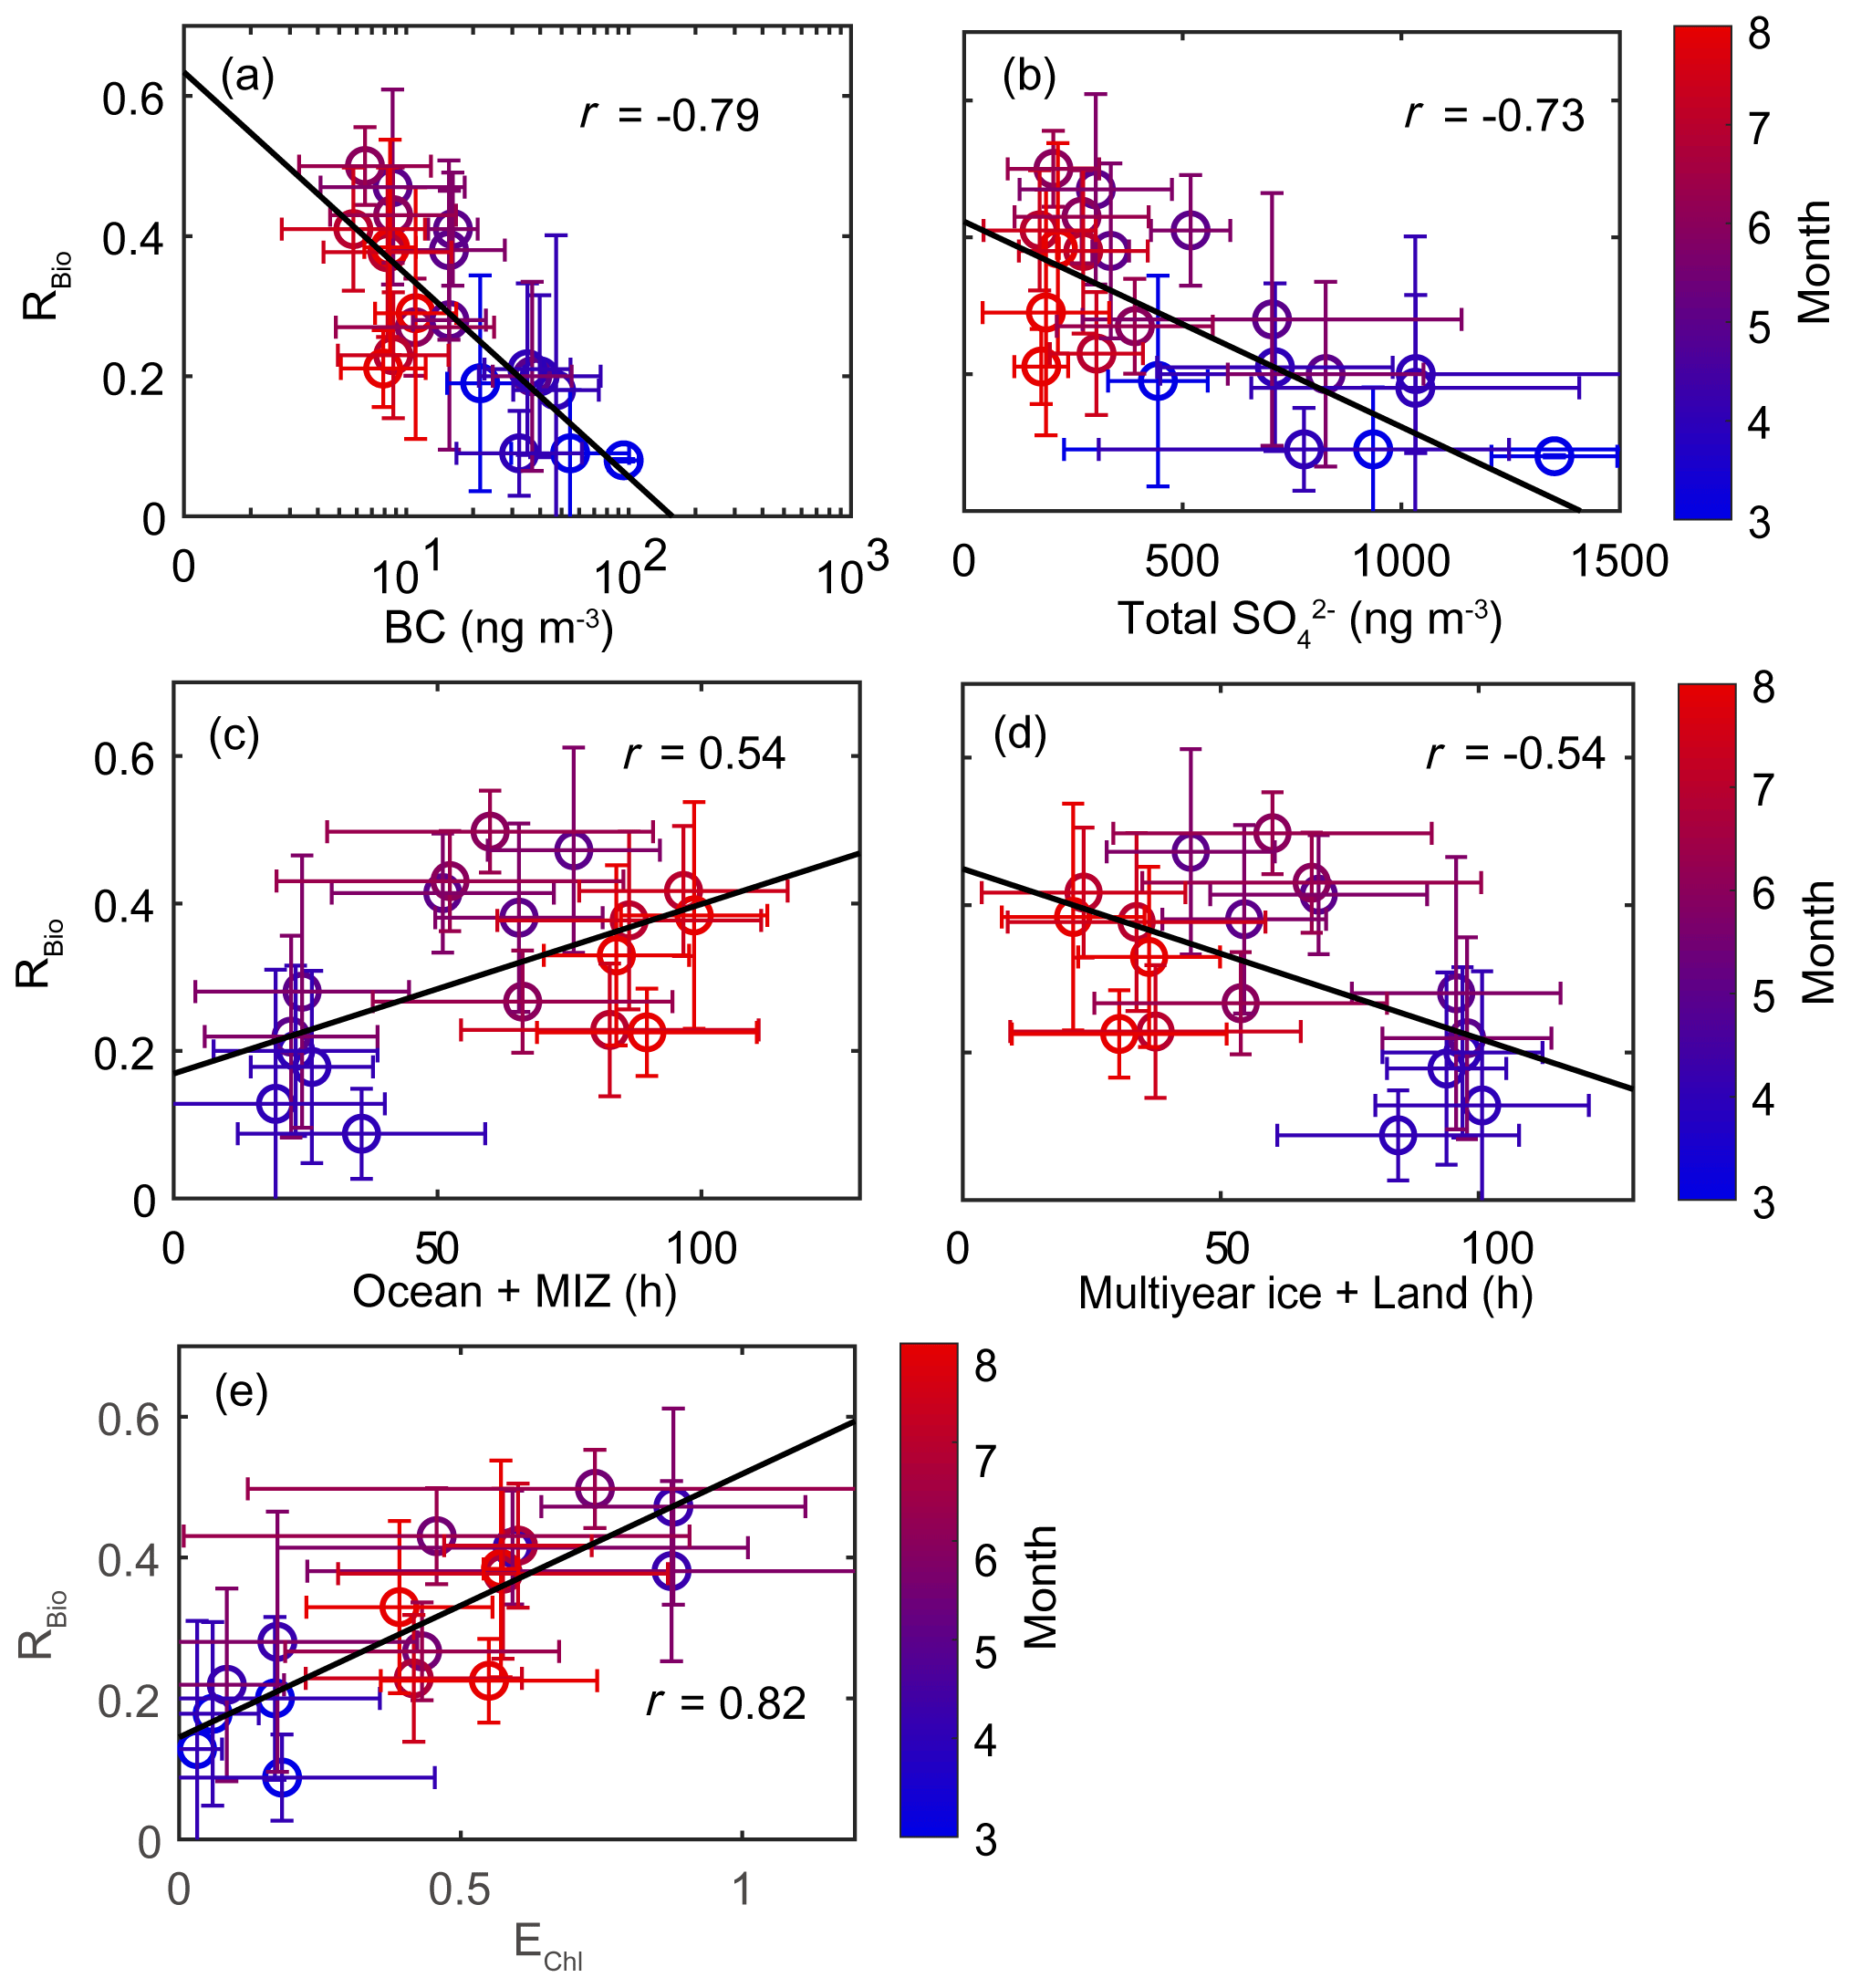
Figure 9Scatter plots of monthly mean RBio values as a function of (a) the monthly mean black carbon (BC) concentration, (b) the monthly mean total SO concentration, (c) the air mass retention time over the ocean and the marginal ice zone (MIZ), (d) the air mass retention time over multi-year ice and land areas, and (e) the monthly mean air mass exposure to chlorophyll (EChl). Error bars and the black solid line represent 1σ and the best fit, respectively.
A strong positive correlation between monthly mean RBio and the air mass exposure to chlorophyll (EChl) was observed during the study period (r=0.82). The retention time of air masses over the ocean and marginal ice zone (i.e., DMS source regions) was also positively correlated with RBio values (r=0.54). The RBio values decreased with decreasing air mass retention time over the land and multi-year ice regions (i.e., the non-DMS-source regions). The concentration of MSA was positively correlated with the mean Chl-a concentration in areas surrounding the observation site, but no similar clear correlation was found between Bio-SO and Chl-a (Fig. S9). The absence of a correlation between Bio-SO and Chl-a indicates that the concentration of Bio-SO measured at the observation site included sulfur compounds produced locally and in distant regions, because the greater atmospheric residence time of Bio-SO (relative to MSA) indicates greater intrusion of Bio-SO into the observation site. Hence, air masses that have been extensively exposed to local biological activities are likely to have higher RBio values. Therefore, the seasonal variations in RBio measured at Ny-Ålesund were probably controlled by the concentration of OH radicals (largely determined by light intensity), the chemical properties of the particles containing black carbon and sulfates, and biological activities surrounding the observation site. Another established factor that could affect the seasonal variations in RBio is air temperature. However, we found no association between RBio and air temperature (see Text S2).
The RBio values in the present study, and those determined in other high-latitude regions including Barrow in Alaska (USA) and Neumayer station in the Antarctic coastal region, consistently pointed to the highest RBio values occurring in summer (Li et al., 1993; Legrand and Pasteur, 1998; Norman et al., 1999). We found that seasonal variability in RBio measured in the Arctic region can be better explained by light conditions, the chemical properties of particles, and biological activities near the observation site than by air temperature. Specifically, the RBio values measured during the pre-bloom period poorly represent the oxidative conditions of DMS in the Arctic atmosphere, because of the considerable intrusion of anthropogenic pollutants from the distant northern Europe. Thus, the RBio values measured during the bloom and post-bloom periods probably more accurately represent the ratio of the oxidation products of DMS produced in the ocean regions surrounding Svalbard under the less polluted conditions of the Arctic atmosphere.
4.2.2 Interannual variations in RBio
The second distinctive trend is the interannual difference in RBio. The RBio values measured in 2017 were much lower than the values in other years (2015, 2016, 2018, and 2019; Fig. 10). One explanation for large interannual variations in RBio is the difference in the condensation of gaseous MSA onto particles in the Arctic atmosphere. As noted above, the chemical properties of particles largely determine the rate of MSA condensation onto them (Jefferson et al., 1998; Yan et al., 2020b). During the pre-bloom and bloom periods in 2017, higher concentrations of black carbon and sulfate were found relative to other years, and consequently lower RBio values were found in 2017 (Fig. 10). However, we found no discernible interannual difference in the concentrations of black carbon (8.3 ± 4.9 ng m−3 in 2017 and 9.5 ± 6.1 ng m−3 in other years) and total SO (235 ± 101 ng m−3 in 2017 and 232 ± 134 ng m−3 in the other years) during the post-bloom period (Fig. 10f). To our surprise, during the post-bloom period the RBio value (0.22 ± 0.07) in 2017 was only half the rate measured in the other years (0.39 ± 0.11). The lack of an association of black carbon and sulfate concentrations with RBio values indicates that factors other than chemical properties of existing particles affected the interannual variation in RBio values measured during the post-bloom period.
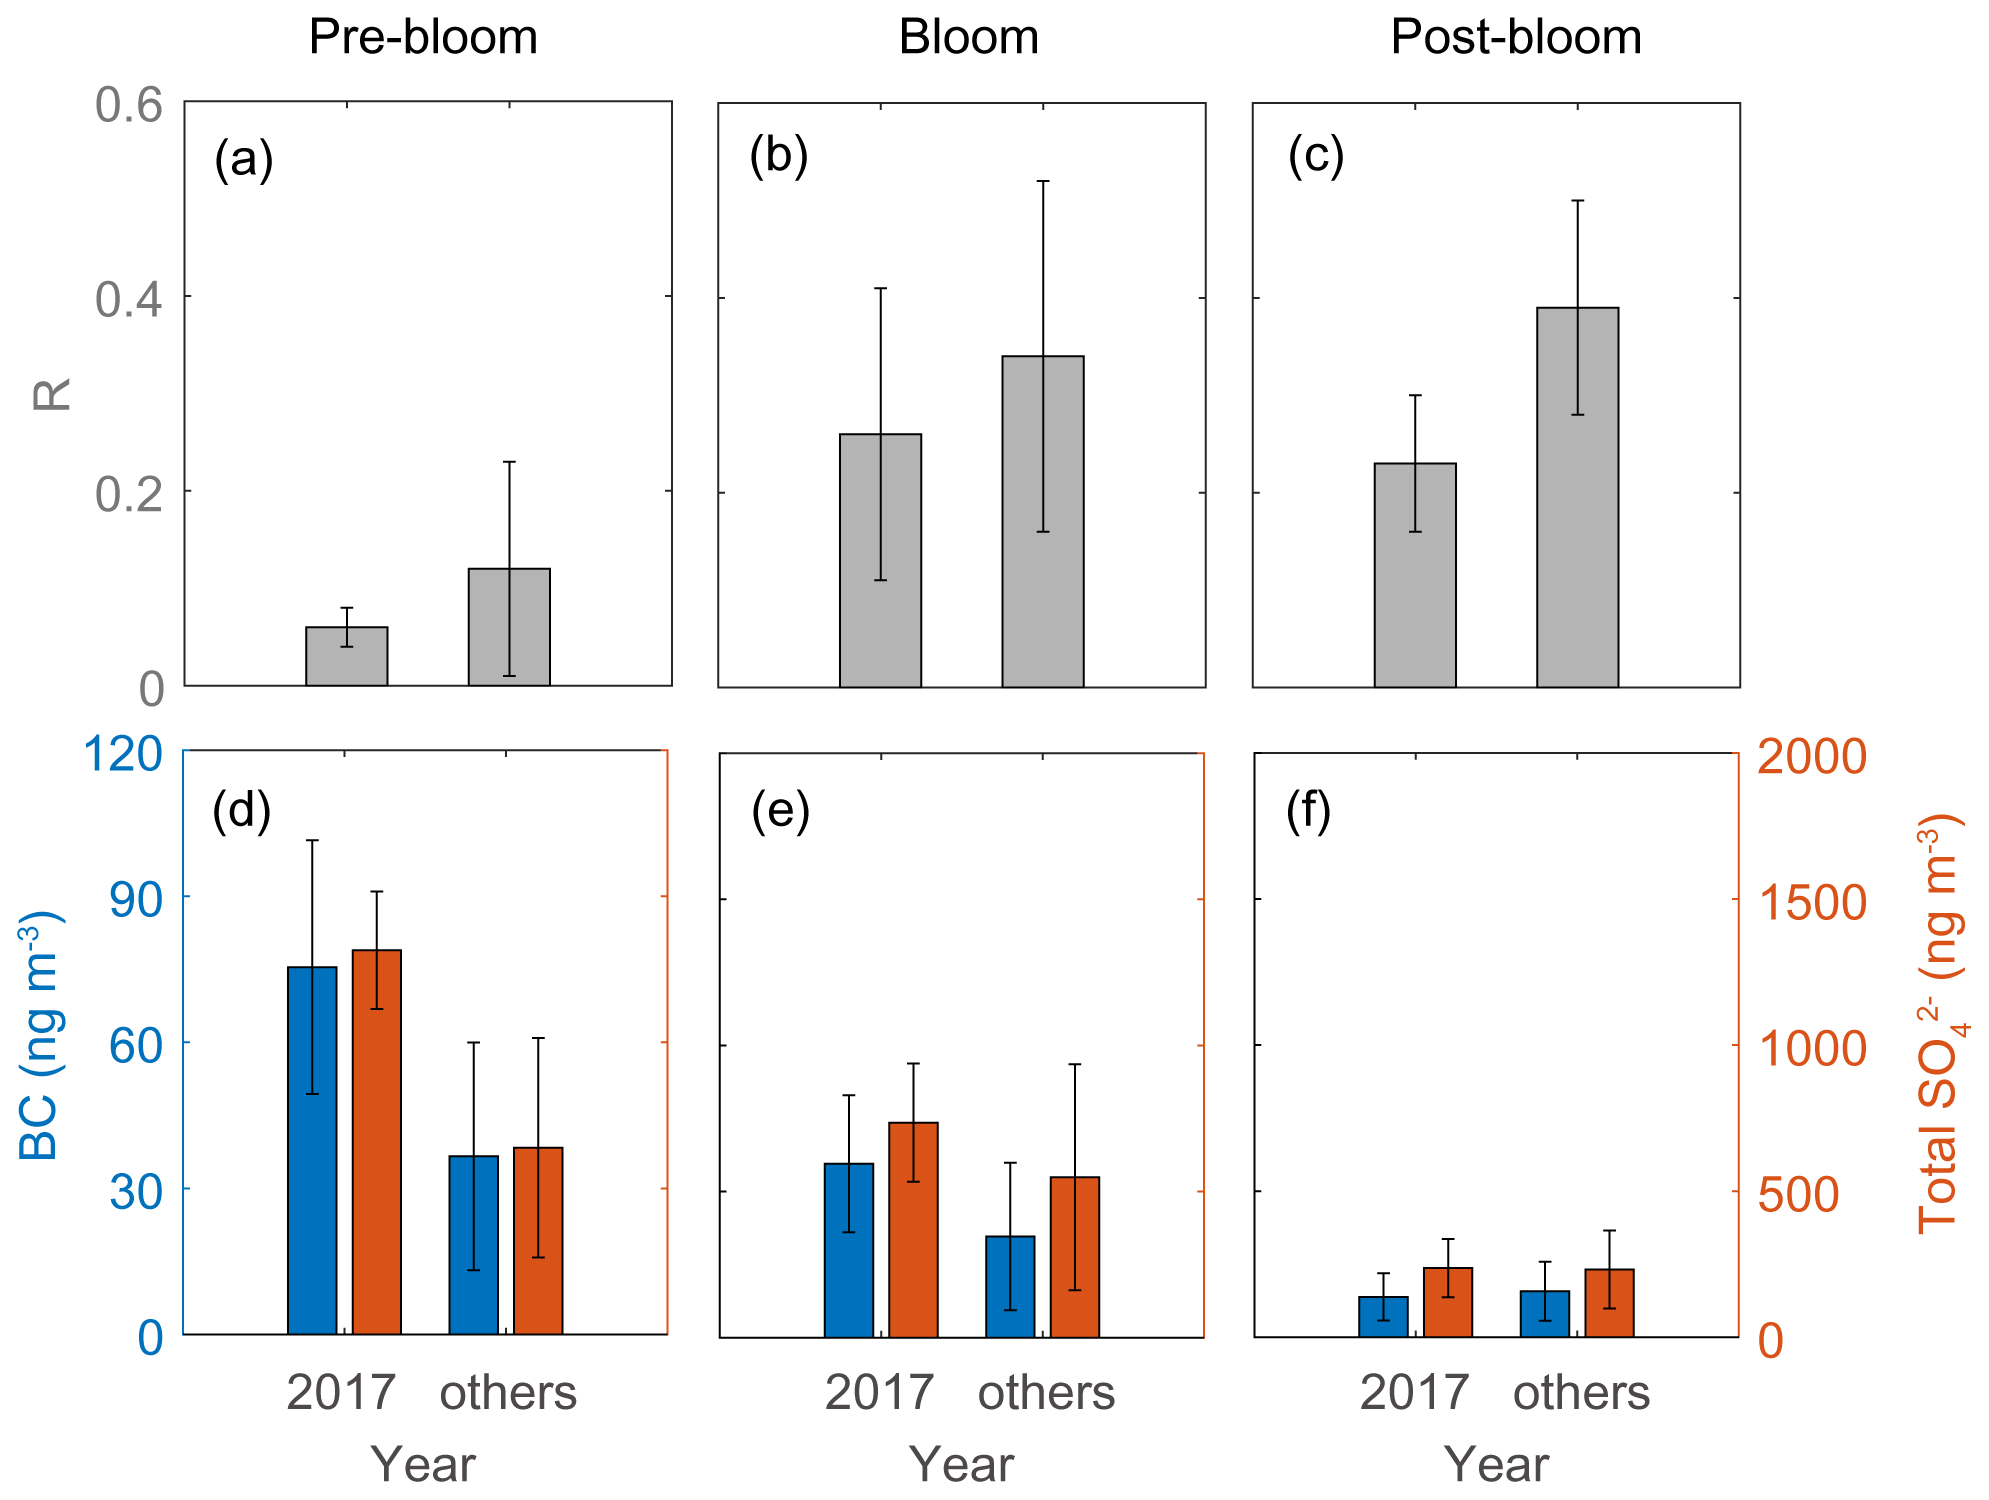
Figure 10RBio (a–c) and the black carbon (BC) and total SO concentrations (d–f) during pre-bloom, bloom, and post-bloom periods. Error bars represent 1σ.
Air temperature difference may explain the interannual variations in RBio during the post-bloom period (Fig. S11). However, the lack of correlation (e.g., Bates et al., 1992b) we found between RBio values and the mean temperatures of air masses along the entire pathway to Svalbard (Fig. S11b) is consistent with the results of other studies (Savoie et al., 1992; Legrand and Pasteur, 1998; Zhan et al., 2017; Moffett et al., 2020), implying that variations in air temperature were not a driver of determining the DMS branching ratio. We also found no discernible differences in solar radiation and relative humidity between year of 2017 and other years; thus, neither solar radiation nor relative humidity showed any association with RBio (Fig. S11c–d). Thus, no meteorological factors adequately explain the interannual variations in RBio during the post-bloom period. The concurrent measurements of DMS and MSA during summer in the Southern Ocean reinforce our finding that temperature and relative humidity have negligible effects on the conversion of DMS to MSA (Yan et al., 2020a).
Analysis of air mass back-trajectory data indicated that the air mass exposure to chlorophyll (EChl) in 2017 (0.44 ± 0.21) was 30 % lower than in other years (0.63 ± 0.35). The mean retention time of air masses over the sea ice and land areas (i.e., non-DMS source regions) in 2017 (40.9 ± 27.9 h) was 25 % longer than that estimated for other years (32.3 ± 19.2 h), whereas the mean retention time of air masses over the ocean and marginal ice regions (i.e., the DMS source regions) was lower in 2017 (79.1 ± 27.9 h) than in other years (87.7 ± 19.2 h) (Fig. 11). Hence, the 2017 RBio values were 40 % lower than those in 2018 and 2019, probably because more air masses swept over non-DMS source regions.
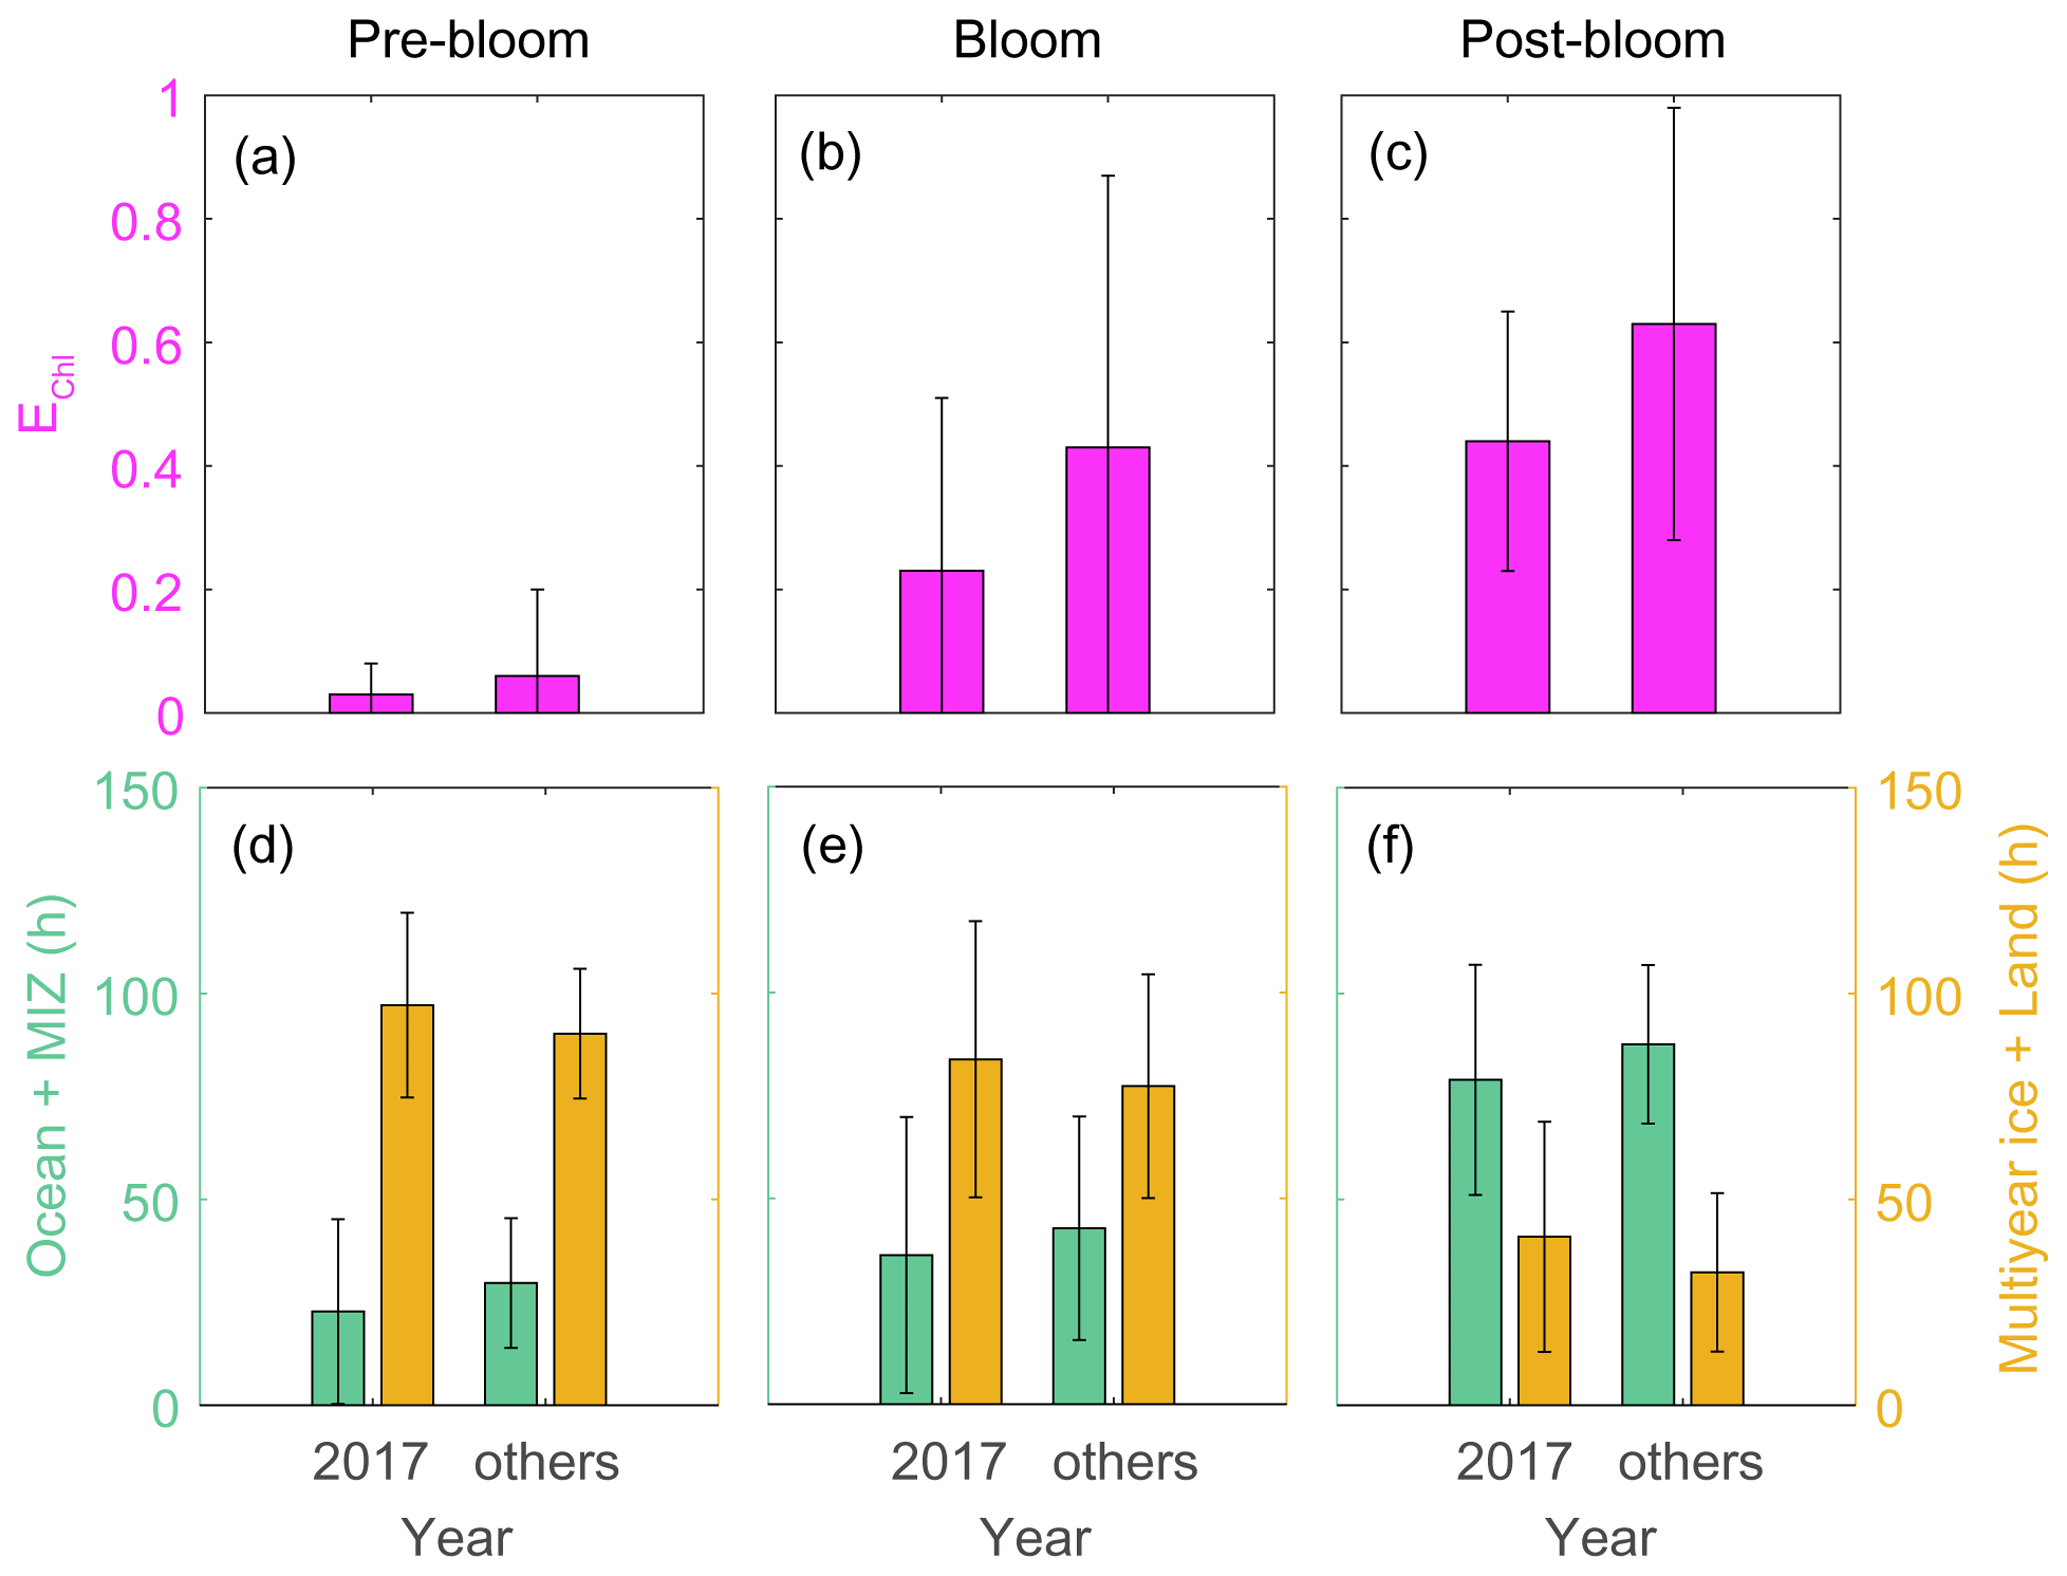
Figure 11Air mass exposure to chlorophyll (EChl) (a–c) and the air mass residence times over the ocean and marginal ice zone (MIZ) and the multi-year ice and land areas (d–f) during pre-bloom, bloom, post-bloom periods. Error bars represent 1σ.
As sulfate and MSA particles have different roles in terms of particle formation and growth, the importance of RBio is worth highlighting. Sulfate particles (including sulfuric acids) are known to produce 4–6 times more submicron-sized particles than MSA, leading to a 10-fold stronger cooling effect via scattering of solar radiation (i.e., a direct effect), whereas the impacts of sulfate and MSA particles on cloud microphysics (i.e., an indirect effect) are comparable (Hodshire et al., 2019). Our findings of considerable seasonal or interannual variations in RBio indicate that the conventional approach of using asymptotic values to determine the oxidation products of DMS and to evaluate the contribution of biogenic sources to the total sulfur budget at particular locations (e.g., Norman et al., 1999; Udisti et al., 2012, 2016) is problematic.
This study shows that in the Arctic atmosphere extensive production of the oxidation products of DMS (i.e., Bio-SO and MSA) occurred from the onset to the termination of phytoplankton blooms between 2015 and 2019. Anth-SO was found to be the largest contributor to total sulfate aerosols during the pre-bloom periods, as a result of the influence of Arctic haze. Its contribution was comparable to that of Bio-SO during the bloom and post-bloom periods. We also found large interannual variations in anthropogenic and biogenic sulfur aerosols. Moreover, the ratio of MSA to Bio-SO (RBio) tended to be higher (0.32 ± 0.15) in summer than in early spring (0.09 ± 0.07). Our results imply that NPF and subsequent growth of those particles to form CCN are governed by both Bio-SO and MSA when RBio is high (bloom and post-bloom periods), but that when RBio is low (pre-bloom period) MSA makes only a small contribution to particle growth and other molecules with low-volatility vapors (e.g., highly oxygenated organic molecules) are more involved in particle growth near Svalbard. The large interannual variability of RBio further indicates that condensational growth following NPF can be affected by MSA or other molecules with low-volatility vapors, depending on the branching ratio of DMS oxidation.
In modeling studies (Vallina et al., 2006, 2007) the annual contribution of biogenically induced CCN to total global CCN has been estimated to be greater than 30 %, and up to 80 % in the austral summer in the Southern Ocean. This is similar to findings for the Northern Hemisphere, where Bio-SO particles accounted for greater than 60 % of CCN in late spring (May and June) in the North Atlantic (Sanchez et al., 2018). An acceleration of sea ice retreat and an increase in melt ponds in the Arctic Ocean will increase biogenic DMS production, resulting in a greater contribution of biogenic S aerosols to atmospheric aerosol formation and climate regulation (Arrigo et al., 2008; Gourdal et al., 2018; Park et al., 2019; Galí et al., 2019). Another important factor that may be involved in the formation of biogenic CCN is changes in the atmospheric concentrations of OH, NOx, and BrO; these are likely to be affected by future climate change and increasing anthropogenic perturbations (e.g., sea ice decline, increasing reduced carbon emissions) (Alexander and Mickley, 2015). Our measurements primarily focused on the particle phase of sulfur species (particles < 2.5 µm) but did not cover the initial phase of DMS oxidation and particle growth (i.e., nano size scales), including the concentration of the oxidants and gas-phase composition of sulfur species. Therefore, the integrated study of both the gas and particle phases of sulfur compounds (including gaseous MSA, SO, and hydroperoxymethyl thioformate), ocean colors, and sea ice properties will help define the climate-relevant impacts of oxidation products of biogenic DMS in the Arctic environment.
All data needed to draw the conclusions in the present study are presented in this report and/or the Supplement. For additional data related to this study, please contact the corresponding author (Kitack Lee; ktl@postech.ac.kr).
The supplement related to this article is available online at: https://doi.org/10.5194/acp-21-9761-2021-supplement.
SJ, KTP, YJY, and KL designed the data analysis and wrote the manuscript. SJ, KTP, and EJ performed the data evaluation and analyses. KK and HYC performed the ion chromatograph measurements. KE provided the black carbon data. RT and SB were involved in aerosol sample collection. BYL, RK, and OH contributed to the interpretation of the results.
The authors declare that they have no conflict of interest.
Publisher's note: Copernicus Publications remains neutral with regard to jurisdictional claims in published maps and institutional affiliations.
We thank the Sverdrup Research Station staff of the Norwegian Polar Institute for assisting us in maintaining the atmospheric DMS analysis system at the Zeppelin station.
This research has been supported by the National Research Foundation of Korea (grant nos. NRF-2020R1A4A1018818 and NRF-2021M1A5A1065425 (KOPRI-PN21011)).
This paper was edited by Aurélien Dommergue and reviewed by two anonymous referees.
Abbatt, J. P. D., Thomas, J. L., Abrahamsson, K., Boxe, C., Granfors, A., Jones, A. E., King, M. D., Saiz-Lopez, A., Shepson, P. B., Sodeau, J., Toohey, D. W., Toubin, C., von Glasow, R., Wren, S. N., and Yang, X.: Halogen activation via interactions with environmental ice and snow in the polar lower troposphere and other regions, Atmos. Chem. Phys., 12, 6237–6271, https://doi.org/10.5194/acp-12-6237-2012, 2012.
Albrecht, B. A.: Aerosols, cloud microphysics, and fractional cloudiness, Science, 245, 1227–1230, https://doi.org/10.1126/science.245.4923.1227, 1989.
Alexander, B. and Mickley, L. J.: Paleo-perspectives on potential future changes in the oxidative capacity of the atmosphere due to climate change and anthropogenic emissions, Current Pollution Reports, 1, 57–69, https://doi.org/10.1007/s40726-015-0006-0, 2015.
Arnold, S. R., Spracklen, D. V., Gebhardt, S., Custer, T., Williams, J., Peeken, I., and Alvain, S.: Relationships between atmospheric organic compounds and air-mass exposure to marine biology, Environ. Chem., 7, 232–241, https://doi.org/10.1071/EN09144, 2010.
Arrigo, K. R., van Dijken, G., and Pabi, S.: Impact of a shrinking Arctic ice cover on marine primary production, Geophys. Res. Lett., 35, L19603, https://doi.org/10.1029/2008GL035028, 2008.
Ayers, G. P., Ivey, J. P., and Gillett, R. W.: Coherence between seasonal cycles of dimethyl sulphide, methanesulphonate and sulphate in marine air, Nature, 349, 404–406, https://doi.org/10.1038/349404a0, 1991.
Barnes, I., Hjorth, J., and Mihalopoulos, N.: Dimethyl sulfide and dimethyl sulfoxide and their oxidation in the atmosphere, Chem. Rev., 106, 940–975, https://doi.org/10.1021/cr020529, 2006.
Bates, T. S., Lamb, B. K., Guenther, A., Dignon, J., and Stoiber, R. E.: Sulfur emissions to the atmosphere from natural sources, J. Atmos. Chem., 14, 315–337, https://doi.org/10.1007/BF00115242, 1992a.
Bates, T. S., Calhoun, J. A., and Quinn, P. K.: Variations in the methanesulfonate to sulfate molar ratio in submicrometer marine aerosol particles over the South Pacific Ocean, J. Geophys. Res.-Atmos., 97, 9859–9865, https://doi.org/10.1029/92JD00411, 1992b.
Becagli, S., Lazzara, L., Marchese, C., Dayan, U., Ascanius, S. E., Cacciani, M., Caiazzo, L., Di Biagio, C., Di Iorio, T., di Sarra, A., Eriksen, P., Fani, F., Giardi, F., Meloni, D., Muscari, G., Pace, G., Severi, M., Traversi, R., and Udisti, R.: Relationships linking primary production, sea ice melting, and biogenic aerosol in the Arctic, Atmos. Environ., 136, 1–15, https://doi.org/10.1016/j.atmosenv.2016.04.002, 2016.
Becagli, S., Amore, A., Caiazzo, L., Iorio, T. D., Sarra, A. D., Lazzara, L., Marchese, C., Meloni, D., Mori, G., Muscari, G., Nuccio, C., Pace, G., Severi, M., and Traversi, R.: Biogenic Aerosol in the Arctic from Eight Years of MSA Data from Ny Ålesund (Svalbard Islands) and Thule (Greenland), Atmosphere, 10, 349, https://doi.org/10.3390/atmos10070349, 2019.
Berresheim, H., Andreae, M. O., Ayers, G. P., Gillett, R. W., Merrill, J. T., Davis, V. J., and Chameides, W. L.: Airborne measurements of dimethylsulfide, sulfur dioxide, and aerosol ions over the Southern Ocean south of Australia, J. Atmos. Chem., 10, 341–370, https://doi.org/10.1007/BF00053868, 1990.
Berresheim, H., Andreae, M. O., Iverson, R. L., and Li, S. M.: Seasonal variations of dimethylsulfide emissions and atmospheric sulfur and nitrogen species over the western north Atlantic Ocean, Tellus B, 43, 353–372, https://doi.org/10.1034/j.1600-0889.1991.t01-1-00001.x-i1, 1991.
Bork, N., Elm, J., Olenius, T., and Vehkamäki, H.: Methane sulfonic acid-enhanced formation of molecular clusters of sulfuric acid and dimethyl amine, Atmos. Chem. Phys., 14, 12023–12030, https://doi.org/10.5194/acp-14-12023-2014, 2014.
Böttcher, M. E., Brumsack, H.-J., and Dürselen, C.-D.: The isotopic composition of modern seawater sulfate: I. Coastal waters with special regard to the North Sea, J. Marine Syst., 67, 73–82, https://doi.org/10.1016/j.jmarsys.2006.09.006, 2007.
Boy, M., Kulmala, M., Ruuskanen, T. M., Pihlatie, M., Reissell, A., Aalto, P. P., Keronen, P., Dal Maso, M., Hellen, H., Hakola, H., Jansson, R., Hanke, M., and Arnold, F.: Sulphuric acid closure and contribution to nucleation mode particle growth, Atmos. Chem. Phys., 5, 863–878, https://doi.org/10.5194/acp-5-863-2005, 2005.
Burkart, J., Willis, M. D., Bozem, H., Thomas, J. L., Law, K., Hoor, P., Aliabadi, A. A., Köllner, F., Schneider, J., Herber, A., Abbatt, J. P. D., and Leaitch, W. R.: Summertime observations of elevated levels of ultrafine particles in the high Arctic marine boundary layer, Atmos. Chem. Phys., 17, 5515–5535, https://doi.org/10.5194/acp-17-5515-2017, 2017.
Chang, R. Y.-W., Sjostedt, S. J., Pierce, J. R., Papakyriakou, T. N., Scarratt, M. G., Michaud, S., Levasseur, M., Leaitch, W. R., and Abbatt, J. P. D.: Relating atmospheric and oceanic DMS levels to particle nucleation events in the Canadian Arctic, J. Geophys. Res.-Atmos., 116, D00S03, https://doi.org/10.1029/2011JD015926, 2011a.
Chang, R. Y.-W., Leck, C., Graus, M., Müller, M., Paatero, J., Burkhart, J. F., Stohl, A., Orr, L. H., Hayden, K., Li, S.-M., Hansel, A., Tjernström, M., Leaitch, W. R., and Abbatt, J. P. D.: Aerosol composition and sources in the central Arctic Ocean during ASCOS, Atmos. Chem. Phys., 11, 10619–10636, https://doi.org/10.5194/acp-11-10619-2011, 2011b.
Chen, H., Ezell, M. J., Arquero, K. D., Varner, M. E., Dawson, M. L., Gerber, R. B., and Finlayson-Pitts, B. J.: New particle formation and growth from methanesulfonic acid, trimethylamine and water, Phys. Chem. Chem. Phys., 17, 13699–13709, https://doi.org/10.1039/C5CP00838G, 2015.
Chen, H., Varner, M. E., Gerber, R. B., and Finlayson-Pitts, B. J.: Reactions of methanesulfonic acid with amines and ammonia as a source of new particles in air, J. Phys. Chem. B, 120, 1526–1536, https://doi.org/10.1021/acs.jpcb.5b07433, 2016.
Chen, L., Wang, J., Gao, Y., Xu, G., Yang, X., Lin, Q., and Zhang, Y.: Latitudinal distributions of atmospheric MSA and MSA/nss-SO ratios in summer over the high latitude regions of the Southern and Northern Hemispheres, J. Geophys. Res., 117, D10306, https://doi.org/10.1029/2011JD016559, 2012.
Chen, L., Li, W., Zhan, J., Wang, J., Zhang, Y., and Yang, X.: Increase in Aerosol Black Carbon in the 2000s over Ny-Ålesund in the Summer, J. Atmos. Sci., 73, 251–262, https://doi.org/10.1175/JAS-D-15-0009.1, 2016.
Choi, J. H., Jang, E., Yoon, Y. J., Park, J. Y., Kim, T. W., Becagli, S., Caiazzo, L., Cappelletti, D., Krejci, R., Eleftheriadis, K., Park, K.-T., and Jang, K. S.: Influence of biogenic organics on the chemical composition of Arctic aerosols, Global. Biogeochem. Cy., 33, 1238–1250, https://doi.org/10.1029/2019GB006226, 2019.
Coplen, T. B. and Krouse, H. R.: Sulphur isotope data consistency improved, Nature, 392, 32–32, https://doi.org/10.1038/32080, 1998.
Dall'Osto, M., Beddows, D. C. S., Tunved, P., Krejci, R., Ström, J., Hansson, H.-C., Yoon, Y. J., Park, K.-T., Becagli, S., Udisti, R., Onasch, T., O'Dowd, C. D., Simó, R., and Harrison, R. M.: Arctic sea ice melt leads to atmospheric new particle formation, Sci. Rep., 7, 3318, https://doi.org/10.1038/s41598-017-03328-1, 2017.
Dall'Osto, M., Geels, C., Beddows, D. C. S., Boertmann, D., Lange, R., Nøjgaard, J. K., Harrison, R. M., Simo, R., Skov, H., and Massling, A.: Regions of open water and melting sea ice drive new particle formation in North East Greenland, Sci. Rep., 8, 1–10, https://doi.org/10.1038/s41598-018-24426-8, 2018.
Dawson, M. L., Varner, M. E., Perraud, V., Ezell, M. J., Gerber, R. B., and Finlayson-Pitts, B. J.: Simplified mechanism for new particle formation from methanesulfonic acid, amines, and water via experiments and ab initio calculations, P. Natl. Acad. Sci. USA, 109, 18719–18724, https://doi.org/10.1073/pnas.1211878109, 2012.
Dekhtyareva, A., Holmén, K., Maturilli, M., Hermansen, O., and Graversen, R.: Effect of seasonal mesoscale and microscale meteorological conditions in Ny-Ålesund on results of monitoring of long-range transported pollution, Polar Res., 37, 1508196, https://doi.org/10.1080/17518369.2018.1508196, 2018.
Draxler, R. R. and Hess, G. D.: An overview of the HYSPLIT_4 modelling system for trajectories, Aust. Meteorol. Mag., 47, 295–308, 1998.
Eleftheriadis, K., Vratolis, S., and Nyeki, S.: Aerosol black carbon in the European Arctic: measurements at Zeppelin station, Ny-Ålesund, Svalbard from 1998–2007, Geophys. Res. Lett., 36, L02809, https://doi.org/10.1029/2008GL035741, 2009.
Fernandez, R. P., Carmona-Balea, A., Cuevas, C. A., Barrera, J. A., Kinnison, D. E., Lamarque, J.-F., Blaszczak-Boxe, C., Kim, K. T., Choi, W. Y., Hay, T., Blechschmidt, A.-M., Schönhardt, A., Burrows, J. P., and Saiz-Lopez, A.: Modeling the sources and chemistry of polar tropospheric halogens (Cl, Br, and I) using the CAM-Chem Global Chemistry-Climate Model, J. Adv. Model. Earth. Sy., 11, 2259–2289, https://doi.org/10.1029/2019MS001655, 2019.
Galí, M., Devred, E., Babin, M., and Levasseur, M.: Decadal increase in Arctic dimethylsulfide emission, P. Natl. Acad. Sci. USA, 116, 19311–19317, https://doi.org/10.1073/pnas.1904378116, 2019.
Gaston, C. J., Pratt, K. A., Qin, X., and Prather, K. A.: Real-time detection and mixing state of methanesulfonate in single particles at an inland urban location during a phytoplankton bloom, Environ. Sci. Technol., 44, 1566–1572, https://doi.org/10.1021/es902069d, 2010.
Ghahremaninezhad, R., Gong, W., Galí, M., Norman, A.-L., Beagley, S. R., Akingunola, A., Zheng, Q., Lupu, A., Lizotte, M., Levasseur, M., and Leaitch, W. R.: Dimethyl sulfide and its role in aerosol formation and growth in the Arctic summer – a modelling study, Atmos. Chem. Phys., 19, 14455–14476, https://doi.org/10.5194/acp-19-14455-2019, 2019.
Gogoi, M. M., Babu, S. S., Moorthy, K. K., Thakur, R. C., Chaubey, J. P., and Nair, V. S: Aerosol black carbon over Svalbard regions of Arctic, Polar Sci., 10, 60–70, https://doi.org/10.1016/j.polar.2015.11.001, 2016.
Gondwe, M., Krol, M., Klaassen, W., Gieskes, W., and de Baar, H.: Comparison of modeled versus measured MSA:nss SO ratios: A global analysis, Global. Biogeochem. Cy., 18, GB2006, https://doi.org/10.1029/2003GB002144, 2004.
Gourdal, M., Lizotte, M., Massé, G., Gosselin, M., Poulin, M., Scarratt, M., Charette, J., and Levasseur, M.: Dimethyl sulfide dynamics in first-year sea ice melt ponds in the Canadian Arctic Archipelago, Biogeosciences, 15, 3169–3188, https://doi.org/10.5194/bg-15-3169-2018, 2018.
Halas, S. and Szaran, J.: Improved thermal decomposition of sulfates to SO2 and mass spectrometric determination of δ34S of IAEA SO-5, IAEA SO-6 and NBS-127 sulfate standards, Rapid. Commun. Mass Sp., 15, 1618–1620, https://doi.org/10.1002/rcm.416, 2001.
Hayashida, H., Steiner, N., Monahan, A., Galindo, V., Lizotte, M., and Levasseur, M.: Implications of sea-ice biogeochemistry for oceanic production and emissions of dimethyl sulfide in the Arctic, Biogeosciences, 14, 3129–3155, https://doi.org/10.5194/bg-14-3129-2017, 2017.
Haywood, J. and Boucher, O.: Estimates of the direct and indirect radiative forcing due to tropospheric aerosols: A review, Rev. Geophys., 38, 513–543, https://doi.org/10.1029/1999RG000078, 2000.
Hodshire, A. L., Campuzano-Jost, P., Kodros, J. K., Croft, B., Nault, B. A., Schroder, J. C., Jimenez, J. L., and Pierce, J. R.: The potential role of methanesulfonic acid (MSA) in aerosol formation and growth and the associated radiative forcings, Atmos. Chem. Phys., 19, 3137–3160, https://doi.org/10.5194/acp-19-3137-2019, 2019.
Hoffmann, E. H., Tilgner, A., Schroedner, R., Bräuer, P., Wolke, R., and Herrmann, H.: An advanced modeling study on the impacts and atmospheric implications of multiphase dimethyl sulfide chemistry, P. Natl. Acad. Sci. USA, 113, 11776–11781, https://doi.org/10.1073/pnas.1606320113, 2016.
Hopkins, F. E., Suntharalingam, P., Gehlen, M., Andrews, O., Archer, S. D., Bopp, L., Bultenhuis, E., Dadou, I., Duce, R., Goris, N., Jickells, T., Johnson, M., Keng, F., Law, C. S., Lee, K., Liss, P. S., Lizotte, M., Malin, G., Murrell, J. C., Naik, H., Rees, A. P., Schwinger, J., and Williamson, P.: The impacts of ocean acidification on marine trace gases and the implications for atmospheric chemistry and climate, P. R. Soc. A., 476, 20190769, https://doi.org/10.1098/rspa.2019.0769, 2020.
Hoppel, W. A.: Nucleation in the MSA-water vapor system, Atmos. Environ., 21, 2703–2709, https://doi.org/10.1016/0004-6981(87)90202-2, 1987.
Hynes, A. J., Wine, P. H., and Semmes, D. H.: Kinetics and mechanism of hydroxyl reactions with organic sulfides, J. Phys. Chem., 90, 4148–4156, https://doi.org/10.1021/j100408a062, 1986.
IPCC: Climate Change 2013: The Physical Science Basis. Contribution of Working Group I to the Fifth Assessment Report of the Intergovernmental Panel on Climate Change, edited by: Stocker, T. F., Qin, D., Plattner, G.-K., Tignor, M., Allen, S. K., Boschung, J., Nauels, A., Xia, Y., Bex, V., and Midgley, P. M., Cambridge University Press, Cambridge, UK and New York, NY, USA, 1217–1308, 2013.
Jaffrezo, J. L., Davidson, C. I., Legrand, M., and Dibb, J. E.: Sulfate and MSA in the air and snow on the Greenland ice sheet, J. Geophys. Res.-Atmos., 99, 1241–1253, https://doi.org/10.1029/93JD02913, 1994.
Jang, S., Park, K.-T., Lee, K., and Suh, Y.-S.: An analytical system enabling consistent and long-term measurement of atmospheric dimethyl sulphide, Atmos. Environ., 134, 217–223, https://doi.org/10.1016/j.atmosenv.2016.03.041, 2016.
Jefferson, A., Tanner, D. J., Eisele, F. L., Davis, D. D., Chen, G., Crawford, J., Huey, J. W., Torres, A. L., and Berresheim, H.: OH photochemistry and methane sulfonic acid formation in the coastal Antarctic boundary layer, J. Geophys. Res.-Atmos., 103, 1647–1656, https://doi.org/10.1029/97JD02376, 1998.
Keene, W. C., Pszenny, A. P., Galloway, J. N., and Hawley, M. E.: Sea Salt Corrections and Interpretations of Constituent Ratios in Marine Precipitation, J. Geophys. Res., 91, 6647–6658, https://doi.org/10.1029/JD091iD06p06647, 1986.
Kettle, A. J. and Andreae, M. O.: Flux of dimethylsulfide from the oceans: A comparison of updated data sets and flux models, J. Geophys. Res., 105, 26793–26808, https://doi.org/10.1029/2000JD900252, 2000.
Kim, J.-M., Lee, K., Yang, E. J., Shin, K., Noh, J. H., Park, K., Hyun B., Jeong, H.-J., Kim, J.-H., Kim, K. Y., Kim, M., Kim, H.C., Jang, P.-G., and Jang, M.C.: Enhanced production of oceanic dimethylsulfide resulting from CO2-induced grazing activity in a high CO2 world, Environ. Sci. Technol., 44, 8140–8143, https://doi.org/10.1021/es102028k, 2010.
Kulmala, M.: How Particles Nucleate and Grow, Science, 302, 1000–1001, https://doi.org/10.1126/science.1090848, 2003.
Kulmala, M., Vehkamäki, H., Petäjä, T., Dal Maso, M., Lauri, A., Kerminen, V.-M., Birmili, W., and McMurry, P.: Formation and growth rates of ultrafine atmospheric particles: a review of observations, J. Aerosol Sci., 35, 143–176, https://doi.org/10.1016/j.jaerosci.2003.10.003, 2004.
Krouse, H. R. and Grinenko, V. A.: Stable isotopes: natural and anthropogenic sulphur in the environment, 43, Wiley, Chichester, UK, 1991.
Lange, R., Dall'Osto, M., Wex, H., Skov, H., and Massling, A.: Large summer contribution of organic biogenic aerosols to Arctic cloud condensation nuclei, Geophys. Res. Lett., 46, 11500–11509, https://doi.org/10.1029/2019GL084142, 2019.
Leaitch, W. R., Sharma, S., Huang L., Toom-Sauntry, D., Chivulescu, A., Macdonald, A. M., von Salzen, K., Pierce J. R., Bertram, A. K., Schroder, J. C., Shantz, N. C., Chang, R. Y.-W., and Norman A.-L.: Dimethyl sulfide control of the clean summertime Arctic aerosol and cloud, Elementa: Science of the Anthropocene, 1, 000017, https://doi.org/10.12952/journal.elementa.000017, 2013.
Leck, C. and Persson, C.: Seasonal and short-term variability in dimethyl sulfide, sulfur dioxide and biogenic sulfur and sea salt aerosol particles in the arctic marine boundary layer during summer and autumn, Tellus B, 48, 272–299, https://doi.org/10.3402/tellusb.v48i2.15891, 1996.
Lee, H., Park, K.-T., Lee, K., Jeong, H. J., and Yoo, Y. D.: Prey-dependent retention of dimethylsulfoniopropionate (DMSP) by mixotrophic dinoflagellates, Environ. Microbiol., 14, 605–616, https://doi.org/10.1111/j.1462-2920.2011.02600.x, 2012.
Lee, K., Sabine, C. L., Tanhua, T., Kim, T. W., Feely, R. A., and Kim, H. C.: Roles of marginal seas in absorbing and storing fossil fuel CO2, Energ. Environ. Sci., 4, 1133–1146, https://doi.org/10.1039/C0EE00663G, 2011.
Legrand, M. and Pasteur, E. C.: Methane sulfonic acid to non-sea-salt sulfate ratio in coastal Antarctic aerosol and surface snow, J. Geophys. Res.-Atmos., 103, 10991–11006, https://doi.org/10.1029/98JD00929, 1998.
Levasseur, M.: Impact of Arctic meltdown on the microbial cycling of sulphur, Nat. Geosci., 6, 691–700, https://doi.org/10.1038/ngeo1910, 2013.
Li, S. M. and Barrie, L. A.: Biogenic sulfur aerosol in the Arctic troposphere: 1. Contributions to total sulfate, J. Geophys. Res.-Atmos., 98, 20613–20622, https://doi.org/10.1029/93JD02234, 1993.
Li, S. M., Barrie, L. A., Talbot, R. W., Harriss, R. C., Davidson, C. I., and Jaffrezo, J. L.: Seasonal and geographic variations of methanesulfonic acid in the Arctic troposphere, Atmos. Environ. A.-Gen., 27, 3011–3024, https://doi.org/10.1016/0960-1686(93)90333-T, 1993.
Lin, C. T., Baker, A. R., Jickells, T. D., Kelly, S., and Lesworth, T.: An assessment of the significance of sulphate sources over the Atlantic Ocean based on sulphur isotope data, Atmos. Environ., 62, 615–621, https://doi.org/10.1016/j.atmosenv.2012.08.052, 2012.
Mahowald, N., Ward, D., Kloster, S., Flanner, M., Heald, C., Heavens, N., Hess, P., Lamarque, J.-F., and Chuang, P.: Aerosol impacts on climate and biogeochemistry, Annu. Rev. Env. Resour., 36, 45–74, https://doi.org/10.1146/annurev-environ-042009-094507, 2011.
Massling, A., Nielsen, I. E., Kristensen, D., Christensen, J. H., Sørensen, L. L., Jensen, B., Nguyen, Q. T., Nøjgaard, J. K., Glasius, M., and Skov, H.: Atmospheric black carbon and sulfate concentrations in Northeast Greenland, Atmos. Chem. Phys., 15, 9681–9692, https://doi.org/10.5194/acp-15-9681-2015, 2015.
Moffett, C. E., Barrett, T. E., Liu, J., Gunsch, M. J., Upchurch, L. M., Quinn, P. K., Pratt, K. A., and Sheesley, R. J.: Long-Term Trends for Marine Sulfur Aerosol in the Alaskan Arctic and Relationships With Temperature, J. Geophys. Res.-Atmos., 125, e2020JD033225, https://doi.org/10.1029/2020JD033225, 2020.
Mungall, E. L., Croft, B., Lizotte, M., Thomas, J. L., Murphy, J. G., Levasseur, M., Martin, R. V., Wentzell, J. J. B., Liggio, J., and Abbatt, J. P. D.: Dimethyl sulfide in the summertime Arctic atmosphere: measurements and source sensitivity simulations, Atmos. Chem. Phys., 16, 6665–6680, https://doi.org/10.5194/acp-16-6665-2016, 2016.
Norman, A. L., Barrie, L. A., Toom-Sauntry, D., Sirois, A., Krouse, H. R., Li, S. M., and Sharma, S.: Sources of aerosol sulphate at Alert: Apportionment using stable isotopes, J. Geophys. Res.-Atmos., 104, 11619–11631, https://doi.org/10.1029/1999JD900078, 1999.
Park, K.-T., Lee, K., Yoon, Y.-J., Lee, H.-W., Kim, H.-C., Lee, B.-Y., Hermansen, O., Kim, T.-W., Holmén, K.: Linking atmospheric dimethyl sulfide (DMS) and the Arctic Ocean spring bloom, Geophys. Res. Lett., 40, 155–160, https://doi.org/10.1029/2012GL054560, 2013.
Park, K.-T., Lee, K., Shin, K., Yang, E. J., Hyun, B., Kim, J.-M., Noh, J. H., Kim, M., Kong, B., Choi, D. H., Choi, S.-J., Jang, P.-G., and Jeong, H. J.: Direct linkage between dimethyl sulfide production and microzooplankton grazing, resulting from prey composition change under high partial pressure of carbon dioxide conditions, Environ. Sci. Technol., 48, 4750–4756, https://doi.org/10.1021/es403351h, 2014a.
Park, K.-T., Lee, K., Shin, K., Jeong, H. J., and Kim, K. Y.: Improved method for minimizing sulfur loss in analysis of particulate organic sulfur. Anal. Chem., 86, 1352–1356. https://doi.org/10.1021/ac403649m, 2014b.
Park, K.-T., Jang, S., Lee, K., Yoon, Y. J., Kim, M.-S., Park, K., Cho, H.-J., Kang, J.-H., Udisti, R., Lee, B.-Y., and Shin, K.-H.: Observational evidence for the formation of DMS-derived aerosols during Arctic phytoplankton blooms, Atmos. Chem. Phys., 17, 9665–9675, https://doi.org/10.5194/acp-17-9665-2017, 2017.
Park, K.-T., Lee, K., Kim, T. W., Yoon, Y. J., Jang, E. H., Jang, S., Lee, B.-Y., and Hermansen, O.: Atmospheric DMS in the Arctic Ocean and its relation to phytoplankton biomass, Global. Biogeochem. Cy., 32, 351–359, https://doi.org/10.1002/2017GB005805, 2018.
Park, K., Kim, I., Choi, J. O., Lee, Y., Jung, J., Ha, S. Y., Kim, J. H., and Zhang, M.: Unexpectedly high dimethyl sulfide concentration in high-latitude Arctic sea ice melt ponds, Environ. Sci.-Proc. Imp., 21, 1642–1649, https://doi.org/10.1039/C9EM00195F, 2019.
Prospero, J. M., Savoie, D. L., Saltzman, E. S., and Larsen, R.: Impact of oceanic sources of biogenic sulphur on sulphate aerosol concentrations at Mawson, Antarctica, Nature, 350, 221–223, https://doi.org/10.1038/350221a0, 1991.
Pszenny, A. A.: Particle size distributions of methanesulfonate in the tropical Pacific marine boundary layer, J. Atmos. Chem., 14, 273–284, https://doi.org/10.1007/BF00115239, 1992.
Pszenny, A. A., Castelle, A. J., Galloway, J. N., and Duce, R. A.: A study of the sulfur cycle in the Antarctic marine boundary layer, J. Geophys. Res.-Atmos., 94, 9818–9830, https://doi.org/10.1029/JD094iD07p09818, 1989.
Read, K. A., Lewis, A. C., Bauguitte, S., Rankin, A. M., Salmon, R. A., Wolff, E. W., Saiz-Lopez, A., Bloss, W. J., Heard, D. E., Lee, J. D., and Plane, J. M. C.: DMS and MSA measurements in the Antarctic Boundary Layer: impact of BrO on MSA production, Atmos. Chem. Phys., 8, 2985–2997, https://doi.org/10.5194/acp-8-2985-2008, 2008.
Rinaldi, M., Fuzzi, S., Decesari, S., Marullo, S., Santoleri, R., Provenzale, A., Hardenberg, J., Ceburnis, D., Vaishya, A., O'Dowd, C. D., and Facchini, M. C.: Is chlorophyll-a the best surrogate for organic matter enrichment in submicron primary marine aerosol?, J. Geophys. Res.-Atmos., 118, 4964–4973, https://doi.org/10.1002/jgrd.50417, 2013.
Saltzman, E. S., Savoie, D. L., Prospero, J. M., and Zika, R. G.: Methanesulfonic acid and non-sea-salt sulfate in Pacific air: Regional and seasonal variations, J. Atmos. Chem., 4, 227–240, https://doi.org/10.1007/BF00052002, 1986.
Sanchez, K. J., Chen, C. L., Russell, L. M., Betha, R., Liu, J., Price, D. J., Massoli, P., Ziemba, L. D., Crosble, E. C., Moore, R. H., Müller, M., Schiller, S. A., Wisthaler, A., Lee, A. K. Y., Quinn P. K., Bates, T. S., Porter, J., Bell, T. G., Saltzman, E. S., Vaillancourt R. D., Behrenfeld, M. J.,: Substantial seasonal contribution of observed biogenic sulfate particles to cloud condensation nuclei, Sci. Rep., 8, 1–14, https://doi.org/10.1038/s41598-018-21590-9, 2018.
Santamaria-Fernandez, R., Hearn, R., and Wolff, J. C.: Detection of counterfeit tablets of an antiviral drug using δ34S measurements by MC-ICP-MS and confirmation by LA-MC-ICP-MS and HPLC-MC-ICP-MS, J. Anal. Atom. Spectrom., 23, 1294–1299, https://doi.org/10.1039/B802890G, 2008.
Savoie, D. L., Prospero, J. M., Larsen, R. J., and Saltzman, E. S.: Nitrogen and sulfur species in aerosols at Mawson, Antarctica, and their relationship to natural radionuclides, J. Atmos. Chem., 14, 181–204, https://doi.org/10.1007/BF00115233, 1992.
Sekiguchi, M., Nakajima, T., Suzuki, K., Kawamoto, K., Higurashi, A., Rosenfeld, D., Sano, I., and Mukai, S.: A study of the direct and indirect effects of aerosols using global satellite data sets of aerosol and cloud parameters, J. Geophys. Res., 108, 4699, https://doi.org/10.1029/2002JD003359, 2003.
Stefels, J., Steinke, M., Turner, S., Malin, G., and Belviso, S.: Environmental constraints on the production and removal of the climatically active gas dimethylsulphide (DMS) and implications for ecosystem modelling, Biogeochemistry, 83, 245–275, https://doi.org/10.1007/s10533-007-9091-5, 2007.
Stroeve, J. C., Jenouvrier, S., Campbell, G. G., Barbraud, C., and Delord, K.: Mapping and assessing variability in the Antarctic marginal ice zone, pack ice and coastal polynyas in two sea ice algorithms with implications on breeding success of snow petrels, The Cryosphere, 10, 1823–1843, https://doi.org/10.5194/tc-10-1823-2016, 2016.
Udisti, R., Dayan, U., Becagli, S., Busetto, M., Frosini, D., Legrand, M., Lucarelli, F., Preunkert, S., Severi, M., Traversi, R., and Vitale, V.: Sea spray aerosol in central Antarctica. Present atmospheric behaviour and implications for paleoclimatic reconstructions, Atmos. Environ., 52, 109–120, https://doi.org/10.1016/j.atmosenv.2011.10.018, 2012.
Udisti, R., Bazzano, A., Becagli, S., Bolzacchini, E., Caiazzo, L., Cappelletti, D., Ferrero, L., Frosini, D., Giardi, F., Grotti, M., Lupi, A., Malandrino, M., Mazzola, M., Moroni, B., Severi, M., Traversi, R., Viola, A., and Vitale, V.: Sulfate source apportionment in the Ny Ålesund (Svalbard Islands) Arctic aerosol, Rend. Lincei, 27, S85–S94, https://doi.org/10.1007/s12210-016-0517-7, 2016.
Vallina, S. M., Simó, R., and Gassó, S.: What controls CCN seasonality in the Southern Ocean? A statistical analysis based on satellite-derived chlorophyll and CCN and model-estimated OH radical and rainfall, Global. Biogeochem. Cy., 20, GB1014, https://doi.org/10.1029/2005GB002597, 2006.
Vallina, S. M., Simó, R., Gassó, S., de Boyer-Montégut, C., Del Río, E., Jurado, E., and Dachs, J.: Analysis of a potential “solar radiation dose–dimethylsulfide–cloud condensation nuclei” link from globally mapped seasonal correlations, Global. Biogeochem. Cy., 21, GB2004, https://doi.org/10.1029/2006GB002787, 2007.
Veres, P. R., Neuman, J. A., Bertram, T. H., Assaf, E., Wolfe, G. M., Williamson, C. J., Weinzierl, B., Tilmes, S., Thompson, C. R., Thames, A. B., Schroder, J. C., Saiz-Lopez, A., Rollins, A. W., Roberts, J. M., Price, D., Peischl, J., Nault, B. A., Møller, K. H., Miller, D. O., Meinardi, S., Li, Q., Lamarque, J., Kupc, A., Kjaergaard, H. G., Kinnison, D., Jimenez, J. L., Jernigan, C. M., Hornbrook, R. S., Hills, A., Dollner, M., Day, D. A., Cuevas, C. A., Campuzano-Jost, P., Burkholder, J., Bui, T. P., Brune, W. H., Brown, S. S., Brock, C. A., Bourgeois, I., Black, D. R., Apel, E. C., and Ryerson, T. B.,: Global airborne sampling reveals a previously unobserved dimethyl sulfide oxidation mechanism in the marine atmosphere, P. Natl. Acad. Sci. USA, 117, 4505–4510, https://doi.org/10.1073/pnas.1919344117, 2020.
von Glasow, R. and Crutzen, P. J.: Model study of multiphase DMS oxidation with a focus on halogens, Atmos. Chem. Phys., 4, 589–608, https://doi.org/10.5194/acp-4-589-2004, 2004.
Willis, M. D., Leaitch, W. R., and Abbatt, J. P.: Processes controlling the composition and abundance of Arctic aerosol, Rev. Geophys., 56, 621–671, https://doi.org/10.1029/2018RG000602, 2018.
Wyslouzil, B. E., Seinfeld, J. H., Flagan, R. C., and Okuyama, K.: Binary nucleation in acid–water systems. I. Methanesulfonic acid–water, J. Chem. Phys., 94, 6827–6841, https://doi.org/10.1063/1.460261, 1991.
Yan, J., Zhang, M., Jung, J., Lin, Q., Zhao, S., Xu, S., and Chen, L.: Influence on the conversion of DMS to MSA and SO in the Southern Ocean, Antarctica, Atmos. Environ., 233, 117611, https://doi.org/10.1016/j.atmosenv.2020.117611, 2020a.
Yan, J., Jung, J., Zhang, M., Bianchi, F., Tham, Y. J., Xu, S., Lin, Q., Zhao, S., Li, L., and Chen, L.: Uptake selectivity of methanesulfonic acid (MSA) on fine particles over polynya regions of the Ross Sea, Antarctica, Atmos. Chem. Phys., 20, 3259–3271, https://doi.org/10.5194/acp-20-3259-2020, 2020b.
Yin, F., Grosjean, D., and Seinfeld, J. H.: Photooxidation of dimethyl sulfide and dimethyl disulfide. I: Mechanism development, J. Atmos. Chem., 11, 309–364, https://doi.org/10.1007/BF00053780, 1990.
Zhan, J., Li, W., Chen, L., Lin, Q., and Gao, Y.: Anthropogenic influences on aerosols at Ny-Ålesund in the summer Arctic, Atmos. Pollut. Res., 8, 383–393, https://doi.org/10.1016/j.apr.2016.10.010, 2017.