the Creative Commons Attribution 4.0 License.
the Creative Commons Attribution 4.0 License.
 | 17 Jun 2021
Global–regional nested simulation of particle number concentration by combing microphysical processes with an evolving organic aerosol module
Xueshun Chen
Fangqun Yu
Wenyi Yang
Huansheng Chen
Jian Zhao
Ying Wei
Lianfang Wei
Huiyun Du
Qizhong Wu
Jie Li
Junling An
Zifa Wang
Aerosol microphysical processes are essential for the next generation of global and regional climate and air quality models to determine particle size distribution. The contribution of organic aerosols (OAs) to particle formation, mass, and number concentration is one of the major uncertainties in current models. A new global–regional nested aerosol model was developed to simulate detailed microphysical processes. The model combines an advanced particle microphysics (APM) module and a volatility basis set (VBS) OA module to calculate the kinetic condensation of low-volatility organic compounds and equilibrium partitioning of semi-volatile organic compounds in a 3-D framework using global–regional nested domain. In addition to the condensation of sulfuric acid, the equilibrium partitioning of nitrate and ammonium, and the coagulation process of particles, the microphysical processes of the OAs are realistically represented in our new model. The model uses high-resolution size bins to calculate the size distribution of new particles formed through nucleation and subsequent growth. The multi-scale nesting enables the model to perform high-resolution simulations of the particle formation processes in the urban atmosphere in the background of regional and global environments. By using the nested domains, the model reasonably reproduced the OA components obtained from the analysis of aerosol mass spectrometry measurements through positive matrix factorization and the particle number size distribution in the megacity of Beijing during a period of approximately a month. Anthropogenic organic species accounted for 67 % of the OAs of secondary particles formed by nucleation and subsequent growth, which is considerably larger than that of biogenic OAs. On the global scale, the model well predicted the particle number concentration in various environments. The microphysical module combined with the VBS simulated the universal distribution of organic components among the different aerosol populations. The model results strongly suggest the importance of anthropogenic organic species in aerosol particle formation and growth at polluted urban sites and over the whole globe.
- Article
(10055 KB) - Full-text XML
-
Supplement
(646 KB) - BibTeX
- EndNote


The increased concentrations of atmospheric aerosol particles caused by anthropogenic activities have become an important scientific issue due to their substantial climate forcing and health effects (Twomey, 1977; Albrecht, 1989; Charlson et al., 1992; Donaldson et al., 2002; Tsigaridis et al., 2006; IPCC, 2013) on global and regional scales. These effects depend on aerosol size, composition, and mixing state. The direct influence of aerosols on climate is their scattering of solar radiations largely determined by the aforementioned key properties of aerosols (IPCC, 2013). The indirect effects of aerosols involve their ability to affect cloud microphysical properties and precipitation processes by serving as cloud condensation nuclei (CCN), which are highly dependent on CCN number concentrations (Dusek et al., 2006). Ultrafine particles, despite having a lower mass concentration, have a larger health effect because of their ability to easily penetrate the body and their higher number concentrations (Delfino et al., 2005; Kumar et al., 2014). Therefore, it is crucial to gain deep insight into the life cycle of aerosol particles and quantify their sources not only in mass concentration but also in their number concentration.
There are two sources of atmospheric aerosols: direct emissions from primary sources and secondary formation processes (Seinfeld and Pandis, 2006). Mineral dust particles over desert regions and sea salt particles over oceans are the two major natural sources contributing to particle mass and number concentration regionally (Textor et al., 2006). Anthropogenic activities (e.g., fossil fuel combustion and biomass burning) can directly emit particles and they have been the most significant contributors to the aerosols since the industrial revolution (IPCC, 2013). The physical and chemical properties of these primarily emitted particles can be modified by condensation, coagulation, and chemical reactions in the atmosphere (Seinfeld and Pandis, 2006). In addition, new particle formation (NPF) has been reported to be an important contributor to aerosol particles in various global environments (Holmes, 2007; Yu et al., 2008; Yu and Luo, 2009; Kulmala et al., 2013). Field observation studies have also demonstrated that NPF can significantly increase CCN number concentrations (Kuang et al., 2009; Wiedensohler et al., 2009; Yue et al., 2011). Thus, it is necessary to reasonably represent primary emissions, their microphysical aging, and the new particle formation process in 3-D models.
During the past two decades, numerous models have incorporated a microphysical module to describe particle formation processes (e.g., Binkowski and Shankar, 1995; Jacobson, 1997; Stier et al., 2005; Bergman et al., 2012). However, large uncertainties still exist due to the unclear complication of processes and the relevant mechanisms. Intercomparison and evaluation of global aerosol models indicate that the constraint of size-resolved primary emissions and improved understanding of secondary formations are required to improve the ability of the model to simulate particle number size distribution (PNSD) (Mann et al., 2014). Spracklen et al. (2005) found that the size distribution assumption has a large impact on particle number concentrations in the boundary layer. A comparison between the simulations and single particle soot photometer measurements suggested that the model that was employed had a large bias in simulating the number size distribution of black carbon particles (Reddington et al., 2013). Considerable improvements in the simulation of the particle number concentration and aerosol optical properties were achieved by using an optimized size distribution of primary particles in a polluted atmosphere over areas with large emissions (Zhou et al., 2012, 2018). However, much work remains to reduce the uncertainty associated with primary emissions, especially over primary particles-dominated regions (e.g., China) in terms of particle number concentration.
The main source of uncertainty in simulating NPF at regional and global scales can be attributed to the fact that the nucleation mechanism and particle growth rates are unexplained. Although sulfuric acid has been identified as a major component and plays a central role in nucleation (Yu and Turco, 2001; Boy et al., 2005; Kirkby et al., 2011), it could not alone explain the NPF rates (Wang et al., 2013; Kulmala et al., 2013). Recent studies have revealed that certain organic vapors are involved in particle nucleation (Metzger et al., 2010; Zhang et al., 2012; Yao et al., 2018) and contribute considerably to particle growth (Kulmala and Kerminen, 2008; Tröstl et al., 2016). Thus, there is no doubt that a reasonable representation of organic aerosols (OAs) is crucial for aerosol models to realistically simulate NPF and particle growth. However, it is still an open question as to which organic species are possibly involved in new particle formation process. Even the chemical composition and the sources of OAs are still uncertain because they contain a large number of compounds (Goldstein and Galbally, 2007). To date, OAs are still the least understood of the components of aerosols (Kanakidou et al., 2005; Hallquist et al., 2009). Clearly, OA representation is the major uncertainty contributing to the large knowledge gap in elucidating particle formation processes.
In recent years, much progress has been made in simulating the formation of OAs and secondary organic aerosols (SOAs). The two product (2P) model recommended by Odum et al. (1996) has been widely used in 3-D models to describe the SOA formation process empirically. The volatility basis set (VBS) approach was recently developed to represent the oxidation of primary OAs (POAs) and SOAs and the partitioning of OAs in different volatilities between the gas phase and aerosol phase (Donahue et al., 2006). Many regional models have used VBS to simulate OAs and SOAs (Shrivastava et al., 2008; Fountoukis et al., 2011; Ahmadov et al., 2012; Zhao et al., 2016; Han et al., 2016). However, the application of VBS in global models is limited because of the large number of tracers required and the uncertainty of the involved parameters (Farina et al., 2010; Hodzic et al., 2016). There are even fewer applications of this unified framework in 3-D global aerosol models to calculate the processes of particle formation. Among the second phase AeroCom aerosol microphysical models, the simplified parameterization and the 2P method are the most common schemes used to represent SOAs (Mann et al., 2014). Recently, some models have incorporated VBS in their microphysical module to simulate the aerosol microphysical formation process. Patoulias et al. (2015) developed a new aerosol dynamics model with VBS and explored the contribution of SOAs with various volatilities to particle growth in different stages; however, the 3-D modeling was not presented. By assuming equilibrium partitioning for all volatility bins, Gao et al. (2017) implemented VBS in an aerosol microphysics model and examined the effect of semi-volatile SOAs (SV-SOAs) on the composition, growth, and mixing state of particles. Their box model simulation suggested that the volatility of organic compounds simulate rather different mixing states from those simulated by the coagulation process alone in the scheme treating the primary emissions of organics as non-volatile. Matsui (2017) represented aerosol size distribution with a 2-D sectional method in a global aerosol model coupled with the VBS scheme, but the size-bin resolution is insufficient to accurately resolve the growth of new particles.
To our knowledge, there are few 3-D modeling studies using VBS to account for both (1) the kinetic condensation of low-volatility organics and re-evaporation of semi-volatile organics and (2) the size-resolved kinetics of the mass transfer for new particles. In addition, particle formation in the polluted atmosphere was not well understood (Kulmala et al., 2016; Wang et al., 2017; Chu et al., 2019). Over urban areas in northern China, observation and modeling studies have indicated that anthropogenic SOAs contribute a larger fraction to OAs than those of biogenic SOAs and play an significant role in particle formation (Yang et al., 2016; Guo et al., 2020; Han et al., 2016; Lin et al., 2016). Simultaneously calculating both anthropogenic and biogenic SOAs in microphysical models with a high resolution is crucial to resolve the particle formation processes over urban areas. Furthermore, the previous studies focusing on the sensitivity of particle number concentration to primary emissions were based on models without considering the detailed microphysics of organic species (e.g., Spracklen et al., 2006; Chang et al., 2009; Chen et al., 2018; Zhou et al., 2018). Therefore, it is urgently needed to establish a 3-D modeling framework of VBS with an aerosol microphysics module with high size-bin resolution to simulate the particle number size distribution and explore the uncertainties associated with the treatment of primary emissions.
In our previous work, a regional model with detailed microphysical processes has been developed to improve the simulation of NPF during summer in Beijing (Chen et al., 2019). In this study, we extend our work to the global scale and by doing so establish a new aerosol model by coupling a VBS OA scheme with a particle microphysics module in a global–regional nested model. The model performance was evaluated against the measurements at a tower and a dataset collected from published papers. In addition, the model's sensitivity to the size distribution of primary emissions and volatility distribution of POAs were explored to elucidate and quantify the associated uncertainties. This new modeling framework can provide a useful tool to simulate the aerosol microphysical process on both global and regional scales. The description of the model and its development method are introduced in Sect. 2. The experiments setup and model input are detailed in Sect. 3. The observed data used for evaluating model performance are described in Sect. 4. The model results and simulation analysis are presented in Sect. 5. Finally, the conclusions and discussions are summarized in Sect. 6.
2.1 Host model
The host model employed in this study is the Atmospheric Aerosol and Chemistry Model developed by the Institute of Atmospheric Physics, Chinese Academy of Sciences (IAP-AACM). The IAP-AACM is a 3-D atmospheric chemical transport model treating chemical and physical processes for gases and aerosols on global and regional scales using a multi-scale domain-nesting technique (Wang et al., 2001; Li et al., 2012; Chen et al., 2015). The meteorological parameters inputted into the IAP-AACM were simulated by the global version of the Weather Research and Forecasting (WRF) model (Skamarock et al., 2008; Zhang et al., 2012). The IAP-AACM model has been successfully used to explore mercury transport (Chen et al., 2015) and simulate the global and regional distribution of gaseous pollutants and aerosol components (Du et al., 2019; Wei et al., 2019). The calculation of some modules in the model has also been recently optimized (Wang et al., 2017, 2019). The model calculates 3-D advection (Walcek and Aleksic, 1998), turbulent diffusion (Byun and Dennis, 1995), gas-phase chemical reactions (Zaveri and Peters, 1999), dry deposition at the surface (Zhang et al., 2003), aqueous reactions in the cloud and wet scavenging (Stockwell et al., 1990), and heterogeneous chemical processes (Li et al., 2012). The partition of nitric acid and ammonia into particle phase to form nitrate and ammonium is simulated using a thermodynamic equilibrium model (Nenes et al., 1998). The model calculates the online emission of dimethyl sulfide (Lana et al., 2011), sea salt (Athanasopoulou et al., 2008), and dust (Wang et al., 2000; Luo and Wang, 2006). The simulation results of the IAP-AACM have been evaluated against a comprehensive observation dataset and compared with other model results. The model exhibited good performance in reproducing global aerosol components (Wei et al., 2019).
2.2 Advanced particle microphysics module
The advanced particle microphysics (APM) module is an aerosol module that uses the sectional method to represent particle number size distribution. The APM module has been coupled to several 3-D models, such as Goddard Earth Observing System-Chemistry model (Yu and Luo, 2009), Weather Research and Forecasting-Chemistry model (Luo and Yu, 2011), and the Nested Air Quality Prediction Modeling System (NAQPMS; Chen et al., 2014). In APM, there are two types of aerosol particles: secondary particles (SPs) and primary particles (PPs) with a secondary species coating. The definitions of SPs and PPs in our model differ from those of secondary aerosol and primary aerosol commonly used in the community. SPs indicate that they originate from the nucleation and the subsequent growth of newly nucleated particles whereas PPs originate from direct emission. PPs include dust particles, sea salt particles, organic carbon (OC) particles, and black carbon (BC) particles. The APM module has a high size-bin resolution to accurately describe the formation and growth processes of SPs (composed of sulfate, nitrate, ammonium, and organic compounds). SPs are represented by 40 size bins from 0.0012 to 12 µm in dry diameter. Among the PPs, the representation of BC and OC was updated from a modal method in the original version (Yu and Luo, 2009) to a size-bin scheme in the revised version (Chen, 2015). Dust particles from 0.03 to 50 µm are represented by four size bins and sea salt particles from 0.0012 to 12 µm are represented by 20 size bins. SPs are assumed to be internally mixed, and PPs are assumed to consist of a primary core and coating species. SPs and PPs of different categories are externally mixed with each other. In addition to the primary core, the coated species are explicitly simulated in the APM module.
The basic microphysical processes in the APM module include nucleation, condensation or evaporation, coagulation, and thermodynamic equilibrium partition. The nucleation scheme is ion-mediated nucleation (IMN) (Yu, 2006, 2010), which is physically based and constrained by laboratory data and has predicted reasonable distributions of global nucleation (Yu et al., 2008). Because of very low saturation vapor pressure, the condensation of H2SO4 is explicitly calculated. The semi-volatile inorganic species (nitrate and ammonium) and secondary organic species are simulated through equilibrium partitioning. The bulk mass concentrations of coating species are tracked to reduce the computational cost and the corresponding tracers used are defined as BC sulfate, OC sulfate, sea salt sulfate, and dust sulfate. For coagulation, the APM module not only calculates the self-coagulation of sea salt particles, BC particles, OC particles, and SPs but also considers the coagulation scavenging of SPs by four types of PPs. Yu (2011) has further developed the APM module to explicitly calculate the co-condensation of sulfuric acid and low-volatility secondary organic gases (LV-SOGs) on SPs and PPs. In the scheme, the production rate of LV-SOGs and the semi-volatile OAs (SV-OAs) input to APM are simulated with the extended 2P SOA formation model. For high calculation efficiency, a pre-calculated lookup table of coagulation kernels is used in the coagulation module. The numerical scheme used is from Jacobson et al. (1994). More details on the microphysical processes of the APM can be found in Yu and Luo (2009).
2.3 VBS module
To reproduce the formation and evolution of OAs, a 1.5-D VBS approach (Koo et al., 2014) based on 1-D VBS framework but accounting for changes in the oxidation state and volatility of OAs in the 2-D VBS space is coupled to the model. Both secondary and primary OAs are distributed in five volatility bins ranging from 10−1 to 103 µg m−3 in saturation concentration (C*) at 298 K, and the temperature dependence of C* is calculated by the Clausiuse–Clapeyron equation (Sheehan and Bowman, 2001). The compounds distributed in the lowest bin with C* less than 10−1 µg m−3 represent the effectively non-volatile OAs and they are regarded in our model as low-volatility organic compounds that are almost partitioned to the particulate phase. The compounds in the other four bins (i.e., , 101, 102, and 103 µg m−3) are defined as semi-volatile organic compounds that can be partitioned between the gas and particulate phase by using the equilibrium assumption (Donahue et al., 2009). To track the oxidation state of OAs, four basis sets are used in the scheme: two basis sets for chemically aged OAs from anthropogenic and biogenic sources and two basis sets for freshly emitted OAs from anthropogenic sources and biomass burning. The molecular properties of primary OAs (POAs) and SOAs in each volatility bin are provided by the parameters calculated by the 2-D volatility scheme (Donahue et al., 2011, 2012).
In this VBS module, gas-phase organic compounds can be aged by extremely reactive hydroxyl (OH) radicals and other oxidants. Volatile organic precursors of SOAs in this study include compounds with a terminal olefin carbon bond () and an internal olefin carbon bond (). The associated species in the model are terpenes, isoprene, and aromatics. The aging of POAs by OH proceeds at a reaction rate of cm3 molecule−1 s−1 (Robinson et al., 2007). Considering a single oxidation step would not be able to move the oxidation products of POAs into the oxidized OA basis in the volatility bin that is one magnitude lower, the concept of “partial conversion” is used; that is, the oxidation products are a mixture of POAs and oxidized POAs (OPOAs) in the adjacent lower volatility bins (Koo et al., 2014). In addition, the multigenerational oxidation processes of intermediate volatile organic compounds (IVOCs) with OH radicals at a rate constant of cm3 molecule−1 s−1 are considered in SOA formation. To account for the insufficient reduction in carbon number and volatility decrease of the IVOC product, the SOA mass yields from IVOCs are assumed to be lower than that of POAs (Yang et al., 2019). Additional IVOC emissions are assumed to be 4.5, 0.5, and 0.5 times of the POA emissions for vehicles, other anthropogenic sources, and biomass burning, respectively. IVOC emissions are put into the bin of 104 µg m−3 saturation concentration. The VBS module in this study does not consider OA formation through aqueous-phase or heterogeneous reactions although their importance has been suggested in some studies (e.g., Liu et al., 2012; Ervens et al., 2014; Lin et al., 2014). SOAs generated from volatile organic compounds (VOCs), IVOCs, and anthropogenic OPOAs are assumed to be further oxidized by OH radicals at an aging rate of cm3 molecule−1 s−1 based on the work by Koo et al. (2014). The volatilities of multi-generation oxidation products decrease and move down to the adjacent bin with an order of magnitude lower volatility (Donahue et al., 2006). Fragmentation in the 1.5-D VBS module is implicitly considered through reduction in carbon number of the oxidation products. NOx-dependent product mass yields from oxidation of hydrocarbon precursors were determined based on smog chamber data (Murphy and Pandis, 2009; Hildebrandt et al., 2009). The model has 32 pairs of semi-volatile compounds including organic gases (OGs) and the corresponding OAs through equilibrium partitioning. Including the eight groups of low-volatility OAs, the model has 40 groups of OAs and 32 groups of OGs in total. Detailed information on this VBS module can be found in Koo et al. (2014) and Yang et al. (2019).
2.4 Model development
In our previous work, the VBS module was combined with APM to improve the simulation of NPF process in our regional model (NAQPMS+APM; Chen et al., 2019). Here, we use a similar method to couple the VBS and APM into the global model (IAP-AACM). The newly developed model is named IAP-AACM+APM. In the model, not only the aforementioned basic microphysical processes but also the condensation of LV-SOGs and equilibrium partition of SV-OAs are calculated following the approaches described in Yu and Luo (2009) and Yu (2011). In addition to the aforementioned tracers of OAs and OGs, a new tracer for LV-SOGs is tracked in the IAP-AACM+APM. The sources of sulfuric acid and LV-SOGs are photochemical reactions. Their production rates are calculated by the carbon bond mechanism Z (CBM-Z) and VBS module, respectively. The production rate of LV-SOGs is equivalent to that of the lowest bin OAs in the VBS module. For simplicity and computing efficiency, the condensation of LV-SOGs on SPs of various sizes is calculated along with H2SO4 and the low-volatility SOAs (LV-SOAs) on SPs are merged into one bulk tracer (SP-LV). When necessary (e.g., calculating the condensation growth and coagulation of SPs and the coagulation scavenging of SPs by PPs), SP-LV is redistributed to size bins according to the surface area of the particles. The condensation of LV-SOGs on PPs (i.e., dust, sea salt, BC, and OC particles) is calculated in the same manner as H2SO4. The amount of LV-SOA coated on these particles are defined as dust-LV, salt-LV, BC-LV, and OC-LV. In this manner, LV-SOAs are distributed approximately proportional to the aerosol surface area. The SV-SOAs partitioned to SPs in each bin and the coatings on PPs are assumed to be proportional to the corresponding low-volatility organic aerosol (LV-OA) mass. For OC particles, the coated SV-SOAs depend on both the OC-LV and primary organic carbon (POC). The SV-SOAs inputted into the APM is the total mass concentration of 32 groups of SV-OAs in the VBS module. The partition of this part of the OAs is similar to that of the equilibrium partition theory (Pankow, 1994a, b; Odum et al., 1996). By using the aforementioned treatments, the various microphysical behaviors of OAs with different volatilities are reasonably simulated. The dry deposition at the surface level and wet deposition by precipitation of LV-SOGs are modeled using the same scheme as for H2SO4. The dry deposition and wet scavenging of the coated LV-OAs associated with SPs and PPs are calculated using the same scheme as for the sulfate coated on PPs (Yu, 2011).
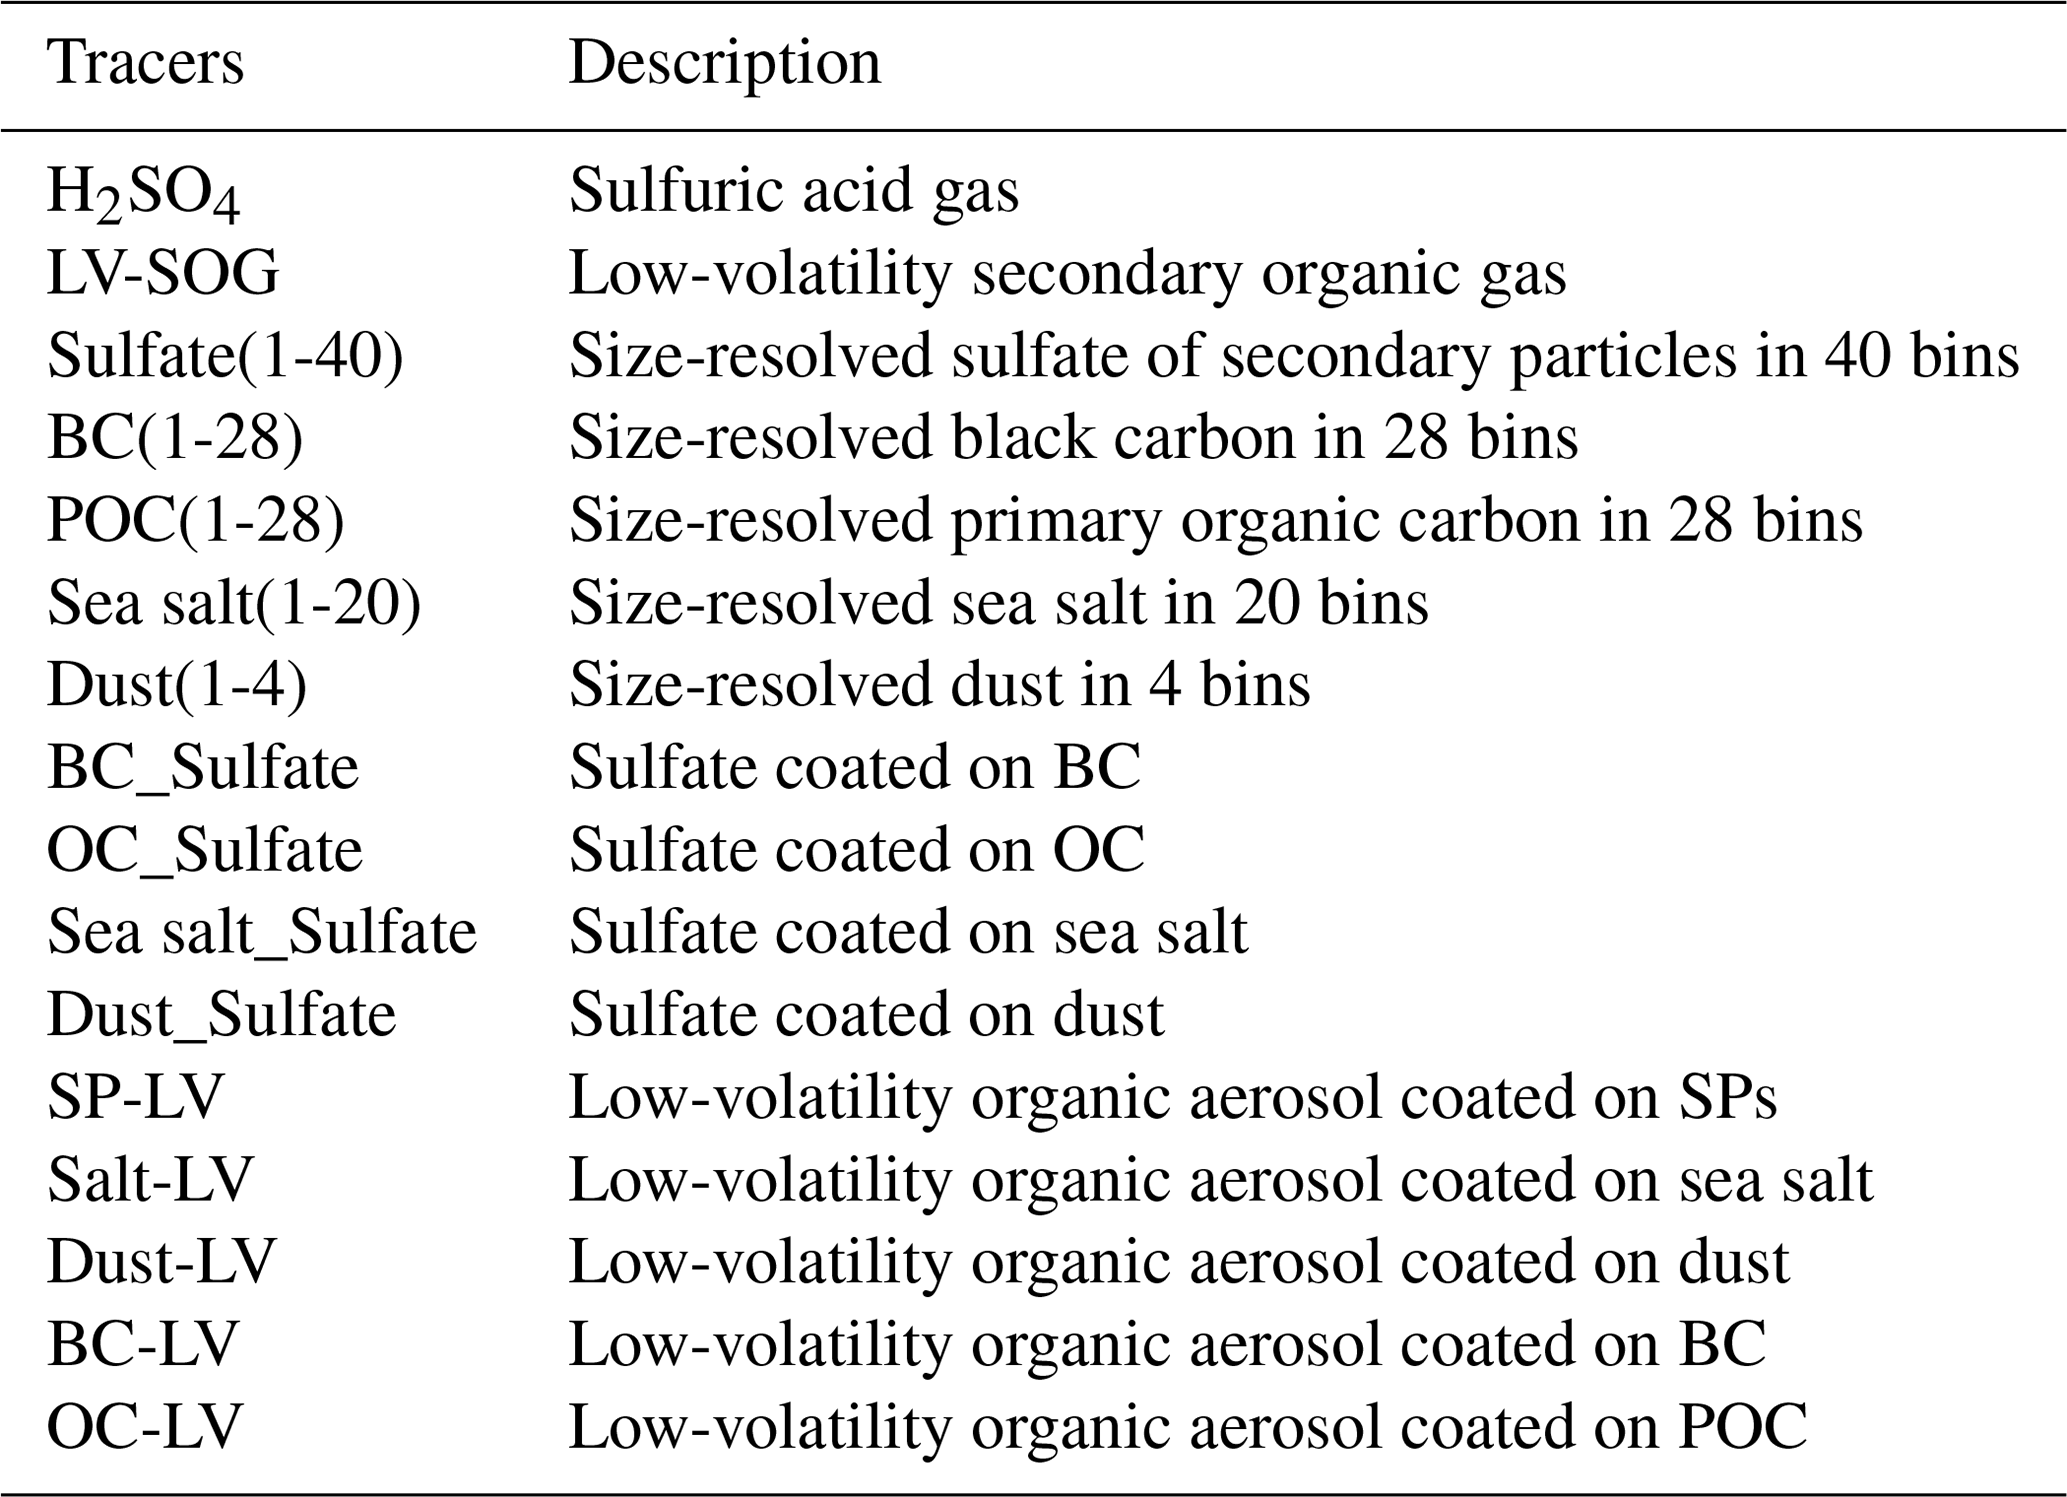
The tracers associated with aerosol microphysical processes in the IAP-AACM+APM are listed in Table 1. Compared with the IAP-AACM, 129 new tracers were added in IAP-AACM+APM; therefore, the computing time of 3-D advection and turbulent diffusion is nearly double that of the IAP-AACM. Among the modules in IAP-AACM+APM, the gas-phase reaction module and the microphysical module are the most time consuming. The newly developed processes in the IAP-AACM+APM do not add much computing time. The total computing time of the IAP-AACM+APM is less than twice that of the IAP-AACM and is acceptable. The aerosol microphysical module combining VBS with APM in this study can be used in other 3-D models.
Table 1The newly added tracers for simulation in microphysical processes.
3.1 Model domain and model inputs
In this study, we used two nested modeling domains for a 1-year simulation in 2010, with the first domain covering the whole globe at 1∘ resolution and the second domain covering East Asia at 0.33∘ resolution. The model has 20 vertical layers and the top layer is at 20 km. The simulation from 1 December 2009 to 31 December 2010 was used for annual mean analysis and the first month of the simulation was spin-up time and not used in the analysis. In addition, a case study in 2015 using three nested domains, with the third domain of 0.11∘ resolution, was conducted to evaluate the model performance in simulating OA components and particle number size distribution at a typical urban site. The model domains are demonstrated in Fig. S1 in the Supplement.
The IAP-AACM+APM model used the same domain and horizontal grid as for the global WRF. Thus, only vertical interpolation of the meteorological fields from the global WRF model was performed to drive the IAP-AACM+APM. The meteorological fields inputted into the IAP-AACM+APM were updated hourly. The initial and boundary conditions of the global WRF was provided by final analysis (FNL) datasets from the National Centers for Environmental Prediction (NCEP) (https://rda.ucar.edu/datasets/ds083.2/, last access: 21 January 2021). The temperature, humidity, wind speed, and pressure in the global WRF were nudged to FNL datasets. For the first domain, a nudging coefficient of 0.0003 for wind, temperature, and water vapor was used in all vertical layers; for the second and third domain, the same nudging scheme was used in vertical layers except those in boundary layer, where nudging was not used. The gridded emission inventory used in the IAP-AACM+APM was an integrated dataset from a publicly available datasets (https://edgar.jrc.ec.europa.eu/htap_v2/index.php, last access: 21 January 2021) and the multi-resolution emission inventory for China (http://meicmodel.org/, last access: 21 January 2021).
3.2 Experiments setting
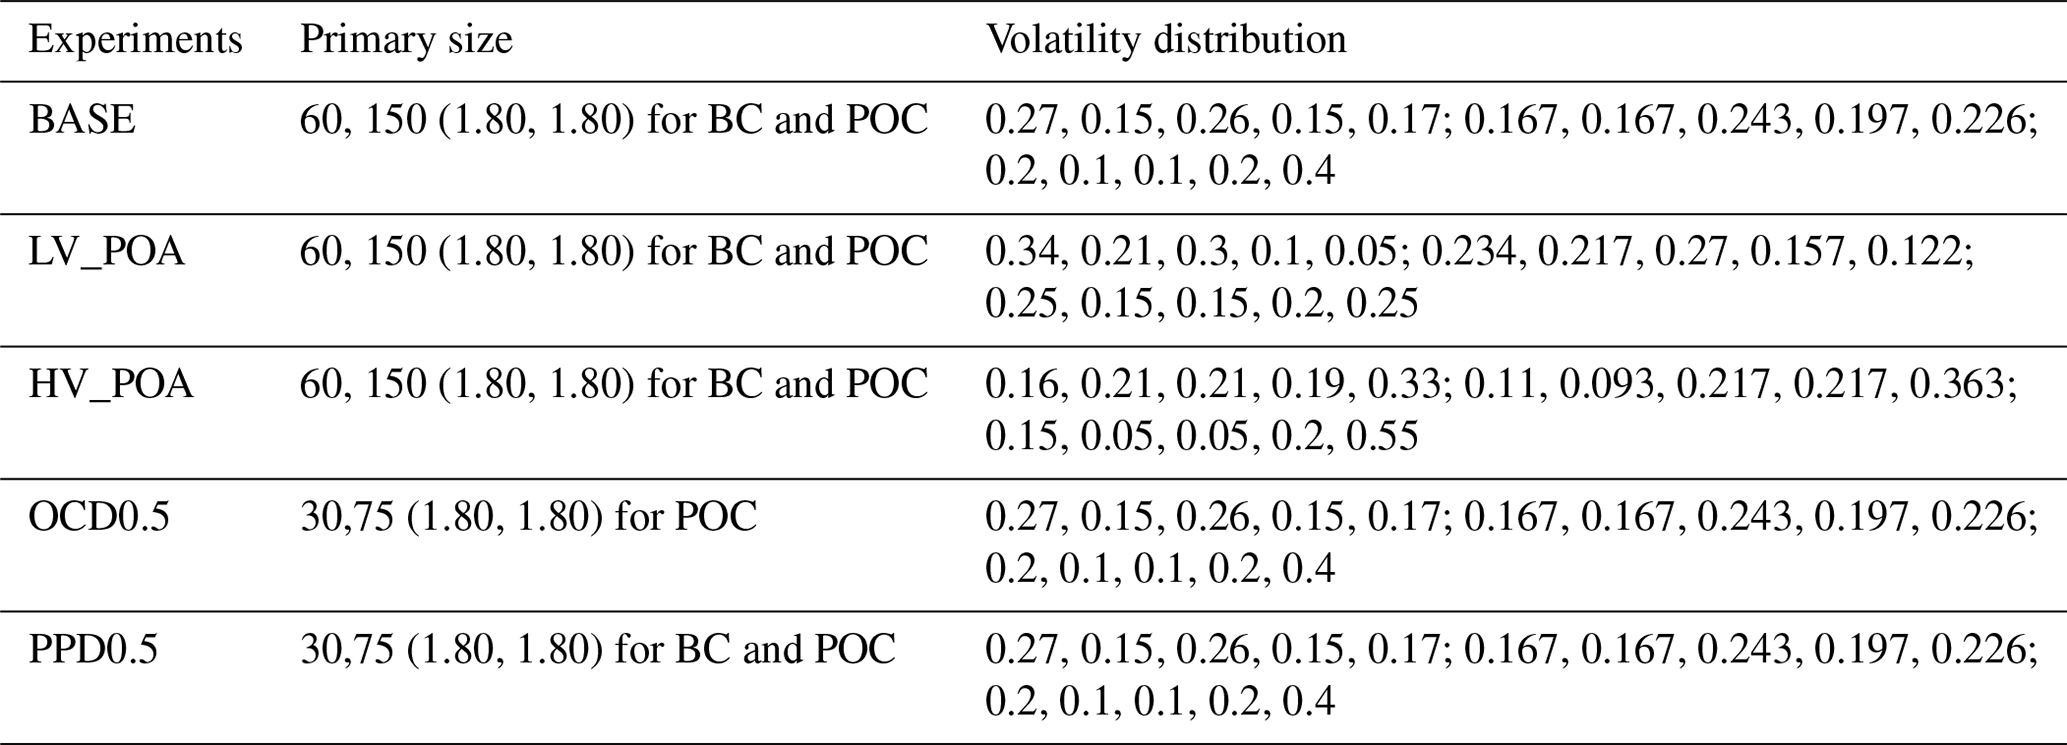
As pointed out in Sect. 1, the size distribution of primarily emitted particles can directly influence the number concentration of PPs through emission and indirectly change the number concentration of SPs through coagulation-scavenging SPs and competing for condensable gases with SPs. In addition, POA volatility distribution can influence the concentration of OAs and the microphysical behavior of OAs and thus the particle number concentration. For these reasons, the sensitivity experiments involving the size distribution of primarily emitted particles, including BC and POC, and the volatility distribution of POAs were designed to investigate the impacts of these factors on the particle number concentration. One base experiment and four sensitivity experiments were used in our study. Table 2 lists the experiments and their corresponding parameters used in this study. In the base experiment, the volatility distributions of POAs from vehicles and biomass burning were based on values from chamber studies (May et al., 2013a, b, c); the factors of other POA emissions were from the estimations of Robinson et al. (2007). The low-volatility POA (LV_POA) experiment and high-volatility POA (HV_POA) experiment used the lower and upper quartiles of the POA volatility distribution factors (May et al., 2013a, b, c; Robinson et al., 2007), respectively. The geometric mean diameters of POC in the OCD0.5 experiment and BC and POC in the PPD0.5 experiment were set as half of the values used in the base experiment.
Table 2Sensitivity experiments and their description. The “Primary size” column refers to the geometric mean diameter values (nm) assumed for primary carbonaceous aerosol emissions. The “Volatility distribution” column refers to the coefficients of POA distributed to the volatility bins for vehicles, other anthropogenic, and biomass burning, respectively. Coefficients for different sources are separated by semicolons and different bins (from the lowest to the highest) by commas.
The hourly observation of OAs and particle number size distribution (PNSD) in Beijing was used to evaluate the model performance in a typical urban environment. The observation site was located at the Tower Branch of the Institute of Atmospheric Physics (IAP), Chinese Academy of Sciences (CAS) (39∘58′ N, 116∘22′ E). The details of the observation site are described in Sun et al. (2015). The observation period was from 22 August to 30 September 2015. OA compositions were measured using a high-resolution aerosol mass spectrometer (HR-AMS; Aerodyne Research Inc.) and an aerosol chemical speciation monitor (ACSM; Aerodyne Research Inc.) at ground level and 260 m, respectively (Zhao et al., 2017). Using a positive matrix factorization (PMF) algorithm (Paatero and Tapper, 1994; Paatero, 1997), organic aerosols (OAs) were separated into hydrocarbon-like OAs (HOAs) and oxygenated OAs (OOAs). A detailed evaluation of PMF results was given in Zhao et al. (2017). PNSDs from 15 to 685 nm at ground level and 260 m on the 325 m meteorological tower were measured using two scanning mobility particle sizers. More details on the observations can be found in Du et al. (2017). In the evaluation of PNSD, the observed PNSDs were mapped to the defined size bins of SPs in APM. In the evaluation of particle number concentration in a size range, the number concentrations of all particles in the corresponding size range were summed for comparison. OC concentrations in 2006 from the Interagency Monitoring of Protected Visual Environments (IMPROVE) network (http://vista.cira.colostate.edu/Improve/, last access: 21 January 2021) and the China Atmosphere Watch Network (CAWNET) reported by Zhang et al. (2008) were compared with the simulated OC of our model. The estimated fractions of OC that is secondary in Zhang et al. (2008) were also used for comparison with the simulations. In addition, a list of surface observations of particle number concentration having at least one full year of measurements was compiled to verify model performance. Table S1 in the Supplement presents the compiled mean concentrations of condensation nuclei larger than 10 nm (CN10) and the corresponding station information from published papers.
5.1 PNSD and aerosol components of SPs in Beijing
The simulated OA concentration was compared with the results of the PMF analysis of the HR-AMS measurements before evaluating the simulated PNSD in Beijing. Here, HOA and OOA components obtained through PMF analysis were compared with the simulation results assuming they are primary and secondary components of OAs (i.e., POAs and SOAs), respectively. Because they were affected by local emission sources (e.g., traffic emissions and cooking emissions), the observed values for OAs were not representative at ground level. Therefore, only HOAs and OOAs at 260 m were used for comparison. The third-domain results at 0.11∘ horizontal resolution, with the other configurations the same as those used in the base experiment, were extracted for analysis and comparison. First, BC simulations were compared with the observations (Fig. 1a), considering that BC is a passive tracer and is generally co-emitted with POAs. The correlation coefficient between the simulated BC and observed BC was 0.70. Because BC is only influenced by emissions, transport, and deposition, the agreement between the model and observations in Fig.1a suggests the model represented these processes reasonably well. Figure 1b and c reveal the comparison of the simulated and observed hourly OA components at 260 m. The comparison in Fig. 1 highlights the good skill of model in capturing the variation of POAs and SOAs in our 3-D framework with VBS. The correlation coefficient between the simulated POAs and observed HOAs was 0.50. Although the measurements at higher levels were not susceptible to local emissions, the observed OA concentrations were inevitably influenced by the sources near the measurement site. For example, cooking-related OAs, assumed to be part of HOAs here, have been identified as an important contributor to OAs (Zhao et al., 2017). Moreover, nearby traffic emissions would also have a large influence on the observed OA concentrations at the measurement site (Sun et al., 2015). Similar to BC, the temporal variation of POAs is mainly influenced by emissions, transport, and deposition; thus, the disagreement between the simulated POA and the observed HOA can largely be attributed to the emissions. In addition, PMF analysis has its own uncertainties and deficiencies (Ulbrich et al., 2009). As a result, some observed HOA values were not reproduced by the IAP-AACM+APM. By contrast, the predicted SOAs and their temporal variation were in better agreement with the OOA observations, although their concentrations were partially underestimated and some peaks were high. The correlation coefficient between the simulated SOAs and observed OOAs was 0.52. Overall, our model simulated the POA and SOA concentrations well. The model also reasonably reproduced the concentrations of fine particulate matter in Beijing and its surrounding cities (Fig. S2 in the Supplement).

Figure 1Comparison of the simulated and the observed (a) black carbon, (b) primary organic aerosol, and (c) secondary organic aerosol concentrations at 260 m height in Beijing from 22 August to 30 September 2015. All the observations are shown with dot points and the simulations with lines.
During the past decades, many field observations have been conducted to study the characteristics of PNSD in Beijing (Wehner et al., 2004; Wu et al., 2007, 2008; Wang et al., 2015). The NAQPMS model has been used to explain the evolution of PNSD in winter in Beijing (Chen et al., 2017). However, 3-D modeling studies on these issues are still limited (Kulmala et al., 2016; Wang et al., 2016). In the current study, the observed PNSD at 260 m was used to evaluate the model performance. Figure 2 presents the comparison of the simulated PNSD with the observations. The model realistically reproduced the evolution of PNSD at 260 m at the measurement site. In the observation, there are five cycles of conversion from clean days to pollution days. Once the pollution episode was over, an obvious new particle formation event occurred, such as the events on 3, 12, 19, and 25 September. When the pollution level increased, the PNSD shifted to the large diameter side. The model successfully captured the NPF events and the growth of particles in the aforementioned pollution episode. Because the atmosphere at higher level is not susceptible to local sources, the observation at 260 m was more representative than that at the ground level. The number concentration of particles from 100 to 685 nm was accurately reproduced, with a normalized bias less than 40 % and a correlation coefficient of 0.70. The consistency between the simulation and observation suggests good model performance in producing a reasonable number concentration of regional aerosol particles, especially in the climate-relevant size range. However, the number concentration of particles from 15 to 25 nm was overestimated. On one hand, the measurements have analytical errors (Du et al., 2017). On the other hand, the model also has several uncertainties. First, the model used the monthly mean emissions and therefore could not simulate the diurnal variation of traffic emissions. In addition, the size distribution of primary emissions did not meet the assumed lognormal distribution. For example, traffic sources emit smaller particles than do industrial sources (Paasonen et al., 2013; Kumar et al., 2014). Second, the nucleation scheme also has some uncertainties (Zhang et al., 2010; Yu et al., 2018). Nevertheless, the main features of NPF events and the growth of particles were captured by the model. Generally, our model produced the aerosols of the real atmosphere and the simulation results were reasonable.
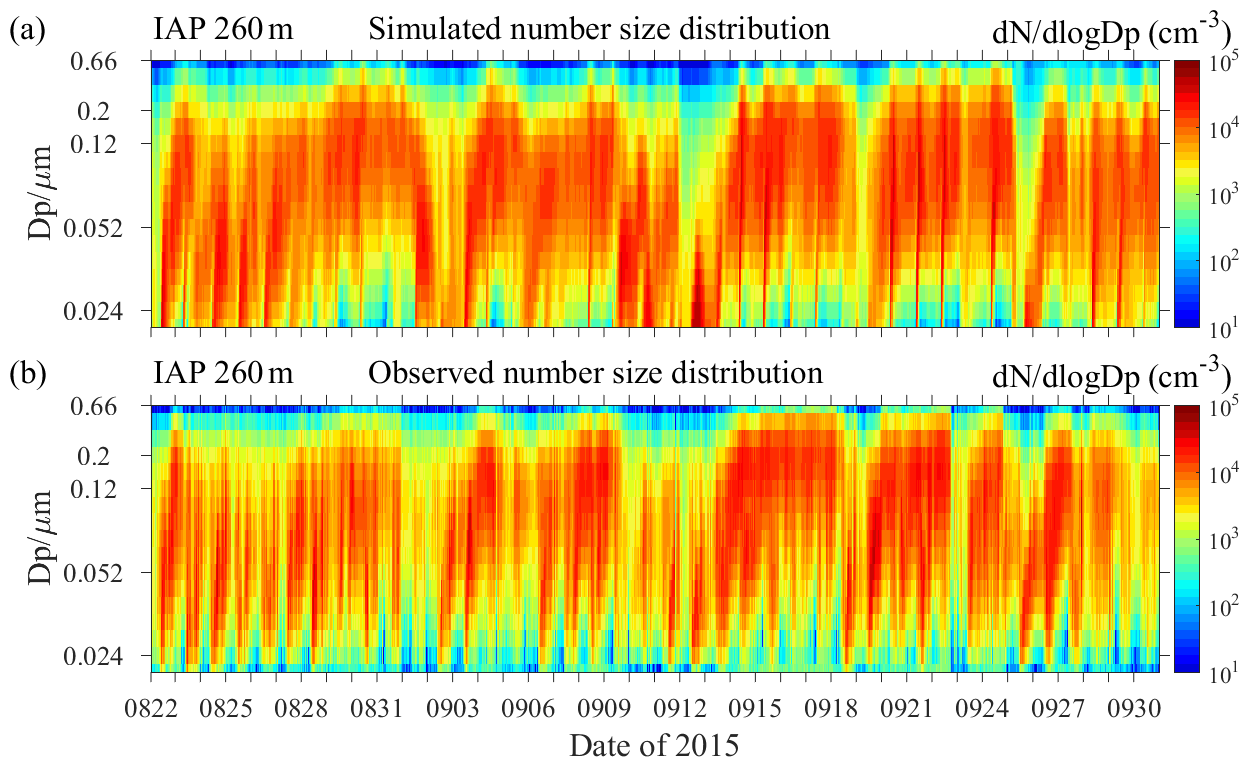
Figure 2(a) Simulated and (b) observed particle number size distribution at high level (260 m) in Beijing from 22 August to 30 September 2015.
The reasonable performance of our model in simulating OA components and PNSD gives us the confidence to further analyze the composition of newly formed particles through nucleation and subsequent growth (i.e., SPs) in our model. Figure 3a shows the simulated mean contribution of sulfate, nitrate, ammonium, and OAs to the mass concentration of SPs in September. Figure 3b displays the contribution of LV anthropogenic OAs (LV-AOAs), LV biogenic OAs (LV-BOAs), SV biogenic OAs (SV-BOAs), and SV anthropogenic OAs (SV-AOAs) to the mass concentration of OAs in SPs. OAs were the major component of SPs, followed by sulfate, nitrate, and ammonium (Fig. 3a). Among the components of OAs in SPs, AOAs accounted for 67 %, substantially larger than the 33 % of BOAs, suggesting the dominant role of AOAs in particle growth. In terms of volatility, LV-OAs comprised 67 %, of which LV-AOAs was responsible for 50 % and LV-BOAs for 17 %. Our model calculated the gas-phase concentration of LV-SOGs and its kinetic condensation on size-resolved SPs. The large fraction of LV-AOAs in the OAs of SPs indicates their critical role in the growth of SPs. Furthermore, LV-AOAs are an indicator of aged atmosphere and its large contribution to OAs suggested the influence of regional transport of OAs and precursors of OAs from surrounding areas to Beijing. The aging and growth during the lifetime of SPs in the atmosphere could greatly enhance their regional impact. In addition to the local emissions of OA precursors (Guo et al., 2014), our results also highlight the importance of regional sources of OA precursors in the growth of new particles.

Figure 3(a) The mean contribution of sulfate, nitrate, ammonium, and OAs to the mass concentration of SPs and (b) the mean contribution of LV-AOAs, LV-BOAs, SV-BOAs, and SV-AOAs to the mass concentration of OAs in SPs in September 2015.
5.2 Global and regional distribution of OAs
There are two important characteristics of OAs that influence particle growth and particle number concentration: (1) the concentration of OAs and (2) the condensation behavior of OAs. The concentration of OAs is dependent on OA sources and sinks. The condensation behavior of OAs is closely related to the separation of POAs and SOAs and their volatility distribution. Therefore, these properties of OAs are given as the background to discuss global and regional particle number concentration. Figure 4 presents the surface distribution of OC concentration and the fraction of secondary OC (SOC) in the base experiment. In our model, OAs are formed by primary emissions and the partitioning of gas-phase species onto preexisting OAs. Therefore, the distribution of OC is well correlated with the amount of primary emissions and SOA precursors. Globally, high concentrations of OC are located in continental regions with large emissions. Over China and India, the OC concentration can exceed 10 µg m−3 because of the high emissions from intense anthropogenic activities. In the tropical region of Africa, OC concentrations are larger than 5 µg m−3 because of biomass burning. Over North America and Europe, OC concentrations are below 3 µg m−3. The model successfully reproduced this spatial difference reflected by the observations in North America and China. The highest concentrations are located in central eastern China. In the second domain (Fig. 4c), the highest concentrations of simulated OC can exceed 15 µg m−3 over some areas in the Sichuan Basin and North China Plain. The model reproduced the OC concentrations over North America and the west–east gradient of OC concentrations over China. However, the absolute concentrations of OC at most sites in China were underestimated by ratios between 40 % and 75 %.

Figure 4Surface layer horizontal spatial distributions of organic carbon concentrations (a, c) and the fraction of OC that is secondary (b, d) over the first domain (a, b) and second domain (c, d). Observed OC and the estimated fraction of secondary OC collected in Sect. 4 are overlapped with shaded circles on the plots for comparison.
The discrepancy over China can be explained by the following reasons: (1) the time difference between the simulation and observation could lead to this discrepancy; (2) the OC emissions over China had large uncertainties (Zhao et al., 2013; M. Li et al., 2017) and the emissions (3.54 Tg C yr−1) used in our study are 47 % lower than a top-down constrained emission (6.67 Tg C yr−1) (Fu et al., 2012); (3) distributing POA emissions to the five volatility bins can lead to a lower OC concentration than that when assuming POAs to be non-volatile (Donahue et al., 2009); (4) the OA pathways included and the parameters used in the model still have uncertainties (e.g., SOA product yields and lacking aqueous SOA formation); and (5) the model resolutions are not high enough to capture the hot points in cities with small urban areas, especially those cities in western China (e.g., Lhasa and Dunhuang). In Sect. 5.1, using the same model configuration but with different emissions, we show that the model can accurately reproduce the BC and OA concentrations in Beijing, which indicates that the emissions are the most influential factor responsible for the inconsistent model performance in OC simulation for the year 2010. The observation-constrained OC emissions by including non-traditional emissions, incorporating new SOA formation pathways, and increasing the model resolution would help reduce the simulation bias of OC over China.
In Fig. 4b, it can be seen that SOC dominated most regions of the globe with the fraction above 70 %. Over China, POC dominated the eastern regions whereas SOC dominated the western regions. In the eastern regions, the higher primary emissions led to the lower fraction of SOC in OC even though the SOC concentrations are higher than those in western regions. In the VBS in our model, there are three pathways forming SOAs, i.e., the oxidation of POAs and the oxidation products of VOCs and IVOCs from anthropogenic and biogenic sources. The simulations of most previous studies (Kanakidou et al., 2005; Tsigaridis et al., 2014) have indicated that biogenic SOAs (BSOAs) are dominant over the global scale because their major sources are from the oxidation of biogenic VOCs. However, our simulations (Fig. 5) indicated that anthropogenic SOAs (ASOAs) are as important as the biogenic, especially over areas with large anthropogenic emissions. Over some areas in India and eastern China, ASOA concentrations can exceed 7 µg m−3, significantly greater than the BSOA concentrations (<3 µg m−3). Even over South America and Africa, there are ASOA concentrations of 1–3 µg m−3 because of the large contribution of IVOCs and POAs emitted from biomass burning. Although a recent study indicated that the VBS representation could not capture the physicochemical dependencies of SOA formation on the dominant pathway from isoprene (Jo et al., 2019), considering the possible underestimation of BSOAs could not reduce the importance of ASOAs. The higher concentrations of ASOAs than BSOAs are also demonstrated by other studies (Matsui et al., 2014; Lin et al., 2016; Zhao et al., 2016). For example, adding an additional SOA correlated with CO emissions can improve the observed OA concentration (Spracklen et al., 2011). In the second domain simulation (Fig. 5c and d), it is more clearly seen that ASOA has higher concentrations than BSOA over China. In the North China Plain, ASOA concentrations were above 3 µg m−3 while BSOA concentrations were below 1 µg m−3. Previous modeling studies using VBS (Han et al., 2016; Lin et al., 2016) have also suggested that ASOAs are dominant in North China. Observation analysis indicated that ASOAs were the greatest contributors of SOA sources, which differs considerably from the reported cases in developed countries (Ding et al., 2014; Y. Li et al., 2017; Tang et al., 2018). In addition, our simulation considered the SOA formation from IVOCs, which has been proved to be a large contributor to SOAs (Zhao et al., 2016; Yang et al., 2019). Clearly, it is the allowing of POAs to be volatile and including the SOA formation from IVOCs that constitute the larger sources of ASOAs. In the case of lower simulated OC concentration than observation, the underestimation of the SOC fraction in source regions (Fig. 4d) indicated that the model underestimated ASOAs and this underestimation is a significant cause of the negative bias in OC over China. The exact contribution of ASOAs to SOAs would be greater than estimated in our simulation. The substantial contribution of ASOAs to SOAs suggests the critical role of ASOAs in particle growth over areas with intense anthropogenic emissions, which will be discussed in Sect. 5.4.
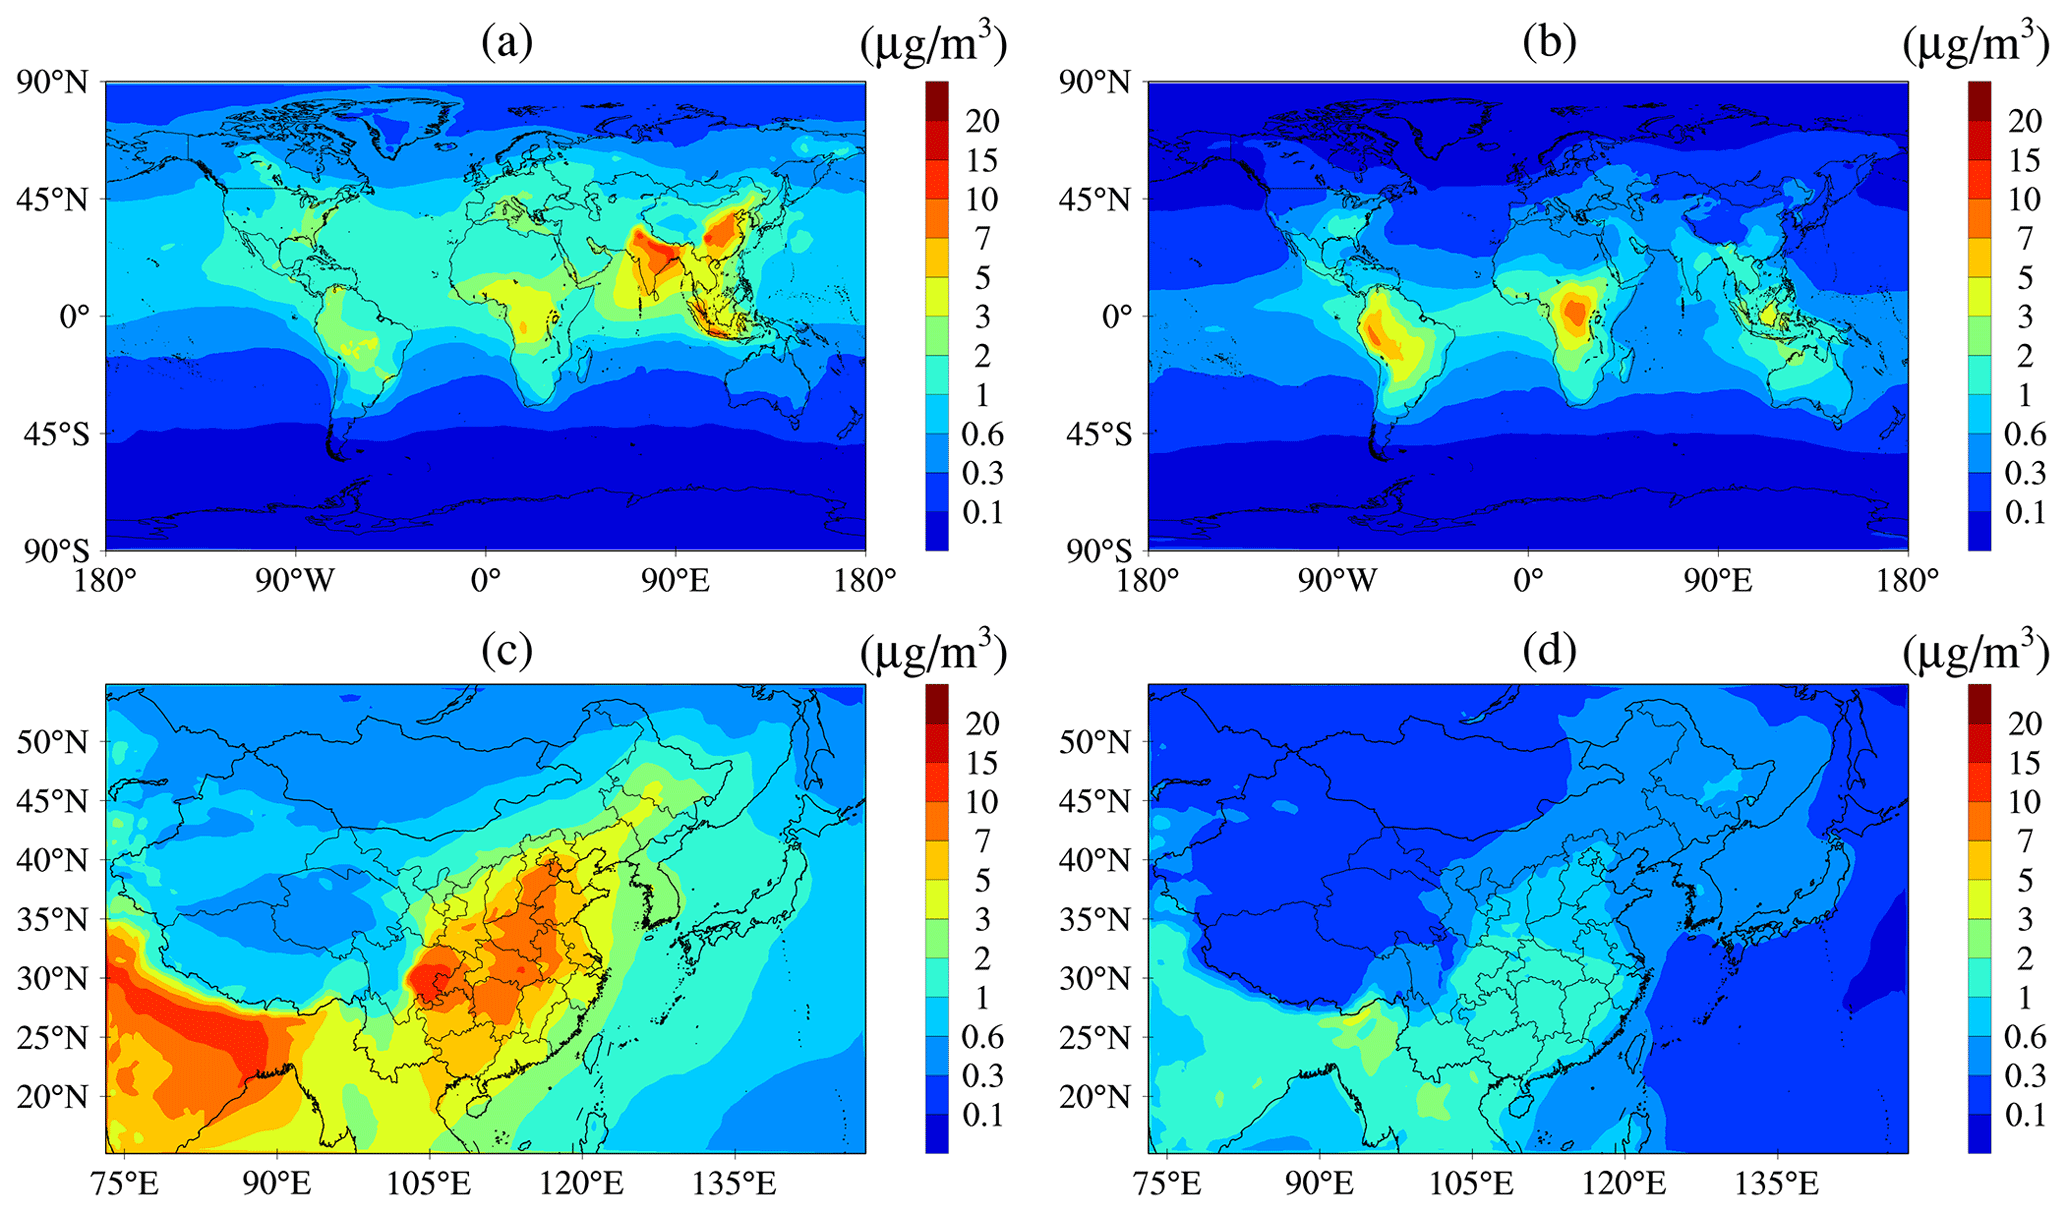
Figure 5Surface layer horizontal spatial distributions of ASOA concentrations (a, c) and BSOA concentrations (b, d) over the first domain (a, b) and second domain (c, d).
The volatility distribution of SOAs is a factor controlling not only the mass concentrations of OAs but also the size distributions of aerosol particles through microphysical processes. The VBS framework can simulate the volatility distribution of OAs in five saturation concentration bins. Riipinen et al. (2011) suggested that approximately half of the condensing mass needs to be distributed proportional to the aerosol surface area to explain the observed aerosol particle growth. The condensation of this part of the OAs is governed by gas-phase concentration rather than the equilibrium vapor pressure, which is how our model calculates the growth of LV-SOAs to particles. The volatility distribution of SOAs is an important factor affecting the global and regional distribution of particle number concentrations. Figure 6 shows the surface layer spatial distributions of SV-SOA and LV-SOA concentrations. Globally, high SV-SOA concentrations are mainly located in the continental source regions. By contrast, LV-SOA distribution is more homogeneous and its contribution to SOA is lower in source regions. The differences between spatial distributions of SV-SOAs and LV-SOAs are mainly caused by different formation processes. The major source of SV-SOAs is the oxidation of VOCs and its distribution is almost consistent with the source areas of VOCs. However, LV-SOAs are formed from the further oxidation of SV-SOGs. Multi-generation aging processes enable LV-SOAs to form both in the source regions and downwind regions. The continental areas with higher emissions have a lower contribution of LV-SOAs. In downwind regions, LV-SOAs have a higher concentration than SV-SOAs. Even over source areas, such as North America and Europe, LV-SOAs also have a higher concentration than SV-SOAs. These results indicate that the multi-generation aging of OA in the VBS produce a higher concentration of LV-SOAs and consequently the wider spread of OAs, which has a large impact on the role of OAs in particle formation processes. Over China, SV-SOAs have a concentration of 3–10 µg m−3 and is dominant over source areas in the eastern region. LV-SOAs have a concentration of 2–5 µg m−3 in the eastern region and 0.6–2 µg m−3 in the western region. Measurement analysis suggested that the OAs and SOAs in Beijing, China, are more volatile than those of cities in Europe and North America (Xu et al., 2019). Our study indicated that, in addition to the different emission sources, the greater volatility of SOAs is also caused by the lower contribution of LV-SOAs to SOAs although the concentration of LV-SOAs over eastern China is higher than that over Europe and North America.
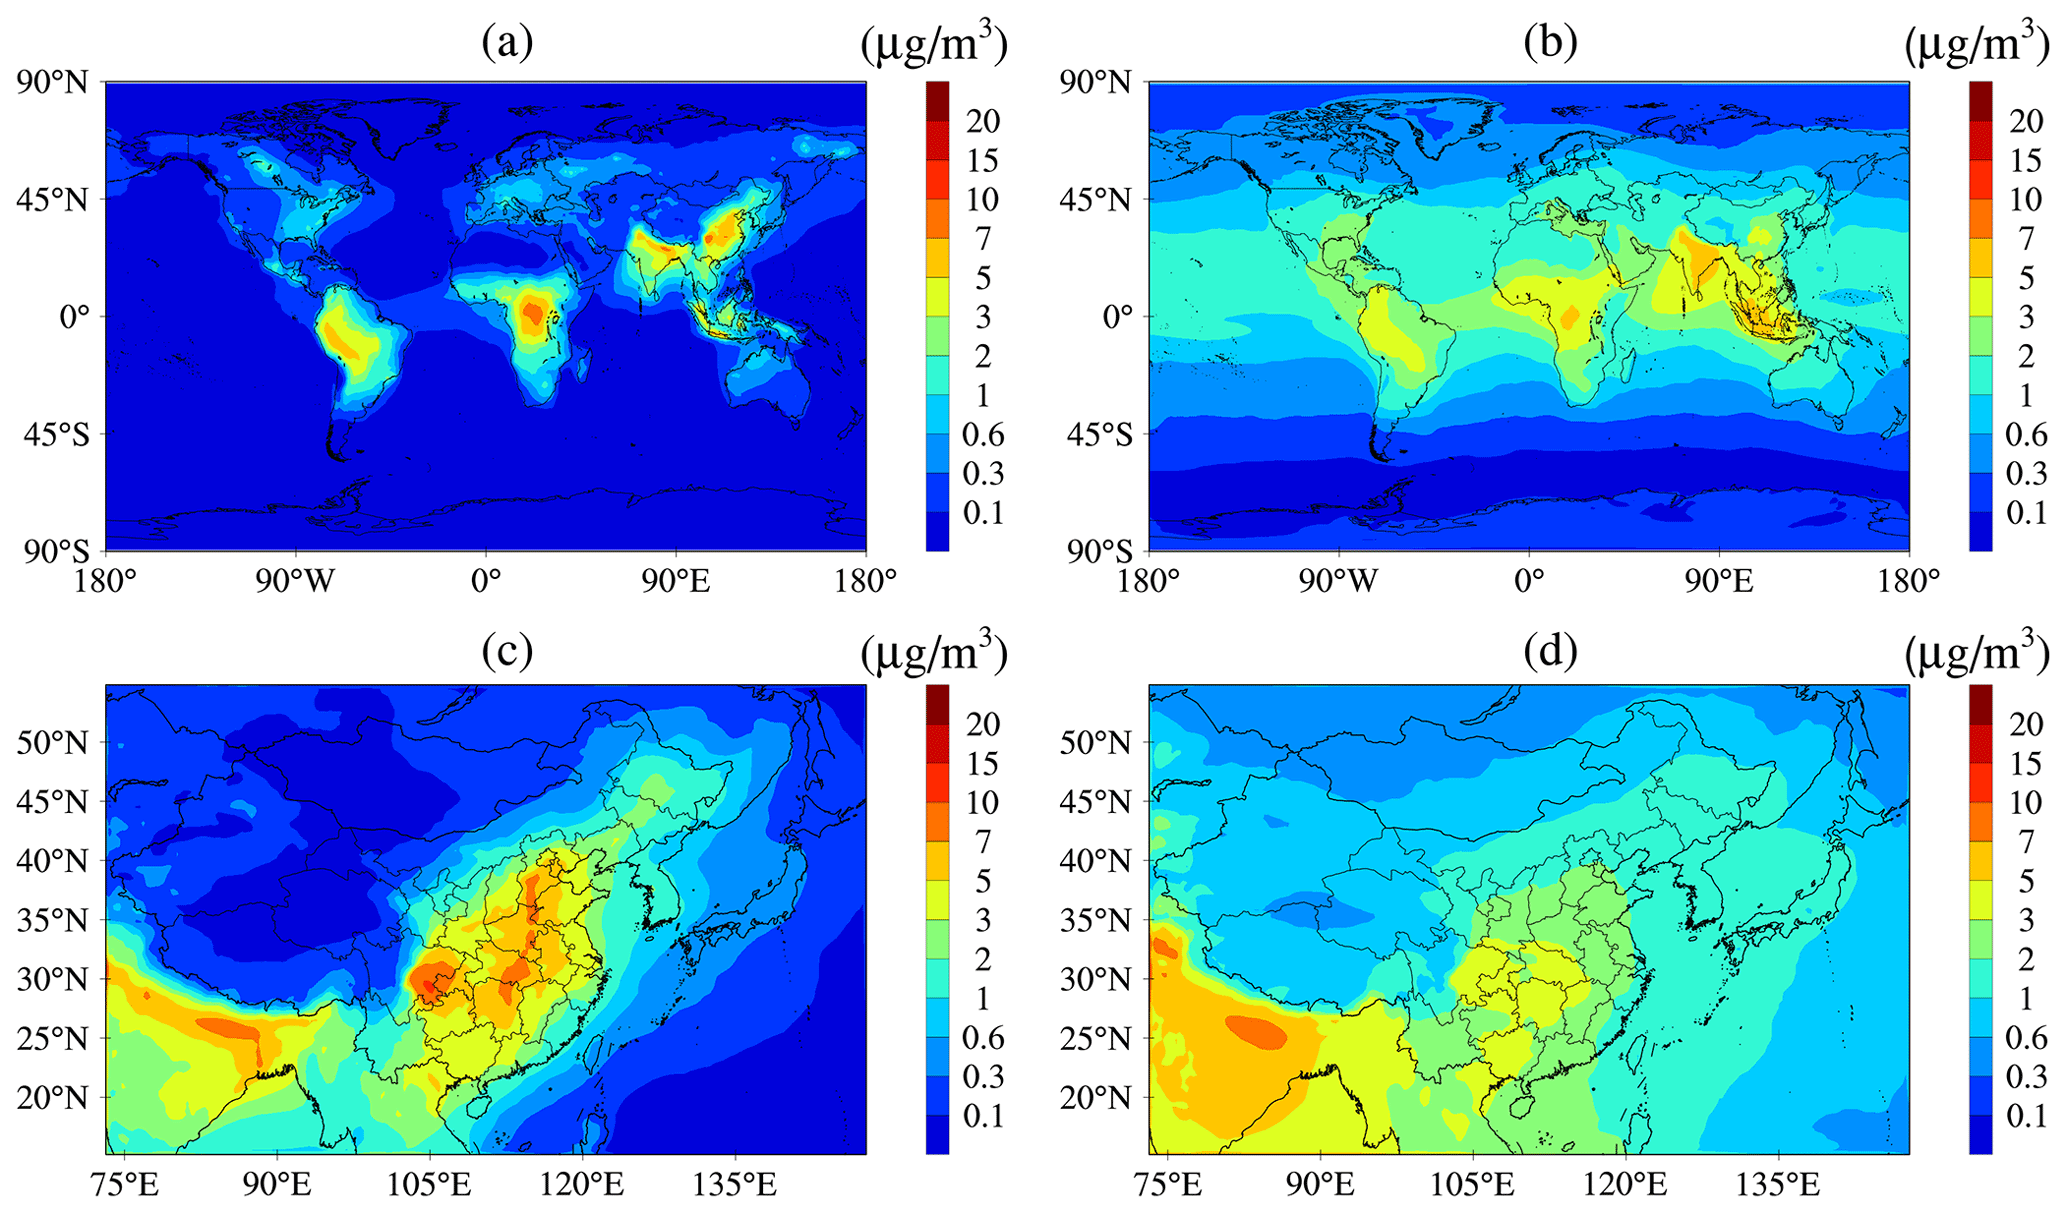
Figure 6Surface layer horizontal spatial distributions of SV-SOA concentrations (a, c) and LV-SOA concentrations (b, d) over the first domain (a, b) and second domain (c, d).
5.3 Global and regional distribution of particle number concentration
Figure 7 displays the simulated surface layer horizontal spatial distributions of annual mean number concentrations of CN10 and the fraction of CN10 that is secondary. The observed CN10 values provided in Table S1 are also illustrated in Fig. 7a and c for comparison. High concentrations of CN10 in the surface layer are located in the regions with large anthropogenic emissions (Fig. 7a). The highest concentrations of annual mean CN10 are over central eastern China and the Sichuan basin, and their values can be larger than 10 000 cm−3. Over the eastern United States, most areas of developed European countries, and India the values of annual mean CN10 are over 5000 cm−3. Over South America and South Africa, CN10 concentrations are also high because of biomass burning emissions. Affected by continental sources and ship emissions, CN10 concentrations over the coastal regions and adjacent seas close to the continent can be over 1000 cm−3. Over the polar regions and the oceans far from continents, CN10 concentrations are lower than 300 cm−3. The model accurately reproduced the aforementioned spatial variation of CN10 represented by observations in different environments. By a more specific comparison (Fig. 8), where the simulation values are compared in a scatter plot with corresponding observations at 34 sites given (Table S1), the simulations of annual mean concentration of CN10 agree quite well with the observations, within a factor of 2 for most of the sites. The spatial pattern of CN10 over the second domain (Fig. 7c) is similar to that of the corresponding region in the first domain (Fig. 7a), but the gradients of CN10 are characterized more precisely because of the higher horizontal resolution. For example, the high concentrations of CN10 over southern Hebei are more clearly depicted in Fig. 7c than in Fig. 7a. The observed annual mean CN10 concentration (12 000 cm−3) in Shangdianzi in eastern China was 5 times greater than that of Waliguan (2030 cm−3) in western China. The corresponding simulated CN10 concentrations, 14 380 and 2780 cm−3, reflected this regional difference well.
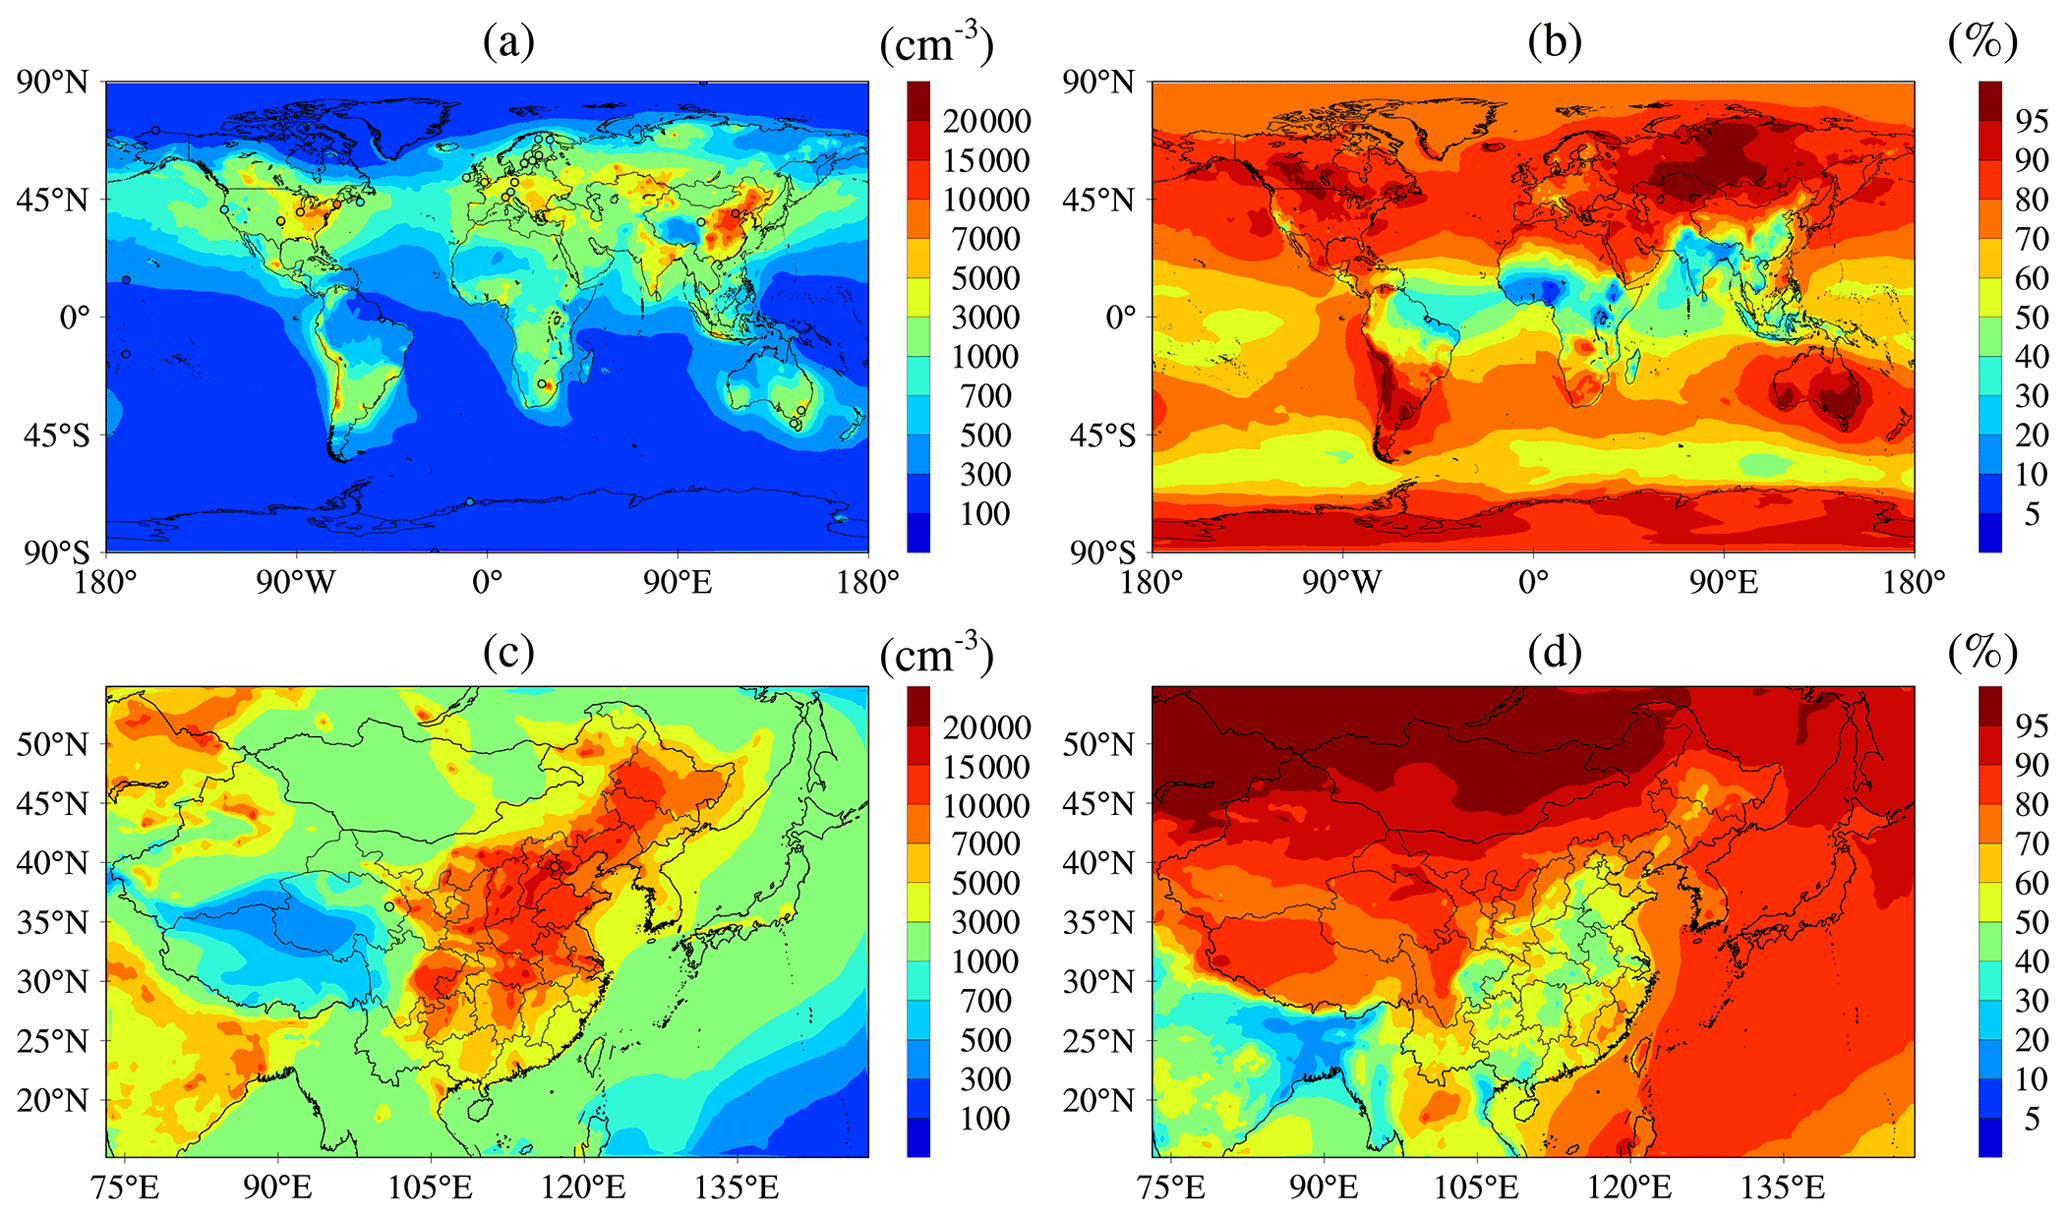
Figure 7Surface layer horizontal spatial distributions of annual mean number concentrations of CN10 (a, c) and fraction of CN10 that is secondary (b, d) over the first domain (a, b) and second domain (c, d). Observed CN10 values in Table S1 are also overlapped with shaded circles on the plots for comparison.
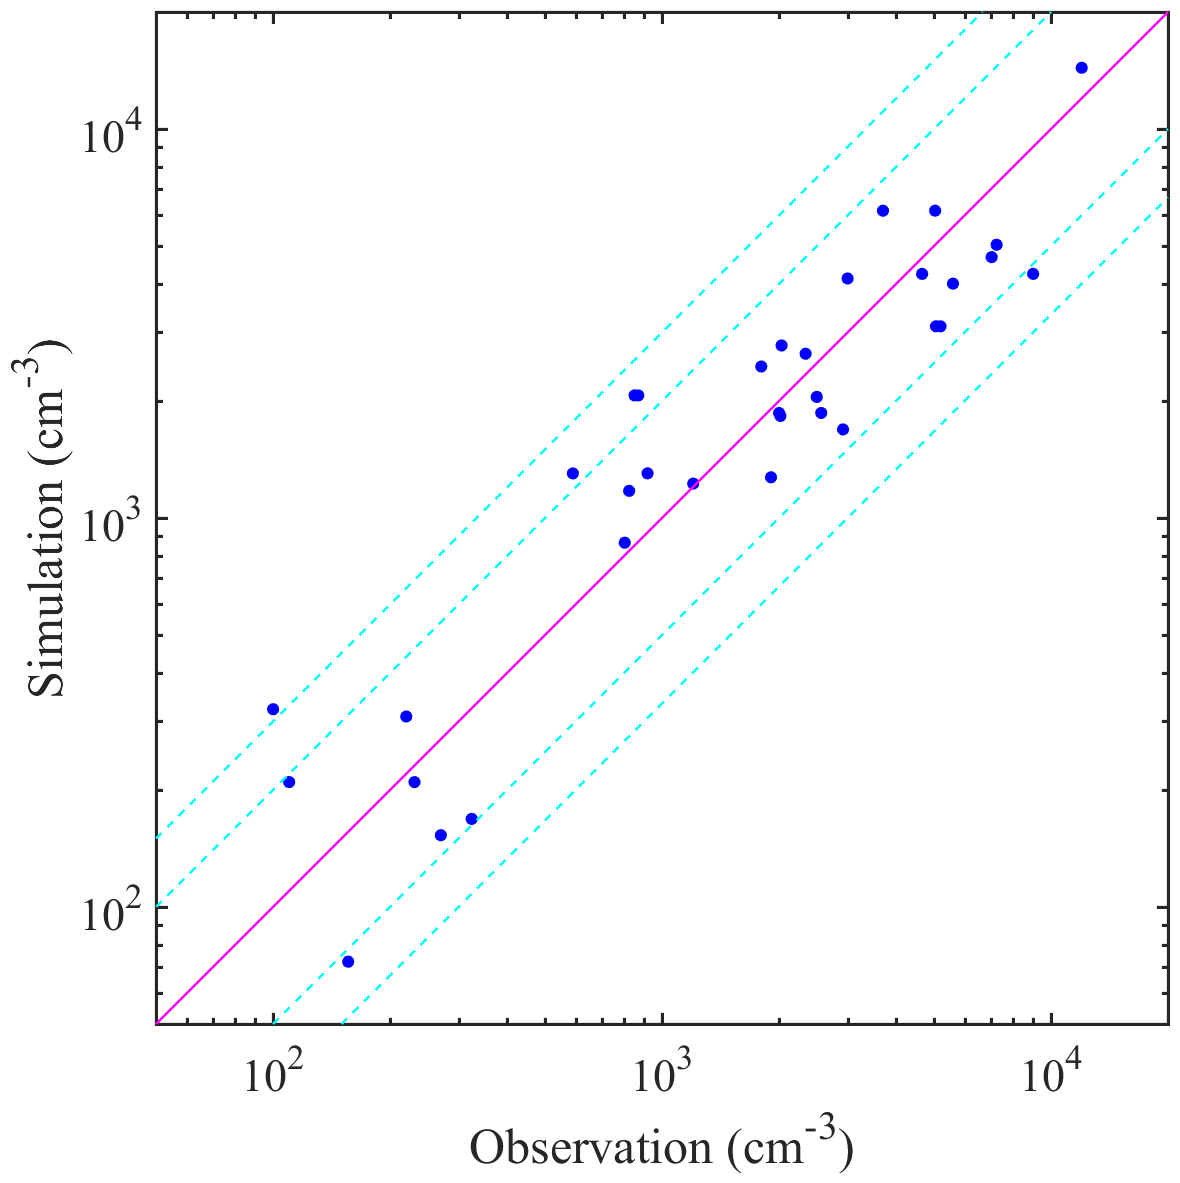
Figure 8Comparison of simulated and observed annual mean number concentrations of particle condensation larger than 10 nm at 34 sites listed in Table S1. The solid carmine line shows a 1:1 ratio and the dashed turquoise lines show ratios of 3:1, 2:1, 1:2, and 1:3.
Both SPs formed through nucleation and subsequent growth and direct emission of PPs can contribute to atmospheric particle number concentration. It is important to quantify the contribution of these two sources in different parts of the globe. In Fig. 7b, it can be seen that SPs are dominant in most parts of the globe except for regions with large primary emissions, such as eastern China, India, and southern Africa. The low contribution of SPs in these regions is due to the strong scavenging of secondary particles by primary particles and the low nucleation rate caused by the competition of PPs for condensable gases. Although secondary aerosol species are high in these regions (Fig. 6), they tend to act as coating species on PPs rather than form new particles; thus, PPs are dominant. This spatial pattern is consistent with the results of a previous study (Yu and Luo, 2009). However, the fractions of SPs in CN10 are lower than those in CN3 reported by Yu and Luo (2009) because of the dominant contribution of secondary nucleation to particles that are 3 to 10 nm in diameter. A boundary from northeast to southwest China can be seen to separate the areas dominated by SPs from that by PPs over China (Fig. 7d). This phenomenon is also caused by the large difference in emissions between the western region and eastern region of the country.
5.4 The mixing state of OAs and their growth to new particles
In addition to particle number concentration, the mixing state of aerosols is also necessary to evaluate aerosol impacts on climate. The VBS framework treats the emitted OAs with diverse volatilities and thus allows them to be partitioned among different aerosol particles through condensation. In addition, the evolving volatility due to oxidation in the atmosphere makes the microphysical behavior of POAs different from that of the non-volatile POAs. In our model, semi-volatile organics are temperature-driven and partitioned through the equilibrium assumption while low-volatility species are kinetically condensed on the particles. Figure 9 presents the fraction of organic species residing in aerosols of different types (i.e., SPs, sea salt, dust, BC, and OC) defined in our model. Most of the organic species reside in OC, SPs, and BC particles, suggesting the intense mixing of anthropogenic aerosol species (Fig. 9). In the Southern Hemisphere, the fractions of organic species residing in SPs are above 30 %, larger than that of OC particles. In the Northern Hemisphere, organic species mainly reside in OC particles because of the higher concentration of POAs and the subsequent partition. The fractions of organic species residing in SPs are lower, but still considerable, indicating the important role of organic species in forming particles over the whole globe. Because of differences in emissions and the associated microphysical processes, there are distinct spatial variations of organic species distribution among different continents. Over the United States, 30 %–40 % of OAs reside in SPs. By contrast, this fraction is below 20 % over China. In China, significant differences also exists between the western and eastern regions. The dominant contribution of semi-volatile species to OAs (Fig. 6) and their partition proportional to LV-OAs lead to a higher fraction of organic species residing in OC particles over eastern China. The mixing of natural aerosols and organic species is also demonstrated in Fig. 9. Over most areas of the globe, 15 % of organic species are distributed in dust particles, which could greatly modify the properties of the dust particles and thus their climate forcing over these regions (Huang et al., 2019).
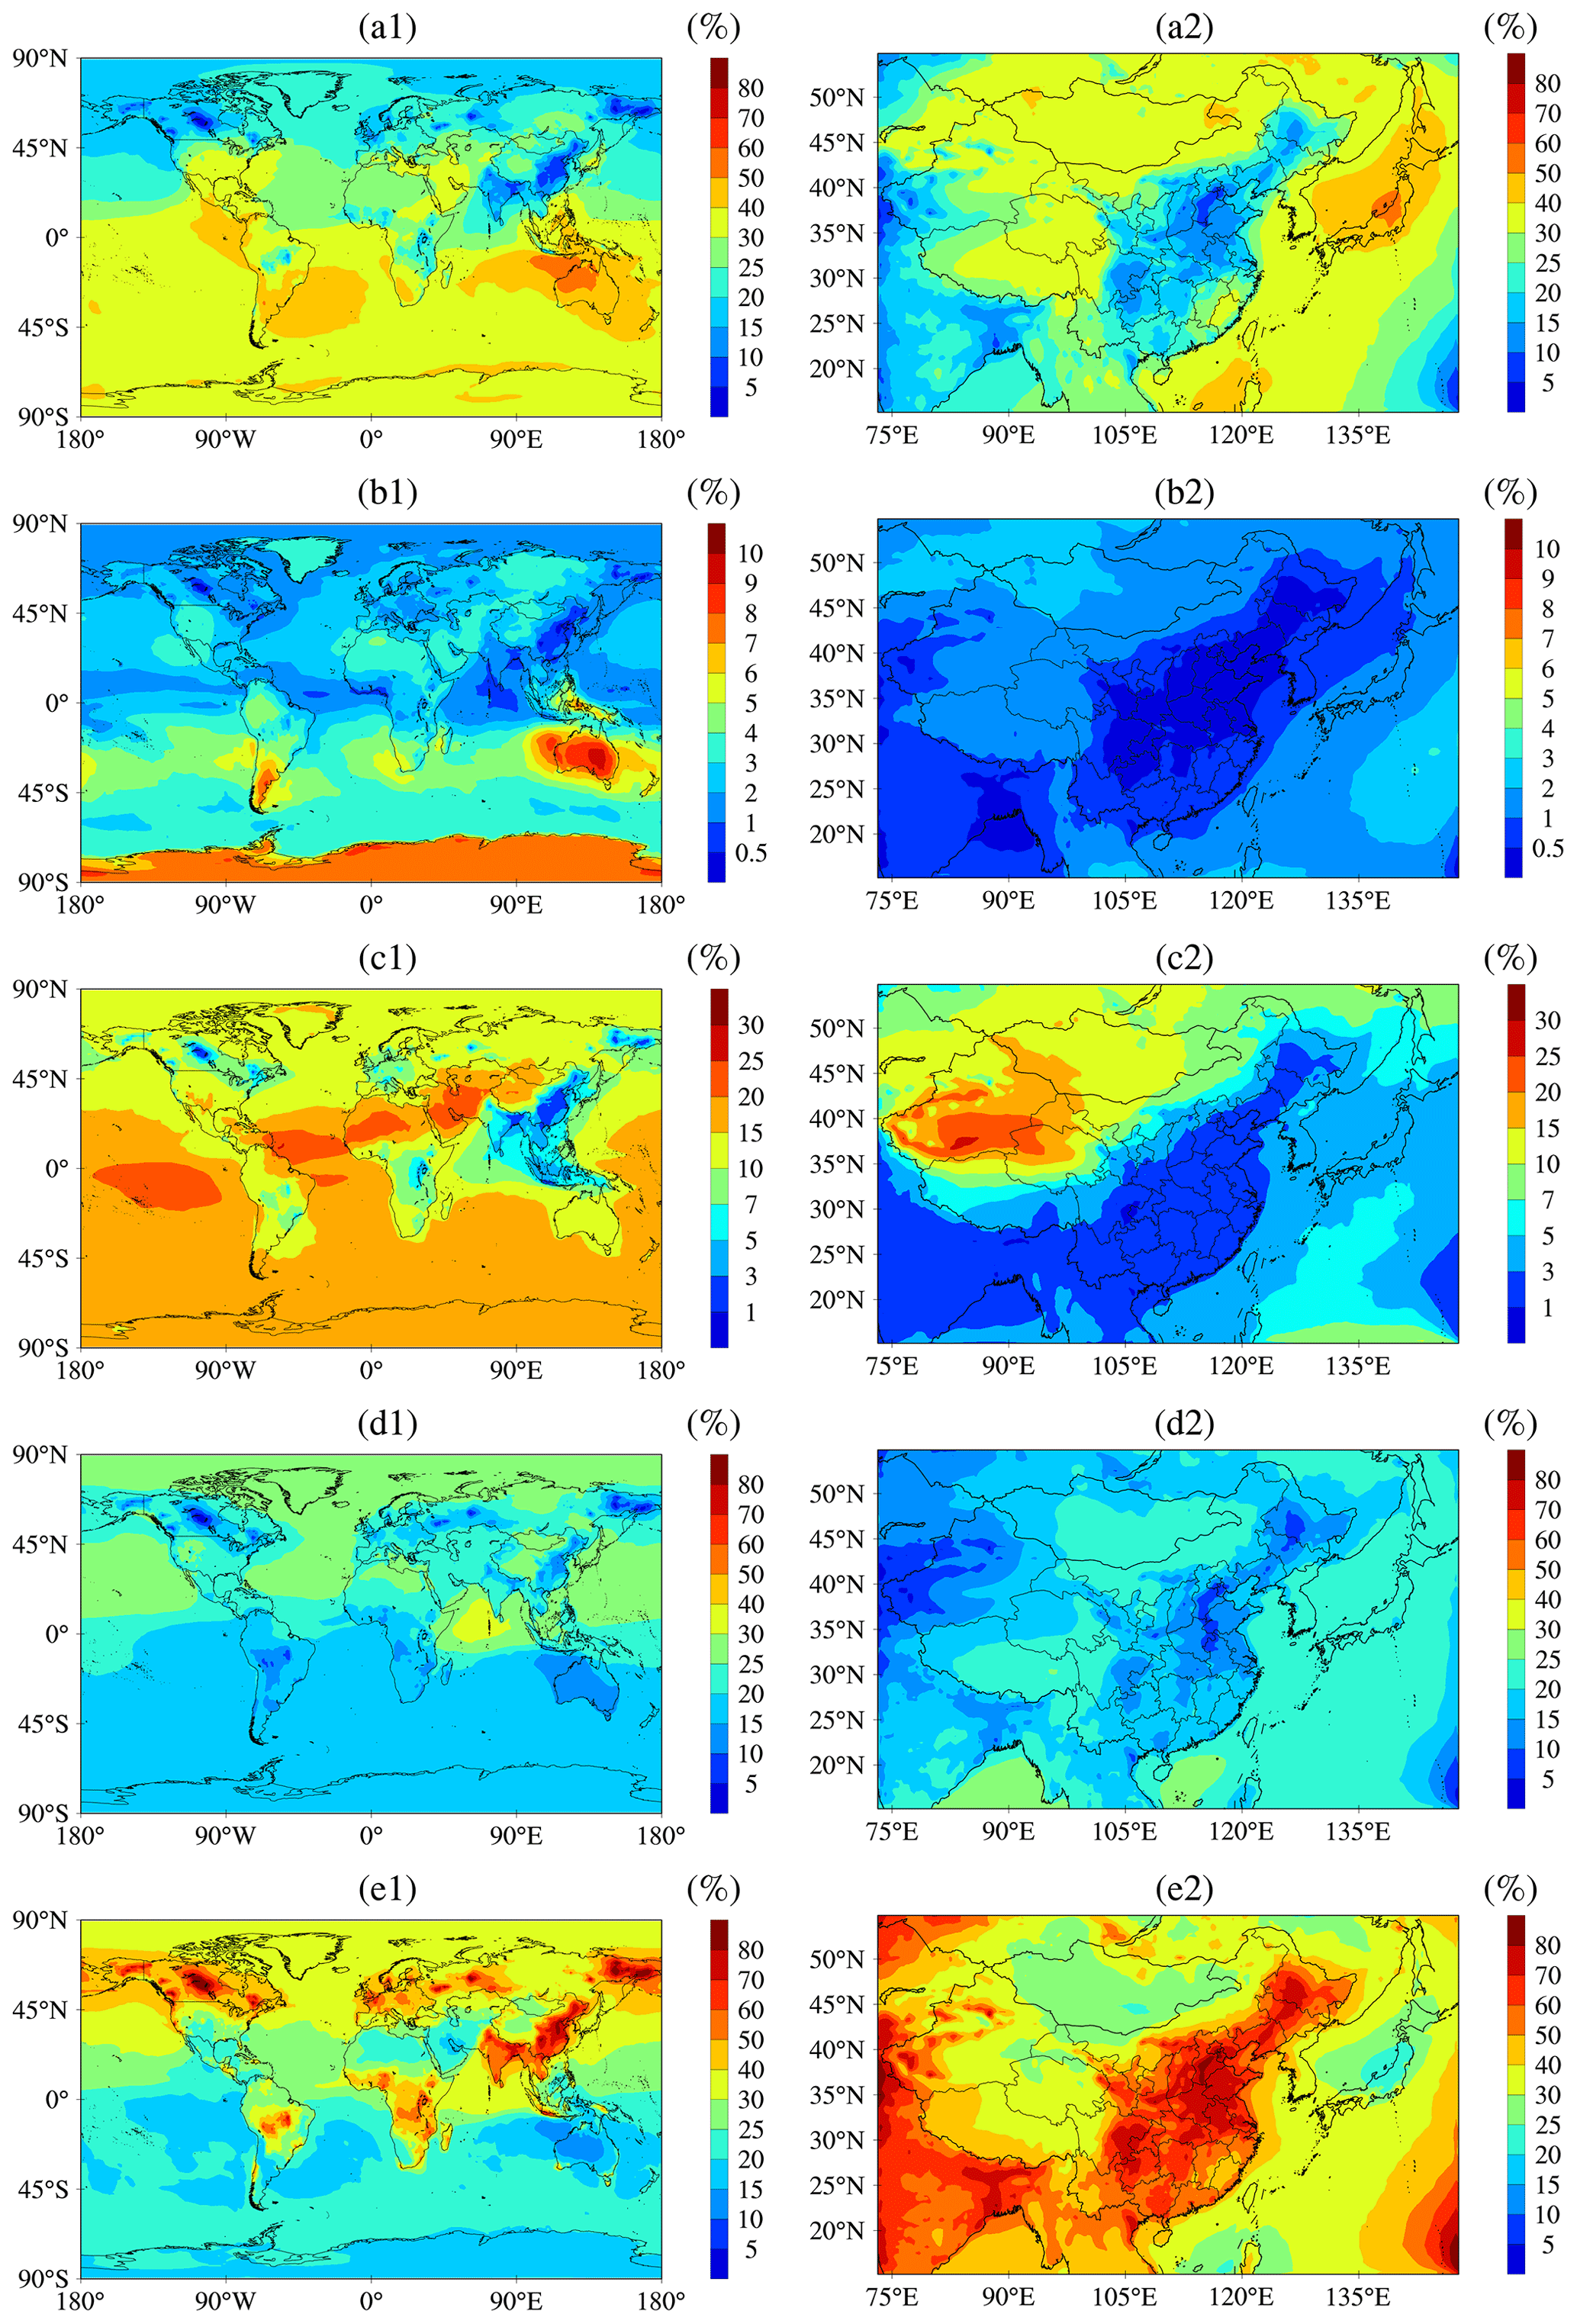
Figure 9Surface layer horizontal spatial distributions of the fraction of organic species that reside in SPs (a1, a2), sea salt (b1, b2), dust (c1, c2), BC (d1, d2), and OC (e1, e2) particles over the first domain (a1, b1, c1, d1, e1) and second domain (a2, b2, c2, d2, e2).
Previous studies have indicated that organic species are the major components of aerosols (e.g., Zhang et al., 2007; Jimenez et al., 2009) and low-volatility organic species can greatly enhance the growth of new particles (e.g., Yu, 2011; Tröstl et al., 2016). Our results also indicated the substantial distribution of organic species in SPs. For this reason, the contribution of LV-SOGs to the growth of SPs was analyzed. Figure 10 shows the ratio of LV-SOGs to H2SO4 and the ratio of low-volatility organic species to sulfate that reside in SPs. The concentration of LV-SOGs is a factor of ∼ 1.5–10 higher than that of H2SO4 over many parts of the continents and the adjacent oceans but is lower in East Asia, the eastern United States, southern Europe, and northern Africa where emissions of SO2 are high. Especially over the areas in Sichuan Basin and eastern China (Fig. 10c), the concentrations of H2SO4 are considerably higher than those of LV-SOGs. Different from the simulation of Yu (2011), our results included anthropogenic LV-SOGs and therefore the ratios of LV-SOGs to H2SO4 are higher, especially in the regions influenced by continental sources and oceans with ship emissions. In Fig. 10b and d, the contribution of low-volatility organic species to the growth of SPs, presented as the concentration ratio of low-volatility organic species to sulfate, is higher in the Southern Hemisphere and lower in the Northern Hemisphere where continental sources of SO2 are larger. Despite being lower, the contribution remains considerable (approximately 10 %–20 %) over Europe and North America. Similar to the contribution of ASOAs to SOAs, LV-SOAs residing in SPs are dominated by anthropogenic contributions over POA source areas (as is the case in Beijing; Fig. 3). The condensation growth of SPs through low-volatility organic species can enhance their survival rate and therefore could increase the contribution of SPs to particle number concentration. These results highlight the importance of ASOAs in new particle growth over polluted regions, such as eastern China and India.
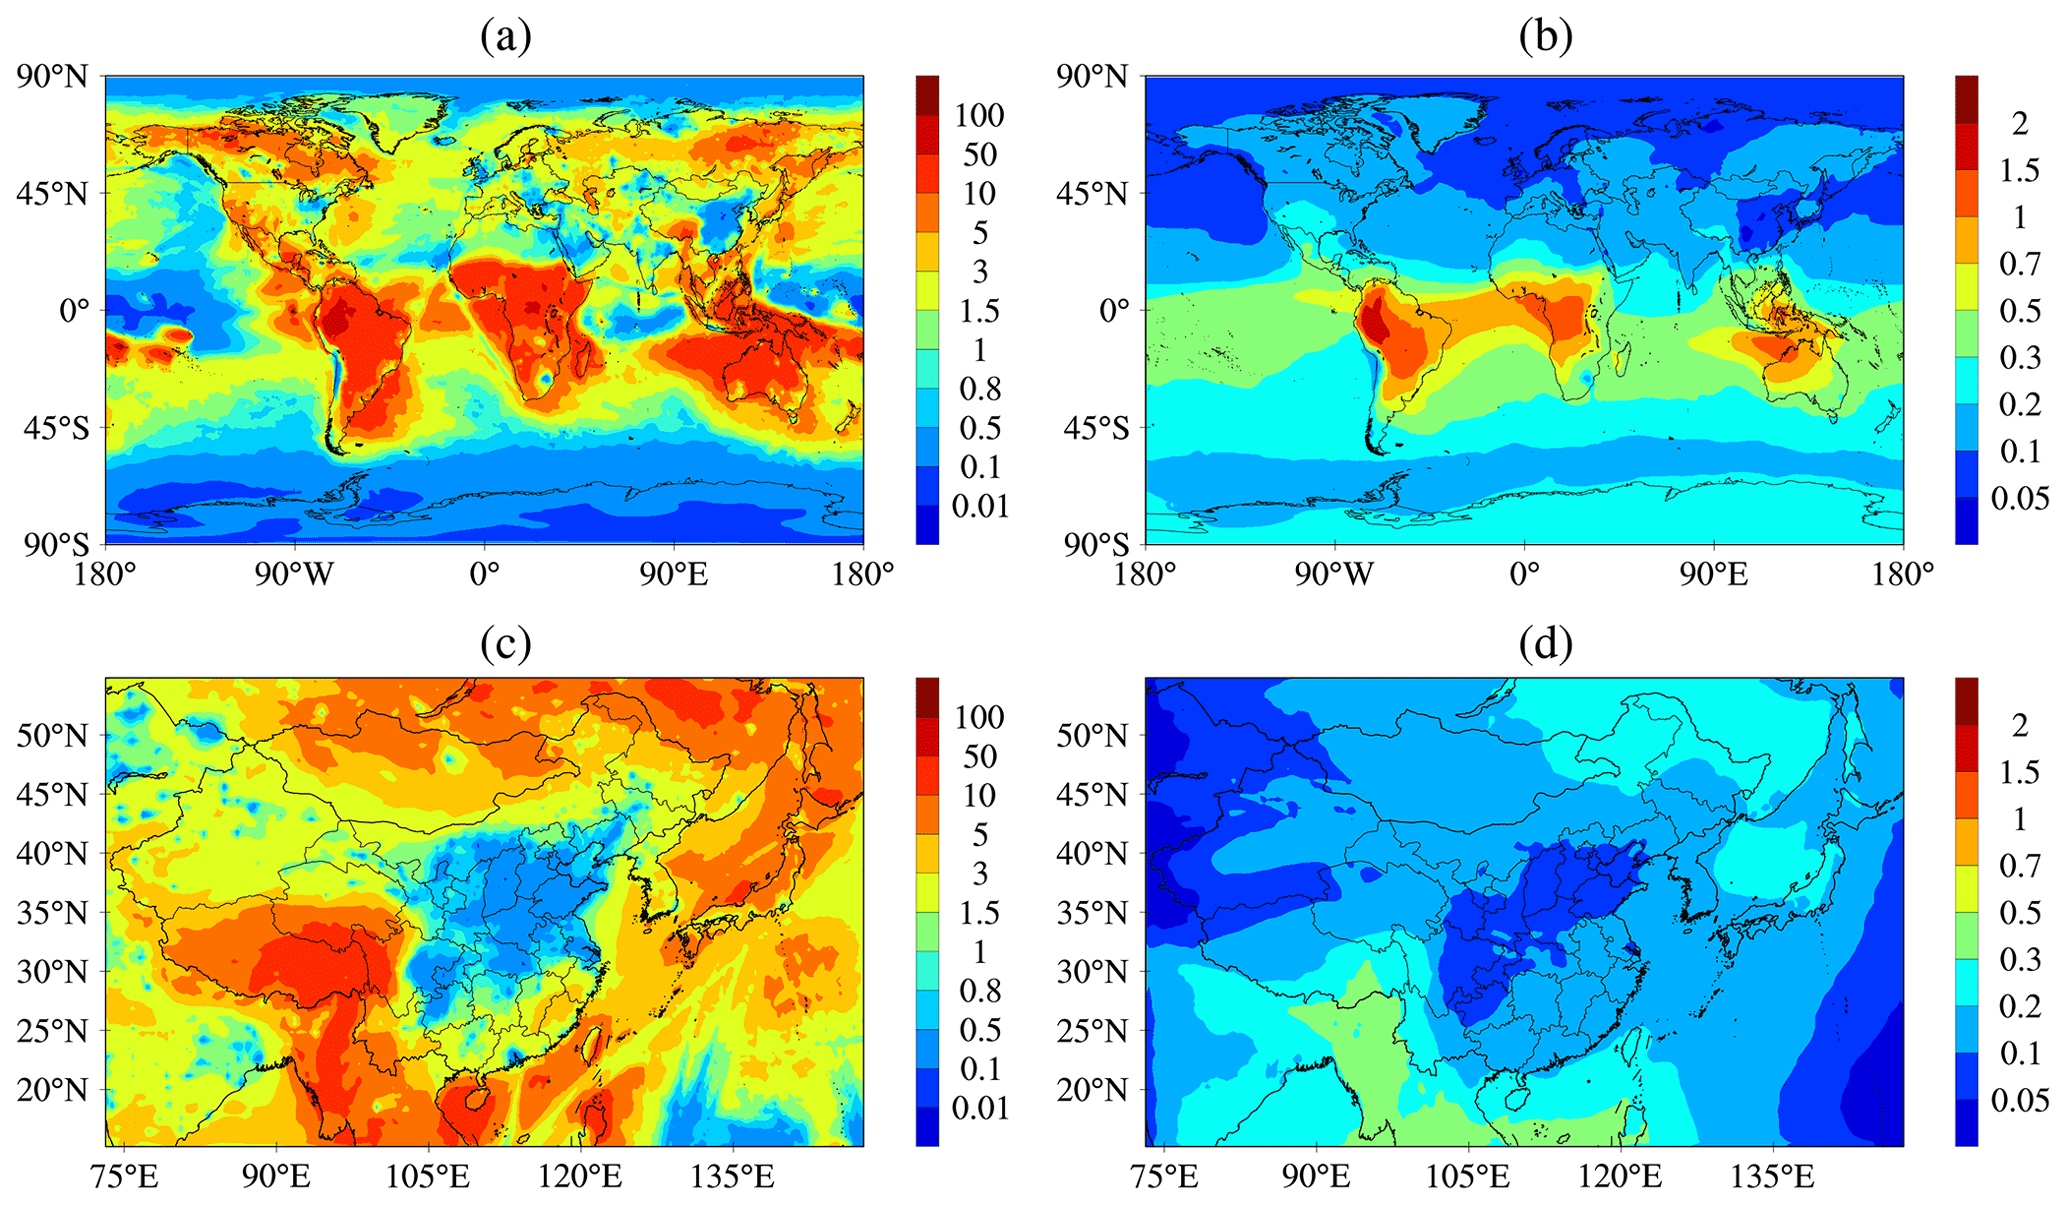
Figure 10The ratio of LV-SOGs to H2SO4 (a, c) and the ratio of LV-OAs to sulfate (b, d) that reside in SPs. Panels (a, b) is for the first domain and panels (c, d) for the second domain.
5.5 Sensitivity of particle number concentration to volatility of POAs
In the VBS, POAs are treated as volatile species and allowed to be aged by oxidation in the atmosphere; thus, it is necessary to explore the uncertainties associated with this treatment of volatility distribution. In addition, the size distribution of POAs and the associated microphysical processes are also modified because of this treatment. Therefore, the sensitivity of particle number concentration to the volatility of POAs and the assumed size distribution of PPs are discussed here. Figure 11 displays the change ratio of CN10 number concentrations in the LV_POA experiment, HV_POA experiment, PPD0.5 experiment, and OCD0.5 experiment relative to that in the base experiment. Overall, CN10 concentrations changed little when POA volatilities were in the inter-quartile range of measurements (Fig. 11a and b). When using the low-volatility distribution of POAs, PPs number concentrations were increased by 5 %–10 % over most areas in the Northern Hemisphere; the concentrations decreased by 5 %–10 % when the high volatility distribution of POAs was used. By contrast, SP number concentrations only exhibited minor changes over the areas with the strongest emissions. Because of the dominant contribution of SPs, CN10 had no clear change in most regions of the globe. By contrast, the size distribution of emitted PPs has a large influence on the CN10 concentration. When the median diameter of BC and OC was set as half the size used in the base experiment, concentrations of CN10 increased by 50 %–150 % over the areas with large emission sources of BC and OC, which were too high to match the observations shown in Fig. 7a. For example, the CN10 in the PPD0.5 experiment was greatly overestimated when compared with the observed concentration (12 000 cm−3) in Shangdianzi in eastern China. Therefore, halving the median diameter of BC and OC in the PPD0.5 experiment could not represent the real situation. However, halving the median diameter of OC only leads to the increase of CN10 by 10 %–50 % over eastern China. Over the other areas with high emissions, no observations were available for comparison. Considering the other factors affecting the simulation of CN10, we cannot confirm that the assumed median size of OC is too small in the PPD0.5 experiment. Moreover, the emitted OC particles are volatile and can re-evaporate after dilution (Robinson et al., 2007; Donahue et al., 2009). The assumption of OC size distribution should consider OC volatility. To clarify this matter, it is necessary to measure the size distribution of freshly emitted primary particles and compare the model results with observation in a polluted atmosphere dominated by PPs.

Figure 11Relative change of number concentrations of CN10 in the (a) LV_POA experiment, (b) HV_POA experiment, (c) PPD0.5 experiment, and (d) OCD0.5 experiment to that in the base experiment.
Laboratory studies and field observations have highlighted the importance of the sources of OAs, volatility distribution, and the microphysical behavior of organic species in particle formation processes; however, OA processes are still poorly represented and this lack of knowledge contributes considerably to model uncertainties in simulating aerosol microphysical properties. In this study, a new global–regional nested aerosol model was developed to simulate detailed microphysical processes in the real atmosphere. The new model combines the APM module and a VBS module to simulate the microphysical processes of OAs. In the model, the OAs in the lowest volatility bin are treated as non-volatile or low-volatility species and their condensation is simulated using the kinetic method. The OAs in other volatility bins are simulated using equilibrium partitioning. Using this framework, both the condensation of secondary inorganic species (i.e., sulfuric acid, nitrate, and ammonium) and the condensation of organic species with various volatilities (i.e., low-volatility organic compounds and semi-volatile organic compounds) are simultaneously simulated, which represents a major advantage of our new model. The concentration of low-volatility organics is separately calculated and the condensation of H2SO4 and LV-SOGs on size-resolved SPs is explicitly simulated, along with the condensation of LV-SOGs on PPs. Therefore, the growth of LV-SOGs to new particles and the aging of PPs by organic species were represented in a realistic way.
Compared with most models in the second phase of AeroCom (Tsigaridis et al., 2014; Mann et al., 2014) and recently developed new models (e.g., Yu, 2011; Patoulias et al., 2015; Gao et al., 2017), our model includes more comprehensive sources of SOA, especially anthropogenic SOAs, by using the VBS framework. In addition, allowing POAs to evaporate and re-condense onto the particles makes its microphysical behavior resemble that of SOAs and therefore gives new meaning to the POA–SOA split, which has a substantial effect on global CCN formation (Trivitayanurak and Adams, 2014). The flexible framework of APM combined with VBS produces the different distribution of organic species in aerosols (i.e., the mixing state of OAs), which has been found to cause substantial differences in the radiative effects of aerosols (Zhu et al., 2017). Box model analyses revealed that LV-SOAs have a large fraction in the growing nucleation mode particles (Pierce et al., 2011). The comprehensive thermodynamic–kinetic approach treating the condensation and the partitioning of organic species that originated from biogenic and anthropogenic sources enable us to investigate the full role of organic species in the growth of new particles, which is vital for understanding the formation processes of particles relevant to radiative forcing and clouds (Shrivastava et al., 2017).
The model with three nested domains was applied to simulate the aerosol components and PNSD in the megacity of Beijing during a period of approximately 1 month. The simulation results were evaluated by observations at a high level on the IAP tower, which is more representative than ground level observations on the regional scale. The simulated BC and OA components agreed well with the PMF analysis of the AMS measurements. The evolution of PNSD and NPF events were also nicely reproduced by the model. Our modeling analyses revealed that AOAs account for the largest part of the OAs of SPs and thus contribute considerably to the growth of SPs in Beijing. Molteni et al. (2018) indicated that highly oxygenated organic compounds that formed from anthropogenic VOCs can substantially contribute to NPF in urban areas. Observations in Beijing suggested that anthropogenic VOCs are major constituents of SOAs (Ding et al., 2014; Yang et al., 2016). For the first time, the contribution of AOAs to new particles was quantified because of the mixing state our model resolved in our study. Although the exact role of AOAs in NPF is not perfectly clear, our study explicitly demonstrated the critical role of AOAs in NPF in Chinese megacities, which can help elucidate the mechanism of more frequent occurrences of NPF events than theoretical prediction in a polluted atmosphere (Kulmala et al., 2017; Chu et al., 2019). Comparisons with the observations collected from published data revealed that the model well reproduced the annual mean concentration of the observed OC at continent sites in America and the spatial pattern of OC in China. Because of the re-evaporation and oxidation of POAs and the additional emission of IVOCs, ASOAs become dominant in SOAs over POA source areas. At sites in different environments over the globe, the model produced reasonable CN10 concentrations within a factor of 2 of observed values for most of the sites. We noted that LV-SOGs, especially anthropogenic SOAs, have a large contribution to new particle growth over areas with intense anthropogenic emissions, such as eastern China. The global simulation of Kelly et al. (2018) indicated that including large anthropogenic SOA sources could achieve results consistent with observations over mid-latitudes of the Northern Hemisphere. Simulation over East Asia also indicated that most of the OAs were from anthropogenic sources (Matsui et al., 2014). Together with these studies, our modeling results further provided the direct evidence of AOAs in particle formation processes not only in Chinese megacities but also in other regions influenced by anthropogenic sources on the global scale.
Sensitivity analyses indicated that CN10 concentration changed only a little in the regions with the highest POA emissions and had no clear change in most regions of the globe when POA volatilities were in the inter-quartile range of measurements. Although the size distribution of primary emitted particles has a large effect on the simulation of CN10, as suggested by other studies (e.g., Spracklen et al., 2006; Chang et al., 2009; Zhou et al., 2018), the simulation of the base experiment had better agreement with the observations than the sensitivity experiments and the conclusions will not be changed. Even so, the importance of the size distribution of primary emitted particles should be emphasized. Global model results in a related study suggested the high sensitivity of CCN to the assumed emission size distribution (Lee et al., 2013). Recently, Xausa et al. (2018) found that using size-segregated primary particle number emissions can help make the number concentration of accumulation mode particles closer to the measurements. The current simulation indicates to the importance of parameterization of the size distribution of emitted OC particles after considering their re-evaporation and condensation. Therefore, the primary emissions must be constrained both in their size distribution and volatility. In addition, the simulated properties of OAs were also determined by the parameters of the VBS module, the emissions inventory and meteorological fields inputted into the model, and the physicochemical processes in the model. Although our model provided reasonable calculations comparable with the available observations and model results of other authors, it has room for further improvements in the future. For example, the size-resolved emissions of anthropogenic PPs may be used as the model input to reduce the associated uncertainties. The fixed parameters in VBS make it difficult to represent the real formation pathway of SOAs and capture the response of SOAs to emission changes (Jo et al., 2019). More accurate parameterizations considering the key physicochemical dependencies should be incorporated to update the VBS module in our model. More nucleation schemes may also be implemented into the model to investigate the influence of nucleation schemes on the aerosol number concentrations because the uncertainties from the nucleation scheme remain large (Dunne et al., 2016). Aqueous-phase formation processes of SOAs have an evident influence on the particle properties and total SOA mass (Ervens et al., 2011), and these processes can close the gap between simulations and observations (Lin et al., 2014). Finally, the description of aerosol microphysical processes should be refined by including the aqueous formation of SOAs in our model.
All of the observations in this research are provided in the paper. The simulation data can be made available from the authors upon request (chenxsh@mail.iap.ac.cn, zifawang@mail.iap.ac.cn).
The supplement related to this article is available online at: https://doi.org/10.5194/acp-21-9343-2021-supplement.
XC developed the model, performed the simulations and analysis, and prepared the manuscript with contributions from all co-authors. FY provided the code for the APM module and modified the manuscript. WY coupled the VBS module and modified the manuscript. YS, WD, and JZ provided the observation data in Beijing and modified the manuscript. HC prepared the emission data and modified the model code. YW, LW, HD, ZhW, QW, JL, and JA modified the manuscript. ZiW guided the study and modified the manuscript.
The authors declare that they have no conflict of interest.
The authors acknowledge the support of the National Key R&D Program of China, the National Natural Science Foundation of China, and the National Key Scientific and Technological Infrastructure project “Earth System Science Numerical Simulator Facility” (EarthLab). We also thank the reviewers for providing constructive comments and suggestions to improve our manuscript.
This research has been supported by the National Key R&D Program of China (grant nos. 2017YFC0209801 and 2017YFC0209805) and the National Natural Science Foundation of China (grant nos. 41705108, 41907200, and 41907201).
This paper was edited by Gordon McFiggans and reviewed by two anonymous referees.
Ahmadov, R., McKeen, S., Robinson, A., Bahreini, R., Middlebrook, A., de Gouw, J., Meagher, J., Hsie, E. Y., Edgerton, E., Shaw, S., and Trainer, M.: A volatility basis set model for summertime secondary organic aerosols over the eastern United States in 2006, J. Geophys. Res., 117, D06301, https://doi.org/10.1029/2011JD016831, 2012.
Albrecht, B.: Aerosols, Cloud Microphysics, and Fractional Cloudiness, Science, 245, 1227–1230, https://doi.org/10.1126/science.245.4923.1227, 1989.
Athanasopoulou, E., Tombrou, M., Pandis, S. N., and Russell, A. G.: The role of sea-salt emissions and heterogeneous chemistry in the air quality of polluted coastal areas, Atmos. Chem. Phys., 8, 5755–5769, https://doi.org/10.5194/acp-8-5755-2008, 2008.
Bergman, T., Kerminen, V.-M., Korhonen, H., Lehtinen, K. J., Makkonen, R., Arola, A., Mielonen, T., Romakkaniemi, S., Kulmala, M., and Kokkola, H.: Evaluation of the sectional aerosol microphysics module SALSA implementation in ECHAM5-HAM aerosol-climate model, Geosci. Model Dev., 5, 845–868, https://doi.org/10.5194/gmd-5-845-2012, 2012.
Binkowski, F. and Shankar, U.: The Regional Particulate Matter Model. 1. Model description and preliminary results, J. Geophys. Res., 100, 26191–26210, https://doi.org/10.1029/95JD02093, 1995.
Boy, M., Kulmala, M., Ruuskanen, T. M., Pihlatie, M., Reissell, A., Aalto, P. P., Keronen, P., Dal Maso, M., Hellen, H., Hakola, H., Jansson, R., Hanke, M., and Arnold, F.: Sulphuric acid closure and contribution to nucleation mode particle growth, Atmos. Chem. Phys., 5, 863–878, https://doi.org/10.5194/acp-5-863-2005, 2005.
Byun, D. and Dennis, R.: Design artifacts in eulerian air quality models: Evaluation of the effects of layer thickness and vertical profile correction on surface ozone concentrations, Atmos. Environ., 29, 105–126, https://doi.org/10.1016/1352-2310(94)00225-A, 1995.
Chang, L.-S., Schwartz, S., McGraw, R., and Lewis, E.: Sensitivity of aerosol properties to new particle formation mechanism and to primary emissions in a continental-scale chemical transport model, J. Geophys. Res., 114, D07203, https://doi.org/10.1029/2008JD011019, 2009.
Charlson, R. J., Schwartz, S. E., Hales, J. M., Cess, R. D., Coakley Jr., J. A., Hansen, J. E., and Hofmann, D. J.: Climate Forcing by Anthropogenic Aerosols, Science, 255, 423–430, https://doi.org/10.1126/science.255.5043.423, 1992.
Chen, H. S., Wang, Z. F., Li, J., Tang, X., Ge, B. Z., Wu, X. L., Wild, O., and Carmichael, G. R.: GNAQPMS-Hg v1.0, a global nested atmospheric mercury transport model: model description, evaluation and application to trans-boundary transport of Chinese anthropogenic emissions, Geosci. Model Dev., 8, 2857–2876, https://doi.org/10.5194/gmd-8-2857-2015, 2015.
Chen, X.: Simulation on microphysics of fine particles over central-eastern China, PhD dissertation, University of Chinese Academy of Sciences, Beijing, China, 2015.
Chen, X., Wang, Z., Li, J., and Yu, F.: Development of a Regional Chemical Transport Model with Size-Resolved Aerosol Microphysics and Its Application on Aerosol Number Concentration Simulation over China, SOLA, 10, 83–87, https://doi.org/10.2151/sola.2014-017, 2014.
Chen, X., Wang, Z., Li, J., Chen, H., Hu, M., Yang, W., Wang, Z., Ge, B., and Wang, D.: Explaining the spatiotemporal variation of fine particle number concentrations over Beijing and surrounding areas in an air quality model with aerosol microphysics, Environ. Pollut., 231, 1302–1313, https://doi.org/10.1016/j.envpol.2017.08.103, 2017.
Chen, X., Wang, Z., Li, J., Yang, W., Chen, H., Wang, Z., Hao, J., Ge, B., Wang, D., and Huang, H.: Simulation on different response characteristics of aerosol particle number concentration and mass concentration to emission changes over mainland China, Sci. Total Environ., 643, 692–703, https://doi.org/10.1016/j.scitotenv.2018.06.181, 2018.
Chen, X., Yang, W., Wang, Z., Li, J., Hu, M., An, J., Wu, Q., Wang, Z., Chen, H., Wei, Y., Du, H., and Wang, D.: Improving new particle formation simulation by coupling a volatility-basis set (VBS) organic aerosol module in NAQPMS+APM, Atmos. Environ., 204, 1–11, https://doi.org/10.1016/j.atmosenv.2019.01.053, 2019.
Chu, B., Kerminen, V.-M., Bianchi, F., Yan, C., Petäjä, T., and Kulmala, M.: Atmospheric new particle formation in China, Atmos. Chem. Phys., 19, 115–138, https://doi.org/10.5194/acp-19-115-2019, 2019.
Delfino, R., Sioutas, C., and Malik, S.: Potential Role of Ultrafine Particles in Associations between Airborne Particle Mass and Cardiovascular Health, Environ. Health Persp., 113, 934–946, https://doi.org/10.1289/ehp.7938, 2005.
Ding, X., He, Q.-F., Shen, R.-Q., Yu, Q.-Q., and Wang, X.-M.: Spatial distributions of secondary organic aerosols from isoprene, monoterpenes, β-caryophyllene, and aromatics over China during summer, J. Geophys. Res.-Atmos., 119, 11877–11891, https://doi.org/10.1002/2014jd021748, 2014.
Donahue, N. M., Robinson, A. L., Stanier, C., and Pandis, S.: Coupled Partitioning, Dilution, and Chemical Aging of Semivolatile Organics, Environ. Sci. Technol., 40, 2635–2643, https://doi.org/10.1021/es052297c, 2006.
Donahue, N. M., Robinson, A., and Pandis, S.: Atmospheric organic particulate matter: From smoke to secondary organic aerosol, Atmos. Environ., 43, 94–106, https://doi.org/10.1016/j.atmosenv.2008.09.055, 2009.
Donahue, N. M., Trump, E., Pierce, J., and Riipinen, I.: Theoretical constraints on pure vapor-pressure driven condensation of organics to ultrafine particles, Geophys. Res. Lett., 38, L16801, https://doi.org/10.1029/2011GL048115, 2011.
Donahue, N. M., Kroll, J. H., Pandis, S. N., and Robinson, A. L.: A two-dimensional volatility basis set – Part 2: Diagnostics of organic-aerosol evolution, Atmos. Chem. Phys., 12, 615–634, https://doi.org/10.5194/acp-12-615-2012, 2012.
Donaldson, K., Brown, D., Clouter, A., Duffin, R., MacNee, W., Renwick, L., Tran, L., and Stone, V.: The Pulmonary Toxicology of Ultrafine Particles, Journal of Aerosol Medicine, 15, 213–220, https://doi.org/10.1089/089426802320282338, 2002.
Du, H., Li, J., Chen, X., Wang, Z., Sun, Y., Fu, P., Li, J., Gao, J., and Wei, Y.: Modeling of aerosol property evolution during winter haze episodes over a megacity cluster in northern China: roles of regional transport and heterogeneous reactions of SO2, Atmos. Chem. Phys., 19, 9351–9370, https://doi.org/10.5194/acp-19-9351-2019, 2019.
Du, W., Zhao, J., Wang, Y., Zhang, Y., Wang, Q., Xu, W., Chen, C., Han, T., Zhang, F., Li, Z., Fu, P., Li, J., Wang, Z., and Sun, Y.: Simultaneous measurements of particle number size distributions at ground level and 260 m on a meteorological tower in urban Beijing, China, Atmos. Chem. Phys., 17, 6797–6811, https://doi.org/10.5194/acp-17-6797-2017, 2017.
Dunne, E. M., Gordon, H., Kurten, A., Almeida, J., Duplissy, J., Williamson, C., Ortega, I. K., Pringle, K. J., Adamov, A., Baltensperger, U., Barmet, P., Benduhn, F., Bianchi, F., Breitenlechner, M., Clarke, A., Curtius, J., Dommen, J., Donahue, N. M., Ehrhart, S., Flagan, R. C., Franchin, A., Guida, R., Hakala, J., Hansel, A., Heinritzi, M., Jokinen, T., Kangasluoma, J., Kirkby, J., Kulmala, M., Kupc, A., Lawler, M. J., Lehtipalo, K., Makhmutov, V., Mann, G., Mathot, S., Merikanto, J., Miettinen, P., Nenes, A., Onnela, A., Rap, A., Reddington, C. L., Riccobono, F., Richards, N. A., Rissanen, M. P., Rondo, L., Sarnela, N., Schobesberger, S., Sengupta, K., Simon, M., Sipila, M., Smith, J. N., Stozkhov, Y., Tome, A., Trostl, J., Wagner, P. E., Wimmer, D., Winkler, P. M., Worsnop, D. R., and Carslaw, K. S.: Global atmospheric particle formation from CERN CLOUD measurements, Science, 354, 1119–1124, https://doi.org/10.1126/science.aaf2649, 2016.
Dusek, U., Frank, G. P., Hildebrandt, L., Curtius, J., Schneider, J., Walter, S., Chand, D., Drewnick, F., Hings, S., Jung, D., Borrmann, S., and Andreae, M. O.: Size Matters More Than Chemistry for Cloud-Nucleating Ability of Aerosol Particles, Science, 312, 1375–1378, https://doi.org/10.1126/science.1125261, 2006.
Ervens, B., Turpin, B. J., and Weber, R. J.: Secondary organic aerosol formation in cloud droplets and aqueous particles (aqSOA): a review of laboratory, field and model studies, Atmos. Chem. Phys., 11, 11069–11102, https://doi.org/10.5194/acp-11-11069-2011, 2011.
Ervens, B., Sorooshian, A., Lim, Y., and Turpin, B.: Key parameters controlling OH-initiated formation of secondary organic aerosol in the aqueous phase (aqSOA), J. Geophys. Res. Atmos., 119, 3997–4016, https://doi.org/10.1002/2013JD021021, 2014.
Farina, S., Adams, P., and Pandis, S.: Modeling global secondary organic aerosol formation and processing with the volatility basis set: Implications for anthropogenic secondary organic aerosol, J. Geophys. Res., 115, D09202, https://doi.org/10.1029/2009JD013046, 2010.
Fountoukis, C., Racherla, P. N., Denier van der Gon, H. A. C., Polymeneas, P., Charalampidis, P. E., Pilinis, C., Wiedensohler, A., Dall'Osto, M., O'Dowd, C., and Pandis, S. N.: Evaluation of a three-dimensional chemical transport model (PMCAMx) in the European domain during the EUCAARI May 2008 campaign, Atmos. Chem. Phys., 11, 10331–10347, https://doi.org/10.5194/acp-11-10331-2011, 2011.
Fu, T.-M., Cao, J. J., Zhang, X. Y., Lee, S. C., Zhang, Q., Han, Y. M., Qu, W. J., Han, Z., Zhang, R., Wang, Y. X., Chen, D., and Henze, D. K.: Carbonaceous aerosols in China: top-down constraints on primary sources and estimation of secondary contribution, Atmos. Chem. Phys., 12, 2725–2746, https://doi.org/10.5194/acp-12-2725-2012, 2012.
Gao, C. Y., Tsigaridis, K., and Bauer, S. E.: MATRIX-VBS (v1.0): implementing an evolving organic aerosol volatility in an aerosol microphysics model, Geosci. Model Dev., 10, 751–764, https://doi.org/10.5194/gmd-10-751-2017, 2017.
Goldstein, A. H. and Galbally, I. E.: Known and Unexplored Organic Constituents in the Earth's Atmosphere, Environ. Sci. Technol., 41, 1514–1521, https://doi.org/10.1021/es072476p, 2007.
Guo, S., Hu, M., Levy Zamora, M., Peng, J., Shang, D., Du, Z., Wu, Z., Shao, M., Zeng, L., Molina, M., and Zhang, R.: Elucidating severe urban haze formation in China, P. Natl. Acad. Sci. USA, 111, 17373–17378, https://doi.org/10.1073/pnas.1419604111, 2014.
Guo, S., Hu, M., Peng, J., Wu, Z., Levy Zamora, M., Shang, D., Du, Z., Xin, F., Tang, R., Wu, Y., Zeng, L., Shuai, S., Zhang, W., Wang, Y., Ji, Y.-M., Li, Y., Zhang, A., Wang, W., and Zhang, R.: Remarkable nucleation and growth of ultrafine particles from vehicular exhaust, P. Natl. Acad. Sci. USA, 117, 3427–3432, https://doi.org/10.1073/pnas.1916366117, 2020.
Hallquist, M., Wenger, J. C., Baltensperger, U., Rudich, Y., Simpson, D., Claeys, M., Dommen, J., Donahue, N. M., George, C., Goldstein, A. H., Hamilton, J. F., Herrmann, H., Hoffmann, T., Iinuma, Y., Jang, M., Jenkin, M. E., Jimenez, J. L., Kiendler-Scharr, A., Maenhaut, W., McFiggans, G., Mentel, Th. F., Monod, A., Prévôt, A. S. H., Seinfeld, J. H., Surratt, J. D., Szmigielski, R., and Wildt, J.: The formation, properties and impact of secondary organic aerosol: current and emerging issues, Atmos. Chem. Phys., 9, 5155–5236, https://doi.org/10.5194/acp-9-5155-2009, 2009.
Han, Z., Xie, Z., Wang, G., Zhang, R., and Tao, J.: Modeling organic aerosols over east China using a volatility basis-set approach with aging mechanism in a regional air quality model, Atmos. Environ., 124, 186–198, https://doi.org/10.1016/j.atmosenv.2015.05.045, 2016.
Hildebrandt, L., Donahue, N. M., and Pandis, S. N.: High formation of secondary organic aerosol from the photo-oxidation of toluene, Atmos. Chem. Phys., 9, 2973–2986, https://doi.org/10.5194/acp-9-2973-2009, 2009.
Hodzic, A., Kasibhatla, P. S., Jo, D. S., Cappa, C. D., Jimenez, J. L., Madronich, S., and Park, R. J.: Rethinking the global secondary organic aerosol (SOA) budget: stronger production, faster removal, shorter lifetime, Atmos. Chem. Phys., 16, 7917–7941, https://doi.org/10.5194/acp-16-7917-2016, 2016.
Holmes, N. S.: A review of particle formation events and growth in the atmosphere in the various environments and discussion of mechanistic implications, Atmos. Environ., 41, 2183–2201, https://doi.org/10.1016/j.atmosenv.2006.10.058, 2007.
Huang, J., Ma, J., Guan, X., Li, Y., and He, Y.: Progress in Semi-arid Climate Change Studies in China, Adv. Atmos. Sci., 36, 922–937, https://doi.org/10.1007/s00376-018-8200-9, 2019.
IPCC (Intergovernmental Panel on Climate Change): ClimateChange 2013: The Physical Science Basis. Contribution of Working Group I to the Fifth Assessment, Report of the Intergovernmental Panel on Climate Change, Cambridge UniversityPress, Cambridge, United Kingdom, and New York, NY, USA, 2013.
Jacobson, M.: Development and application of a new air pollution modeling system–II. Aerosol module structure and design, Atmos. Environ., 31, 131–144, https://doi.org/10.1016/1352-2310(96)00202-6, 1997.
Jacobson, M., Turco, R., Jensen, E., and Toon, O.: Modeling Coagulation Among Particles of Different Composition and Size, Atmos. Environ., 28, 1327–1338, https://doi.org/10.1016/1352-2310(94)90280-1, 1994.
Jimenez, J., Donahue, N., Prevot, A., Zhang, Q., Kroll, J., DeCarlo, P., Allan, J. D., Coe, H., Ng, N., Aiken, A., Docherty, K., Ulbrich, I., Grieshop, A., Robinson, A. L., Duplissy, J., Smith, J., Wilson, K., Lanz, V. A., and Worsnop, D.: Evolution of Organic Aerosols in the Atmosphere, Science, 326, 1525–1529, https://doi.org/10.1126/science.1180353, 2009.
Jo, D. S., Hodzic, A., Emmons, L. K., Marais, E. A., Peng, Z., Nault, B. A., Hu, W., Campuzano-Jost, P., and Jimenez, J. L.: A simplified parameterization of isoprene-epoxydiol-derived secondary organic aerosol (IEPOX-SOA) for global chemistry and climate models: a case study with GEOS-Chem v11-02-rc, Geosci. Model Dev., 12, 2983–3000, https://doi.org/10.5194/gmd-12-2983-2019, 2019.
Kanakidou, M., Seinfeld, J. H., Pandis, S. N., Barnes, I., Dentener, F. J., Facchini, M. C., Van Dingenen, R., Ervens, B., Nenes, A., Nielsen, C. J., Swietlicki, E., Putaud, J. P., Balkanski, Y., Fuzzi, S., Horth, J., Moortgat, G. K., Winterhalter, R., Myhre, C. E. L., Tsigaridis, K., Vignati, E., Stephanou, E. G., and Wilson, J.: Organic aerosol and global climate modelling: a review, Atmos. Chem. Phys., 5, 1053–1123, https://doi.org/10.5194/acp-5-1053-2005, 2005.
Kelly, J. M., Doherty, R. M., O'Connor, F. M., and Mann, G. W.: The impact of biogenic, anthropogenic, and biomass burning volatile organic compound emissions on regional and seasonal variations in secondary organic aerosol, Atmos. Chem. Phys., 18, 7393–7422, https://doi.org/10.5194/acp-18-7393-2018, 2018.
Kirkby, J., Curtius, J., Almeida, J., Dunne, E., Duplissy, J., Ehrhart, S., Franchin, A., Gagné, S., Ickes, L., Kürten, A., Kupc, A., Metzger, A., Riccobono, F., Rondo, L., Schobesberger, S., Tsagkogeorgas, G., Wimmer, D., Amorim, A., Bianchi, F., and Kulmala, M.: Role of sulphuric acid, ammonia and galactic cosmic rays in atmospheric aerosol nucleation, Nature, 476, 429–433, https://doi.org/10.1038/nature10343, 2011.
Koo, B., Knipping, E., and Yarwood, G.: 1.5-Dimensional volatility basis set approach for modeling organic aerosol in CAMx and CMAQ, Atmos. Environ., 95, 158–164, https://doi.org/10.1016/j.atmosenv.2014.06.031, 2014.
Kuang, C., McMurry, P. H., and McCormick, A. V.: Determination of cloud condensation nuclei production from measured new particle formation events, Geophys. Res. Lett., 36, L09822, https://doi.org/10.1029/2009gl037584, 2009.
Kulmala, M. and Kerminen, V.-M.: On the formation and growth of atmospheric nanoparticles, Atmos. Res., 90, 132–150, https://doi.org/10.1016/j.atmosres.2008.01.005, 2008.
Kulmala, M., Kontkanen, J., Junninen, H., Lehtipalo, K., Manninen, H., Nieminen, T., Petäjä, T., Sipilä, M., Schobesberger, S., Rantala, P., Franchin, A., Jokinen, T., Järvinen, E., Äijälä, M., Kangasluoma, J., Hakala, J., Aalto, P., Paasonen, P., Mikkilä, J., and Worsnop, D.: Direct Observations of Atmospheric Aerosol Nucleation, Science, 339, 943–946, https://doi.org/10.1126/science.1227385, 2013.
Kulmala, M., Petäjä, T., Kerminen, V.-M., Kujansuu, J., Ruuskanen, T., Ding, A., Nie, W., Hu, M., Wang, Z., Wu, Z., Wang, L., and Worsnop, D.: On secondary new particle formation in China, Front. Env. Sci. Eng., 10, 8, https://doi.org/10.1007/s11783-016-0850-1, 2016.
Kulmala, M., Kerminen, V. M., Petaja, T., Ding, A. J., and Wang, L.: Atmospheric gas-to-particle conversion: why NPF events are observed in megacities?, Faraday Discuss., 200, 271–288, https://doi.org/10.1039/c6fd00257a, 2017.
Kumar, P., Morawska, L., Birmili, W., Paasonen, P., Hu, M., Kulmala, M., Harrison, R. M., Norford, L., and Britter, R.: Ultrafine particles in cities, Environ. Int., 66, 1–10, https://doi.org/10.1016/j.envint.2014.01.013, 2014.
Lana, A., Bell, T., Simó, R., Vallina, S., Ballabrera, J., Kettle, A., Dachs, J., Bopp, L., Saltzman, E., Stefels, J., Johnson, J., and Liss, P.: An updated climatology of surface dimethlysulfide concentrations and emission fluxes in the global ocean, Global Biogeochem. Cy., 25, GB1004, https://doi.org/10.1029/2010GB003850, 2011.
Lee, L. A., Pringle, K. J., Reddington, C. L., Mann, G. W., Stier, P., Spracklen, D. V., Pierce, J. R., and Carslaw, K. S.: The magnitude and causes of uncertainty in global model simulations of cloud condensation nuclei, Atmos. Chem. Phys., 13, 8879–8914, https://doi.org/10.5194/acp-13-8879-2013, 2013.
Li, J., Wang, Z., Zhuang, G., Luo, G., Sun, Y., and Wang, Q.: Mixing of Asian mineral dust with anthropogenic pollutants over East Asia: a model case study of a super-duststorm in March 2010, Atmos. Chem. Phys., 12, 7591–7607, https://doi.org/10.5194/acp-12-7591-2012, 2012.
Li, M., Liu, H., Geng, G. N., Hong, C. P., Liu, F., Song, Y., Tong, D., Zheng, B., Cui, H. Y., Man, H. Y., Zhang, Q., and He, K. B.: Anthropogenic emission inventories in China: a review, Natl. Sci. Rev., 4, 834–866, https://doi.org/10.1093/nsr/nwx150, 2017.
Li, Y., Sun, Y., Zhang, Q., Li, X., Li, M., Zhou, Z., and Chan, C.: Real-time chemical characterization of atmospheric particulate matter in China: A review, Atmos. Environ., 158, 270–304, https://doi.org/10.1016/j.atmosenv.2017.02.027, 2017.
Lin, G., Sillman, S., Penner, J. E., and Ito, A.: Global modeling of SOA: the use of different mechanisms for aqueous-phase formation, Atmos. Chem. Phys., 14, 5451–5475, https://doi.org/10.5194/acp-14-5451-2014, 2014.
Lin, J., An, J., Qu, Y., Chen, Y., Li, Y., Tang, Y., Wang, F., and Xiang, W.: Local and distant source contributions to secondary organic aerosol in the Beijing urban area in summer, Atmos. Environ., 124, 176–185, https://doi.org/10.1016/j.atmosenv.2015.08.098, 2016.
Liu, J., Horowitz, L., Fan, S.-M., Carlton, A. M., and Ii, L.: Global in-cloud production of secondary organic aerosols: Implementation of a detailed chemical mechanism in the GFDL atmospheric model AM3, J. Geophys. Res., 117, D15303, https://doi.org/10.1029/2012JD017838, 2012.
Luo, G. and Wang, Z.: A Global Environmental Atmospheric Transport Model(GEATM): Model Description and Validation, Chinese Journal of Atmospheric Sciences, 30, 504–518, https://doi.org/10.1016/S1003-6326(06)60040-X, 2006.
Luo, G. and Yu, F.: Simulation of particle formation and number concentration over the Eastern United States with the WRF-Chem + APM model, Atmos. Chem. Phys., 11, 11521–11533, https://doi.org/10.5194/acp-11-11521-2011, 2011.
Mann, G. W., Carslaw, K. S., Reddington, C. L., Pringle, K. J., Schulz, M., Asmi, A., Spracklen, D. V., Ridley, D. A., Woodhouse, M. T., Lee, L. A., Zhang, K., Ghan, S. J., Easter, R. C., Liu, X., Stier, P., Lee, Y. H., Adams, P. J., Tost, H., Lelieveld, J., Bauer, S. E., Tsigaridis, K., van Noije, T. P. C., Strunk, A., Vignati, E., Bellouin, N., Dalvi, M., Johnson, C. E., Bergman, T., Kokkola, H., von Salzen, K., Yu, F., Luo, G., Petzold, A., Heintzenberg, J., Clarke, A., Ogren, J. A., Gras, J., Baltensperger, U., Kaminski, U., Jennings, S. G., O'Dowd, C. D., Harrison, R. M., Beddows, D. C. S., Kulmala, M., Viisanen, Y., Ulevicius, V., Mihalopoulos, N., Zdimal, V., Fiebig, M., Hansson, H.-C., Swietlicki, E., and Henzing, J. S.: Intercomparison and evaluation of global aerosol microphysical properties among AeroCom models of a range of complexity, Atmos. Chem. Phys., 14, 4679–4713, https://doi.org/10.5194/acp-14-4679-2014, 2014.
Matsui, H.: Development of a global aerosol model using a two-dimensional sectional method: 1. Model design: H. MATSUI: 2-D SECTIONAL GLOBAL AEROSOL MODEL 1, J. Adv. Model. Earth Sy., 9, 1921–1947, https://doi.org/10.1002/2017MS000936, 2017.
Matsui, H., Koike, M., Kondo, Y., Takami, A., Fast, J. D., Kanaya, Y., and Takigawa, M.: Volatility basis-set approach simulation of organic aerosol formation in East Asia: implications for anthropogenic–biogenic interaction and controllable amounts, Atmos. Chem. Phys., 14, 9513–9535, https://doi.org/10.5194/acp-14-9513-2014, 2014.
May, A., Levin, E., Hennigan, C., Riipinen, I., Lee, T., Collett, J., Jimenez, J., Kreidenweis, S., and Robinson, A.: Gas-particle partitioning of primary organic aerosol emissions: 3. Biomass burning, J. Geophys. Res.-Atmos., 118, 11327–11338, https://doi.org/10.1002/jgrd.50828, 2013a.
May, A., Presto, A., Hennigan, C., Nguyen, N. T., Gordon, T., and Robinson, A.: Gas-Particle Partitioning of Primary Organic Aerosol Emissions: (2) Diesel Vehicles, Environ. Sci. Technol., 47, 8288–8296, https://doi.org/10.1021/es400782j, 2013b.
May, A. A., Presto, A. A., Hennigan, C. J., Nguyen, N. T., Gordon, T. D., and Robinson, A. L.: Gas-particle partitioning of primary organic aerosol emissions: (1) Gasoline vehicle exhaust, Atmos. Environ., 77, 128–139, https://doi.org/10.1016/j.atmosenv.2013.04.060, 2013c.
Metzger, A., Verheggen, B., Dommen, J., Duplissy, J., Prevot, A., Weingartner, E., Riipinen, I., Kulmala, M., Spracklen, D., Carslaw, K., and Baltensperger, U.: Evidence for the role of organics in aerosol particle formation under atmospheric conditions, P. Natl. Acad. Sci USA, 107, 6646–6651, https://doi.org/10.1073/pnas.0911330107, 2010.
Molteni, U., Bianchi, F., Klein, F., El Haddad, I., Frege, C., Rossi, M. J., Dommen, J., and Baltensperger, U.: Formation of highly oxygenated organic molecules from aromatic compounds, Atmos. Chem. Phys., 18, 1909–1921, https://doi.org/10.5194/acp-18-1909-2018, 2018.
Murphy, B. and Pandis, S.: Simulating the Formation of Semivolatile Primary and Secondary Organic Aerosol in a Regional Chemical Transport Model, Environ. Sci. Technol., 43, 4722–4728, https://doi.org/10.1021/es803168a, 2009.
Nenes, A., Pandis, S., and Pilinis, C.: ISORROPIA: A New Thermodynamic Equilibrium Model for Multiphase Multicomponent Inorganic Aerosols, Aquat. Geochem., 4, 123–152, https://doi.org/10.1023/A:1009604003981, 1998.
Odum, J. R., Hoffmann, T., Bowman, F., Collins, D., Flagan, R., and Seinfeld, J.: Gas/Particle Partitioning and Secondary Organic Aerosol Yields, Environ. Sci. Technol., 30, 2580–2585, https://doi.org/10.1021/es950943+, 1996.
Paatero, P.: A weighted non-negative least squares algorithm for three-way 'PARAFAC' factor analysis, Chemometr. Intell. Lab., 38, 223–242, https://doi.org/10.1016/S0169-7439(97)00031-2, 1997.
Paatero, P. and Tapper, U.: Positive matrix factorization: A non-negative factor model with optimal utilization of error estimates of data values, Environmetrics, 5, 111–126, https://doi.org/10.1002/env.3170050203, 1994.
Pankow, J. F.: An absorption model of gas/particle partitioning of organic compounds in the atmosphere, Atmos. Environ., 28, 185–188, https://doi.org/10.1016/1352-2310(94)90093-0, 1994a.
Pankow, J. F.: An absorption model of the gas/aerosol partitioning involved in the formation of secondary organic aerosol, Atmos. Environ., 28, 189–193, https://doi.org/10.1016/j.atmosenv.2007.10.060, 1994b.
Patoulias, D., Fountoukis, C., Riipinen, I., and Pandis, S. N.: The role of organic condensation on ultrafine particle growth during nucleation events, Atmos. Chem. Phys., 15, 6337–6350, https://doi.org/10.5194/acp-15-6337-2015, 2015.
Paasonen, P., Visshedjik, A., Kupiainen, K., Klimont, Z., Denier van der Gon, H., and Kulmala, M.: Aerosolparticle number emissions and size distributions: implementation in the GAINSmodel and initial results, IIASA Interim Report, IR-13-020, IIASA, Laxenburg, Austria, 2013.
Pierce, J. R., Riipinen, I., Kulmala, M., Ehn, M., Petäjä, T., Junninen, H., Worsnop, D. R., and Donahue, N. M.: Quantification of the volatility of secondary organic compounds in ultrafine particles during nucleation events, Atmos. Chem. Phys., 11, 9019–9036, https://doi.org/10.5194/acp-11-9019-2011, 2011.
Reddington, C. L., McMeeking, G., Mann, G. W., Coe, H., Frontoso, M. G., Liu, D., Flynn, M., Spracklen, D. V., and Carslaw, K. S.: The mass and number size distributions of black carbon aerosol over Europe, Atmos. Chem. Phys., 13, 4917–4939, https://doi.org/10.5194/acp-13-4917-2013, 2013.
Riipinen, I., Pierce, J. R., Yli-Juuti, T., Nieminen, T., Häkkinen, S., Ehn, M., Junninen, H., Lehtipalo, K., Petäjä, T., Slowik, J., Chang, R., Shantz, N. C., Abbatt, J., Leaitch, W. R., Kerminen, V.-M., Worsnop, D. R., Pandis, S. N., Donahue, N. M., and Kulmala, M.: Organic condensation: a vital link connecting aerosol formation to cloud condensation nuclei (CCN) concentrations, Atmos. Chem. Phys., 11, 3865–3878, https://doi.org/10.5194/acp-11-3865-2011, 2011.
Robinson, A., Donahue, N., Shrivastava, M., Weitkamp, E., Sage, A., Grieshop, A., Lane, T., Pierce, J., and Pandis, S.: Rethinking Organic Aerosols: Semivolatile Emissions and Photochemical Aging, Science, 315, 1259–1262, https://doi.org/10.1126/science.1133061, 2007.
Seinfeld, J. H. and Pandis, S. N.: Atmospheric Chemistry and Physics: From Air Pollution to Climate Change, John Wiley & Sons, Inc., New York, 2006.
Sheehan, P. and Bowman, F.: Estimated Effects of Temperature on Secondary Organic Aerosol Concentrations, Environ. Sci. Technol., 35, 2129–2135, https://doi.org/10.1021/es001547g, 2001.
Shrivastava, M., Donahue, N., Pandis, S., and Robinson, A.: Effects of gas particle partitioning and aging of primary emissions on urban and regional organic aerosol concentrations, J. Geophys. Res., 113, D18301, https://doi.org/10.1029/2007JD009735, 2008.
Shrivastava, M., Cappa, C. D., Fan, J., Goldstein, A. H., Guenther, A. B., Jimenez, J. L., Kuang, C., Laskin, A., Martin, S. T., Ng, N. L., Petaja, T., Pierce, J. R., Rasch, P. J., Roldin, P., Seinfeld, J. H., Shilling, J., Smith, J. N., Thornton, J. A., Volkamer, R., Wang, J., Worsnop, D. R., Zaveri, R. A., Zelenyuk, A., and Zhang, Q.: Recent advances in understanding secondary organic aerosol: Implications for global climate forcing, Rev. Geophys., 55, 509–559, https://doi.org/10.1002/2016rg000540, 2017.
Skamarock, W., Klemp, J. B., Dudhia, J., Gill, D. O., and Barker, D.: A Description of the Advanced Research WRF Version 3, NCAR Technical Note, NCAR/TN–475+STR, 2008.
Spracklen, D. V., Pringle, K. J., Carslaw, K. S., Chipperfield, M. P., and Mann, G. W.: A global off-line model of size-resolved aerosol microphysics: I. Model development and prediction of aerosol properties, Atmos. Chem. Phys., 5, 2227–2252, https://doi.org/10.5194/acp-5-2227-2005, 2005.
Spracklen, D. V., Carslaw, K. S., Kulmala, M., Kerminen, V.-M., Mann, G. W., and Sihto, S.-L.: The contribution of boundary layer nucleation events to total particle concentrations on regional and global scales, Atmos. Chem. Phys., 6, 5631–5648, https://doi.org/10.5194/acp-6-5631-2006, 2006.
Spracklen, D. V., Jimenez, J. L., Carslaw, K. S., Worsnop, D. R., Evans, M. J., Mann, G. W., Zhang, Q., Canagaratna, M. R., Allan, J., Coe, H., McFiggans, G., Rap, A., and Forster, P.: Aerosol mass spectrometer constraint on the global secondary organic aerosol budget, Atmos. Chem. Phys., 11, 12109–12136, https://doi.org/10.5194/acp-11-12109-2011, 2011.
Stier, P., Feichter, J., Kinne, S., Kloster, S., Vignati, E., Wilson, J., Ganzeveld, L., Tegen, I., Werner, M., Balkanski, Y., Schulz, M., Boucher, O., Minikin, A., and Petzold, A.: The aerosol-climate model ECHAM5-HAM, Atmos. Chem. Phys., 5, 1125–1156, https://doi.org/10.5194/acp-5-1125-2005, 2005.
Stockwell, W., Middleton, P., and Chang, J.: The Second Generation Regional Acid Deposition Model Chemical Mechanism for Regional Air Quality Modeling, J. Geophys. Res., 951, 16343–16367, https://doi.org/10.1029/JD095iD10p16343, 1990.
Sun, Y. L., Wang, Z. F., Du, W., Zhang, Q., Wang, Q. Q., Fu, P. Q., Pan, X. L., Li, J., Jayne, J., and Worsnop, D. R.: Long-term real-time measurements of aerosol particle composition in Beijing, China: seasonal variations, meteorological effects, and source analysis, Atmos. Chem. Phys., 15, 10149–10165, https://doi.org/10.5194/acp-15-10149-2015, 2015.
Tang, R., Wu, Z., Li, X., Wang, Y., Shang, D., Xiao, Y., Li, M., Zeng, L., Wu, Z., Hallquist, M., Hu, M., and Guo, S.: Primary and secondary organic aerosols in summer 2016 in Beijing, Atmos. Chem. Phys., 18, 4055–4068, https://doi.org/10.5194/acp-18-4055-2018, 2018.
Textor, C., Schulz, M., Guibert, S., Kinne, S., Balkanski, Y., Bauer, S., Berntsen, T., Berglen, T., Boucher, O., Chin, M., Dentener, F., Diehl, T., Easter, R., Feichter, H., Fillmore, D., Ghan, S., Ginoux, P., Gong, S., Grini, A., Hendricks, J., Horowitz, L., Huang, P., Isaksen, I., Iversen, I., Kloster, S., Koch, D., Kirkevåg, A., Kristjansson, J. E., Krol, M., Lauer, A., Lamarque, J. F., Liu, X., Montanaro, V., Myhre, G., Penner, J., Pitari, G., Reddy, S., Seland, Ø., Stier, P., Takemura, T., and Tie, X.: Analysis and quantification of the diversities of aerosol life cycles within AeroCom, Atmos. Chem. Phys., 6, 1777–1813, https://doi.org/10.5194/acp-6-1777-2006, 2006.
Trivitayanurak, W. and Adams, P. J.: Does the POA–SOA split matter for global CCN formation?, Atmos. Chem. Phys., 14, 995–1010, https://doi.org/10.5194/acp-14-995-2014, 2014.
Tröstl, J., Chuang, W., Gordon, H., Heinritzi, M., Yan, C., Molteni, U., Ahlm, L., Frege, C., Bianchi, F., Wagner, R., Simon, M., Lehtipalo, K., Williamson, C., Craven, J., Duplissy, J., Adamov, A., Almeida, J., Bernhammer, A.-K., Breitenlechner, M., and Baltensperger, U.: The role of low-volatility organic compounds in initial particle growth in the atmosphere, Nature, 533, 527–531, 2016.
Tsigaridis, K., Krol, M., Dentener, F. J., Balkanski, Y., Lathière, J., Metzger, S., Hauglustaine, D. A., and Kanakidou, M.: Change in global aerosol composition since preindustrial times, Atmos. Chem. Phys., 6, 5143–5162, https://doi.org/10.5194/acp-6-5143-2006, 2006.
Tsigaridis, K., Daskalakis, N., Kanakidou, M., Adams, P. J., Artaxo, P., Bahadur, R., Balkanski, Y., Bauer, S. E., Bellouin, N., Benedetti, A., Bergman, T., Berntsen, T. K., Beukes, J. P., Bian, H., Carslaw, K. S., Chin, M., Curci, G., Diehl, T., Easter, R. C., Ghan, S. J., Gong, S. L., Hodzic, A., Hoyle, C. R., Iversen, T., Jathar, S., Jimenez, J. L., Kaiser, J. W., Kirkevåg, A., Koch, D., Kokkola, H., Lee, Y. H., Lin, G., Liu, X., Luo, G., Ma, X., Mann, G. W., Mihalopoulos, N., Morcrette, J.-J., Müller, J.-F., Myhre, G., Myriokefalitakis, S., Ng, N. L., O'Donnell, D., Penner, J. E., Pozzoli, L., Pringle, K. J., Russell, L. M., Schulz, M., Sciare, J., Seland, Ø., Shindell, D. T., Sillman, S., Skeie, R. B., Spracklen, D., Stavrakou, T., Steenrod, S. D., Takemura, T., Tiitta, P., Tilmes, S., Tost, H., van Noije, T., van Zyl, P. G., von Salzen, K., Yu, F., Wang, Z., Wang, Z., Zaveri, R. A., Zhang, H., Zhang, K., Zhang, Q., and Zhang, X.: The AeroCom evaluation and intercomparison of organic aerosol in global models, Atmos. Chem. Phys., 14, 10845–10895, https://doi.org/10.5194/acp-14-10845-2014, 2014.
Twomey, S.: The Influence of Pollution on the Shortwave Albedo of Clouds, J. Atmos. Sci., 34, 1149–1154, https://doi.org/10.1175/1520-0469(1977)034<1149:TIOPOT>2.0.CO;2, 1977.
Ulbrich, I. M., Canagaratna, M. R., Zhang, Q., Worsnop, D. R., and Jimenez, J. L.: Interpretation of organic components from Positive Matrix Factorization of aerosol mass spectrometric data, Atmos. Chem. Phys., 9, 2891–2918, https://doi.org/10.5194/acp-9-2891-2009, 2009.
Walcek, C. J. and Aleksic, N. M.: A simple but accurate mass conservative, peak-preserving, mixing ratio bounded advection algorithm with FORTRAN code, Atmos. Environ., 32, 3863–3880, https://doi.org/10.1016/S1352-2310(98)00099-5, 1998.
Wang, H., Chen, H., Wu, Q., Lin, J., Chen, X., Xie, X., Wang, R., Tang, X., and Wang, Z.: GNAQPMS v1.1: accelerating the Global Nested Air Quality Prediction Modeling System (GNAQPMS) on Intel Xeon Phi processors, Geosci. Model Dev., 10, 2891–2904, https://doi.org/10.5194/gmd-10-2891-2017, 2017.
Wang, H., Lin, J., Wu, Q., Chen, H., Tang, X., Wang, Z., Chen, X., Cheng, H., and Wang, L.: MP CBM-Z V1.0: design for a new Carbon Bond Mechanism Z (CBM-Z) gas-phase chemical mechanism architecture for next-generation processors, Geosci. Model Dev., 12, 749–764, https://doi.org/10.5194/gmd-12-749-2019, 2019.
Wang, Z., Ueda, H., and Huang, M.: A deflation module for use in modeling long-range transport of yellow sand over East Asia, J. Geophys. Res., 105, 26947–26960, https://doi.org/10.1029/2000JD900370, 2000.
Wang, Z., Maeda, T., Hayashi, M., Hsiao, L. F., and Liu, K. Y.: A Nested Air Quality Prediction Modeling System for Urban and Regional Scales: Application for High-Ozone Episode in Taiwan, Water Air Soil Poll., 130, 391–396, https://doi.org/10.1023/A:1013833217916, 2001.
Wang, Z., Hu, M., Wu, Z., and Yue, D.: Research on the Formation Mechanisms of New Particles in the Atmosphere, Acta Chim. Sinica, 71, 519–527, https://doi.org/10.6023/A12121062, 2013.
Wang, Z., Wu, Z., Yue, D., Shang, D., Guo, S., Sun, J., Ding, A., Wang, L., Jiang, J., Guo, H., Gao, J., Cheung, H. C., Morawska, L., Keywood, M., and Hu, M.: New particle formation in China: Current knowledge and further directions, Sci. Total Environ., 577, 258–266, https://doi.org/10.1016/j.scitotenv.2016.10.177, 2016.
Wang, Z. B., Hu, M., Pei, X., Zhang, R. Y., Paasonen, P., Zheng, J., Yue, D. L., Wu, Z., Boy, M., and Wiedensohler, A.: Connection of organics to atmospheric new particle formation and growth at an urban site of Beijing, Atmos. Environ., 103, 7–17, https://doi.org/10.1016/j.atmosenv.2014.11.069, 2015.
Wehner, B., Wiedensohler, A., Tuch, T., Wu, Z., Hu, M., Slanina, J., and Kiang, C.: Variability of the Aerosol Number Size Distribution in Beijing, China: New Particle Formation, Dust Storms, and High Continental Background, Geophys. Res. Lett., 31, L22108, https://doi.org/10.1029/2004GL021596, 2004.
Wei, Y., Chen, X., Chen, H., Li, J., Wang, Z., Yang, W., Ge, B., Du, H., Hao, J., Wang, W., Li, J., Sun, Y., and Huang, H.: IAP-AACM v1.0: a global to regional evaluation of the atmospheric chemistry model in CAS-ESM, Atmos. Chem. Phys., 19, 8269–8296, https://doi.org/10.5194/acp-19-8269-2019, 2019.
Wiedensohler, A., Cheng, Y., Nowak, A., Wehner, B., Achtert, P., Berghof, M., Birmili, W., Wu, Z., Hu, M., Zhu, T., Takegawa, N., Kita, K., Kondo, Y., Lou, S., Hofzumahaus, A., Holland, F., Wahner, A., Gunthe, S., Rose, D., and Pöschl, U.: Rapid aerosol particle growth and increase of cloud condensation nucleus activity by secondary aerosol formation and condensation: A case study for regional air pollution in northeastern China, J. Geophys. Res., 114, D00G08, https://doi.org/10.1029/2008JD010884, 2009.
Wu, Z., Hu, M., Liu, S., Wehner, B., Bauer, S., Ssling, A., Wiedensohler, A., PetäJä, T., Dal Maso, M., and Kulmala, M.: New particle formation in Beijing, China: Statistical analysis of a 1-year data set, J. Geophys. Res., 112, D09209, https://doi.org/10.1029/2006JD007406, 2007.
Wu, Z., Hu, M., Lin, P., Liu, S., Wehner, B., and Wiedensohler, A.: Particle number size distribution in the urban atmosphere of Beijing, China, Atmos. Environ., 42, 7967–7980, https://doi.org/10.1016/j.atmosenv.2008.06.022, 2008.
Xausa, F., Paasonen, P., Makkonen, R., Arshinov, M., Ding, A., Denier Van Der Gon, H., Kerminen, V.-M., and Kulmala, M.: Advancing global aerosol simulations with size-segregated anthropogenic particle number emissions, Atmos. Chem. Phys., 18, 10039–10054, https://doi.org/10.5194/acp-18-10039-2018, 2018.
Xu, W., Xie, C., Karnezi, E., Zhang, Q., Wang, J., Pandis, S. N., Ge, X., Zhang, J., An, J., Wang, Q., Zhao, J., Du, W., Qiu, Y., Zhou, W., He, Y., Li, Y., Li, J., Fu, P., Wang, Z., Worsnop, D. R., and Sun, Y.: Summertime aerosol volatility measurements in Beijing, China, Atmos. Chem. Phys., 19, 10205–10216, https://doi.org/10.5194/acp-19-10205-2019, 2019.
Yang, F., Kawamura, K., Chen, J., Ho, K. F., Lee, S., Gao, Y., Cui, L., Wang, T., and Fu, P.: Anthropogenic and biogenic organic compounds in summertime fine aerosols (PM2.5) in Beijing, China, Atmos. Environ., 124, 166–175, https://doi.org/10.1016/j.atmosenv.2015.08.095, 2016.
Yang, W., Li, J., Wang, W., Li, J., Ge, M.-F., Sun, Y., Chen, G., ge, B., Tong, S., Wang, Q., and Wang, Z.: Investigating secondary organic aerosol formation pathways in China during 2014, Atmos. Environ., 213, 133–147, https://doi.org/10.1016/j.atmosenv.2019.05.057, 2019.
Yao, L., Garmash, O., Bianchi, F., Zheng, J., Yan, C., Kontkanen, J., Junninen, H., Mazon, S., Ehn, M., Paasonen, P., Sipilä, M., Wang, M., Wang, X., Xiao, S., Chen, H., Lu, Y., Zhang, B., Wang, D., Fu, Q., and Wang, L.: Atmospheric new particle formation from sulfuric acid and amines in a Chinese megacity, Science, 361, 278–281, https://doi.org/10.1126/science.aao4839, 2018.
Yu, F.: From molecular clusters to nanoparticles: second-generation ion-mediated nucleation model, Atmos. Chem. Phys., 6, 5193–5211, https://doi.org/10.5194/acp-6-5193-2006, 2006.
Yu, F.: Ion-mediated nucleation in the atmosphere: Key controlling parameters, implications, and look-up table, J. Geophys. Res., 115, D03206, https://doi.org/10.1029/2009JD012630, 2010.
Yu, F.: A secondary organic aerosol formation model considering successive oxidation aging and kinetic condensation of organic compounds: global scale implications, Atmos. Chem. Phys., 11, 1083–1099, https://doi.org/10.5194/acp-11-1083-2011, 2011.
Yu, F. and Luo, G.: Simulation of particle size distribution with a global aerosol model: contribution of nucleation to aerosol and CCN number concentrations, Atmos. Chem. Phys., 9, 7691–7710, https://doi.org/10.5194/acp-9-7691-2009, 2009.
Yu, F. and Turco, R.: From molecular clusters to nanoparticles: Role of ambient ionization in tropospheric aerosol formation, J. Geophys. Res., 106, 4797–4814, https://doi.org/10.1029/2000JD900539, 2001.
Yu, F., Wang, Z., and Turco, R.: Ion-mediated Nucleation as an Important Source of Global Tropospheric Aerosols, in: Nucleation and Atmospheric Aerosols, edited by: O'Dowd, C. D. and Wagner, P. E., Springer, Dordrecht, 938–942, https://doi.org/10.1007/978-1-4020-6475-3_185, 2007.
Yu, F., Wang, Z., Luo, G., and Turco, R.: Ion-mediated nucleation as an important global source of tropospheric aerosols, Atmos. Chem. Phys., 8, 2537–2554, https://doi.org/10.5194/acp-8-2537-2008, 2008.
Yu, F., Nadykto, A. B., Herb, J., Luo, G., Nazarenko, K. M., and Uvarova, L. A.: H2SO4–H2O–NH3 ternary ion-mediated nucleation (TIMN): kinetic-based model and comparison with CLOUD measurements, Atmos. Chem. Phys., 18, 17451–17474, https://doi.org/10.5194/acp-18-17451-2018, 2018.
Yue, D. L., Hu, M., Zhang, R. Y., Wu, Z., Su, H., Wang, Z. B., Peng, J., He, L. Y., Huang, X., Gong, Y. G., and Wiedensohler, A.: Potential contribution of new particle formation to cloud condensation nuclei in Beijing, Atmos. Environ., 45, 6070–6077, https://doi.org/10.1016/j.atmosenv.2011.07.037, 2011.
Zaveri, R. and Peters, L.: Anew lumped structure photochemical mechanism for long-scale applications, J. Geophys. Res., 104, 30387–30415, https://doi.org/10.1029/1999JD900876, 1999.
Zhang, L., Brook, J. R., and Vet, R.: A revised parameterization for gaseous dry deposition in air-quality models, Atmos. Chem. Phys., 3, 2067–2082, https://doi.org/10.5194/acp-3-2067-2003, 2003.
Zhang, Q., Jimenez, J. L., Canagaratna, M. R., Allan, J. D., Coe, H., Ulbrich, I., Alfarra, M. R., Takami, A., Middlebrook, A. M., Sun, Y. L., Dzepina, K., Dunlea, E., Docherty, K., DeCarlo, P. F., Salcedo, D., Onasch, T., Jayne, J. T., Miyoshi, T., Shimono, A., Hatakeyama, S., Takegawa, N., Kondo, Y., Schneider, J., Drewnick, F., Borrmann, S., Weimer, S., Demerjian, K., Williams, P., Bower, K., Bahreini, R., Cottrell, L., Griffin, R. J., Rautiainen, J., Sun, J. Y., Zhang, Y. M., and Worsnop, D. R.: Ubiquity and dominance of oxygenated species in organic aerosols in anthropogenically-influenced Northern Hemisphere midlatitudes, Geophys. Res. Lett., 34, L13801, https://doi.org/10.1029/2007GL029979, 2007.
Zhang, X., Wang, Y., Zhang, X., Guo, W., and Gong, S.: Carbonaceous aerosol composition over various regions of China during 2006, J. Geophys. Res., 113, D14111, https://doi.org/10.1029/2007JD009525, 2008.
Zhang, Y., Hemperly, J., Meskhidze, N., and Skamarock, W. C.: The Global Weather Research and Forecasting (GWRF) Model: Model Evaluation, Sensitivity Study, and Future Year Simulation, Atmospheric and Climate Sciences, 2, 231–253, https://doi.org/10.4236/acs.2012.23024, 2012.
Zhang, Y., Liu, P., Liu, X.-H., Jacobson, M., McMurry, P., Yu, F., Yu, S., and Schere, K.: A comparative study of nucleation parameterizations: 2. Three-dimensional model application and evaluation, J. Geophys. Res., 115, D20213, https://doi.org/10.1029/2010JD014151, 2010.
Zhao, B., Wang, S., Donahue, N., Jathar, S., Huang, X., Wu, W., Hao, J., and Robinson, A.: Quantifying the effect of organic aerosol aging and intermediate-volatility emissions on regional-scale aerosol pollution in China, Scientific Reports, 6, 28815, https://doi.org/10.1038/srep28815, 2016.
Zhao, J., Du, W., Zhang, Y., Wang, Q., Chen, C., Xu, W., Han, T., Wang, Y., Fu, P., Wang, Z., Li, Z., and Sun, Y.: Insights into aerosol chemistry during the 2015 China Victory Day parade: results from simultaneous measurements at ground level and 260 m in Beijing, Atmos. Chem. Phys., 17, 3215–3232, https://doi.org/10.5194/acp-17-3215-2017, 2017.
Zhao, Y., Zhang, J., and Nielsen, C. P.: The effects of recent control policies on trends in emissions of anthropogenic atmospheric pollutants and CO2 in China, Atmos. Chem. Phys., 13, 487–508, https://doi.org/10.5194/acp-13-487-2013, 2013.
Zhou, C., Gong, S., Zhang, X.-Y., Liu, H.-L., Xue, M., Cao, G.-L., An, X.-Q., Che, H., Zhang, Y.-M., and Niu, T.: Towards the improvements of simulating the chemical and optical properties of Chinese aerosols using an online coupled model CUACE/Aero, Tellus B, 64, 18965, https://doi.org/10.3402/tellusb.v64i0.18965, 2012.
Zhou, C., Shen, X., Liu, Z., Zhang, Y., and Xin, J.: Simulating Aerosol Size Distribution and Mass Concentration with Simultaneous Nucleation, Condensation/Coagulation, and Deposition with the GRAPES–CUACE, J. Meteorol. Res., 32, 265–278, https://doi.org/10.1007/s13351-018-7116-8, 2018.
Zhu, J., Penner, J. E., Lin, G., Zhou, C., Xu, L., and Zhuang, B.: Mechanism of SOA formation determines magnitude of radiative effects, P. Natl. Acad. Sci. USA, 114, 12685–12690, https://doi.org/10.1073/pnas.1712273114, 2017.