the Creative Commons Attribution 4.0 License.
the Creative Commons Attribution 4.0 License.
 | 10 Jun 2021
Determination of free amino acids, saccharides, and selected microbes in biogenic atmospheric aerosols – seasonal variations, particle size distribution, chemical and microbial relations
Jose Ruiz-Jimenez
Magdalena Okuljar
Outi-Maaria Sietiö
Giorgia Demaria
Thanaporn Liangsupree
Elisa Zagatti
Juho Aalto
Kari Hartonen
Jussi Heinonsalo
Jaana Bäck
Tuukka Petäjä
Marja-Liisa Riekkola
Primary biological aerosol particles (PBAPs) play an important role in the interaction between biosphere, atmosphere, and climate, affecting cloud and precipitation formation processes. The presence of pollen, plant fragments, spores, bacteria, algae, and viruses in PBAPs is well known. In order to explore the complex interrelationships between airborne and particulate chemical tracers (amino acids, saccharides), gene copy numbers (16S and 18S for bacteria and fungi, respectively), gas phase chemistry, and the particle size distribution, 84 size-segregated aerosol samples from four particle size fractions (< 1.0, 1.0–2.5, 2.5–10, and > 10 µm) were collected at the SMEAR II station, Finland, in autumn 2017. The gene copy numbers and size distributions of bacteria, Pseudomonas, and fungi in biogenic aerosols were determined by DNA extraction and amplification. In addition, free amino acids (19) and saccharides (8) were analysed in aerosol samples by hydrophilic interaction liquid chromatography–mass spectrometry (HILIC-MS). Different machine learning (ML) approaches, such as cluster analysis, discriminant analysis, neural network analysis, and multiple linear regression (MLR), were used for the clarification of several aspects related to the composition of biogenic aerosols. Clear variations in composition as a function of the particle size were observed. In most cases, the highest concentration values and gene copy numbers (in the case of microbes) were observed for 2.5–10 µm particles, followed by > 10, 1–2.5, and < 1.0 µm particles. In addition, different variables related to the air and soil temperature, the UV radiation, and the amount of water in the soil affected the composition of biogenic aerosols. In terms of interpreting the results, MLR provided the greatest improvement over classical statistical approaches such as Pearson correlation among the ML approaches considered. In all cases, the explained variance was over 91 %. The great variability of the samples hindered the clarification of common patterns when evaluating the relation between the presence of microbes and the chemical composition of biogenic aerosols. Finally, positive correlations were observed between gas-phase VOCs (such as acetone, toluene, methanol, and 2-methyl-3-buten-2-ol) and the gene copy numbers of microbes in biogenic aerosols.
- Article
(594 KB) - Full-text XML
-
Supplement
(1117 KB) - BibTeX
- EndNote


Primary biological aerosol particles (PBAPs) can be defined as solid airborne particles that are directly emitted by the biosphere into the atmosphere (Després et al., 2012). When expressed as mass concentration percentages, PBAPs constitute 30 % of the coarse particle fraction in urban and rural air (Fröhlich-Nowoisky et al., 2016), up to 65 % of that fraction in boreal forest air (Manninen et al., 2014), and even 80 % of that fraction in tropical forest air (Elbert et al., 2007; Pöschl et al., 2010). PBAPs include both dead and alive microorganisms (i.e. algae, archaea, bacteria, fungi, and viruses), fragments or excretions from plants and animals (i.e. plant debris and brochosomes), and dispersal units (i.e. fungal spores and plant pollen) (Després et al., 2012; Šantl-Temkiv et al., 2020).
Large aerosol particles are usually removed from the atmosphere close to the emission area by dry deposition (Pöschl, 2005). However, smaller ones have a relatively long residence time in air, allowing them to be transported over long distances and to undergo interaction processes (Després et al., 2012). PBAPs can play a very important role in the atmosphere – they affect cloud and precipitation formation processes by acting as cloud condensation nuclei (CCN) and ice nuclei (IN) (Morris et al., 2011). However, their role is still poorly understood because the sources and distribution of PBAPs in the atmosphere are not well quantified. Thus, to clarify their atmospheric transport and ecosystem interactions, the chemical and microbial constituents of PBAPs must be characterized and identified (Spracklen and Heald, 2014).
Chemical tracers, such as free amino acids and saccharides, have been traditionally used for the determination of particles of biological origin (Bauer et al., 2008; Helin et al., 2017). Free amino acids (AAs) are one of the most abundant compounds in bioaerosols and important markers for deposition and atmospheric transport (Barbaro et al., 2011). The emission of AAs is associated with the degradation of bacterial and biological materials (plants, pollens, algae, fungi, bacterial spores, etc.), but they can be also related to volcanic emissions and compounds from combustion (Dittmar et al., 2001; Ge et al., 2011). The exact impact of amino acids in the atmosphere is barely known, but they might be related to climate change and the atmospheric radiation balance (Chan et al., 2005). In addition, AAs can react with other oxidants present in the atmosphere, thus acting as pollutant scavengers or seeds for secondary aerosols (Haan et al., 2009; Zhang and Anastasio, 2001).
Saccharides – frequently found in both urban and rural air (Yan et al., 2019) as primary saccharides (mono- and disaccharides), saccharide polyols (reduced sugars), and/or anhydrosaccharide derivatives (especially levoglucosan) – are often used as tracers for biomass burning (Samaké et al., 2019a, b). However, they are also closely related to fungal activity (Wan and Yu, 2007). In this way, fungal saccharide emissions can correlate with several factors, such as temperature and carbon, nutrient, and oxygen availability (Pasanen et al., 1999). In addition, several studies have demonstrated the role of saccharides in the formation of clouds and ice nuclei and in regional climate change (Goldstein and Nobel, 1991, 1994; Krog et al., 1979).
The determination of chemical tracers in aerosol samples has clear advantages in qualitative analysis (Rathnayake et al., 2017; Staton et al., 2015). However, this approach provides very little information about the microbiological characteristics of PBAPs (Gosselin et al., 2016; Zhu et al., 2015). Classical techniques such as cultivation and microscopy are widely used for the clarification of the microbial groups present in samples, and they can provide information on cells, but only on viable and cultivable cells (Després et al., 2012; Manninen et al., 2014). Additional information about uncultivable or dead microorganisms as well as fragments of plant and animal cells can be obtained using molecular genetic analytical techniques such as quantitative polymerase chain reaction (qPCR) or next-generation sequencing (NGS) (Després et al., 2012).
Viruses have frequently been found attached to airborne particles (Yang et al., 2011). In this way, PBAPs might be considered a potential route for viral infection and transmission (Pica and Bouvier, 2012). However, unlike other living organisms such as bacteria, fungi, and algae, viruses do not have repair systems, and their inactivation in the atmosphere under the influence of certain environmental factors (changes in temperature, relative humidity, solar radiation, etc.) should not be overlooked (Després et al., 2012).
Bacteria, which typically range in size from 0.6 to 7.0 µm, can be found in the atmosphere as individual cells, attached to other particles, or as an agglomerate (Lighthart, 1997). Bacterial emission into the air depends on many factors such as seasonality, meteorological factors, the variability of bacterial sources, and anthropogenic influences (Fang et al., 2018; Innocente et al., 2017). Detailed aerosol–cloud models have shown that bacteria can alter the properties of clouds if present in sufficiently high number concentrations (Phillips et al., 2009). In addition, bacteria – especially those of the genus Pseudomonas – have been shown to participate in cloud formation by functioning as ice nuclei (Huffman et al., 2013).
Fungi, fungal spores, and their fragments are one of the most common components of PBAPs (Crawford et al., 2009). They are commonly between 0.5 and 15 µm in size, but larger spores can also be detected depending on the environmental conditions, fungal species, or age of the sporocarp (Huffman et al., 2010). Their role in the environment is of critical importance because many species can act as plant pathogens or trigger respiratory diseases and allergenic processes in humans (Reinmuth-Selzle et al., 2017). In addition, global and regional models have been used to evaluate fungal spore emissions and transport as well as their impact on the hydrological cycle by acting as CCN and IN (Spracklen and Heald, 2014).
There are very few places where airborne and particulate chemical and molecular genetic tracers, the detailed gas-phase chemistry, and the particle size distribution can be simultaneously observed in field conditions. Even though observations of the concentrations and distributions of different PBAPs are accumulating, there is still a lack of a comprehensive understanding of the processes behind the different observations and a need for detailed chemical characterization of the particles. In our previous study (Helin et al., 2017), amino acids, bacteria, and fungi were determined in aerosol samples collected at the SMEAR II station to establish seasonal variations and size distributions. Additionally, the effects of a few local meteorological factors and potential emission sources were also evaluated.
In this study, 84 size-segregated aerosol samples of four particle size fractions (< 1, 1–2.5, 2.5–10, and > 10 µm) were collected at the SMEAR II station (Station for Measuring forest Ecosystem-Atmosphere Relations; Hari and Kulmala, 2005) in Southern Finland in autumn 2017. The data from the SMEAR II station were searched for possible correlations with > 1200 simultaneously observed parameters from the forested ecosystem and the boundary layer, and thus provided a unique opportunity for a comprehensive analysis of interrelationships. Concentrations of chemical compounds (amino acids and saccharides) were determined by hydrophilic interaction liquid chromatography–mass spectrometry (HILIC-MS), and microbe gene copy numbers (bacteria, fungi, and Pseudomonas) and total DNA concentrations by DNA extraction and amplification. Different statistical tools, including classical techniques and machine learning (ML) approaches such as cluster analysis (CA), discriminant analysis (DA), and neural networks (NN), were used to clarify the relationships between particle size, environmental and meteorological conditions, and the composition of biogenic aerosols. Pearson correlation and multiple linear regression (MLR) were used for the elucidation of possible microbial biomarkers in biogenic aerosol particles. Finally, the potential connections between gas-phase VOCs, the microbiological composition of biogenic aerosol particles, and bacterial, fungal, and Pseudomonas gene copy numbers were also evaluated using CA, DA, and MLR.
2.1 Materials and reagents
Detailed information on materials and reagents is given in the Supplement (Sect. S1).
2.2 Instruments and apparatus
Aerosol samples were collected using a Dekati PM10 impactor (Dekati Ltd., Kangasala, Finland), which allows the simultaneous sampling of four particle size fractions (< 1.0, 1–2.5, 2.5–10, and > 10 µm). Polycarbonate membranes (25 mm) from Whatman Nuclepore (Global Life Sciences Solutions, Pittsburgh, PA, USA) filters were used for the collection of the three largest particle size fractions. A 47 mm Teflon filter (Gelman Sciences Ltd., Port Washington, NY, USA), smeared with diluted Apiezon L vacuum grease (Apiezon, Manchester, United Kingdom) to prevent bouncing, was used for the collection of the < 1.0 µm particles. A Branson 5510R-MT ultrasonic cleaner (Marshall Scientific, Hampton, NH, USA) was used for the extraction of saccharides and free amino acids from the filters.
An Agilent 1260 Infinity HPLC system (Agilent Technologies, Palo Alto, CA, USA) furnished with a SeQuant®ZIC®-cHILIC column (150 mm × 2.1 mm i.d., pore size 100 Å, 3 µm particle size) from Merck was coupled with an Agilent 6420 triple-quadrupole mass spectrometer equipped with an electrospray ion source (Agilent Technologies) and used for the individual isolation and determination of amino acids and saccharides in a single HILIC-MS analysis. A KrudKatcher ULTRA HPLC in-line filter (0.5 µm) from Phenomenex Inc. (Torrance, CA, USA) was used to protect the column from potential particulate impurities.
Volatile organic compounds (VOCs) were measured by a high-sensitivity proton-transfer-reaction mass spectrometer (PTR-MS, Ionicon Analytik GmbH, Innsbruck, Austria). The proton-transfer-reaction quadrupole mass spectrometer measured 13 different masses in a sampling time of 2.0 s. Samples were collected 8.4 m above ground level inside the canopy under a continuous airflow of 43 L min−1. They were drawn down into the instrument using a heated 157 m line (14 mm i.d. PTFE tubing). From this line, a side flow of 0.1 L min−1 was transferred to the PTR-MS via a 4 m PTFE tube with 1.6 mm i.d. The instrumental background was determined every third hour by measuring VOC-free air produced with a zero air generator (Parker ChromGas, model 3501).
2.3 Sampling place and aerosol sampling
Samples and measurements were collected/conducted at the SMEAR II station in Hyytiälä, Southern Finland ( N, E) in autumn 2017 (4 September–22 November 2017). The SMEAR II station is located in the middle of a forest that consists mostly of Scots pine (Pinus sylvestris L.) trees (Hari et al., 2013). In addition to Scots pine, there are some Norway spruce (Picea abies) and broadleaved trees such as European aspen
(Populus tremula) and birch (Betula sp.). The forest is about 50 years old and the canopy height is currently ca. 18 m. SMEAR II is classified as a rural measurement station and there are no large pollution sources near the station. The nearest large cities, Tampere (220 000 inhabitants) and Jyväskylä (140 000 inhabitants), are located about 60 and 100 km from the measurement station, respectively. Otherwise, there are no large pollution sources near the station. Eighty-four aerosol samples from four particle size fractions (21 from each) were collected using the device and filters described in the previous section. The sampling inlet was placed 5 m above the ground, the sampling flow rate was on average 30 L min−1, and the collection time was approximately 48 h (sampling volume: 89–94 m3). Additional information about the samples, including sampling period and volume, can be found in Table S1 in the Supplement. After collection, the filters were stored at −20 ∘C inside a closed polystyrene Petri dish covered with aluminium foil. Before analysis, the filters were cut into two pieces. One half was submitted to DNA extraction and amplification to characterize the microbiology of the samples; the other half was used for the simultaneous determination of amino acids and saccharides.
2.4 Chemical and microbiological characterization of the aerosol samples
The methods used for the chemical and microbiological characterization of the samples are based on those described by Helin et al. (2017) with some modifications. These changes are mainly related to the analytical procedure applied for the simultaneous determination of amino acids and saccharides.
2.4.1 Microbiological characterization
Total nucleic acids were extracted from the half of the filter selected for microbiological evaluation using a commercial DNA extraction kit (PowerWater DNA Isolation Kit, MoBio Laboratories, USA). Briefly, the DNA in the filters was extracted by 30 min of incubation at 65 ∘C using 1 mL of prewarmed lysis buffer as the extractant and subsequent homogenization, vortexing horizontally for 2.5 min. The remaining steps were carried out according to the supplier's protocol, and the DNA was eluted with 100 µL of 10 mM Tris. The extracted DNA was further concentrated by precipitating it with 5 µL of 3 M NaCl and 200 µL of 99 % cold ethanol at −20 ∘C for an hour before centrifugation at 10 000 ×g for 5 min. The liquid was decanted and the pellet was dried in ambient air before the DNA was redissolved in 50 µL of 10 mM Tris. The DNA concentration and purity were measured fluorometrically with a Qubit 2.0 fluorometer (Thermo Fisher Scientific, Waltham, MA, USA). The DNA samples were stored at −20 ∘C prior to qPCR.
The qPCR reactions were carried out with a Bio-Rad CFX96 iCycler on 96-well white polypropylene plates (Bio-Rad, USA). The amounts of bacterial 16S and fungal 18S ribosomal DNA in the samples were quantified with qPCR using the target-specific primer pairs Eub338F and Eub518R (Fierer et al., 2005) and FF390 and FR1 (Vainio and Hantula, 2000). The genus-specific primers Eub338F (Fierer et al., 2005) and PseudoR (Purohit et al., 2003) were utilized to detect bacteria belonging to the genus Pseudomonas. The selected qPCR reaction conditions were similar to those used in Helin et al. (2017). Three technical replicates were prepared from each DNA sample and standard, and three negative controls were analysed from each master mix. The bacterial and Pseudomonas genus-specific reaction mixtures, which had a final reaction volume of 20 µL (adjusted with nuclease-free water), contained SsoAdvanced Universal SYBR Green Supermix (Bio-Rad, USA) at a final concentration of 1×, 5 µL of template DNA, and 250 nM of forward and reverse primers. The same reaction mixture was used for the fungal primers. In this case, the concentration of FF390 was 250 nM and that of FR1 was 200 nM. The manufacturer's protocol for the development of qPCR reactions, which combined annealing and extension, was followed. In this case, different conditions and times were used for bacteria and fungi (55 ∘C, 30 s for bacterial and Pseudomonas primers and 60 ∘C, 45 s for fungal primers). In all cases, fluorescent measurements performed during the elongation step were used for the quantitation. Specifically, 1.5 % () agarose gel (BioTop) and 0.3 % () ethidium bromide (Sigma-Aldrich) were used for qPCR product analysis and visualization under UV light. In the bacterial and Pseudomonas-specific qPCR reactions, standard curves were generated with DNA extracted from Pseudomonas fluorescens H-27 (Hambi culture collection, University of Helsinki); for the fungal-specific qPCR, the DNA from the whole-genome-sequenced Phlebia radiata FBCC43 (FBCC culture collection, University of Helsinki) was used (Kuuskeri et al., 2016). Results, expressed as gene copies, were normalized by the total amount of sampled air.
In addition to the actual samples, we extracted DNA from eight blank filters, determined their DNA concentrations, and used the extracts as templates in qPCR. All the blank filters were below the detection limit in DNA concentration assays with Qubit as well as in all (three) qPCR assays.
2.4.2 Chemical characterization
For the determination of amino acids and saccharides, half of the filters were spiked with internal standard solutions and transferred to a test tube for ultrasound-assisted extraction at room temperature using 0.1 % formic acid as extraction solvent. Three extraction cycles (2 mL (15 min), 2 mL (10 min), and 1 mL (10 min)) were needed to ensure the complete extraction of the analytes. After the removal of lipids and other nonpolar interferences by liquid-liquid extraction (with 1 mL of hexane used as the extractant), the aqueous phase was concentrated from approximately 5 mL to 1 mL at 50 ∘C under a gentle flow of nitrogen. A final centrifugation step was used to eliminate as many insoluble particles as possible before analysis. The samples were stored at 4 ∘C and analysed within 72 h. Blank filters were processed simultaneously with the real samples and used to correct the results.
The developed HILIC method allowed the simultaneous determination of amino acids and saccharides in the extracts. The column temperature was set to 50 ∘C. Mobile phase A was acetonitrile with 0.1 % formic acid, and mobile phase B was MQ water with 0.1 % formic acid. The separation of the target analytes was performed using the following gradient program: 20 % B for 15 min (0.4 mL min−1), 20 %–80 % B for 5 min (0.3 mL min−1), followed by 80 %–20 % B for 3 min (0.3 mL min−1). The total analysis time was 23 min, and 12 min were required to re-establish the initial conditions. The injection volume was 3 µL. The entire effluent was fed to the electrospray source for ionization (ESI; positive and negative mode for amino acids and sugars, respectively) and monitored by MS2 detection in multiple reaction monitoring mode (MRM), with the exception of levoglucosan, which was analysed in selected ion monitoring mode. Ionization conditions and MRM parameters for the different compounds are found in Tables S2 and S3. Results were normalized by the total amount of sampled air.
2.5 Additional background data
Meteorological and environmental parameters are continuously measured at the SMEAR II station and the resulting data are available from the AVAA portal (Junninen et al., 2009). Among all of the data available (more than 1200 simultaneously observed parameters from the forested ecosystem and the boundary layer), 41 parameters, including aerosol parameters, concentrations of atmospheric gases, and meteorological and environmental data, were selected for further statistical analysis. Detailed information about these variables is provided in the Supplement (Table S4). Data from the portal (half-hourly averaged) were further averaged across each sampling time period using the arithmetic mean.
Volatile organic compounds (VOCs) were measured by a high-sensitivity proton-transfer-reaction mass spectrometer. Detailed information on the instrument used for the measurements, the measured masses, the potential relations between those masses and individual VOCs, and the instrumental calibration can be found in the “Instruments and apparatus section” and Sect. S2.
2.6 Statistical analysis
A number of R (version 3.6.3) tools were used in this research for statistical analysis (R Team, 2019). Standardized skewness and kurtosis tests were used for the evaluation of data distribution normality. Additional logarithmic transformation was needed to ensure that the input variables had normal data distributions. Variables quantified in less than one-quarter of the samples (N< 5) were not considered for further statistical analysis.
The Pearson product moment correlation between each pair of variables (normally distributed data) was evaluated to measure the strength of their linear relationship. P-values were used to evaluate the statistical significance of the estimated correlations. P-values ≤ 0.05 indicate statistically significant nonzero correlations at the 95 % confidence level.
Cluster analysis, a ML tool based on a nonsupervised pattern recognition approach, was used to group the samples into clusters according to the similarities in the meteorological and environmental data. The different variables used for the development of the model are listed in Table S4. In addition, samples were grouped according to gas-phase VOC emissions. In all cases, the furthest neighbour method and the squared Euclidean distance were utilized for model development.
ML algorithms utilizing linear discriminant analysis or probabilistic NN based on Bayesian classifiers were used to clarify the seasonal distributions of chemical compounds and microbes in biogenic aerosol particles. The concentrations of amino acids and saccharides (in ng m−3), the amount of bacteria, the amount of Pseudomonas, and the amount of fungi (expressed as the gene copy number m−3), and the total amount of DNA in the samples (in ng m−3) were used as input variables. These ML algorithms utilizing DA or NN were also used to elucidate potential connections between gas-phase VOCs, the microbiological composition of the biogenic aerosol particles, the particle size, and aerosol chemical composition.
Multiple linear regression via backward stepwise selection to remove nonstatistically significant variables was used to identify potential microbial biomarkers in airborne particles. The same approach was selected for the clarification of links between potential gas-phase VOCs and the microbiological composition of biogenic aerosols. The amount of bacteria, amount of Pseudomonas, and amount of fungi (expressed as the gene copy number m−3) were used as dependent variables in all cases. The concentrations of amino acids and saccharides in the samples (expressed as ng m−3) and the concentration of gas-phase VOCs (expressed in ppbv) were used as independent variables. Different parameters were used for the evaluation of the MLR models. The P-value indicates whether there is a statistically significant relationship between the variables at the 95.0 % confidence level. The explained variance of the data was indicated by the R2 values. Finally, the residuals of the model were evaluated using the standard error of the estimate, the mean absolute error, and the Durbin-Watson test, which allows the elucidation of the prediction limit for new observations, the average value, and the potential autocorrelation between the residuals, respectively.
3.1 Analytical features of the methods used for chemical and microbiological analysis of the biogenic aerosol samples
The analytical approach used for the chemical characterization of the biogenic aerosol particles allowed the simultaneous determination of free amino acids and saccharides in a single HILIC-MS run. Typical chromatograms obtained for standard solutions and natural samples, the features of the method (regression coefficient, linear range, LOD, and LOQ), extraction recoveries, and the effect of the sample matrix on the results can be found in the Supplement (Fig. S1 and Tables S5–S7).
Good linearities were achieved for all the analytes under study. In addition, linear ranges of at least two orders of magnitude were achieved for most of the compounds under study. Tryptophan (Trp) gave the shortest linear range (one order of magnitude), while those for glutamine (Gln), arginine (Arg), and fructose were three orders of magnitude. Detection limits were calculated for each compound using the standard deviation of the estimate and the slope values (Shrivastava and Gupta, 2011). In the case of free amino acids, LODs ranged between 0.01 (Arg) and 0.04 (histidine (His)) ng m−3. Similar results were also achieved for saccharides whose LODs ranged between 0.01 ng m−3 (arabitol) and 0.05 ng m−3 (fructose) (Table S5).
Recovery experiments were done using the approach proposed by Helin et al. (2017). Extraction recoveries ranged from 73 % (tyrosine (Tyr)) to 134 % (serine (Ser)) for AAs, and from 82 % (mannitol) to 125 % (levoglucosan) for saccharides (Table S6).
A pool of samples containing different particle sizes (1.0–2.5 µm and > 10 µm particles) and spiked at three different concentration levels (8, 77, and 111 ng) with each analyte were used to establish the accuracy of the method and potential matrix effects on the ionization. Average recoveries ranging from 93.5 % (Gln) to 116.4 % (asparagine (Asn)) and from 80.3 % (fructose) to 99.6 % (inositol) were obtained for amino acids and saccharides, respectively (Table S7).
In addition, the detection limit of the Qubit method for the determination of the total amount of DNA in the biogenic aerosol particles was 0.51 ng of DNA/filter.
3.2 Chemical and microbiological composition of the biogenic aerosol particles
Results of the chemical and microbiological characterization of the biogenic aerosol particles collected from the SMEAR II station in 2017 are shown in Fig. 1 and Tables S8–S11. For total biogenic aerosol particles, the average concentration of AAs ranged from 0.3 (Trp) to 9.4 (Gln) ng m−3 and the average concentration of saccharides ranged between 1.3 (inositol) and 19.0 (mannitol) ng m−3. In addition, the average gene copy numbers m−3 for bacteria, Pseudomonas, and fungi were 72, 3.3, and 134.0, respectively. Finally, the average total DNA concentration was 0.05 ng m−3. These values are relatively low in comparison with those found in our previous research (Helin et al., 2017) and other publications. Specifically, the values obtained for the total DNA concentration and the bacterial gene copy number are below the ranges reported in the literature. However, these results might be explained by differences in climatic conditions/meteorological variables. As can be seen in Table S12, the total number of particles in 2017 was around half that in 2014, supporting the difference between the results for gene copy number m−3. Namely, in Finland, the annual variation in air microbial concentration can be very high due to large differences in weather conditions between seasons. Helin et al. also reported low concentrations/gene copy numbers for the samples collected during the winter season. Additionally, the use of the same sample for both chemical and DNA analysis, with the filter divided into two equal pieces, might affect the detection limit of the method used for DNA analysis due to the use of a small amount of sample, but it did not affect the observed gene copy numbers m−3.
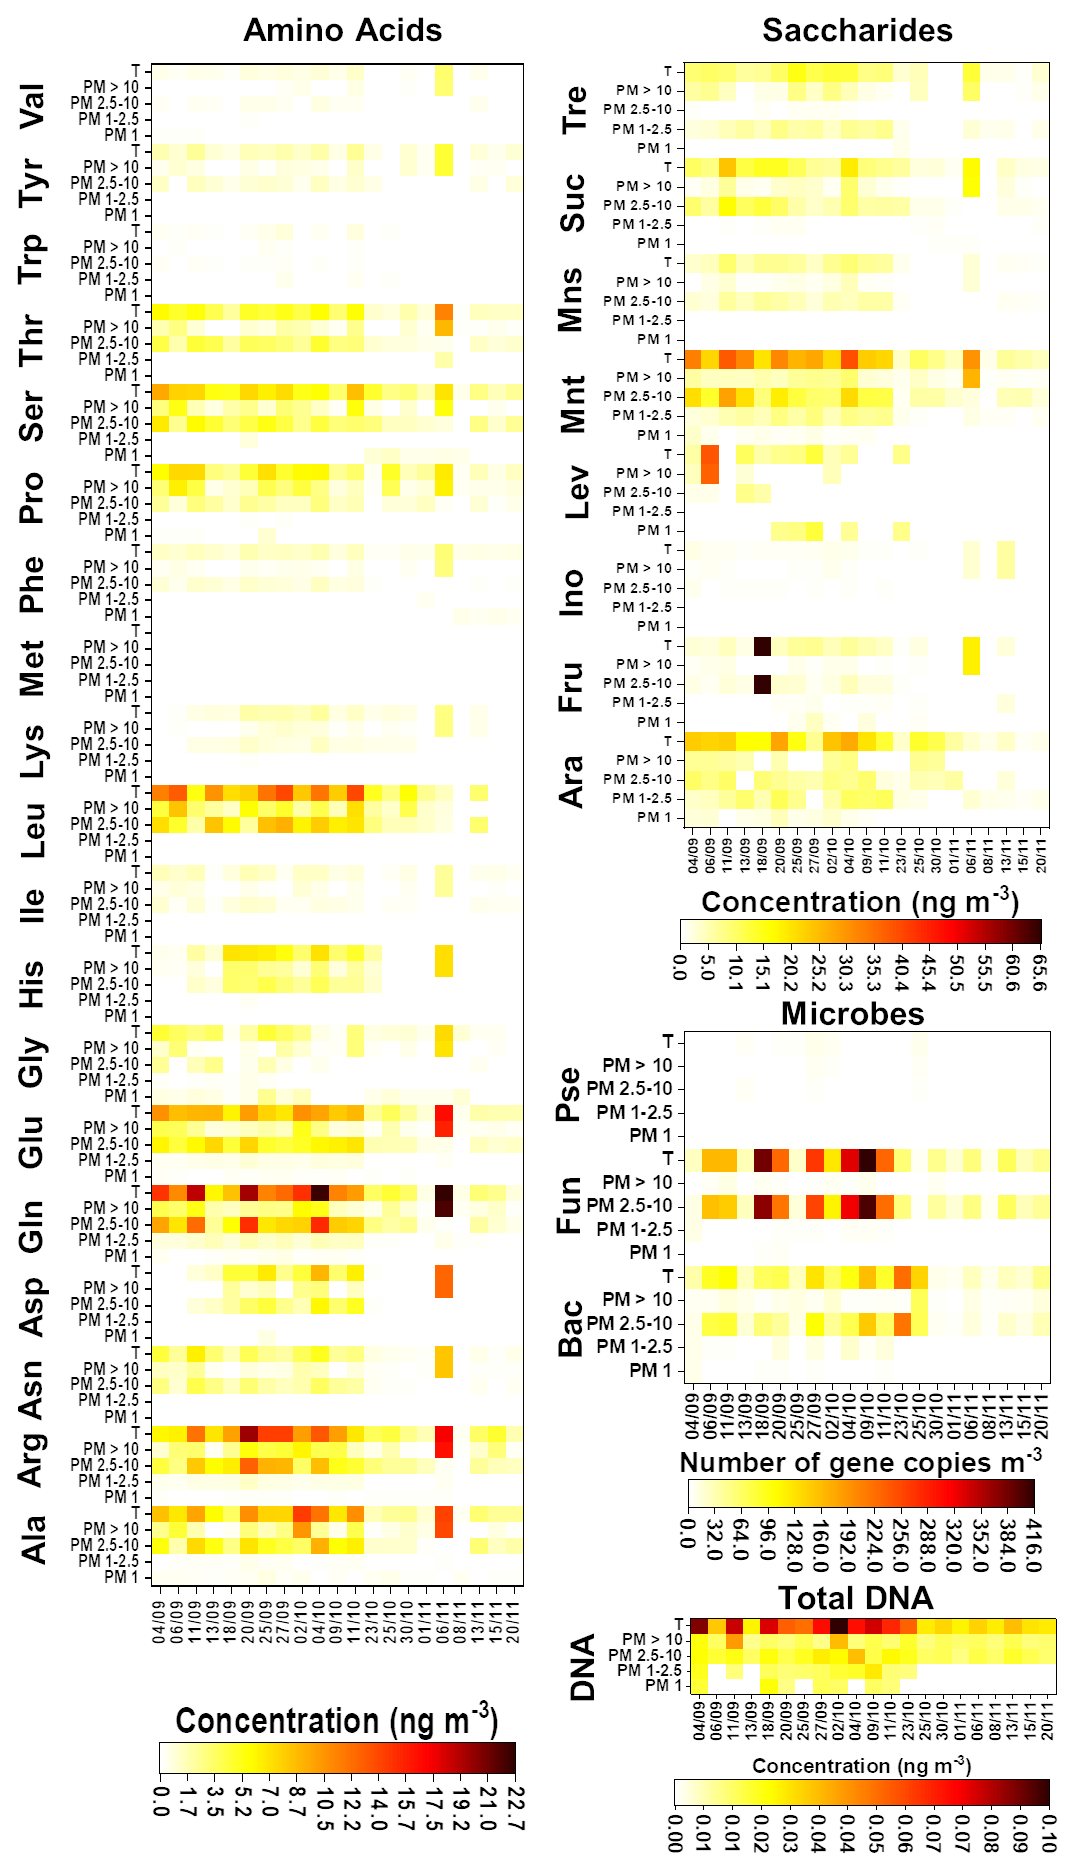
Figure 1Chemical and microbiological compositions of the analysed filters. The first day of sampling is shown on the x axis. Bac, bacteria; Pse, Pseudomonas; and Fun, fungi.
In general, the number and concentration of saccharides and amino acids and the gene copy numbers increased with particle size up to 10 µm. A detailed study of the results obtained for the smallest (i.e. < 1.0 µm) particles revealed that bacteria and fungi were present in almost all the samples. However, Pseudomonas was found just in 50 % of them. In addition, the total DNA concentration was under the LOQ for 66 % of the samples. The average gene copy numbers of bacteria were higher than those of fungi. The chemical composition of < 1.0 µm particles was quite simple in comparison with the composition of bigger particles. Just five free amino acids – alanine (Ala), glutamic acid (Glu), glycine (Gly), valine (Val), and proline (Pro) – were found at least in 70 % of the samples. Among these, Gly and Pro had the highest and lowest concentrations, respectively. Saccharides were only a minor component of this fraction: only arabitol and mannitol were found, and only in approximately half of the samples. These results are in good agreement with those found for remote-source aerosol particles (Scalabrin et al., 2012).
In the mid-size range, i.e. 1.0–2.5 µm particles, the total concentration of DNA was over the LOQ in at least in 50 % of the samples. In addition, these particles were clearly more chemically complex than < 1.0 µm particles. Arabitol, mannitol, and trehalose were found at least in 70 % of the samples. Mannitol and trehalose were the saccharides present at the highest concentration. A detailed examination of the results for free amino acids showed the presence of two different groups as a function of the detection frequency in the samples under study. Gln, Glu, Arg, Ala, Pro, and phenylalanine (Phe) were detected in at least 70 % of the samples. On the other hand, His was found in only 50 % of them. Gln and Phe were the amino acids with the highest and lowest concentrations, respectively.
The microbiological results highlighted clear differences between the large particles (i.e. 2.5–10.0 µm particles) and the other size classes. High ribosomal 18S gene copy numbers were determined for fungi and total DNA in all the samples. The results provided by the chemical analysis of the samples demonstrated a clear increase in the number of saccharides (7) and free amino acids (11) found in at least 70 % of the samples as compared with the smaller size classes. Also, mannitol and trehalose were the saccharides detected at the highest concentrations in these particles. In addition, Arg and Trp were the amino acids with the highest and the lowest concentrations, respectively. These results, including those achieved for 1.0–2.5 µm particles, are in good agreement with those reported previously for aerosol particles collected from the SMEAR II station (Helin et al., 2017).
Finally, microbiological analysis of the largest particle size class (i.e. > 10 µm particles) showed that bacteria, fungi, and total DNA were above the LOQ in all the samples under study. As also observed for smaller particles, the 16S gene copy numbers of bacteria were higher than those of fungi in this size class. In addition, Pseudomonas was detected in just 40 % of the samples. Focusing on the chemical analysis, the number of saccharides detected in at least 70 % of the samples was four – less than the number (seven) detected in 2.5–10.0 µm particles. This can be explained by noting the clear decrease in fungi ribosomal 18S gene copy numbers in ≥ 10 µm particles and the role of saccharides as typical fungal markers (Bauer et al., 2008). However, the number of amino acids present at least in 70 % of the samples remained the same (11) as in smaller particles. In this case, Trp and leucine (Leu) were the amino acids with the highest and the lowest concentrations, respectively. Leu is one of the most abundant AAs in plants, which could indicate that it occurs in > 10 µm particles due to the emission of plant debris and pollen grains into the air (Mashayekhy Rad et al., 2019; Nicolson and Human, 2013).
3.3 Evaluation of the relationship between the particle size and the composition of biogenic aerosol particles
The relationship between different particle sizes for the microbial groups and chemical compounds detected in biogenic airborne particles was evaluated using two different statistical approaches. The first one, based on classical correlation (Pearson), was used to find statistically significant relations between the particle sizes and the composition (chemical and microbial) of aerosols. The concentrations of the individual compounds and the number of gene copies in microbes determined for different particle sizes were used as variables. The second method allowed the clarification of potential variations in the composition of biogenic aerosol particles with different sizes based on the use of microbiological and chemical profiles. This approach required the use of more complex statistical algorithms (ML approaches) such as DA and NN. In this case, 84 samples were divided into training and validation sets containing 68 (80 %) and 16 (20 %) samples, respectively. These sets were used for model development and subsequent unbiased evaluation, respectively.
Evaluating the potential correlations between different particle sizes and the individual chemicals and microbes (used as variables) can be useful for identifying the presence of a common emission source and/or the participation of these compounds and microbes in the growth of the biogenic aerosol particles. However, a surprisingly small number of correlations were found between the different particle sizes for the individual compounds and microbial groups under study (Fig. S2). None of the evaluated variables, chemical or microbial, provided simultaneous correlations between all the particles sizes under study. In addition, the highest number of correlations between particle sizes were achieved for fungi and Gln. In both cases, it was possible to find correlations between the samples with particle sizes of less than 10 µm. Additional correlations for different compounds were observed between 1.0–2.5 and 2.5–10.0 µm particles (Fig. S2).
Discriminant analysis was able to correctly classify 61 (89.7 %) and 14 (87.5 %) of the samples included in the training and validation sets, respectively, demonstrating a clear relationship between particle size and biogenic aerosol particle composition. A detailed study of the influence of the variables on the model indicated three different trends (Fig. 2). The first – found for the Pseudomonas 16S gene copy number and for the inositol, His, and Pro concentrations – showed an increase in the concentration (or gene copy number in the case of Pseudomonas) with the particle size. The second, observed for levoglucosan and Gly, revealed that the highest concentrations were obtained for the smallest particle sizes (< 1 µm) and the lowest concentration values were found for 1.0–2.5 µm particles. Above this particle size range, there was a progressive increase in the concentration with particle size. The last trend – found for most of the compounds and the microbial groups – gave the highest concentration values for 2.5–10 µm particles, followed by > 10 and 1–2.5 µm particles. The concentrations of the different chemicals and the gene copy numbers of microbial groups in the 1–2.5 µm particles were higher than or at least similar to those in the smallest particle sizes under study (< 1 µm), with some exceptions.

Figure 2Comparison of the concentration profiles obtained for the chemical and microbiological species and the total DNA found in the filters as a function of the particle size. Blue bar, < 1.0 µm particles; orange bar, 1.0–2.5 µm particles; grey bar, 2.5–10.0 µm particles; yellow bar, 10 > µm particles. Bac, bacteria; Pse, Pseudomonas; Fun, fungi.
The use of a more complex ML algorithm such as a NN for the classification of the samples allowed the correct classification of 52 (76.5 %) and 12 (75.0 %) of the samples included in the training and validation sets, respectively. Only a relatively limited number of samples were used for the development of the different models, which clearly influenced their classification performance.
3.4 Seasonal distribution of chemical compounds and microbes in biogenic aerosol particles
The seasonal distribution of chemical compounds and microbes in the atmospheric biogenic aerosol particles was evaluated using a two-step approach.
First, the samples were classified into different sampling periods according to the observed differences in the concentrations of atmospheric gases and aerosol, meteorological, and environmental parameters. Among all (> 1200) the forested-ecosystem and boundary-layer parameters simultaneously monitored at the SMEAR II station, 41 (Table S4) were selected as CA data input for the visualization of seasonal differences between samples. The farthest neighbour approach and squared Euclidean distance were applied for clustering. The final number of clusters (sample groups) was optimized according to the distribution provided by CA, avoiding the presence of clusters containing a very limited number of samples, which would hinder additional statistical analysis (Table S13).
Two different sampling periods (clusters) were found for the campaign under study. The first period (group 1) contains 48 samples collected from 4 September to 13 October 2017. The second period (group 2) consists of 36 samples collected from 23 October to 22 November 2017. Differences between these periods in terms of the different variables used in this study can be found in Fig. S3. The main differences were observed for snow (M21) and water precipitation (M22), the air temperature (M14) and the soil temperature in different layers (M33–M36), the solar radiation (M23–M25), and other parameters such as evapotranspiration (M03), soil heat flux (M41), and gross primary production derived from net ecosystem exchange (M05). For these variables, the highest values were found for group 1 samples, with the exception of snow precipitation.
Once differences between the different sampling periods were established, ML tools such as DA and Bayesian NN were used to clarify the seasonal distributions of chemical compounds and microbes in the biogenic aerosol particles. The sample groups obtained from the previous step were used for the classification of the biogenic aerosol particles based on their chemical and microbiological compositions as input data. As stated in the previous section, the samples (84) were divided into training and validation sets containing 68 (80.0 %) and 16 (20.0 %) samples, respectively. The performance (accuracy) of the supervised models was evaluated by cross-validation using the training set. The rest of the samples formed the validation set, which was used for the evaluation of the predictive ability of the models. In this way, the percentage of the samples that were correctly classified were easily associated with the real differentiation of the samples into the selected groups based on the variables used for model development and their validity. This is especially important in the case of the validation set samples because they were not used during model development. However, it was not easy to estimate the number of incorrectly classified samples (samples that do not follow the trend found for their group) using this approach. Incorrect classification could occur due to experimental errors in the calculations of the chemical compounds and microbes, missing data, or the potential influence of meteorological and environmental variables not considered in this study.
Discriminant analysis provided the correct classification of 60 (88.2 %) and 13 (81.2 %) of the samples included in the training and validation sets, respectively. In addition, five (45.5 %) of the incorrectly classified samples belonged to the group of < 1.0 µm particles. This could be explained by the limited information available on the chemical and microbiological composition of these samples (Fig. 1). As can be seen from Fig. 3, a clear trend was found for the average concentrations calculated for all the particle sizes under study. The gene copy numbers of bacteria and fungi and the concentrations of chemical species were higher in the biogenic aerosol particles collected during sampling period 1 compared to sampling period 2. The same trend was observed for the individual particle sizes. These results are in good agreement with those recently found in literature evaluating the influences of environmental factors on ambient air concentrations of saccharides and microbes (Innocente et al., 2017; Samaké et al., 2019b). In addition, the DA results were supported by those obtained when Bayesian NN was used for the classification of the samples; the NN correctly classified 49 (72.1 %) and 10 (62.5 %) of the samples included in the training and validation sets, respectively. Among all the incorrectly classified samples, 11 (43.8 %) belonged to the group of < 1.0 µm particles. Once again, the classification performance of more complex algorithms such as NN was clearly affected by the limited number of samples analysed. The use of a larger dataset would improve the reliability of these results.
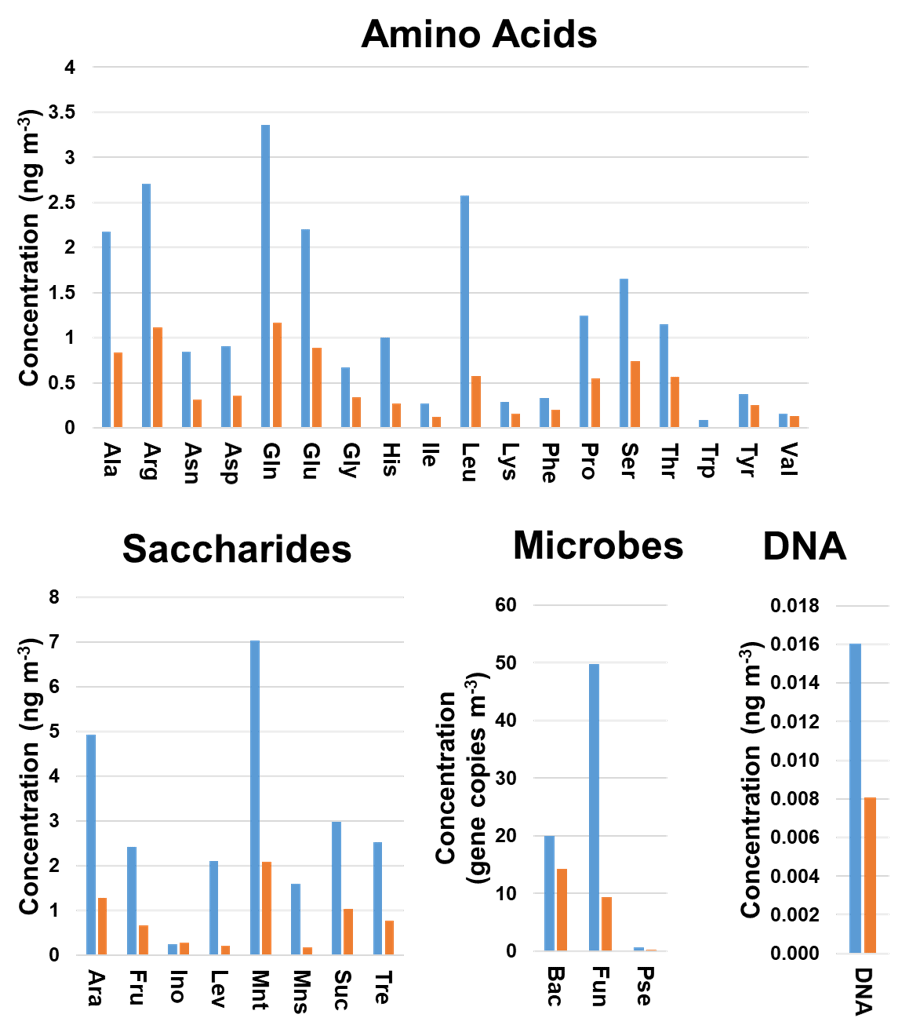
Figure 3Variation in the chemical and microbiological compositions of the biogenic aerosols with the sampling period. Average concentrations were calculated for all filter sizes analysed. Blue bars refer to sampling period 1 (4 September–13 October 2017) and orange bars to sampling period 2 (23 October–22 November 2017). Bac, bacteria; Pse, Pseudomonas; Fun, fungi.
3.5 Identification of potential microbial biomarkers in biogenic aerosol particles
A potentially simple way to elucidate microbial biomarkers in biogenic aerosol particles is to evaluate the correlation between the concentration of a chemical species and the gene copy numbers of multiple microbes in the biogenic aerosol particles. However, it is well known that different chemical compounds such as saccharides and amino acids are produced and in some cases emitted to the atmosphere by microbes during metabolic activities (Bauer et al., 2008). Accordingly, it is extremely difficult to discern specific correlations between airborne microbes and atmospheric chemical compounds. Such correlations between atmospheric compounds and microbes might help to elucidate potential biomarkers for airborne microbes if the relation between the airborne microbes and their presence in forest ecosystems is considered along with the presence of multi-emission sources at the sampling site for the chemicals under study. The unique and exceptional characteristics of the SMEAR II station, a remote measurement station with no large pollution sources nearby, minimizes the problems associated with the latter issue. Two different approaches based on statistical analysis of the results were selected for the elucidation of the chemical fingerprint of the microbes in the biogenic aerosol particles. The first one, based on Pearson correlation, used the individual microbial groups (bacteria, Pseudomonas, and fungi) and chemical compounds as dependent and independent variables, respectively. The second one, based on MLR, used the individual microbial groups as dependent variables and the chemical profiles, including AAs and saccharides, as independent variables.
The irregular dependence of the chemical compound and microbe concentrations in the biogenic aerosol particles on the particle size (Fig. 1) hinders the development of general statistical models that include all of the samples studied. Different models were evaluated for different particle sizes to minimize these problems. In addition, the limited number of samples used for the development of the different models (< 20) could affect the reliability of the results, including their predictive capacity. However, the resulting MLR models might still be useful for the identification of potential microbial biomarkers in the samples.
The results achieved for the Pearson correlations between chemical compounds and microbial groups (P-value < 0.05) can be seen in Fig. S4. In the case of MLR, a backward stepwise selection approach was used to remove statistically nonsignificant variables. This approach is especially relevant considering the potential limitations of MLR. As stated before, the concentrations of the different amino acids (19) and sugars (8) present in the biogenic aerosol particles were used as independent variables. When the number of independent variables was higher than the number of samples, the variables were split into two smaller batches, each containing 50 % of the variables. Preliminary MLR models were developed to identify statistically significant variables, which were subsequently selected for the development of definitive equations. Detailed information on the different MLR models developed can be found in Fig. 4 and Table S14.
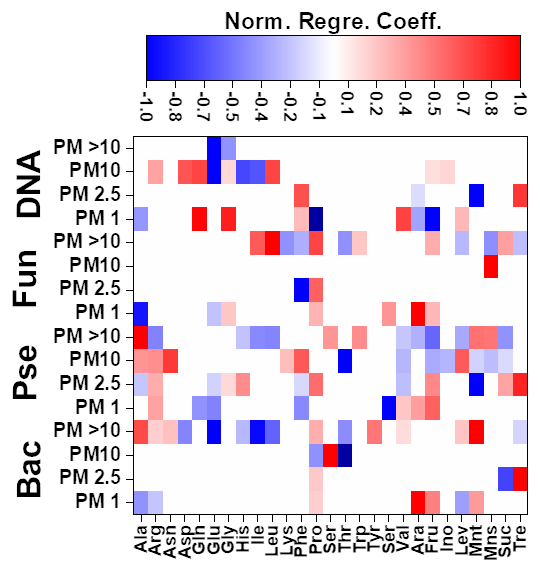
Figure 4Normalized regression coefficients obtained for the MLR models developed for the potential elucidation of chemical fingerprints from microbes in the biogenic aerosol particles. Maximum normalization was applied in all cases. Bac, bacteria; Pse, Pseudomonas; Fun, fungi.
The evaluation of Pearson correlations for the < 1.0 µm particles (Fig. S4) indicated that there were positive correlations between all the microbial groups and Pro. The simultaneous use of different AAs and saccharides for the development of the MLR equations clearly improved the results in comparison with those from Pearson correlation (Table S14). The evaluation of the statistically significant MLR coefficients (Fig. 4) indicated clear correlations between the gene copy numbers of the microbial groups and the concentrations of Pro (but not for Pseudomonas) and different saccharides such as arabitol and fructose. As stated before, saccharides are produced by biological sources such as bacteria and fungi via metabolic activities (Bauer et al., 2008). Specifically, arabitol is well known as a fungal spore tracer (Jia and Fraser, 2011; Yang et al., 2012). In addition, Pro is a widely recognized product of the degradation of organic matter by bacteria and fungi (Li, 2019).
For the 1.0–2.5 µm particles, it should be emphasized that there was a clear negative Pearson correlation between the total DNA concentration and His (Fig. S4). His is reported in the literature to act as a catalyser of DNA double-strand breakage in the presence of oxidants. This could affect the results reported for the DNA concentrations in the samples (Cantoni et al., 1992). However, it is not possible to establish a relation between the concentration of His and the concentration of dead airborne microorganisms. Additionally, positive correlations were observed between microbial groups and Glu, Gln, and mannitol. The first is a well-known fermentation by-product of bacteria and fungi (Kinoshita et al., 2005). Mannitol, synthesized by plants, is released into bacteria and fungi during the degradation of organic matter (Upadhyay et al., 2015). In addition, Gln, a metabolite of central importance in bacterial and fungal physiology, is the basis for a large variety of nitrogen-containing compounds and is closely linked to bacterial and fungal ammonia assimilation (van Heeswijk et al., 2013). It should also be noted that the correlation results given by MLR are a clear improvement on those from Pearson correlation (Table S14). Detailed evaluation of the regression coefficients (Fig. 4) indicated that trehalose correlates with the 16S gene copy numbers of bacteria and Pseudomonas. Finally, Phe correlates with the gene copy numbers of Pseudomonas and fungi. Trehalose has been reported to be a microbial cellular component in a wide variety of microorganisms, including bacteria, yeast, fungi, and insects (Elbein et al., 2003). Finally, microorganisms utilize Phe for the production of more complex compounds such as cinnamic acid (Hyun et al., 2011).
The correlation between sucrose and the microbial groups could be of special interest. This saccharide has a key role in the symbiotic association of bacteria and fungi with plants (Vargas et al., 2009). The results achieved from Pearson correlation studies of the 2.5–10.0 µm particles (Fig. S4) indicated a positive but weak correlation between bacteria, fungi, Gln, and sucrose. This correlation was also observed for 1.0–2.5 µm particles. The use of more complex statistical approaches, such as MLR, could explain the higher data variability in comparison with Pearson correlation (Table S14). The evaluation of the regression coefficients that statistically significantly influenced the MLR models (Fig. 4) showed a clear correlation between mannose and the ribosomal 18S gene copy numbers of fungi. Mannose plays a very important role in fungi as a cell wall component, providing integrity and microbiological viability (Meyer-Wentrup et al., 2007).
Finally, detailed evaluation of the results obtained for the biogenic aerosol particles with diameters exceeding 10 µm revealed correlations between bacteria and saccharides such as mannose and trehalose (Fig. S4). Mannose is used by bacteria as a lectin-like substance to bind to cells, and may also find its way to aerosol particles (Sharon et al., 1981). Additionally, correlations were found between bacteria and some important AAs in the Krebs cycle. Pseudomonas had a clear correlation with Gly (P-value < 0.01, R2 > 0.95). The simplest AA, Gly, is a metabolic product used in some bacteria. Specifically, Gly is used by Pseudomonas as a carbon source in the biosynthesis of complex structures (Lundgren et al., 2013). The explained variance of the data was clearly improved by the use of MLR models, as shown in Table S14. Detailed evaluation of the regression coefficients (Fig. 4) showed a clear positive correlation between the 16S gene copy numbers of the bacteria and Pseudomonas in the samples and the concentrations of mannitol and Ala. The latter plays an important role in bacteria, especially in Pseudomonas, as a constituent of pantothenic acid (Boulette et al., 2009). In addition, there were significant correlation coefficients between fungi and three AAs: Ile, Leu, and Pro. These AAs, essential to humans, can easily be synthesized by fungi (Jastrzębowska and Gabriel, 2015).
3.6 Elucidation of potential connections between gas-phase VOCs and the microbiological composition of the biogenic aerosol particles
Soil microorganisms, bacteria, and fungi produce large quantities of highly diverse VOCs in organic matter mineralization and nutrient accumulation processes. Some of these VOCs are emitted to the atmosphere. Once in the atmosphere they can be taken in by other organisms, released in underground habitats, or participate in the formation and growth of secondary aerosol particles. In this way, the evaluation of the potential connections between gas-phase VOCs and the microbiological composition of biogenic aerosol particles could provide information about their role as potential emission sources, or at least about usual conditions under which both VOCs and microbes are released to the atmosphere.
Preliminary studies were carried out with a two-step methodology according to Sect. 3.4. First, the gas-phase concentrations of 13 VOCs (Fig. S5) were used for the development of CA models. These models allowed the visualization of seasonal differences between samples. The samples were collected during two time periods (clusters) at the SMEAR II station. The first 32 samples were collected from 4 to 15 September and from 25 September to 6 October 2017 (period 1). Then 52 samples were collected from 18 to 22 September and from 9 October to 22 November 2017 (period 2). In all cases, the highest concentrations of VOCs in the gas phase were found during period 1 (Fig. S6a). These periods were used for the development of DA models, which enabled the classification of the biogenic aerosol particles using their chemical and microbiological composition as input data. Discriminant analysis was able to provide the correct classification of 72 samples, 85.7 % of the total. Period 1 samples gave the highest values for all chemical and microbial groups with the exception of fructose, confirming that there was a clear connection between the gas-phase concentrations of VOCs and the chemical and microbial groups in the biogenic aerosol particles (Fig. S6b). These results varied only slightly from those found using the concentrations of atmospheric gases and aerosol, meteorological, and environmental parameters as variables. In this way, the connection between these variables, the gas-phase VOCs, and the chemical and microbiological composition of the biogenic aerosol particles was revealed.
In a second approach, the correlations between the concentrations of gas-phase VOCs and the gene copy numbers of bacteria and fungi in the biogenic aerosol particles were evaluated using statistical tools: Pearson correlation and MLR algorithms. The amount of microbes, expressed in gene copies m−3, was used as a dependent variable. The gas-phase concentrations of 13 VOCs were used as independent variables. The limited number of independent variables used in this study – smaller than the number of samples in all cases – allowed ordinary least squares to be used as the fitting algorithm instead of the backward stepwise algorithm used in the previous section. The limitations arising from the small number of samples used for the development of the different statistical models (as discussed in the previous section) were considered in the present study. As described in the previous section, the results achieved from these models should be interpreted carefully. Correlations between different VOCs and specific microbes should not be used to identify these microbes in the air, as this would assume that those VOCs are only released by those airborne microbes, whereas it is well known that large amounts of microbes are present in different forest ecosystems (trees, plant leaves, etc.), and their VOC emissions to the air cannot be ignored.
The results achieved from Pearson correlations can be found in Fig. S7. Detailed evaluation of these results for < 1.0 µm particles (Fig. S7) indicated that there were positive correlations between Pseudomonas and seven of the VOCs analysed. However, no correlation with the gas-phase VOCs was observed for other bacteria and fungi. In most cases, with the exception of methacrolein, these compounds are reported to be produced and emitted to the atmosphere by Pseudomonas (Effmert et al., 2012). As stated before, the use of relatively complex ML approaches, such as MLR, clearly improved the results. Successful models were achieved for all of the microbes under study. Detailed information on the MLR models can be found in Table S15. Evaluation of the statistically significant MLR coefficients (Fig. 5) indicated that air concentrations of acetone, toluene, and isoprene correlated with the variations in the gene copy numbers of the different microorganisms. All these compounds can be produced and emitted by a large variety of bacterial and fungal species (Effmert et al., 2012), although other biogenic and anthropogenic emission sources should not be discarded (Spaulding et al., 2003).
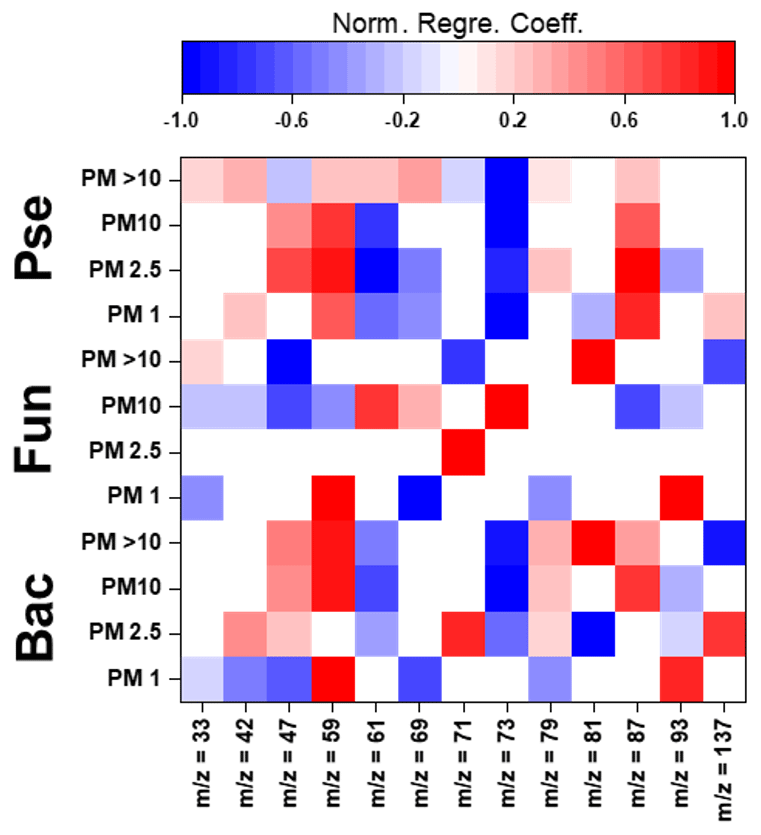
Figure 5Normalized regression coefficients obtained for the MLR models developed for the elucidation of potential connections between gas-phase VOCs and the microbiological composition of the biogenic aerosol particles. Maximum normalization was applied in all cases. Bac, bacteria; Pse, Pseudomonas; Fun, fungi.
Multiple correlations (Fig. S7) were found between bacteria–fungi and six VOCs present in the gas phase for 1.0–2.5 µm particles. As can be seen from Table S15, the use of a combination of variables in the MLR algorithm led to a clear improvement in the results obtained in comparison with those provided by Pearson correlation. Detailed evaluation of the regression coefficients for MLR (Fig. 5) showed a clear correlation between the concentrations of isoprene and benzene and the variations in the gene copy numbers of the different microorganisms. The correlations observed for benzene should be emphasized. It is widely believed that benzene is emitted only by anthropogenic sources. However, several bacterial and fungal species such as Bacillus simplex (Gu et al., 2007), Acremonium obclavatum, and Aspergillus versicolor (Ezeonu et al., 1994) can also produce benzene and emit it to the atmosphere. In addition, ethanol, acetic acid, and toluene correlated with variations in bacteria and fungi in our study.
It was not possible to find any correlation between the concentrations of the VOCs in the gas phase and the microbial groups detected in 2.5–10.0 µm particles. However, successful models were achieved using MLR, as can be observed in Table S15. Analysis of the regression coefficients (Fig. 5) indicated that the gas-phase concentrations of ethanol, acetone, 2-methyl-3-buten-2-ol, and acetic acid correlate with the variations in the gene copy numbers of bacteria and fungi. These results are in good agreement with those achieved for 1.0–2.5 µm particles. However, the opposite trend was observed in the case of Pseudomonas. A potential explanation for this might be high variability of Pseudomonas in the samples (Fröhlich-Nowoisky et al., 2016).
Finally, weak positive correlations (Fig. S7) were found between bacteria, fungi, and several VOCs such as acetone and isoprene for biogenic aerosol particles with diameters of over 10 µm. It should be emphasized, however, that the sign of the correlation with isoprene was opposite to that observed for < 1.0 and 1.0–2.5 µm particles. MLR algorithms provided better results than Pearson correlations (Table S15). Evaluation of the statistically significant regression coefficients (Fig. 5) revealed some interesting results. The concentrations of VOCs such as acetone, 2-methyl-3-buten-2-ol, benzene, and 2-butanone correlated with bacterial and fungal gene copy number variations. In addition, terpenes, including monoterpene fragments, correlated with variations in the gene copy numbers of bacteria and Pseudomonas. Monoterpenes are primarily emitted to the atmosphere by terrestrial vegetation (Acosta Navarro et al., 2014). However, some species of bacteria, including Pseudomonas, can synthesize and emit these compounds to the air (Effmert et al., 2012). Therefore, it is not possible to ignore the common emissions of terpenes and airborne bacteria under certain environmental and meteorological conditions. In addition, it is not possible to ignore the contribution of airborne bacteria to the total monoterpene concentration in the air considering the very specific environmental and meteorological conditions present during the experiments.
Chemical compounds and microbial species in biogenic aerosol particles collected at the SMEAR II station in September–November 2017 were determined. These unique observations, along with abundant chemical, meteorological, and environmental information, were used as input data for the development of different statistical models, including classical techniques and ML approaches, that allowed the elucidation of several aspects related to the composition of biogenic aerosols.
The use of different approaches based on ML, such as DA or Bayesian NN, confirmed that there was a clear relationship between the composition of the biogenic aerosol particles and the particle size. Different trends were observed for the distribution of chemical compounds and microbial species among the samples. These results were surprising considering the relatively low number of correlations observed using traditional Pearson correlation. It should also be emphasized that the limited number of samples analysed could have affected the performance of the Bayesian NN, decreasing its predictive capacity.
In addition, the ML approaches allowed the clarification of the effects of the concentrations of atmospheric gases and aerosol, meteorological, and environmental parameters on the biogenic aerosol particle composition. The different conditions observed during the two sampling periods established by CA were clearly connected to the variations observed for the chemical and microbial composition of the biogenic aerosol particles. High concentrations were observed for the chemical compounds and microbes (gene copy numbers) in the samples collected during period 1. The quality and quantity of the data used had a clear influence on model performance, especially for < 1.0 µm particles.
The elucidation of chemical fingerprints for the microbes in biogenic aerosols was possible due to the exceptional characteristics of the SMEAR II station, a rural measurement station with no large pollution sources nearby, which minimized the presence of interferences in the study. These markers may be related to the presence of particular chemical compounds in a microbial species or at least to a common emission source. The complexity of the system due to the great variety of microbial species present in the biogenic aerosol particles and potential emission sources hindered the clarification of common trends for all the particle sizes under study. Multiple connections between the microbial composition and chemical composition of the biogenic aerosol particles were observed for different sizes using classical and more advanced statistical approaches. These connections are mainly associated with metabolic processes, but in some cases they are also related to protection or interaction mechanisms.
Finally, the elucidation of potential connections between gas-phase VOCs and the microbiological composition of the biogenic aerosol particles confirmed that there was a clear relationship between the VOCs in the gas phase and the presence of chemicals and microbes in the biogenic aerosol particles. This might indicate the presence of common emission sources or at least emission conditions. The results achieved are promising, even if the number of samples used for model development was very limited. Additional studies are needed to develop more reliable statistical models that could provide the proxy concentration of aerosol particles in the boreal environment based on standard observations performed continuously at the site.
Data used in this work are available from the authors upon request (marja-liisa.riekkola@helsinki).
The supplement related to this article is available online at: https://doi.org/10.5194/acp-21-8775-2021-supplement.
JRJ, OMS, JH, JB, KH, TP, and MLR designed the experiments. JRJ, MO, OMS, GD, EZ, JA, and TL carried them out. JRJ and OMS performed the statistical analysis. JRJ, MO, OMS KH, JB, TP, and MLR prepared the manuscript, with contributions from other co-authors.
The authors declare that they have no conflict of interest.
The staff of the SMEAR II station are thanked for their valuable help.
This research has been supported by the Academy of Finland (grant nos. 307331, 307537, 324259, 333397, 334792, 329274, 328616, and 304460), the European Commission, Horizon 2020 (FORCeS (grant no. 821205) and ERA-PLANET (grant no. 689443)), and the University of Helsinki (Support for ACTRIS infrastructure and INAR RI Ecosystems grant).
Open-access funding was provided by the Helsinki University Library.
This paper was edited by Aurélien Dommergue and reviewed by Pierre Amato and one anonymous referee.
Acosta Navarro, J. C., Smolander, S., Struthers, H., Zorita, E., Ekman, A. M. L., Kaplan, J. O., Guenther, A., Arneth, A., and Riipinen, I.: Global emissions of terpenoid VOCs from terrestrial vegetation in the last millennium, J. Geophys. Res.-Atmos., 119, 6867–6885, https://doi.org/10.1002/2013JD021238, 2014.
Barbaro, E., Zangrando, R., Moret, I., Barbante, C., Cescon, P., and Gambaro, A.: Free amino acids in atmospheric particulate matter of Venice, Italy, Atmos. Environ., 45, 5050–5057, https://doi.org/10.1016/j.atmosenv.2011.01.068, 2011.
Bauer, H., Claeys, M., Vermeylen, R., Schueller, E., Weinke, G., Berger, A., and Puxbaum, H.: Arabitol and mannitol as tracers for the quantification of airborne fungal spores, Atmos. Environ., 42, 588–593, https://doi.org/10.1016/j.atmosenv.2007.10.013, 2008.
Boulette, M. L., Baynham, P. J., Jorth, P. A., Kukavica-Ibrulj, I., Longoria, A., Barrera, K., Levesque, R. C., and Whiteley, M.: Characterization of alanine catabolism in pseudomonas aeruginosa and its importance for proliferation in vivo, J. Bacteriol., 191, 6329, https://doi.org/10.1128/JB.00817-09, 2009.
Cantoni, O., Sestili, P., Guidarelli, A., Giacomoni, P. U., and Cattabeni, F.: Effects of L-histidine on hydrogen peroxide-induced DNA damage and cytotoxicity in cultured mammalian cells, Mol. Pharm., 41, 969–974, 1992.
Chan, M. N., Choi, M. Y., Ng, N. L., and Chan, C. K.: Hygroscopicity of water-soluble organic compounds in atmospheric aerosols: amino acids and biomass burning derived organic species, Environ. Sci. Technol., 39, 1555–1562, https://doi.org/10.1021/es049584l, 2005.
Crawford, C., Reponen, T., Lee, T., Iossifova, Y., Levin, L., Adhikari, A., and Grinshpun, S. A.: Temporal and spatial variation of indoor and outdoor airborne fungal spores, pollen, and (1> 3)-β-d-glucan, Aerobiologia, 25, 147–158, https://doi.org/10.1007/s10453-009-9120-z, 2009.
Després, V., Huffman, J. A., Burrows, S. M., Hoose, C., Safatov, A., Buryak, G., Fröhlich-Nowoisky, J., Elbert, W., Andreae, M., Pöschl, U., and Jaenicke, R.: Primary biological aerosol particles in the atmosphere: a review, Tellus B, 64, 15598, https://doi.org/10.3402/tellusb.v64i0.15598, 2012.
Dittmar, T., Fitznar, H. P., and Kattner, G.: Origin and biogeochemical cycling of organic nitrogen in the eastern Arctic Ocean as evident from D- and L-amino acids, Geochim. Cosmochim. Ac., 65, 4103–4114, https://doi.org/10.1016/S0016-7037(01)00688-3, 2001.
Effmert, U., Kalderás, J., Warnke, R., and Piechulla, B.: Volatile Mediated Interactions Between Bacteria and Fungi in the Soil, J. Chem. Ecol., 38, 665–703, https://doi.org/10.1007/s10886-012-0135-5, 2012.
Elbein, A. D., Pan, Y. T., Pastuszak, I., and Carroll, D.: New insights on trehalose: a multifunctional molecule, Glycobiology, 13, 17R–27R, https://doi.org/10.1093/glycob/cwg047, 2003.
Elbert, W., Taylor, P. E., Andreae, M. O., and Pöschl, U.: Contribution of fungi to primary biogenic aerosols in the atmosphere: wet and dry discharged spores, carbohydrates, and inorganic ions, Atmos. Chem. Phys., 7, 4569–4588, https://doi.org/10.5194/acp-7-4569-2007, 2007.
Ezeonu, I. M., Price, D. L., Simmons, R. B., Crow, S. A., and Ahearn, D. G.: Fungal production of volatiles during growth on fiberglass, Appl. Environ. Microbiol., 60, 4172–4173, https://doi.org/10.1128/AEM.60.11.4172-4173.1994, 1994.
Fang, Z., Guo, W., Zhang, J., and Lou, X.: Influence of heat events on the composition of airborne bacterial communities in urban ecosystems, Int. J. Environ. Res. Pu., 15, 2295, https://doi.org/10.3390/ijerph15102295, 2018.
Fierer, N., Jackson, J. A., Vilgalys, R., and Jackson, R. B.: Assessment of soil microbial community structure by use of taxon-specific quantitative PCR assays, Appl. Environ. Microbiol., 71, 4117, https://doi.org/10.1128/AEM.71.7.4117-4120.2005, 2005.
Fröhlich-Nowoisky, J., Kampf, C. J., Weber, B., Huffman, J. A., Pöhlker, C., Andreae, M. O., Lang-Yona, N., Burrows, S. M., Gunthe, S. S., Elbert, W., Su, H., Hoor, P., Thines, E., Hoffmann, T., Després, V. R., and Pöschl, U.: Bioaerosols in the earth system: climate, health, and ecosystem interactions, Atmos. Res., 182, 346–376, https://doi.org/10.1016/j.atmosres.2016.07.018, 2016.
Ge, X., Wexler, A. S., and Clegg, S. L.: Atmospheric amines – Part I. A review, Atmos. Environ., 45, 524–546, https://doi.org/10.1016/j.atmosenv.2010.10.012, 2011.
Goldstein, G. and Nobel, P. S.: Changes in osmotic pressure and mucilage during low-temperature acclimation of Opuntia ficus-indica, Plant Physiol., 97, 954, https://doi.org/10.1104/pp.97.3.954, 1991.
Goldstein, G. and Nobel, P. S.: Water relations and low-temperature acclimation for cactus species varying in freezing tolerance, Plant Physiol., 104, 675, https://doi.org/10.1104/pp.104.2.675, 1994.
Gosselin, M. I., Rathnayake, C. M., Crawford, I., Pöhlker, C., Fröhlich-Nowoisky, J., Schmer, B., Després, V. R., Engling, G., Gallagher, M., Stone, E., Pöschl, U., and Huffman, J. A.: Fluorescent bioaerosol particle, molecular tracer, and fungal spore concentrations during dry and rainy periods in a semi-arid forest, Atmos. Chem. Phys., 16, 15165–15184, https://doi.org/10.5194/acp-16-15165-2016, 2016.
Gu, Y.-Q., Mo, M.-H., Zhou, J.-P., Zou, C.-S., and Zhang, K.-Q.: Evaluation and identification of potential organic nematicidal volatiles from soil bacteria, Soil Biol. Biochem., 39, 2567–2575, https://doi.org/10.1016/j.soilbio.2007.05.011, 2007.
Haan, D. O. D., Corrigan, A. L., Smith, K. W., Stroik, D. R., Turley, J. J., Lee, F. E., Tolbert, M. A., Jimenez, J. L., Cordova, K. E., and Ferrell, G. R.: Secondary organic aerosol-forming reactions of glyoxal with amino acids, Environ. Sci. Technol., 43, 2818–2824, https://doi.org/10.1021/es803534f, 2009.
Hari, P. and Kulmala, M.: Station for measuring Ecosystem-Atmosphere relations (SMEAR II), Boreal Environ. Res., 10, 315–322, 2005.
Hari, P., Nikinmaa, E., Pohja, T., Siivola, E., Bäck, J., Vesala, T., and Kulmala, M.: Station for Measuring Ecosystem-Atmosphere Relations: SMEAR, in: Physical and Physiological Forest Ecology, edited by: Hari, P., Heliövaara, K., and Kulmala, L., Springer Netherlands, Dordrecht, 471–487, 2013.
Helin, A., Sietiö, O.-M., Heinonsalo, J., Bäck, J., Riekkola, M.-L., and Parshintsev, J.: Characterization of free amino acids, bacteria and fungi in size-segregated atmospheric aerosols in boreal forest: seasonal patterns, abundances and size distributions, Atmos. Chem. Phys., 17, 13089–13101, https://doi.org/10.5194/acp-17-13089-2017, 2017.
Huffman, J. A., Treutlein, B., and Pöschl, U.: Fluorescent biological aerosol particle concentrations and size distributions measured with an Ultraviolet Aerodynamic Particle Sizer (UV-APS) in Central Europe, Atmos. Chem. Phys., 10, 3215–3233, https://doi.org/10.5194/acp-10-3215-2010, 2010.
Huffman, J. A., Prenni, A. J., DeMott, P. J., Pöhlker, C., Mason, R. H., Robinson, N. H., Fröhlich-Nowoisky, J., Tobo, Y., Després, V. R., Garcia, E., Gochis, D. J., Harris, E., Müller-Germann, I., Ruzene, C., Schmer, B., Sinha, B., Day, D. A., Andreae, M. O., Jimenez, J. L., Gallagher, M., Kreidenweis, S. M., Bertram, A. K., and Pöschl, U.: High concentrations of biological aerosol particles and ice nuclei during and after rain, Atmos. Chem. Phys., 13, 6151–6164, https://doi.org/10.5194/acp-13-6151-2013, 2013.
Hyun, M. W., Yun, Y. H., Kim, J. Y., and Kim, S. H.: Fungal and plant phenylalanine ammonia-lyase, Mycobiology, 39, 257–265, https://doi.org/10.5941/MYCO.2011.39.4.257, 2011.
Innocente, E., Squizzato, S., Visin, F., Facca, C., Rampazzo, G., Bertolini, V., Gandolfi, I., Franzetti, A., Ambrosini, R., and Bestetti, G.: Influence of seasonality, air mass origin and particulate matter chemical composition on airborne bacterial community structure in the Po Valley, Italy, Sci. Total Environ.t, 593-594, 677–687, https://doi.org/10.1016/j.scitotenv.2017.03.199, 2017.
Jastrzębowska, K. and Gabriel, I.: Inhibitors of amino acids biosynthesis as antifungal agents, Amino Acids, 47, 227–249, https://doi.org/10.1007/s00726-014-1873-1, 2015.
Jia, Y. and Fraser, M.: Characterization of saccharides in size-fractionated ambient particulate matter and aerosol sources: The contribution of primary biological aerosol particles (PBAPs) and soil to ambient particulate matter, Environ. Sci. Technol., 45, 930–936, https://doi.org/10.1021/es103104e, 2011.
Junninen, H., Lauri, A., Keronen, P., Aalto, P., Hiltunen, V., Hari, P., and Kulmala, M.: Smart-SMEAR: On-line data exploration and visualization tool for SMEAR stations, Boreal Environ. Res., 14, 447–457, 2009.
Kinoshita, S., Udaka, S., and Shimono, M.: Studies on the amino acid fermentation – Part I. Production of L-glutamic acid by various microorganisms, J. Gen. Appl. Microbiol., 50, 331–343, 2005.
Krog, J. O., Zachariassen, K. E., Larsen, B., and Smidsrød, O.: Thermal buffering in Afro-alpine plants due to nucleating agent-induced water freezing, Nature, 282, 300–301, https://doi.org/10.1038/282300a0, 1979.
Kuuskeri, J., Häkkinen, M., Laine, P., Smolander, O.-P., Tamene, F., Miettinen, S., Nousiainen, P., Kemell, M., Auvinen, P., and Lundell, T.: Time-scale dynamics of proteome and transcriptome of the white-rot fungus Phlebia radiata: growth on spruce wood and decay effect on lignocellulose, Biotechnol. Biofuels, 9, 192, https://doi.org/10.1186/s13068-016-0608-9, 2016.
Li, Q.: Progress in Microbial Degradation of Feather Waste, Front. Microbiol., 10, 2717, https://doi.org/10.3389/fmicb.2019.02717, 2019.
Lighthart, B.: The ecology of bacteria in the alfresco atmosphere, FEMS Microbiol. Ecol., 23, 263–274, https://doi.org/10.1111/j.1574-6941.1997.tb00408.x, 1997.
Lundgren, B. R., Thornton, W., Dornan, M. H., Villegas-Peñaranda, L. R., Boddy, C. N., and Nomura, C. T.: Gene PA2449 is essential for glycine metabolism and pyocyanin biosynthesis in Pseudomonas aeruginosa PAO1, J. Bacteriol., 195, 2087, https://doi.org/10.1128/JB.02205-12, 2013.
Manninen, H., Bäck, J., Sihto-Nissilä, S.-L., Huffman, J., Pessi, A.-M., Hiltunen, V., Aalto, P., Hidalgo, P., Hari, P., Saarto, A., Kulmala, M., and Petäjä, T.: Patterns in airborne pollen and other primary biological aerosol particles (PBAP), and their contribution to aerosol mass and number in a boreal forest, Boreal Environ. Res., 19, 383–405, 2014.
Mashayekhy Rad, F., Zurita, J., Gilles, P., Rutgeerts, L. A. J., Nilsson, U., Ilag, L. L., and Leck, C.: Measurements of Atmospheric Proteinaceous Aerosol in the Arctic Using a Selective UHPLC/ESI-MS/MS Strategy, J. Am. Soc. Mass Spectrom., 30, 161–173, https://doi.org/10.1007/s13361-018-2009-8, 2019.
Meyer-Wentrup, F., Cambi, A., Figdor, C. G., and Adema, G. J.: Detection of Fungi by Mannose-based Recognition Receptors, in: Immunology of Fungal Infections, edited by: Brown, G. D., and Netea, M. G., Springer Netherlands, Dordrecht, 293–307, 2007.
Morris, C. E., Sands, D. C., Bardin, M., Jaenicke, R., Vogel, B., Leyronas, C., Ariya, P. A., and Psenner, R.: Microbiology and atmospheric processes: research challenges concerning the impact of airborne micro-organisms on the atmosphere and climate, Biogeosciences, 8, 17–25, https://doi.org/10.5194/bg-8-17-2011, 2011.
Nicolson, S. W. and Human, H.: Chemical composition of the “low quality” pollen of sunflower (Helianthus annuus, Asteraceae), Apidologie, 44, 144–152, https://doi.org/10.1007/s13592-012-0166-5, 2013.
Pasanen, A. L., Yli-Pietila, K., Pasanen, P., Kalliokoski, P., and Tarhanen, J.: Ergosterol content in various fungal species and biocontaminated building materials, Applied Environ. Microbiol., 65, 138–142, https://doi.org/10.1128/AEM.65.1.138-142.1999, 1999.
Phillips, V. T. J., Andronache, C., Christner, B., Morris, C. E., Sands, D. C., Bansemer, A., Lauer, A., McNaughton, C., and Seman, C.: Potential impacts from biological aerosols on ensembles of continental clouds simulated numerically, Biogeosciences, 6, 987–1014, https://doi.org/10.5194/bg-6-987-2009, 2009.
Pica, N. and Bouvier, N. M.: Environmental factors affecting the transmission of respiratory viruses, Curr. Opin. Virol., 2, 90–95, https://doi.org/10.1016/j.coviro.2011.12.003, 2012.
Purohit, H. J., Raje, D. V., and Kapley, A.: Identification of signature and primers specific to genus Pseudomonas using mismatched patterns of 16S rDNA sequences, BMC Bioinformatics, 4, 19, https://doi.org/10.1186/1471-2105-4-19, 2003.
Pöschl, U.: Atmospheric Aerosols: Composition, Transformation, Climate and Health Effects, Angew. Chem. Int. Edit., 44, 7520–7540, https://doi.org/10.1002/anie.200501122, 2005.
Pöschl, U., Martin, S., Sinha, B., Chen, Q., Gunthe, S., Huffman, J., Borrmann, S., Farmer, D., Garland, R., Helas, G., Jimenez, J., King, S., Manzi, A., Mikhailov, E., Pauliquevis, T., Petters, M., Prenni, A., Roldin, P., Rose, D., and Andreae, M.: Rainforest Aerosols as Biogenic Nuclei of Clouds and Precipitation in the Amazon, Science, 329, 1513–1516, https://doi.org/10.1126/science.1191056, 2010.
Rathnayake, C. M., Metwali, N., Jayarathne, T., Kettler, J., Huang, Y., Thorne, P. S., O'Shaughnessy, P. T., and Stone, E. A.: Influence of rain on the abundance of bioaerosols in fine and coarse particles, Atmos. Chem. Phys., 17, 2459–2475, https://doi.org/10.5194/acp-17-2459-2017, 2017.
Reinmuth-Selzle, K., Kampf, C. J., Lucas, K., Lang-Yona, N., Fröhlich-Nowoisky, J., Shiraiwa, M., Lakey, P. S. J., Lai, S., Liu, F., Kunert, A. T., Ziegler, K., Shen, F., Sgarbanti, R., Weber, B., Bellinghausen, I., Saloga, J., Weller, M. G., Duschl, A., Schuppan, D., and Pöschl, U.: Air Pollution and Climate Change Effects on Allergies in the Anthropocene: Abundance, Interaction, and Modification of Allergens and Adjuvants, Environ. Sci. Technol., 51, 4119–4141, https://doi.org/10.1021/acs.est.6b04908, 2017.
R Team: R: A language and environment for statistical computing. R Foundation for Statistical Computing, Vienna, Austria, 2019.
Samaké, A., Jaffrezo, J.-L., Favez, O., Weber, S., Jacob, V., Albinet, A., Riffault, V., Perdrix, E., Waked, A., Golly, B., Salameh, D., Chevrier, F., Oliveira, D. M., Bonnaire, N., Besombes, J.-L., Martins, J. M. F., Conil, S., Guillaud, G., Mesbah, B., Rocq, B., Robic, P.-Y., Hulin, A., Le Meur, S., Descheemaecker, M., Chretien, E., Marchand, N., and Uzu, G.: Polyols and glucose particulate species as tracers of primary biogenic organic aerosols at 28 French sites, Atmos. Chem. Phys., 19, 3357–3374, https://doi.org/10.5194/acp-19-3357-2019, 2019a.
Samaké, A., Jaffrezo, J.-L., Favez, O., Weber, S., Jacob, V., Canete, T., Albinet, A., Charron, A., Riffault, V., Perdrix, E., Waked, A., Golly, B., Salameh, D., Chevrier, F., Oliveira, D. M., Besombes, J.-L., Martins, J. M. F., Bonnaire, N., Conil, S., Guillaud, G., Mesbah, B., Rocq, B., Robic, P.-Y., Hulin, A., Le Meur, S., Descheemaecker, M., Chretien, E., Marchand, N., and Uzu, G.: Arabitol, mannitol, and glucose as tracers of primary biogenic organic aerosol: the influence of environmental factors on ambient air concentrations and spatial distribution over France, Atmos. Chem. Phys., 19, 11013–11030, https://doi.org/10.5194/acp-19-11013-2019, 2019b.
Šantl-Temkiv, T., Sikoparija, B., Maki, T., Carotenuto, F., Amato, P., Yao, M., Morris, C. E., Schnell, R., Jaenicke, R., Pöhlker, C., DeMott, P. J., Hill, T. C. J., and Huffman, J. A.: Bioaerosol field measurements: Challenges and perspectives in outdoor studies, Aerosol Sci. Technol., 54, 520–546, https://doi.org/10.1080/02786826.2019.1676395, 2020.
Scalabrin, E., Zangrando, R., Barbaro, E., Kehrwald, N. M., Gabrieli, J., Barbante, C., and Gambaro, A.: Amino acids in Arctic aerosols, Atmos. Chem. Phys., 12, 10453–10463, https://doi.org/10.5194/acp-12-10453-2012, 2012.
Sharon, N., Eshdat, Y., Silverblatt, F. J., and Ofek, I.: Bacterial adherence to cell surface sugars, Ciba Found. Symp., 80, 119–141, https://doi.org/10.1002/9780470720639.ch9, 1981.
Shrivastava, A. and Gupta, V. B.: Methods for the determination of limit of detection and limit of quantitation of the analytical methods, Chron. Young Sci., 2, 15–21, 2011.
Spaulding, R. S., Schade, G. W., Goldstein, A. H., and Charles, M. J.: Characterization of secondary atmospheric photooxidation products: Evidence for biogenic and anthropogenic sources, J. Geophys. Res., 108, 4247, https://doi.org/10.1029/2002JD002478, 2003.
Spracklen, D. V. and Heald, C. L.: The contribution of fungal spores and bacteria to regional and global aerosol number and ice nucleation immersion freezing rates, Atmos. Chem. Phys., 14, 9051–9059, https://doi.org/10.5194/acp-14-9051-2014, 2014.
Staton, S. J. R., Woodward, A., Castillo, J. A., Swing, K., and Hayes, M. A.: Ground level environmental protein concentrations in various ecuadorian environments: Potential uses of aerosolized protein for ecological research, Ecol. Indic., 48, 389–395, https://doi.org/10.1016/j.ecolind.2014.08.036, 2015.
Upadhyay, R., Meena, M., Prasad, V., Zehra, A., and Gupta, V.: Mannitol metabolism during pathogenic fungal–host interactions under stressed conditions, Front. Microbiol., 6, 1019, https://doi.org/10.3389/fmicb.2015.01019, 2015.
Vainio, E. J. and Hantula, J.: Direct analysis of wood-inhabiting fungi using denaturing gradient gel electrophoresis of amplified ribosomal DNA, Mycol. Res., 104, 927–936, https://doi.org/10.1017/S0953756200002471, 2000.
van Heeswijk, W. C., Westerhoff, H. V., and Boogerd, F. C.: Nitrogen assimilation in Escherichia coli: putting molecular data into a systems perspective, Microbiol. Mol. Biol. R., 77, 628, https://doi.org/10.1128/MMBR.00025-13, 2013.
Vargas, W. A., Mandawe, J. C., and Kenerley, C. M.: Plant-derived sucrose is a key element in the symbiotic association between Trichoderma virens and maize Plants, Plant Physiol., 151, 792, https://doi.org/10.1104/pp.109.141291, 2009.
Wan, E. C. H. and Yu, J. Z.: Analysis of sugars and sugar polyols in atmospheric aerosols by chloride attachment in liquid chromatography/negative ion electrospray mass spectrometry, Environ. Sci. Technol., 41, 2459–2466, https://doi.org/10.1021/es062390g, 2007.
Yan, C., Sullivan, A. P., Cheng, Y., Zheng, M., Zhang, Y., Zhu, T., and Collett, J. L.: Characterization of saccharides and associated usage in determining biogenic and biomass burning aerosols in atmospheric fine particulate matter in the North China Plain, Sci. Total Environ., 650, 2939–2950, https://doi.org/10.1016/j.scitotenv.2018.09.325, 2019.
Yang, W., Elankumaran, S., and Marr, L.: Concentrations and size distributions of airborne influenza A viruses measured indoors at a health centre, a day-care centre and on aeroplanes, J. Roy. Soc. Interface, 8, 1176–1184, https://doi.org/10.1098/rsif.2010.0686, 2011.
Yang, Y., Chan, C.-y., Tao, J., Lin, M., Engling, G., Zhang, Z., Zhang, T., and Su, L.: Observation of elevated fungal tracers due to biomass burning in the Sichuan Basin at Chengdu City, China, Sci. Total Environ., 431, 68–77, https://doi.org/10.1016/j.scitotenv.2012.05.033, 2012.
Zhang, Q. and Anastasio, C.: Chemistry of fog waters in California's Central Valley – Part 3: concentrations and speciation of organic and inorganic nitrogen, Atmos. Environ., 35, 5629–5643, https://doi.org/10.1016/S1352-2310(01)00337-5, 2001.
Zhu, C., Kawamura, K., and Kunwar, B.: Organic tracers of primary biological aerosol particles at subtropical Okinawa Island in the western North Pacific Rim, J. Geophys. Res. Atmos., 120, 5504–5523, https://doi.org/10.1002/2015jd023611, 2015.