the Creative Commons Attribution 4.0 License.
the Creative Commons Attribution 4.0 License.
 | 10 Jun 2021
Impact of international shipping emissions on ozone and PM2.5 in East Asia during summer: the important role of HONO and ClNO2
Jianing Dai
Ocean-going ships emit large amounts of air pollutants such as nitrogen oxide (NOx) and particulate matter. NOx emitted from ships can be converted to nitrous acid (HONO) and nitryl chloride (ClNO2), which produce hydroxyl (OH) and chlorine (Cl) radicals and recycle NOx, thereby affecting the oxidative capacity and production of secondary pollutants. However, these effects have not been quantified in previous investigations of the impacts of ship emissions. In this study, a regional transport model (WRF-Chem) revised to incorporate the latest HONO and ClNO2 processes was used to investigate their effects on the concentrations of ROx (RO2 + HO2 + OH) radicals, ozone (O3), and fine particulate matter (PM2.5) in Asia during summer. The results show that the ship-derived HONO and ClNO2 increased the concentration of ROx radicals by approximately 2–3 times in the marine boundary layer. The enhanced radicals then increased the O3 and PM2.5 concentrations in marine areas, with the ship contributions increasing from 9 % to 21 % and from 7 % to 10 % respectively. The largest ROx enhancement was simulated over the remote ocean with the ship contribution increasing from 29 % to 50 %, which led to increases in ship-contributed O3 and PM2.5 from 21 % to 38 % and from 13 % to 19 % respectively. In coastal cities, the enhanced levels of radicals also increased the maximum O3 and averaged PM2.5 concentrations from 5 % to 11 % and from 4 %–8 % to 4 %–12 % respectively. These findings indicate that modelling studies that do not consider HONO and ClNO2 can significantly underestimate the impact of ship emissions on radicals and secondary pollutants. Therefore, it is important that these nitrogen compounds be included in future models of the impact of ship emissions on air quality.
- Article
(5667 KB) - Full-text XML
-
Supplement
(3252 KB) - BibTeX
- EndNote


Exhaust emissions from ocean-going ships affect the chemical composition of the marine atmosphere and have a significant impact on the climate, air quality, and human health (Eyring et al., 2010; Liu et al., 2016; Corbett et al., 2007; Andersson et al., 2009). The key air pollutants emitted by vessels include gases such as sulfur dioxide (SO2) and nitrogen oxides (NOx = NO + NO2) and particulate matter (PM) (Eyring et al., 2005; Moldanová et al., 2009). Emissions of NOx and other ozone (O3) precursors, volatile organic compounds (VOCs) and carbon monoxide (CO), from shipping contribute to the tropospheric O3 burden and hydroxyl radicals (OH), thereby influencing global radiative forcing and oxidative power (Lawrence and Crutzen, 1999). Ship-generated aerosols also affect the radiative budget by scattering and absorbing solar and thermal radiation directly and by altering cloud properties (Eyring et al., 2010; Fuglestvedt et al., 2009; Lawrence and Crutzen, 1999; Liu et al., 2016; Devasthale et al., 2006). Ship emissions in ports and near the coast also influence the air quality of coastal cities (Y. Zhang et al., 2017; Liu et al., 2018) and threaten public health (Liu et al., 2016; Campling et al., 2013). As international seaborne trade continues to increase, ship emissions are expected to continuously grow at a rate of 3.5 % over the 2019–2024 period (UNCTAD, 2020), and their impact on the environment is a growing concern.
The effects of ship emissions on the formation of O3 and PM2.5 have been extensively evaluated in numerical studies. On the open ocean, ship-generated NOx reacts with VOCs emitted from ships and from the background atmosphere and enhances O3 formation (Corbett and Fischbeck, 1997; Lawrence and Crutzen, 1999; Aksoyoglu et al., 2016; Huszar et al., 2010; Hoor et al., 2009). In coastal areas, the O3 levels can also be increased by NOx emitted from ships in ports and harbours and through the dispersion of ship-formed O3 on the open ocean (Wang et al., 2019; Aksoyoglu et al., 2016; Song et al., 2010). On the other hand, ship-generated NOx can reduce ozone formation via a titration effect in heavy-traffic ports and within the ship tracks (Wang et al., 2019; Aksoyoglu et al., 2016). Ship emissions have also been shown to increase PM2.5 concentrations via direct emissions and via the production of secondary aerosols through the reaction of gaseous precursors (Aksoyoglu et al., 2016; Liu et al., 2018; Lv et al., 2018). Although the formation of O3 and secondary aerosols is affected by their precursors, it can also be influenced by the levels of radicals, which are key to the oxidation of precursors. Limited attention has been paid to the production of ship-related radicals in evaluating the effects of ship emissions on secondary pollutants.
Recent studies have demonstrated the potentially important roles of two radical precursors and nitrogen reservoirs – nitrous acid (HONO) and nitryl chloride (ClNO2) – in atmospheric oxidation chemistry (Fu et al., 2019; Li et al., 2016; Sarwar et al., 2014; Simon et al., 2009; L. Zhang et al., 2017). HONO is emitted directly in combustion and soil (Kleffmann et al., 2005) or is produced by heterogeneous reactions of NO2 on various surfaces (Finlayson-Pitts et al., 2003; Ndour et al., 2008; Monge et al., 2010) and by photolysis of nitrate aerosol (Ye et al., 2017, 2016). ClNO2 is formed from reactions of N2O5, which is produced when NO2 reacts with O3, on chloride-containing aerosol at night (Bertram and Thornton, 2009). Photolysis of HONO and ClNO2 by sunlight produces OH or Cl radicals and recycles NO2, thereby affecting the oxidation capacity and production of secondary pollutants (Osthoff et al., 2008; Wang et al., 2016). Ships can directly emit HONO (Sun et al., 2020), and the NOx that they emit can subsequently produce HONO and ClNO2 via heterogeneous reactions on sea-salt and ship-emitted particles. Although the production and effects of HONO and ClNO2 from land-based emissions have been demonstrated over land areas (L. Zhang et al., 2017), few studies have examined the effects of the two reactive nitrogen species from international shipping. Field studies have observed elevated mixing ratios of HONO (0.2 ppb) at a marine site of the Bohai rim in northern China (Wen et al., 2019) and of HONO (126 ppt) and ClNO2 (1.97 ppb) at a coastal site in southern China (Tham et al., 2014; Zha et al., 2014). These observations suggest the significant contribution of ship emissions to the oxidative capacity of the marine and coastal atmosphere in East Asia.
In this study, we used a revised regional chemical transport model to simulate the spatial distributions of HONO and ClNO2 produced by ocean-going ships and their effects on the formation of O3 and PM2.5 in East Asia, which is home to 8 of the world's top 10 container ports and the world's most trafficked oceans. We selected the summer (July) of 2018 as the study period. During this time, large-scale oceanic winds prevailed in Asia and solar radiation and air temperature reached the highest level for the year. Thus, international shipping is expected to have the most distinctive and perhaps the greatest impact on atmospheric chemistry during this time of year in East Asia.
The remainder of the paper is structured as follows: in Sect. 2, we detail the model setting, emissions, numerical experiments, observational data, and model validation. In Sect. 3, we exhibit the model performance for HONO and ClNO2 and compare the results with available measurements in marine areas; we then show the formation of ship-related HONO and ClNO2 and their subsequent effects on radicals, O3, and PM2.5 in oceanic areas and coastal cities. Finally, our conclusions are given in Sect. 4.
2.1 Model setting
In this study, the WRF-Chem model (version 3.6.1; Grell et al., 2005) with updated gases-phase and heterogeneous-phase mechanisms of new reactive nitrogen species (L. Zhang et al., 2017) was used to simulate the transport, mixing, and chemical transformation of trace gases and aerosols. Briefly, the updated module was based on the default Carbon Bond Mechanism-Z (CBMZ) module (Zaveri and Peters, 1999), in which the O3 production came from the traditional photochemical mechanisms with only two gas-phase sources of HONO (OH + NO → HONO and HO2 + NO2 → HONO) and no chlorine chemistry. In the updated module, CBMZ-Reactive NitrOgen Mechnism (CBMZ-ReNOM), the HONO sources included the additional gas-phase reactions between NOx and HOx (OH + HO2); the heterogeneous reaction of NO2 on the particle, urban, leaf (Kurtenbach et al., 2001), and sea surfaces (Zha et al., 2014); and direct emission from vehicles (Kurtenbach et al., 2001; Gutzwiller et al., 2002; Sun et al., 2020). For this study, an additional HONO source from the photolysis of particulate nitrate (PNO3 → 0.67 HONO + 0.33 NO2) was included into our model. The photolysis rate constant of PNO3 () was calculated following the approach used in Fu et al. (2019): = () × , where is the photolysis rate constant of gaseous HNO3 calculated online in the WRF-Chem model. For ClNO2 production, the parameterization from Bertram and Thornton (2009) was used to represent the N2O5 uptake coefficient and ClNO2 production yield. This parameterization reproduced the order of magnitude and variation in the observed N2O5 and ClNO2 levels in a background site in Hong Kong (Dai et al., 2020). The other six chlorine species, with relevant photolysis reactions and subsequent reactions between released Cl radical and VOCs, were also added to the default module (L. Zhang et al., 2017). The details of other chemical and physical schemes for the simulation can be found in L. Zhang et al. (2017).
The model simulations were performed from 28 June to 31 July 2018. The first 72 h of the simulations was considered spin-up time. The initial meteorological conditions were provided by reanalysis data from the Final (FNL) Operational Global Analysis dataset provided by the National Centers for Environmental Prediction (NCEP; http://rda.ucar.edu/datasets/ds083.2/, last access: 1 November 2020). The model had 31 vertical layers with a fixed top of 100 hPa. The domain covered a large part of Asia with a horizontal resolution of 36 km × 36 km (Fig. 1a). The surface layer was 30 m above the ground, and the lowest 11 layers were approximately within the height of the planetary boundary layer at noon.
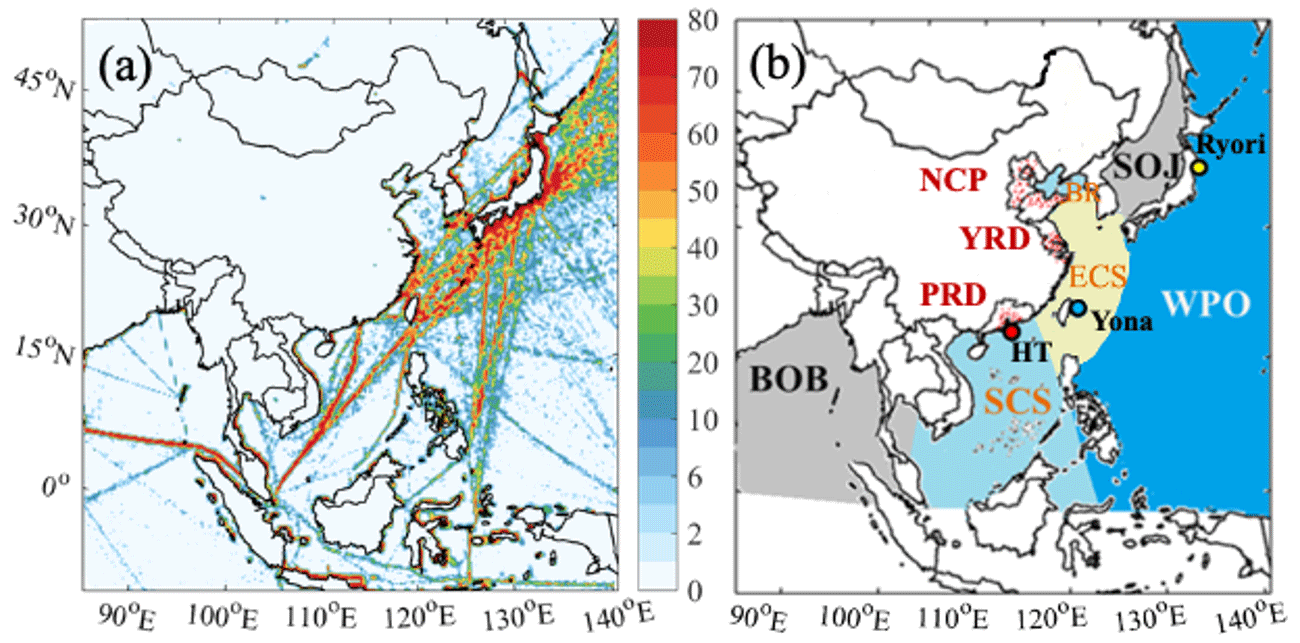
Figure 1(a) NOx emission fluxes from ships (in g m−2 month−1) in July 2017. (b) Model domains with six water zones (South China Sea, SCS; East China Sea, ECS; Bohai rim, BR; Sea of Japan, SOJ; Bay of Bengal, BOB; and western Pacific Ocean, WPO), three coastal city clusters (Pearl River Delta, PRD; Yangtze River Delta, YRD; and North China Plain, NCP), and three maritime observational sites (Hok Tsui, HT; Yonagunijima, Yona; and Ryori). Red dots in PRD, YRD, and NCP represent selected coastal sites. The ranges of latitude and longitude in each body of water are listed in Table S1 in the Supplement.
2.2 Emissions
Five sets of emission inventories (EIs) were used for anthropogenic emissions in our study. For mainland China, the Multi-resolution Emission Inventory for China (MEIC; http://www.meicmodel.org/, last access: 1 November 2020) in 2016 was used. For the rest of Asia, we applied the MIX dataset (http://www.meicmodel.org/dataset-mix, last access: 1 November 2020) for 2010 (Li et al., 2017). For international shipping, the emission database in the Community Emission Data System (CEDS) (McDuffie et al., 2020) for 2017 was used. The HONO emissions from land transportation sources were calculated using their NOx emissions and the ratio of 0.8 % for gasoline and 2.3 % for diesel. These commonly used ratios in model studies (Zhang et al., 2016; Fu et al., 2019) are based on the previous measurements of vehicle exhausts (Kurtenbach et al., 2001; Gutzwiller et al., 2002) and are generally consistent with more recent emission result (Liu et al., 2019; Trinh et al., 2017). For ship-emitted HONO, we set the emission ratio of as 0.51 % based on the reported ratio in fresh ship plumes in Chinese waters (Sun et al., 2020). For anthropogenic chloride emissions, the high-resolution (0.1∘ × 0.1∘) EIs of HCl and fine particulate Cl− for 2014 were applied for mainland China (Fu et al., 2018). These EIs included four sectors and have been shown to offer a reasonable model simulation of particulate chloride by the WRF-Chem model (Dai et al., 2020). The Reactive Chlorine Emission Inventory (RCEI; Keene et al., 1999) was used for anthropogenic chloride emissions in the other regions. For natural emissions, the biogenic emissions were calculated by the Model of Emission of Gas and Aerosols from Nature (MEGAN) version 2.1 (Guenther et al., 2006).
The spatial distribution of ship NOx emissions is shown in Fig. 1a. The main ship routes with high emission intensity are clearly identified in the ship emission inventory. One major shipping lane is located in the southern Bay of Bengal (BOB) in the Indian Ocean, passes through the Strait of Malacca, and extends to the South China Sea (SCS) and other Asian countries. Distinct shipping lanes are also shown along the coast of the East China Sea (ECS) and the Sea of Japan (SOJ). Over the western Pacific Ocean (WPO), congested ship routes are distributed among Japan and other countries (Southeast Asian countries, Australia, and North America). Based on the distribution of ship NOx emissions, six water zones were selected, including three waters around China (SCS; ECS; Bohai Rim, BR), two waters in other regions (SOJ and BOB), and one open ocean (WPO; Fig. 1b). In addition, three densely populated city clusters were chosen (the North China Plain, NCP; the Yangtze River Delta, YRD; and the Pearl River Delta, PRD).
2.3 Experimental setting
Eight simulations were conducted with different emissions and chemistry, as listed in Table 1. In the Def and Def_noship cases, the WRF-Chem model was conducted with default chemistry (i.e. the default CBMZ mechanism with only the two HONO sources and no chlorine chemistry). The differences between Def and Def_noship (i.e. Def − Def_noship) represent the effects of ship emissions with the default nitrogen chemistry. In the Cl and Cl_noship cases, an updated chlorine chemistry in the revised WRF-Chem model was used. The differences between the two cases (i.e. Cl − Cl_noship) represent the effects of ship emissions with the default and additional chlorine chemistry. Similarly, in the HONO and HONO_noship cases, the additional HONO chemistry was used, and the difference between the two cases (i.e. HONO − HONO_noship) represents the default impact of ship emissions with additional HONO chemistry. In the BASE and BASE_noship cases, the integrated HONO and chlorine chemistry are considered. The differences between BASE and BASE_noship represent the shipping impact with the integrated effects of HONO and chlorine species. The results from the BASE experiment will be used to validate the model performance.
Table 1Experimental setting.

a Anthropogenic emissions except for ship emissions. b Ship emissions except for directly emitted HONO. c HONO chemistry. d Chlorine chemistry.
2.4 Observational data and model validation
Meteorological data from surface stations from the NOAA National Climatic Data Center (NCDC; Fig. S1a in the Supplement) comprising wind direction, wind speed, surface temperature, and specific humidity were used to validate model performance for the meteorological parameters. Conventional air pollutant data (NO2, PM2.5, and O3) from surface stations (obtained from China's Ministry of Ecology and Environment; Fig. S1b) were used to evaluate the simulated air pollutants over mainland China. Table S2 summarizes the statistical performance of our model results. For meteorological parameters, high R values (>0.85) and low mean bias (MB) values indicate good performance for the meteorological field. For regular air pollutants, the model overpredicted PM2.5 (MB = 10.6 µg m−3) and slightly underpredicted NO2 (MB = 3.3 ppbv) and O3 (MB = 5.5 ppbv). These biases in simulation can be partially explained by uncertainties in the model input, such as the land-use data (Dai et al., 2019) and emission inventory (Li et al., 2017).
The O3 data from two remote sites, Ryori and Yonagunijima (Yona) in Japan (https://www.data.jma.go.jp/ghg/kanshi/ghgp/o3_e.html, last access: 1 November 2020) and one coastal background site in Hong Kong, Hok Tsui (HT), were used to compare the model performance over the maritime areas. These three sites are located along the coasts of the SCS, ECS, and WPO regions (Fig. 1b). As shown in Fig. S2, with the default chemistry, the model underpredicted the O3 mixing ratio at the coastal and marine sites, with an underestimation of 2.8, 4.8, and 2.3 ppbv at the HT, Ryori, and Yona sites respectively (Table S3). With the addition of the HONO and ClNO2 chemistry, the simulated O3 levels at the marine sites were improved, with an MB of −2.8 to −1.5 ppbv at the HT site, −3.0 to −2.3 ppbv at the Ryori site, and −2.3 to −0.7 ppbv at the Yona site.
3.1 Simulated HONO and ClNO2 and contributions from ship emissions
Figure 2a shows the horizontal distribution of the average HONO at the surface layer in the BASE case. The predicted HONO was widespread over the oceans, with mixing ratios ranging from 0.005 to 0.300 ppbv and distinct higher concentrations along the main shipping lanes. The distribution of HONO was consistent with that of NO2 (Fig. S3) due to the heterogeneous conversion of NO2 to form HONO and direct HONO emission from ships. In the vertical direction, the simulated HONO was concentrated at the surface and reached up to 400–600 m in the coastal and marine areas (see Fig. S4). Figure 3 shows the vertical profile of HONO from ship emissions in the nine selected regions. Consistent with the overall HONO vertical distribution, ship-contributed HONO also peaked at the surface in the oceanic areas, with average HONO levels of 3–120 pptv in the marine boundary layer (MBL). The greatest contribution of ship emissions was simulated in the WPO (96 %), followed by the SOJ (80 %), the BOB (49 %), the three Chinese waters (14 %–16 %), and the coastal cities (3 %–12 %). The varying ship contributions in these regions can be explained by the relative strength of the emissions from ships and from the adjacent land areas.
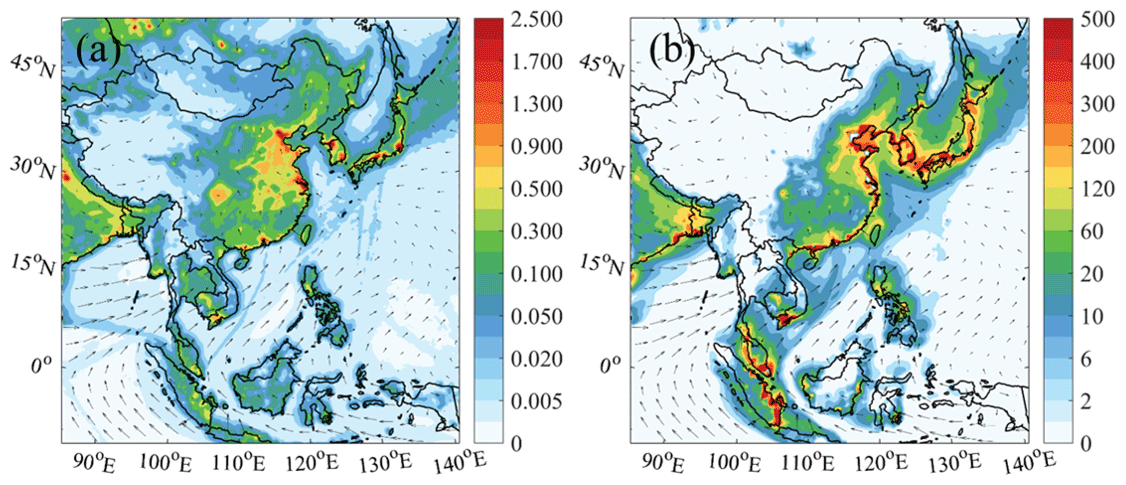
Figure 2Spatial distributions of the simulation of averaged (a) HONO (in ppbv, whole day) and (b) night-time ClNO2 (in pptv, 18:00–06:00 LST, local standard time) at the surface layer (∼ 30 m) in July 2018 from the BASE case. The arrows present simulated wind vectors from the BASE case.
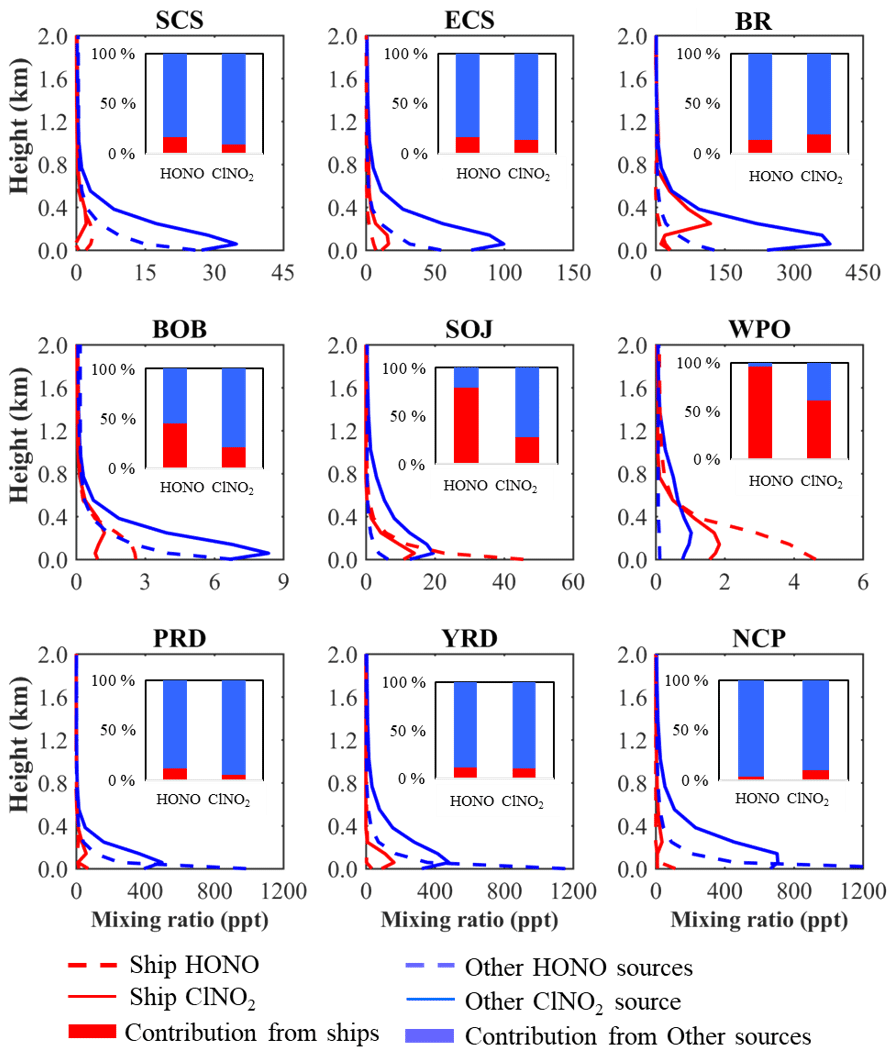
Figure 3Vertical profiles of simulated HONO and night-time ClNO2 (in ppt) from ship emissions and other sources in the nine regions. Also shown are the contributions of ship emissions and other sources to averaged HONO and night-time ClNO2 levels in the marine boundary layer (within 600 m).
High values of ClNO2 were simulated along the coasts and peaked in the lower MBL (Fig. 2b), with mixing ratios ranging from 2 to 400 pptv in oceanic areas and the highest value in the BR region. This distribution was in line with that of its precursors, N2O5 (Fig. S5) and particulate chloride (Fig. S6). Vertically, the peak value of ClNO2 was simulated in the residual layer (100–300 m; Fig. 3), with mixing ratios of 8–350 pptv in oceanic areas. Similar to HONO, the greatest ship contribution to ClNO2 was also simulated in the WPO (61 %), followed by other oceanic areas (9 %–24 %) and coastal cities (5 %–11 %).
We compared the modelled HONO and ClNO2 with field observations made at some coastal and marine sites (see Table S4). The simulated HONO mixing ratios were 0.1–0.3 ppbv and 0.01–0.1 ppbv over the respective coastal BR and SCS sites and were comparable to the measurements at the marine sites of the BR (0.2 ppbv) (Wen et al., 2019) and SCS (89 pptv) (Table S4). For the coastal areas of other Asian countries, the simulated HONO compared well with the measurements in South Korea (0.60 ppbv) (Kim et al., 2015) and Japan (0.63 ppbv) (Takeuchi et al., 2013). HONO was simulated at approximately 5 pptv in the open ocean and 10–25 pptv along the main shipping lanes (Fig. 2a), which are values comparable to the measured HONO (3–35 pptv) in the open ocean in Europe and North America (Meusel et al., 2016; Kasibhatla et al., 2018; Ye et al., 2016). For ClNO2, the order of magnitude and variation in the measured N2O5 and ClNO2 levels at the HT site were reasonably reproduced by our model for early autumn of 2018 (Dai et al., 2020). The model performance of HONO and ClNO2 in the land areas of mainland China for the summer of 2014 was also evaluated by L. Zhang et al. (2017). Overall, our model ability with respect to simulating HONO and ClNO2 is acceptable, and the model results are sufficiently reliable for further analysis.
3.2 Impact of ship-derived HONO and chlorine on ROx, O3, and PM2.5
In this section, we evaluate the ship effects on the main atmospheric radicals (ROx, OH + HO2 + RO2), O3, and PM2.5 with the default chemistry (described in Sect. 2.3) and with the additional HONO and chlorine chemistry.
3.2.1 ROx
Figure 4 shows the simulated differences in the average daytime ROx mixing ratios at the surface from the cases with and without ship emissions using different chemistry. The ROx mixing ratio was noticeably increased by ship emissions over oceanic areas, and this enhancement was magnified by the additional nitrogen chemistry. With the default chemistry (Fig. 4a), the average ship contribution to ROx was about 18 % over the whole oceanic area. The addition of the HONO and chlorine chemistry increased the ship contributions to 28 % (Fig. 4b) and 22 % (Fig. 4c) respectively. Photolysis of ship-generated HONO and ClNO2 released radicals (OH and Cl; Fig. S7) and recycled NOx, which then oxidized VOCs and gave rise to high levels of ROx. With the combined HONO and chlorine chemistry, the ship contribution was further increased to 38 % (Fig. 4d). This combined ship contribution was smaller than the sum of that from the separate HONO and chlorine chemistry (22 % + 28 % = 50 %), which can be explained by the nonlinear interactions of the chemical system. Figure 5 shows the vertical profile of the ROx mixing ratio from ship emissions in the nine regions. The enhanced ROx reached an altitude of greater than 2 km over the oceanic regions, indicating the significant impact of ship-derived HONO and ClNO2 on the oxidative capacity in the marine troposphere.
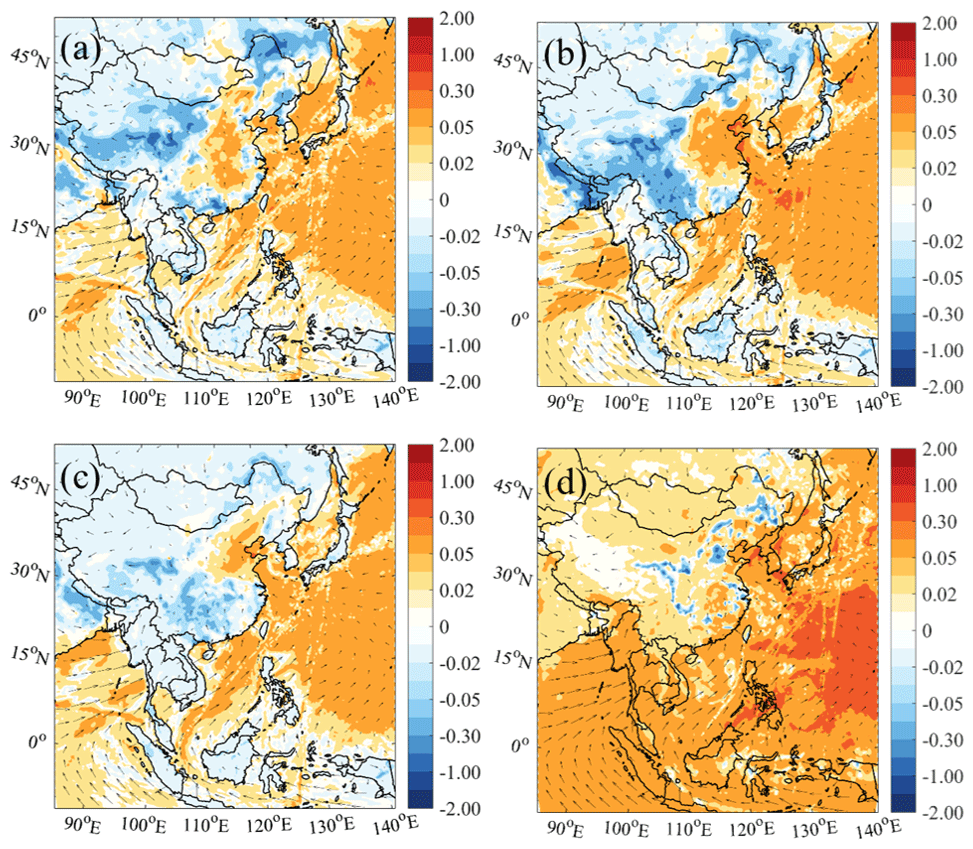
Figure 4Averaged daytime ROx changes due to ship emissions (06:00–18:00 LST; in pptv) with (a) default chemistry (Def − Def_noship), (b) default and additional HONO chemistry (HONO − HONO_noship), (c) default and additional chlorine chemistry (Cl − Cl_noship), and (d) default and combined HONO and chlorine chemistry (BASE − BASE_noship). The arrows present simulated wind vectors from the BASE case.
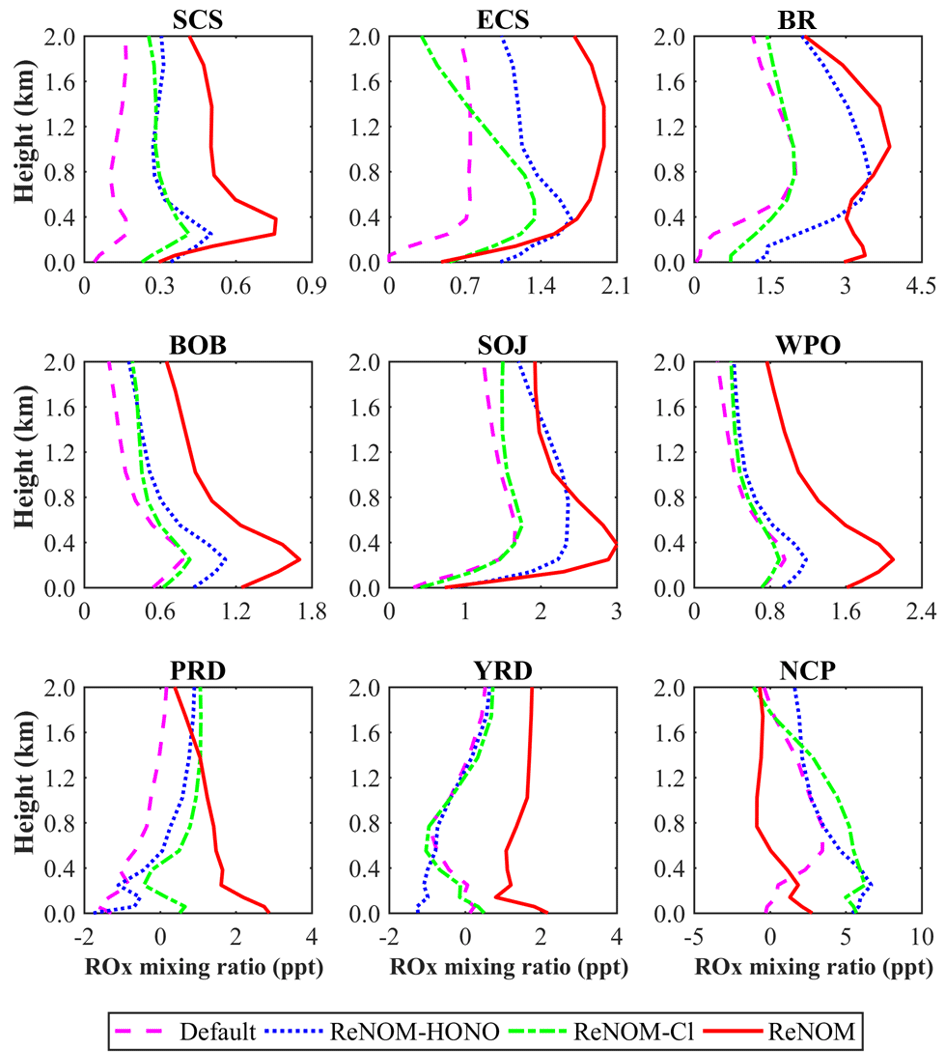
Figure 5Vertical profiles of daytime ROx changes due to ship emissions (in pptv) from different chemistry in the nine regions.
The largest increase in the ship contribution to ROx was predicted in the WPO region (from 29 % to 50 %; Fig. 9a), followed by other oceanic areas (from 3 %–12 % to 6 %–17 %) and coastal cities (from −2 %–3 % to 4 %–6 %). The maximum ship contribution in the WPO region was consistent with the greatest ship contribution to HONO and ClNO2 in this region (Fig. 4d). In the SCS and BOB regions, the enhanced ROx was more dispersed with the combined nitrogen chemistry than that with the default and separate nitrogen chemistry. In the coastal cities, the ROx mixing ratio was also affected by ship emissions via the transport of ship-generated HONO and ClNO2 by summertime winds.
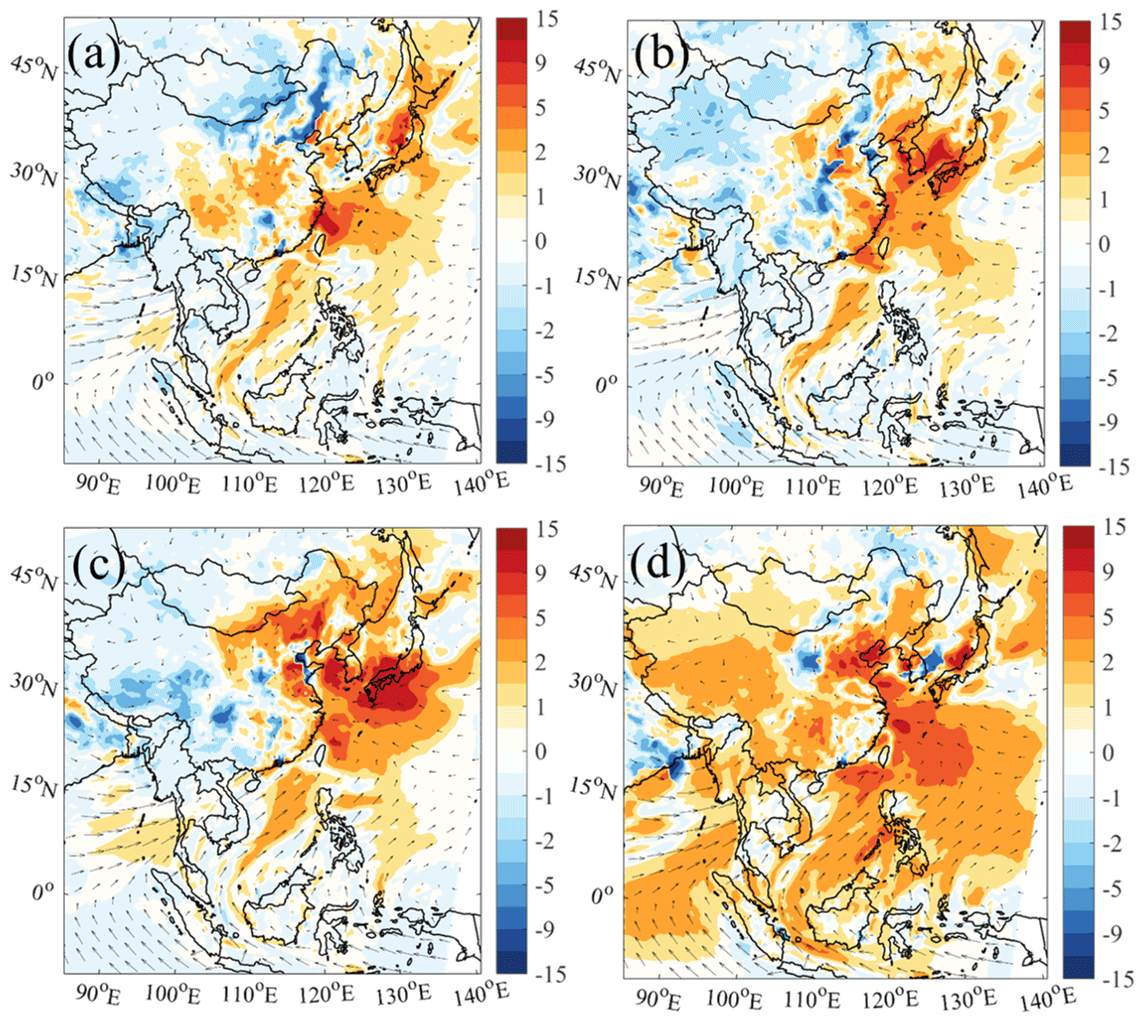
Figure 6The 24 h averaged ozone changes (06:00–18:00 LST; in ppbv) due to ship emissions with (a) default chemistry (Def − Def_noship), (b) default and additional HONO chemistry (HONO − HONO_noship), (c) default and additional chlorine chemistry (Cl − Cl_noship), and (d) default and combined HONO and chlorine chemistry (BASE − BASE_noship). The arrows present simulated wind vectors from the BASE case.
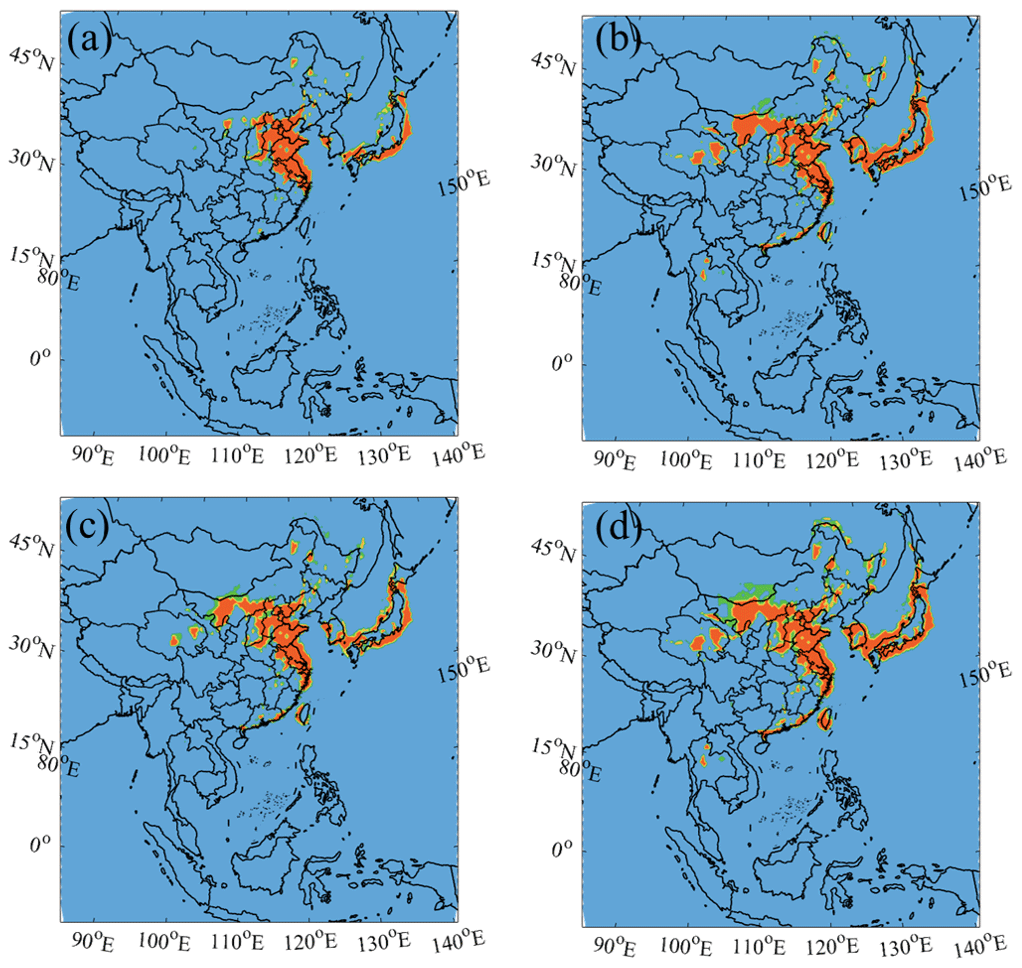
Figure 7The O3 sensitivity regimes using the (a) Def, (b) HONO, (c) Cl, and (d) the BASE cases. The classification of the ozone sensitivity regime is based on production rates of H2O2 to HNO3, and values of <0.06, 0.06–0.2, and >0.2 correspond to VOC-limited, transition, and NOx-limited conditions respectively (Zhang et al., 2009).
3.2.2 O3
Figure 6 shows the simulated differences in the average O3 at the surface from the cases with and without ship emissions. Consistent with the impact of ship emissions on oceanic ROx, the oceanic O3 was also noticeably increased (by 9 %) by ship emissions, which was further enhanced by the addition of HONO (12 %) and ClNO2 (14 %) and combined nitrogen chemistry (21 %). The simulated distribution of ship-enhanced O3 with the default chemistry was along the main shipping routes with high NOx emissions (Fig. 6a). O3 formation was highly sensitive to NOx from ship emissions due to the relatively low concentrations of NOx in the marine areas. The larger ship contribution with ClNO2 chemistry than with HONO chemistry may be partially explained by a higher production ozone efficiency by NO2 than by NO (from photolysis of HONO) and by the faster reaction rate of Cl radicals than OH radicals with long-lived alkanes.
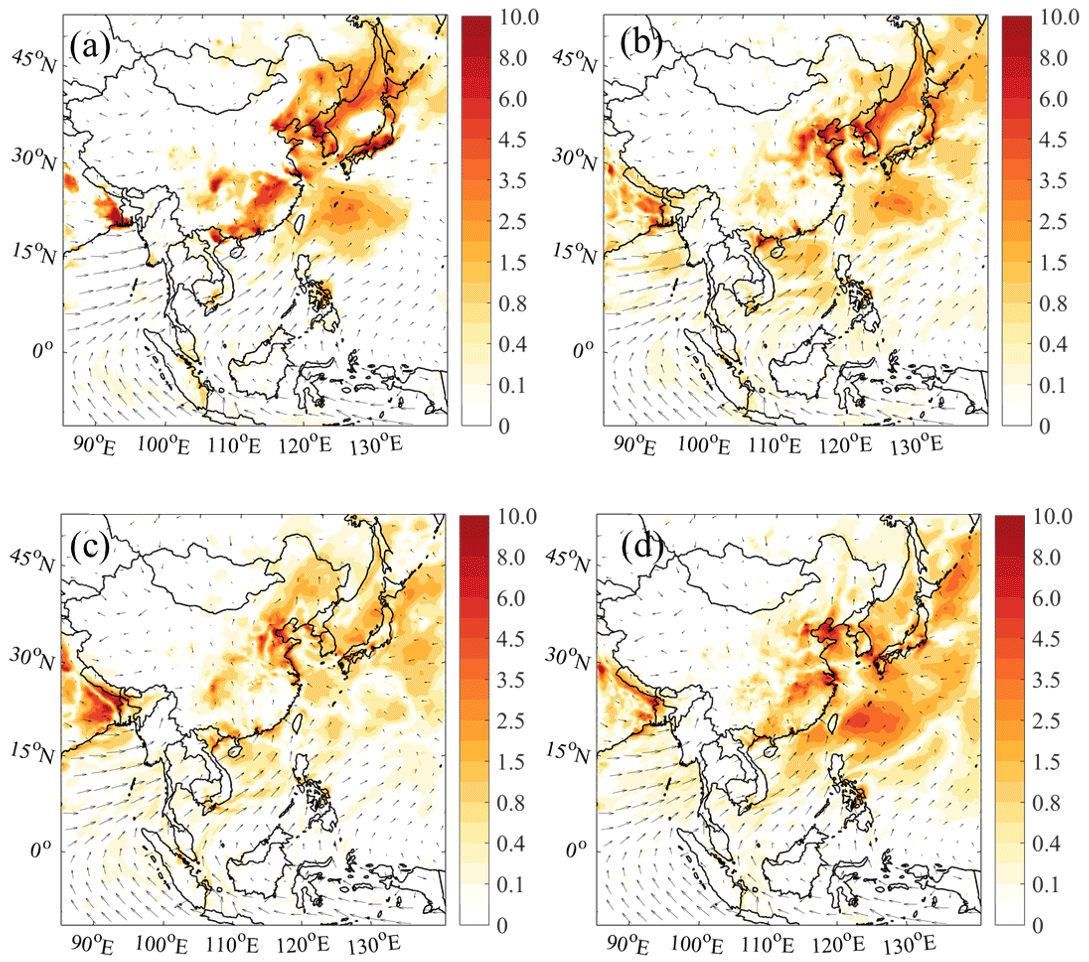
Figure 8Averaged PM2.5 enhancements due to ship emissions (in µg m−3) with (a) default chemistry (Def − Def_noship), (b) default and additional HONO chemistry (HONO − HONO_noship), (c) default and additional chlorine chemistry (Cl − Cl_noship), and (d) default and combined HONO and chlorine chemistry (BASE − BASE_noship). The arrows present simulated wind vectors from the BASE case.
With the combined impact from HONO and ClNO2, widespread ozone increases were simulated over the SCS, BOB, and WPO regions (Fig. 6d). The combined nitrogen chemistry also increased the ozone concentrations in the coastal areas; in contrast, these concentrations were decreased by HONO or ClNO2 separately. As shown in Fig. 6b and c, distinct ozone enhancement was simulated over the marine area of South Korea and Japan by HONO or ClNO2. However, this enhancement was weakened and even cancelled by their combined effects. We calculated an indicator of the ozone formation regimes based on the ratio of the production rate of H2O2 to that of HNO3 () (Fu et al., 2020). Figure 7, with the combined HONO and ClNO2 chemistry, shows that the NOx-sensitive regime in East Asia was changed to a VOC-sensitive regime, which was probably due to the increase level of NO or NO2 from photolysis of HONO.
Figure S8 shows the vertical profile of ship-generated O3 enhancement in the nine regions. Similar to ship-enhanced ROx, ship-related O3 enhancement stretched from the surface to the lower troposphere (>2 km) over the marine regions. Because the emissions from ships occur at the sea surface, the vertically enhanced O3 formation was caused by strong convection (Dalsøren et al., 2009).
The ship contribution to O3 formation was also simulated in the WPO region (from 21 % to 38 %; Fig. 9b). Moreover, in other oceanic areas, the contributions of ship emissions were increased from 3 %–18 % to 12 %–24 %, with two distinct O3 enhancements over the BR (∼ 10 ppbv; Fig. 6d) and ECS (15 ppbv) regions. In the three coastal city clusters, the reduced O3 formation was simulated by ship emissions with the default chemistry (from −5 to −1 ppb). Because these coastal cities are in the VOC-limited regime (Fig. 7a), the NOx from ships would lead to a decrease in chemical O3 production. With the combined HONO and ClNO2 effects, the ship-induced O3 increased to −1 to −5 ppb due to the enhanced radicals and the transport of O3 in the marine areas by ship-generated HONO and ClNO2. The maximum O3 increase in coastal cities also doubled from 3 ppb (5 %) to 7 ppb (11 %), aggravating the negative effects of ship emissions on human health in these regions.
In addition to the above coastal and oceanic areas, ship emissions also exert considerable impact on surface O3 in distant inland areas such as the Sichuan Basin, and, interestingly, there are some “hot spots” of ozone (as well as ROx, Fig. 4a–d, and PM2.5, Fig. 8a–d) increase or decrease in the inland areas due to ship emissions (Fig. 6a–d). These hot spots may be a result of the inhomogeneous impact of ship emissions due to complicated dynamic and chemical processes that affect the fate and distribution of ship-emitted pollutants in the inland areas. In particular, the mountainous terrain in southern China may have large influence on the transport of ship emissions to inland areas.
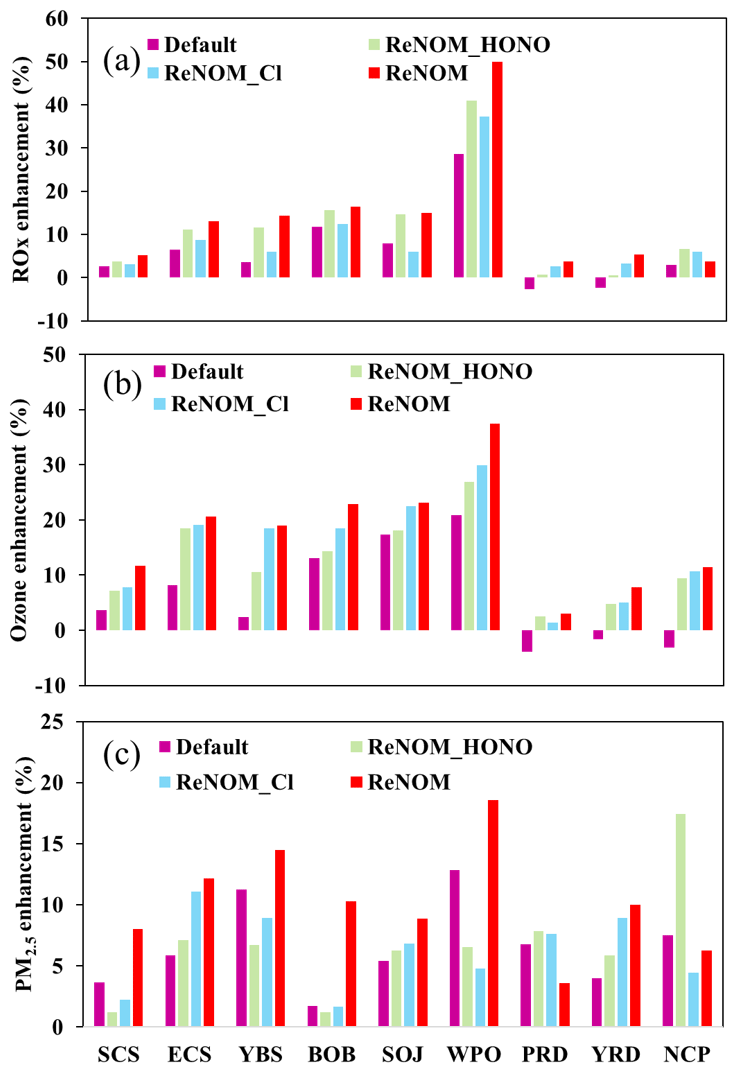
Figure 9Contributions of ship emissions with different chemistry (Default, ReNOM_HONO, ReNOM_Cl, and ReNOM) to average mixing ratios of (a) daytime ROx, (b) ozone, and (c) PM2.5.
3.2.3 PM2.5
Ship-derived HONO and ClNO2 also influence the production of aerosols via changes in radicals and NOx. Figure 8 shows the simulated differences in the average PM2.5 at the surface for cases with and without ship emissions. The PM2.5 concentration was considerably enhanced by ship emissions, and the additional nitrogen chemistry further increased the simulated PM2.5 concentration. With the default chemistry, the average ship contribution to the PM2.5 concentration was about 7 % in oceanic areas (Fig. 8a), and it was increased to 10 % with the addition of HONO and ClNO2 chemistry (Fig. 8d). The greatest contribution from shipping to the PM2.5 concentration was also simulated over the WPO region, as with ozone, with the contribution ranging from 13 % with the default chemistry to 19 % with the improved chemistry (Fig. 9c). In other oceanic areas, the ship contributions were also increased from 2 %–12 % to 6 %–15 %. We calculated the effects of ship-generated HONO and ClNO2 on the formation of secondary particles. The additional ship HONO and chlorine chemistry increased the ship contribution to particulate nitrate from 13 % to 41 % in oceanic areas (Figs. S9 and S11) and its contribution to particulate sulfate from 11 % to 34 % (Figs. S10 and S11). In the coastal cities, the default contribution by ships was about 4 %–8 %, which was also increased to 4 %–12 % with the improved chemistry (Fig. 9c). The considerable increase in ship-contributed PM2.5 and ozone due to HONO and ClNO2 demonstrates the need to consider these compounds in evaluations of the impact of shipping on air quality.
Previous studies have evaluated the impact of ship emissions on the formation of O3 and PM2.5. Aksoyoglu et al. (2016) simulated the average ship contribution to oceanic O3 as 10 %–20 % in the Mediterranean area, and Huszar et al. (2010) showed a ship contribution of 10 % over the eastern Atlantic. The maximum O3 enhancement by ship emissions was 15 ppb in the coastal waters of South Korea (Song et al., 2010) and 30–50 µg m−3 off the coast of the YRD region (Wang et al., 2019). For PM2.5, the average ship contributions were about 20 %–25 % in European waters (Aksoyoglu et al., 2016) and 2.2 %–18.8 % off the coast of China (Lv et al., 2018).
Compared with previous studies, our study simulated a higher contribution to average ozone formation and a smaller contribution to average PM2.5. We note that the underprediction of NO2 in our simulation may lead to an underestimation of HONO, and the overpredicted PM2.5 can result in an overestimation of N2O5 uptake, conversion of NO2 to HONO, and production of ClNO2. The exact effects of these uncertainties on the ozone and PM2.5 is difficult to quantify. It is also difficult to discern the differences in our and previous modelling studies due to the differences in the methodologies adopted, including ship emission inventory, model resolution, chemical mechanisms (in addition to different treatment of HONO and ClNO2 chemistry), and period of study. However, all of these studies demonstrate an important impact of ship emissions on atmospheric chemistry and air quality. The key finding of our study is the role of HONO and ClNO2 in driving the oxidation processes, which has not been fully considered in most previous model studies of the impact of shipping on pollutant levels.
This study evaluated the production of HONO and ClNO2 from international shipping and their impact on the oxidative capacity, ozone level, and level of fine PM in the maritime and coastal areas of eastern Asia. The results show that photolysis of the two compounds releases OH and Cl radicals, recycles NOx, and changes conventional hydroxyl and organic peroxy radicals (ROx = OH + HO2 + RO2) by 0.8 %–21.4 % (0.8 %–7.7 % over coasts and 2.6 %–21.4 % over oceans), O3 by 5.9 %–16.6 % (6.9 %–14.6 % over coasts and 5.9 %–16.6 % over oceans), and PM2.5 by −1.2 %–8.6 % (−1.2 % to 6 % over coasts and 3.2 %–8.6 % over oceans) at the surface of the western Pacific regions. Their impact extends to the marine boundary layer. The largest contributions of HONO and ClNO2 occur in the relatively remote oceans. Because ocean-going ships are a major source of NOx, which is the key chemical precursor to HONO and ClNO2, it is important to consider the sources and chemistry of these nitrogen compounds in evaluations of the impact of ship emissions.
The codes and data used in this study are available upon request from Tao Wang (cetwang@polyu.edu.hk).
The supplement related to this article is available online at: https://doi.org/10.5194/acp-21-8747-2021-supplement.
TW initiated the research, and JD and TW designed the paper framework. JD ran the model, processed the data, and made the plots. JD and TW analysed the results and wrote the paper.
The authors declare that they have no conflict of interest.
We would like to thank Qiang Zhang from Tsinghua University for providing the emission inventory and Xiao Fu from The Hong Kong Polytechnic University for providing the code of HONO sources and anthropogenic chloride emission inventory.
This research has been supported by the Research Grants Council – University Grants Committee (grant no. T24-504/17-N) and the National Natural Science Foundation of China (grant no. 91844301).
This paper was edited by Sally E. Pusede and reviewed by two anonymous referees.
Aksoyoglu, S., Baltensperger, U., and Prévôt, A. S. H.: Contribution of ship emissions to the concentration and deposition of air pollutants in Europe, Atmos. Chem. Phys., 16, 1895–1906, https://doi.org/10.5194/acp-16-1895-2016, 2016.
Andersson, C., Bergström, R., and Johansson, C.: Population exposure and mortality due to regional background PM in Europe – Long-term simulations of source region and shipping contributions, Atmos. Environ., 43, 3614–3620, https://doi.org/10.1016/j.atmosenv.2009.03.040, 2009.
Bertram, T. H. and Thornton, J. A.: Toward a general parameterization of N2O5 reactivity on aqueous particles: the competing effects of particle liquid water, nitrate and chloride, Atmos. Chem. Phys., 9, 8351–8363, https://doi.org/10.5194/acp-9-8351-2009, 2009.
Campling, P., Janssen, L., Vanherle, K., Cofala, J., Heyes, C., and Sander, R.: Specific evaluation of emissions from shipping including assessment for the establishment of possible new emission control areas in European Seas, Flemish Institute for Technological Research (VITO), Mol, Belgium, 2013.
Corbett, J. J. and Fischbeck, P.: Emissions from ships, Science, 278, 823–824, https://doi.org/10.1126/science.278.5339.823, 1997.
Corbett, J. J., Winebrake, J. J., Green, E. H., Kasibhatla, P., Eyring, V., and Lauer, A.: Mortality from ship emissions: a global assessment, Environ. Sci. Technol., 41, 8512–8518, https://doi.org/10.1021/es071686z, 2007.
Dai, J. N., Wang, X. M., Dai, W., and Chang, M.: The impact of inhomogeneous urban canopy parameters on meteorological conditions and implication for air quality in the Pearl River Delta region, Urban Climate, 29, 100494, https://doi.org/10.1016/j.uclim.2019.100494, 2019.
Dai, J. N., Liu, Y. M., Wang, P., Fu, X., Xia, M., and Wang, T.: The impact of sea-salt chloride on ozone through heterogeneous reaction with N2O5 in a coastal region of south China, Atmos. Environ., 236, 117604, https://doi.org/10.1016/j.atmosenv.2020.117604, 2020.
Dalsøren, S. B., Eide, M. S., Endresen, Ø., Mjelde, A., Gravir, G., and Isaksen, I. S. A.: Update on emissions and environmental impacts from the international fleet of ships: the contribution from major ship types and ports, Atmos. Chem. Phys., 9, 2171–2194, https://doi.org/10.5194/acp-9-2171-2009, 2009.
Devasthale, A., Krüger, O., and Graßl, H.: Impact of ship emissions on cloud properties over coastal areas, Geophys. Res. Lett., 33, 2, https://doi.org/10.1029/2005GL024470, 2006.
Eyring, V., Köhler, H., Van Aardenne, J., and Lauer, A.: Emissions from international shipping: 1. The last 50 years, J. Geophys. Res.-Atmos., 110, D17, https://doi.org/10.1029/2004JD005619, 2005.
Eyring, V., Isaksen, I. S., Berntsen, T., Collins, W. J., Corbett, J. J., Endresen, O., Grainger, R. G., Moldanova, J., Schlager, H., and Stevenson, D. S.: Transport impacts on atmosphere and climate: Shipping, Atmos. Environ., 44, 4735–4771, https://doi.org/10.1016/j.atmosenv.2009.04.059, 2010.
Finlayson-Pitts, B., Wingen, L., Sumner, A., Syomin, D., and Ramazan, K.: The heterogeneous hydrolysis of NO2 in laboratory systems and in outdoor and indoor atmospheres: An integrated mechanism, Phys. Chem. Chem. Phys., 5, 223–242, https://doi.org/10.1039/B208564J, 2003.
Fu, X., Wang, T., Wang, S. X., Zhang, L., Cai, S., Xing, J., and Hao, J. M.: Anthropogenic emissions of hydrogen chloride and fine particulate chloride in China, Environ. Sci. Technol., 52, 1644–1654, https://doi.org/10.1021/acs.est.7b05030, 2018.
Fu, X., Wang, T., Zhang, L., Li, Q., Wang, Z., Xia, M., Yun, H., Wang, W., Yu, C., Yue, D., Zhou, Y., Zheng, J., and Han, R.: The significant contribution of HONO to secondary pollutants during a severe winter pollution event in southern China, Atmos. Chem. Phys., 19, 1–14, https://doi.org/10.5194/acp-19-1-2019, 2019.
Fu, X., Wang, T., Gao, J., Wang, P., Liu, Y., Wang, S. X., Zhao, B., and Xue, L.: Persistent Heavy Winter Nitrate Pollution Driven by Increased Photochemical Oxidants in Northern China, Environ. Sci. Technol., 54, 3881–3889, https://doi.org/10.1021/acs.est.9b07248, 2020.
Fuglestvedt, J., Berntsen, T., Eyring, V., Isaksen, I., Lee, D. S., and Sausen, R.: Shipping Emissions: From Cooling to Warming of Climate and Reducing Impacts on Health, Environ. Sci. Technol., 43, 9057–9062, https://doi.org/10.1021/es901944r, 2009.
Grell, G. A., Peckham, S. E., Schmitz, R., Mckeen, S. A., Frost, G., Skamarock, W. C., and Eder, B.: Fully coupled “online” chemistry within the WRF model, Atmos. Environ., 39, 6957–6975, https://doi.org/10.1016/j.atmosenv.2005.04.027, 2005.
Guenther, A., Karl, T., Harley, P., Wiedinmyer, C., Palmer, P. I., and Geron, C.: Estimates of global terrestrial isoprene emissions using MEGAN (Model of Emissions of Gases and Aerosols from Nature), Atmos. Chem. Phys., 6, 3181–3210, https://doi.org/10.5194/acp-6-3181-2006, 2006.
Gutzwiller, L., Arens, F., Baltensperger, U., Gäggeler, H. W., and Ammann, M.: Significance of semivolatile diesel exhaust organics for secondary HONO formation, Environ. Sci. Technol., 36, 677–682, https://doi.org/10.1021/es015673b, 2002.
Hoor, P., Borken-Kleefeld, J., Caro, D., Dessens, O., Endresen, O., Gauss, M., Grewe, V., Hauglustaine, D., Isaksen, I. S. A., Jöckel, P., Lelieveld, J., Myhre, G., Meijer, E., Olivie, D., Prather, M., Schnadt Poberaj, C., Shine, K. P., Staehelin, J., Tang, Q., van Aardenne, J., van Velthoven, P., and Sausen, R.: The impact of traffic emissions on atmospheric ozone and OH: results from QUANTIFY, Atmos. Chem. Phys., 9, 3113–3136, https://doi.org/10.5194/acp-9-3113-2009, 2009.
Huszar, P., Cariolle, D., Paoli, R., Halenka, T., Belda, M., Schlager, H., Miksovsky, J., and Pisoft, P.: Modeling the regional impact of ship emissions on NOx and ozone levels over the Eastern Atlantic and Western Europe using ship plume parameterization, Atmos. Chem. Phys., 10, 6645–6660, https://doi.org/10.5194/acp-10-6645-2010, 2010.
Kasibhatla, P., Sherwen, T., Evans, M. J., Carpenter, L. J., Reed, C., Alexander, B., Chen, Q., Sulprizio, M. P., Lee, J. D., Read, K. A., Bloss, W., Crilley, L. R., Keene, W. C., Pszenny, A. A. P., and Hodzic, A.: Global impact of nitrate photolysis in sea-salt aerosol on NOx, OH, and O3 in the marine boundary layer, Atmos. Chem. Phys., 18, 11185–11203, https://doi.org/10.5194/acp-18-11185-2018, 2018.
Keene, W. C., Khalil, M. A. K., Erickson III, D. J., Mcculloch, A., Graedel, T. E., Lobert, J. M., Aucott, M. L., Gong, S. L., Harper, D. B., and Kleiman, G.: Composite global emissions of reactive chlorine from anthropogenic and natural sources: Reactive Chlorine Emissions Inventory, J. Geophys. Res.-Atmos., 104, 8429–8440, https://doi.org/10.1029/1998JD100084, 1999.
Kim, S., Kim, S.-Y., Lee, M., Shim, H., Wolfe, G. M., Guenther, A. B., He, A., Hong, Y., and Han, J.: Impact of isoprene and HONO chemistry on ozone and OVOC formation in a semirural South Korean forest, Atmos. Chem. Phys., 15, 4357–4371, https://doi.org/10.5194/acp-15-4357-2015, 2015.
Kleffmann, J., Gavriloaiei, T., Hofzumahaus, A., Holland, F., Koppmann, R., Rupp, L., Schlosser, E., Siese, M., and Wahner, A.: Daytime formation of nitrous acid: A major source of OH radicals in a forest, Geophys. Res. Lett., 32, 5, https://doi.org/10.1029/2005GL022524, 2005.
Kurtenbach, R., Becker, K., Gomes, J., Kleffmann, J., Lörzer, J., Spittler, M., Wiesen, P., Ackermann, R., Geyer, A., and Platt, U.: Investigations of emissions and heterogeneous formation of HONO in a road traffic tunnel, Atmos. Environ., 35, 3385–3394, https://doi.org/10.1016/S1352-2310(01)00138-8, 2001.
Lawrence, M. G. and Crutzen, P. J: Influence of NOx emissions from ships on tropospheric photochemistry and climate, Nature, 402, 167–170, https://doi.org/10.1038/46013, 1999.
Li, M., Zhang, Q., Kurokawa, J.-I., Woo, J.-H., He, K., Lu, Z., Ohara, T., Song, Y., Streets, D. G., Carmichael, G. R., Cheng, Y., Hong, C., Huo, H., Jiang, X., Kang, S., Liu, F., Su, H., and Zheng, B.: MIX: a mosaic Asian anthropogenic emission inventory under the international collaboration framework of the MICS-Asia and HTAP, Atmos. Chem. Phys., 17, 935–963, https://doi.org/10.5194/acp-17-935-2017, 2017.
Li, Q., Zhang, L., Wang, T., Tham, Y. J., Ahmadov, R., Xue, L., Zhang, Q., and Zheng, J.: Impacts of heterogeneous uptake of dinitrogen pentoxide and chlorine activation on ozone and reactive nitrogen partitioning: improvement and application of the WRF-Chem model in southern China, Atmos. Chem. Phys., 16, 14875–14890, https://doi.org/10.5194/acp-16-14875-2016, 2016.
Liu, H., Fu, M., Jin, X., Shang, Y., Shindell, D., Faluvegi, G., Shindell, C., and He, K.: Health and climate impacts of ocean-going vessels in East Asia, Nat. Clim. Change, 6, 1037–1041, https://doi.org/10.1038/nclimate3083, 2016.
Liu, H., Jin, X., Wu, L., Wang, X., Fu, M., Lv, Z., Morawska, L., Huang, F., and He, K.: The impact of marine shipping and its DECA control on air quality in the Pearl River Delta, China, Sci. Total Environ., 625, 1476–1485, https://doi.org/10.1016/j.scitotenv.2018.01.033, 2018.
Liu, Y., Nie, W., Xu, Z., Wang, T., Wang, R., Li, Y., Wang, L., Chi, X., and Ding, A.: Semi-quantitative understanding of source contribution to nitrous acid (HONO) based on 1 year of continuous observation at the SORPES station in eastern China, Atmos. Chem. Phys., 19, 13289–13308, https://doi.org/10.5194/acp-19-13289-2019, 2019.
Lv, Z., Liu, H., Ying, Q., Fu, M., Meng, Z., Wang, Y., Wei, W., Gong, H., and He, K.: Impacts of shipping emissions on PM2.5 pollution in China, Atmos. Chem. Phys., 18, 15811–15824, https://doi.org/10.5194/acp-18-15811-2018, 2018.
McDuffie, E. E., Smith, S. J., O'Rourke, P., Tibrewal, K., Venkataraman, C., Marais, E. A., Zheng, B., Crippa, M., Brauer, M., and Martin, R. V.: A global anthropogenic emission inventory of atmospheric pollutants from sector- and fuel-specific sources (1970–2017): an application of the Community Emissions Data System (CEDS), Earth Syst. Sci. Data, 12, 3413–3442, https://doi.org/10.5194/essd-12-3413-2020, 2020.
Meusel, H., Kuhn, U., Reiffs, A., Mallik, C., Harder, H., Martinez, M., Schuladen, J., Bohn, B., Parchatka, U., Crowley, J. N., Fischer, H., Tomsche, L., Novelli, A., Hoffmann, T., Janssen, R. H. H., Hartogensis, O., Pikridas, M., Vrekoussis, M., Bourtsoukidis, E., Weber, B., Lelieveld, J., Williams, J., Pöschl, U., Cheng, Y., and Su, H.: Daytime formation of nitrous acid at a coastal remote site in Cyprus indicating a common ground source of atmospheric HONO and NO, Atmos. Chem. Phys., 16, 14475–14493, https://doi.org/10.5194/acp-16-14475-2016, 2016.
Moldanová, J., Fridell, E., Popovicheva, O., Demirdjian, B., Tishkova, V., Faccinetto, A., and Focsa, C.: Characterization of particulate matter and gaseous emissions from a large ship diesel engine, Atmos. Environ., 43, 2632–2641, https://doi.org/10.1016/j.atmosenv.2009.02.008, 2009.
Monge, M. E., D'Anna, B., Mazri, L., Giroir-Fendler, A., Ammann, M., Donaldson, D., and George, C.: Light changes the atmospheric reactivity of soot, P. Natl. Acad. Sci. USA, 107, 6605–6609, https://doi.org/10.1073/pnas.0908341107, 2010.
Ndour, M., D'Anna, B., George, C., Ka, O., Balkanski, Y., Kleffmann, J., Stemmler, K., and Ammann, M.: Photoenhanced uptake of NO2 on mineral dust: Laboratory experiments and model simulations, Geophys. Res. Lett., 35, 5, https://doi.org/10.1029/2007GL032006, 2008.
Osthoff, H. D., Roberts, J. M., Ravishankara, A., Williams, E. J., Lerner, B. M., Sommariva, R., Bates, T. S., Coffman, D., Quinn, P. K., and Dibb, J. E.: High levels of nitryl chloride in the polluted subtropical marine boundary layer, Nat. Geosci., 1, 324, https://doi.org/10.1038/ngeo177, 2008.
Sarwar, G., Simon, H., Xing, J., and Mathur, R.: Importance of tropospheric ClNO2 chemistry across the Northern Hemisphere, Geophys. Res. Lett., 41, 4050–4058, https://doi.org/10.1002/2014GL059962, 2014.
Simon, H., Kimura, Y., Mcgaughey, G., Allen, D., Brown, S., Osthoff, H., Roberts, J., Byun, D., and Lee, D.: Modeling the impact of ClNO2 on ozone formation in the Houston area, J. Geophys. Res.-Atmos., 114, D7, https://doi.org/10.1029/2008JD010732, 2009.
Song, S. K., Shon, Z. H., Kim, Y. K., Kang, Y. H., Oh, I. B., and Jung, C. H.: Influence of ship emissions on ozone concentrations around coastal areas during summer season, Atmos. Environ., 44, 713–723, https://doi.org/10.1016/j.atmosenv.2009.11.010, 2010.
Sun, L., Chen, T., Jiang, Y., Zhou, Y., Sheng, L., Lin, J., Li, J., Dong, C., Wang, C., and Wang, X.: Ship emission of nitrous acid (HONO) and its impacts on the marine atmospheric oxidation chemistry, Sci. Total Environ., 735, 139355, https://doi.org/10.1016/j.scitotenv.2020.139355, 2020.
Takeuchi, M., Miyazaki, Y., Tsunoda, H., and Tanaka, H.: Atmospheric acid gases in Tokushima, Japan, monitored with parallel plate wet denuder coupled ion chromatograph, Anal. Sci., 29, 165–168, https://doi.org/10.2116/analsci.29.165, 2013.
Tham, Y. J., Yan, C., Xue, L., Zha, Q., Wang, X., and Wang, T.: Presence of high nitryl chloride in Asian coastal environment and its impact on atmospheric photochemistry, Chinese Sci. Bull., 59, 356–359, https://doi.org/10.1007/s11434-013-0063-y, 2014.
Trinh, H. T., Imanishi, K., Morikawa, T., Hagino, H., and Takenaka, N.: Gaseous nitrous acid (HONO) and nitrogen oxides (NOx) emission from gasoline and diesel vehicles under real-world driving test cycles, J. Air Waste Manage., 67, 412–420, https://doi.org/10.1080/10962247.2016.1240726, 2017.
UNCTAD: Review of Maritime Transport 2020, United Nations Publication, 159 pp., 2020.
Wang, R., Tie, X., Li, G., Zhao, S., Long, X., Johansson, L., and An, Z.: Effect of ship emissions on O3 in the Yangtze River Delta region of China: Analysis of WRF-Chem modeling, Sci. Total Environ., 683, 360–370, https://doi.org/10.1016/j.scitotenv.2019.04.240, 2019.
Wang, T., Tham, Y. J., Xue, L. K., Li, Q. Y., Zha, Q., Wang, Z., Poon, S. C., Dubé, W. P., Blake, D. R., and Louie, P. K.: Observations of nitryl chloride and modeling its source and effect on ozone in the planetary boundary layer of southern China, J. Geophys. Res.-Atmos., 121, 2476–2489, https://doi.org/10.1002/2015JD024556, 2016.
Wen, L., Chen, T., Zheng, P., Wu, L., Wang, X., Mellouki, A., Xue, L. K., and Wang, W.: Nitrous acid in marine boundary layer over eastern Bohai Sea, China: Characteristics, sources, and implications, Sci. Total Environ., 670, 282–291, https://doi.org/10.1016/j.scitotenv.2019.03.225, 2019.
Ye, C., Zhou, X., Pu, D., Stutz, J., Festa, J., Spolaor, M., Tsai, C., Cantrell, C., Mauldin, R. L., and Campos, T.: Rapid cycling of reactive nitrogen in the marine boundary layer, Nature, 532, 489–491, https://doi.org/10.1038/nature17195, 2016.
Ye, C., Zhang, N., Gao, H., and Zhou, X.: Photolysis of Particulate Nitrate as a Source of HONO and NOx, Environ. Sci. Technol., 51, 6849–6856, https://doi.org/10.1021/acs.est.7b00387, 2017.
Zaveri, R. A. and Peters, L. K.: A new lumped structure photochemical mechanism for large-scale applications, J. Geophys. Res.-Atmos., 104, 30387–30415, https://doi.org/10.1029/1999JD900876, 1999.
Zha, Q., Xue, L., Wang, T., Xu, Z., Yeung, C., Louie, P. K., and Luk, C. W.: Large conversion rates of NO2 to HNO2 observed in air masses from the South China Sea: Evidence of strong production at sea surface? Geophys. Res. Lett., 41, 7710–7715, https://doi.org/10.1002/2014GL061429, 2014.
Zhang, L., Wang, T., Zhang, Q., Zheng, J., Xu, Z., and Lv, M.: Potential sources of nitrous acid (HONO) and their impacts on ozone: A WRF-Chem study in a polluted subtropical region, J. Geophys. Res.-Atmos., 121, 3645–3662, https://doi.org/10.1002/2015JD024468, 2016.
Zhang, L., Li, Q., Wang, T., Ahmadov, R., Zhang, Q., Li, M., and Lv, M.: Combined impacts of nitrous acid and nitryl chloride on lower-tropospheric ozone: new module development in WRF-Chem and application to China, Atmos. Chem. Phys., 17, 9733–9750, https://doi.org/10.5194/acp-17-9733-2017, 2017.
Zhang, Y., Wen, X. Y., Wang, K., Vijayaraghavan, K., and Jacobson, M. Z.: Probing into regional O3 and particulate matter pollution in the United States: An examination of formation mechanisms through a process analysis technique and sensitivity study, J. Geophys. Res.-Atmos., 114, D22, https://doi.org/10.1029/2009JD011900, 2009.
Zhang, Y., Yang, X., Brown, R., Yang, L., Morawska, L., Ristovski, Z., Fu, Q., and Huang, C.: Shipping emissions and their impacts on air quality in China, Sci. Total Environ., 581, 186–198, https://doi.org/10.1016/j.scitotenv.2016.12.098, 2017.