the Creative Commons Attribution 4.0 License.
the Creative Commons Attribution 4.0 License.
 | 08 Jun 2021
The impact of aerosol size-dependent hygroscopicity and mixing state on the cloud condensation nuclei potential over the north-east Atlantic
Kirsten N. Fossum
Jurgita Ovadnevaite
Chunshui Lin
Ru-Jin Huang
Colin O'Dowd
Darius Ceburnis
We present an aerosol cloud condensation nuclei (CCN) closure study over the north-east Atlantic Ocean using six approximating methods. The CCN number concentrations (NCCN) were measured at four discrete supersaturations (SSs; 0.25 %, 0.5 %, 0.75 % and 1.0 %). Concurrently, aerosol number size distribution, sub-saturation hygroscopic growth factor and bulk PM1 chemical composition were obtained at matching time resolution and after a careful data validation exercise. Method A used a constant bulk hygroscopicity parameter κ of 0.3; method B used bulk PM1 chemical composition measured by an aerosol mass spectrometer (AMS); method C utilised a single growth factor (GF) size (165 nm) measured by a humidified tandem differential mobility analyser (HTDMA); method D utilised size-dependent GFs measured at 35, 50, 75, 110 and 165 nm; method E divided the aerosol population into three hygroscopicity modes (near-hydrophobic, more-hygroscopic and sea-salt modes), and the total CCN number in each mode was cumulatively added up; method F used the full-size-scale GF probability density function (GF–PDF) in the most complex approach. The studied periods included high-biological-activity and low-biological-activity seasons in clean marine and polluted continental air masses to represent and discuss the most contrasting aerosol populations.
Overall, a good agreement was found between estimated and measured NCCN with linear regression slopes ranging from 0.64 to 1.6. The temporal variability was captured very well, with Pearson's R value ranging from 0.76 to 0.98 depending on the method and air mass type. We further compared the results of using different methods to quantify the impact of size-dependent hygroscopicity and mixing state and found that ignoring size-dependent hygroscopicity induced overestimation of NCCN by up to 12 %, and ignoring a mixing state induced overestimation of NCCN by up to 15 %. The error induced by assuming an internal mixing in highly polluted cases was largely eliminated by dividing the full GF–PDF into three conventional hygroscopic modes, while assuming an internal mixing in clean marine aerosol did not induce significant error.
- Article
(4335 KB) - Full-text XML
-
Supplement
(1790 KB) - BibTeX
- EndNote


Aerosols play an essential role in climate change through direct and indirect effects (Twomey, 1977). The direct effect refers to the effect of aerosol absorbing and scattering incoming solar radiation, and the indirect effect refers to the activation of aerosol into cloud droplets, thereby modifying cloud properties. Cloud condensation nuclei (CCN) is a subset of the aerosol population that can be activated into cloud droplets under certain water vapour supersaturation (SS).
Despite its essential role in regulating climate, the aerosol–cloud interactions have not been satisfactorily understood, resulting in the largest source of uncertainty in current climate models (IPCC, 2013). The accurate representation of natural aerosol is crucial for reducing the uncertainty in climate models (Carslaw et al., 2013). The CCN number concentration (NCCN) is, therefore, crucial in characterising aerosol–cloud interaction and their radiative impacts
The NCCN can be measured in situ using a CCN counter (Roberts and Nenes, 2005) or estimated by the extrapolation of sub-saturation hygroscopicity based on Kölher theory (Köhler, 1936). Petters and Kreidenweis (2007) proposed a water activity parameterisation, making it possible to describe aerosol hygroscopic growth and CCN activation with a single parameter, κ. Comparison between measured and extrapolated NCCN constitutes a so-called hygroscopicity–CCN closure. In the last few decades, intensive efforts have been made in achieving hygroscopicity–CCN closure (Cai et al., 2018; Cerully et al., 2011; Hansen et al., 2015; Hämeri et al., 2001; Hong et al., 2014; Jurányi et al., 2013; Kim et al., 2011). For example, Kawana et al. (2016) found that in urban areas of Tokyo, the aerosol organic matter played a vital role in CCN activity, whereby the NCCN was greatly underestimated if organic matter was assumed to be completely insoluble. Wex et al. (2010) compiled data from urban, rural and coastal areas for hygroscopicity–CCN closure, showing that the assumption of aerosol internal mixing leads to an overestimation of NCCN for continental aerosols, where less-hygroscopic aerosol species dominated. A detailed exploration of hygroscopicity–CCN closure in a remote subarctic Sordalen mire site was conducted by Kammermann et al. (2010), and the results showed that ignoring particle mixing state did not impair CCN closure considerably, but size-resolved hygroscopicity or chemical composition information was essential for accurate estimation of NCCN. Good et al. (2010) found good closure between sub-saturated hygroscopicity and CCN activity when non-sea-salt sulfate (nss-sulfate) and ammonium were the major chemical species in terms of aerosol mass.
An alternative approach for NCCN estimation is to use chemical composition rather than sub-saturated aerosol hygroscopicity because of the wider application of aerosol mass spectrometers (AMS) as compared to the humidified tandem differential mobility analyser (HTDMA). Chemical composition can be used to estimate water activity using various models, such as the Zdanovskii–Stokes–Robinson (ZSR) simple mixing rule (Stokes and Robinson, 1966; Zdanovskii, 1948) and thermodynamic models (Nenes et al., 1998; Topping et al., 2005; Zuend et al., 2011). Chemical composition–CCN closure has been successfully achieved in various environments, including marine (Martin et al., 2011), rural (Wu et al., 2013), urban (Ren et al., 2018), boreal (Hong et al., 2014) and free-troposphere (Jurányi et al., 2010) environments.
The above-mentioned closure studies have provided great value in validating current small-scale thermodynamic and large-scale climate models. The discrepancies in certain closure studies revealed many factors that had not been taken into account, such as the change in solubility of organics (Petters and Kreidenweis, 2008), or liquid-phase-driven surface tension effects (Davies et al., 2019; Ovadnevaite et al., 2017; Petters and Kreidenweis, 2013; Ruehl et al., 2016). Successful closure studies suggested that it is possible to estimate the NCCN in large-scale models quite accurately. For example, Pringle et al. (2010) used the global chemical composition distribution to model the global distribution of the hygroscopicity parameter κ.
Although chemical composition–CCN closure studies have been conducted more widely than the hygroscopicity–CCN closure studies, there are several benefits of using sub-saturation hygroscopicity to be further explored. Firstly, sub-saturation hygroscopicity measurements provide information about ultra-fine or Aitken-mode particles which are not resolved in bulk chemical composition. Although size-resolved chemical composition data were presented in some locations by using a high-resolution aerosol mass spectrometer (AMS), it is difficult to achieve the same in remote environments where the mass concentration of submicron aerosols is usually too low to be size-resolved. Secondly, sub-saturation hygroscopicity measurements can reveal the aerosol mixing state. Chemistry–CCN closures often assume that aerosols are internally mixed, an assumption that can lead to overestimation of CCN number (Ching et al., 2017, 2019). The HTDMA is one of the few instruments that can deliver the information of mixing state of submicron aerosol in near real time. Thirdly, although the hygroscopicity of inorganic salts is well established, the hygroscopicity of organics is still rather uncertain. The organic matter species are highly diverse and complex in the ambient environments; therefore, in many CCN closure studies a constant hygroscopicity of organics was assumed for simplification (e.g. Pringle et al., 2010). However, the hygroscopic properties of organic matter were widely reported to be dependent on their molecular weight (Wang et al., 2019), oxidation level (Chang et al., 2010; Jimenez et al., 2009; Massoli et al., 2010; Nakao, 2017) and solubility (Petters and Kreidenweis, 2008). Freshly emitted carbonaceous aerosols are often non-hygroscopic, while the aged secondary organic aerosols are more hygroscopic. The HTDMA can provide information on the hygroscopicity and mixing state of organic matter. Furthermore, the organic matter may transform into organic nitrate (Kiendler-Scharr et al., 2016) or organosulfate (Vogel et al., 2016), which have significantly different hygroscopicity, thus introducing over- or underestimation of the particle hygroscopicity. Lastly, it is well recognised that some of the organic compounds in the atmosphere can lower the surface tension of the droplets, thus leading to a decrease in critical diameter at activation (Dcrit). Such information is not necessarily provided by chemical composition measurement. Therefore, surface tension of water (0.072 N m−1) is most often assumed. With the sub-saturation growth factor, the obtained NCCN was not affected by surface tension as long as κ and surface tension were self-consistently applied in calculations (Petters and Kreidenweis, 2007) due to the surface tension being used twice and cancelling out. There were a few reported exceptions where the surface tension evolved with the relative humidity (RH), and liquid–liquid phase separation occurred, leading to the surface tension evolution during the growth of an organic enriched droplet (Liu et al., 2018; Ovadnevaite et al., 2017)
Unfortunately, a long-standing debate on the use of HTDMA for NCCN estimation is that the κ derived from HTDMA measurements (κHTDMA) is generally lower than the κ derived from CCN measurements (κCCN) for the same chemical species. For example, κ(NH4)2SO4 is defined as 0.53 and 0.61 from HTDMA and CCN measurements, respectively (Petters and Kreidenweis, 2007). Similarly, in both lab experiments and ambient measurements, the κCCN was higher than κHTDMA by about ∼20 % to 50 % (Rose et al., 2010; Wu et al., 2013), while a few previous studies found κHTDMA and κCCN agreeing well within 20 % (Carrico et al., 2008; Duplissy et al., 2008). A meta-analysis compiled of HTDMA–CCN reconciliation over 10 sites revealed that at most of the sites, the agreement was within the calculated error bars; however, there was a tendency of underestimating NCCN using HTDMA, especially at low supersaturation (Whitehead et al., 2014).
Here we present the CCN closure study from the Mace Head research station (MHD) using collocated aerosol number size distribution measurements, NCCN measurements, sub-saturated hygroscopicity using HTDMA, aerosol bulk PM1 chemical composition including refractory sea salt by AMS and black carbon measurements by absorption photometer. Although several studies have investigated CCN and hygroscopic properties of aerosol in this region (Dall'Osto et al., 2010; Reade et al., 2006), the temporal coverage was limited, and no attempt has been made at estimating NCCN with hygroscopic properties of aerosols in various air masses and in different seasons. We compared the NCCN closure results by approximating both chemical composition and hygroscopicity parameter and analysed the extent of deviations caused by different simplifications and assumptions that were commonly applied in modelling studies.
2.1 Site
Measurements were taken over the period from 1 August 2009 to 12 November 2009 and from 14 April 2010 to 23 July 2010 at Mace Head atmospheric research station, located on the west coast of Ireland (http://www.macehead.org, last access: 30 April 2020), situated in the mid-to-high latitude of the North Atlantic Ocean. Meteorological parameters including solar radiation, wind speed, wind direction, relative humidity (RH) and pressure were also recorded over the measurement periods.
The aerosol population varied dramatically at MHD, ranging from polluted air masses advecting over the European continent and the United Kingdom to the cleanest air masses advecting over the north-east Atlantic (Dall'Osto et al., 2010; Ovadnevaite et al., 2014) and evolving by season, thus providing a unique opportunity to quantify the impact of simplified assumption in estimating NCCN in the above scenarios.
2.2 Measurements
2.2.1 Aerosol number size distribution
The aerosol number size distributions (20 to 500 nm) were measured using a scanning mobility particle sizer (SMPS). The SMPS is comprised of a differential mobility analyser (DMA) and a condensation particle counter (CPC), which scans the full size range every 10 min. A nano-SMPS was used to measure aerosol number size distribution from 3.5 to 20 nm. The SMPS system follows the particle physical property measurement protocol developed by the EUropean Supersites for Atmospheric Aerosol Research (EUSAAR; http://www.eusaar.net/files/activities/na3.cfm, last access: 12 October 2020).
2.2.2 CCN number concentration (NCCN)
The NCCN was measured using a continuous-flow streamwise thermal gradient CCN counter (CCN-100, Droplet Measurement Technologies, USA) described in Roberts and Nenes (2005). The CCN-100 operates at a flow rate of 0.5 L min−1, which is separated into a wetted zero-air sheath flow and sample flow at a ratio of 10 ± 0.3 (sheathsample). Aerosol is drawn into a temperature-regulated wetted vertical column, which creates supersaturated conditions through its centreline proportional to the applied vertical temperature gradient along the column wall. The CCN-100 was operated at four discrete water vapour supersaturations of 0.25 %, 0.5 %, 0.75 % and 1 %, with a dwell time of 5 min per supersaturation (SS). Column SS was calibrated using ammonium sulfate according to the methodology of Rose et al. (2008). Taking into account the length of this study's measurement period and normal operational drift of the CCN-100 column SS, a SS uncertainty of ±0.03 % was applied to the data (Schmale et al., 2017).
2.2.3 Sub-saturated hygroscopicity
An HTDMA (Liu et al., 1978; Rader and McMurry, 1986; Swietlicki et al., 2008; Tang et al., 2019a) was used to measure the growth factor probability density function (GF–PDF). A detailed description of the HTDMA instrument operated at MHD can be found in previous studies (Bialek et al., 2012; Xu et al., 2020). Briefly, the HTDMA consists of two DMAs, a temperature triggered humidifier and a CPC. First, mono-disperse particles with certain electrical mobility were selected by applying a certain voltage to DMA-1. The particles were then humidified by a Gex-Tex membrane and then scanned by the DMA-2, on which the varying voltage was applied corresponding to discrete particle electrical mobility diameter. By counting the particles at different voltages, GF–PDF was obtained over the full size range from 35 to 165 nm. The HTDMA RH probes were calibrated using ammonium sulfate monthly, the sizing of HTDMA was regularly cross-checked with SMPS, and the sizing difference between two DMAs was performed regularly using dry scan. The GF was calculated by measuring the aerosol size distribution at a fixed RH. The GF is defined as the ratio of wet and dry diameters. To retrieve the GF–PDF from raw data and to correct the broadening of the DMA distribution, a piecewise linear inversion algorithm was used (Gysel et al., 2009). In this study, the DMA-1 was held at an RH below 10 %, while the second DMA was set at an RH of 90 %. The electrical mobility diameters selected by the DMA-1 were 35, 50, 75, 110 and 165 nm. The main sample and sheath flow rates were 1 and 9 L min−1, respectively. The operation and quality assurance procedure followed the standard configuration and deployment recommended by the European Supersites for Atmospheric Aerosol Research (EUSAAR) network project (Duplissy et al., 2009).
It is important to note here that the definition of mixing state is arbitrary, although it was recently defined as the heterogeneous distribution of chemical species across the aerosol populations (Riemer et al., 2019; Ching et al., 2017). However, the mixing state metric proposed by Riemer et al. (2019) can only be obtained from single-particle chemical composition, which is not available in this study. Previous attempts of evaluating the impact of mixing state sometimes assumed chemical species being externally mixed with each other (e.g. Ren et al., 2018), while in the current study, the mixing state was defined as the distribution of hygroscopic species across the aerosol population, where the GF–PDF was practically divided by the bin of 0.01, and the binned GF–PDF was considered to be the representation of the mixing state. Therefore, the method F always represented the real mixing state of the ambient aerosol.
2.2.4 Chemical composition
The PM1 mass and chemical compositions, including organic matter (Org), ammonium (NH4), non-sea-salt sulfate (nss-SO4), nitrate (NO3) and methanesulfonic acid (MSA), were measured using a high-resolution time-of-flight aerosol mass spectrometer (HR-ToF-AMS; Aerodyne Research Inc., Billerica, MA) (DeCarlo et al., 2006). The 23Na35Cl+ ion signal at 58 and a scaling factor of 51 was used to retrieve refractory sea-salt concentration (Ovadnevaite et al., 2012). The ion signal of CH3SO and CH3SO3H+, which are related to MSA, was used for quantification and calibration of MSA (Ovadnevaite et al., 2014). Regular calibrations were also conducted using ammonium nitrate and sulfate. The AMS was operating at a vaporiser temperature of 650 ∘C and 5 min time resolution. The composition-dependent collection efficiency was applied (Middlebrook et al., 2012) to account for bouncing effects. Further details of the high-resolution time-of-flight aerosol mass spectrometer (HR-ToF-AMS) operations can be found in Ovadnevaite et al. (2014).
A multi-angle absorption photometer (MAAP; Thermo Fisher Scientific model 5012) was used to measure the mass concentration of black carbon (BC). The MAAP operated at a flow rate of 10 L min−1. The MAAP measured the transmittance and reflectance of BC-containing particles at two angles to calculate the optical absorbance, as described by Petzold and Schönlinner (2004).
2.3 Data validation and quality assurance
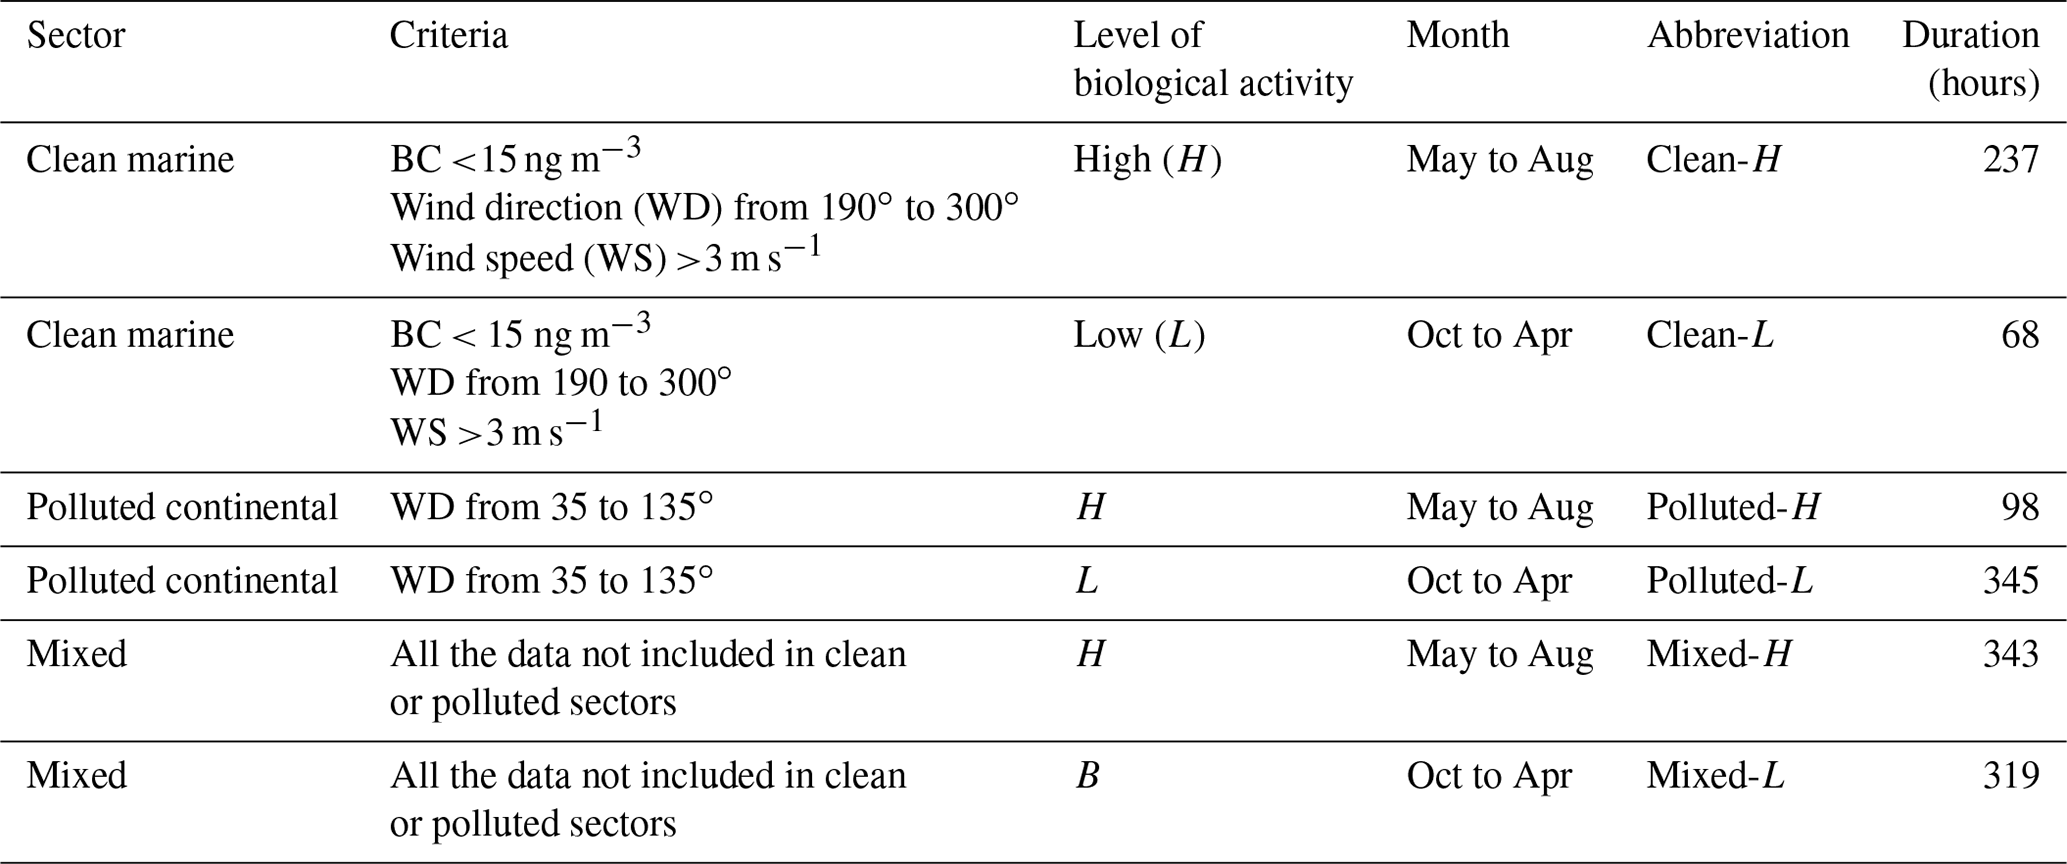
Air masses that advected over MHD were categorised into clean marine and polluted continental types according to the hourly averaged BC concentration, wind direction and wind speed. The clean marine sector criteria were used following the previous studies, where westerly air masses with BC concentration of less than 15 ng m−3 convincingly separated anthropogenically impacted air masses (O'Dowd et al., 2014). The polluted continental sector was defined according to wind direction alone (Xu et al., 2020). The rest of the data were defined as “mixed” sector, where either clean marine air masses were continentally modified, or polluted continental air masses recirculated into marine sector wind direction ranges. The clean, polluted and mixed sectors were further divided by the level of oceanic biological activity, further noted as “H” or “L” for high- and low-biological-activity seasons, respectively. The duration of high-biological-activity periods was classified according to prominent phytoplankton blooming periods (O'Dowd et al., 2004; Yoon et al., 2007). The sea surface chlorophyll concentration varied significantly in H and L seasons for the North Atlantic (Fig. S1). Table 1 summarises the data selection criteria and their frequency of occurrence. The duration of Clean-H and Clean-L conditions was 237 and 68 h, respectively, while the duration of Polluted-H and Polluted-L conditions was 98 and 345 h, respectively.
Table 1The total number of hours obtained in each air mass category after data validation.
The study used a large overlapping data set of six different instruments, and the data integrity was ensured by using a set of conservative processing criteria and taking advantage of a large initial data set:
-
All of the data were averaged to hourly resolution to match the resolution of various instruments due to different scanning time.
-
The data were manually checked to avoid any time stamp mismatch between individual data sets.
-
It was mandated that the NCCN at higher SS was always higher than or equal to the NCCN at lower SS; otherwise, data were filtered out. In some cases, however, the NCCN only marginally increased at high SS as the Dcrit moved in the tail of aerosol size distribution. For example, the Dcrit of sea salt at 0.75 % SS and 1 % SS is about 28 and 23 nm when assuming surface tension of water, and the gain in NCCN when summing up the aerosol size distribution from 28 to 23 nm would be minor, especially in low-marine-background events. Such a small difference could mask itself within the measurement uncertainty.
-
The SMPS data were cross-checked by an independent condensation particle counter (CPC; CPC3010, TSI) measurement. The ratio between Ncpc (the total number measured by CPC) and N10 (the total number of particles larger than 10 nm measured by SMPS) was calculated hourly. The upper envelope of the ratio was expected to be ranging between 1 and 1.1 to account for the rather frequent new particle formation at MHD. The SMPS data were corrected on a daily basis to make sure the 84.15th quantile of was ranging from 1 to 1.1. The 84.15th quantile was used as it represents the upper limit of the mean value plus 1 standard deviation in the normal distribution.
-
The total SMPS number was mandated to exceed that of NCCN to have meaningful comparison. For high-particle-number events (N30>400 cm−3), the NCCN (0.75 %) <1.1× N30 was considered to be the upper credibility limit of activation, where N30 represented the total particle number larger than 30 nm. For low-number events (N30<400 cm−3), the NCCN (0.75 %) <1.2× N30 was considered to be the upper limit. The different upper limits were used due to the larger uncertainty in SMPS measurement at low total particle number concentration.
-
Only data periods lasting longer than 4 h were used in further analysis to avoid transient events.
As shown in Fig. S2, most of the clean sector air mass advected over the North Atlantic without land contact for at least 3 d. The polluted sector showed larger anthropogenic impact, with the highest-frequency pixels located over land, but also revealed re-circulated air masses because of the geographical location of MHD. The wind rose, BC distribution and meteorological parameters of each category are given in Fig. S3.
2.4 Uncertainty
The uncertainty in the aerosol number size distribution measured by the SMPS was normally less than 10 % (Wiedensohler et al., 2017); the uncertainty in the HTDMA measurement was around 10 %. The uncertainty in the AMS measurement was about 30 %–40 %, which was mainly arising from the species-dependent collection efficiency. However, only the relative mass fractions were used to calculate aerosol hygroscopicity arising from chemical composition. Therefore, we assumed the uncertainty in the AMS-based κ to be lower than 20 %. The RH of the air sample in the inlet of SMPS and AMS was always lower than 40 %, while the inlet RH of the HTDMA was even lower, at ∼10 %. The uncertainty due to the inlet RH was minor because most of the inorganic aerosols undergo deliquescence when RH is greater than 40 %. For non-deliquescent organics, the increase in growth factor at 10 % and 40 % RH is typically limited to 10 % of the electrical mobility sizes. The accuracy of GF–PDF is sensitive to the total number; therefore GF–PDF uncertainty was 20 % for marine cases and even lower for polluted cases (Gysel et al., 2009). The accuracy in the CCN measurements was mainly determined by the accuracy of SS of the CCN counter column, which has an associated error on the order of ±0.03 % SS, translating to approximately 10 % uncertainty in measured NCCN. Considering the uncertainties induced by interpolation between discrete sizes, any estimated NCCN within 30 % of measured NCCN was believed to be reasonable closure. The relative root square error (RRSE) represented the relative error between the measurement and the estimated value, and it was calculated as
where pi is the estimated value, yi is the measured value, and is the mean value of yi.
3.1 Method A: internally mixed NCCN calculation based on constant κ of 0.3
Method A applies a constant κ of 0.3 to all of the data regardless of aerosol composition. Method A is regarded as the simplest method that can be used for estimating NCCN, and the κ of 0.3 has been suggested as the averaged κ over continental regions (Schmale et al., 2018). The Dcrit under certain SS was obtained by κ-Köhler theory (Petters and Kreidenweis, 2007).
where T is the temperature (298.15 K), R is the universal gas constant (8.315 J K−1 mol−1), ρw is the density of water (997.1 kg m−3), Mw is the molar mass of water (0.018015 kg mol−1), and is surface tension at the droplet–air interface (assumed to be 0.072 N m−1).
Lastly, the number of CCN (NCCN) was obtained by integrating the number size distribution from the Dcrit to its upper end of 500 nm.
3.2 Method B: internally mixed NCCN calculation based on the temporally resolved chemical composition
The hygroscopicity parameter κchem was calculated based on chemical composition using the ZSR mixing rule, which assumed that the total water content of mixed particles is the sum of the water content of each species. Firstly, the κchem was determined from the chemical composition as
where κi and εi are the hygroscopicity parameters and volume fractions of the individual chemical species in the mixture. The εi was derived from the chemical composition obtained by AMS and MAAP:
where the mi is the mass fraction, which was converted to volume fractions based on the simplified ion-pairing scheme (Gysel et al., 2007; Wu et al., 2013), and ρi is the density of each chemical. The κi and ρi used in this study are summarised in Table 2.
Table 2The κ values and densities of the chemical species considered in the study.
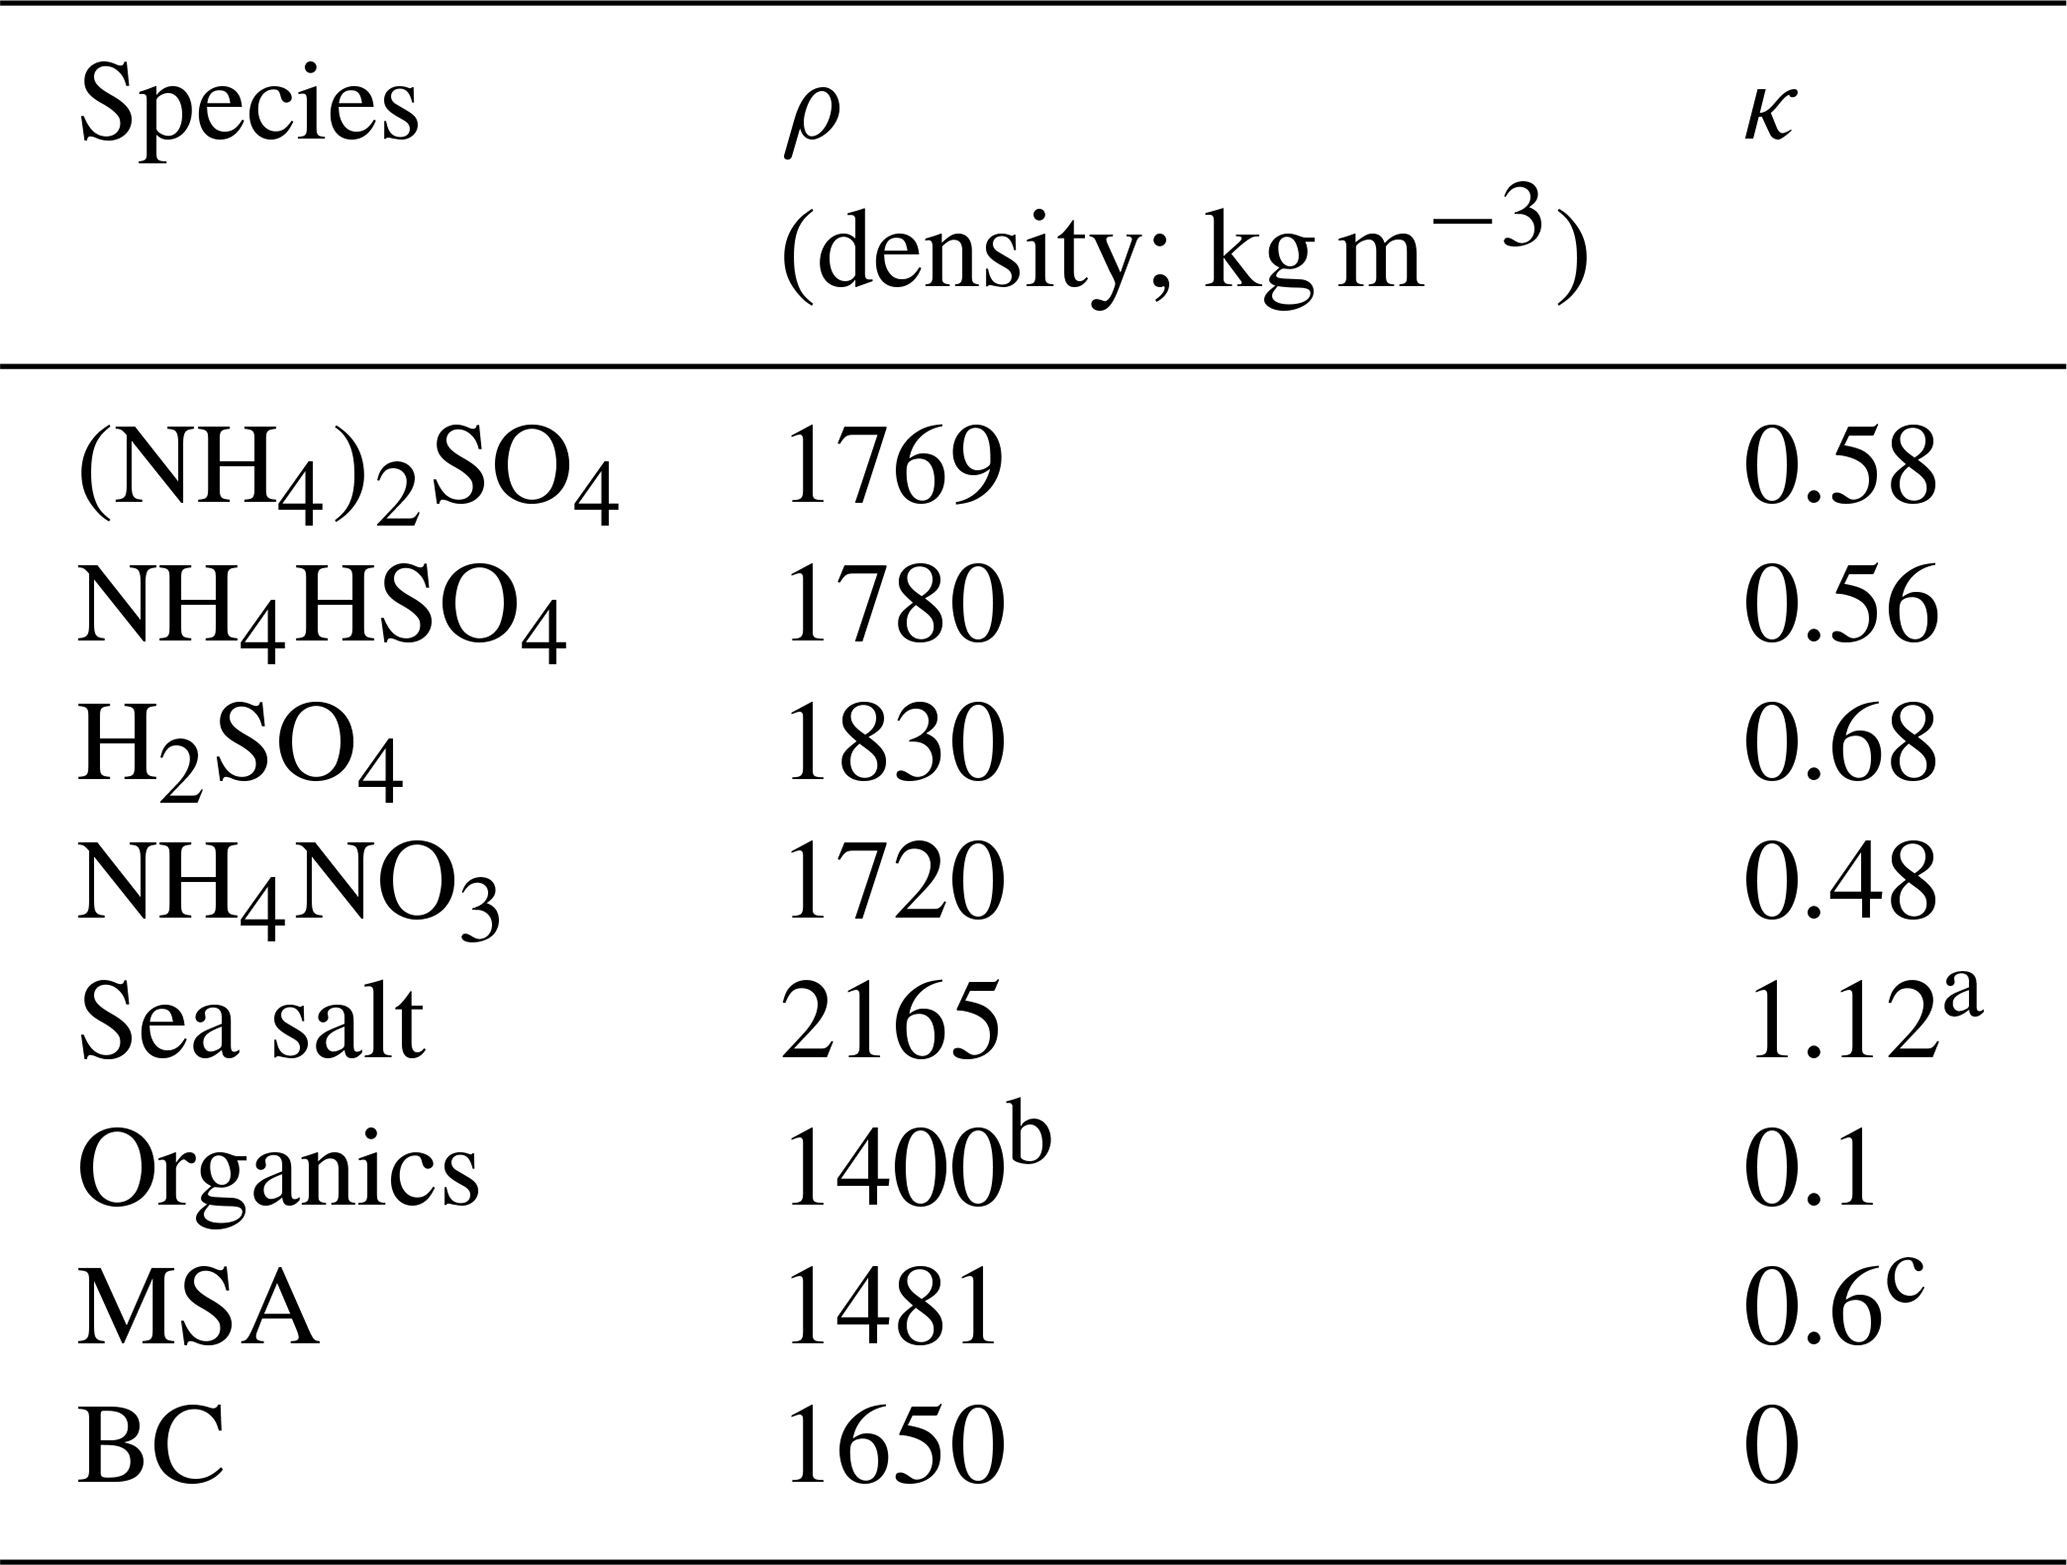
a The value was adapted from Zieger et al. (2017).
b The value was chosen to represent oxidised organics in aged air
masses (Alfarra et al., 2006).
c The value was adapted from Fossum et al. (2018) and Tang et al. (2019b).
The NCCN was then calculated using Eqs. (4) and (2) by replacing κ with κchem.
3.3 Method C: internally mixed NCCN calculation based on temporally resolved single growth factor
Method C is similar to method B, while the κchem was replaced by κHTDMA, which was obtained as follows:
where the RH is the relative humidity of DMA-2 of HTDMA. The GFmean (Dp) is the mean GF of the particle diameter (Dp), which was obtained by integrating the GF–PDF c (GF, 165 nm) (Gysel et al., 2009) from 0.8 to 2.5 with a ΔGF of 0.1:
In method C, only the Dp = 165 nm was used to represent the accumulation mode, and other sizes were assumed to have the same κHTDMA.
3.4 Method D: internally mixed NCCN calculation based on size-dependent growth factor
Method D used the size-dependent growth factor instead of a single growth factor, and the measured Dps were 35, 50, 75, 110 and 165 nm. Linear interpolation was used between these sizes to obtain a full size range measured by SMPS. Note that the particle diameters larger than 165 nm were assumed to have a growth factor equal to that of 165 nm diameter particles, and the sizes smaller than 35 nm were assumed to have GF of those of 35 nm.
3.5 Method E: NCCN calculation based on three hygroscopic growth modes
In method E, the GF–PDF was divided into near-hydrophobic mode (1< GF <1.3), more-hygroscopic mode (1.3< GF <1.85) and sea salt (1.85< GF). The number fraction (nf) and GF of these modes were calculated as follows:
And then the Dcrit of each mode was calculated by Eq. (4). Finally, the NCCN was the sum of the activated number of particles in three modes:
where nfi(Dp) is the number fraction of each mode at Dp size.
3.6 Method F: NCCN calculation based on temporally resolved growth factor probability density function (GF–PDF)
The calculation of NCCN based on sub-saturation hygroscopicity followed the method described in Kammermann et al. (2010). This approach was considered to be the most detailed CCN estimation which takes the mixing state and size-dependent hygroscopicity into account. The approach calculates the number fraction of CCN (fCCN) based on the GF–PDF, which was obtained as follows:
where GFcrit(SS,Dp) is the smallest GF required when a particle with a size of Dp is activated under SS. The GFcrit(SS,Dp) is obtained by using Eqs. (7), (2) and (3). The full GF–PDF over SMPS size ranges was obtained by interpolating the GF–PDF over the five measured electrical mobility diameters using linear interpolation.
The estimation of NCCN is then obtained by integrating the number size distribution weighted with the activated number fraction fCCN(SS,Dp):
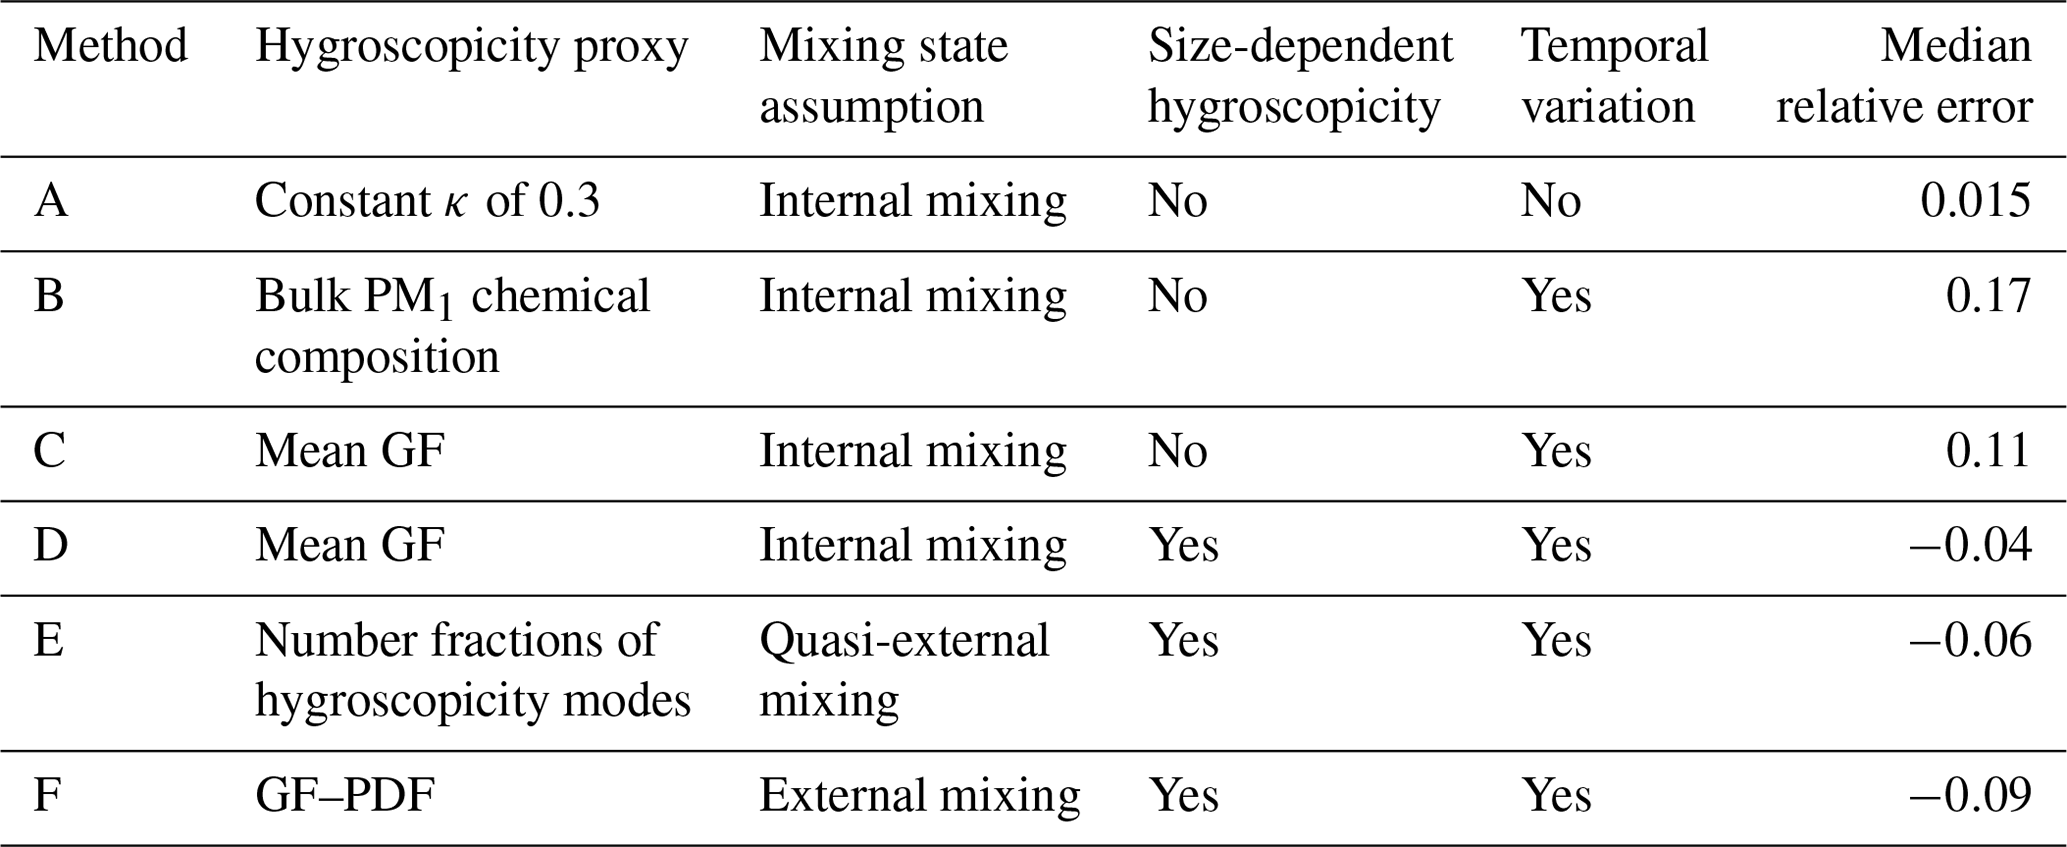
A schematic graph summarising key principles of each method is given in Fig. 1, where the first row of panels exhibits the types of hygroscopicity parameter κ used, and the second row of panel visualises how the NCCN was calculated using aerosol number size distribution. The defining features and simplifications of each method regarding size-dependent hygroscopicity and mixing state are given in Table 3.
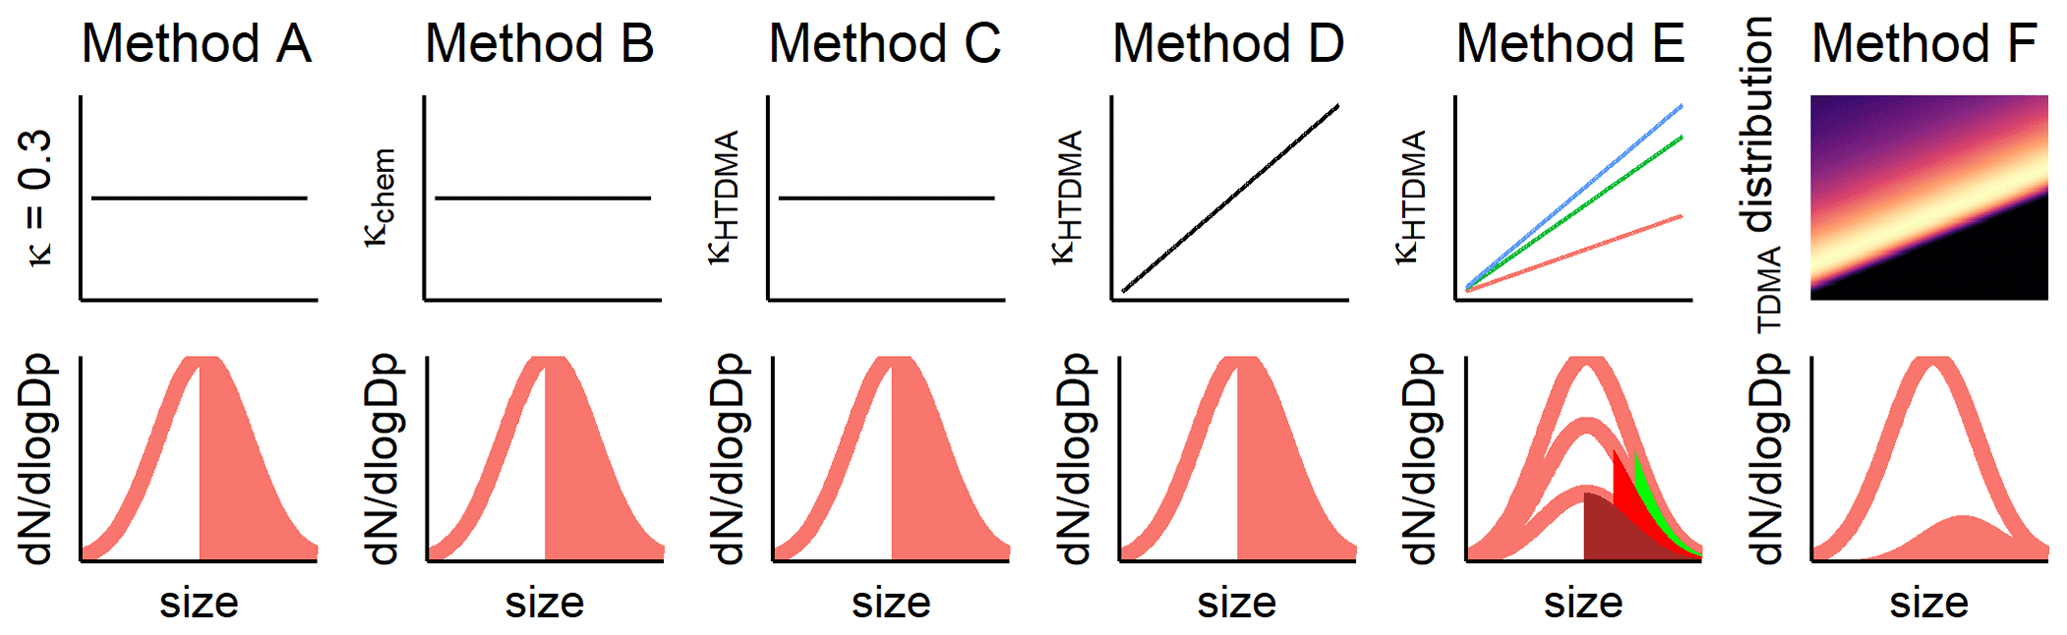
Figure 1Schematic illustration of different methods used for NCCN estimation. Method A: constant κ of 0.3; method B: size-independent κ derived by bulk PM1 chemical composition; method C: size-independent κ derived by hygroscopicity growth factor (GF) at 165 nm; method D: size-dependent κ derived by hygroscopicity growth factor; method E: size-independent κ and number fractions of near-hydrophobic, more-hygroscopic and sea-salt modes; method F: size-dependent activation ratio based on GF probability density function (GF–PDF).
Table 3The simplification and assumption of NCCN and the median relative error estimation methods.
Note that the upper limit of 500 nm was used when integrating NCCN because the SMPS measured particles up to 500 nm. Particles larger than 500 nm certainly contributed to the NCCN because of their large sizes. While ignoring those large particles would cause a slight systematic underestimation of NCCN, such underestimation would be negligible as their contribution to the total activated particle number (<3 %) was within the measurement uncertainty in the CCN counter.
Method A was the simplest method that can provide a rough estimate of NCCN if hygroscopicity data were not available. Method B was probably the most frequently used in the scientific community because of various parallel online and/or offline aerosol chemical analyses. Method C was the simplest version of hygroscopicity closure, and the complexity increased with the methods D, E and F. Method F was the most comprehensive method that captured the fine structure of GF–PDF but which is not always presented in the previous studies and is computationally expensive. Method E, therefore, divided full GF–PDF into three discrete modes and reduced the complexity of GF–PDF but kept basic information of the mixing state. More importantly, the principal hygroscopicity modes used in method E were widely reported in previous HTDMA studies, which then can be readily used for the NCCN prediction.
4.1 Measured CCN concentration and aerosol size distribution
The aerosol number concentrations and NCCN varied with air mass type and season. Figure 2 shows the aerosol number size distributions for each type of air mass. The Clean-H and Clean-L showed typical bimodal distribution of marine aerosol similar to the open-ocean nucleation event category (Dall'Osto et al., 2010; O'Dowd et al., 2010). The Aitken mode peaked at a dry electrical mobility diameter of 30 to 50 nm, and accumulation mode peaked at 100 to 200 nm. However, the size distribution in Polluted-H and Polluted-L showed broad distributions centred at 50–60 nm, but in Polluted-L, the relative contribution of accumulation mode was more significant due to the increased cloud processing during winter. Figure 3a summarises the NCCN for the given SSs for each type of air mass. Note that the SS of 1 % data was not included as it was partially unavailable. Overall, the measured NCCN in Polluted-L was the highest (with a median concentration of 1164 cm−3 at SS of 0.25 % and 1800 cm−3 at SS of 1 %), which was attributed to the high total particle number concentration (the median particle number with a diameter larger than 30 nm was 3156 cm−3), consistent with continental sources and enhanced emission. Polluted-H also showed remarkably high NCCN and aerosol number concentrations, with the NCCN median of 1182 cm−3 at SS of 1 % and median number particles of N30 of 1499 cm−3. In comparison to the polluted sector, low number concentrations were found in the clean sector, reflecting the clean marine conditions over the north-east Atlantic Ocean selected by the sector criteria (Methods section). For the clean sector, seasonal variation was also observed. Specifically, the Clean-H showed higher NCCN than Clean-L (for SS of 0.5 %, median NCCN values are 171 and 114 for Clean-H and Clean-L, respectively), although the bulk hygroscopicity of Clean-L aerosol was higher because of the higher contribution of sea salt. The mean κchem was 0.63 and 0.79, and the κHTDMA values for 165 nm particles were 0.45 and 0.56 for Clean-H and Clean-L, respectively; see Tables 4 and 5. The NCCN difference between Clean-H and Clean-L could be explained by the fact that the aerosol number concentration was high during Clean-H (the median numbers of particles over 30 nm are 322 and 206 cm−3 for Clean-H and Clean-L, respectively) due to the prominent biological activity over the ocean, leading to a higher concentration of condensible vapour and secondary aerosol formation. The mixed sector showed intermediate values of total particle concentrations and size distribution that fell between the clean sector and polluted sector patterns. Mixed-H showed greater similarity in number size distribution to Clean-H, while the Mixed-L was closer to Polluted-L in number size distribution due to the prevailing winds and synoptic-scale circulation in the low-biological-activity periods being predominantly influenced by continental air advection.
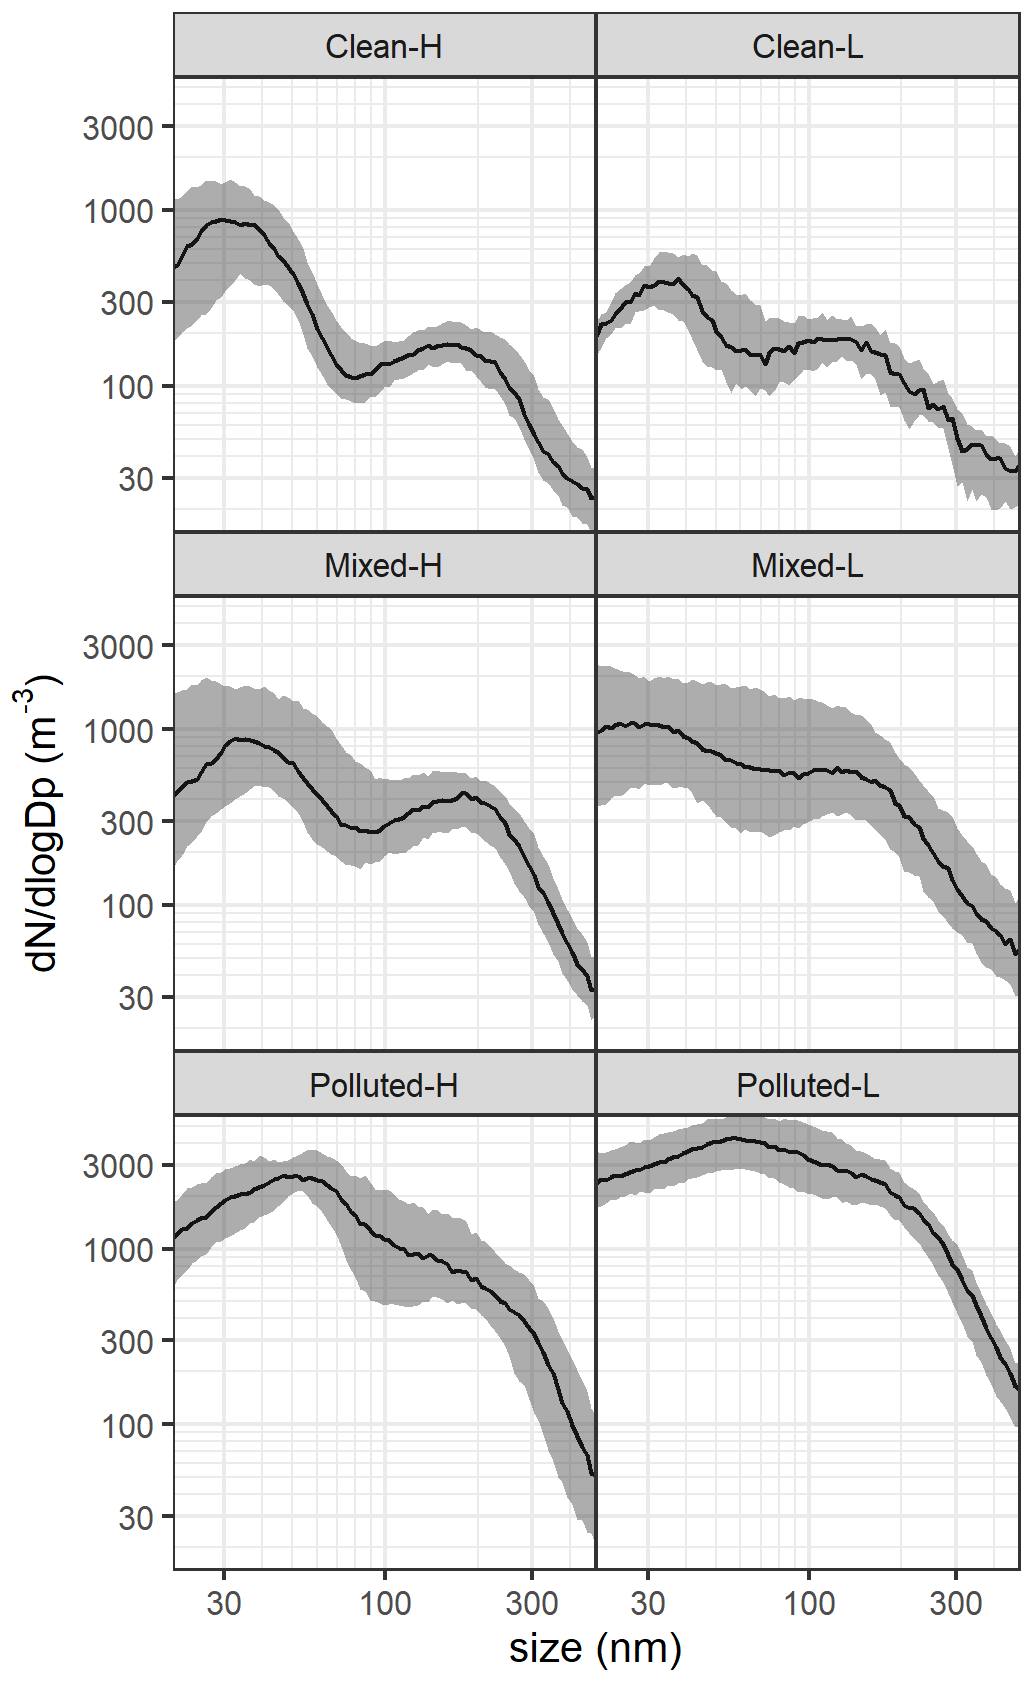
Figure 2The aerosol number size distribution for different types of air masses. The solid lines represent the median number concentration (), and the shaded area represents the 25th to 75th percentile.
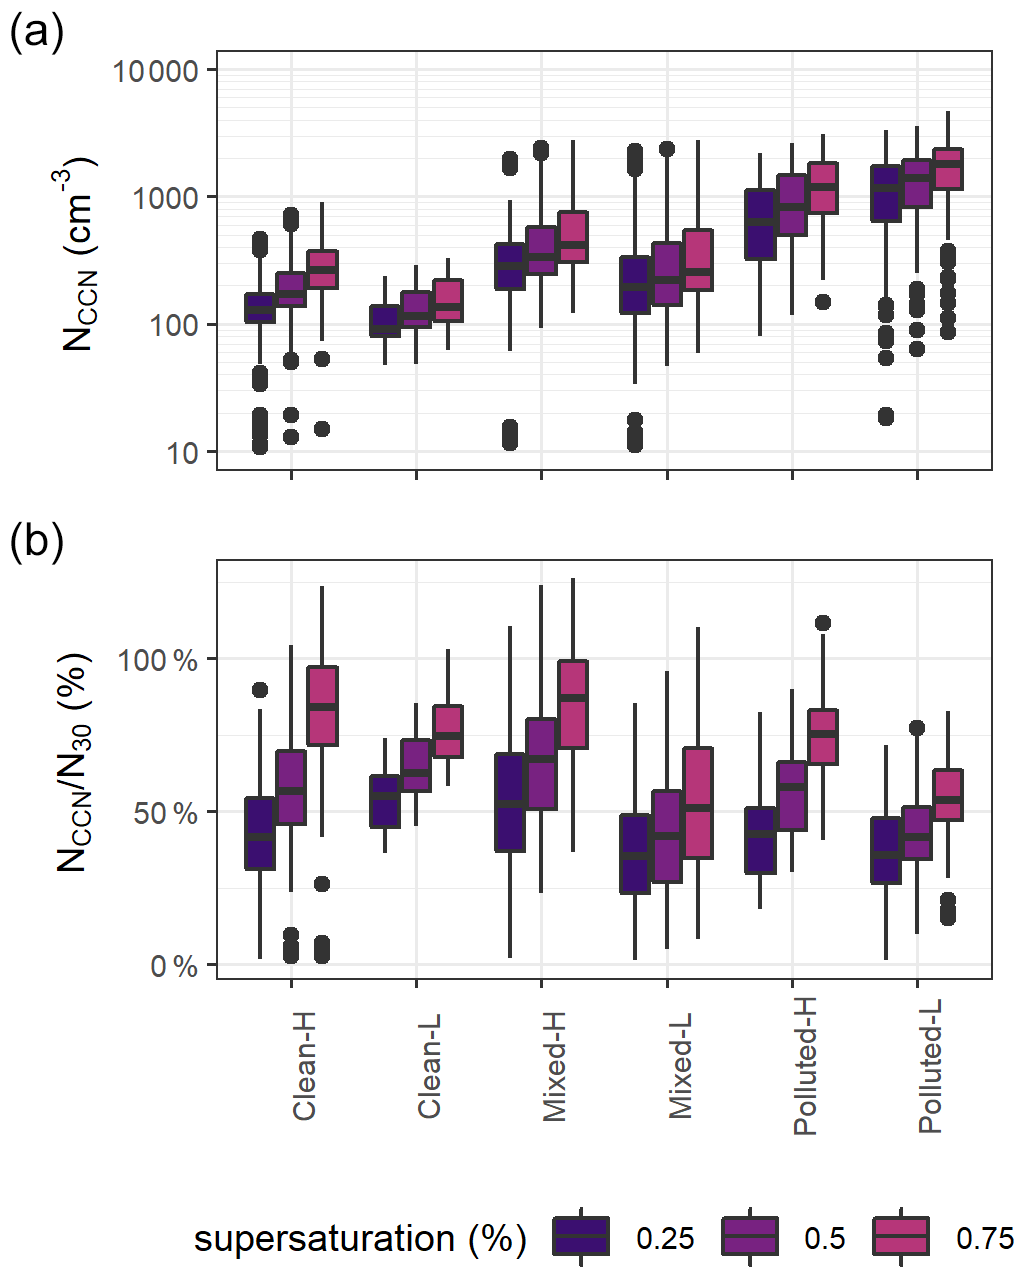
Figure 3(a) The NCCN and (b) the activation ratio () at given supersaturations (SSs) for different types of air mass. The lines represent the median, the boxes represent the 25th to 75th quantile, the whiskers represent the 1.5 interquartile, and the points represent outliers. The colour codes represent the level of supersaturations. Note the logarithmic Y axes in (a).
Table 4The mass concentration (ng m−3) of chemical composition and κchem in each type of air mass (arithmetic mean ± standard deviation).
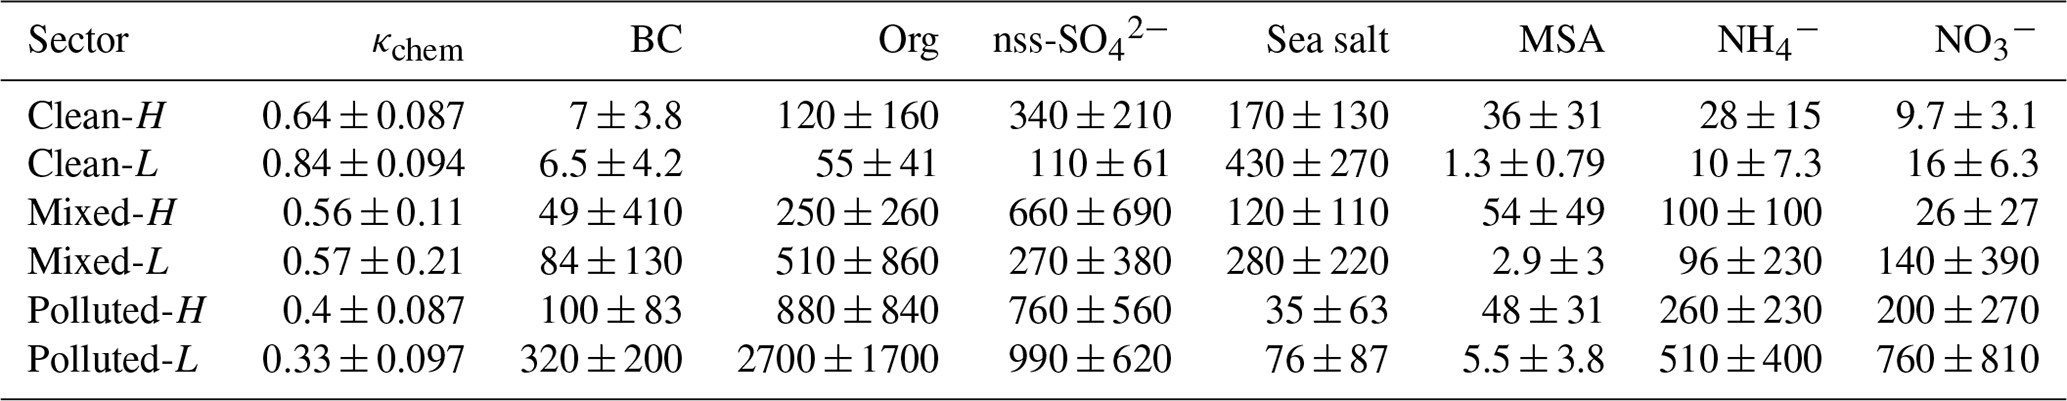
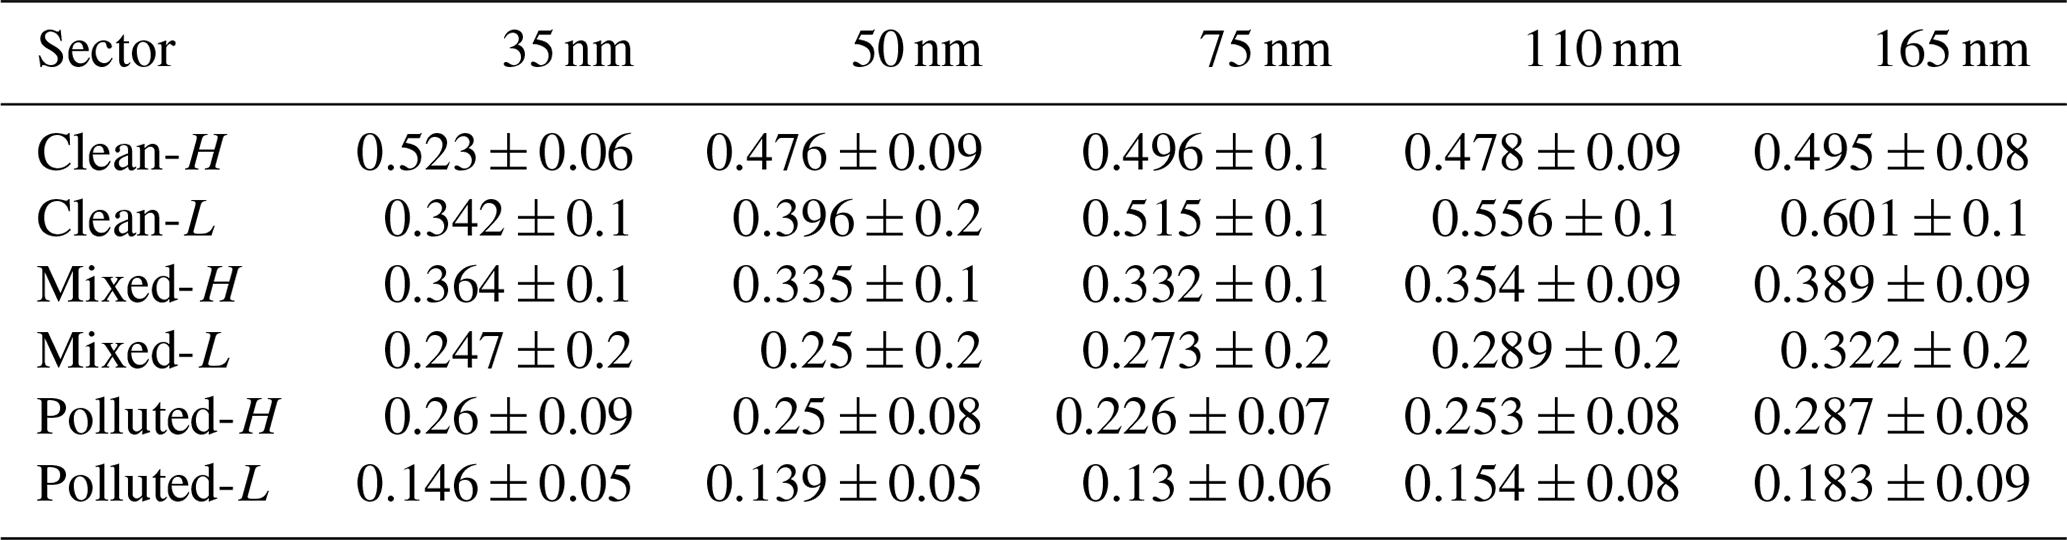
Table 5The κHTDMA in each type of air mass (arithmetic mean ± standard deviation).
The activation ratios (ARs) at varying SS for each category are shown in Fig. 3b. The ARs in the clean sector were generally higher than those of the polluted sector. Clean-L was characterised by higher AR than Clean-H at SS of 0.25 %, while at SS of 1 %, the AR was higher in Clean-H, which is consistent with chemical composition and size-dependent hygroscopicity (Tables 4 and 5). In Clean-H, the smaller particles exhibited higher hygroscopicity, while in Clean-L, it was the larger particles that were more hygroscopic. This pattern is attributed to the presence of Aitken-mode near-hydrophobic particles in Clean-L, as highlighted in the previous study (Xu et al., 2020). The AR of less than 100 % in Clean-L suggested that treating wintertime marine aerosol as pure sea salt or their mixture with nss-SO4 will likely induce an overestimation of NCCN at higher SS. Further research is needed to determine the source of such near-hydrophobic Aitken-mode particles. The reduced AR in the Polluted-L sector was consistent with the past studies showing that anthropogenically related organics significantly reduced the particle hygroscopicity (Duplissy et al., 2011; Wu et al., 2013), while the higher AR in Polluted-H lends support to the idea of enhanced particle ageing by photochemical reactions during spring, summer and autumn, making them more hygroscopic and CCN active at low SS.
The bulk PM1 chemical composition and derived κchem for each category are shown in Table 4. The concentrations of BC in the clean marine sector were 7.1 and 6.4 ng m−3 for the H and L seasons, respectively, reaffirming the representativeness of clean marine air masses.
4.2 CCN closure
The measured NCCN and estimated NCCN were compared by different air mass back trajectory sectors and seasons. The closure was considered to be achieved when measured NCCN and estimated NCCN agreed within the range of measurement uncertainty (refer to Sect. 2.4). Overall, the estimated and measured NCCN agreed well and were highly correlated, with the Pearson's R ranging between 0.85 and 0.99. The sector-specific closure results are shown in Figs. 4 and 5. The slope of the regression line (with a fixed intercept of zero) larger than 1.0 suggested overestimation, while the slope smaller than 1.0 suggested underestimation.
Here we show and discuss the results for the clean and polluted air mass back trajectory sectors, while the closure results of Mixed-H and Mixed-L are shown in Fig. S1. Overall, the closure results using different methods are similar within each sector. This points to the fact that for NCCN estimation, the effect of hygroscopicity or chemical composition is weaker than the particle size (Dusek et al., 2006; Wang et al., 2018). The estimated NCCN using different methods are summarised in Table S1. The normalised frequency of distribution of critical diameter by method A and method D is given in Figs. S2 and S3.
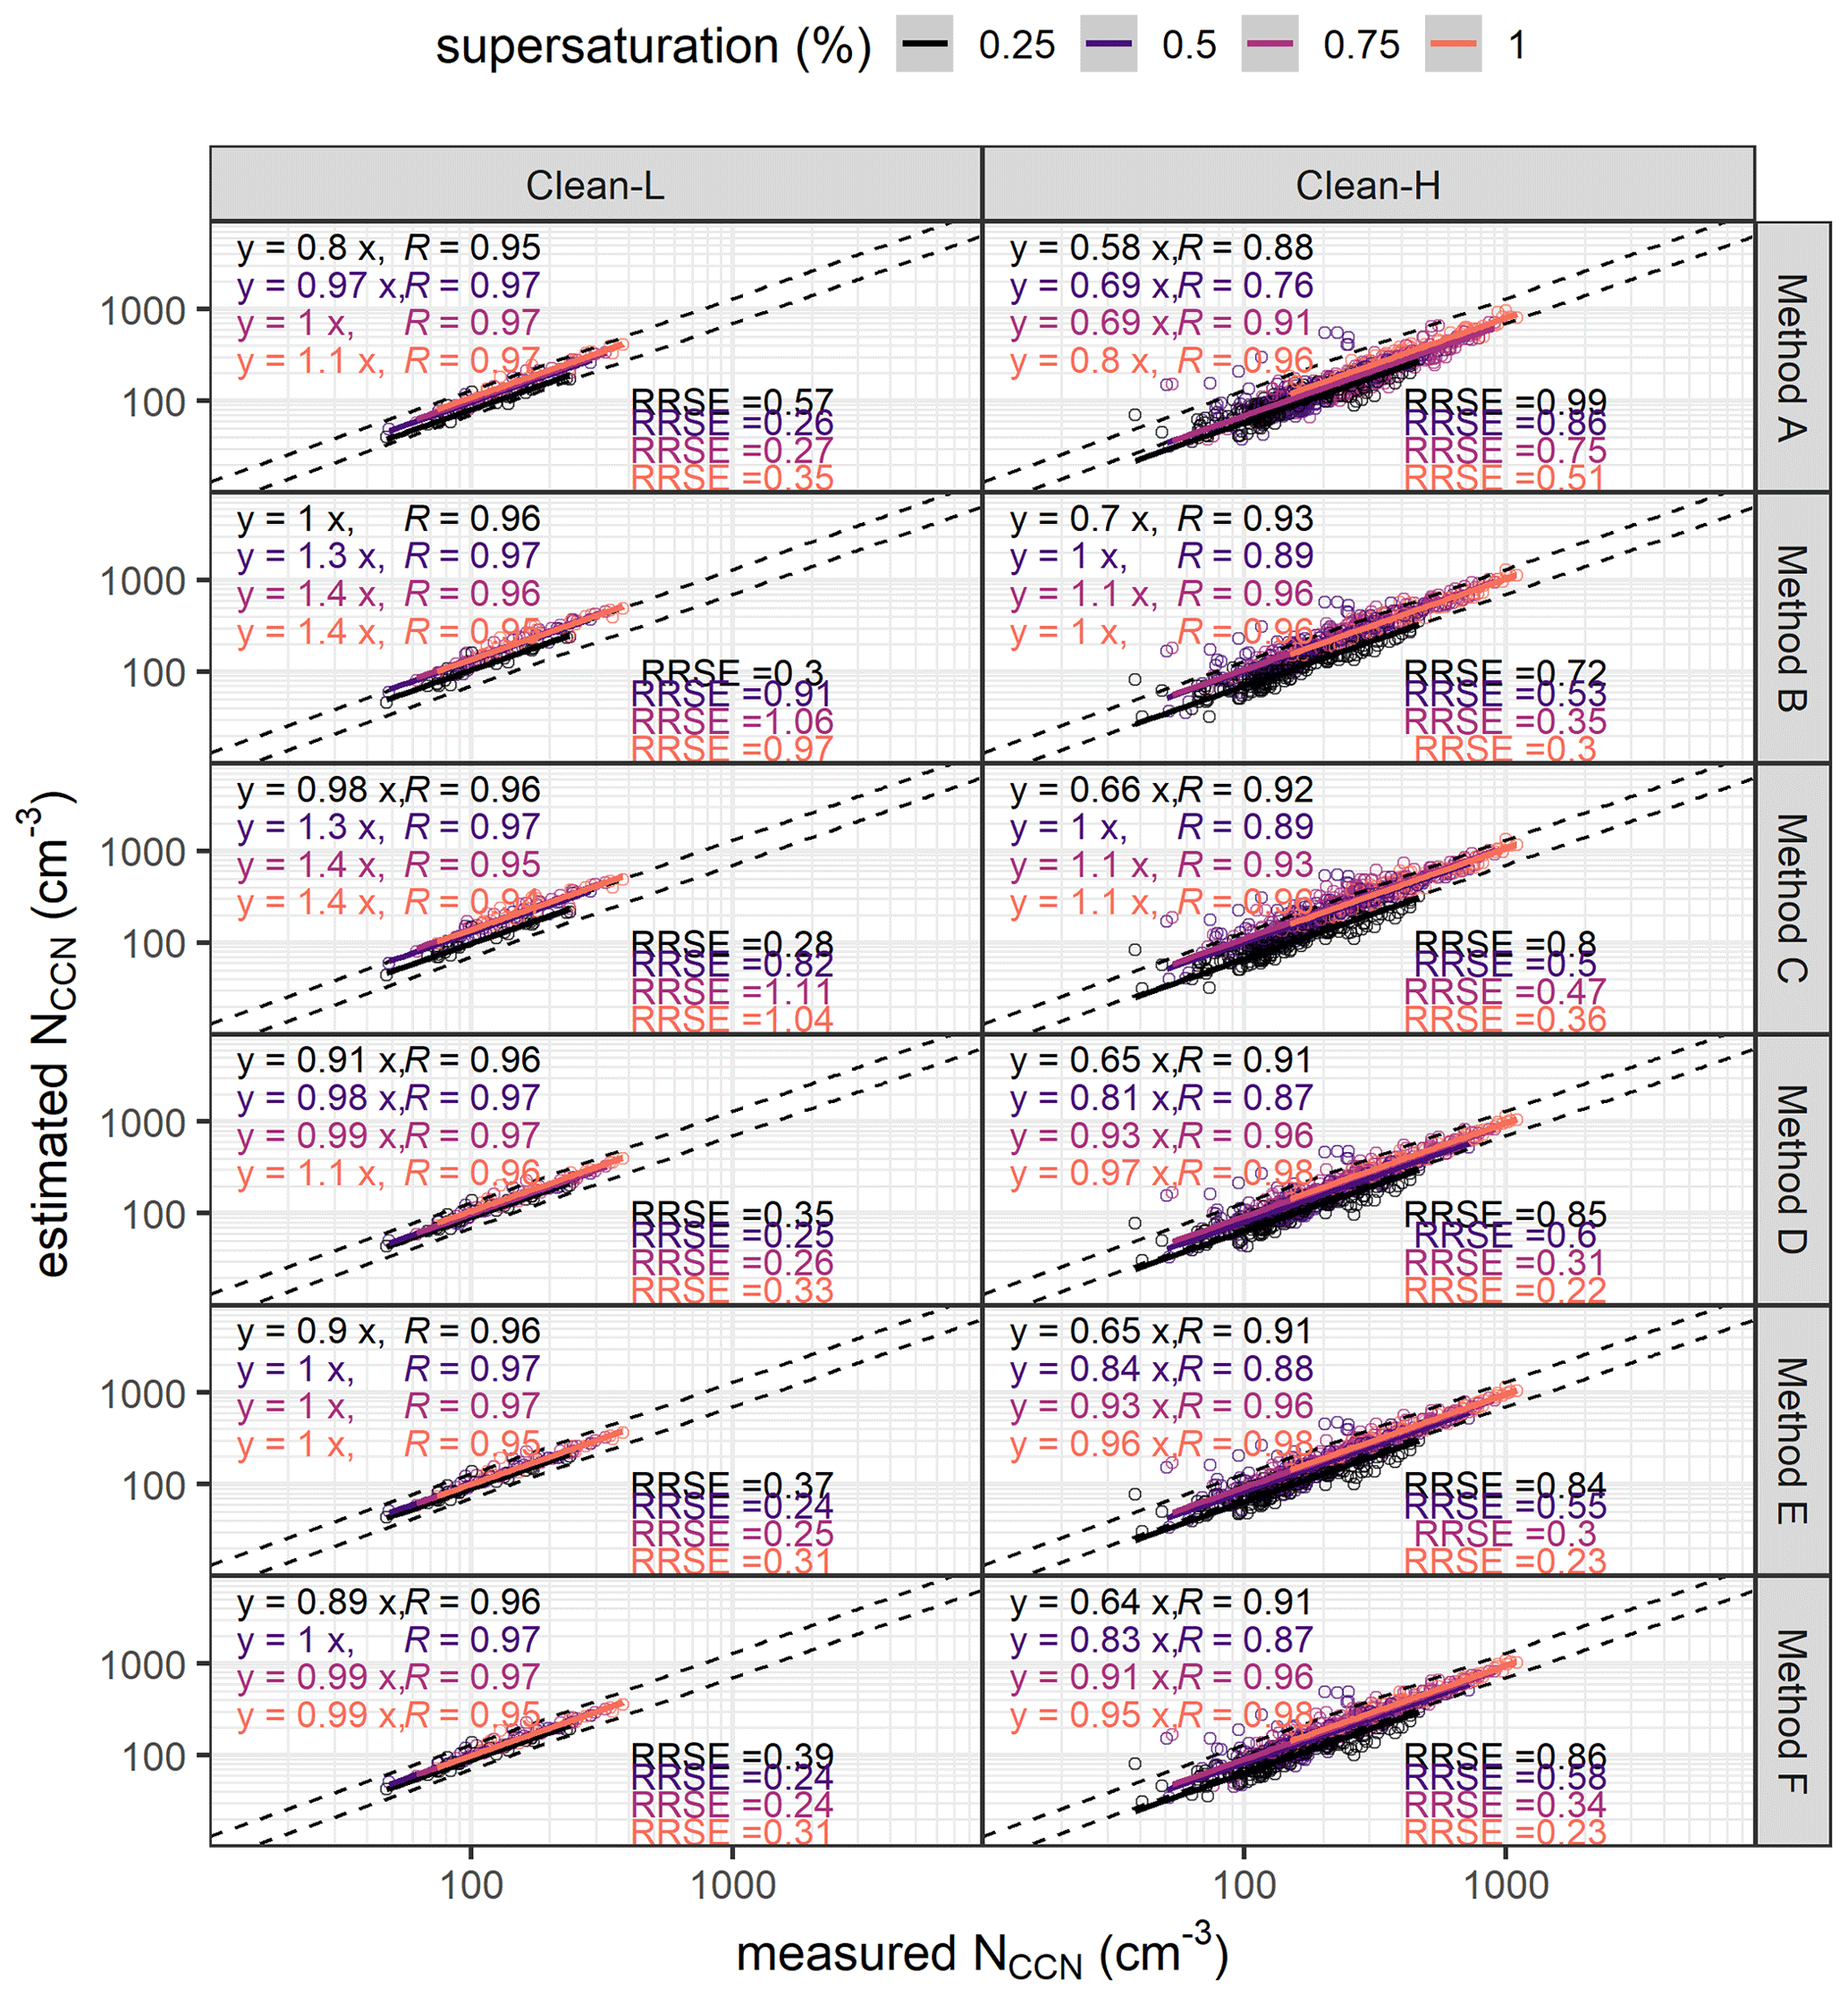
Figure 4Comparison of measured NCCN against the estimated NCCN under different SS using each method in Clean-L and Clean-H periods. The colour codes representing SS, equation of regression line, Pearson correlation efficient and relative root square error (RRSE) are shown in each panel. The dashed lines represent ±30 % uncertainty ranges. Note that axes are in logarithmic scales.

Figure 5Comparison of measured NCCN against estimated NCCN under different SS using each method in Polluted-L and Polluted-H. The colour codes representing SS, equation of regression line, Pearson correlation efficient and relative root square error (RRSE) are shown in each panel. The dashed lines represent 30 % uncertainty ranges. Note that axes are in logarithmic scales.
4.2.1 Clean sector
Hygroscopicity–CCN closure or chemistry–CCN closure in marine environments are few and far apart due to the inaccessibility of the marine environment. By contrast, geographically well-located sites like MHD offer ample opportunities for the systematic study of the marine atmosphere by carefully selecting observation periods. In this study, the clean sector represented the air masses advected across the North Atlantic Ocean, setting up the regional aerosol background entering the European continent. The low number concentration (See Sect. 4.1) and low black carbon mass concentration suggested the least anthropogenic impacts. The accumulation-mode Clean-L aerosol was mainly composed of nss-SO4 and sea salt, as suggested by the chemical composition (Table 4) and hygroscopicity measured at 110 and 165 nm (Fig. S5), while the Aitken-mode aerosol consisted of a fraction of near-hydrophobic particles (Fig. S5), which was not discerned by the bulk chemical composition due to negligible mass (Xu et al., 2020). As shown in Fig. 4, the Person's R values for the clean sector ranged from 0.76 to 0.98 depending on the type of air mass and SS. In the Clean-L, sea salt was the major contributor to the PM1 mass loadings, leading to a high average of κchem of 0.78. In contrast, nss-SO4 and organics accounted for a larger fraction in Clean-H. The averaged BC concentrations of 6.5 ng m−3 confirmed the cleanness and representativeness of the filtered clean sector data.
For the Clean-L, the slopes of regression lines of method A ranged from 0.76 to 1.4, and the Pearson's R values were 0.95 to 0.97. The slopes of method A were among the lowest, which was expected as either κHTDMA or κchem values were higher than 0.3 due to the high contribution of sea salt to the aerosol mass (Tables 4 and 5). Compared to method F, method A showed about 10 % to 15 % underestimation at SS from 0.25 % to 0.75 %. Method B and method C also showed significant overestimation at SS over 0.5 %, and the correlations were the highest when SS was 0.5 or 0.75 % due to the fact that the Dcrit was moving towards the tail of the SMPS spectrum with increasing SS, where the change in Dcrit did not produce a considerable change in NCCN. Similar results between method B and C suggested a minor difference between κchem and κHTDMA in Clean-L. The difference in NCCN between method C and method D was arising from size-dependent hygroscopicity. The NCCN obtained by method D was generally lower than that of method C by 3 % to 19 %, as shown in Table 5, with the larger particles exhibiting higher hygroscopicity. The reduced hygroscopicity in smaller sizes was consistent with our previous observation of near-hydrophobic Aitken-mode particles in wintertime clean marine air masses (Xu et al., 2020).
No statistically significant difference was found between method D and method E, with the corresponding chi-squared value of 70 (while the critical chi-squared value was 303 at the significance level of 0.05), suggesting that the simplification of full GF–PDF into near-hydrophobic, more-hygroscopic and sea-salt modes was a good representation of aerosol mixing state. Similar results were obtained between method C, D and E at any given SS, demonstrating a minor impact of mixing state to NCCN closure. This is probably due to the fact that although aerosol particles were externally mixed sea salt and nss-SO4, both of them were pretty hygroscopic. Consequently, if the species were not hygroscopic, the impact of neglecting the mixing state would be significant.
For the Clean-H sector, the Pearson's R values ranged from 0.76 to 0.98, suggesting that most of the variability in measured NCCN was captured well. The slopes ranged from 0.58 to 1.1 and increased with increasing SS. The Pearson's R values were as high as 0.96 using method A, and the slopes ranged from 0.58 to 0.8, suggesting significant underestimation by using a constant κ of 0.3. The NCCN using method B was substantially higher than method A by 10 % to 40 % because of high κchem values (averaged κchem of 0.63). No statistical difference between method C, D, E and F was found in terms of slopes, R values and the RRSE, the similarity being consistent with the internal mixing of Clean-H aerosol. As shown in Fig. S5, the size-resolved GF–PDF of the Clean-H aerosols was mainly composed of the more-hygroscopic mode, which can be the nss-sulfate or the mixture of sea salt and organics. The steep activation curve derived by GF–PDF also confirmed the minor difference between method B and C (Fig. S4).
The results in the clean sector were different from other closure studies in marine environments. For example, a closure study conducted during the RHaMBLe Discovery Cruise by Good et al. (2010) found a discrepancy between κHTDMA and κCCN. They found consistent underestimation of CCN activity by using aerosol composition and sub-saturation hygroscopicity. A CCN closure study in the summer high Arctic during the Arctic Summer Cloud Ocean Study (ASCOS) found that the calculated CCN was always higher than the measured CCN at an SS of 0.73 % and 0.41 % (Martin et al., 2011). Ovadnevaite et al. (2011) found that marine primary organic aerosol exhibited low-GF and high-CCN activation ratio simultaneously and hypothesised that the formation of marine hydrogel was responsible for the measured dichotomy. Similarly, Ovadnevaite et al. (2017) found underestimation of NCCN by an order of magnitude by using chemical composition, and liquid–liquid phase separation was considered to be the main driver of surface tension lowering. In contrast, Mochida et al. (2011) calculated CCN efficiency spectra from hygroscopic growth, and it agreed reasonably well with measured CCN spectra without lowering of the surface tension. When comparing to those studies, there were a few important differences in the current study: (1) the sea-salt component was retrieved with our method, which was not measured by some of the above studies; (2) our conservative data selection approach aimed at removing anthropogenic influence by using the threshold of BC of 15 ng m−3, while in some of the above-mentioned studies, some impact of anthropogenic perturbation might have influenced results; (3) lastly, an apparent dichotomy during significant marine organic matter events would violate closure. The organic matter events are regularly observed at MHD with organic matter (OM) concentration approaching 3–4 µg m−3 and lasting up to 24 h (Ovadnevaite et al., 2011, 2017). The above events can be dominated by either primary and/or secondary marine biogenic sources and are most importantly characterised by low-hygroscopicity particles, which however readily activated to CCN and formed cloud droplets (Ovadnevaite et al., 2011). The violation of closure depends on the specific κ value of OM during the events, the mixing ratio with sea salt (Vaishya et al., 2013), and whether or not OM is lowering the particle surface tension (Ovadnevaite et al., 2017). In this paper we used surface tension of water throughout the study, which does not apply during the OM events, and as such the detailed exploration of OM events is beyond the scope of the current study. Furthermore, the OM events were extensively covered in the above studies.
Our current methodological approach did not allow the calculation of κCCN, which required size-resolved CCN measurement, making it challenging to compare κCCN with κHTDMA or κchem (and concurrently advancing understanding of OM events). However, by comparing measured and estimated NCCN, we conclude that using a constant κ of 0.3 is likely to induce significant underestimation of NCCN, and using the HTDMA and AMS enabled the prediction of NCCN accurately most of the time, at least at MHD.
4.2.2 Polluted sector
The polluted sector represents the aerosol population in the polluted air masses advected across Ireland from the UK or the European continent with higher mass loadings of chemical species and higher number concentrations, leading to a higher NCCN. Aerosols in the polluted sector were rather externally mixed, which consisted of the near-hydrophobic mode and more-hygroscopic mode (Fig. S5) and led to the flatter activation curves (see panel of Fig. S4 for clarity). The near-hydrophobic mode was mainly composed of anthropogenic organic matter or BC and their mixture with nss-SO4 and NH4, and the more-hygroscopic mode was mainly composed of secondary inorganic species. The BC concentrations (290 and 410 ng m−3 for Polluted-H and Polluted-L) were nearly an order of magnitude higher than those in the clean sector. Polluted-L also showed a high mass contribution of organics. Higher BC and organic matter in Polluted-L suggested significant contribution of biomass and fossil fuel combustion in winter. Figure 5 shows the NCCN closure of Polluted-H and Polluted-L sectors.
For the Polluted-L, the Pearson's R values ranged from 0.74 to 0.97, suggesting that the temporal variability in NCCN was well explained by either chemical composition or sub-saturation hygroscopicity. The slopes were the highest at 0.75 % SS, while the Pearson's R values were highest at 1 % SS. RRSE values were lowest at 0.75 % SS. The highest Pearson's R values obtained at 1 % SS were likely the combined result of hygroscopicity and aerosol number size distribution. The obtained Dcrit's were between 40 and 50 nm (Fig. S3), which was within the peak of aerosol number size distribution, where the uncertainty in aerosol number size distribution was the lowest. As shown in the method A panel of Fig. 4, using a constant κ of 0.3 results in the steepest slope, for example, the slope of 1.5 at 0.5 % and 1 % SS, which is higher by over 30 % than obtained by method F. That suggested that using κ of 0.3 may induce the potential overestimation of 30 % to 50 % in highly polluted air masses. Method A and method B showed very similar results due to similar κ values used in the calculation. As shown in Table 4, the κchem was 0.31 ± 0.097 during the Polluted-L, and the mean κchem (0.30 ± 0.1) was larger than κHTDMA for 165 nm particles (0.17 ± 0.07), suggesting the possible overestimation by using the assumed κorg of 0.1. In a previous sub-saturated hygroscopicity and chemical composition study (Xu et al., 2020), the closure was achieved during wintertime between GFHTDMA and GFAMS, suggesting that using κ instead of GF will substantially increase an apparent error due to their cubic relationship, as shown in Eq. (7). Moreover, the selected κ values for the NCCN closure were usually in the upper range of hygroscopicity of specific chemical species, leading to the larger discrepancies between κchem and κHTDMA (Tables 4 and 5).
In the Polluted-H sector, the slopes ranged from 0.6 to 1.1, and the Person's R values ranged from 0.93 to 0.97. The slopes and correlations were the lowest at low SS. Method A showed the highest slopes of regression, with the majority of the slopes exceeding 1 except at 0.25 % SS. The differences between method A and B were minor, suggesting that the influence of replacing κchem by κHTDMA(165 nm) was minor and consistent with our previous study on the chemical composition–hygroscopicity closure (Xu et al., 2020). The slopes of method C (0.71 to 1.1) were lower than those of method B (0.79 to 1.1), indicating that the assumption made about the hygroscopicity being homogeneous across the sizes contributed to overestimation of NCCN by less than ∼10 %. Method D had the slopes closest to 1, suggesting the best achieved closure and the minor contribution of Δκ or surface tension reduction. The NCCN results obtained by method E were lower than method D but higher than method F.
CCN closure studies in polluted areas were attempted in the past, and the results varied rather significantly: Ervens et al. (2010) used simplified assumptions of organic aerosol from six locations, and the slopes of regression ranged from 0.2 to 7.9, and the locations farther away from fresh emission sources are more reliable, similar to the closure studies at the high alpine site and MHD (Jurányi et al., 2010). Compared to the aforementioned studies, the site in the current study, MHD, is also far away from fresh anthropogenic emission sources (O'Connor et al., 2008), making MHD less influenced by the mixing state. A more recent study by Schmale et al. (2018) compiled CCN closure by using chemical composition, particle number size distribution and CCN measurement from 12 sites on 3 continents. When applying the simple κ-Köhler theory and assuming internal mixing and ignoring the size dependency, the slopes ranged from 0.87 to 1.37, and κorg worked reasonably well in their study. However, there were a few differences in our method versus the Schmale et al. (2018) study, in which MHD data were also included: (1) the temporal coverage was different; (2) the Schmale et al. (2018) selection of κ of chemical species was different from this study. The slope of regression lines were ∼1.14, and Pearson's R values were ∼0.97, suggesting that the selection of higher κ values might induce a slight overestimation but still result in good correlation. However, due the variability in aerosol in MHD and different temporal coverage of the two studies, the difference in slopes resulted not only from the selection of κ but also the seasonal coverage of the data. Overall, the reasonable closure at MHD confirmed that data quality and aerosol number size distribution are essential for accurate NCCN estimations.
To conclude, by using a constant κ of 0.3, reasonable closure in Polluted-H was achieved but resulted in significant overestimation in Polluted-L by up to 50 to 60 %, and using bulk PM1 chemical-composition-derived κ again resulted in reasonable NCCN prediction in Polluted-H but showed overestimation in Polluted-L.
In the Mixed-H sector (Fig. S1), the slopes of regression lines were higher (ranged from 1.1 to 1.6), and the Pearson's R values were lower (0.64 to 0.79). The mixed sector represents the aerosols of continental modified marine air masses or continental outflow. As shown in Table 4, the concurrent high concentration of BC and sea salt and the coexistence of near-hydrophobic and sea-salt modes in GF–PDF confirm their external mixing in a mixed air mass. Generally, Mixed-H was rather similar to Clean-H, and Mixed-L was more similar to Clean-L, which is expected due to the seasonal distribution of wind direction and synoptic-scale circulation at MHD. For the Mixed-L, the NCCN obtained by method D was generally higher than method C but lower than method B, suggesting that dividing GF–PDF into three modes inhibits some information of external mixing, especially the existence of completely non-hygroscopic Aitken particles in the wintertime.
4.2.3 The impact of size-dependent hygroscopicity and mixing state
The importance of size-dependent hygroscopicity and mixing state in NCCN estimation has been emphasised in earlier studies. For example, Meng et al. (2014) found the NCCN deviation increasing up to 26 % when NCCN was calculated by bulk PM1 chemical composition (without size-dependent hygroscopicity). A CCN closure conducted in the winter season in India (Bhattu and Tripathi, 2015) found that the closure was sensitive to both aerosol chemical composition and mixing state at lower SS (e.g. 0.18 %), while at the higher SS, size-resolved chemical composition and the solubility of organics were needed for accurate NCCN estimation. In this study, the relative difference between each method was established to quantify the effect of simplified size-dependent hygroscopicity and mixing state. The relative difference between method C and method D can be viewed as the impact of size-dependent hygroscopicity. Similarly, the error of ignoring mixing state was obtained by looking at the relative difference between method D and method F.
As shown in Fig. 6 (left), the size-dependent hygroscopicity-induced relative error increased with the given SS and reached the highest value at 0.5 % or 0.75 % SS and then decreased again at SS of 1 %. The trend was shared by all types of air masses, suggesting that the impact of size-dependent hygroscopicity was the most prominent at moderate to high SS values. The assumption of size-independent hygroscopicity may cause larger errors in Clean-L, and the relative differences were within ±25 % for Clean-H and were up to 37 % for Clean-L at 0.75 % SS. As shown in Table 5, the κHTDMA of Clean-L increased with particle size, and the trend was similar to previous ship-based observations in the North Atlantic, where Aitken-mode particles were more hygroscopic than accumulation-mode particles because of the higher mass loading of nss-SO4 (Saliba et al., 2020). The relative differences in the Clean-L sector increased with increasing SS, which confirmed the fact that Aitken-mode particles were less hygroscopic as would be the case with nss-SO4 vs. sea-salt particles. For the mixed and polluted sectors, the relative differences introduced by size-dependent hygroscopicity were mostly within 25 %, ranging from 8 % to 25 % depending on SS.
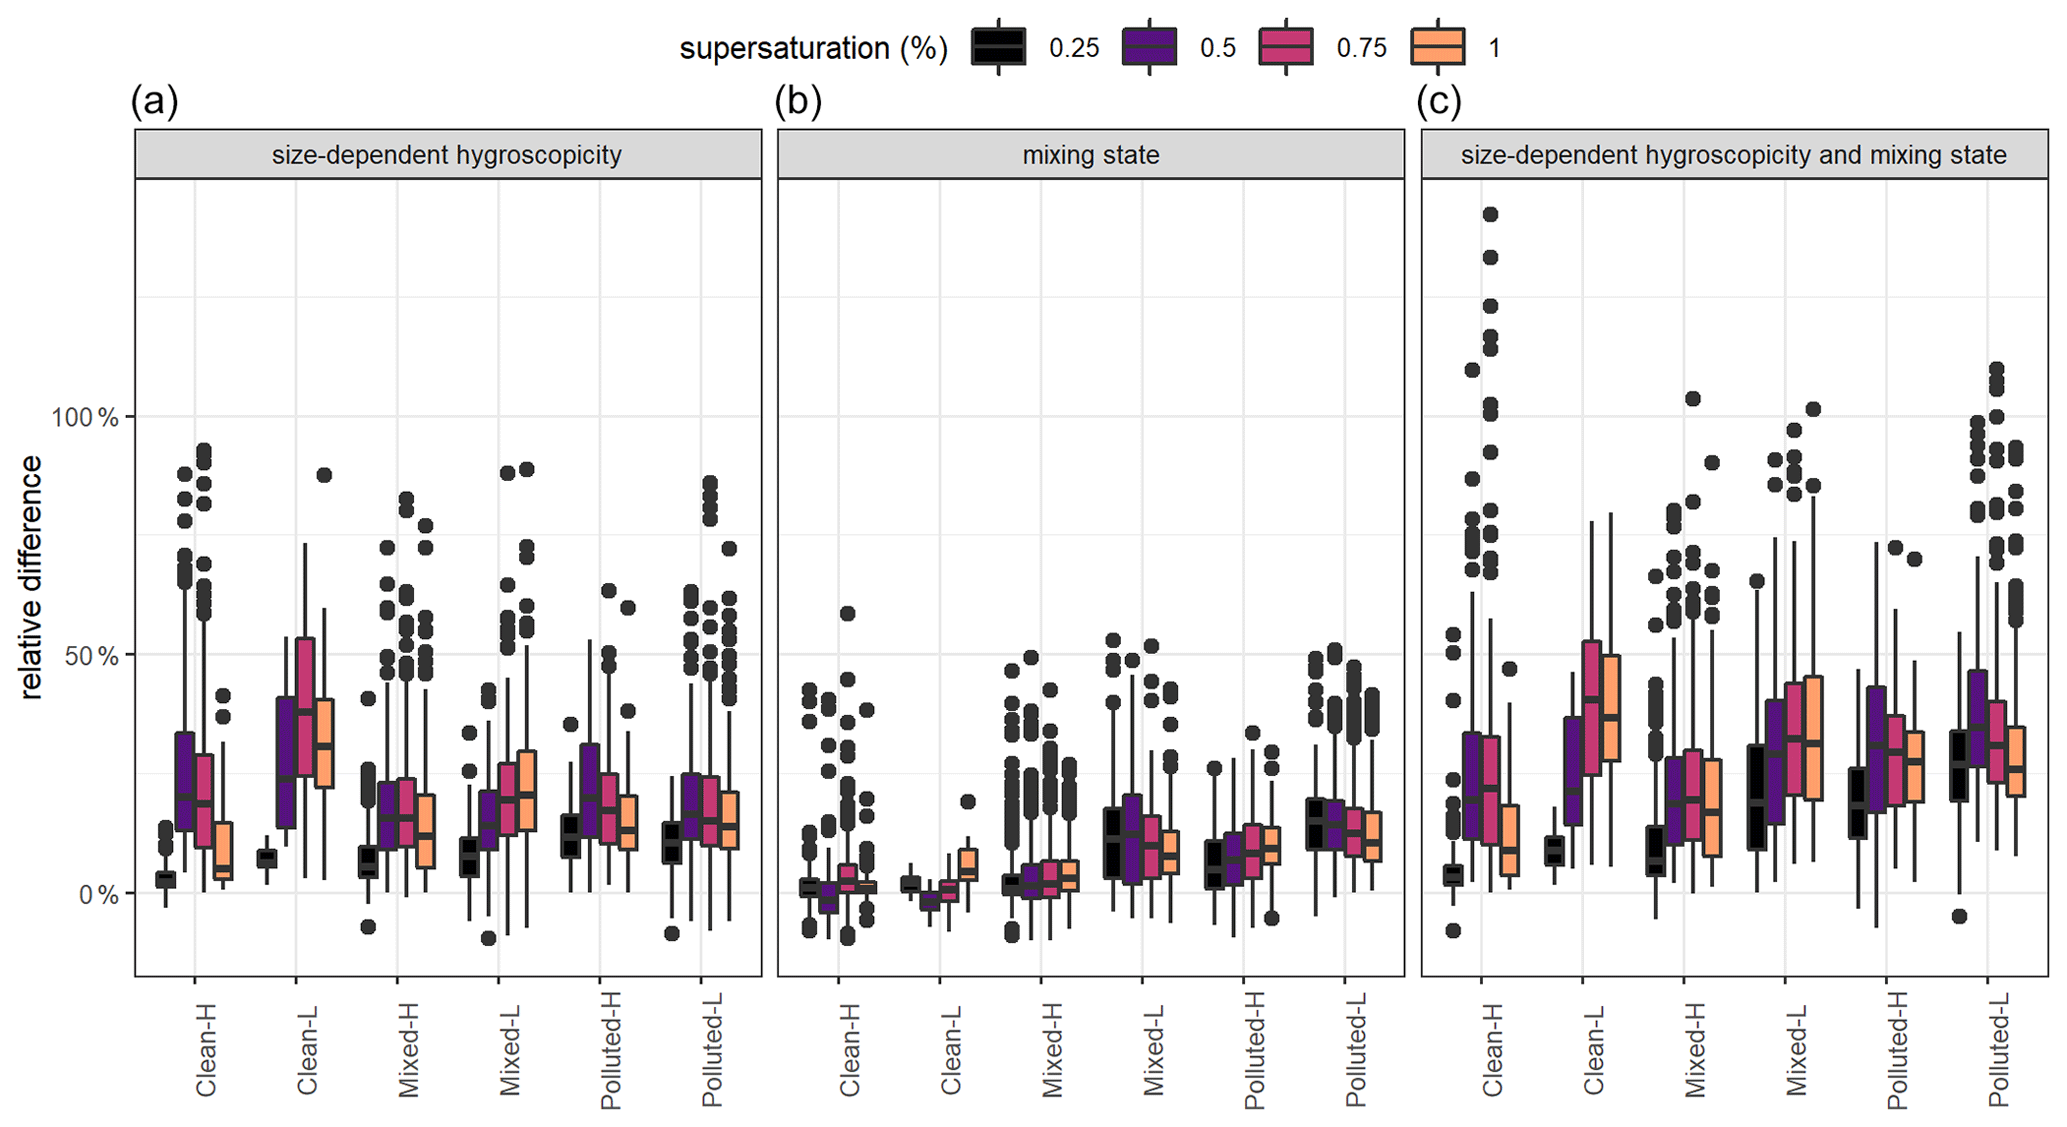
Figure 6The relative difference induced by ignoring size-dependent hygroscopicity (a), simplification of the aerosol as complete internal mixing state (b), total error in the first two assumptions (c). The lines represent medians, the boxes represent 25th to 75th quantiles, the whiskers represent the 1.5 interquartile, and the points represent outliers.
The impact of simplification of the aerosol population to a complete internal mixture on NCCN estimation was well recognised, however not well quantified. Lance et al. (2013) found that neglecting the mixing state leads to overestimation of CCN concentration during morning rush hour in greater Mexico City. To access the effect of internal mixing, studies often assumed that the chemical species were externally mixed (Ren et al., 2018; Zhang et al., 2020). The relative difference between method C and method F provided quantitative assessment of the error introduced by the assumption of internal mixing. As shown in Fig. 6 (middle), the assumption of complete internal mixing did not induce a significant relative difference in the clean sector (including Clean-H and Clean-L) due to (1) clean sector aerosols being relatively internally mixed (compared to the polluted sector) and (2) the high hygroscopicity of aerosol in the clean sector (compared to pure organics). The median relative difference caused by the assumption of complete internal mixing was relatively smaller for Clean-H, suggesting that the Clean-L had a higher degree of external mixing. Such external mixing resulted from the near-hydrophobic particle type in Clean-L as noted several times (Xu et al., 2020). The impact of the mixing state varied at different SS. In the Polluted-H, the relative difference induced by the mixing state increased with increasing SS, while in the Polluted-L the relative difference by mixing state decreased with increasing SS. The seasonal pattern of the impact of mixing state to polluted air masses was similar to a previous study (Wang et al., 2010). As shown in Fig. 6 (middle), the median relative difference induced by the mixing state was within ±5 % for Clean-H, Clean-L and Mixed-H. As expected, the relative difference induced by mixing state was high in Polluted-H, Polluted-L and Mixed-L. The highest median relative difference of 13 % was observed in Polluted-L. The impact of mixing state in the polluted sector decreased with increasing SS, which is similar to a previous study conducted at the HKUST Supersite (Meng et al., 2014).
A general conclusion can be drawn that the mixing state matters more at low SS, while size-dependent hygroscopicity was crucial at higher SS. Since the negligence of size-dependent hygroscopicity and the assumption of an internal mixture are commonly adapted practices, the total relative difference was considered to be an upper limit for the NCCN error, at least at the current sampling location. As shown in Fig. 6 (right), the error introduced by the two assumptions was relatively small in the clean sector as it resulted in less than 5 % deviation between measured and estimated NCCN at low SS (0.25 %) in Clean-H and up to 10 % deviation in Clean-L. At higher SS, these two assumptions added up to over 45 % error in Clean-L and 20 % in Clean-H. In contrast, it resulted in up to 30 % error at low SS and 17 % at high SS in the polluted sector. The effect was less evident with increasing SS, pointing to the fact that the size plays a more important role in CCN activation at high SS.
4.2.4 The effectiveness of method E
In principle, method E was a simplified version of method F, which aimed at reducing the computational complexity while preserving the information of mixing state. Additionally, the data of these hygroscopic modes were commonly reported in previous studies. To evaluate the representativeness of the mixing state by three hygroscopic growth modes versus the mixing state represented by GF–PDF, the relative differences between method E and method F were considered by the following ratio:
where NCCN D−NCCN F is the difference in NCCN between method D and F, which represents the error in NCCN caused by assuming the complete internal mixture, while NCCN D−NCCN E is the difference in NCCN between method D and E, which represents the NCCN that was corrected by using three hygroscopicity modes. The ratio in Eq. (18) of 100 % suggests that three modes can represent the full GF–PDF pretty accurately, and a value of 0 % suggests that the three-mode method cannot represent the GF–PDF at all.
As shown in Fig. 7, for the Clean-L, the median values were highest at 1 % SS, which is consistent with our previous observations showing that the Aitken mode of marine aerosols in wintertime was the external mixture of species. For the Polluted-H and Polluted-L, reducing the full GF–PDF into three modes can diminish the error by up to 50 % when mixing state was completely ignored.
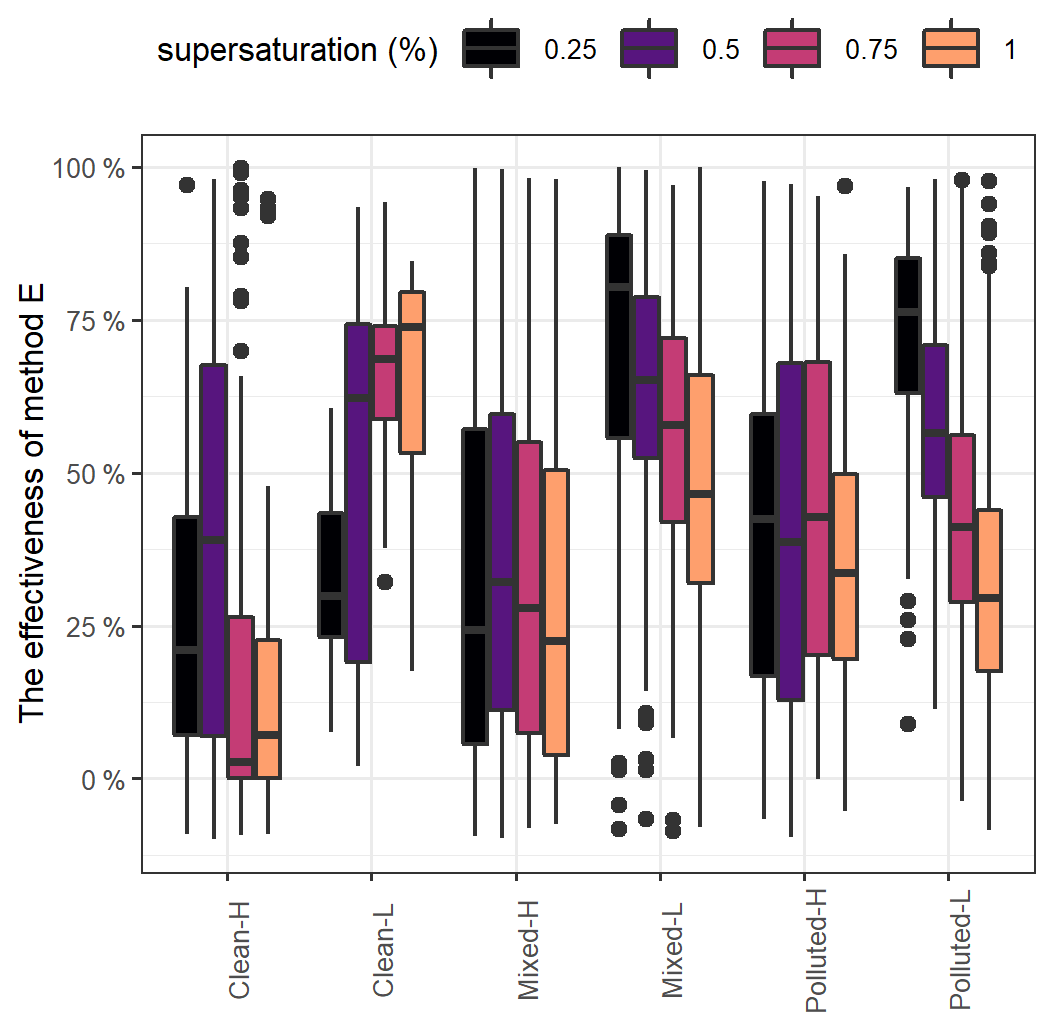
Figure 7The effectiveness of the three hygroscopicity modes (method E) in the real mixing state scenario (method F), as defined in Eq. (18). The lines represent medians, the boxes represent 25th to 75th quantiles, the whiskers represent the 1.5 interquartile, and the points represent outliers.
In general, the median value of the effectiveness of method E decreased with increasing SS, which suggested the increasing fraction of completely hydrophobic species in smaller size ranges, except for Clean-L, in which the effectiveness increased with increasing SS. When compared to a CCN closure study in a polluted region in China (Ren et al., 2018), the estimated NCCN using bulk composition is higher than NCCN using size-resolved composition by less than 5 %, while the assumption of an internal mixture induced an error of about 40 % to 50 %. During the study in Mexico City, Wang et al. (2010) found ∼20 % deviation by assuming an internal mixture and using bulk chemical composition. A study conducted by Wex et al. (2010) compiled data of different aerosol types and concluded that for aerosol populations with a contribution of the less-hygroscopic mode of over 50 %, the NCCN can be overestimated by 100 % by assuming an internal mixture. The above study also concluded that the fraction of the less-hygroscopic mode is important when the NCCN was calculated by measured aerosol number size distribution and particle hygroscopicity. In the Polluted-L of the current study, the number fraction of near-hydrophobic-mode particles (GF < 1.3) was lower, leading to a smaller overestimation. The smaller overestimation by assuming a complete internal mixture might be due to the lack of hydrocarbon-producing sources from the sampling location.
A reductionist approach is commonly applied to reduce the complexity of aerosol processes and properties. Simplifications, approximations and parameterisations are at the heart of every atmospheric model; however, those should not go beyond realistic representation of aerosol population and should have limited associated uncertainties. Several reductionist methods were applied to calculate NCCN based on different assumptions of mixing state or size-dependent hygroscopicity. Generally, good agreement was found using either AMS or HTDMA data, and the Pearson's R value between estimated NCCN and measured NCCN ranged from 0.65 to 0.97 depending on air mass type and the supersaturation level. This study not only provided a quantified evaluation of NCCN estimation based on AMS and HTDMA measurement but also evaluated the impact of size-dependent hygroscopicity and the assumption of internal mixing on predicting NCCN, which led to several key conclusions. Firstly, using a constant κ of 0.3 leads to underestimation, except in Polluted-L conditions. Bulk PM1 chemical composition and sub-saturated hygroscopicity can be used to estimate NCCN within the range of measurement uncertainty. Secondly, the closure results were poorest in low SS; therefore careful considerations should be taken at low SS. Thirdly, the impact of size-dependent hygroscopicity and mixing state in terms of the relative error could be as high as 50 % in Clean-L and about 25 % in the polluted sector. The relative difference induced by the assumption of internal mixing was typically less than 25 % due to the lack of nearby fresh emission sources at MHD. Lastly, a reduction of a full GF–PDF representation to the three basic hygroscopicity modes reduces the error caused by assuming a complete internal mixture (method D) by up to 80 %, especially in the polluted sector.
The data used in the analysis are published in the Mendeley digital repository, which can be accessed at http://doi.org/10.17632/3dx6pnx869.1 (Xu et al., 2021).
The supplement related to this article is available online at: https://doi.org/10.5194/acp-21-8655-2021-supplement.
WX and KNF conceived the study and analysed the data. JO provided the AMS data. WX, KNF and DC wrote the manuscript with input from all the authors.
The authors declare that they have no conflict of interest.
This work is supported by EPA-Ireland (AEROSOURCE, 2016-CCRP-MS-31); the COST Action CA16109 (COLOSSAL); and MaREI, the SFI Research Centre for Energy, Climate, and Marine (grant no. 12/RC/2302_P2). Jakub Bialek is acknowledged for running HTDMA and CCN in Mace Head. The Chinese Scholarship Council (no. 201706310154) is acknowledged for supporting Wei Xu financially.
This research has been supported by the China Scholarship Council (grant no. 201706310154), the Environmental Protection Agency (grant no. AEROSOURCE, 2016-CCRP-MS-31), the COST Action CA16109 (COLOSSAL), and the Science Foundation Ireland (Research Centre for Energy, Climate and Marine research and innovation; grant no. 12/RC/2302_P2).
This paper was edited by Alexander Laskin and reviewed by two anonymous referees.
Alfarra, M. R., Paulsen, D., Gysel, M., Garforth, A. A., Dommen, J., Prévôt, A. S. H., Worsnop, D. R., Baltensperger, U., and Coe, H.: A mass spectrometric study of secondary organic aerosols formed from the photooxidation of anthropogenic and biogenic precursors in a reaction chamber, Atmos. Chem. Phys., 6, 5279–5293, https://doi.org/10.5194/acp-6-5279-2006, 2006.
Bhattu, D. and Tripathi, S. N.: CCN closure study: Effects of aerosol chemical composition and mixing state, J. Geophys. Res.-Atmos., 120, 766–783, https://doi.org/10.1002/2014jd021978, 2015.
Bialek, J., Dall Osto, M., Monahan, C., Beddows, D., and O'Dowd, C. D.: On the contribution of organics to the North East Atlantic aerosol number concentration, Environ. Res. Lett., 7, 044013, https://doi.org/10.1088/1748-9326/7/4/044013, 2012.
Cai, M., Tan, H., Chan, C. K., Qin, Y., Xu, H., Li, F., Schurman, M. I., Liu, L., and Zhao, J.: The size-resolved cloud condensation nuclei (CCN) activity and its prediction based on aerosol hygroscopicity and composition in the Pearl Delta River (PRD) region during wintertime 2014, Atmos. Chem. Phys., 18, 16419–16437, https://doi.org/10.5194/acp-18-16419-2018, 2018.
Carrico, C. M., Petters, M. D., Kreidenweis, S. M., Collett Jr., J. L., Engling, G., and Malm, W. C.: Aerosol hygroscopicity and cloud droplet activation of extracts of filters from biomass burning experiments, J. Geophys. Res.-Atmos., 113, D08206, https://doi.org/10.1029/2007JD009274, 2008.
Carslaw, K. S., Lee, L. A., Reddington, C. L., Pringle, K. J., Rap, A., Forster, P. M., Mann, G. W., Spracklen, D. V., Woodhouse, M. T., Regayre, L. A., and Pierce, J. R.: Large contribution of natural aerosols to uncertainty in indirect forcing, Nature, 503, 67–71, https://doi.org/10.1038/nature12674, 2013.
Cerully, K. M., Raatikainen, T., Lance, S., Tkacik, D., Tiitta, P., Petäjä, T., Ehn, M., Kulmala, M., Worsnop, D. R., Laaksonen, A., Smith, J. N., and Nenes, A.: Aerosol hygroscopicity and CCN activation kinetics in a boreal forest environment during the 2007 EUCAARI campaign, Atmos. Chem. Phys., 11, 12369–12386, https://doi.org/10.5194/acp-11-12369-2011, 2011.
Chang, R. Y.-W., Slowik, J. G., Shantz, N. C., Vlasenko, A., Liggio, J., Sjostedt, S. J., Leaitch, W. R., and Abbatt, J. P. D.: The hygroscopicity parameter (κ) of ambient organic aerosol at a field site subject to biogenic and anthropogenic influences: relationship to degree of aerosol oxidation, Atmos. Chem. Phys., 10, 5047–5064, https://doi.org/10.5194/acp-10-5047-2010, 2010.
Ching, J., Fast, J., West, M., and Riemer, N.: Metrics to quantify the importance of mixing state for CCN activity, Atmos. Chem. Phys., 17, 7445–7458, https://doi.org/10.5194/acp-17-7445-2017, 2017.
Ching, J., Adachi, K., Zaizen, Y., Igarashi, Y., and Kajino, M.: Aerosol mixing state revealed by transmission electron microscopy pertaining to cloud formation and human airway deposition, NPJ Climate and Atmospheric Science, 2, 22, https://doi.org/10.1038/s41612-019-0081-9, 2019.
Dall'Osto, M., Ceburnis, D., Martucci, G., Bialek, J., Dupuy, R., Jennings, S. G., Berresheim, H., Wenger, J., Healy, R., Facchini, M. C., Rinaldi, M., Giulianelli, L., Finessi, E., Worsnop, D., Ehn, M., Mikkilä, J., Kulmala, M., and O'Dowd, C. D.: Aerosol properties associated with air masses arriving into the North East Atlantic during the 2008 Mace Head EUCAARI intensive observing period: an overview, Atmos. Chem. Phys., 10, 8413–8435, https://doi.org/10.5194/acp-10-8413-2010, 2010.
Davies, J. F., Zuend, A., and Wilson, K. R.: Technical note: The role of evolving surface tension in the formation of cloud droplets, Atmos. Chem. Phys., 19, 2933–2946, https://doi.org/10.5194/acp-19-2933-2019, 2019.
DeCarlo, P. F., Kimmel, J. R., Trimborn, A., Northway, M. J., Jayne, J. T., Aiken, A. C., Gonin, M., Fuhrer, K., Horvath, T., Docherty, K. S., Worsnop, D. R., and Jimenez, J. L.: Field-Deployable, High-Resolution, Time-of-Flight Aerosol Mass Spectrometer, Anal. Chem., 78, 8281–8289, https://doi.org/10.1021/ac061249n, 2006.
Duplissy, J., Gysel, M., Alfarra, M. R., Dommen, J., Metzger, A., Prevot, A. S. H., Weingartner, E., Laaksonen, A., Raatikainen, T., Good, N., Turner, S. F., McFiggans, G., and Baltensperger, U.: Cloud forming potential of secondary organic aerosol under near atmospheric conditions, Geophys. Res. Lett., 35, L03818, https://doi.org/10.1029/2007gl031075, 2008.
Duplissy, J., Gysel, M., Sjogren, S., Meyer, N., Good, N., Kammermann, L., Michaud, V., Weigel, R., Martins dos Santos, S., Gruening, C., Villani, P., Laj, P., Sellegri, K., Metzger, A., McFiggans, G. B., Wehrle, G., Richter, R., Dommen, J., Ristovski, Z., Baltensperger, U., and Weingartner, E.: Intercomparison study of six HTDMAs: results and recommendations, Atmos. Meas. Tech., 2, 363–378, https://doi.org/10.5194/amt-2-363-2009, 2009.
Duplissy, J., DeCarlo, P. F., Dommen, J., Alfarra, M. R., Metzger, A., Barmpadimos, I., Prevot, A. S. H., Weingartner, E., Tritscher, T., Gysel, M., Aiken, A. C., Jimenez, J. L., Canagaratna, M. R., Worsnop, D. R., Collins, D. R., Tomlinson, J., and Baltensperger, U.: Relating hygroscopicity and composition of organic aerosol particulate matter, Atmos. Chem. Phys., 11, 1155–1165, https://doi.org/10.5194/acp-11-1155-2011, 2011.
Dusek, U., Frank, G., Hildebrandt, L., Curtius, J., Schneider, J., Walter, S., Chand, D., Drewnick, F., Hings, S., Jung, D., Borrmann, S., and Andreae, M. O.: Size matters more than chemistry for cloud-nucleating ability of aerosol particles, Science, 312, 1375–1378, 2006.
Ervens, B., Cubison, M. J., Andrews, E., Feingold, G., Ogren, J. A., Jimenez, J. L., Quinn, P. K., Bates, T. S., Wang, J., Zhang, Q., Coe, H., Flynn, M., and Allan, J. D.: CCN predictions using simplified assumptions of organic aerosol composition and mixing state: a synthesis from six different locations, Atmos. Chem. Phys., 10, 4795–4807, https://doi.org/10.5194/acp-10-4795-2010, 2010.
Fossum, K. N., Ovadnevaite, J., Ceburnis, D., Dall'Osto, M., Marullo, S., Bellacicco, M., Simó, R., Liu, D., Flynn, M., Zuend, A., and O'Dowd, C.: Summertime Primary and Secondary Contributions to Southern Ocean Cloud Condensation Nuclei, Sci. Rep.-UK, 8, 13844, https://doi.org/10.1038/s41598-018-32047-4, 2018.
Good, N., Topping, D. O., Allan, J. D., Flynn, M., Fuentes, E., Irwin, M., Williams, P. I., Coe, H., and McFiggans, G.: Consistency between parameterisations of aerosol hygroscopicity and CCN activity during the RHaMBLe discovery cruise, Atmos. Chem. Phys., 10, 3189–3203, https://doi.org/10.5194/acp-10-3189-2010, 2010.
Gysel, M., Crosier, J., Topping, D. O., Whitehead, J. D., Bower, K. N., Cubison, M. J., Williams, P. I., Flynn, M. J., McFiggans, G. B., and Coe, H.: Closure study between chemical composition and hygroscopic growth of aerosol particles during TORCH2, Atmos. Chem. Phys., 7, 6131–6144, https://doi.org/10.5194/acp-7-6131-2007, 2007.
Gysel, M., McFiggans, G., and Coe, H.: Inversion of tandem differential mobility analyser (TDMA) measurements, J. Aerosol Sci., 40, 134–151, https://doi.org/10.1016/j.jaerosci.2008.07.013, 2009.
Hämeri, K., Väkevä, M., Aalto, P., Kulmala, M., Swietlicki, E., Zhou, J., Seidl, W., Becker, E., and O'Dowd, C.: Hygroscopic and CCN properties of aerosol particles in boreal forests, Tellus B, 53, 359–379, 2001.
Hansen, A. M. K., Hong, J., Raatikainen, T., Kristensen, K., Ylisirniö, A., Virtanen, A., Petäjä, T., Glasius, M., and Prisle, N. L.: Hygroscopic properties and cloud condensation nuclei activation of limonene-derived organosulfates and their mixtures with ammonium sulfate, Atmos. Chem. Phys., 15, 14071–14089, https://doi.org/10.5194/acp-15-14071-2015, 2015.
Hong, J., Häkkinen, S. A. K., Paramonov, M., Äijälä, M., Hakala, J., Nieminen, T., Mikkilä, J., Prisle, N. L., Kulmala, M., Riipinen, I., Bilde, M., Kerminen, V.-M., and Petäjä, T.: Hygroscopicity, CCN and volatility properties of submicron atmospheric aerosol in a boreal forest environment during the summer of 2010, Atmos. Chem. Phys., 14, 4733–4748, https://doi.org/10.5194/acp-14-4733-2014, 2014.
IPCC: Climate Change 2013: The Physical Science Basis. Contribution of Working Group I to the Fifth Assessment Report of the Intergovernmental Panel on Climate Change, edited by: Stocker, T. F., Qin, D., Plattner, G.-K., Tignor, M., Allen, S. K., Boschung, J., Nauels, A., Xia, Y., Bex, V., and Midgley, P. M., Cambridge University Press, Cambridge, United Kingdom and New York, NY, USA, 1535 pp, 2013.
Jimenez, J. L., Canagaratna, M. R., Donahue, N. M., Prevot, A. S. H., Zhang, Q., Kroll, J. H., DeCarlo, P. F., Allan, J. D., Coe, H., Ng, N. L., Aiken, A. C., Docherty, K. S., Ulbrich, I. M., Grieshop, A. P., Robinson, A. L., Duplissy, J., Smith, J. D., Wilson, K. R., Lanz, V. A., Hueglin, C., Sun, Y., Tian, J., Laaksonen, A., Raatikainen, T., Rautiainen, J., Vaattovaara, P., Ehn, M., Kulmala, M., Tomlinson, J. M., Collins, D. R., Cubison, M. J., E., Dunlea, J., Huffman, J. A., Onasch, T. B., Alfarra, M. R., Williams, P. I., Bower, K., Kondo, Y., Schneider, J., Drewnick, F., Borrmann, S., Weimer, S., Demerjian, K., Salcedo, D., Cottrell, L., Griffin, R., Takami, A., Miyoshi, T., Hatakeyama, S., Shimono, A., Sun, J. Y., Zhang, Y. M., Dzepina, K., Kimmel, J. R., Sueper, D., Jayne, J. T., Herndon, S. C., Trimborn, A. M., Williams, L. R., Wood, E. C., Middlebrook, A. M., Kolb, C. E., Baltensperger, U., and Worsnop, D. R.: Evolution of Organic Aerosols in the Atmosphere, Science, 326, 1525–1529, https://doi.org/10.1126/science.1180353, 2009.
Jurányi, Z., Gysel, M., Weingartner, E., DeCarlo, P. F., Kammermann, L., and Baltensperger, U.: Measured and modelled cloud condensation nuclei number concentration at the high alpine site Jungfraujoch, Atmos. Chem. Phys., 10, 7891–7906, https://doi.org/10.5194/acp-10-7891-2010, 2010.
Jurányi, Z., Tritscher, T., Gysel, M., Laborde, M., Gomes, L., Roberts, G., Baltensperger, U., and Weingartner, E.: Hygroscopic mixing state of urban aerosol derived from size-resolved cloud condensation nuclei measurements during the MEGAPOLI campaign in Paris, Atmos. Chem. Phys., 13, 6431–6446, https://doi.org/10.5194/acp-13-6431-2013, 2013.
Kammermann, L., Gysel, M., Weingartner, E., Herich, H., Cziczo, D. J., Holst, T., Svenningsson, B., Arneth, A., and Baltensperger, U.: Subarctic atmospheric aerosol composition: 3. Measured and modeled properties of cloud condensation nuclei, J. Geophys. Res.-Atmos., 115, D04202, https://doi.org/10.1029/2009jd012447, 2010.
Kawana, K., Nakayama, T., and Mochida, M.: Hygroscopicity and CCN activity of atmospheric aerosol particles and their relation to organics: Characteristics of urban aerosols in Nagoya, Japan, J. Geophys. Res.-Atmos., 121, 4100–4121, https://doi.org/10.1002/2015jd023213, 2016.
Kiendler-Scharr, A., Mensah, A. A., Friese, E., Topping, D., Nemitz, E., Prevot, A. S. H., Äijälä, M., Allan, J., Canonaco, F., Canagaratna, M., Carbone, S., Crippa, M., Osto, M. D., Day, D. A., Carlo, P. D., Marco, C. F. D., Elbern, H., Eriksson, A., Freney, E., Hao, L., Herrmann, H., Hildebrandt, L., Hillamo, R., Jimenez, J. L., Laaksonen, A., McFiggans, G., Mohr, C., O'Dowd, C., Otjes, R., Ovadnevaite, J., Pandis, S. N., Poulain, L., Schlag, P., Sellegri, K., Swietlicki, E., Tiitta, P., Vermeulen, A., Wahner, A., Worsnop, D., and Wu, H.-C.: Ubiquity of organic nitrates from nighttime chemistry in the European submicron aerosol, Geophys. Res. Lett., 43, 7735–7744, https://doi.org/10.1002/2016gl069239, 2016.
Kim, J. H., Yum, S. S., Shim, S., Yoon, S.-C., Hudson, J. G., Park, J., and Lee, S.-J.: On aerosol hygroscopicity, cloud condensation nuclei (CCN) spectra and critical supersaturation measured at two remote islands of Korea between 2006 and 2009, Atmos. Chem. Phys., 11, 12627–12645, https://doi.org/10.5194/acp-11-12627-2011, 2011.
Köhler, H.: The nucleus in and the growth of hygroscopic droplets, T. Faraday Soc., 32, 1152–1161, 1936.
Lance, S., Raatikainen, T., Onasch, T. B., Worsnop, D. R., Yu, X.-Y., Alexander, M. L., Stolzenburg, M. R., McMurry, P. H., Smith, J. N., and Nenes, A.: Aerosol mixing state, hygroscopic growth and cloud activation efficiency during MIRAGE 2006, Atmos. Chem. Phys., 13, 5049–5062, https://doi.org/10.5194/acp-13-5049-2013, 2013.
Liu, B. Y. H., Pui, D. Y. H., Whitby, K. T., Kittelson, D. B., Kousaka, Y., and McKenzie, R. L.: The aerosol mobility chromatograph: a new detectoer for sulfuric acid aerosols, Atmos. Environ., 12, 99–104, https://doi.org/10.1016/0004-6981(78)90192-0, 1978.
Liu, P., Song, M., Zhao, T., Gunthe, S. S., Ham, S., He, Y., Qin, Y. M., Gong, Z., Amorim, J. C., Bertram, A. K., and Martin, S. T.: Resolving the mechanisms of hygroscopic growth and cloud condensation nuclei activity for organic particulate matter, Nat. Commun., 9, 4076, https://doi.org/10.1038/s41467-018-06622-2, 2018.
Martin, M., Chang, R. Y.-W., Sierau, B., Sjogren, S., Swietlicki, E., Abbatt, J. P. D., Leck, C., and Lohmann, U.: Cloud condensation nuclei closure study on summer arctic aerosol, Atmos. Chem. Phys., 11, 11335–11350, https://doi.org/10.5194/acp-11-11335-2011, 2011.
Massoli, P., Lambe, A. T., Ahern, A. T., Williams, L. R., Ehn, M., Mikkila, J., Canagaratna, M. R., Brune, W. H., Onasch, T. B., Jayne, J. T., Petaja, T., Kulmala, M., Laaksonen, A., Kolb, C. E., Davidovits, P., and Worsnop, D. R.: Relationship between aerosol oxidation level and hygroscopic properties of laboratory generated secondary organic aerosol (SOA) particles, Geophys. Res. Lett., 37, L24801, https://doi.org/10.1029/2010gl045258, 2010.
Meng, J. W., Yeung, M. C., Li, Y. J., Lee, B. Y. L., and Chan, C. K.: Size-resolved cloud condensation nuclei (CCN) activity and closure analysis at the HKUST Supersite in Hong Kong, Atmos. Chem. Phys., 14, 10267–10282, https://doi.org/10.5194/acp-14-10267-2014, 2014.
Middlebrook, A. M., Bahreini, R., Jimenez, J. L., and Canagaratna, M. R.: Evaluation of composition-dependent collection efficiencies for the aerodyne aerosol mass spectrometer using field data, Aerosol Sci. Tech., 46, 258–271, 2012.
Mochida, M., Nishita-Hara, C., Furutani, H., Miyazaki, Y., Jung, J., Kawamura, K., and Uematsu, M.: Hygroscopicity and cloud condensation nucleus activity of marine aerosol particles over the western North Pacific, J. Geophys. Res.-Atmos., 116, D06204, https://doi.org/10.1029/2010jd014759, 2011.
Nakao, S.: Why would apparent κ linearly change with O/C? Assessing the role of volatility, solubility, and surface activity of organic aerosols, Aerosol Sci. Tech., 51, 1377–1388, 2017.
Nenes, A., Pandis, S. N., and Pilinis, C.: ISORROPIA: A new thermodynamic equilibrium model for multiphase multicomponent inorganic aerosols, Aquat. Geochem., 4, 123–152, 1998.
O'Connor, T. C., Jennings, S. G., and O'Dowd, C. D.: Highlights of fifty years of atmospheric aerosol research at Mace Head, Atmos. Res., 90, 338–355, https://doi.org/10.1016/j.atmosres.2008.08.014, 2008.
O'Dowd, C., Monahan, C., and Dall'Osto, M.: On the occurrence of open ocean particle production and growth events, Geophys. Res. Lett., 37, L19805, https://doi.org/10.1029/2010gl044679, 2010.
O'Dowd, C., Ceburnis, D., Ovadnevaite, J., Vaishya, A., Rinaldi, M., and Facchini, M. C.: Do anthropogenic, continental or coastal aerosol sources impact on a marine aerosol signature at Mace Head?, Atmos. Chem. Phys., 14, 10687–10704, https://doi.org/10.5194/acp-14-10687-2014, 2014.
O'Dowd, C. D., Facchini, M. C., Cavalli, F., Ceburnis, D., Mircea, M., Decesari, S., Fuzzi, S., Yoon, Y. J., and Putaud, J.-P.: Biogenically driven organic contribution to marine aerosol, Nature, 431, 676–680, https://doi.org/10.1038/nature02959, 2004.
Ovadnevaite, J., Ceburnis, D., Martucci, G., Bialek, J., Monahan, C., Rinaldi, M., Facchini, M. C., Berresheim, H., Worsnop, D. R., and O'Dowd, C. D.: Primary marine organic aerosol: A dichotomy of low hygroscopicity and high CCN activity, Geophys. Res. Lett., 38, L21806, https://doi.org/10.1029/2011gl048869, 2011.
Ovadnevaite, J., Ceburnis, D., Canagaratna, M., Berresheim, H., Bialek, J., Martucci, G., Worsnop, D. R., and O'Dowd, C. D.: On the effect of wind speed on submicron sea salt mass concentrations and source fluxes, J. Geophys. Res.-Atmos., 117, D16201, https://doi.org/10.1029/2011jd017379, 2012.
Ovadnevaite, J., Ceburnis, D., Leinert, S., Dall'Osto, M., Canagaratna, M., O'Doherty, S., Berresheim, H., and O'Dowd, C. D.: Submicron NE Atlantic marine aerosol chemical composition and abundance: Seasonal trends and air mass categorization, J. Geophys. Res.-Atmos., 119, 11850–11863, https://doi.org/10.1002/2013jd021330, 2014.
Ovadnevaite, J., Zuend, A., Laaksonen, A., Sanchez, K. J., Roberts, G., Ceburnis, D., Decesari, S., Rinaldi, M., Hodas, N., Facchini, M. C., Seinfeld, J. H., and O'Dowd, C.: Surface tension prevails over solute effect in organic-influenced cloud droplet activation, Nature, 546, 637–641, https://doi.org/10.1038/nature22806, 2017.
Petters, M. D. and Kreidenweis, S. M.: A single parameter representation of hygroscopic growth and cloud condensation nucleus activity, Atmos. Chem. Phys., 7, 1961–1971, https://doi.org/10.5194/acp-7-1961-2007, 2007.
Petters, M. D. and Kreidenweis, S. M.: A single parameter representation of hygroscopic growth and cloud condensation nucleus activity – Part 2: Including solubility, Atmos. Chem. Phys., 8, 6273–6279, https://doi.org/10.5194/acp-8-6273-2008, 2008.
Petters, M. D. and Kreidenweis, S. M.: A single parameter representation of hygroscopic growth and cloud condensation nucleus activity – Part 3: Including surfactant partitioning, Atmos. Chem. Phys., 13, 1081–1091, https://doi.org/10.5194/acp-13-1081-2013, 2013.
Petzold, A. and Schönlinner, M.: Multi-angle absorption photometry: A new method for the measurement of aerosol light absorption and atmospheric black carbon, J. Aerosol Sci., 35, 421–441, 2004.
Pringle, K. J., Tost, H., Pozzer, A., Pöschl, U., and Lelieveld, J.: Global distribution of the effective aerosol hygroscopicity parameter for CCN activation, Atmos. Chem. Phys., 10, 5241–5255, https://doi.org/10.5194/acp-10-5241-2010, 2010.
Rader, D. and McMurry, P. H.: Application of the tandem differential mobility analyzer to studies of droplet growth or evaporation, J. Aerosol Sci., 17, 771–787, 1986.
Reade, L., Jennings, S., and McSweeney, G.: Cloud condensation nuclei measurements at Mace Head, Ireland, over the period 1994–2002, Atmos. Res., 82, 610–621, 2006.
Ren, J., Zhang, F., Wang, Y., Collins, D., Fan, X., Jin, X., Xu, W., Sun, Y., Cribb, M., and Li, Z.: Using different assumptions of aerosol mixing state and chemical composition to predict CCN concentrations based on field measurements in urban Beijing, Atmos. Chem. Phys., 18, 6907–6921, https://doi.org/10.5194/acp-18-6907-2018, 2018.
Riemer, N., Ault, A. P., West, M., Craig, R. L., and Curtis, J. H.: Aerosol Mixing State: Measurements, Modeling, and Impacts, Rev. Geophys., 57, 187–249, https://doi.org/10.1029/2018rg000615, 2019.
Roberts, G. and Nenes, A.: A continuous-flow streamwise thermal-gradient CCN chamber for atmospheric measurements, Aerosol Sci. Tech., 39, 206–221, 2005.
Rose, D., Gunthe, S. S., Mikhailov, E., Frank, G. P., Dusek, U., Andreae, M. O., and Pöschl, U.: Calibration and measurement uncertainties of a continuous-flow cloud condensation nuclei counter (DMT-CCNC): CCN activation of ammonium sulfate and sodium chloride aerosol particles in theory and experiment, Atmos. Chem. Phys., 8, 1153–1179, https://doi.org/10.5194/acp-8-1153-2008, 2008.
Rose, D., Nowak, A., Achtert, P., Wiedensohler, A., Hu, M., Shao, M., Zhang, Y., Andreae, M. O., and Pöschl, U.: Cloud condensation nuclei in polluted air and biomass burning smoke near the mega-city Guangzhou, China – Part 1: Size-resolved measurements and implications for the modeling of aerosol particle hygroscopicity and CCN activity, Atmos. Chem. Phys., 10, 3365–3383, https://doi.org/10.5194/acp-10-3365-2010, 2010.
Ruehl, C. R., Davies, J. F., and Wilson, K. R.: An interfacial mechanism for cloud droplet formation on organic aerosols, Science, 351, 1447–1450, 2016.
Saliba, G., Chen, C.-L., Lewis, S., Russell, L. M., Quinn, P. K., Bates, T. S., Bell, T. G., Lawler, M. J., Saltzman, E. S., Sanchez, K. J., Moore, R., Shook, M., Rivellinin, L.-H., Lee, A., Baetge, N., Carlson, C. A., and Behrenfeld, M. J.: Seasonal Differences and Variability of Concentrations, Chemical Composition, and Cloud Condensation Nuclei of Marine Aerosol over the North Atlantic, J. Geophys. Res.-Atmos., 125, e2020JD033145, https://doi.org/10.1029/2020JD033145, 2020.
Schmale, J., Henning, S., Henzing, B., Keskinen, H., Sellegri, K., Ovadnevaite, J., Bougiatioti, A., Kalivitis, N., Stavroulas, I., Jefferson, A., Park, M., Schlag, P., Kristensson, A., Iwamoto, Y., Pringle, K., Reddington, C., Aalto, P., Äijälä, M., Baltensperger, U., Bialek, J., Birmili, W., Bukowiecki, N., Ehn, M., Fjæraa, A. M., Fiebig, M., Frank, G., Fröhlich, R., Frumau, A., Furuya, M., Hammer, E., Heikkinen, L., Herrmann, E., Holzinger, R., Hyono, H., Kanakidou, M., Kiendler-Scharr, A., Kinouchi, K., Kos, G., Kulmala, M., Mihalopoulos, N., Motos, G., Nenes, A., O'Dowd, C., Paramonov, M., Petäjä, T., Picard, D., Poulain, L., Prévôt, A. S. H., Slowik, J., Sonntag, A., Swietlicki, E., Svenningsson, B., Tsurumaru, H., Wiedensohler, A., Wittbom, C., Ogren, J. A., Matsuki, A., Yum, S. S., Myhre, C. L., Carslaw, K., Stratmann, F., and Gysel, M.: Collocated observations of cloud condensation nuclei, particle size distributions, and chemical composition, Scientific Data, 4, 170003, https://doi.org/10.1038/sdata.2017.3, 2017.
Schmale, J., Henning, S., Decesari, S., Henzing, B., Keskinen, H., Sellegri, K., Ovadnevaite, J., Pöhlker, M. L., Brito, J., Bougiatioti, A., Kristensson, A., Kalivitis, N., Stavroulas, I., Carbone, S., Jefferson, A., Park, M., Schlag, P., Iwamoto, Y., Aalto, P., Äijälä, M., Bukowiecki, N., Ehn, M., Frank, G., Fröhlich, R., Frumau, A., Herrmann, E., Herrmann, H., Holzinger, R., Kos, G., Kulmala, M., Mihalopoulos, N., Nenes, A., O'Dowd, C., Petäjä, T., Picard, D., Pöhlker, C., Pöschl, U., Poulain, L., Prévôt, A. S. H., Swietlicki, E., Andreae, M. O., Artaxo, P., Wiedensohler, A., Ogren, J., Matsuki, A., Yum, S. S., Stratmann, F., Baltensperger, U., and Gysel, M.: Long-term cloud condensation nuclei number concentration, particle number size distribution and chemical composition measurements at regionally representative observatories, Atmos. Chem. Phys., 18, 2853–2881, https://doi.org/10.5194/acp-18-2853-2018, 2018.
Stokes, R. and Robinson, R.: Interactions in aqueous nonelectrolyte solutions, I. Solute-solvent equilibria, J. Phys. Chem.-US, 70, 2126–2131, 1966.
Swietlicki, E., Hansson, H. C., Hämeri, K., Svenningsson, B., Massling, A., McFiggans, G., McMurry, P. H., Petaja, T., Tunved, P., Gysel, M., Topping, D. O., Weingartner, E., Baltensperger, U., Rissler, J., Wiedensohler, A., and Kulmala, M.: Hygroscopic properties of submicrometer atmospheric aerosol particles measured with H-TDMA instruments in various environments – a review, Tellus B, 60, 432–469, https://doi.org/10.1111/j.1600-0889.2008.00350.x, 2008.
Tang, M., Chan, C. K., Li, Y. J., Su, H., Ma, Q., Wu, Z., Zhang, G., Wang, Z., Ge, M., Hu, M., He, H., and Wang, X.: A review of experimental techniques for aerosol hygroscopicity studies, Atmos. Chem. Phys., 19, 12631–12686, https://doi.org/10.5194/acp-19-12631-2019, 2019a.
Tang, M., Guo, L., Bai, Y., Huang, R.-J., Wu, Z. J., Wang, Z., Zhang, G., Ding, X., Hu, M., and Wang, X.: Impacts of methanesulfonate on the cloud condensation nucleation activity of sea salt aerosol, Atmos. Environ., 201, 13–17, 2019b.
Topping, D. O., McFiggans, G. B., and Coe, H.: A curved multi-component aerosol hygroscopicity model framework: Part 1 – Inorganic compounds, Atmos. Chem. Phys., 5, 1205–1222, https://doi.org/10.5194/acp-5-1205-2005, 2005.
Twomey, S.: The influence of pollution on the shortwave albedo of clouds, J. Atmos. Sci., 34, 1149–1152, 1977.
Vaishya, A., Ovadnevaite, J., Bialek, J., Jennings, S. G., Ceburnis, D., and O'Dowd, C. D.: Bistable effect of organic enrichment on sea spray radiative properties, Geophys. Res. Lett., 40, 6395–6398, 2013.
Vogel, A. L., Schneider, J., Muller-Tautges, C., Klimach, T., and Hoffmann, T.: Aerosol chemistry resolved by mass spectrometry: Insights into particle growth after ambient new particle formation, Environ. Sci. Technol., 50, 10814–10822, 2016.
Wang, J., Cubison, M. J., Aiken, A. C., Jimenez, J. L., and Collins, D. R.: The importance of aerosol mixing state and size-resolved composition on CCN concentration and the variation of the importance with atmospheric aging of aerosols, Atmos. Chem. Phys., 10, 7267–7283, https://doi.org/10.5194/acp-10-7267-2010, 2010.
Wang, J., Shilling, J. E., Liu, J., Zelenyuk, A., Bell, D. M., Petters, M. D., Thalman, R., Mei, F., Zaveri, R. A., and Zheng, G.: Cloud droplet activation of secondary organic aerosol is mainly controlled by molecular weight, not water solubility, Atmos. Chem. Phys., 19, 941–954, https://doi.org/10.5194/acp-19-941-2019, 2019.
Wang, Y., Li, Z., Zhang, Y., Du, W., Zhang, F., Tan, H., Xu, H., Fan, T., Jin, X., Fan, X., Dong, Z., Wang, Q., and Sun, Y.: Characterization of aerosol hygroscopicity, mixing state, and CCN activity at a suburban site in the central North China Plain, Atmos. Chem. Phys., 18, 11739–11752, https://doi.org/10.5194/acp-18-11739-2018, 2018.
Wex, H., McFiggans, G., Henning, S., and Stratmann, F.: Influence of the external mixing state of atmospheric aerosol on derived CCN number concentrations, Geophys. Res. Lett., 37, L10805, https://doi.org/10.1029/2010gl043337, 2010.
Whitehead, J. D., Irwin, M., Allan, J. D., Good, N., and McFiggans, G.: A meta-analysis of particle water uptake reconciliation studies, Atmos. Chem. Phys., 14, 11833–11841, https://doi.org/10.5194/acp-14-11833-2014, 2014.
Wiedensohler, A., Wiesner, A., Weinhold, K., Birmili, W., Hermann, M., Merkel, M., Müller, T., Pfeifer, S., Schmidt, A., Tuch, T., Velarde, F., Quincey, P., Seeger, S., and Nowak, A.: Mobility particle size spectrometers: Calibration procedures and measurement uncertainties, Aerosol Sci. Tech., 52, 146–164, https://doi.org/10.1080/02786826.2017.1387229, 2017.
Wu, Z. J., Poulain, L., Henning, S., Dieckmann, K., Birmili, W., Merkel, M., van Pinxteren, D., Spindler, G., Müller, K., Stratmann, F., Herrmann, H., and Wiedensohler, A.: Relating particle hygroscopicity and CCN activity to chemical composition during the HCCT-2010 field campaign, Atmos. Chem. Phys., 13, 7983–7996, https://doi.org/10.5194/acp-13-7983-2013, 2013.
Xu, W., Ovadnevaite, J., Fossum, K. N., Lin, C., Huang, R.-J., O'Dowd, C., and Ceburnis, D.: Aerosol hygroscopicity and its link to chemical composition in the coastal atmosphere of Mace Head: marine and continental air masses, Atmos. Chem. Phys., 20, 3777–3791, https://doi.org/10.5194/acp-20-3777-2020, 2020.
Xu, W., Fossum, K., Ceburnis, D., Ovadnevaite, J., and O'Dowd, C.: Cloud condensation nuclei and hygroscopic growth measurement at Mace Head from 2009 to 2010, Mendeley Data, V1, https://doi.org/10.17632/3dx6pnx869.1, 2021.
Yoon, Y. J., Ceburnis, D., Cavalli, F., Jourdan, O., Putaud, J. P., Facchini, M. C., Decesari, S., Fuzzi, S., Sellegri, K., Jennings, S. G., and O'Dowd, C. D.: Seasonal characteristics of the physicochemical properties of North Atlantic marine atmospheric aerosols, J. Geophys. Res.-Atmos., 112, D04206, https://doi.org/10.1029/2005jd007044, 2007.
Zdanovskii, A.: New methods for calculating solubilities of electrolytes in multicomponent systems, Zh. Fiz. Khim.+, 22, 1475–1485, 1948.
Zhang, Y., Tao, J., Ma, N., Kuang, Y., Wang, Z., Cheng, P., Xu, W., Yang, W., Zhang, S., Xiong, C., Dong, W., Xie, L., Sun, Y., Fu, P., Zhou, G., Cheng, Y., and Su, H.: Predicting cloud condensation nuclei number concentration based on conventional measurements of aerosol properties in the North China Plain, Sci. Total Environ., 719, 137473, https://doi.org/10.1016/j.scitotenv.2020.137473, 2020.
Zieger, P., Väisänen, O., Corbin, J. C., Partridge, D. G., Bastelberger, S., Mousavi-Fard, M., Rosati, B., Gysel, M., Krieger, U. K., Leck, C., Nenes, A., Rippinen, I., Virtanen, A., and Salter, M. E.: Revising the hygroscopicity of inorganic sea salt particles, Nat. Commun., 8, 15833, https://doi.org/10.1038/ncomms15883, 2017.
Zuend, A., Marcolli, C., Booth, A. M., Lienhard, D. M., Soonsin, V., Krieger, U. K., Topping, D. O., McFiggans, G., Peter, T., and Seinfeld, J. H.: New and extended parameterization of the thermodynamic model AIOMFAC: calculation of activity coefficients for organic-inorganic mixtures containing carboxyl, hydroxyl, carbonyl, ether, ester, alkenyl, alkyl, and aromatic functional groups, Atmos. Chem. Phys., 11, 9155–9206, https://doi.org/10.5194/acp-11-9155-2011, 2011.