the Creative Commons Attribution 4.0 License.
the Creative Commons Attribution 4.0 License.
 | 07 Jun 2021
The important roles of surface tension and growth rate in the contribution of new particle formation (NPF) to cloud condensation nuclei (CCN) number concentration: evidence from field measurements in southern China
Mingfu Cai
Baoling Liang
Qibin Sun
Li Liu
Min Shao
Shan Huang
Yuwen Peng
Zelong Wang
Haobo Tan
Hanbin Xu
Duohong Chen
The contribution of new particle formation (NPF) to cloud condensation nuclei (CCN) number concentration (NCCN) varies largely under different environments and depends on several key factors such as formation rate (J), growth rate (GR), distribution of preexisting particles, and properties of new particles during NPF events. This study investigates the contribution of NPF to the NCCN and its controlling factors based on measurements conducted at the Heshan supersite, in the Pearl River Delta (PRD) region of China during fall 2019. The size-resolved cloud condensation nuclei activity and size-resolved particle hygroscopicity were measured by a cloud condensation nuclei counter (CCNc) and a hygroscopic tandem differential mobility analyzer (HTDMA), respectively, along with a scanning mobility particle sizer (SMPS) and a diethylene glycol scanning mobility particle sizer (DEG-SMPS) for particle number size distribution (PNSD). A typical NPF event on 29 October was chosen to investigate the contribution of the NPF to NCCN under several supersaturation (SS) ratios. Two particle properties (hygroscopicity and surface tension) affect CCN activation with the latter being more important in terms of the CCN concentration (NCCN). A lower value of surface tension (i.e., 0.06 N m−1) than the pure-water assumption (0.073 N m−1) could increase the NCCN at SS = 1.0 % by about 20 % during the nonevent period and by about 40 % during the event. In addition, an earlier peak time corresponding to a lower critical diameter (D50) was also observed. The results show that high formation rate, growth rate, and low background particle concentration lead to high number concentrations of newly formed particles. The high growth rate was found to have the most significant impact on the NCCN, which can be attributed to the fact that a higher growth rate can grow particles to the CCN size in a shorter time before they are scavenged by preexisting particles. Two other NPF events (an event on 18 October in this campaign and an event on 12 December 2014 in Panyu) were chosen to perform sensitivity tests under different scenarios (growth rate, formation rate, and background particle concentration). The calculated NCCN at SS = 1.0 % on 12 December 2014 was significantly lower than that from the other two events. The event on 12 December was re-simulated using the growth rate taken from the event on 18 October which resulted in similar CCN concentrations between the two events (12 December and 18 October), implying that the growth rate is the major impact factor for CCN activation. Our results highlight the importance of growth rate and surface tension when evaluating the contribution of NPF to the NCCN.
- Article
(5553 KB) - Full-text XML
-
Supplement
(1147 KB) - BibTeX
- EndNote


Atmospheric particles have direct effects on the global climate by adsorbing and scattering solar radiation while they can also act as cloud condensation nuclei (CCN) and exert influences on cloud formation, life cycle, and albedo and hence indirectly affect the global radiation balance. In general, atmospheric particles have a cooling effect on the global climate with the highest uncertainty among all the climatic forcings (Stocker et al., 2013). The relationship between the CCN number concentration (NCCN) and its climatic effect represents one of the major uncertainties. It is hence essential to carry out field measurements to investigate the CCN activity and its major impact factor.
New particle formation (NPF), as an important source of global atmospheric particles, is frequently observed in various atmospheric environments, including forest, urban, marine, and agricultural regions (Kulmala et al., 2004). Once formed, the particles can grow to the CCN sizes (50–100 nm) within a few hours and contribute significantly to the NCCN (Leng et al., 2014; Spracklen et al., 2008; Dameto de España et al., 2017). The extent to which newly formed particles can contribute to the NCCN is controlled by many factors, including formation rate (J), growth rate (GR), background particle number size distribution (PNSD), and properties of the particles. The formation rate is defined as a flux of newly formed particles at a threshold diameter and is usually used to describe how many particles are produced in the atmosphere during an event. The growth rate (GR) represents the diameter change of the particles in a certain time period, and particles with a higher GR will grow to the CCN sizes in a shorter time. The background PNSD controls the scavenging of the newly formed particles, and the high concentration of preexisting particles will efficiently scavenge these particles before they can grow to the CCN sizes. The properties of the particles (e.g., chemical composition, hygroscopicity, and surface tension) affect their ability to act as CCN. In general, particles containing a higher fraction of inorganic matter or water-soluble organics are more hygroscopic and more easily activated due to a lower critical diameter (D50). Recent studies showed that surfactant effects of organic matter were found on the particle surface which could lead to an increase of the CCN activity (Ovadnevaite et al., 2017; Cai et al., 2018; Liu et al., 2018). The contribution of NPF to NCCN is difficult to be quantitatively evaluated, and currently the major impact factors are not fully understood, which becomes a challenge for quantification of the climatic forcing of NPF events.
NPF events are well known to have an important contribution to the NCCN, while a wide range of NCCN during NPF events was reported in the literature. Yue et al. (2011) showed that the NCCN during NPF events was increased by a factor of 0.4–6 in Beijing. However, a much smaller (a factor of 1.17–1.88) increase of the NCCN was observed during NPF events in Shanghai (Leng et al., 2014). The results from Ma et al. (2016) showed that the NCCN was significantly impacted by the hygroscopicity of newly formed particles during NPF events in the North China Plain (NCP). Yu et al. (2014) reported an average factor of 4.7 increase of the NCCN during NPF events from growth of new particles to the CCN sizes in Ozark forest. Rose et al. (2017) showed that NPF could be a larger contributor to NCCN compared to transport in free troposphere. A long-term field measurement in urban Vienna conducted by Dameto de España et al. (2017) reported that the NCCN (at 0.5 % SS) could increase up to 143 % during NPF events. Kalkavouras er al. (2017) found that the NPF could double the NCCN (at 0.1 % SS) but could augment the potential droplet number only by 12 %.
Factors that control the CCN activity of newly formed particles (formation rate, growth rate, and particle properties) were investigated worldwide. These parameters varied substantially at large temporal and spatial scales. For example, the mean formation rate of 10 nm particles (J10) was 3.7 cm−3 s−1 in Nanjing (An et al., 2015), which was much higher than that (0.40 cm−3 s−1) reported in Shanghai (Leng et al., 2014). A value of 3.3–81.4 cm−3 s−1 was reported for the mean formation rate of 3 nm particles (J3) based on 1-year-long measurements in Beijing (Wu et al., 2007). In the NCP region, a long-term measurement conducted by Shen et al. (2011) reported that the J3 ranged from 0.7 to 72.7 cm−3 s−1, with a mean value of 8.0 cm−3 s−1. Shen et al. (2019) reported an average J3 value of 1.30 cm−3 s−1 at Mount Tai, which was much lower than urban regions. The growth of newly formed particles can be characterized by the particle growth rates. Kulmala et al. (2004) summarized a wide range of growth rates (1 to 20 nm h−1) from more than 100 filed measurements of NPF in mid-latitudes. On the one hand, the growth rates are usually high in polluted regions; for example, a growth rate of 11.6–18.1 nm h−1 was reported in New Delhi, India (Kulmala et al., 2005; Mönkkönen et al., 2005). On the other hand, the growth rates are in general low in forest regions; for example, a median value of 2.5 nm h−1 was reported from long-term measurements (Nieminen et al., 2014). Furthermore, large uncertainties exist for the measured growth rates even in the same region. For example, the growth rates under sulfur-poor conditions were about 80 % higher than those under sulfur-rich conditions in Beijing (Yue et al., 2011). The condensable vapors not only control the growth rate but also decide the hygroscopicity of newly formed particle, which can vary in a large range from event to event. Wu et al. (2013) reported a hygroscopic growth factor of 1.2 to 1.55 during NPF events in a mountain region, Germany. Asmi et al. (2010) found a significant contribution of organic vapors to particle formation and growth, leading to a low hygroscopicity of newly formed particles in the Antarctica region. The above studies show large temporal and spatial variations of characteristics in the properties of newly formed particles (i.e., the formation rate, growth rate, and hygroscopicity) during NPF events. However, how these parameters contribute to the variation of the NCCN during NPF events in various regions is yet to be investigated.
Although the Pearl River Delta region (PRD), one of the most economically developed areas in China, has made substantial progress in mitigating haze pollution, especially in achieving PM2.5 national level II standard (an average annual mass concentration of less than 35 µg m−3 for PM2.5), the intensive human activities and photochemistry lead to emissions and production of a large amount of condensable air pollutants for initiating formation of atmospheric particles and promoting their subsequent growth. Several studies have reported the frequent occurrence of NPF events in urban and rural areas of the PRD which provide a large amount of particles to the local atmosphere (Yue et al., 2013, 2016; Liu et al., 2008; Wang et al., 2013). However, these studies focused primarily on the characteristics of the NPF events, the contribution to the NCCN, and the controlling factors were still unknown, hindering an accurate assessment of NPF in CCN formation and eventually global climate change.
In this study, we analyzed the contribution of NPF to the NCCN based on a rural field campaign conducted at the Heshan supersite in the PRD region during fall (October and November, 2019). A suite of advanced analytical instruments was employed to measure particle hygroscopicity, size-resolved CCN activity, and particle number size distribution (1 nm–10 µm). Here, we select three representative NPF events (two from this measurement and the other one from a previous measurement in Panyu; Guangzhou, 2014) to quantitatively investigate the contribution of NPF to the NCCN and impact factors (i.e., formation rate, growth rate, background particle concentration, and particle properties) that affect the contribution.
2.1 Measurement site
The field campaign was conducted at the Heshan supersite in the Guangdong Province of China during the fall season (from 27 September to 17 November, 2019). This rural site (22∘42′39.1′′ N, 112∘55′35.9′′ E) is located at the southwest of the PRD region (about 70 km away from megacity Guangzhou) with an altitude of about 40 m a.s.l. (above sea level) and the site is surrounded by several farms and villages. All the instruments were placed in an air-conditioned room (T = 298 K) on the top floor of the building at the supersite, administrated by Guangdong Provincial Environmental Monitoring Center. Two aerosol sampling ports equipped, respectively, with a PM10 impactor and a PM2.5 impactor were made of a 6 m long in. o.d. stainless-steel tube. The schematic diagram of the inlet system and instrument setup is shown in Fig. S1. The sampling air was dried to a relative humidity (RH) lower than 30 % by passing through a Nafion dryer (model MD-700, Perma Pure, Inc., USA) before the air entered into the individual instruments.
2.2 Instrumentation
2.2.1 Particle number size distribution and size-resolved CCN activity measurements
The particle number size distribution (PNSD) in a complete size range of 1 nm–10 µm (an upper cutoff size of 10 µm) was measured by a diethylene glycol scanning mobility particle sizer (DEG-SMPS, model 3938E77, TSI Inc., USA), a SMPS (model 3938L75, TSI Inc., USA), and an aerodynamic particle sizer (APS, model 3321, TSI Inc., USA). The DEG-SMPS was applied to measure particles with a size range of 1–30 nm, consisting of a nano differential mobility analyzer (nDMA, model 3086, TSI Inc., USA), a nano enhancer (model 3777, TSI Inc., USA), and a condensation particle counter (CPC, model 3772, TSI Inc., USA). The SMPS, which was composed of a DMA (model 3081A, TSI Inc., USA) and a CPC (model 3775, TSI Inc., USA), was employed to measure particles in the size range of 10–800 nm. The APS was used to measure submicron particles ranging from 0.5 to 10 µm. The data inversion processes for the measured PNSD were done by Aerosol Instrument Manager (version 10, TSI Inc., USA). However, accurate inversion for particles smaller than 3 nm is currently still lacking due to large uncertainties from corrections for multiple charges and diffusion losses. Thus, we only discussed PNSD for particles larger than 3 nm in this study.
Size-resolved CCN activity was measured with a combination of a cloud condensation nuclei counter (CCNc, model 200, DMT Inc., USA) and another SMPS. The CCNc-200 has two parallel cloud columns, which can be used to measure the CCN concentration (NCCN) simultaneously. The supersaturation (SS) values were set to be 0.1 %, 0.2 % and 0.4 % for the first column and 0.7 %, 0.9 % and 1.0 % for the second column. The dry particles were firstly neutralized by an X-ray neutralizer (model 3088, TSI Inc., USA) and were then classified by a DMA (model 3081A, TSI Inc., USA). The monodisperse particles were split into three streams: two to the CCNc for measurement of the NCCN (with a flow rate of 0.6 L min−1) and one to the CPC for measurement of total particle number concentration (NCN, with a flow rate of 0.3 L min−1). Prior to the campaign, the SMPS instruments were calibrated with standard polystyrene latex spheres (PSL, with sizes of 20, 50, and 200 nm), and the CCNc-200 was calibrated with ammonium sulfate ((NH4)2SO4) particles at the six SS values (0.1 %, 0.2 %, 0.4 %, 0.7 %, 0.9 %, and 1.0 %).
2.2.2 Aerosol hygroscopicity measurement
Hygroscopicity of atmospheric particle at various size ranges was measured by a hygroscopic tandem differential mobility analyzer (HTDMA), consisting of two DMA instruments (model 3081L, TSI Inc., USA), a Nafion humidifier (model MD-700, Perma Pure Inc., USA), a heated tube, and a condensation particle counter (model 3788, TSI Inc., USA). The dry particles were firstly neutralizer by an X-ray neutralizer (model 3088, TSI Inc., USA) and subsequently were classified by a DMA for six sizes in this study (30, 50, 80, 100, 150, and 200 nm). The selected particles at a specific diameter (D0) were then introduced into a humidifier under a fixed RH (90 % in this study). Another DMA and a CPC were used to measure the size distribution of humified particles (Dwet).
2.3 Methodology
2.3.1 Estimation of hygroscopicity based on the measurements
The size-resolved activation ratio (AR) could be obtained from the measured NCN and NCCN by the SMPS and CCNc-200 system and was inverted based on the method described by Moore et al. (2010). The AR was then fitted with the sigmoidal function with respect to particle diameter Dp,
where B, C, and D50 are fitting coefficients. The D50 coefficient represents the critical diameter at which half of the particles are activated at a specific SS.
The hygroscopic parameter κ can be obtained from the critical supersaturation (Sc) and D50 (Petters and Kreidenweis, 2007) by
and where σs/a is the surface tension of the solution/air interface, and here it is temporarily assumed to be that of pure water (0.0728 N m−1 at 298.15 K); Mw is the molecular weight of water (0.018 kg mol−1), R is the universal gas constant (8.31 J mol−1 K−1), T is the thermodynamic temperature in kelvin (298.15 K), and ρw is the density of water (about 997.04 kg m−3 at 298.15 K).
The growth factor (GF) of selected particles can be calculated according to the following equation:
In addition to the hygroscopic parameter calculated based on the SMPS and CCNc-200 system, κ can also be calculated from HTDMA measurement based on the growth factor:
Due to the effect of the DMA diffusing transfer function, the TDMAfit algorithm (Stolzenburg and McMurry, 2008) was applied to narrow the uncertainty and fit the growth factor probability density function (GF-PDF). The detailed data inversion process can be found elsewhere in Tan et al. (2013).
2.3.2 Estimation of H2SO4 concentration and its contribution to particle growth
The daytime gas-phase H2SO4 concentration is estimated according to the proxy proposed by Lu et al. (2019),
where UVB is the ultraviolet radiation B intensity (in W m−2), [SO2] is the concentration of SO2 in molec. cm−3, [O3] is the concentration of O3 in molec. cm−3, [NOx] is the concentration of NOx in molec. cm−3, and CS is the condensation sink; it can be calculated from following equation:
where D is the diffusion coefficient of the H2SO4 vapor (assumed to be m2 s−1 in this study), βm,i is the transitional regime correction factor which can be calculated from the Knudsen number (Fuchs and Sutugin, 1971), and Ni represents the particle number concentration at Dpi.
This proxy is derived based on measurements from a winter field measurement in urban Beijing, where the atmospheric environment is similar to the locations of our measurements. A relative error of about 20 % for the proxy proposed by Lu et al. (2019) was estimated based on comparison of the estimated [H2SO4] with the measured one. However, accurate quantification of the uncertainty is not feasible since this proxy has not been tested in the PRD region. For simplicity, we adopted a relative error of about 20 % for the estimation of sulfuric acid concentration and ignored the uncertainties in measuring UVB, [SO2], CS, [O3], and [NOx]. However, further investigation is still needed, since the relative error of the estimation could vary temporally and spatially (Mikkonen et al., 2011).
Framework for 0-D Atmospheric Modeling (F0AM) v3.1 (Wolfe et al., 2016) is a zero-dimensional atmospheric box model which was used to simulate the concentration of OH radical in the atmosphere. The model was constrained with a set of online-measured trace gases, volatile organic compounds (VOCs), and meteorological data. The employed chemical mechanism is Master Chemical Mechanism (MCM) v3.3.1. A more detailed description of model setup can be found in Wang et al. (2020).
The required vapor concentration of H2SO4 () for a growth rate of 1 nm h−1 in a certain particle size range (Dp,initial to Dp,final) can be calculated from the following equation,
where ρv, mv, and Dv are the density, mass, and diameter of H2SO4, which were assumed to be 1830 kg m−3, 98 amu, and 0.55 nm, respectively (Nieminen et al., 2010; Jiang et al., 2011); αm is the mass accommodation coefficient (assumed to be unity in this study); x1 and x0 are the ratios of Dv to Dp,final (10 nm in this study) and to Dp,initial (3 nm in this study), respectively; Δt (in s) is the time for particle growth from dp,initial to dp,final () with a growth rate of 1 nm h−1, and k is the Boltzmann constant (1.38×10²³ J K−1).
Thus, the growth rate contributed from condensation of H2SO4 vapor can be obtained:
The average calculated H2SO4 concentration during particle growth can be calculated using Eq. (5). The resultant can be overestimated as the assumption of unity for αm in Eq. (7) is not necessarily the case, because not all H2SO4 molecules will be captured when colliding with the particles.
2.3.3 Estimation of growth rate (GR) and formation rate (J)
The observed particle growth rate (GR) is defined as the diameter change of nucleated particles (dDpnuc) for a time period (dt),
Here the lognormal distribution function method was adopted, and the PNSD was fitted to obtain the representative diameter for nucleated particles during NPF events (Kulmala et al., 2012),
where Dp is particle diameter, N is total particle number concentration, and Dpgmd is the geometric mean particle diameter that was also used as the representative particle size in Eq. (9). In this study, the PNSD was found to have a significant mode in a size range of 3–60 nm during NPF events, and we hence applied one lognormal mode fitting. At each time step, the PNSD was fitted using Eq. (10) and the Dpgmd as a function of time; that is, the growth rate was determined according to Eq. (9).
The formation rate (Jk) described the flux through a certain diameter (k) during NPF events, and it is calculated based on the formula given in Cai and Jiang (2017),
where is particle number concentration in a size range from Dpk to Dpu (excluding particles with diameter Dpu); Dpk and Dpu are the lower- and upper-bound diameters, respectively (here 3 and 30 nm); β(i,g) is the coagulation coefficient for collisions between particles with diameter Dpi and particles with diameter Dpg; nu is the particle distribution function at Dpu; and GRu is the growth rate calculated using Eq. (9) at Dpu. Note that the calculation of formation rate using Eq. (11) is based on two assumptions: (1) dilution and other particles sources and losses except for coagulation loss in the size range from Dpk to Dpu are negligible, and (2) net coagulation of particles is negligible.
2.3.4 Measurement-based NPF simulations
For a regional NPF event, the evolution of particle size distribution is governed by the population balance equations (Lehtinen et al., 2003; Kuang et al., 2012):
In the equations, class k∗ represents the smallest detectable particle size (here 3 nm particles), is the formation rate calculated using Eq. (11). Class k represents the particles with diameter Dpk. The first, second, and third terms on the right-hand side (RHS) of Eq. (12a) represent the formation, condensation, the coagulation sink terms, respectively. The first and second terms, the third term, and the fourth term on the RHS of Eq. (12b) represent the condensation growth terms, a coagulation source (CoagSrc) term, and the coagulation sink (CoagSnk) term, respectively.
For a specific NPF event, the evolution of PNSD with a size range of 3–1000 nm was simulated based on Eq. (12) using MATLAB (version 2016a, MathWorks, Inc.). In the simulation, the background particle distribution was assumed to be the average PNSD before 06:00 LT; the growth rate and formation rate were the measured values obtained from Eqs. (9) and (12), respectively; and the time step was set to be 10 s. The simulation is based on following assumptions. (1) The dynamics of newly formed particles are driven by coagulation and condensation. The influences of transportation, primary emissions, dilution, and particle evaporation are negligible. (2) The influence of coagulation on the preexisting particles is negligible. (3) The particle growth rate for all particle sizes is assumed to be the same at a time during NPF events.
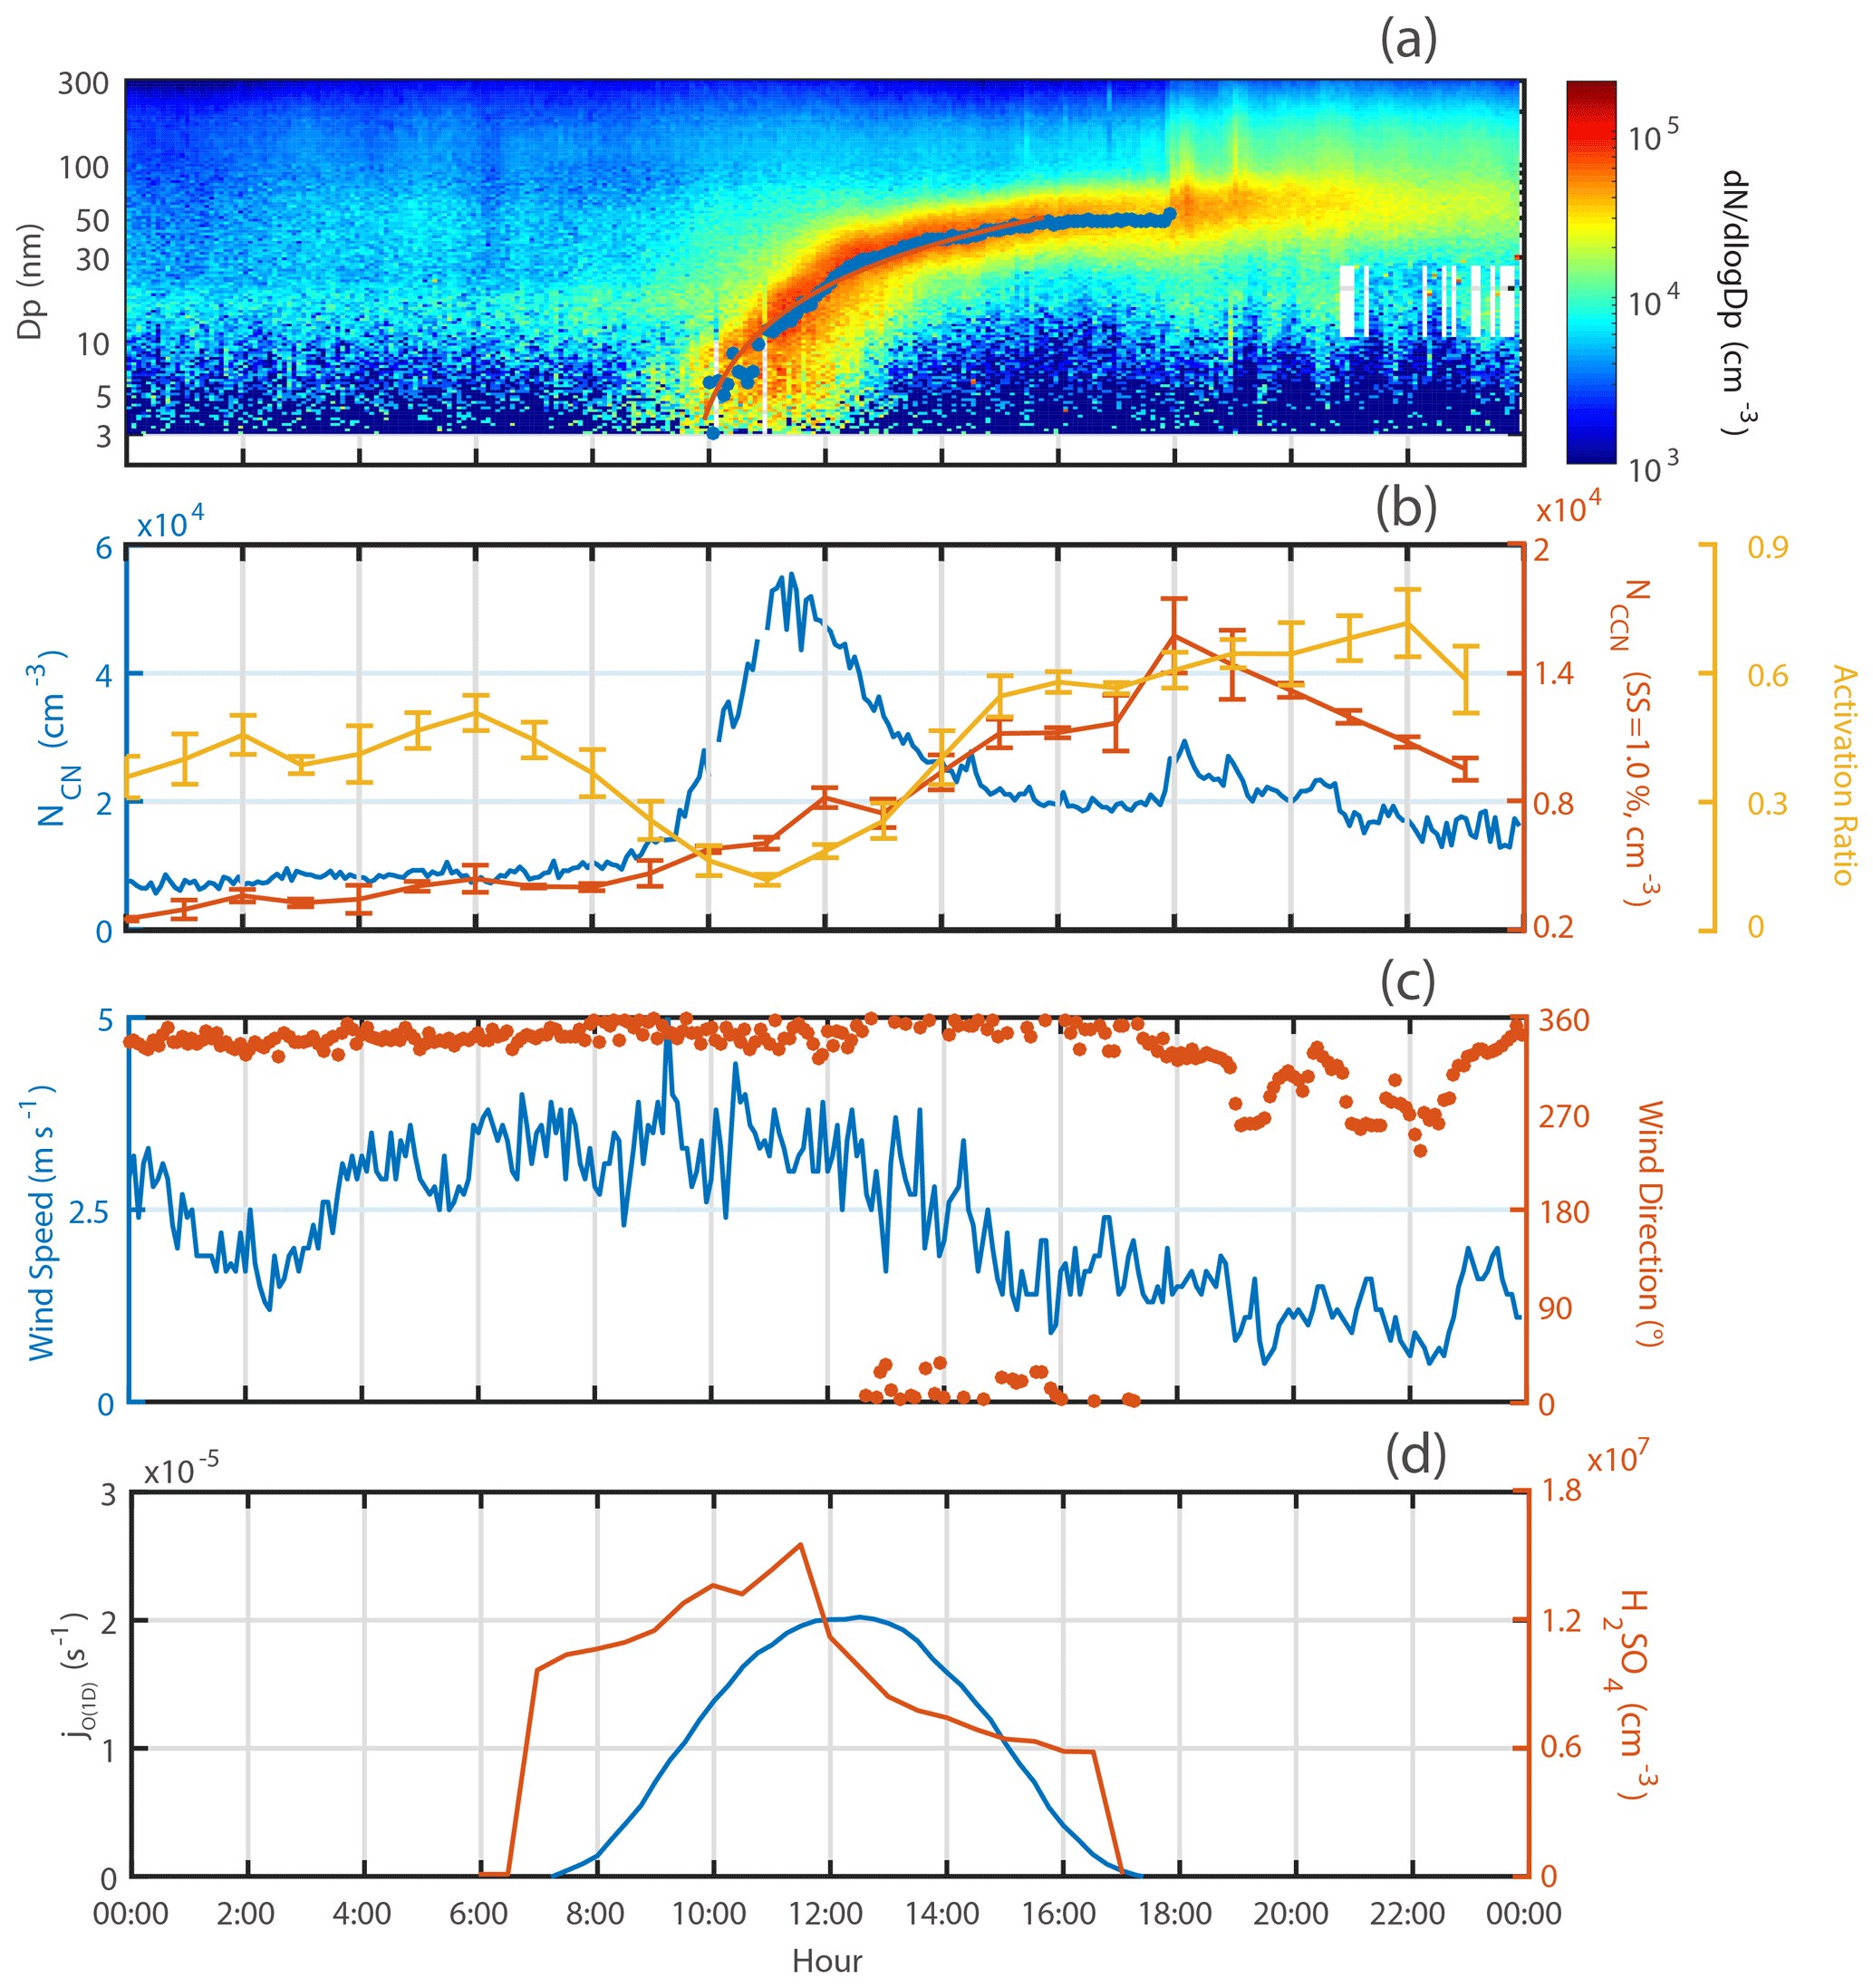
Figure 1The PNSD (a); NCN, NCCN, and AR (b); wind speed and wind direction (c); ; and concentration of calculated H2SO4 (d) during the NPF event on 29 October 2019. The blue dots in (a) represents the geometric mean particle diameter (Dpgmd), and the red line represents the linear fit.
3.1 New particle formation (NPF) events at the Heshan site
A total of 20 NPF events were observed during this 7-week-long field campaign. Here we selected a typical event (29 October 2019) for further investigation. As shown in Fig. 1a, new particle formation occurred at about 09:50 LT (local time) when a significant concentration of 3–10 nm particles were observed. Subsequently, continuous and steady growth of the newly formed particles was observed until the particles grew to about 70–80 nm at about 20:00 LT. The blue dots in Fig. 1a represent the Dpgmd of nucleated particles, and the red line represents the linear fitting, leading to an estimated growth rate of 8.0 nm h−1. Prior to the event (around 09:50 LT), the total particle number concentration (NCN) remained low (a concentration slightly below 10 000 cm−3), rapidly increased when NPF event occurred, and then reached its peak (about 56 000 cm−3) at 11:15 LT and subsequently decreased to 20 000 cm−3 at about 15:00 LT; it remained at this concentration for the rest of the day. A steady north wind was observed before 18:00 LT and shifted to northwest afterwards (Fig. 1c). The shift of wind direction led to a change of air mass as seen from the PNSD, leading to a sudden increase of the NCN at 18:00 LT (Fig. 1a and b). The CCN concentration (NCCN) at 1.0 % SS increased from 5000 cm−3 at around 10:00 LT to 11 000 cm−3 at about 15:00 LT, when the nucleated particles grew to the CCN size (Fig. S2). The D50 at 1.0 % SS was apparently the smallest critical diameter among all the SS values, which was the size that was easily reached during NPF and was significantly affected by the newly formed particles; we thus only discussed the variation of the NCCN at 1.0 % SS in the following section. The sudden increase of NCCN at 18:00 LT could be attributed to change of the air mass due to transportation, consistent with the changes of the PNSD, the NCN, and wind direction (Fig. 1a–c). The activation ratio (AR) was about 0.5 before dawn and dropped to about 0.2 just prior to the event (Fig. 1b). This ratio continued to decrease to its trough at the time corresponding to the maximum of NCN and then increased again to about 0.6 at 15:00 LT during particle growth slightly higher than the value before dawn. Clearly, NPF can not only add a large number of particles to the atmosphere but also increase the NCCN and AR after particles are formed and grow. The wind speeds were about 3 m s−1 during initial formation and growth, and decreased to about 1.5 m s−1 during most of the particle growth periods.
Formation of gaseous H2SO4 was favored by intensive photochemistry. Significant values of (in s−1) were observed during the day (from about 07:00 to 17:00 LT) with a maximum value of 2×10⁻⁵ s−1 at noon and symmetrically distributed before and after noon. The average calculated H2SO4 concentration during particle formation periods (10:00–12:00 LT) was about 1.4×107 cm−3, about an order higher than that (about 7–12×106 cm−3) in a mountain region in Germany (Wu et al., 2013) and close to that (about 2–5×107 cm−3) in a rural region of Sichuan in China (Chen et al., 2014). Considering a relative error of about 20 %, the growth rate contributed by condensation of gaseous H2SO4 was about 0.61–1.09 nm h−1 or about 7.6 %–13.6 % of the observed growth rates for 3–10 nm particles. It should be pointed out that the above estimates for the growth rates are subject to large uncertainties due to uncertainties for the estimation of sulfuric acid concentration using Eq. (5) as the proxy, and here unity for sticking coefficients was assumed when gaseous H2SO4 molecules collide with preexisting particles. This implies that compounds other than H2SO4 (e.g., organic vapors) play significant roles in the growth process of newly formed particles, which was widely reported in the literature (Boy et al., 2005; Casquero-Vera et al., 2020; Paasonen et al., 2010).
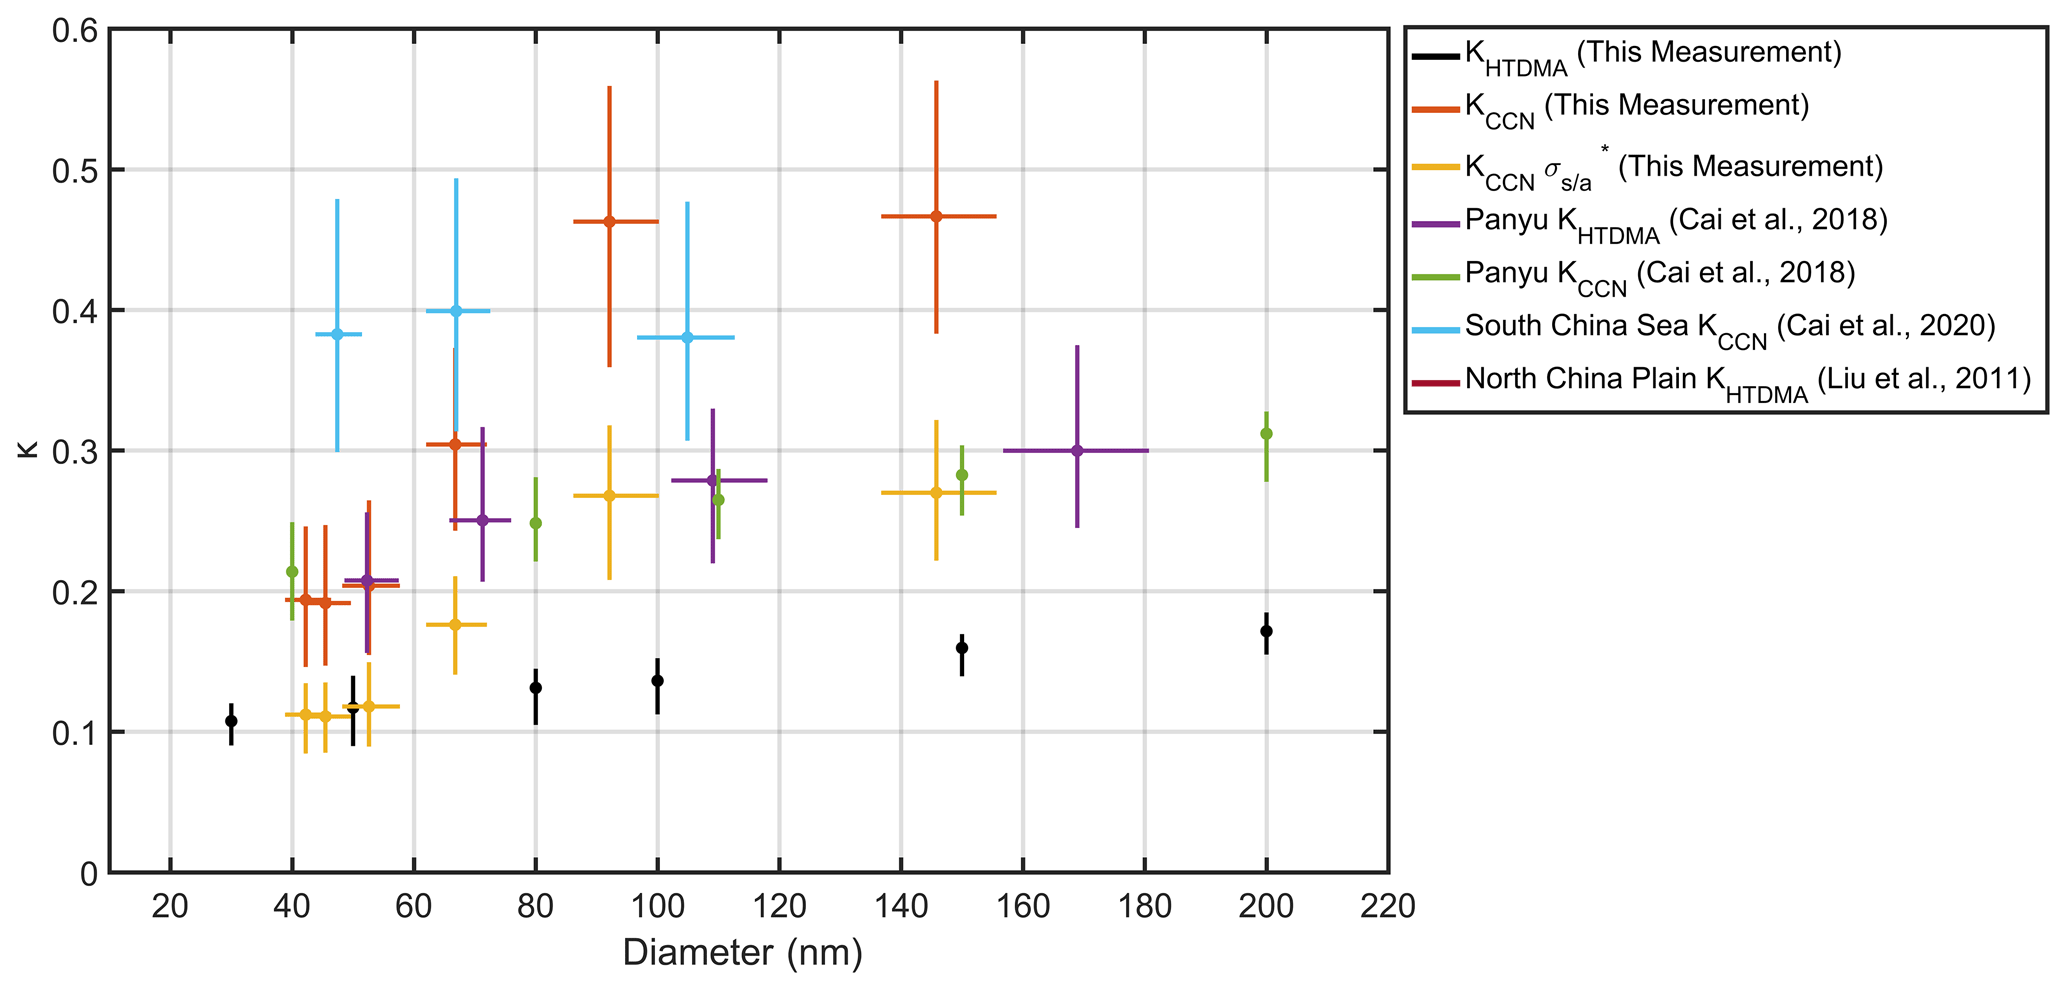
Figure 2Comparison of the median and interquartile κ values obtained from HTDMA and CCN measurements during this campaign at Heshan, at Panyu (urban Guangzhou), and from South China Sea. The κ was pointed against the corresponding median D50 (CCN measurement) or selected diameter (HTDMA measurement). Dots represent the median values, and bars represent the interquartile ranges. The κ values in this measurement were obtained from HTDMA measurement (in black) and CCNc measurement (SS = 0.1 %, 0.2 %, 0.4 %, 0.7 %, 0.9 %, and 1.0 %, in red and yellow for different surface tensions). The yellow lines and dots represent the κ values recalculated based on . The κ values at Panyu were obtained from HTDMA measurement (in purple) and CCNc measurement (SS = 0.1 %, 0.2 %, 0.4 %, and 0.7 %, in green). The κ values from the South China Sea were obtained from CCNc measurement (SS = 0.18 %, 0.34 %, and 0.59 %, in light blue). The κ values from the North China Plain were obtained from HTDMA measurement.
3.2 The impact of hygroscopicity and surfactants on NCCN
The ability that atmospheric particles can serve as CCN is determined by several factors including sizes, chemical composition, surface tension, and water saturation ratio of the particles (Farmer et al., 2015). The organic matter in particles can act as surfactants to lower the surface tension of the particles and hence can increase the CCN activity (Ovadnevaite et al., 2017). Previous studies showed that surfactants could modify the ability of water uptake, leading to discrepancies in κ values between measurements using techniques under different water saturation conditions, e.g., subsaturation (HTDMA measurements) or supersaturation (CCNc measurements) (Cai et al., 2018; Wex et al., 2009; Rastak et al., 2017; Ruehl and Wilson, 2014). Figure 2 compares the κ values measured from several locations including Heshan (this study, rural), Panyu (urban PRD, Cai et al., 2018), North China Plain (Liu et al., 2011), and South China Sea (Cai et al., 2020). The median κ values measured by HTDMA in this study ranged from 0.1 to 0.18 in a size range of 30–200 nm, similar to those of particles primarily composed of organics (Deng et al., 2019; Liu et al., 2018; Pajunoja et al., 2015), implying that chemical composition of the measured particles was dominated by organics. In particular, the κ values measured using HTDMA (κHTDMA) in this study were significantly lower than those from other studies. The κ values in a range of 0.21–0.31 were reported for urban PRD and suburban North China Plain, which were likely attributed to high fractions of water-soluble organic matter and inorganic compounds from traffic and industry emissions. The κ values measured using CCNc (κCCN) fall in a range from 0.19 to 0.46, which are much higher than those from measurements using HTDMA in this study. The discrepancy of the κHTDMA and κCCN values suggests that surfactant effects could play an important role in CCN activation under subsaturation and supersaturation environments. Previous studies have shown that the organics in particles could lower surface tension by about 0.01–0.032 N m−1 (Ovadnevaite et al., 2017; Liu et al., 2018; Engelhart et al., 2008; Cai et al., 2018), leading to the decrease of the D50 and higher κ values. This effect was closely related to the presence of liquid–liquid phase separation (LLPS) (Renbaum-Wolff et al., 2016), which was observed in organic-containing particles under high relative humidity. LLPS is mainly dependent on the chemical composition of organics (e.g., functional groups and oxidation state) and inorganic–organic mixing ratio (Ruehl et al., 2016; Ma et al., 2021; Bertram et al., 2011). Once LLPS occurred, the organic-rich phase on the droplet surface would reduce surface tension and further enhance water uptake (Rastak et al., 2017; Freedman, 2017). Surface tension is expected to increase with droplet growth, since the organic-rich phase becomes thinner and shifted to the water-rich phase (Liu et al., 2018; Renbaum-Wolff et al., 2016; Ovadnevaite et al., 2017). Further laboratory and field studies are needed for better understanding the occurrence of LLPS in particles, its variation with different chemical composition, and its impact on the surface tension.
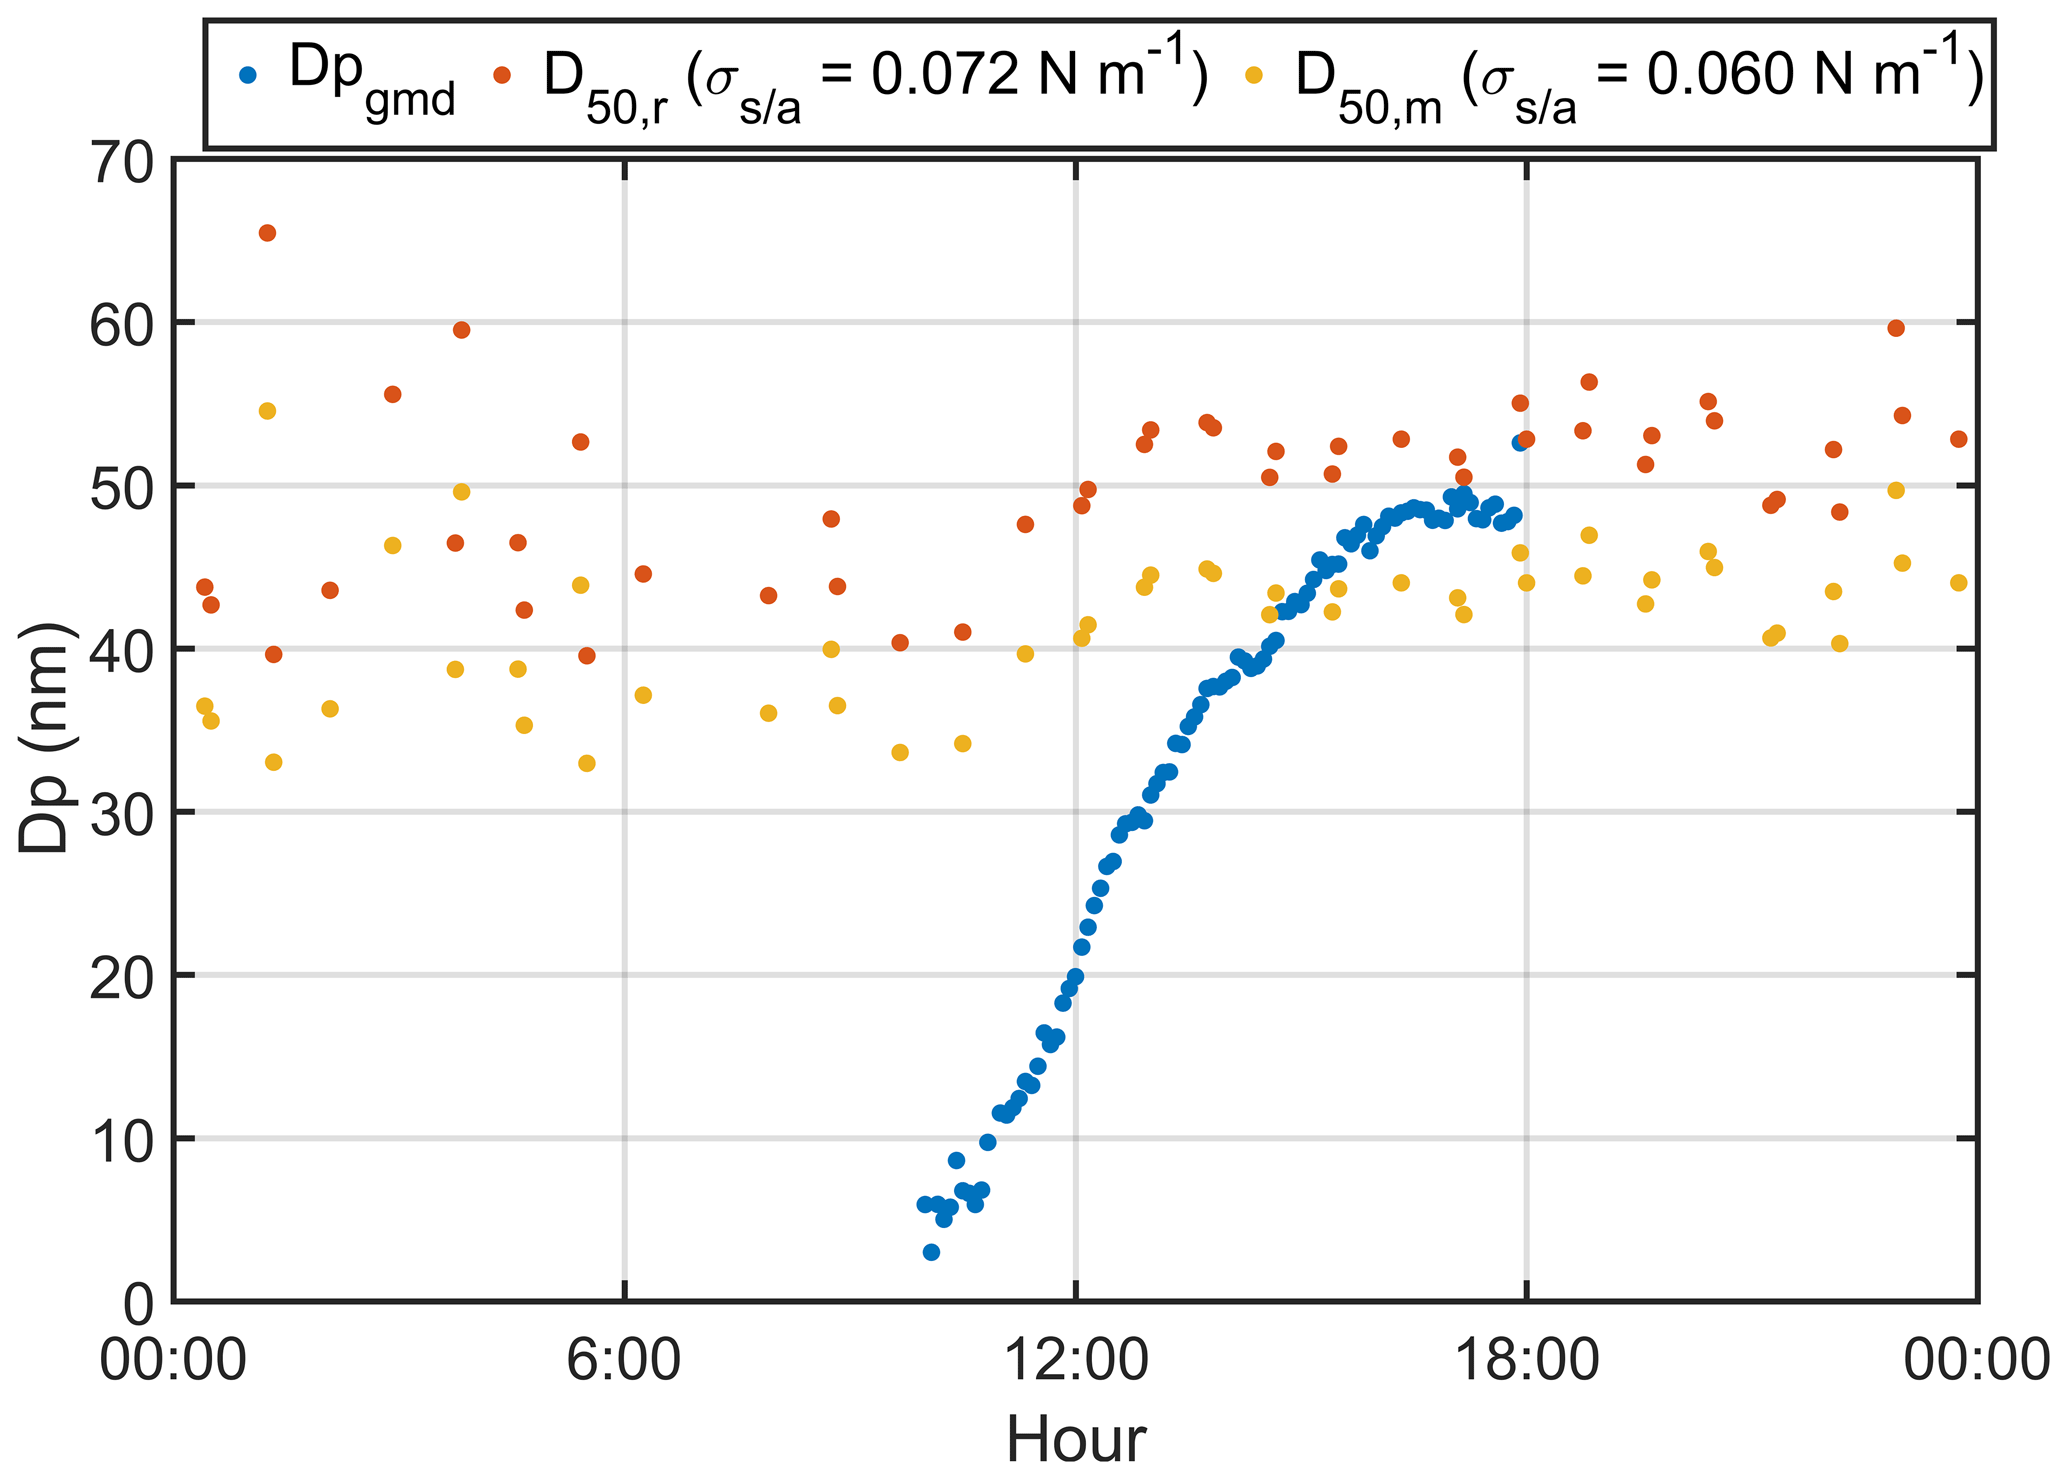
Figure 3The variation of Dpgmd (blue dots), D50,m (yellow dots) and D50,r (red dots) based on pure-water surface tension.
A surface tension value ( N m−1) was adopted to calculate both the κCCN (denoted as ) and κHTDMA () using Eqs. (2) and (4), respectively. No significant changes of κ values (i.e., from 0.11 to 0.10 for 30 nm particles) were found from TDMA measurements (Fig. S3), while the κ values from CCNc measurements using this surface tension value () were still lower than those using pure-water assumption, and the differences became larger with increasing particle sizes, implying that the surface tension is dependent on particle diameter. It also implies that the κ value was more susceptible to surfactants under supersaturation condition, which can lower the D50 of the particle for facilitating CCN activation. For particles with the same κ value, the measured D50 (denoted as D50,m) by fitting of NCCN NCN using Eq. (1) was lower than the calculated value based on pure-water surface tension using Eq. (2) due to the surfactant effect. In order to estimate the impact of surfactant on particle activation, the D50 was recalculated using the surface tension of pure water (0.072 N m−1) by Eq. (2) based on the κ value from the CCN measurements with a surface tension correction (refer to and N m−1 in Fig. 2). We termed the above recalculated D50 as the D50,r to illustrate the surfactant effects on the CCN activity during NPF events. Figure 3 shows the variation of the D50,r (here σs/a=0.072 N m−1) and the D50,m, along with the Dpgmd of the nucleated particles during the NPF event. The D50,m was lower than the D50,r by about 10 nm. As a result, the Dpgmd reached the D50,m at about 15:00 LT, about 2 h earlier than it arrived at the D50,r, which indicates that the surfactant effects could lead to earlier activation of the newly formed particles as CCN. The earlier the Dpgmd reaches the critical diameter D50, the higher the NCCN is, because more particles can survive from being scavenged by preexisting particles. The differences in the PNSD at the time when the Dpgmd reached D50,m and D50,r are shown in Fig. S2. The peak value of PNSD at 15:00 LT was about 20 000 cm−3 higher than the value at 17:15 LT. The NCCN also shows a difference between D50,r and D50,m (Fig. 4a).
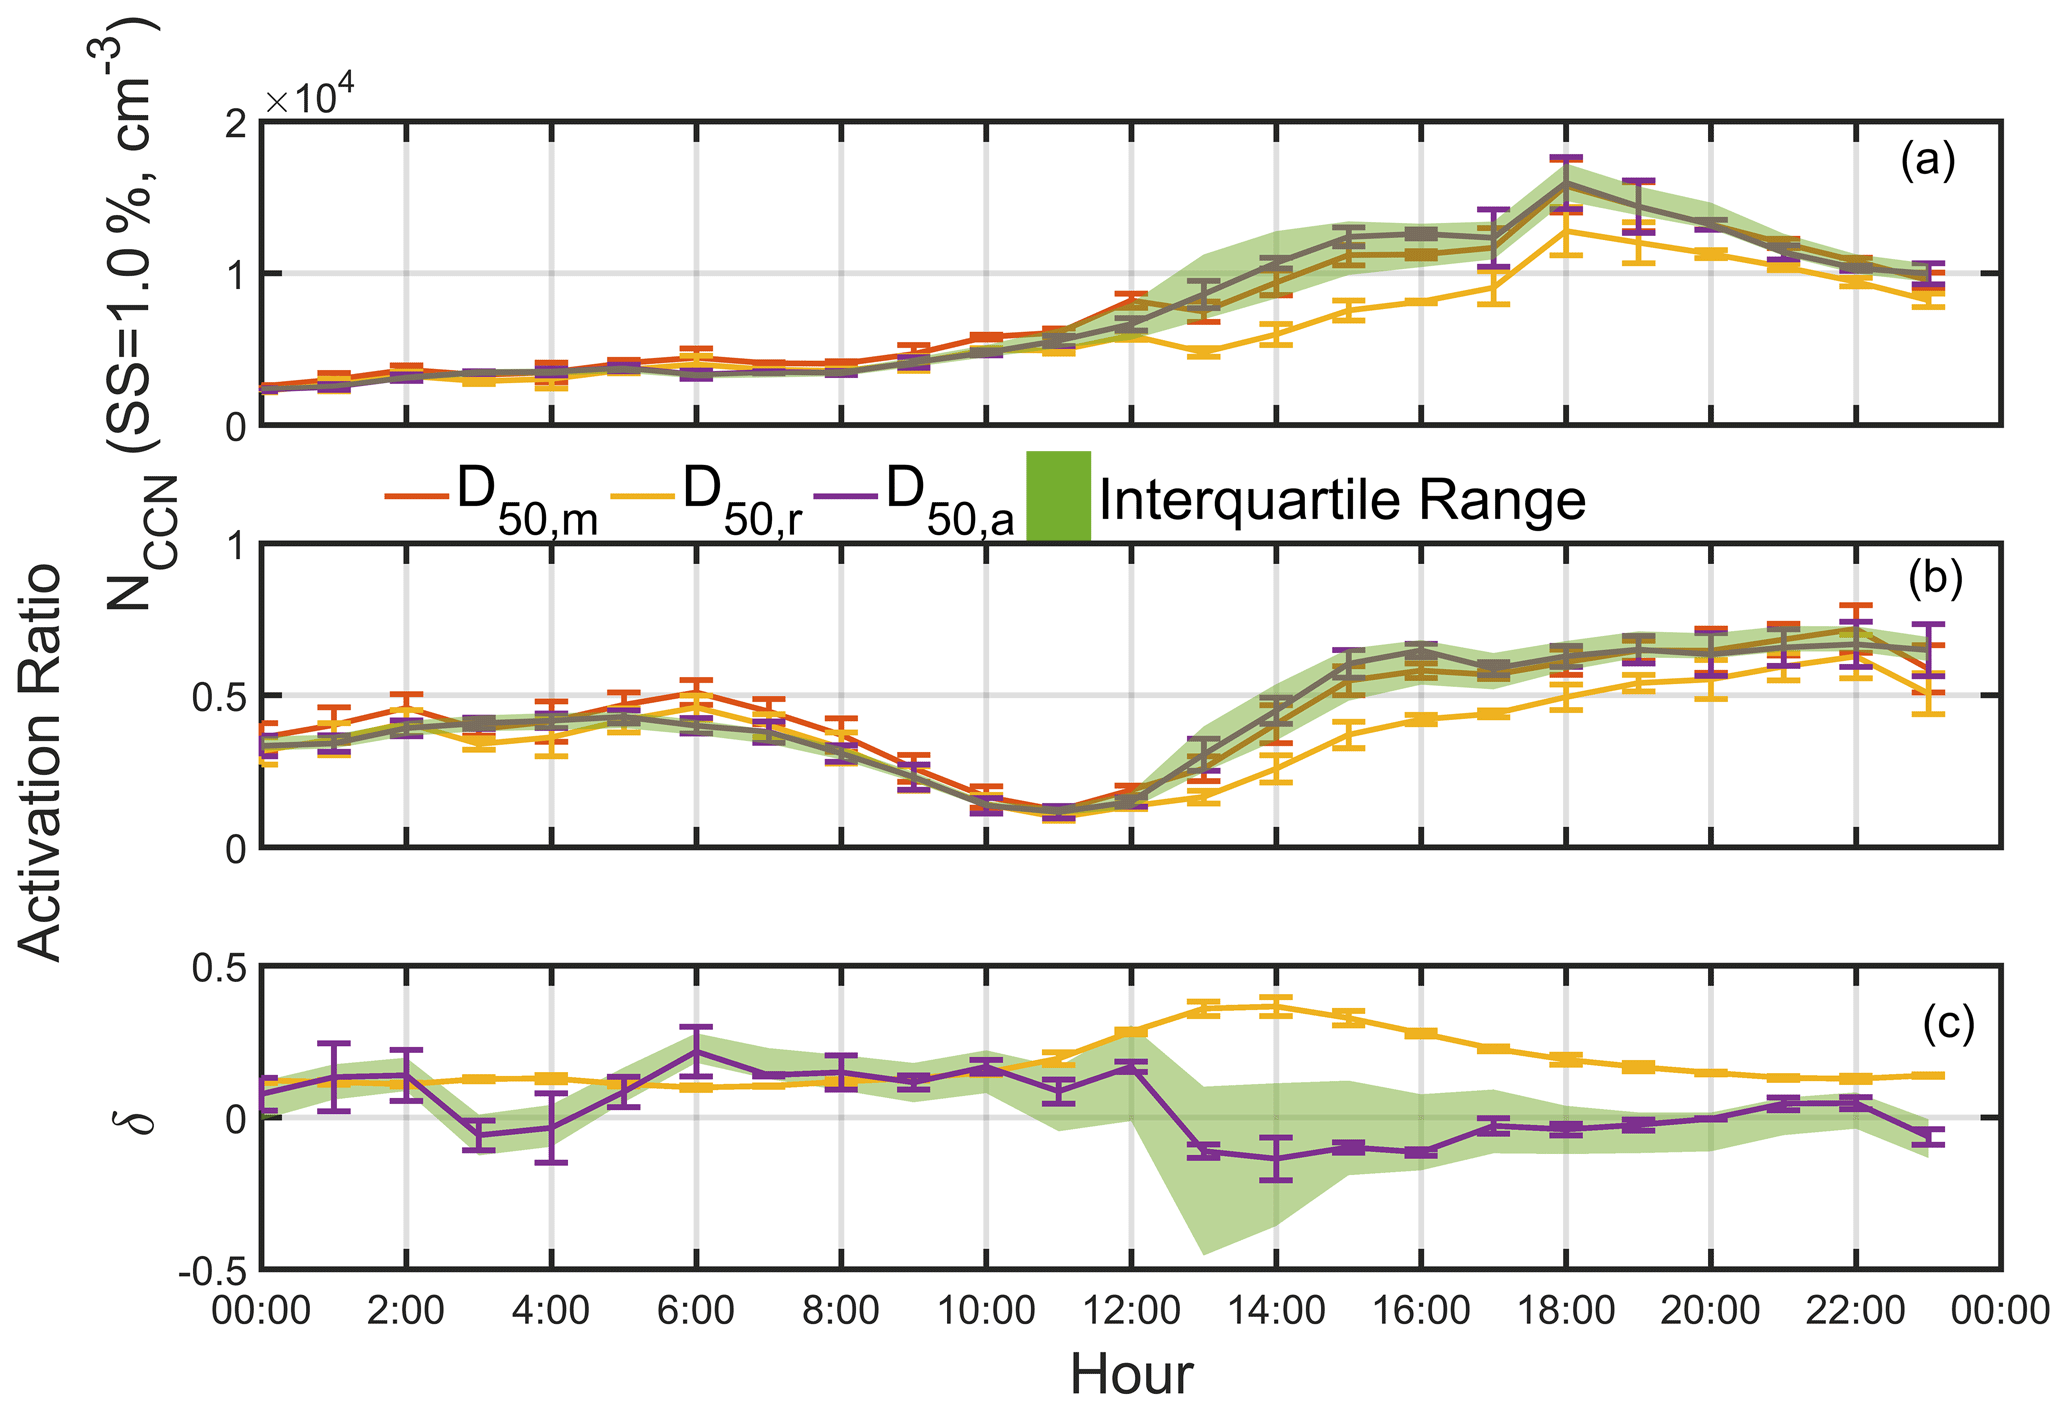
Figure 4The variation of NCCN (a), activation ratio (b), and δCCN (c) based on D50,m, D50,r, and the average D50. The red line represents the measured values. The yellow line represents the values calculated based on the surface tension of pure water (0.072 N m−1). The purple line represents the values calculated from the average D50. The green region represents the interquartile values calculated from the interquartile D50.
We also investigate the effect of the surface tension on the NCCN at SS = 1.0 % by varying the value of the surface tension. As we mentioned in the beginning of this section, a surface tension of 0.060 N m−1 () was adopted when discussing the CCN activation at 1.0 % SS, and we assume that the D50,r was based on this surface tension value. The average D50 (denoted as D50,a) was the mean of the D50,m. The NCCN is calculated by integrating particle concentrations above D50 using the following equation:
where ni is the particle distribution function at Dpi. The D50 can be the measured or recalculated one. It was shown that the NCCN at SS = 1.0 % from integration of particles above D50,r was significantly lower than that above D50,m after 12:00 LT (2 h after the occurrence of the NPF event), with concentration differences of about 3000–4000 cm−3 (Fig. 4a). The AR based on the D50,r reached its minimal values between 10:00 and 12:00 LT and then steadily increased until 22:00 LT and subsequently decreased. The AR based on the D50,m reached its minimal during the same period as the AR from the D50,r; however, it then rapidly increased until 16:00 LT, and the continuing increase of the AR was much slower until 22:00 LT and also subsequently decrease for the last hour of the measurement (Fig. 4b). This different trend was likely attributed to the continuing growth of the nucleated particles to the CCN size prior to 16:00 LT. Here, we define the deviation of NCCN based on the D50,r from that based on the D50,m to evaluate the impacts of the surface tension (primarily due to the surfactant effects) on the NCCN,
where the NCCN,m and NCCN,r represent the NCCN based on the D50,m and the D50,r or D50,a. The of the D50,r was about 0.1 prior to the NPF event, reached a peak value of 0.4 at 14:00 LT, and then decreased steadily to 0.1 at 22:00 LT and remained unchanged for the last hour of the measurement (Fig. 4c). The results suggest that the decrease of the surface tension due to the surfactant effects could lead to about 10 % increase of the NCCN at 1.0 % SS for nonevent period and about 40 % increase during the NPF event (Fig. 4c). Apparently, the surfactants have more significant effects on NCCN during the NPF event period than during nonevent period, as the difference between the based on the D50,r and the D50,a was significant only during the event period (12:00–18:00 LT).
The hygroscopicity of newly grown particles can have a significant impact on the NCCN during the NPF event. During the campaign, the minimum particle size of CCN activity measurement was about 40–45 nm (at 1.0 % SS); thus, the hygroscopicity of this size range was used to present the property of the newly grown particles, when they grow up to this size range. In general, the κCCN values for 40–45 nm particles were significantly higher (corresponding to much higher hygroscopicity) during early event period than during nonevent and other event periods (Fig. S4a). Hence, we adopted a minimum size range of 40–45 nm particles for CCN activity measurements (at about 1.0 % SS) to represent typically growth of newly formed particles to this size range during the campaign. It should be pointed out that the high κ values during 10:00–12:00 LT did not represent the hygroscopicity of the newly grown particles which were primarily composed of particles much smaller than 30–40 nm. Those new particles grew to about 40–50 nm at 14:00–16:00 LT (Figs. 1a and 3), and their κ values were obviously lower than the average ones, implying that the organic vapors could play an important role during growth of new particles as discussed in Sect. 3.1. The decrease of hygroscopicity due to condensation of organic vapors can lead to an increase of about 3–4 nm for the D50, which is much smaller than the increase of about 10 nm induced by the surfactant effect which reduces the surface tension as discussed before. The results indicate that the surfactant effect may play a more important role than hygroscopicity in the NCCN, because the surfactant effect can largely decrease the D50 during the NPF event when the number concentration of particles is dominant by Aitken mode.
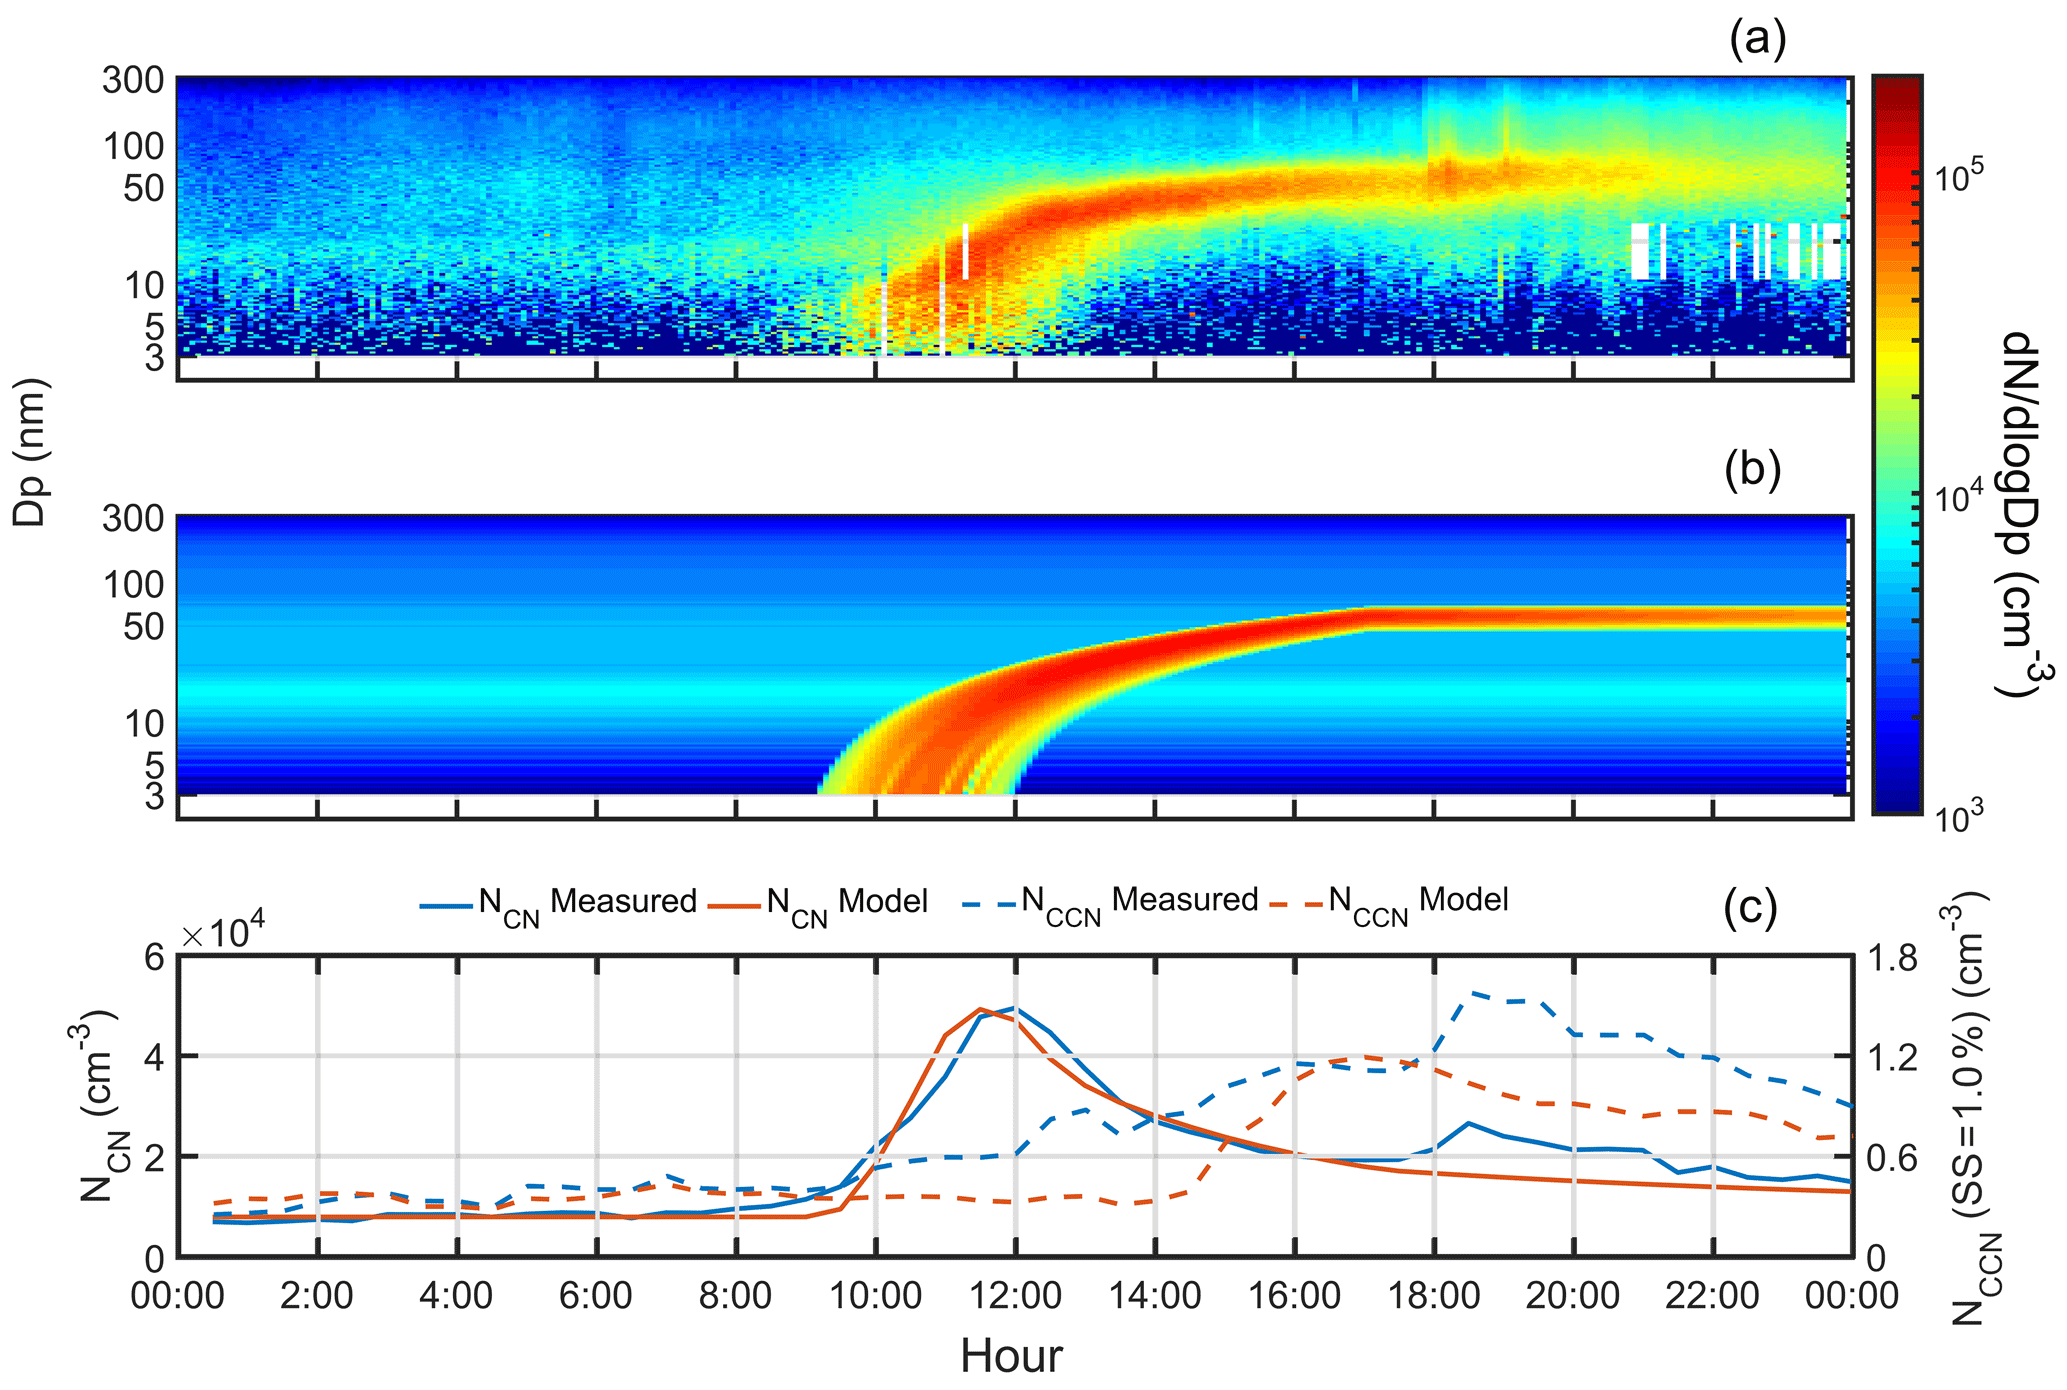
Figure 5The measured and modeled PNSD (a, b), NCN (c), and NCCN (c). The blue lines in (c) represent the measured values, and the red lines represent the model values.
3.3 The impact of the dynamic processes on NCCN
As discussed in Sect. 2.3.4, the dynamical processes for new particles during nucleation events are governed by the population balance equation (Eq. 12). Here, we build a MATLAB program to model the NPF event using Eq. (12), with input parameters including background particle distribution, growth rate and formation rate. Notice that the simulation is based on the aforementioned three assumptions. Figure 5 shows the measured and modeled PNSD, NCN, and NCCN at 1.0 % SS. To be simplified, the background particle distribution was assumed to be the average particle distribution before 06:00 LT. The modeled PNSD and NCN agree very well with the measured ones, except the model fails to reproduce the abrupt change of PNSD and NCN between 18:00 and 22:00 LT. As discussed in Sect. 3.1, this discrepancy was attributed to the change of the air mass by wind direction which was not considered in the model. However, there are considerable discrepancies between the modeled and the measured NCCN. The measured NCCN at 1.0 % SS increased steadily after the occurrence of the NPF event (at around 09:00 LT) due to formation of high concentration particles at a size range of 10–60 nm until around 19:00 LT and subsequently the NCCN dropped for the rest of the day. The model NCCN started to increase at about 14:15 LT and reached its maximum level at about 17:00 LT. The model failed to reproduce the increase of the measured NCCN before 16:00 LT, although the reasons corresponding to the discrepancy are still unknown. The modeled peak value of the NCCN at 1.0 % SS was about 12 000 cm−3, which agreed very well with the measured one (11 000 cm−3). Again, the model failed to reproduce the increase of NCCN due to the change of the air mass between 18:00 and 22:00 LT.
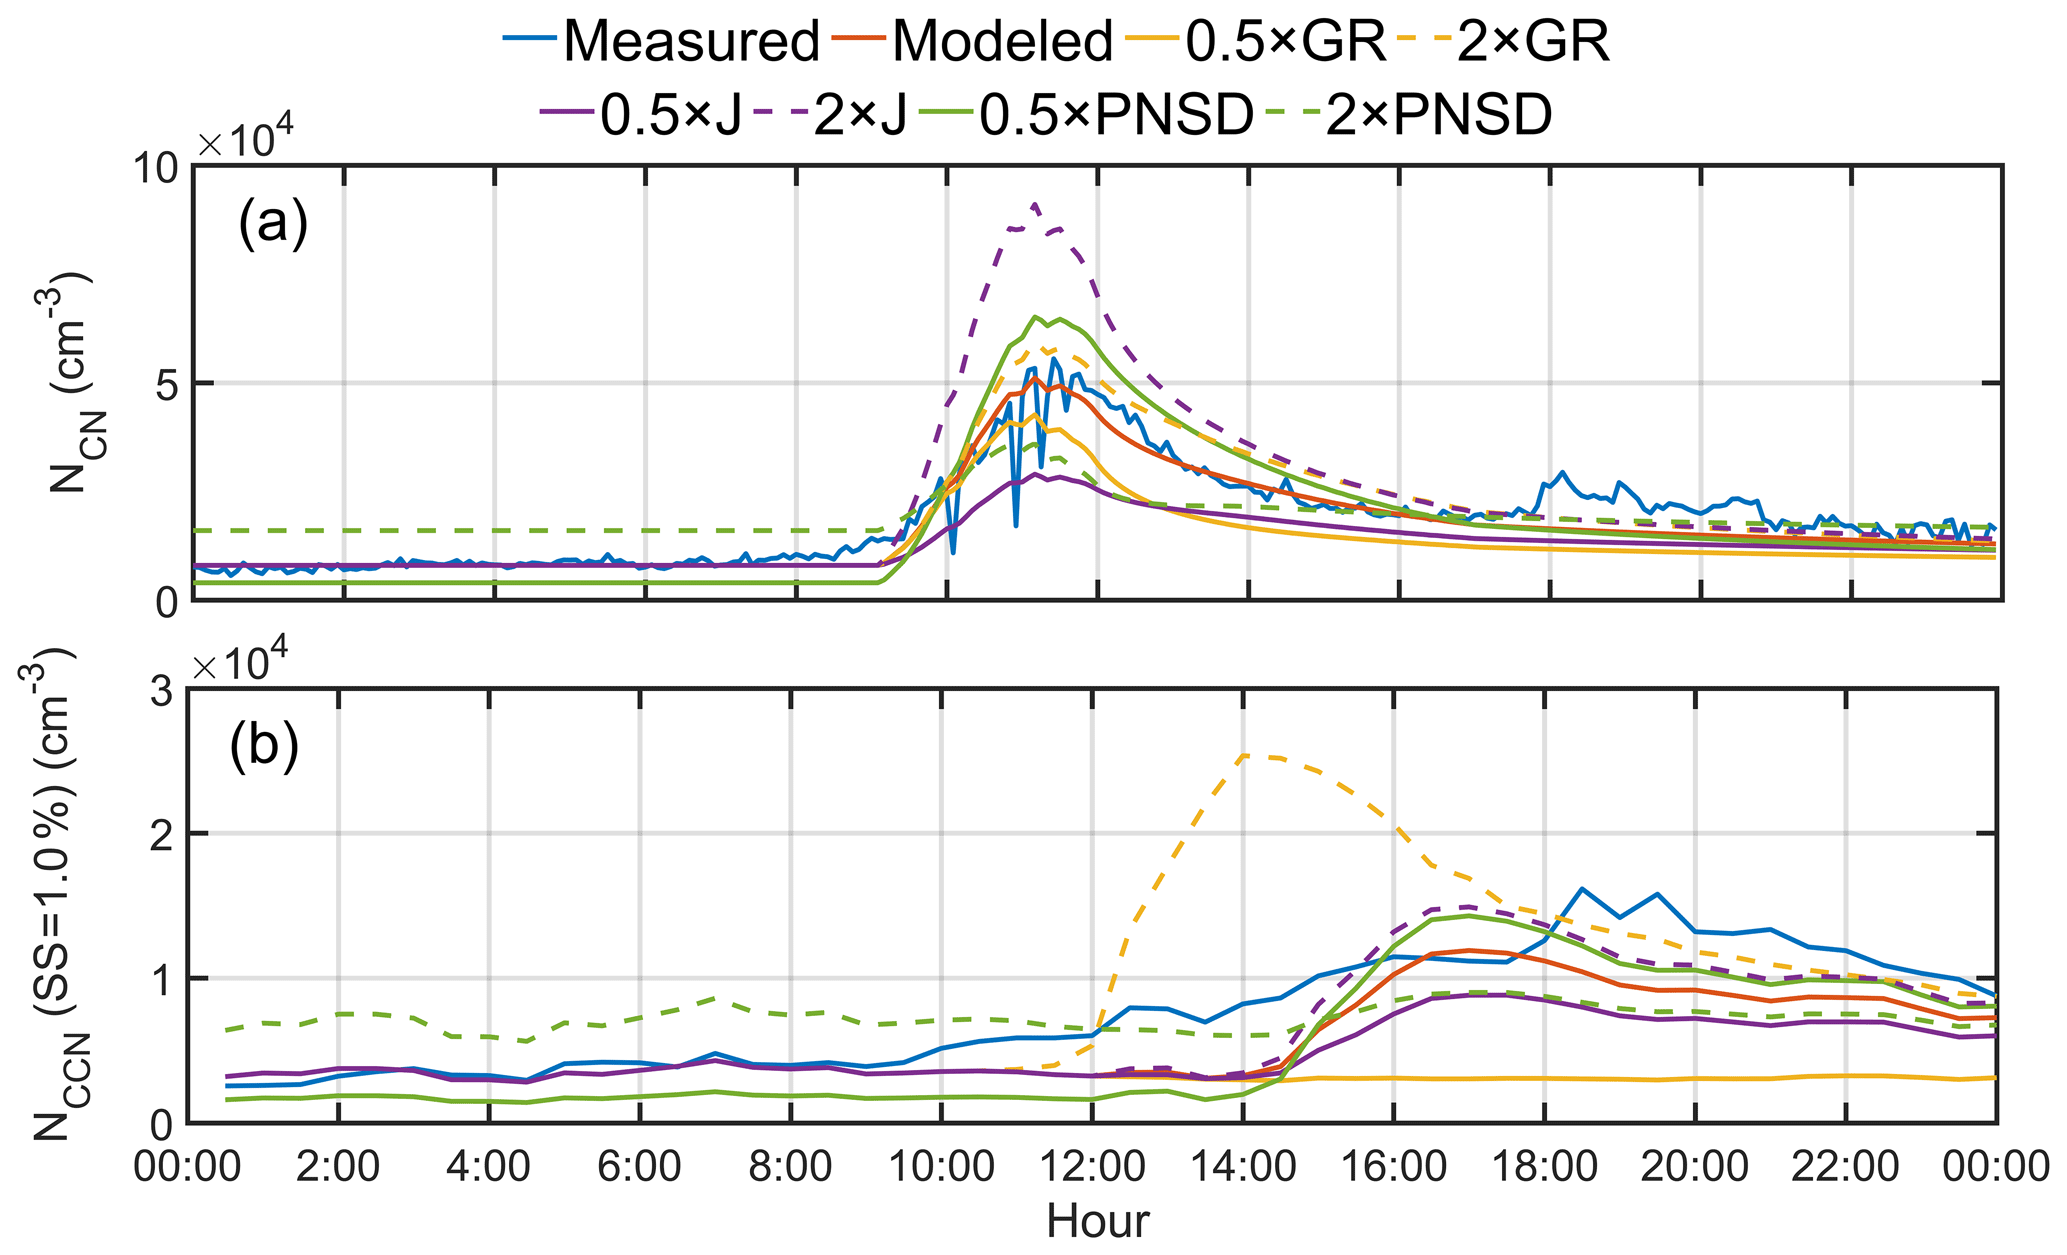
Figure 6The variation of measured and modeled NCN (a) and NCCN (b) at 1.0 % SS. The simulation was based on standard characteristic (red solid line); halving of GR, formation rate, and background particle distribution (orange, purple, and green solid lines, respectively); and doubling of GR, formation rate, and background particle distribution (orange, purple, and green dashed lines, respectively).
As discussed in Sect. 3.2, the contribution of NCCN was affected by the properties of newly grown particles. However, the characteristics of NPF, including growth rate, formation rate, and the background PNSD, also affect NCCN. The effects of variation (halving or doubling) of the growth rate, formation rate, and the background PNSD on the NCN and NCCN were investigated to test the sensitivity of those parameters. Figure 6 shows the comparison of the measured NCN and NCCN with their respective modeled values based on the half or doubling of each tested parameter, respectively. As can be seen from Fig. 6a, the modeled NCN values based on the double GR, the double formation rate, and the half background PNSD were higher than the corresponding measured values, respectively, and vice versa. Doubling of the formation rate led to formation of more new particles, and the half background PNSD corresponds to a low coagulation loss with preexisting particles, resulting in production of more new particles in the simulation. Doubling of the GR resulted in a higher concentration of particles, probably due to the significant increases of the coagulation source (Fig. S5b), while small decreases for both of the coagulation sink and growth term were found (Figs. S5a and S5d). Coagulation source means that two smaller particles collide with each other and become a larger particle, which can also increase the population of new particles. Since the newly formed particles can grow to larger sizes under a higher GR, the PNSD of new particles would be broader (Fig. S6), which provides a wider “region” for the coagulation sources, i.e., the “k−1” in Eq. (12b) is higher. Doubling of the FR (J) resulted in the highest modeled NCN (about 90 000 cm−3) among all simulated cases; however, the modeled NCCN based on a double J was only the second highest value (about 15 000 cm−3). The highest modeled NCCN (about 25 000 cm−3) was found to double the GR; moreover, it peaked earlier at about 14:00 LT (2 h earlier than the other cases). Similarly, the highest modeled AR (about 0.82) was from doubling the GR and an earlier peak time was also found (Fig. S7). The above results can be attributed to the following two possible reasons: (1) doubling of the GR made newly formed particles grow faster to the D50, which facilitated the survival of more particles from coagulation scavenging; (2) the NCN became higher by doubling the GR. If newly formed particles grew slowly, for example, the decrease of the GR to a half value would result in growth of most particles to diameters below that of the D50, leading to the smallest change of the NCCN compared to other cases (Fig. S7). The preexisting background particles can serve as the coagulation sinks for newly formed particles and hence can prevent them from growing to the CCN sizes. For example, under the double background PNSD condition, the NCN reached its peak of about 38 000 cm−3 at about 11:00 LT and quickly dropped afterward. The newly formed particles contributed about 3000 cm−3 to the NCCN or an AR of about 0.45 at about 17:30 LT, which is an insignificant change compared to the value for the nonevent period, implying that under a high background particle concentration, NPF events have a minor contribution to the NCCN. Doubling or halving of the FR resulted, respectively, in contributions of about 11 000 and 5000 cm−3 to the NCCN; however, the magnitude of contribution from variation of the FR was relatively lower than that from the GR and the background PNSD.
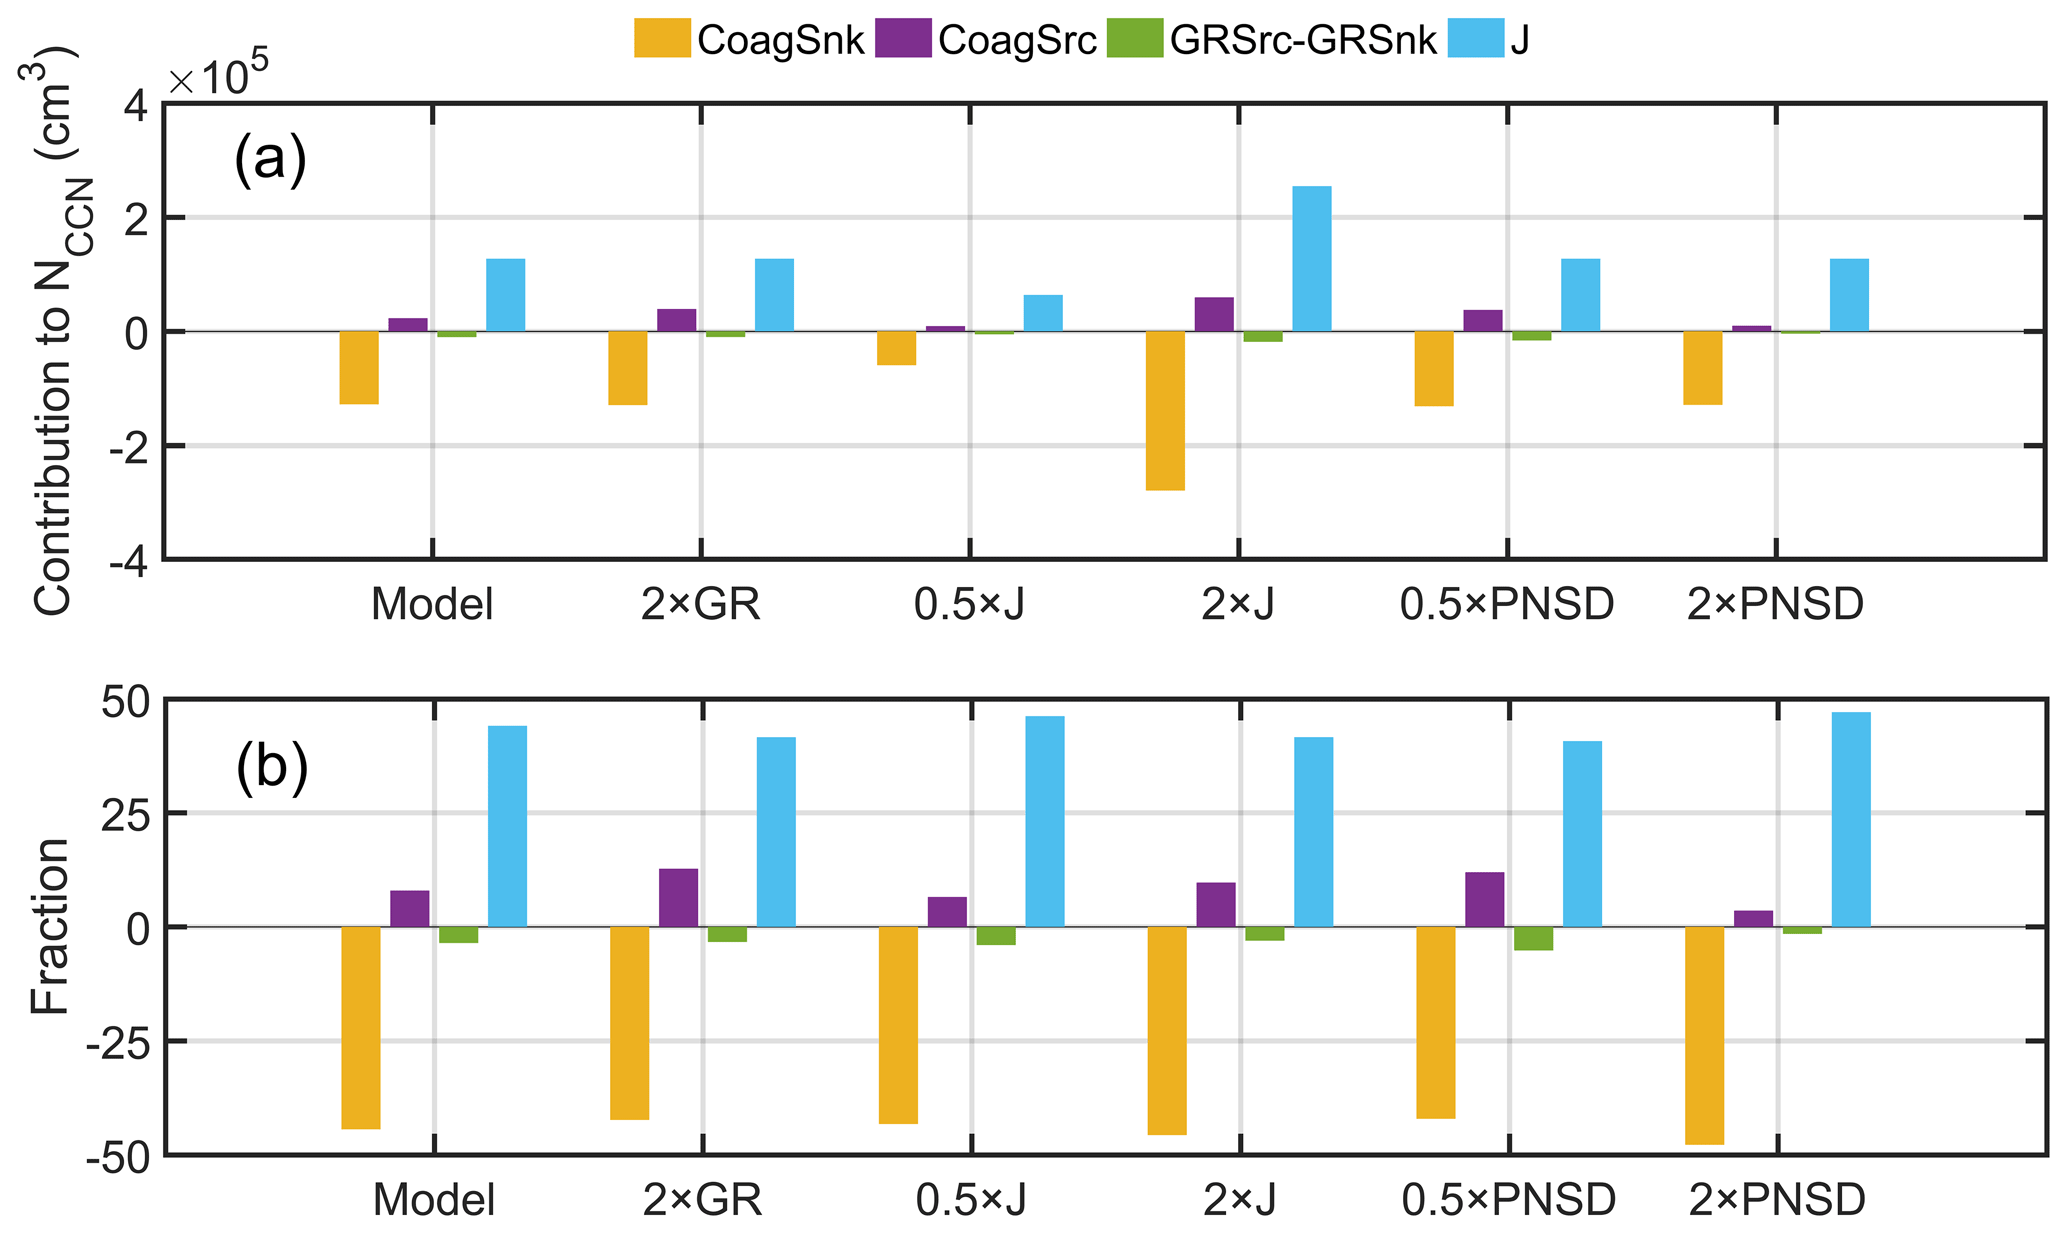
Figure 7The number contribution (a) and its fraction (b) of CoagSnk term, CoagSrc term, GR term, and formation (J) term to the NCCN when it reached its peak value based on different case scenarios.
Figure 7 shows the comparison of the itemized absolute and fractional contribution of coagulation sink, coagulation source, GR, and J to the NCCN for the above several scenarios (model, double GR, half or double J, and half or double PNSD). Here, the individual contribution was integrated from the corresponding term in Eq. (12) for all particle sizes from the initial time of the NPF event to the time when the NCCN reached the peak concentration. As clearly shown in Fig. 7, the coagulation source term plays a more important role in the NCCN (with a fraction of about 13 %) for the double GR case than any other cases. As discussed above, doubling of FR (J) and halving of PNSD led to similar NCCN peak values (about 15 000 and 13 500 cm−3, respectively); however, the dynamic processes for the two scenarios were significantly different. For the double J case, the formation term contributed about 240 000 cm−3 to the NCCN, which was much higher than the half PNSD case, and the CoagSnk and CoagSrc terms were much higher (about −260 000 and 50 000 cm−3, respectively) than any other cases due to formation of high concentration of newly formed particles. Moreover, under the double J scenario, the fraction of the CoagSnk term was higher, while the CoagSrc term was lower than the half PNSD case, indicating a more significant coagulation scavenging with preexisting particles. As a result, the NCN quickly dropped from its peak value to a concentration level similar to the half PNSD case within 1 h (Fig. 6a). Based on the above reasons, the contribution of the newly formed particles to the NCCN was relatively smaller for the double J case than the double GR or half PNSD cases, although its coagulation source term and J term were the highest among all the cases.
To compare different impacts of the characteristics and properties of newly formed particles, the NCCN was simulated through varying parameters of different characteristics (cases 1, 4, and 7) and properties (cases 2, 3, 5, 6, 8, and 9). The input parameters for different cases are shown in Table S1. For case 2, 3, 5, 6, 8, and 9 scenarios, the surface tension or hygroscopicity was adjusted to match similar NCCN values based on different NPF characteristics (cases 1, 4, and 7). The results show that doubling GR produces the most significant impact on the NCCN, and the surface tension (κ value) was adjusted to 0.030 N m−1 (1.2) to have the same impact (Fig. 8a). Obviously, a κ value of 1.2 for hygroscopicity is much higher than that of many inorganics, e.g., H2SO4 (κ=0.90; Topping et al., 2005) and NH4NO3 (0.58; Topping et al., 2005). Meanwhile, the surface tension was lower than the values (0.049–0.060) reported previously (Ovadnevaite et al., 2017; Engelhart et al., 2008; Cai et al., 2018). However, doubling GR value (16.0 nm h−1) was reasonable and consistent with previous studies (Mönkkönen et al., 2005; Foucart et al., 2018; O'Dowd et al., 1999), suggesting significant contribution of GR to the growth. For doubling formation rate and halving PNSD, the modified surface tension and κ values were minor (Fig. 8b and c).
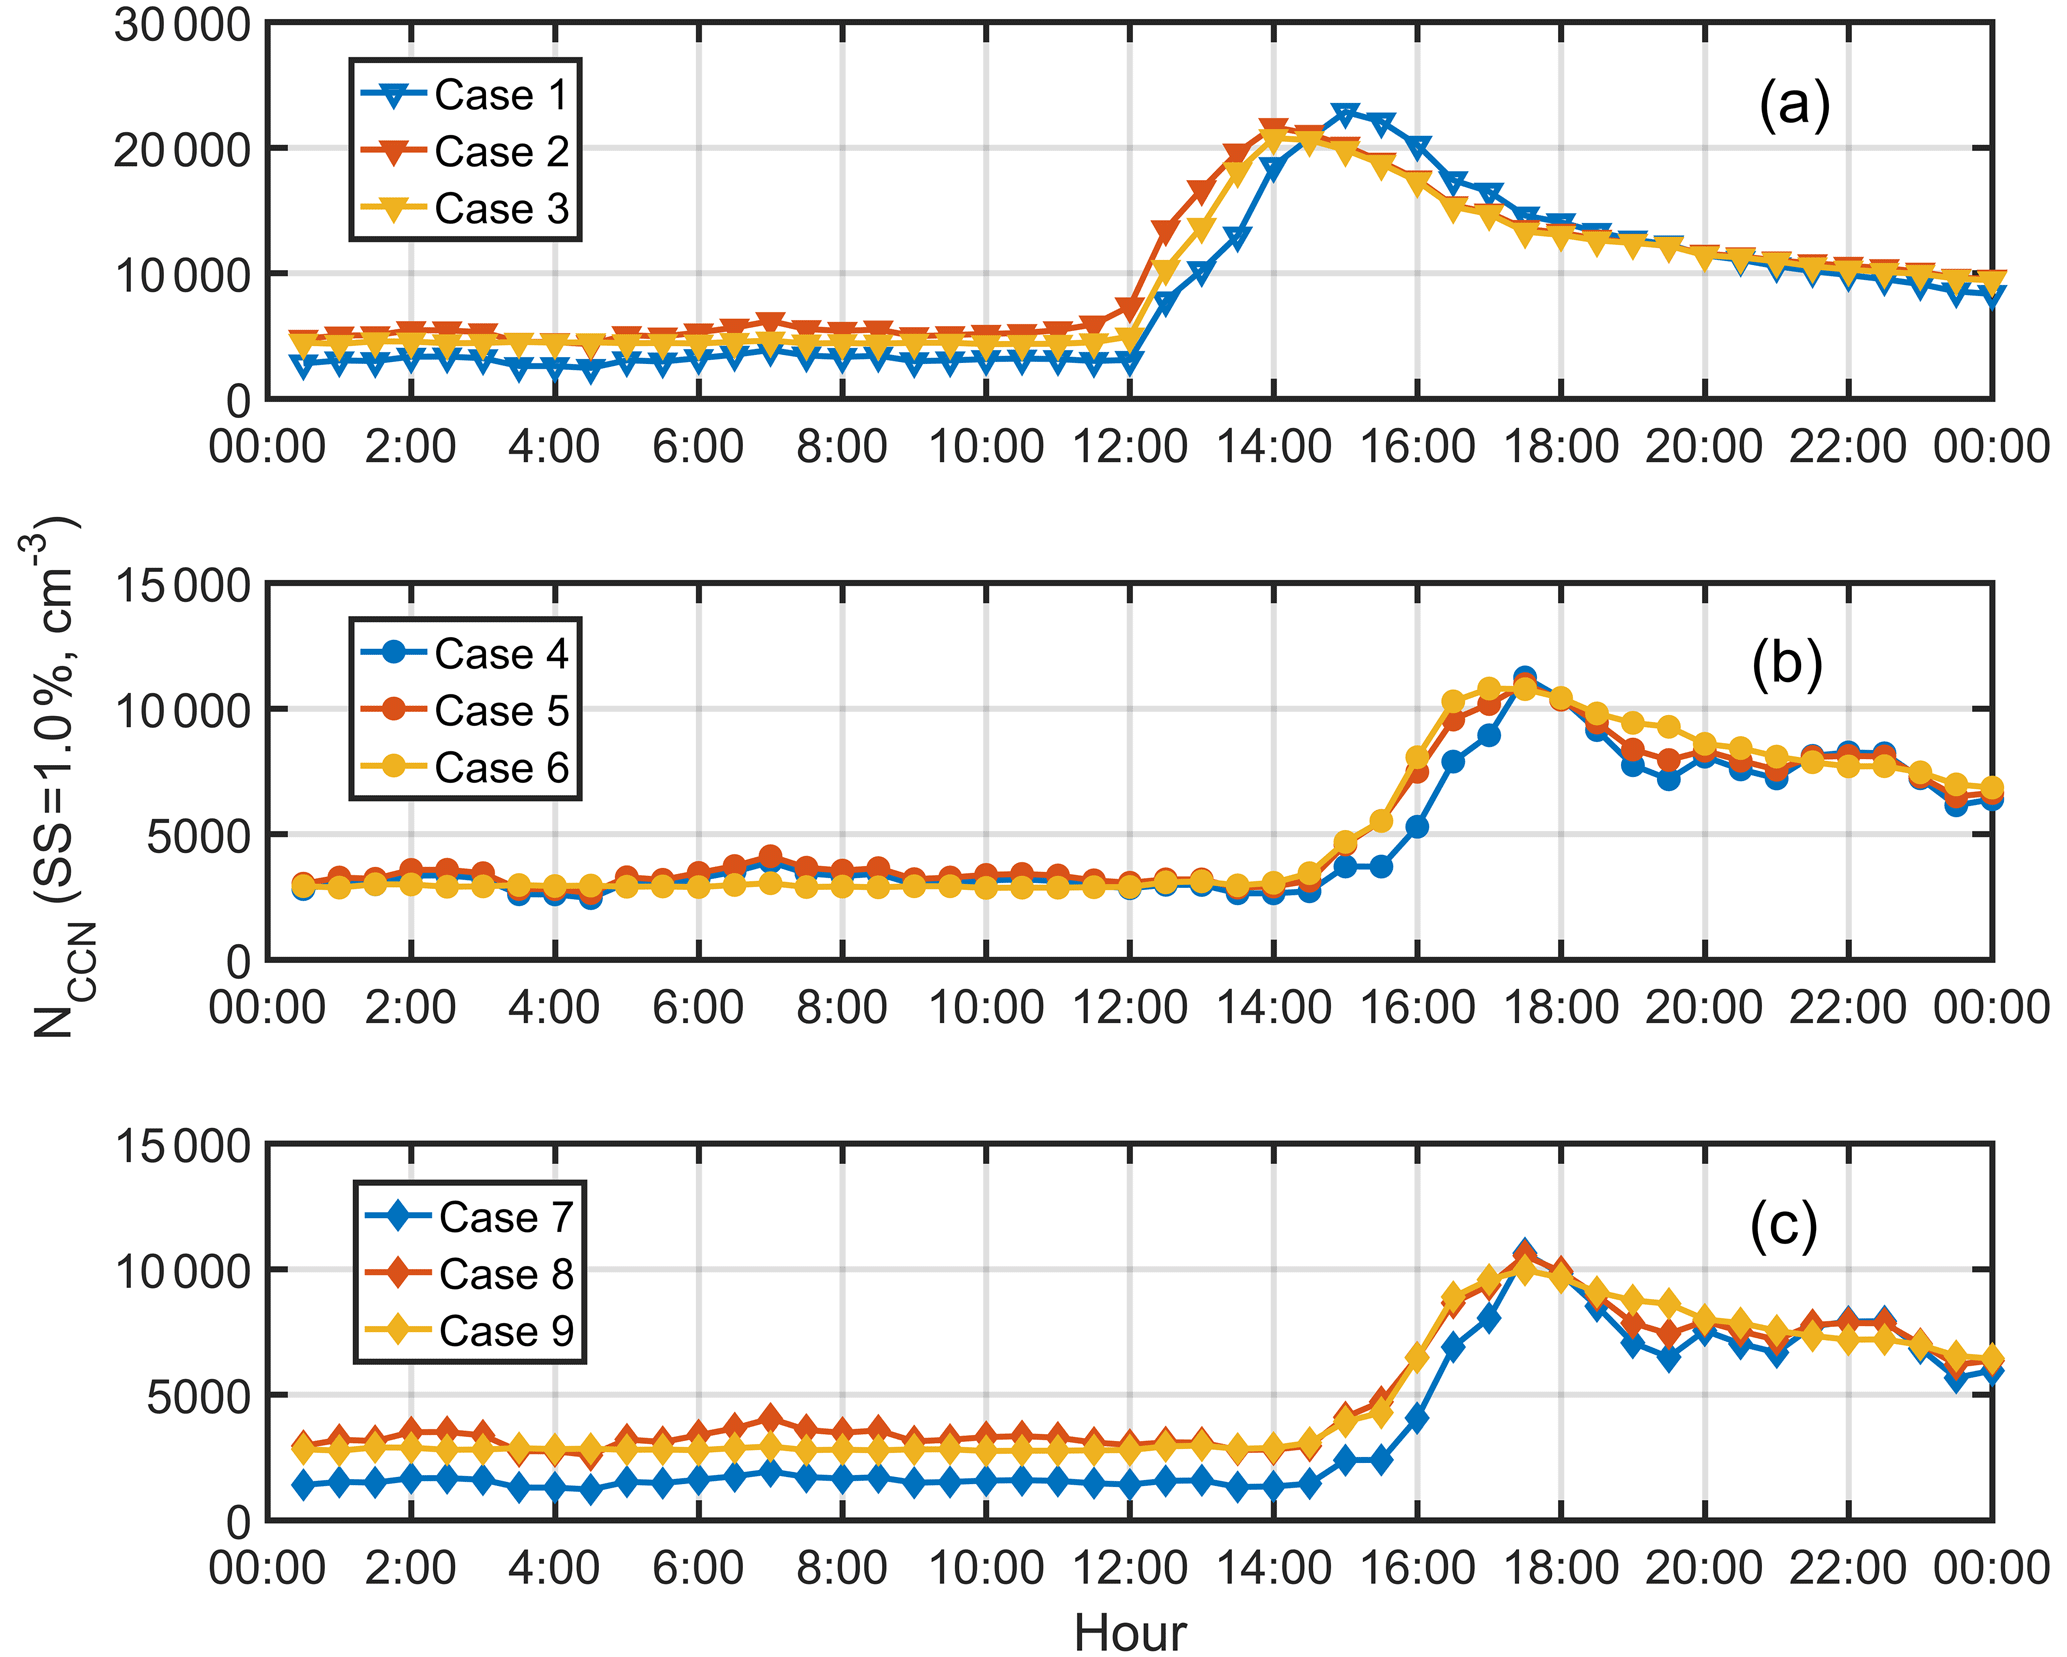
Figure 8The model NCCN based on different characteristics (doubling growth rate and formation rate and halving background particle distribution) and particle properties. Different colors and markers represent cases 1–9.
3.4 Modeling of the impact factors on the NCCN during NPF events
Here we include two more NPF events to investigate the influence of several important impact factors (growth rate, formation rate, and background particles) on the NCCN: one from this campaign (18 October 2019) and another from the field campaign in Panyu (12 December 2014). Both campaigns were conducted in the PRD region, details of the field campaign in Panyu can be found in Cai et al. (2018). We applied the same model to simulate NPF as discussed in the previous section. Figure 9 shows the measured (a), modeled PNSD (b), along with the NCN (c). For a better comparison among all the cases, all the modeled PNSDs were based on the measured formation rate (J10) due to a lack of measurement data for particles below 10 nm in the Panyu campaign. The background particle distributions were assumed to be the average values before 07:00 LT. In addition, since no measurement data were available for the CCN activity at 1.0 % SS during the Panyu campaign, the NCCN for this campaign was calculated from the average CCN activation curve at 1.0 % SS in the two Heshan events and the PNSD of the Panyu event using following equation,
where ARi is the average activation ratio (in Heshan) at Dpi, and ni is the particle distribution function (in Panyu) at Dpi.
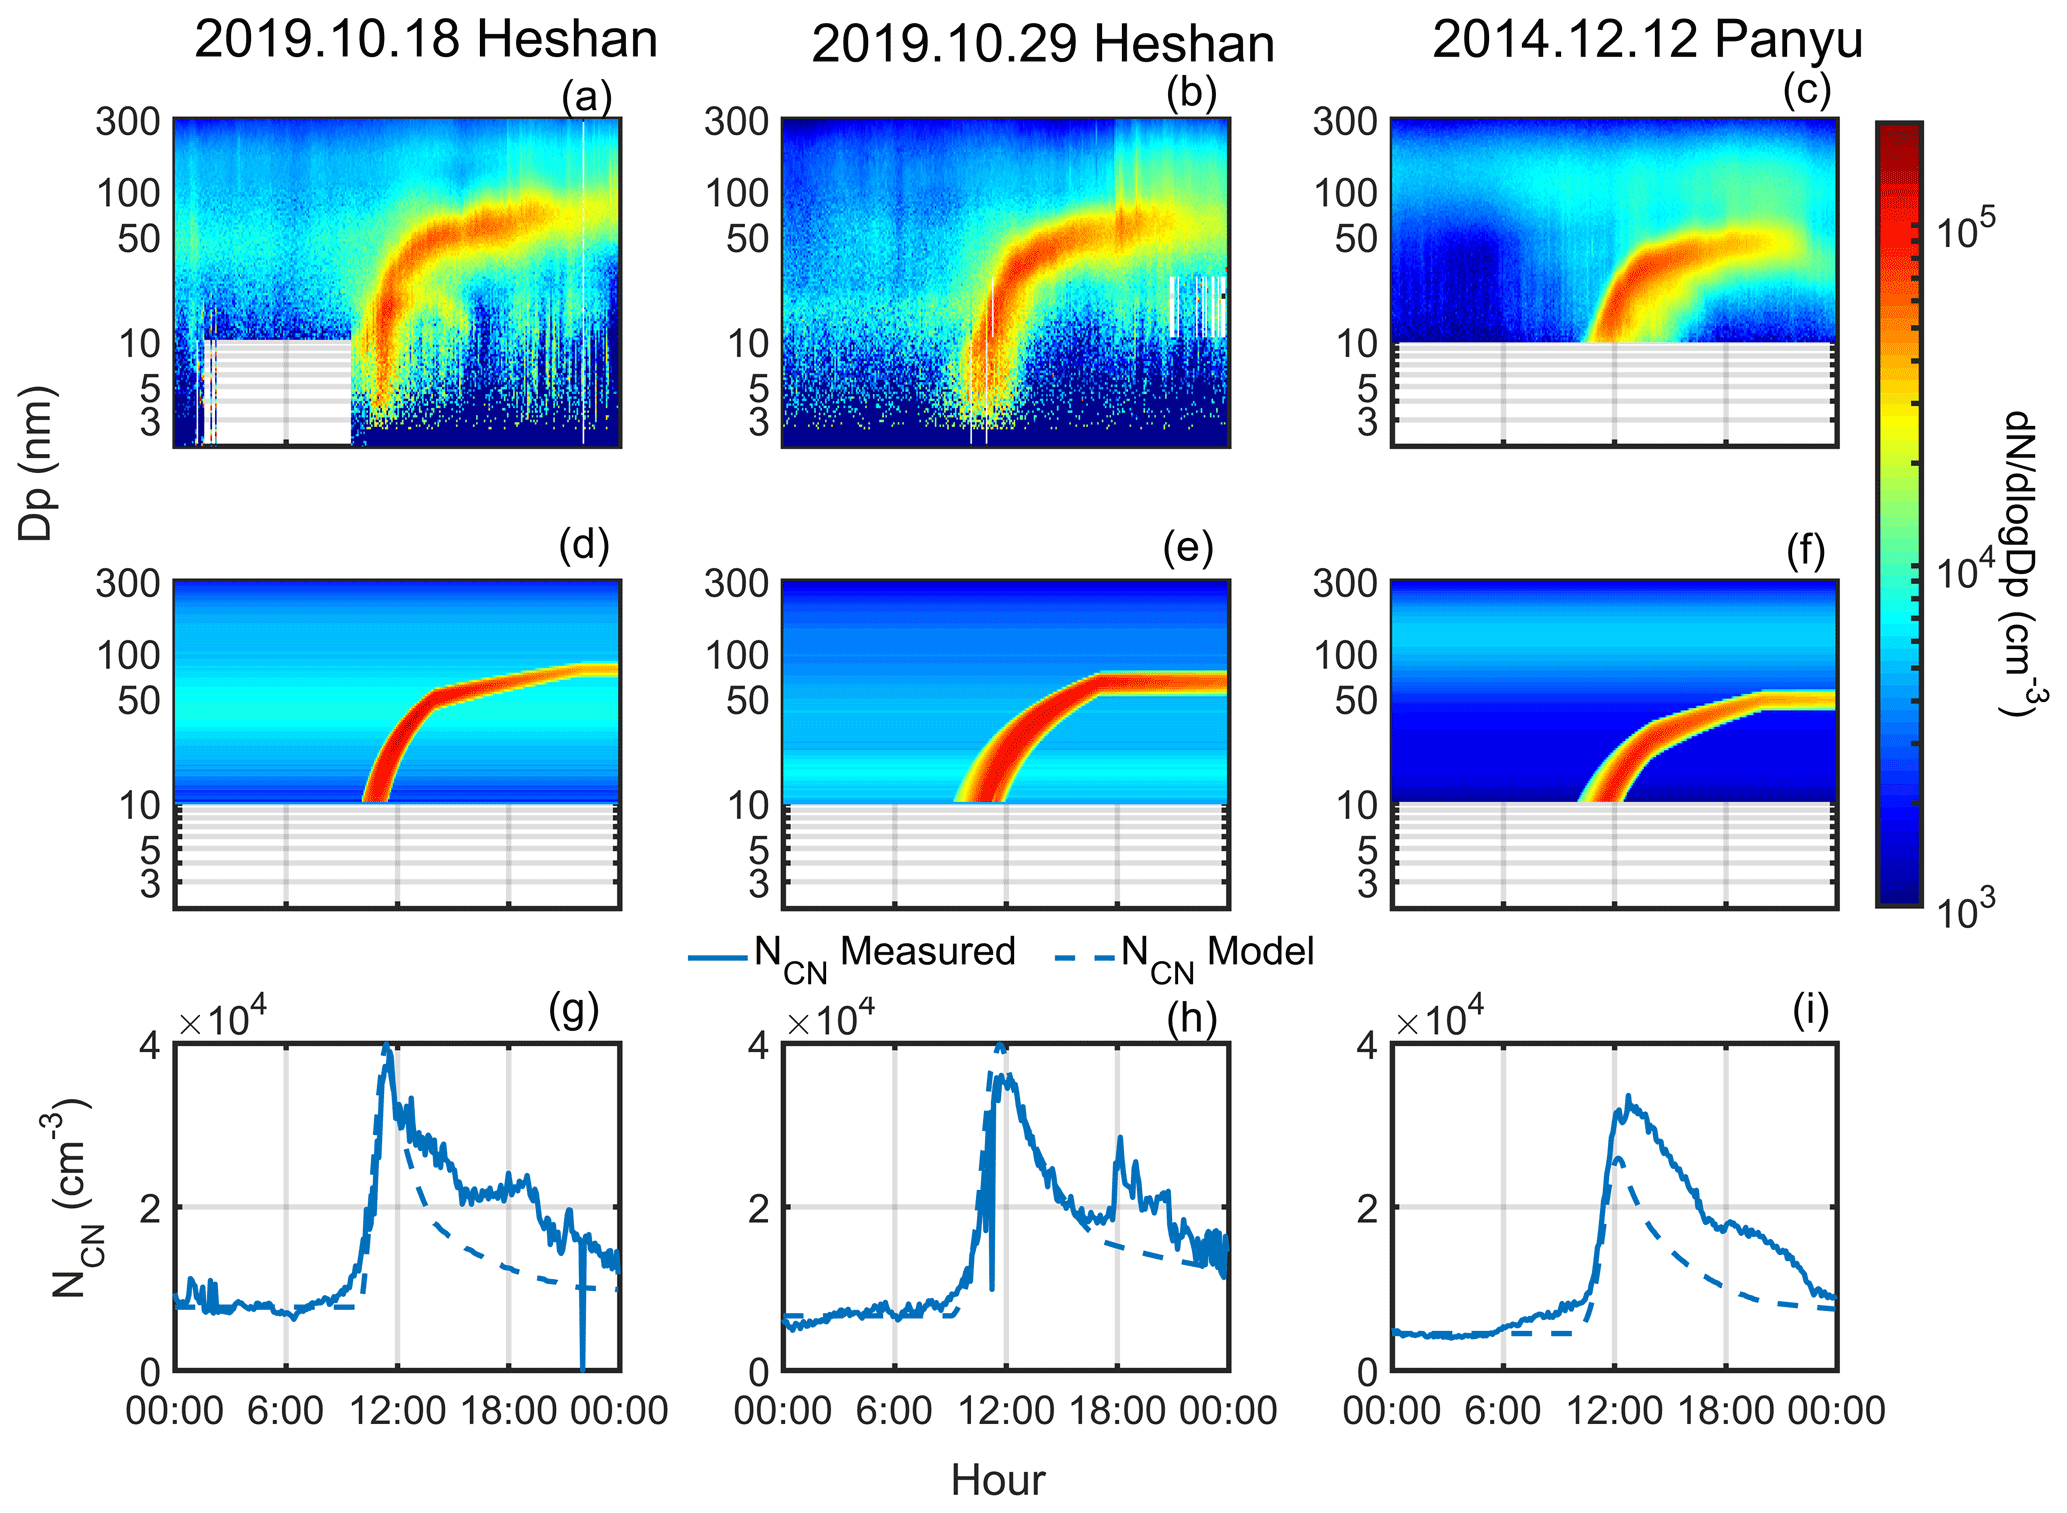
Figure 9The measured PNSD (a, b, c), modeled PNSD (d, e, f), and measured NCN and modeled NCN (g, h, i) during different NPF events. Solid and dashed lines represent the measured and modeled NCN trends, respectively.
In general, the modeled PNSDs agreed well with the measured ones for the NPF events under investigation (Fig. 9a–f). The NCN values were excellently predicted during the initial particle formation period before the maximum values were reached (Fig. 9g–i). In particular, the NCN was well predicted for the study case (the 29 October event) except for the period when the air mass changed as has been discussed in the previous section. For the 18 October event, however, the model underpredicted the NCN shortly after it reached the peak value which can be attributed to significant variation of Aitken mode during the event. For example, the model failed to reproduce concentration trend of 10–60 nm particle at the early event stage (Fig. 10a–b). For the 12 December event, the model underpredicted a significantly lower peak concentration (about 4100 cm−3 lower) at about 12:00 LT (midday) than the measured one, due probably to the presence of a significant amount of larger background particles (100–200 nm) which were not taken into account in the model (Figs. 9c and 10c). As a result, the NCCN was underpredicted in two Heshan events (Fig. 10a–b), owing to the fluctuation of background particle distribution and unexplained increase in concentration of particles at a size range of 10–60 nm at the beginning of the event. While for the Panyu event (the 12 December event), a significant underestimate (about 4100 cm−3 lower than the measured NCN) for the peak concentration was made at about 12:00 LT (midday), due probably to the presence of a significant amount of other bigger background particles (100–200 nm) after 12:00 LT (midday), which was not able to be taken into account in the model (Fig. 9c). Thus, the predicted NCCN value was substantially lower than the measured one for the 12 December event (Fig. 10c). This also indicates that the NCCN was primarily contributed to from the background preexisting particles rather than newly formed particles from the NPF event on the 12 December event case. The maximum modeled peak NCCN value (about 7000 cm−3) is significantly lower that of the other two events (about 15 000 and 12 000 cm−3, respectively), which could be attributed to the lower growth rates, formation rate, and the high CS value (Fig. S8 for J10 and Table S2 for GR and CS). We further simulate the 12 December event to investigate the most important impact factor that influences the NCCN using different characteristics from the two other NPF events (Fig. 11), including the growth rate for the 18 October event (high growth rate scenario), the formation rate for the 29 October event (high formation rate scenario), and the background PNSD for the 29 October event (mainly distributed in Aitken mode, denoted as low CS PNSD scenario). The results show that all the new modeled NCN value were higher than the initial modeled NCN value. The NCN was significantly increased and peaked earlier (with a peak value about 38 000 cm−3) under the high formation rate scenario, while the NCCN was mainly affected and also peaked earlier under the high growth rate scenario. The peak value of NCCN increased from 6000 to 14 000 cm−3 and the peak time varied from 20:00 to 16:00 LT. The NCN value increased under the low CS PNSD scenario; however, the NCCN barely changed, implying that larger size particles in the preexisting background play a more important role in scavenging newly formed particles. We hence conclude that the newly formed particles with a higher growth rate would grow faster to the CCN size by avoiding higher number concentration losses in the atmosphere (Fig. S9a). Our results highlight the importance of particle growth rate in modulating the NCCN during NPF events.
It should be noted that the three NPF events discussed in this study were generally “Class I” regional NPF events, for which the growth rate and formation rate could be obtained with high confidence (Dal Maso et al., 2005). Other types (i.e., Class II proposed by Dal Maso et al., 2005) were not considered since their growth rates and formation rates are extremely difficult to be determined, leading to high uncertainties in model simulation of these events. In addition, we did not include the “transport” type of NPF events, for which new particles were formed somewhere else and then transported to the measurement site, because the model ignores the impact of transport. Some events belonging to Class II type and transport type were observed during the campaign (Fig. S10). For the Class II type (Fig. S10a), the number concentration and diameter of the nucleation and Aitken mode particles vary significantly. For the transport type (Fig. S10b), the concentration of 3–30 nm particles at 10:00–12:00 LT was much lower than that of 30–70 nm at 12:00–20:00 LT, indicating the impact of transport. Investigation on the contribution of other NPF types to the NCCN is needed in future studies. Moreover, this study only analyzed three NPF events as representatives of Class I type in the PRD region, and more field campaigns in other regions and seasons are also needed to identify the major impact factor.
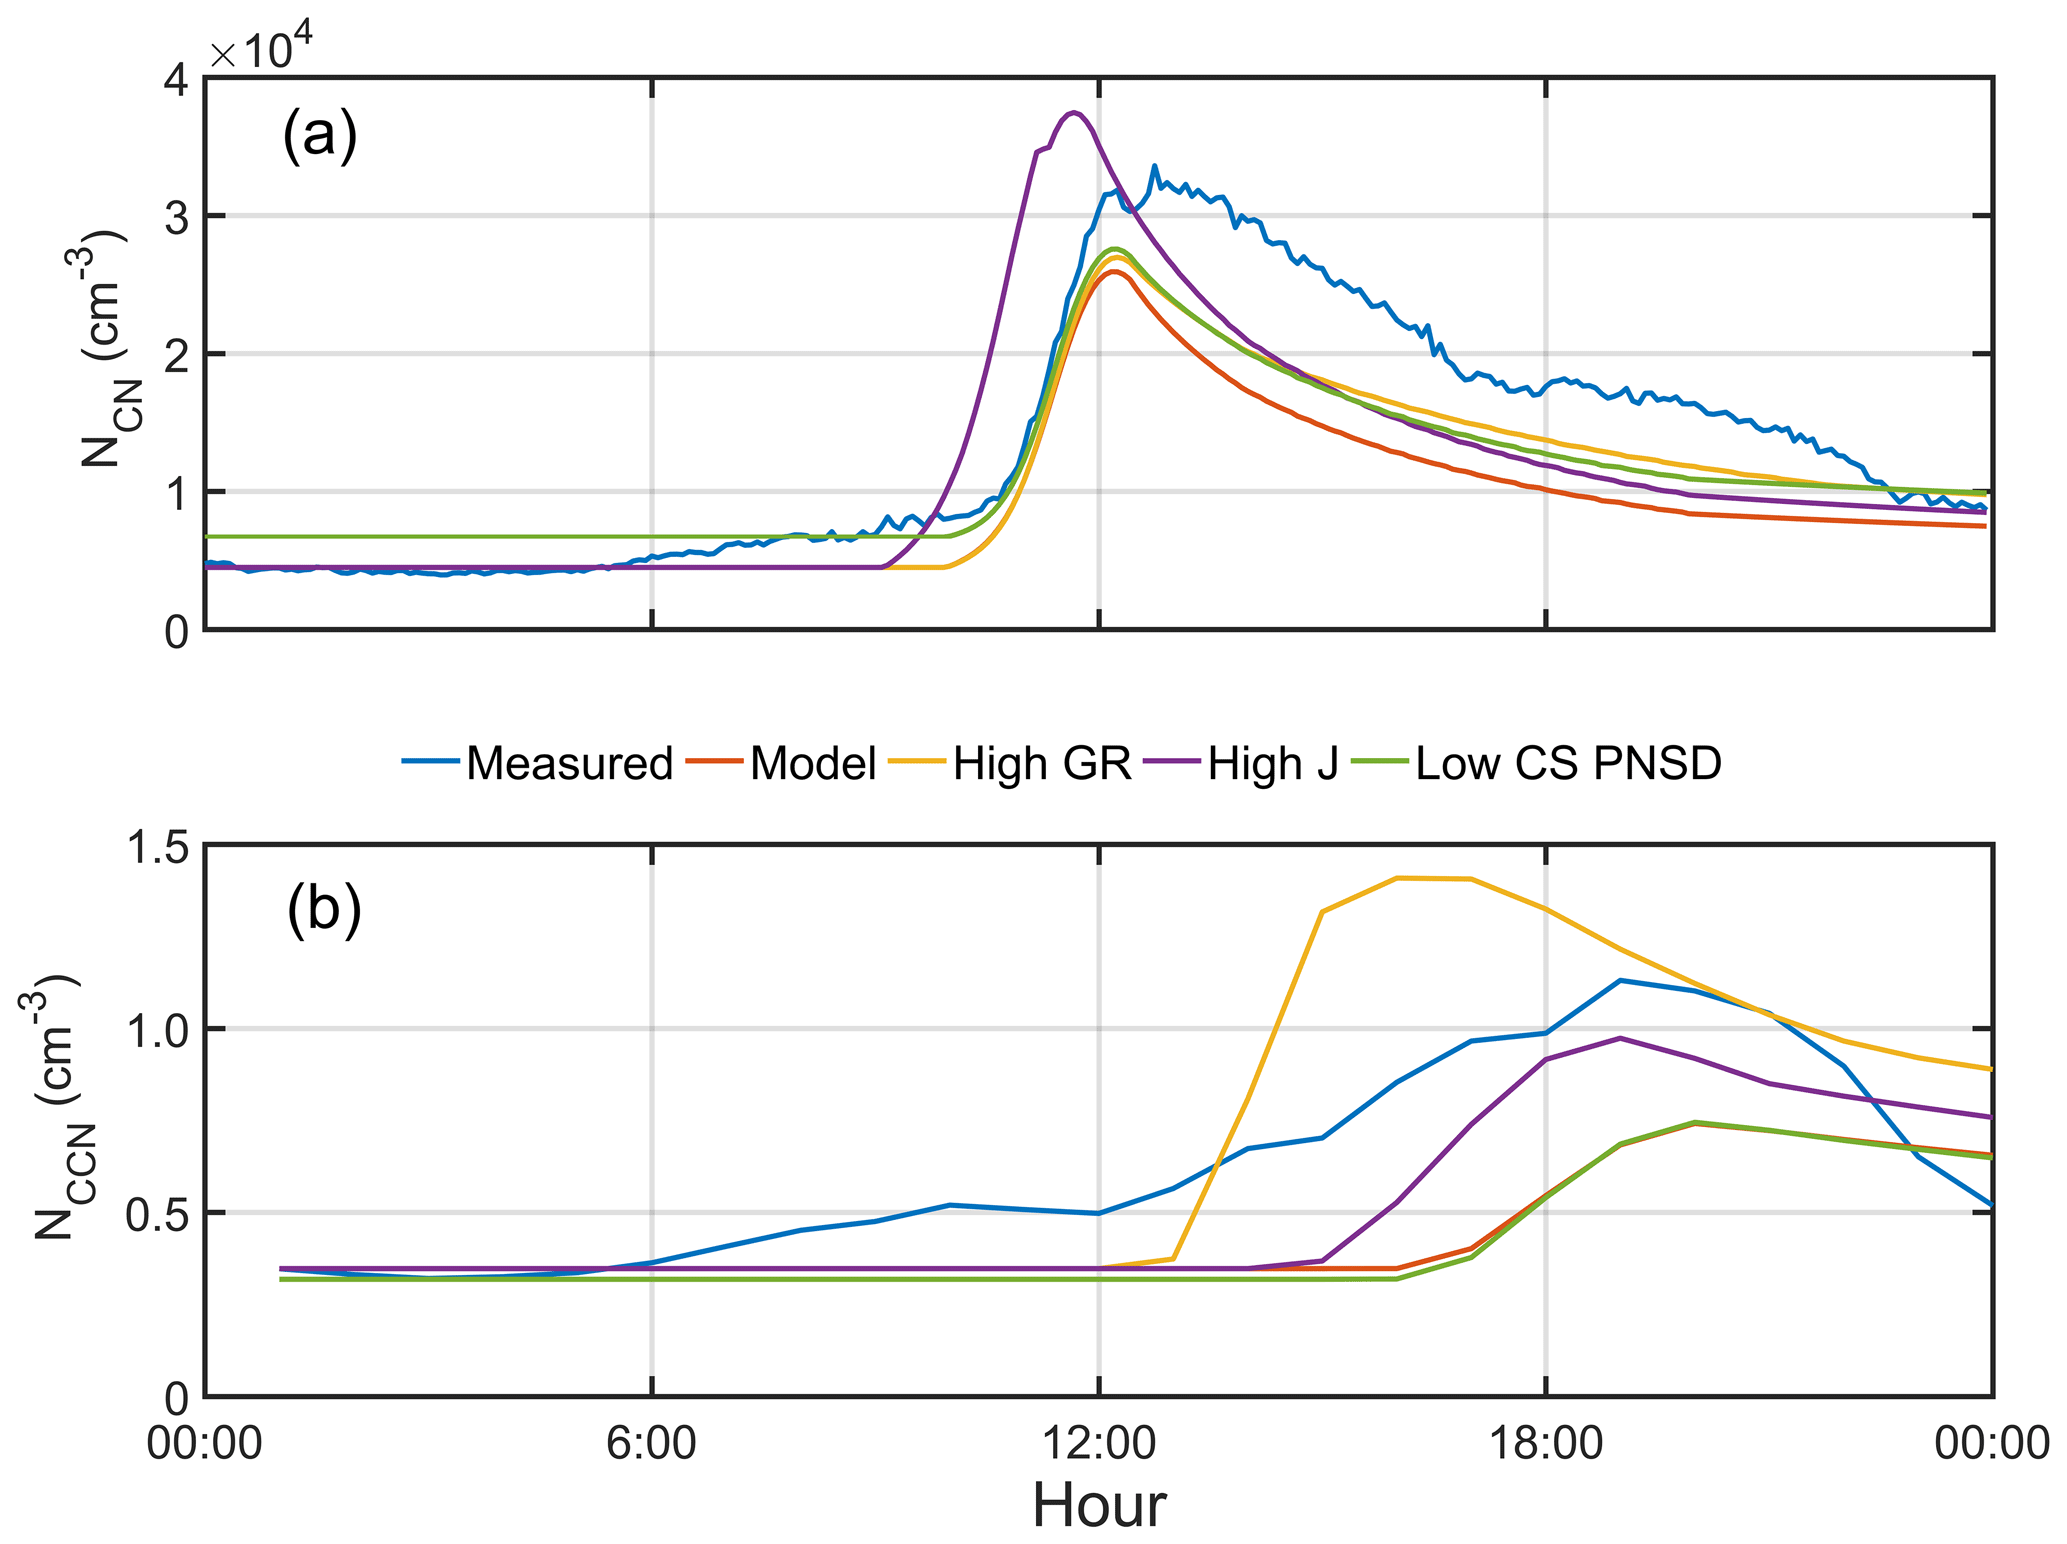
Figure 11The measured and modeled NCN (a) and NCCN (b) on the Panyu NPF event. The blue line represents the measured value. The red, yellow, purple, and green lines represent the simulated NCCN based on standard input, growth rate of the NPF event on 18 October (referred to as high GR), formation rate of the NPF event on 29 October (referred to as high J), and background particle distribution of the NPF event on 29 October (referred to as low CS PNSD), respectively.
Field measurements were conducted at a rural site in the PRD region of China during October and November 2019. The contribution of new particle formation (NPF) to the NCCN was investigated based on three chosen NPF events including two (29 October and 18 November 2019) from this field campaign and one (12 December 2014) from a previous campaign in Panyu. The effects of several controlling factors on the contribution were explored to better understand the CCN activation process. These factors include formation rate, growth rate, background particle distribution, hygroscopicity, and surface tension of the particles. Significant discrepancies were found for the κ values between measurements under supersaturation (using CCNc) and those under subsaturation (using HTDMA), due partly to the pure-water assumption for the surface tension when calculating the κ values based on the CCNc measurements. Organics in the particles could act as surfactants to lower the surface tension which facilitates CCN activation during NPF events. The results show that a surface tension value of about 0.060 N m−1 instead of 0.073 N m−1 (pure-water assumption) could decrease the D50 (SS = 1.0%) for 10 nm particles, bringing the agreement of the κ values between CCNc and HTDMA measurements. The surfactant effects caused by organics in the particles would increase the NCCN at SS = 1.0 % by about 20 % during nonevent periods and by about 40 % during NPF events. In addition, an earlier peak time was also observed, because much higher number concentrations of small particles (3–100 nm) during the event would lead to smaller D50.
The dynamic population balance equations were employed to qualitatively simulate NPF events under different case scenarios (coagulation term, formation term, and growth term). Sensitivity studies were then performed to analyze the contribution of each aforementioned term to the NCCN. The results show that high formation rates, high growth rates, and low background particle concentrations lead to high total and CCN concentrations, although different mechanisms were attributed to the high NCN and NCCN. High formation rates lead to high particle production in the atmosphere; likewise, high growth rates produce a broad distribution of new particles and further increase the coagulation sources, while low background concentrations result in low coagulation scavenging with preexisting particles. Among these controlling factors, the growth rate was found to have the most significant impact on the NCCN, because a faster growth for newly formed particles resulted in growing these particles to the CCN sizes in a shorter time before they were scavenged by preexisting particles. The NCCN (SS = 1.0 %) measured from the chosen event on 12 December 2014 was significantly lower than that from two other chosen events, initially attributed to the low growth rate, low formation rate, and low background particle concentration. Sensitivity tests were then performed under different scenarios (the highest growth rate form the event on 18 October, and the highest formation rate and the lowest CS from the event on 29 October, respectively) with change of only one factor for each simulation. The results show that the peak value of the modeled NCCN increased from 6000 to 14 000 cm−3 with the new applied growth rate, leading to a similar value to that from the event on 18 October, while the modeled NCCN values were barely affected under the two other scenarios. These results highlight the importance of the growth rate in the contribution of the controlling factors to the NCCN. We concluded that surface tension and growth rate played a major role in the contribution of the NPF event to the NCCN. More work on the other NPF cases is obviously needed in order to better understand the contribution to the NCCN and its impact on climate.
Data from the measurements are available upon request (Bin Yuan via byuan@jnu.edu.cn).
The supplement related to this article is available online at: https://doi.org/10.5194/acp-21-8575-2021-supplement.
MC, MS, and BY designed the research. MC, MS, BY, SH, YP, ZW, DC, BL, and QS performed the measurements. MC, BY, JZ, HT, FL, SH, HX, LL, YP, ZW, BL, and QS analyzed the data. MC, BY, and JZ wrote the paper with contributions from all co-authors.
The authors declare that they have no conflict of interest.
Additional support from the crew of the Heshan Supersite and Guangdong Environmental Monitoring Center is greatly acknowledged. We also thank two anonymous referees for valuable comments and suggestions.
This research has been supported by the Key Area Research and Development Program of Guangdong Province (grant no. 2019B110206001), the National Key R&D Plan of China (grant nos. 2019YFE0106300 and 2018YFC0213904), the National Natural Science Foundation of China (grant nos. 41877302, 91644225, and 41775117), the Guangdong Natural Science Funds for Distinguished Young Scholar (grant no. 2018B030306037), the Guangdong Innovative and Entrepreneurial Research Team Program (grant no. 2016ZT06N263), the Guangdong Province Key Laboratory for Climate Change and Natural Disaster Studies (grant no. 2020B1212060025), the Guangdong Basic and Applied Basic Research Foundation (grant nos. 2019A1515110790 and 2019A1515110791), and the Science and Technology Research project of Guangdong Meteorological Bureau (grant no. GRMC2018M07).
This paper was edited by Veli-Matti Kerminen and reviewed by two anonymous referees.
An, J., Wang, H., Shen, L., Zhu, B., Zou, J., Gao, J., and Kang, H.: Characteristics of new particle formation events in Nanjing, China: Effect of water-soluble ions, Atmos. Environ., 108, 32–40, https://doi.org/10.1016/j.atmosenv.2015.01.038, 2015.
Asmi, E., Frey, A., Virkkula, A., Ehn, M., Manninen, H. E., Timonen, H., Tolonen-Kivimäki, O., Aurela, M., Hillamo, R., and Kulmala, M.: Hygroscopicity and chemical composition of Antarctic sub-micrometre aerosol particles and observations of new particle formation, Atmos. Chem. Phys., 10, 4253–4271, https://doi.org/10.5194/acp-10-4253-2010, 2010.
Bertram, A. K., Martin, S. T., Hanna, S. J., Smith, M. L., Bodsworth, A., Chen, Q., Kuwata, M., Liu, A., You, Y., and Zorn, S. R.: Predicting the relative humidities of liquid-liquid phase separation, efflorescence, and deliquescence of mixed particles of ammonium sulfate, organic material, and water using the organic-to-sulfate mass ratio of the particle and the oxygen-to-carbon elemental ratio of the organic component, Atmos. Chem. Phys., 11, 10995–11006, https://doi.org/10.5194/acp-11-10995-2011, 2011.
Boy, M., Kulmala, M., Ruuskanen, T. M., Pihlatie, M., Reissell, A., Aalto, P. P., Keronen, P., Dal Maso, M., Hellen, H., Hakola, H., Jansson, R., Hanke, M., and Arnold, F.: Sulphuric acid closure and contribution to nucleation mode particle growth, Atmos. Chem. Phys., 5, 863–878, https://doi.org/10.5194/acp-5-863-2005, 2005.
Cai, M., Tan, H., Chan, C. K., Qin, Y., Xu, H., Li, F., Schurman, M. I., Liu, L., and Zhao, J.: The size-resolved cloud condensation nuclei (CCN) activity and its prediction based on aerosol hygroscopicity and composition in the Pearl Delta River (PRD) region during wintertime 2014, Atmos. Chem. Phys., 18, 16419–16437, https://doi.org/10.5194/acp-18-16419-2018, 2018.
Cai, M., Liang, B., Sun, Q., Zhou, S., Chen, X., Yuan, B., Shao, M., Tan, H., and Zhao, J.: Effects of continental emissions on cloud condensation nuclei (CCN) activity in the northern South China Sea during summertime 2018, Atmos. Chem. Phys., 20, 9153–9167, https://doi.org/10.5194/acp-20-9153-2020, 2020.
Cai, R. and Jiang, J.: A new balance formula to estimate new particle formation rate: reevaluating the effect of coagulation scavenging, Atmos. Chem. Phys., 17, 12659–12675, https://doi.org/10.5194/acp-17-12659-2017, 2017.
Casquero-Vera, J. A., Lyamani, H., Dada, L., Hakala, S., Paasonen, P., Román, R., Fraile, R., Petäjä, T., Olmo-Reyes, F. J., and Alados-Arboledas, L.: New particle formation at urban and high-altitude remote sites in the south-eastern Iberian Peninsula, Atmos. Chem. Phys., 20, 14253–14271, https://doi.org/10.5194/acp-20-14253-2020, 2020.
Chen, C., Hu, M., Wu, Z., Wu, Y., Guo, S., Chen, W., Luo, B., Zhang, Y., and Xie, S.: Characterization of new particle formation event in the rural site of Sichuan Basin and its contribution to cloud condensation nuclei, China Environ. Sci., 34, 2764–2772, 2014 (in Chinese).
Dal Maso, M., Kulmala, M., Riipinen, I., Wagner, R., Hussein, T., Aalto, P. P., and Lehtinen, K. E. J.: Formation and growth of fresh atmospheric aerosols: eight years of aerosol size distribution data from SMEAR II, Hyytiälä, Finland, Boreal Environ. Res., 10, 323–336, 2005.
Dameto de España, C., Wonaschütz, A., Steiner, G., Rosati, B., Demattio, A., Schuh, H., and Hitzenberger, R.: Long-term quantitative field study of New Particle Formation (NPF) events as a source of Cloud Condensation Nuclei (CCN) in the urban background of Vienna, Atmos. Environ., 164, 289–298, https://doi.org/10.1016/j.atmosenv.2017.06.001, 2017.
Deng, Y., Yai, H., Fujinari, H., Kawana, K., Nakayama, T., and Mochida, M.: Diurnal variation and size dependence of the hygroscopicity of organic aerosol at a forest site in Wakayama, Japan: their relationship to CCN concentrations, Atmos. Chem. Phys., 19, 5889–5903, https://doi.org/10.5194/acp-19-5889-2019, 2019.
Engelhart, G. J., Asa-Awuku, A., Nenes, A., and Pandis, S. N.: CCN activity and droplet growth kinetics of fresh and aged monoterpene secondary organic aerosol, Atmos. Chem. Phys., 8, 3937–3949, https://doi.org/10.5194/acp-8-3937-2008, 2008.
Farmer, D. K., Cappa, C. D., and Kreidenweis, S. M.: Atmospheric Processes and Their Controlling Influence on Cloud Condensation Nuclei Activity, Chem. Rev., 115, 4199, https://doi.org/10.1021/cr5006292, 2015.
Freedman, M. A.: Phase separation in organic aerosol, Chem. Soc. Rev., 46, 7694–7705, https://doi.org/10.1039/C6CS00783J, 2017.
Foucart, B., Sellegri, K., Tulet, P., Rose, C., Metzger, J.-M., and Picard, D.: High occurrence of new particle formation events at the Maïdo high-altitude observatory (2150 m), Réunion (Indian Ocean), Atmos. Chem. Phys., 18, 9243–9261, https://doi.org/10.5194/acp-18-9243-2018, 2018.
Fuchs, N. and Sutugin, A.: High Dispersed Aerosols, Topics in Current Aerosol Research, in: International Reviews in Aerosol Physics and Chemistry, Pergamon Press Oxford, Oxford, UK, 5–60, 1971.
Jiang, J., Zhao, J., Chen, M., Eisele, F. L., Scheckman, J., Williams, B. J., Kuang, C., and McMurry, P. H.: First Measurements of Neutral Atmospheric Cluster and 1–2 nm Particle Number Size Distributions During Nucleation Events, Aerosol Sci. Tech., 45, 2–5, https://doi.org/10.1080/02786826.2010.546817, 2011.
Kalkavouras, P., Bossioli, E., Bezantakos, S., Bougiatioti, A., Kalivitis, N., Stavroulas, I., Kouvarakis, G., Protonotariou, A. P., Dandou, A., Biskos, G., Mihalopoulos, N., Nenes, A., and Tombrou, M.: New particle formation in the southern Aegean Sea during the Etesians: importance for CCN production and cloud droplet number, Atmos. Chem. Phys., 17, 175–192, https://doi.org/10.5194/acp-17-175-2017, 2017.
Kuang, C., Chen, M., Zhao, J., Smith, J., McMurry, P. H., and Wang, J.: Size and time-resolved growth rate measurements of 1 to 5 nm freshly formed atmospheric nuclei, Atmos. Chem. Phys., 12, 3573–3589, https://doi.org/10.5194/acp-12-3573-2012, 2012.
Kulmala, M., Vehkamäki, H., Petäjä, T., Dal Maso, M., Lauri, A., Kerminen, V. M., Birmili, W., and McMurry, P. H.: Formation and growth rates of ultrafine atmospheric particles: a review of observations, J. Aerosol Sci., 35, 143–176, https://doi.org/10.1016/j.jaerosci.2003.10.003, 2004.
Kulmala, M., Petäjä, T., Mönkkönen, P., Koponen, I. K., Dal Maso, M., Aalto, P. P., Lehtinen, K. E. J., and Kerminen, V.-M.: On the growth of nucleation mode particles: source rates of condensable vapor in polluted and clean environments, Atmos. Chem. Phys., 5, 409–416, https://doi.org/10.5194/acp-5-409-2005, 2005.
Kulmala, M., Petäjä, T., Nieminen, T., Sipilä, M., Manninen, H. E., Lehtipalo, K., Dal Maso, M., Aalto, P. P., Junninen, H., Paasonen, P., Riipinen, I., Lehtinen, K. E. J., Laaksonen, A., and Kerminen, V.-M.: Measurement of the nucleation of atmospheric aerosol particles, Nat. Protoc., 7, 1651–1667, https://doi.org/10.1038/nprot.2012.091, 2012.
Lehtinen, K. E. J. and Kulmala, M.: A model for particle formation and growth in the atmosphere with molecular resolution in size, Atmos. Chem. Phys., 3, 251–257, https://doi.org/10.5194/acp-3-251-2003, 2003.
Leng, C., Zhang, Q., Tao, J., Zhang, H., Zhang, D., Xu, C., Li, X., Kong, L., Cheng, T., Zhang, R., Yang, X., Chen, J., Qiao, L., Lou, S., Wang, H., and Chen, C.: Impacts of new particle formation on aerosol cloud condensation nuclei (CCN) activity in Shanghai: case study, Atmos. Chem. Phys., 14, 11353–11365, https://doi.org/10.5194/acp-14-11353-2014, 2014.
Liu, P. F., Zhao, C. S., Göbel, T., Hallbauer, E., Nowak, A., Ran, L., Xu, W. Y., Deng, Z. Z., Ma, N., Mildenberger, K., Henning, S., Stratmann, F., and Wiedensohler, A.: Hygroscopic properties of aerosol particles at high relative humidity and their diurnal variations in the North China Plain, Atmos. Chem. Phys., 11, 3479–3494, https://doi.org/10.5194/acp-11-3479-2011, 2011.
Liu, P. F., Song, M., Zhao, T., Gunthe, S. S., Ham, S., He, Y., Qin, Y. M., Gong, Z., Amorim, J. C., Bertram, A. K., and Martin, S. T.: Resolving the mechanisms of hygroscopic growth and cloud condensation nuclei activity for organic particulate matter, Nat. Commun., 9, 4076, https://doi.org/10.1038/s41467-018-06622-2, 2018.
Liu, S., Hu, M., Wu, Z., Wehner, B., Wiedensohler, A., and Cheng, Y.: Aerosol number size distribution and new particle formation at a rural/coastal site in Pearl River Delta (PRD) of China, Atmos. Environ., 42, 6275–6283, 2008.
Lu, Y., Yan, C., Fu, Y., Chen, Y., Liu, Y., Yang, G., Wang, Y., Bianchi, F., Chu, B., Zhou, Y., Yin, R., Baalbaki, R., Garmash, O., Deng, C., Wang, W., Liu, Y., Petäjä, T., Kerminen, V.-M., Jiang, J., Kulmala, M., and Wang, L.: A proxy for atmospheric daytime gaseous sulfuric acid concentration in urban Beijing, Atmos. Chem. Phys., 19, 1971–1983, https://doi.org/10.5194/acp-19-1971-2019, 2019.
Ma, N., Zhao, C., Tao, J., Wu, Z., Kecorius, S., Wang, Z., Größ, J., Liu, H., Bian, Y., Kuang, Y., Teich, M., Spindler, G., Müller, K., van Pinxteren, D., Herrmann, H., Hu, M., and Wiedensohler, A.: Variation of CCN activity during new particle formation events in the North China Plain, Atmos. Chem. Phys., 16, 8593–8607, https://doi.org/10.5194/acp-16-8593-2016, 2016.
Ma, S.-S., Chen, Z., Pang, S.-F., and Zhang, Y.-H.: Observations on hygroscopic growth and phase transitions of mixed 1, 2, 6-hexanetriol/(NH4)2SO4 particles: Investigation of liquid-liquid phase separation (LLPS) dynamic process and mechanism and secondary LLPS, Atmos. Chem. Phys. Discuss. [preprint], https://doi.org/10.5194/acp-2020-1299, in review, 2021.
Mikkonen, S., Romakkaniemi, S., Smith, J. N., Korhonen, H., Petäjä, T., Plass-Duelmer, C., Boy, M., McMurry, P. H., Lehtinen, K. E. J., Joutsensaari, J., Hamed, A., Mauldin III, R. L., Birmili, W., Spindler, G., Arnold, F., Kulmala, M., and Laaksonen, A.: A statistical proxy for sulphuric acid concentration, Atmos. Chem. Phys., 11, 11319–11334, https://doi.org/10.5194/acp-11-11319-2011, 2011.
Mönkkönen, P., Koponen, I. K., Lehtinen, K. E. J., Hämeri, K., Uma, R., and Kulmala, M.: Measurements in a highly polluted Asian mega city: observations of aerosol number size distribution, modal parameters and nucleation events, Atmos. Chem. Phys., 5, 57–66, https://doi.org/10.5194/acp-5-57-2005, 2005.
Moore, R. H., Nenes, A., and Medina, J.: Scanning Mobility CCN Analysis – A Method for Fast Measurements of Size-Resolved CCN Distributions and Activation Kinetics, Aerosol Sci. Tech., 44, 861–871, https://doi.org/10.1080/02786826.2010.498715, 2010.
Nieminen, T., Lehtinen, K. E. J., and Kulmala, M.: Sub-10 nm particle growth by vapor condensation – effects of vapor molecule size and particle thermal speed, Atmos. Chem. Phys., 10, 9773–9779, https://doi.org/10.5194/acp-10-9773-2010, 2010.
Nieminen, T., Asmi, A., Dal Maso, M., Aalto, P. P., Keronen, P., Petäjä, T., Kulmala, M., and Kerminen, V.-M.: Trends in atmospheric new-particle formation: 16 years of observations in a boreal-forest environment, Boreal Environ. Res., 19, 191–214, 2014.
O'Dowd, C., McFiggans, G., Creasey, D. J., Pirjola, L., Hoell, C., Smith, M. H., Allan, B. J., Plane, J. M. C., Heard, D. E., Lee, J. D., Pilling, M. J., and Kulmala, M.: On the photochemical production of new particles in the coastal boundary layer, Geophys. Res. Lett., 26, 1707–1710, https://doi.org/10.1029/1999GL900335, 1999.
Ovadnevaite, J., Zuend, A., Laaksonen, A., Sanchez, K. J., Roberts, G., Ceburnis, D., Decesari, S., Rinaldi, M., Hodas, N., Facchini, M. C., Seinfeld, J. H., and O'Dowd, C.: Surface tension prevails over solute effect in organic-influenced cloud droplet activation, Nature, 546, 637–641, https://doi.org/10.1038/nature22806, 2017.
Paasonen, P., Nieminen, T., Asmi, E., Manninen, H. E., Petäjä, T., Plass-Dülmer, C., Flentje, H., Birmili, W., Wiedensohler, A., Hõrrak, U., Metzger, A., Hamed, A., Laaksonen, A., Facchini, M. C., Kerminen, V.-M., and Kulmala, M.: On the roles of sulphuric acid and low-volatility organic vapours in the initial steps of atmospheric new particle formation, Atmos. Chem. Phys., 10, 11223–11242, https://doi.org/10.5194/acp-10-11223-2010, 2010.
Pajunoja, A., Lambe, A. T., Hakala, J., Rastak, N., Cummings, M. J., Brogan, J. F., Hao, L., Paramonov, M., Hong, J., and Prisle, N. L.: Adsorptive uptake of water by semisolid secondary organic aerosols, Geophys. Res. Lett., 42, 3063–3068, 2015.
Petters, M. D. and Kreidenweis, S. M.: A single parameter representation of hygroscopic growth and cloud condensation nucleus activity, Atmos. Chem. Phys., 7, 1961–1971, https://doi.org/10.5194/acp-7-1961-2007, 2007.
Rastak, N., Pajunoja, A., Acosta Navarro, J. C., Ma, J., Song, M., Partridge, D. G., Kirkevåg, A., Leong, Y., Hu, W. W., Taylor, N. F., Lambe, A., Cerully, K., Bougiatioti, A., Liu, P., Krejci, R., Petäjä, T., Percival, C., Davidovits, P., Worsnop, D. R., Ekman, A. M. L., Nenes, A., Martin, S., Jimenez, J. L., Collins, D. R., Topping, D. O., Bertram, A. K., Zuend, A., Virtanen, A., and Riipinen, I.: Microphysical explanation of the RH-dependent water affinity of biogenic organic aerosol and its importance for climate, Geophys. Res. Lett., 44, 5167–5177, https://doi.org/10.1002/2017GL073056, 2017.
Renbaum-Wolff, L., Song, M., Marcolli, C., Zhang, Y., Liu, P. F., Grayson, J. W., Geiger, F. M., Martin, S. T., and Bertram, A. K.: Observations and implications of liquid–liquid phase separation at high relative humidities in secondary organic material produced by α-pinene ozonolysis without inorganic salts, Atmos. Chem. Phys., 16, 7969–7979, https://doi.org/10.5194/acp-16-7969-2016, 2016.
Rose, C., Sellegri, K., Moreno, I., Velarde, F., Ramonet, M., Weinhold, K., Krejci, R., Andrade, M., Wiedensohler, A., Ginot, P., and Laj, P.: CCN production by new particle formation in the free troposphere, Atmos. Chem. Phys., 17, 1529–1541, https://doi.org/10.5194/acp-17-1529-2017, 2017.
Ruehl, C. R. and Wilson, K. R.: Surface organic monolayers control the hygroscopic growth of submicrometer particles at high relative humidity, J. Phys. Chem. A, 118, 3952–3966, 2014.
Ruehl, C. R., Davies, J. F., and Wilson, K. R.: An interfacial mechanism for cloud droplet formation on organic aerosols, Science, 351, 1447–1450, 2016.
Shen, L., Wang, H., Yin, Y., Chen, J., and Chen, K.: Observation of atmospheric new particle growth events at the summit of mountain Tai (1534 m) in Central East China, Atmos. Environ., 201, 148–157, https://doi.org/10.1016/j.atmosenv.2018.12.051, 2019.
Shen, X. J., Sun, J. Y., Zhang, Y. M., Wehner, B., Nowak, A., Tuch, T., Zhang, X. C., Wang, T. T., Zhou, H. G., Zhang, X. L., Dong, F., Birmili, W., and Wiedensohler, A.: First long-term study of particle number size distributions and new particle formation events of regional aerosol in the North China Plain, Atmos. Chem. Phys., 11, 1565–1580, https://doi.org/10.5194/acp-11-1565-2011, 2011.
Spracklen, D. V., Carslaw, K. S., Kulmala, M., Kerminen, V.-M., Sihto, S.-L., Riipinen, I., Merikanto, J., Mann, G. W., Chipperfield, M. P., Wiedensohler, A., Birmili, W., and Lihavainen, H.: Contribution of particle formation to global cloud condensation nuclei concentrations, Geophys. Res. Lett., 35, L06808, https://doi.org/10.1029/2007GL033038, 2008.
Stocker, D. Q.: Climate change 2013: The physical science basis, in: Working Group I Contribution to the Fifth Assessment Report of the Intergovernmental Panel on Climate Change, Summary for Policymakers, IPCC, Cambridge University Press, 571–658, 2013.
Stolzenburg, M. R. and McMurry, P. H.: Equations Governing Single and Tandem DMA Configurations and a New Lognormal Approximation to the Transfer Function, Aerosol Sci. Tech., 42, 421–432, https://doi.org/10.1080/02786820802157823, 2008.
Tan, H., Xu, H., Wan, Q., Li, F., Deng, X., Chan, P. W., Xia, D., and Yin, Y.: Design and Application of an Unattended Multifunctional H-TDMA System, J. Atmos. Ocean. Tech., 30, 1136–1148, https://doi.org/10.1175/JTECH-D-12-00129.1, 2013.
Topping, D. O., McFiggans, G. B., and Coe, H.: A curved multi-component aerosol hygroscopicity model framework: Part 1 – Inorganic compounds, Atmos. Chem. Phys., 5, 1205–1222, https://doi.org/10.5194/acp-5-1205-2005, 2005.
Wang, S., Peng, Y., Qi, J., Wu, C., Wang, C., Wang, B., Wang, Z., Kuang, Y., Song, W., Wang, X., Hu, W., Chen, W., Shen, J., Chen, D., Shao, M., and Yuan, B.: Different chemical removal pathways of volatile organic compounds (VOCs) s: Comparison of urban and regional sites, Acta Sci. Circumst., 40, 2311–2322, 2020 (in Chinese).
Wang, Z., Hu, M., Yue, D., He, L., Huang, X., Yang, Q., Zheng, J., Zhang, R., and Zhang, Y.: New particle formation in the presence of a strong biomass burning episode at a downwind rural site in PRD, China, Tellus B, 65, 19965, https://doi.org/10.3402/tellusb.v65i0.19965, 2013.
Wex, H., Petters, M. D., Carrico, C. M., Hallbauer, E., Massling, A., McMeeking, G. R., Poulain, L., Wu, Z., Kreidenweis, S. M., and Stratmann, F.: Towards closing the gap between hygroscopic growth and activation for secondary organic aerosol: Part 1 – Evidence from measurements, Atmos. Chem. Phys., 9, 3987–3997, https://doi.org/10.5194/acp-9-3987-2009, 2009.
Wolfe, G. M., Marvin, M. R., Roberts, S. J., Travis, K. R., and Liao, J.: The Framework for 0-D Atmospheric Modeling (F0AM) v3.1, Geosci. Model Dev., 9, 3309–3319, https://doi.org/10.5194/gmd-9-3309-2016, 2016.
Wu, Z., Hu, M., Liu, S., Wehner, B., Bauer, S., Maßling, A., Wiedensohler, A., Petäjä, T., Dal Maso, M., and Kulmala, M.: New particle formation in Beijing, China: Statistical analysis of a 1-year data set, J. Geophys. Res.-Atmos., 112, D09209, https://doi.org/10.1029/2006jd007406, 2007.
Wu, Z., Birmili, W., Poulain, L., Wang, Z., Merkel, M., Fahlbusch, B., van Pinxteren, D., Herrmann, H., and Wiedensohler, A.: Particle hygroscopicity during atmospheric new particle formation events: implications for the chemical species contributing to particle growth, Atmos. Chem. Phys., 13, 6637–6646, https://doi.org/10.5194/acp-13-6637-2013, 2013.
Yu, H., Ortega, J., Smith, J. N., Guenther, A. B., Kanawade, V. P., You, Y., Liu, Y., Hosman, K., Karl, T., Seco, R., Geron, C., Pallardy, S. G., Gu, L., Mikkilä, J., and Lee, S.-H.: New Particle Formation and Growth in an Isoprene-Dominated Ozark Forest: From Sub-5 nm to CCN-Active Sizes, Aerosol Sci. Tech., 48, 1285–1298, https://doi.org/10.1080/02786826.2014.984801, 2014.
Yue, D., Zhong, L., Zhang, T., Shen, J., Yuan, L., Ye, S., Zhou, Y., and Zeng, L.: Particle growth and variation of cloud condensation nucleus activity on polluted days with new particle formation: A case study for regional air pollution in the PRD region, China, Aerosol Air Qual. Res., 16, 323–335, 2016.
Yue, D. L., Hu, M., Zhang, R. Y., Wu, Z. J., Su, H., Wang, Z. B., Peng, J. F., He, L. Y., Huang, X. F., Gong, Y. G., and Wiedensohler, A.: Potential contribution of new particle formation to cloud condensation nuclei in Beijing, Atmos. Environ., 45, 6070–6077, https://doi.org/10.1016/j.atmosenv.2011.07.037, 2011.
Yue, D. L., Hu, M., Wang, Z. B., Wen, M. T., Guo, S., Zhong, L. J., Wiedensohler, A., and Zhang, Y. H.: Comparison of particle number size distributions and new particle formation between the urban and rural sites in the PRD region, China, Atmos. Environ., 76, 181–188, https://doi.org/10.1016/j.atmosenv.2012.11.018, 2013.