the Creative Commons Attribution 4.0 License.
the Creative Commons Attribution 4.0 License.
 | 02 Jun 2021
The stratospheric Brewer–Dobson circulation inferred from age of air in the ERA5 reanalysis
Felix Ploeger
Mohamadou Diallo
Edward Charlesworth
Paul Konopka
Bernard Legras
Johannes C. Laube
Jens-Uwe Grooß
Gebhard Günther
Andreas Engel
Martin Riese
This paper investigates the global stratospheric Brewer–Dobson circulation (BDC) in the ERA5 meteorological reanalysis from the European Centre for Medium-Range Weather Forecasts (ECMWF). The analysis is based on simulations of stratospheric mean age of air, including the full age spectrum, with the Lagrangian transport model CLaMS (Chemical Lagrangian Model of the Stratosphere), driven by reanalysis winds and total diabatic heating rates. ERA5-based results are compared to results based on the preceding ERA-Interim reanalysis. Our results show a significantly slower BDC for ERA5 than for ERA-Interim, manifesting in weaker diabatic heating rates and higher age of air. In the tropical lower stratosphere, heating rates are 30 %–40 % weaker in ERA5, likely correcting a bias in ERA-Interim. At 20 km and in the Northern Hemisphere (NH) stratosphere, ERA5 age values are around the upper margin of the uncertainty range from historical tracer observations, indicating a somewhat slow–biased BDC. The age trend in ERA5 over the 1989–2018 period is negative throughout the stratosphere, as climate models predict in response to global warming. However, the age decrease is not linear but steplike, potentially caused by multi-annual variability or changes in the observations included in the assimilation. During the 2002–2012 period, the ERA5 age shows a similar hemispheric dipole trend pattern as ERA-Interim, with age increasing in the NH and decreasing in the Southern Hemisphere (SH). Shifts in the age spectrum peak and residual circulation transit times indicate that reanalysis differences in age are likely caused by differences in the residual circulation. In particular, the shallow BDC branch accelerates in both reanalyses, whereas the deep branch accelerates in ERA5 and decelerates in ERA-Interim.
- Article
(11463 KB) - Full-text XML
- BibTeX
- EndNote


The Brewer–Dobson circulation (BDC) is the global transport circulation in the stratosphere that controls the transport of chemical species and aerosol (e.g. Holton et al., 1995; Butchart, 2014). Changes in the BDC induce changes in radiatively active trace gas species and hence may cause radiative effects on climate. Therefore, BDC changes need to be reliably represented in atmospheric models.
The BDC is characterized by upwelling motion in the tropics, poleward transport in the stratosphere, and downwelling above middle and high latitudes. In addition, a mesospheric circulation branch transports air masses from the summer to the winter pole. As pointed out by Haynes et al. (1991), the BDC is mechanically driven by atmospheric waves propagating upwards from the troposphere and breaking at upper levels in the stratosphere where they deposit their momentum and cause the driving force. From a conceptual point of view, the BDC can be divided into a residual mean mass circulation and additional two-way eddy mixing (e.g. Neu and Plumb, 1999; Garny et al., 2014), which are both related to the breaking of atmospheric waves. The residual circulation and eddy mixing both affect trace gas distributions in a complex manner (e.g. Minganti et al., 2020). The climatological structure of the BDC shows two main circulation branches: a shallow branch at lower levels (below about 20 km) which causes rapid transport to high latitudes (transport timescales of months), and a deep branch above with much longer transport timescales of a few years (e.g. Plumb, 2002; Birner and Bönisch, 2011; Lin and Fu, 2013).
Diagnosing the BDC and estimating its strength is a challenging task due to the fact that the BDC is a zonal mean circulation and that the mean vertical velocities are very slow (less than 1 mm/s). In models, these slow velocities can be computed (e.g. within the transformed Eulerian mean, TEM, framework, Andrews et al., 1987) but are likely affected by model numerics. For observations, the circulation strength needs to be deduced from trace gas measurements. A common diagnostic for the speed of the BDC is the stratospheric age of air (Waugh and Hall, 2002). Due to atmospheric mixing processes, a given air parcel in the stratosphere is characterized by a multitude of different transit times through the stratosphere, defining the age spectrum (Hall and Plumb, 1994). The first moment of the age spectrum defines the mean age of air. Due to its definition of being an average transit time, mean age may give ambiguous results, whereas the age spectrum is able to resolve the information on different processes (Waugh and Hall, 2002).
Despite its crucial effects on atmospheric composition and climate, no common understanding of long-term changes in the BDC with increasing greenhouse gas levels has been reached yet. On the one hand, climate models show a robust strengthening and acceleration of the BDC with climate change (e.g. Butchart et al., 2010), manifesting in an increase in tropical upwelling and a decrease in global mean age of air. On the other hand, atmospheric trace gas measurements from balloon soundings in the Northern Hemisphere (NH) mid-latitudes show a non-significant long-term BDC trend over the last few decades (Engel et al., 2009, 2017; Fritsch et al., 2020). Moreover, satellite measurement from the Michelson Interferometer for Passive Atmospheric Sounding (MIPAS) show no globally homogeneous mean age change over the 2002–2012 period but a more detailed pattern with increasing age in the NH and decreasing age in the Southern Hemisphere (SH) (Stiller et al., 2012; Haenel et al., 2015).
Coming along with improvements in model physics and data assimilation systems, meteorological reanalyses have been used more intensively for trend investigations in recent years. With transport driven by European Centre for Medium-Range Weather Forecasts (ECMWF) ERA-Interim reanalysis, modelling studies have shown a weak increase in mean age in the NH middle stratosphere, qualitatively consistent with balloon observations (e.g. Diallo et al., 2012; Monge-Sanz et al., 2012). However, more recent efforts combining different newest-generation reanalysis data sets have shown a large dependency of BDC trend estimates on the reanalysis used, for both residual circulation (Abalos et al., 2015; Miyazaki et al., 2016) and age of air diagnostics (Chabrillat et al., 2018; Ploeger et al., 2019). In particular, no consensus has been reached amongst reanalyses, including ERA-Interim reanalysis from the ECMWF (Dee et al., 2011), JRA-55 from the Japanese Meteorological Agency (Kobayashi et al., 2015), and MERRA-2 from the National Aeronautics and Space Administration (Gelaro et al., 2017) concerning decadal age of air and BDC changes.
Very recently, the ECMWF released its newest-generation reanalysis product ERA5 (Hersbach et al., 2020). Compared with its predecessor ERA-Interim, ERA5 is based on an improved forecast model version and improved data assimilation system (see Sect. 2.2 for further details). Case studies on stratospheric and tropospheric transport indicate improvements in the representation of physical processes, like convection, in ERA5 (e.g. Li et al., 2020). Recently, Diallo et al. (2021) analysed the ERA5 residual mean mass circulation of the BDC, its variability and trend, based on transformed Eulerian mean (TEM) calculations. The present paper can be seen as being complementary, as it investigates the representation of the BDC in ERA5 in terms of stratospheric age of air from transport model simulations and compares results to the previous ERA-Interim reanalysis. For this reason, we carry out simulations of stratospheric age of air with the Lagrangian CLaMS (Chemical Lagrangian Model of the Stratosphere) model over the 1979–2018 period driven by either ERA5 or ERA-Interim reanalysis meteorology. Simulation of the stratospheric age spectrum with CLaMS allows one to attribute differences between the reanalyses to processes. The main research questions are as follows:
-
How strong and fast is BDC transport in ERA5 compared with ERA-Interim?
-
How has the BDC (and age of air) changed over recent decades?
-
How good is the agreement with age of air derived from trace gas observations?
The analysis presented here contributes to the Processes And their Role in Climate (SPARC) Reanalysis Intercomparison Project (S-RIP) (Fujiwara et al., 2017) and can be regarded as a follow-up of the analyses presented by Chabrillat et al. (2018) and Ploeger et al. (2019), where the BDC in ERA-Interim, JRA-55, and MERRA-2 reanalysis was compared in terms of age of air. Here, we discuss the ERA5 results within the context of the other reanalyses. For better comparability, we also present ERA-Interim results from Ploeger et al. (2019), although for an extended period, and juxtapose them with the new ERA5 results.
In a first step, in Sect. 2, the CLaMS model and age spectrum calculation are described as well as ERA5 reanalysis data. A particular focus is laid on the ERA5 diabatic heating rate which is used to drive CLaMS model transport. Thereafter, Sect. 3 presents the results related to the climatological structure of the BDC, showing that ERA5 has a substantially slower BDC than ERA-Interim. Section 4 presents BDC and age of air trends, showing a globally negative long-term trend for ERA5 and a stronger variability compared with ERA-Interim. A comparison to age of air observations is presented in Sect. 5. The results are placed into the context of previous studies in the discussion in Sect. 6, and final conclusions are summarized in Sect. 7.
In this study, the BDC is investigated based on age of air calculated with the CLaMS model driven by ERA5 and ERA-Interim reanalysis data. In the following, Sect. 2.1 describes the CLaMS model and age of air calculation, and Sect. 2.2 briefly describes the ERA5 reanalysis with focus on the variables used.
2.1 Age of air simulations with the Chemical Lagrangian Model of the Stratosphere (CLaMS)
The CLaMS model is a Lagrangian chemistry transport model, with the transport scheme based on the calculation of 3D air parcel trajectories (which represent the model grid points) and a parameterization of small-scale atmospheric mixing (McKenna et al., 2002; Konopka et al., 2004). This mixing parameterization is controlled by the shear in the large-scale flow (via a critical Lyapunov exponent); thus, in regions of large flow deformations, strong mixing occurs. The forward trajectory calculation is driven by offline meteorological data. In this paper, we will use ERA5 and ERA-Interim reanalysis data, which are further described in Sect. 2.2.
In the vertical direction CLaMS uses an isentropic vertical coordinate which makes the model particularly well-suited for the stratosphere, where diabatic transport is generally weaker than adiabatic transport (e.g. McKenna et al., 2002). Strictly speaking, the vertical coordinate in CLaMS is a hybrid potential temperature which follows orography at the surface and transforms smoothly into potential temperature θ above; thus, it equals θ above the σ=0.3 surface (with ) and therefore throughout the stratosphere (e.g. Mahowald et al., 2002; Pommrich et al., 2014). The cross-isentropic vertical velocity (also termed diabatic vertical velocity in the following) is calculated from the reanalysis total diabatic heating rate (see Sect. 2.2 for further details).
A calculation of the fully time-dependent stratospheric age of air spectra has been implemented in CLaMS, based on multiple tracer pulses, as described by Ploeger et al. (2019) and references therein. The age spectrum at a point r in the stratosphere and time t is the distribution of transit times τ from the surface (or from the tropopause in some studies) to r. For the age spectrum calculation in CLaMS, chemically inert model tracers are pulsed in the orography-following lowest model layer (approximately the boundary layer) in the tropics (30∘ S–30∘ N) with a unit mixing ratio, a pulse duration of 1 month, and a pulse frequency of 2 months. The value of the age spectrum at transit time τi is then related to the mixing ratio χi of the tracer pulsed at t−τi and sampled at r (e.g. Li et al., 2012):
Therefore, the use of 60 pulse tracers in the model with a pulse frequency of 2 months allows for the calculation of the age spectrum over 10 years along the transit time axis (e.g. Ploeger et al., 2019). Mean age Γ is the average stratospheric transit time and is defined as the first moment of the age spectrum:
The two model simulations driven by either ERA5 or ERA-Interim cover the 1979–2018 period. Preceding 10-year spin-up simulations have been carried out by repeating the meteorology of 1979. To eliminate the influence of this spin-up on the age spectra, we focus on the 1989–2018 period (for most parts of the paper) when all memory of the spin-up in the 10-year-long age spectra is lost. As the model age spectrum is truncated at 10 years, the respective mean age will be biased low if no correction for the spectrum tail is taken into account. Therefore, throughout this paper, we consider mean age calculated from an additional “clock tracer” in CLaMS – a chemically inert tracer with linearly increasing mixing ratios at the surface (e.g. Hall and Plumb, 1994). This clock-tracer mean age experienced a longer spin-up (minimum of 20 years at the beginning of the period considered in 1989) and is therefore higher compared with the spectrum-based mean age.
Note that, compared with Ploeger et al. (2019), small quantitative differences can occur due to the different periods considered as well as due to the use of different mean age calculation methods (clock-tracer-based versus spectrum-based methods; for a quantification of these differences, see Ploeger and Birner, 2016, their Figs. 4 and A1). Another difference to the simulations by Ploeger et al. (2019) concerns the cross-isentropic vertical velocities. Ploeger et al. (2019) added a constant correction term to the vertical velocity to correct for missing balance in the annual mean cross-isentropic mass flux on a given θ level, as suggested by Rosenlof (1995) and implemented in CLaMS by Konopka et al. (2010). Here, we do not include this mass correction and use the “raw” reanalysis heating rate to simplify interpretation and reproducibility with other studies. For most of the results including this annual mean mass balance causes no significant change. However, it causes a clearer age decrease in the SH for mean age trends after about 2002 (see Sect. 4).
2.2 ERA5 reanalysis
The newest-generation ERA5 reanalysis from the European Centre for Medium-Range Weather Forecasts (ECMWF) is the successor of the previous ERA-Interim reanalysis (Dee et al., 2011). ERA5 is now available from 1979 to 2020 with production lagging real time by about 2 months. For the production of ERA5, 4D-Var data assimilation of the ECMWF Integrated Forecast System (in cycle CY41R2) was used (Hersbach et al., 2020). The horizontal resolution is about 30 km (T639). In the vertical, the pressure range from the surface to 0.01 hPa is covered with 137 hybrid levels. The output frequency for ERA5 data is hourly. Due to a cold bias in the lower stratosphere, the reanalysis data have been replaced for the 2000–2006 period with the updated data set named ERA5.1 (Simmons et al., 2020). For the present paper, we carried out CLaMS simulations driven by both the previous (termed ERA5.0 in the following) and the corrected ERA5.1 data (for simplicity, termed ERA5 in this paper), and we discuss the effects of the bias correction on the stratospheric BDC (Sect. 6). Further details on ERA5 can be found in Hersbach et al. (2020).
For better comparability between the ERA5- and ERA-Interim-driven model simulations as well as for reasons related to practicability (storage and memory space), we use 6-hourly (00:00, 06:00, 12:00, and 18:00 UTC) ERA5 data with a truncated 1∘ × 1∘ horizontal resolution, downscaled using direct transformation from T1279 to 1∘ × 1∘ with automatic truncation to T213 as provided by the ECMWF MARS processing system. However, we maintain the full vertical resolution, as the necessary meteorological data are interpolated from the reanalysis fields on native ECMWF model levels onto the Lagrangian CLaMS air parcels. Hence, the ERA5 data to drive the CLaMS model in this study have 137 hybrid ECMWF model levels; ERA-Interim data have 60 levels.
Of particular importance for the CLaMS model calculations is the reanalysis temperature tendency variable (diabatic heating rate) which is used for deducing diabatic vertical velocity. Both ERA5 and ERA-Interim provide five temperature tendencies: the mean temperature tendencies due to short-wave and long-wave radiation for both clear-sky and all-sky conditions as well as the mean temperature tendency due to all parameterizations (including the above-mentioned radiative contributions, latent heat release, and turbulent and sensitive heating). From the temperature tendency due to parameterizations (the total diabatic heating rate Qtot), the cross-isentropic vertical velocity for driving CLaMS transport is calculated as
where T is temperature, θ is the potential temperature, and cp is the specific heat capacity at constant pressure. The calculation of cross-isentropic vertical velocity for ERA-Interim was described by Ploeger et al. (2010). In the following, we illustrate the similar (but not identical) procedure for ERA5.
Temperature tendencies are only available from the ERA5 forecast data, which is stored twice per day (06:00 and 18:00 UTC) with forecast steps ranging between 1 and 18 h (1 h increments). These temperature tendencies have to be interpreted differently compared with ERA-Interim, as they are “mean rates”, representative of the interval between the actual time and the previous post-processing time. For instance, the forecast data at 06:00 UTC with a 5 h forecast step are the mean tendency between 10:00 and 11:00 UTC. Temperature tendencies are provided in K/s (Kelvin per second). The CLaMS preprocessor assigns the forecast variables to the reanalysis data set at the later time (here 11:00 UTC). This induces a time uncertainty of 0.5 h, which is negligible for the purpose of this paper.
Here, we did not use the hourly ERA5 data to drive model transport; data subsampled in time are used instead. Therefore, the temperature tendencies have to be averaged appropriately, as they represent accumulations since the previous post-processing time and not since the last forecast date. Otherwise, sampling errors will occur. Hence, for the present case of using only 00:00, 06:00, 12:00, and 18:00 UTC data, we average all tendency data sets within 6 h windows around each date. For instance, the mean tendency averaged over 10:00–15:00 UTC (from forecast data at 06:00 UTC with 4–9 h steps, see above) is assigned to the reanalysis data at 12:00 UTC.
As described in Sect. 2, CLaMS uses diabatic heating rates for driving vertical transport in the model. The climatological cross-isentropic (or diabatic) vertical velocity calculated from the diabatic heating rate for winter and summer seasons from ERA5 and ERA-Interim, and the respective differences, are shown in Fig. 1a–f. Overall, both reanalyses show very similar distributions and seasonality for . Diabatic tropical upwelling maximizes in boreal winter (December–February, DJF), somewhat shifted into the summer subtropics, and the extratropical downwelling maximizes in the respective winter hemisphere. Further, heating rates show a double-peak structure above the tropical tropopause with a minimum above the Equator. However, quantitatively, clear differences also occur between the two reanalyses, showing larger diabatic velocities (heating rates) in the lower stratosphere (positive differences below about 600 K; Fig. 1c, f) in ERA-Interim and smaller heating rates above. In particular, the zoomed view in Fig. 1g–i reveals that in the 400–430 K layer (30∘ N–30∘S) in ERA-Interim shows about 40 % larger total diabatic heating rates than in ERA5. Furthermore, in the lowest tropical tropopause layer (TTL) around the level of zero radiative heating (about 350 K), total diabatic heating rates are much weaker in ERA5 than ERA-Interim, even showing no continuous upwelling in the annual mean in a shallow layer around 350 K (Fig. 1i). However, it should be noted that seasonal ERA5 heating rate averages show very weak zonal mean upwelling from the troposphere into the stratosphere in small latitude bands, which vanishes in the annual mean due to seasonal shifts. This much weaker upwelling in the TTL and tropical lower stratosphere causes stronger restrictions on large-scale advective upward transport in ERA5 and appears to correct an overestimation in ERA-Interim (see Sect. 6). The heating rate difference below the tropopause will also affect the simulations of mean age, which is defined with respect to the surface in this study. Another difference between the two reanalyses concerns heating rates in the summertime stratosphere above about 700 K (about 20 hPa), where ERA5 shows upward velocities whereas ERA-Interim shows downward velocities. The upward velocities in ERA5 in that region are more consistent with the residual circulation vertical velocity (Fig. 2), which is further discussed below.

Figure 1 Diabatic vertical velocity climatology (1979–2018), calculated from the total diabatic heating rate, for boreal winter (December–February, DJF) from (a) ERA5, (b) ERA-Interim, and (c) the difference ERA-Interim minus ERA5. Panels (d)–(f) are the same but for boreal summer (June–August, JJA). Panels (g)–(i) show a zoomed in view of the tropical lower stratosphere annual mean heating rates. Note the different colour scale for the difference plots. Heating rate contours are highlighted in black (dashed for negative values). The thin black contour in the difference plot shows the zero contour from ERA-Interim. White contours show zonal wind (in ±10 m/s steps; easterly wind dashed), the thin dashed black lines show pressure levels, and the thick black line shows the (WMO lapse rate) tropopause.

Figure 2 Residual circulation vertical velocity climatology (1979–2018) for boreal winter (December–February, DJF) from (a) ERA5, (b) ERA-Interim, and (c) the difference ERA-Interim minus ERA5. Panels (d)–(f) are the same but for boreal summer (June–August, JJA). Note the different colour scale for the difference plots. Circulation contours are highlighted in black (dashed for negative values). White contours show zonal wind (in ±10 m/s steps; easterly wind dashed), the thin dashed black lines show potential temperature levels, and the thick black line shows the (WMO lapse rate) tropopause. The y axis is log-pressure altitude.
Diallo et al. (2021) analysed the ERA5 BDC based on the TEM residual circulation vertical velocity, a common measure of the strength of the BDC (e.g. Andrews et al., 1987, Eq. 3.5.1b):
where the overline denotes the zonal mean and primes fluctuations therefrom (due to eddies), w is the vertical velocity in log-pressure z coordinates, a is the Earth's radius, ϕ is latitude, and v is the latitudinal wind component. Here, we briefly recapitulate a few findings from that paper for ease of comparison to the heating-rate-based results.
Figure 2 shows calculated from ERA5 and ERA-Interim during boreal winter (December–February, DJF) and summer (June–August, JJA) and the respective reanalysis differences, for comparison with the diabatic vertical velocity, calculated from the reanalysis diabatic heating rate. Overall, the distributions and seasonal differences for both reanalyses are very similar. Moreover, for , both reanalyses show stronger tropical upwelling in boreal winter, which is somewhat shifted into the summer subtropics, and stronger downwelling in the respective winter hemisphere. In particular in the winter hemisphere, contours of negative representing downwelling are very close for both reanalyses. Also in the deep tropics close to the Equator around the 18 km level (about 420 K potential temperature, 70 hPa pressure), a minimum in upwelling (and even downwelling in JJA) occurs similarly in both data sets. Minor differences between ERA5 and ERA-Interim concern downward velocities in the summer hemisphere and a stronger upwelling in the tropical lower stratosphere in ERA-Interim. In their Fig. 2, Diallo et al. (2021) showed that tropical upwelling differences in in the tropical lower stratosphere amount to about 40 % at around 15 km and decrease above this level (zero difference at about 22 km). Hence, the reanalysis differences in upwelling in the TTL as diagnosed from are qualitatively similar to those diagnosed from heating rates (up to 30 %–40 %, see Fig. 1). Above about 20 km, however, upwelling from heating rates shows larger differences than upwelling from . Downwelling differences are larger in the summer than winter hemisphere, similar to the case of .
The integrated effect of BDC transport in the two reanalyses is shown from climatological mean age of air for winter and summer in Fig. 3. The general characteristics of the stratospheric mean age distribution are evident for both reanalyses, with age increasing with both altitude and latitude: low age in the tropical upwelling region and high age in extratropical downwelling regions. The oldest air is found in the winter hemisphere, and it is even older in the SH during JJA compared with the NH during DJF. The summertime lowest stratosphere (below about 450 K) is characterized by a “flushing” with young air (e.g. Hegglin and Shepherd, 2007; Bönisch et al., 2009), which is strongest in the NH during JJA. A particular feature in this region is an age inversion in the summertime NH with younger air (around 400 K) located above older air (around 350 K), which is also apparent in both reanalyses. This “eave structure” (i.e. younger air above older air) in the summertime lower stratosphere age distribution has been recently discussed by Charlesworth et al. (2020) and has been shown to depend critically on the numerics of the model transport scheme.
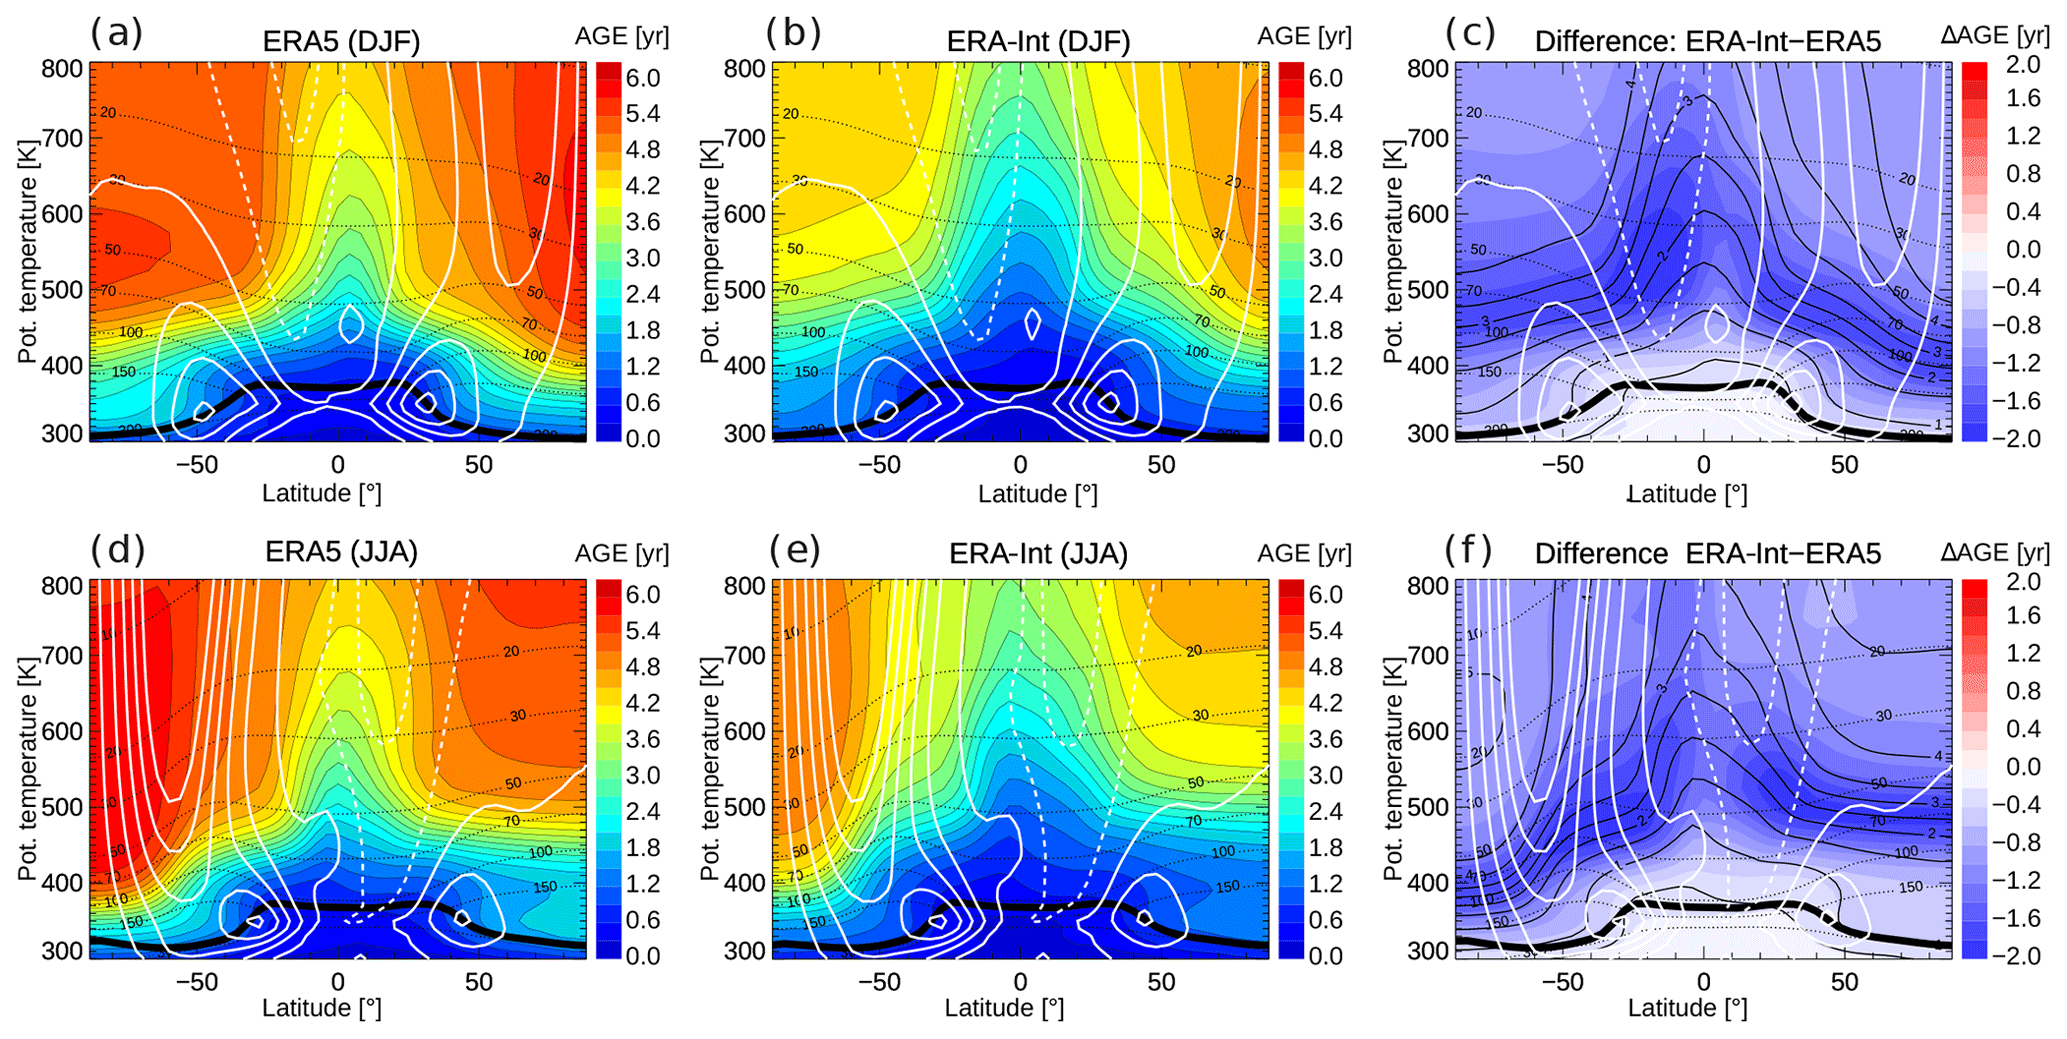
Figure 3 Mean age climatology (1989–2018) for boreal winter (December–February, DJF) from ERA5 (a), ERA-Interim (b), and the difference (c). Panels (d)–(f) are the same but for boreal summer (June–August, JJA). White contours show zonal wind (in ±10 m/s steps; easterly wind dashed), the thin dashed black lines show pressure levels, and the thick black line shows the (WMO lapse rate) tropopause.
Clear quantitative differences between ERA5 and ERA-Interim age are evident in Fig. 3c and f, with significantly older air shown for ERA5. The largest differences of up to about 2 years (equivalent to about 50 %–75 %) occur in the lower stratospheric regions where the climatological age distribution (black contours) shows the strongest gradients. These differences indicate a downward shift of the locations of the strongest age gradients and stronger gradients in ERA5 compared with ERA-Interim.
To gain deeper insight into transport processes and their differences in the two reanalyses, we consider stratospheric age spectra at the 400 and 600 K potential temperature levels, which are representative of the shallow and the deep BDC branch respectively (see Fig. 2 for a relation between potential temperature and altitude levels). Figure 4 shows the CLaMS model age spectra at 400 K versus latitude for ERA5 and ERA-Interim for winter and summer. The spectra from both reanalyses show similar overall characteristics and seasonality, caused by known characteristics of BDC transport. The multi-modal spectrum shape, arising from the seasonality in upward transport into the stratosphere and in the strength of transport barriers, clearly emerges for both cases and appears strongest for middle-latitude and high-latitude spectra, which is consistent with previous studies (e.g. Reithmeier et al., 2007; Li et al., 2012). In the tropics, age spectra are narrower and have a younger peak in boreal winter, indicating faster upwelling during that season. Weaker latitudinal gradients in the summer hemisphere, especially in the NH during JJA, are a sign of stronger mixing in summer. The flushing of the summertime lower stratosphere with young air can be seen from the extent of the young air peak to high latitudes in the summer hemisphere (e.g. Fig. 4b, d).
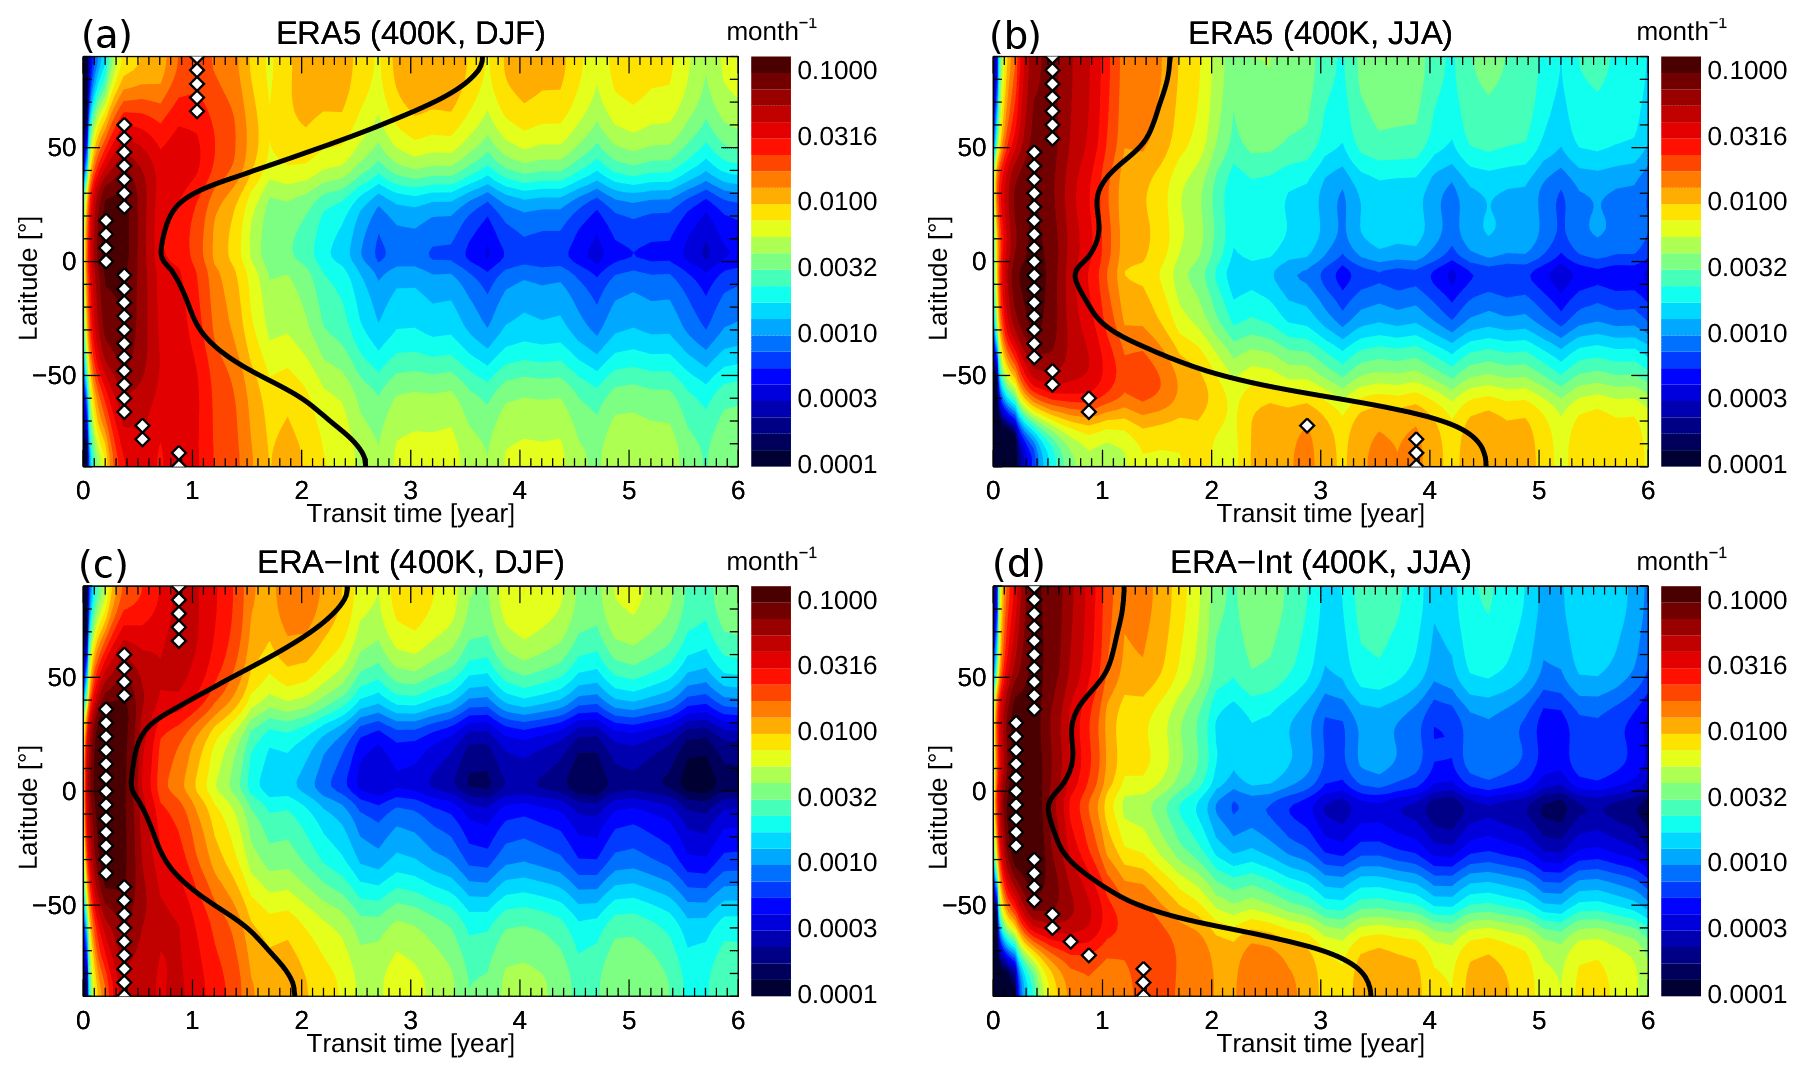
Figure 4 Age spectra at 400 K (1989–2018 climatology) from ERA5 for boreal winter (a) and summer (b). Panels (c) and (d) are the same but for age spectra from ERA-Interim. The black contour shows mean age (calculated as the first moment of spectra), and the white diamonds show modal age (peak of the spectrum).
Closer inspection reveals differences between ERA5 and ERA-Interim age spectra. In the tropics, the main spectrum peak is broader and is shifted to larger transit times for ERA5, which is related to slower tropical upwelling compared with ERA-Interim. At high latitudes this shift of ERA5 age spectra towards older transit times is even clearer, indicating slower transport along the BDC and a stronger confinement of polar regions in ERA5. The clearest differences occur in the SH polar vortex during winter (JJA) where the modal age (transit time of the largest spectrum peak) for ERA5 is at about 4 years, whereas the modal age occurs at 1.4 years for ERA-Interim. Hence, there is a significantly higher fraction of young air at high latitudes for ERA-Interim than for ERA5.
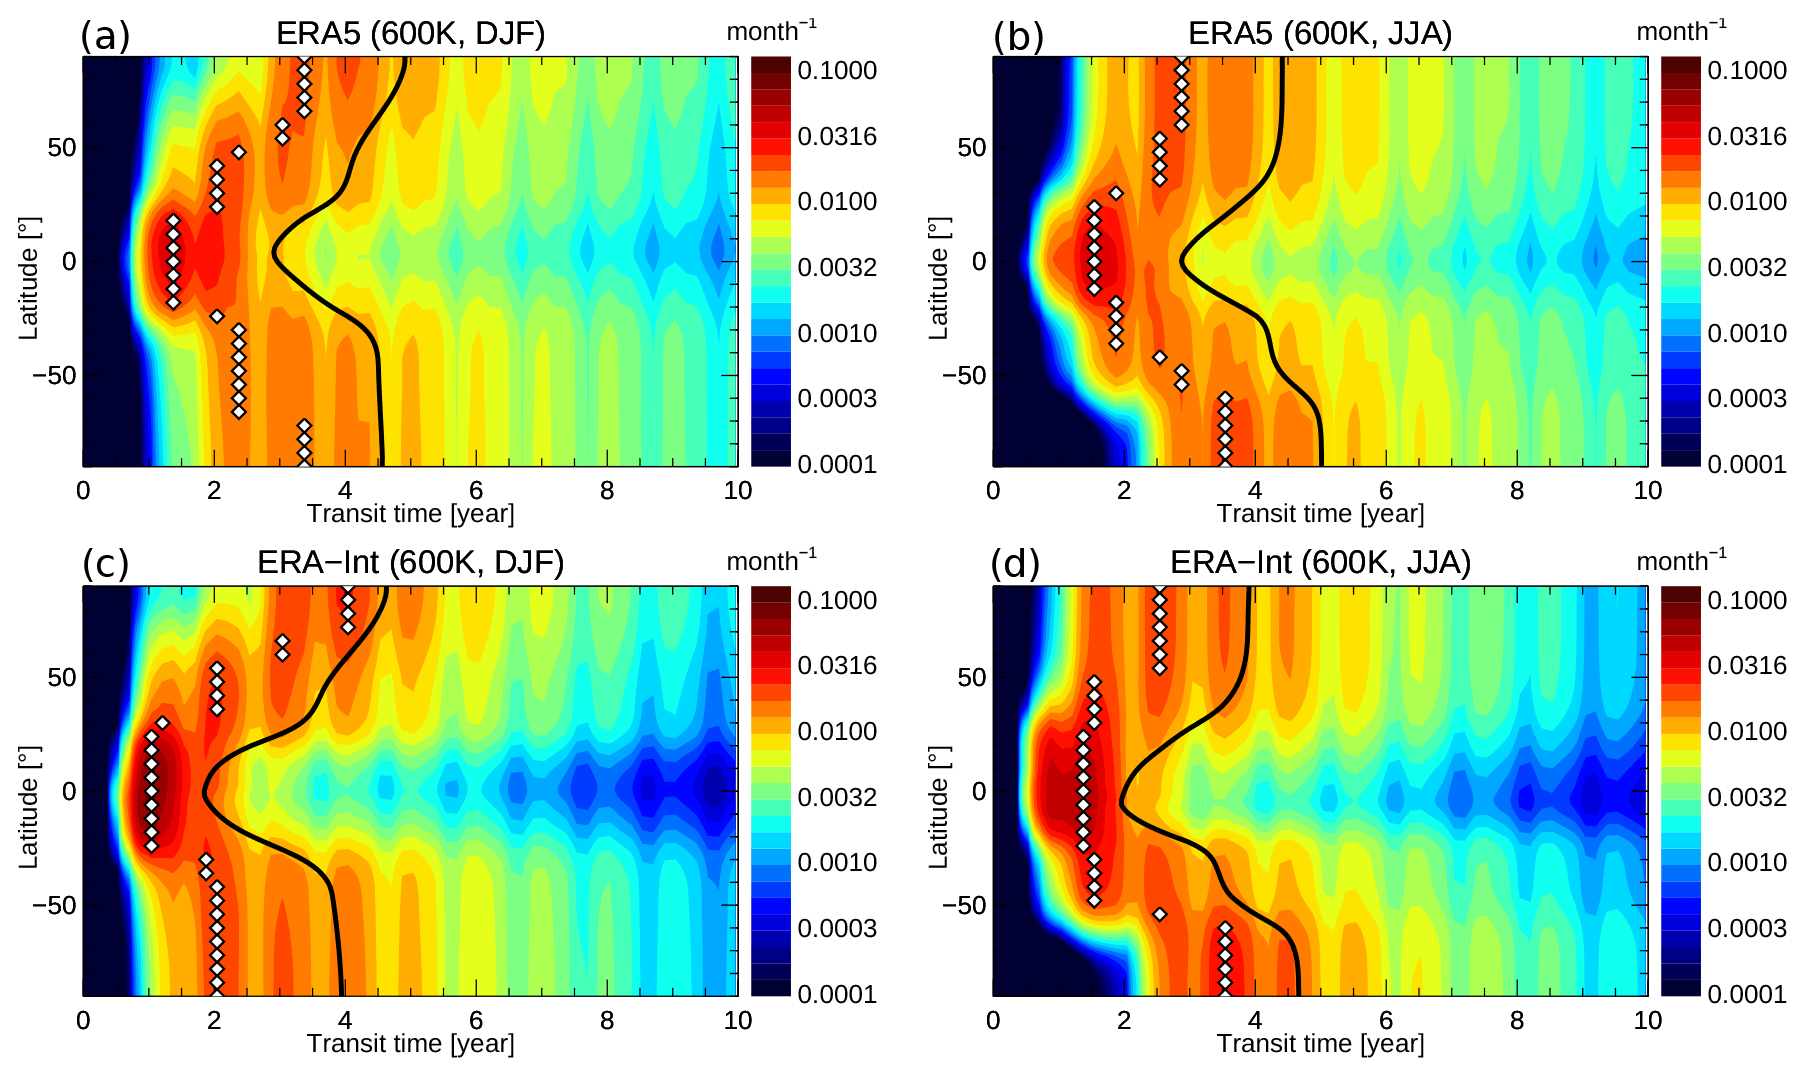
Similar conclusions hold for the age spectrum comparison at 600 K (Fig. 5). While the general spectrum characteristics are similar for ERA5 and ERA-Interim, clear detailed differences occur in the spectrum shape. ERA5 spectra are shifted towards older transit times and show an older peak compared with ERA-Interim, as found similarly at the lower 400 K level. In the tropics, these differences are particularly clear with the shift of the spectrum peak to older ages in ERA5 compared with ERA-Interim indicating slower residual circulation upwelling (e.g. Li et al., 2012; Ploeger and Birner, 2016). This slower residual circulation upwelling is consistent with the weaker diabatic heating rates in the TTL and lower tropical stratosphere in Fig. 1. Moreover, the larger extent of the youngest spectrum peak towards high latitudes in the summer hemisphere (e.g. in the NH during JJA in Fig. 5b and in the SH during DJF in Fig. 5c) shows faster transport of young air towards the pole in ERA-Interim than in ERA5.
Trends in mean age over the entire 30-year period from 1989 to 2018 and over the 2002–2012 period are shown in Fig. 6. The trends are calculated from linear regression of the deseasonalized time series (after subtracting the mean annual cycle at each grid point). The regression did not attempt to extract any signals of interannual variability such as the Quasi-Biennial Oscillation, the El Niño–Southern Oscillation, or volcanic influence. The standard deviation from the regression provides a 1σ range for assessing the significance of the calculated trends. Even over 30 years, the trend values are still affected by decadal variability, as will be discussed at the end of this section. Nevertheless, for simplicity, we use the term “trend” in this paper but note that our results concern changes over 30 years and not over centennial timescales, as is often the case for climate model experiments.
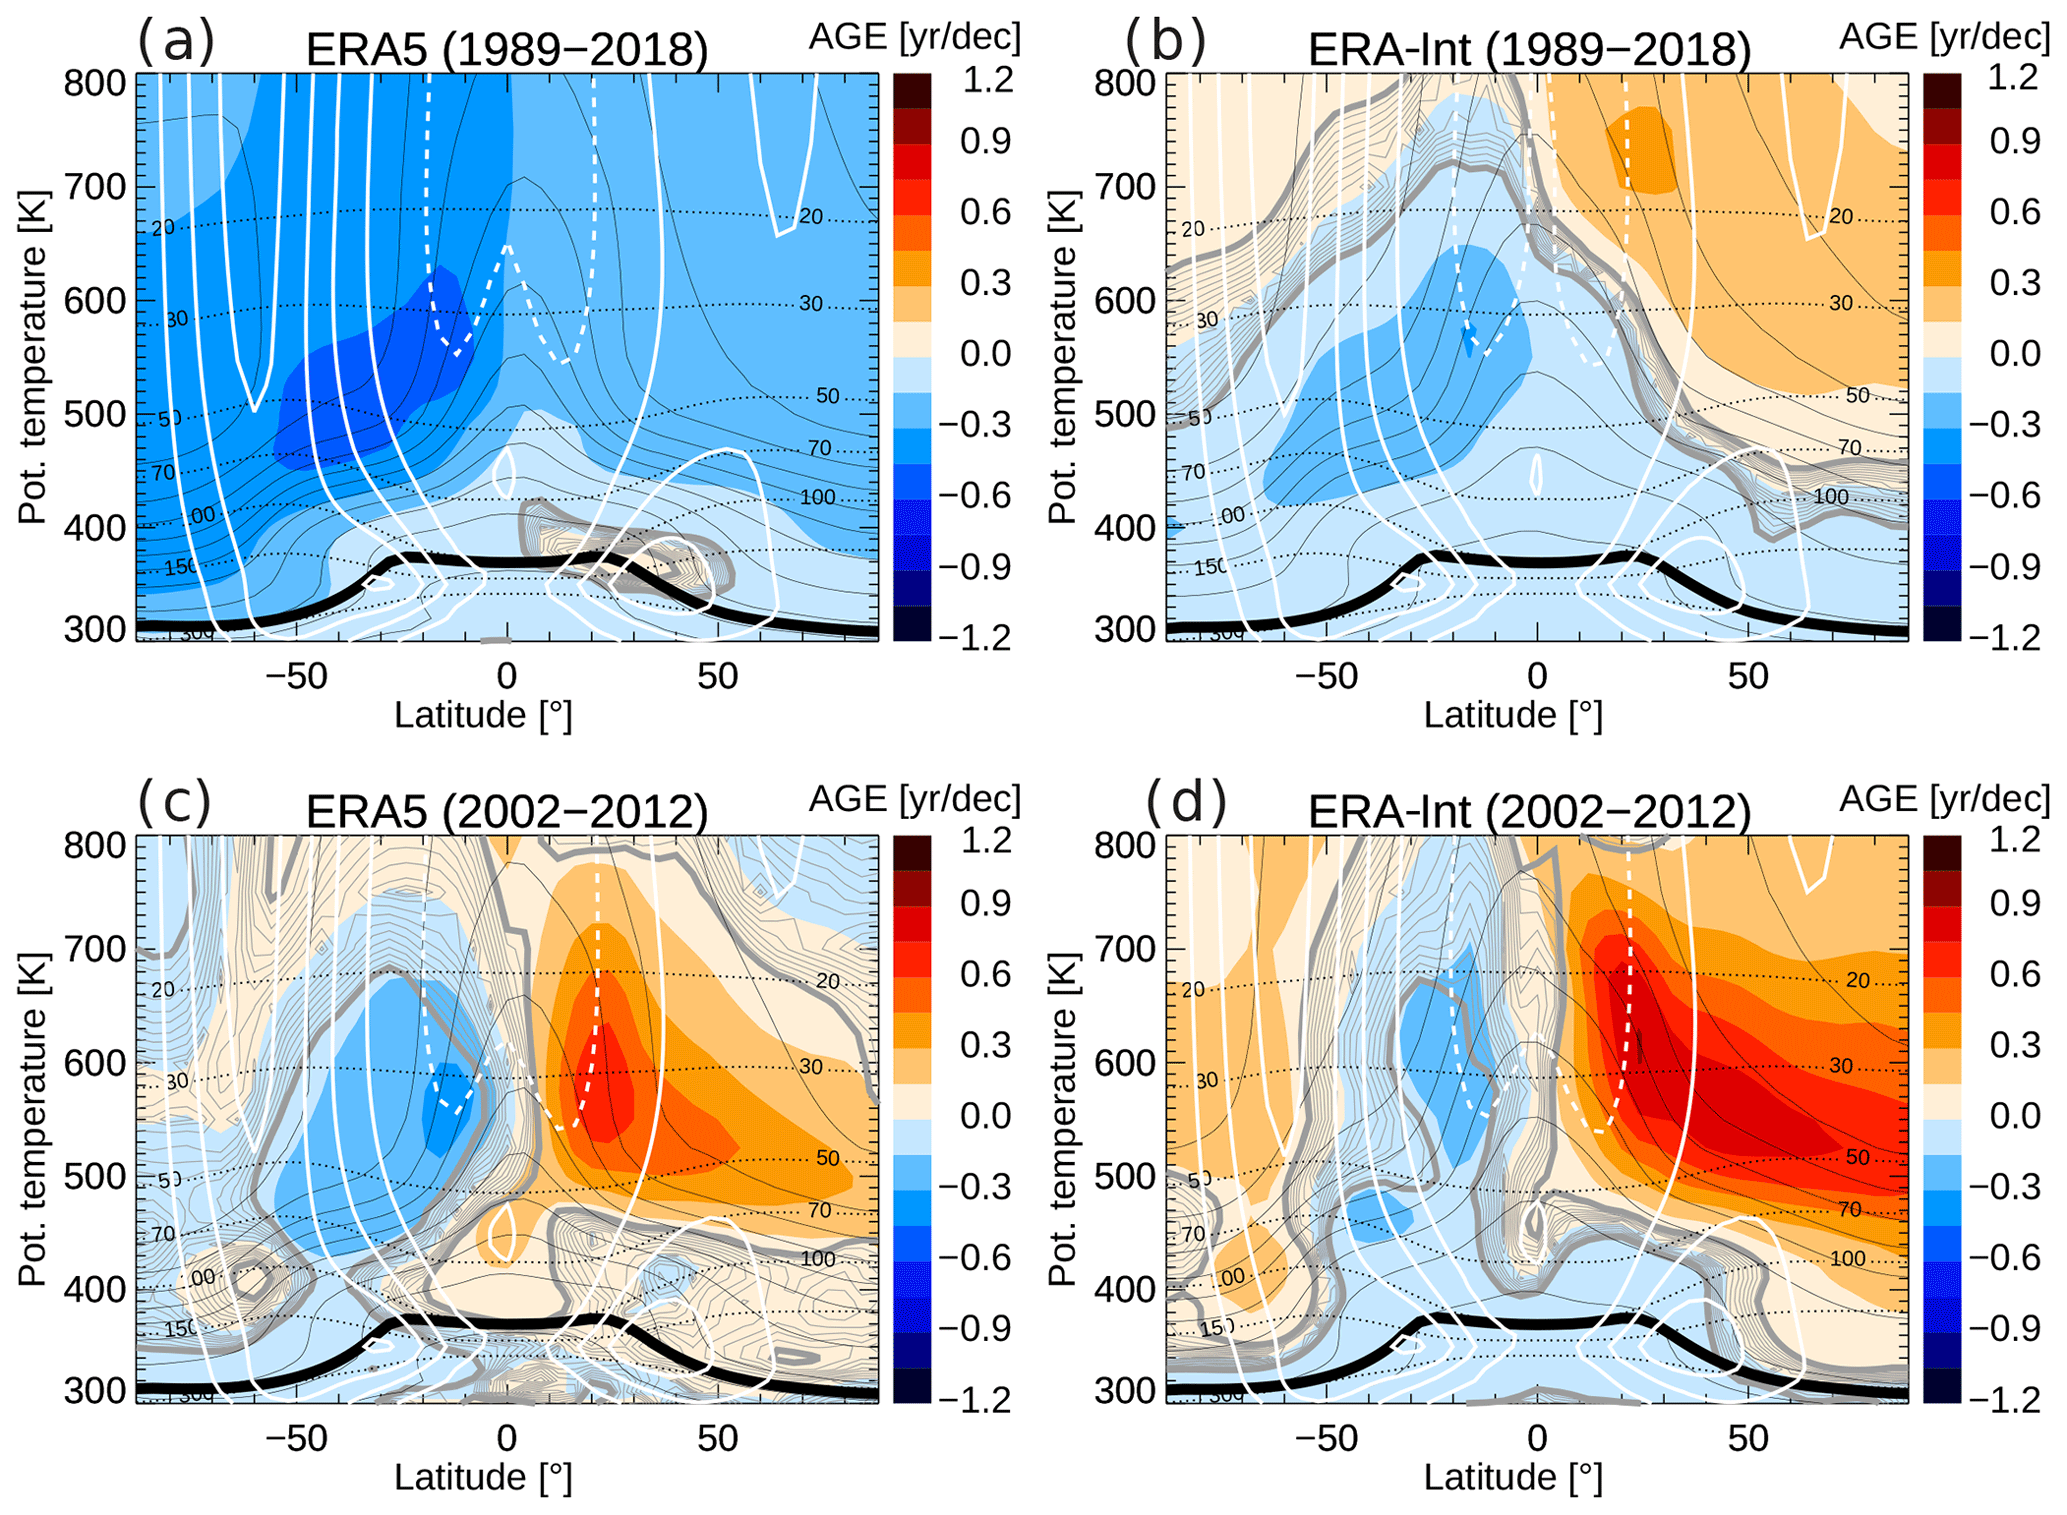
Figure 6 Mean age trends for the 1989–2018 period from ERA5 (a) and ERA-Interim (b). Panels (c) and (d) are the same but for the 2002–2012 period. Black contours (solid) show the climatological mean age, the thin dashed black lines show pressure levels, the white contours show zonal wind (in ±10 m/s steps; easterly wind dashed), and the thick black line shows the tropopause. The significance of the linear trend, measured in multiples of the standard deviation σ, is shown as grey contours (the 2σ contour is thick, and the contours then decrease with a 0.2 step – shown by thin lines).
Evidently, ERA5 shows a negative age trend throughout the stratosphere over the longer period, with the strongest decreases of up to −0.5 years per decade in the SH subtropics and mid-latitudes. In the SH and in the lowest stratosphere (below about 450 K), this negative age trend qualitatively agrees with the trend from ERA-Interim. In particular in the NH above about 500 K, however, the signs of the trends in the two reanalyses are inverse, with ERA-Interim showing increasing age. These differences will be further discussed in Sect. 6.
For the shorter period from 2002 to 2012, both reanalyses show qualitatively similar mean age changes, with increasing age in the NH and decreasing age in the SH (Fig. 6c, d). Detailed differences concern a weaker NH age increase and a stronger SH age decrease in ERA5 compared with ERA-Interim. In the lowest tropical and subtropical stratosphere, ERA5 shows significantly increasing age, although non-significant changes in some regions, compared with decreasing age or insignificant trends in ERA-Interim in this region. Hence, changes in the shallow BDC branch over this short period are not consistent between the two reanalyses. The small quantitative differences for the 2002–2012 ERA-Interim age trends compared with recent publications of CLaMS-simulated mean age (e.g. Stiller et al., 2017) are related to the use of clock-tracer-based versus age-spectrum-based mean age and to the updates in the model configuration (e.g. exclusion of annual mean cross-isentropic mass balance here), as explained in Sect. 2.1.
Trends in the age spectrum provide more detailed information about changes in transport processes and are presented in Fig. 7 for the 1989–2018 period (for the two levels of 400 and 600 K). ERA5 age spectra show a shift of the spectrum peak towards a younger age for most regions, as indicated by comparatively strong positive spectrum trends at transit times shorter than the modal age (indicating an increase in the mass fraction of young air). Such a decrease in modal age can be interpreted as an acceleration of the residual circulation, at least in the tropics and in the winter hemisphere extratropics (e.g. Li et al., 2012; Ploeger and Birner, 2016). In the tropics and SH, this modal age shift and residual circulation acceleration is clearest. In the NH in a shallow layer around the 400 K level between 0 and 50∘ N, the age changes are different, with a decrease in the young air fraction (transit times shorter than modal age) causing weak positive mean age changes (cf. Figs. 7a and 6a).
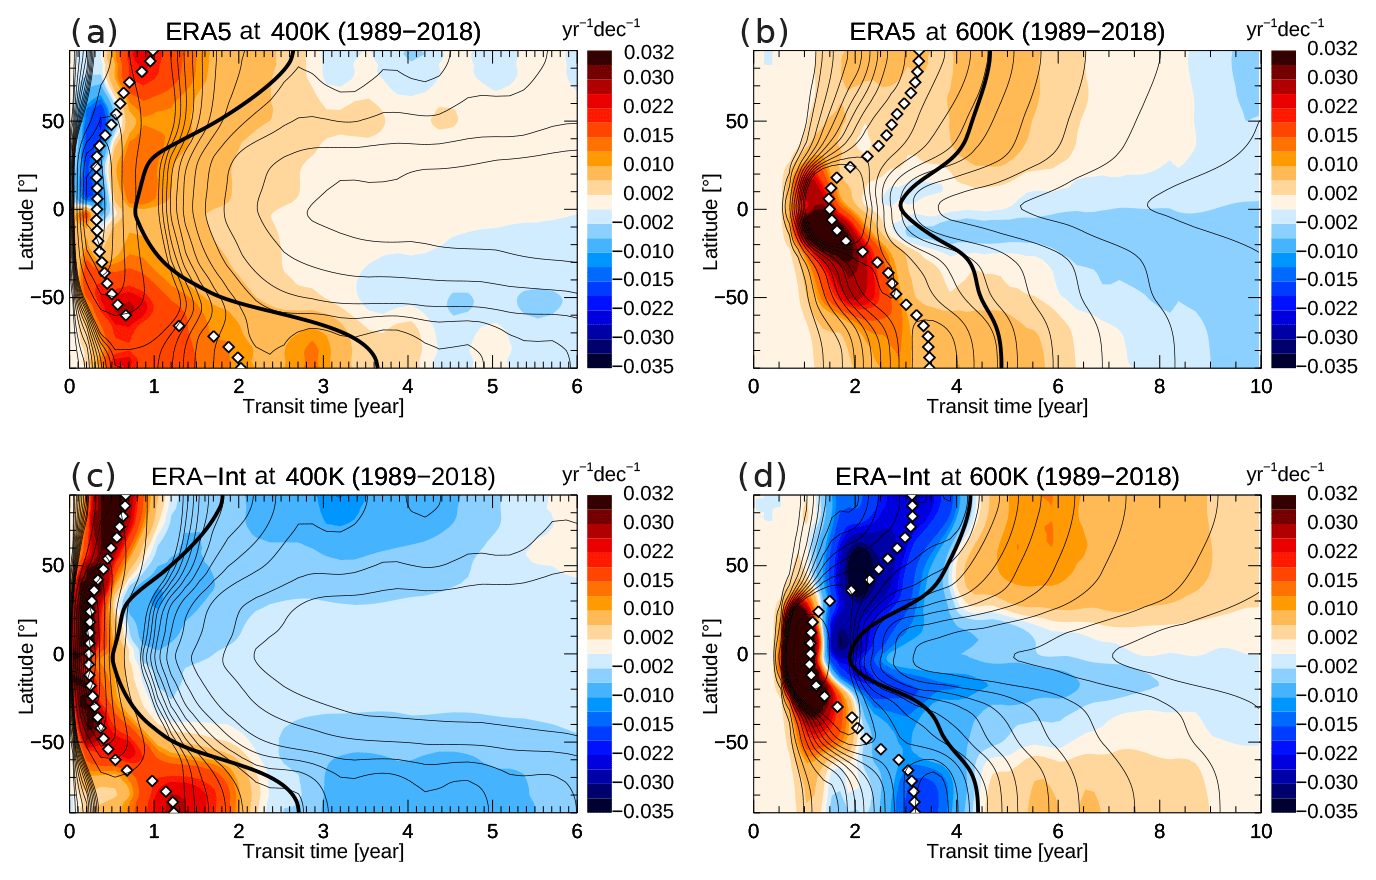
Figure 7 Age spectrum trend for the 1989–2018 period from ERA5 at 400 K (a) and at 600 K (c). Panels (c) and (d) are the same but for ERA-Interim. The thin black contours show annual mean age spectra, the thick black contour shows mean age (calculated as the first moment of spectra), and the white diamonds show modal age (peak of the spectrum). Note the different x axis scales for the two levels.
The clearest difference with respect to ERA-Interim regarding structural age spectrum changes emerges at middle and high latitudes at upper levels (here 600 K; Fig. 7b, d). On the one hand, ERA5 shows a shift of the spectrum to younger ages, although not as clear as in the tropics and in the SH. On the other hand, ERA-Interim shows a decrease in the fraction of air younger than about 4 years old and an increase in the fraction of older air. This increased fraction of air older than about 4 years old in ERA-Interim indicates a deceleration of the deep branch of the residual circulation. The different spectrum changes in ERA5 and ERA-Interim cause the inverse mean age changes in the two reanalyses (Fig. 6) and are related to different trends in the deep BDC branch, as evident from further analysis of the residual circulation (see below).
Changes in the structure of the residual circulation are further investigated using residual circulation transit times (RCTTs), the pure transit time for (hypothetical) air parcels in the 2D residual circulation flow (e.g. Birner and Bönisch, 2011). Here, the RCTTs have been calculated in isentropic coordinates using the same reanalysis diabatic heating rates as in the full CLaMS simulation for calculating vertical motion (e.g. Ploeger et al., 2019). RCTTs cannot be easily compared to mean age, as differences between both quantities are related to mixing effects (e.g. Garny et al., 2014; Dietmüller et al., 2017). Figure 8 shows the climatology and percentage trend in RCTTs for the 1989–2018 period for ERA5 and ERA-Interim. Comparison of climatological RCTTs shows substantially longer transit times for ERA5 than for ERA-Interim (up to 40 % longer in the lower stratosphere), which is consistent with the slower circulation in ERA5 as already diagnosed from heating rates, , and age of air. The trends in RCTTs in Fig. 8c and d indicate differences between the reanalyses regarding changes in the structure of the BDC. In the lower stratosphere below about 600 K, both reanalyses show consistent changes, with decreasing RCTTs indicating a strengthening of the shallow residual circulation branch. In the tropical lower stratosphere, the residual circulation accelerates by about 2.4 % per decade in ERA5 and 2.2 % per decade in ERA-Interim, as diagnosed from the RCTT trend (20∘ N–20∘ S, 450 K average, approximately 70 hPa). Clear differences emerge at higher levels and also at higher latitudes and, hence, appear in atmospheric regions of the deep circulation branch. In these regions, ERA5 still shows decreasing RCTTs; this change becomes insignificant at high latitudes. ERA-Interim, on the other hand, shows increasing RCTTs, which is clearest in the NH. Hence, changes in the deep branch of the residual circulation clearly differ between the reanalyses, with a weakly strengthening deep branch in ERA5 and a weakening deep branch in ERA-Interim.

Figure 8 Residual circulation transit times (RCTTs) from ERA5 (a) and ERA-Interim (b) and their trends over the 1989–2018 period (c, d). The thin black lines in panels (c) and (d) show climatological RCTT contours (in 0.3 year steps). The white contours show zonal wind (in ±10 m/s steps; easterly wind dashed), the thin dashed black lines show potential temperature levels, and the thick black line shows the (WMO lapse rate) tropopause. The significance of the linear trend, measured in multiples of the standard deviation σ, is shown as grey contours (the 2σ contour is thick, and the contours then decrease with a 0.2 step – shown by thin lines).
Figure 9 provides further insights into the temporal evolution of mean age at three different locations in the stratosphere. The three locations have been chosen to be representative of the tropical lower stratosphere, and the NH and SH subtropical stratosphere regions of strong mean age trends (cf. Figs. 6 and 9). In the tropical lower stratosphere (450 K and 10∘ S–10∘ N; Fig. 9a), the relative difference between ERA5 and ERA-Interim is large and the variability in ERA5 mean age is significantly stronger than in ERA-Interim. At the higher levels, the variability in mean age in the two reanalyses is more comparable in magnitude. From a qualitative point of view, the variability is similar at all locations, with coinciding ups and downs in the age time series, caused by factors such as modulations in the BDC related to the Quasi-Biennial Oscillation, QBO, or El Niño–Southern Oscillation, ENSO (e.g. Calvo et al., 2010; Konopka et al., 2016). A particularly striking feature is the anomalously high mean age following the year 1991, which is even higher for ERA5 than ERA-Interim. This significant increase in stratospheric mean age in reanalyses has been related to the Mt. Pinatubo eruption in June 1991 (Diallo et al., 2017).
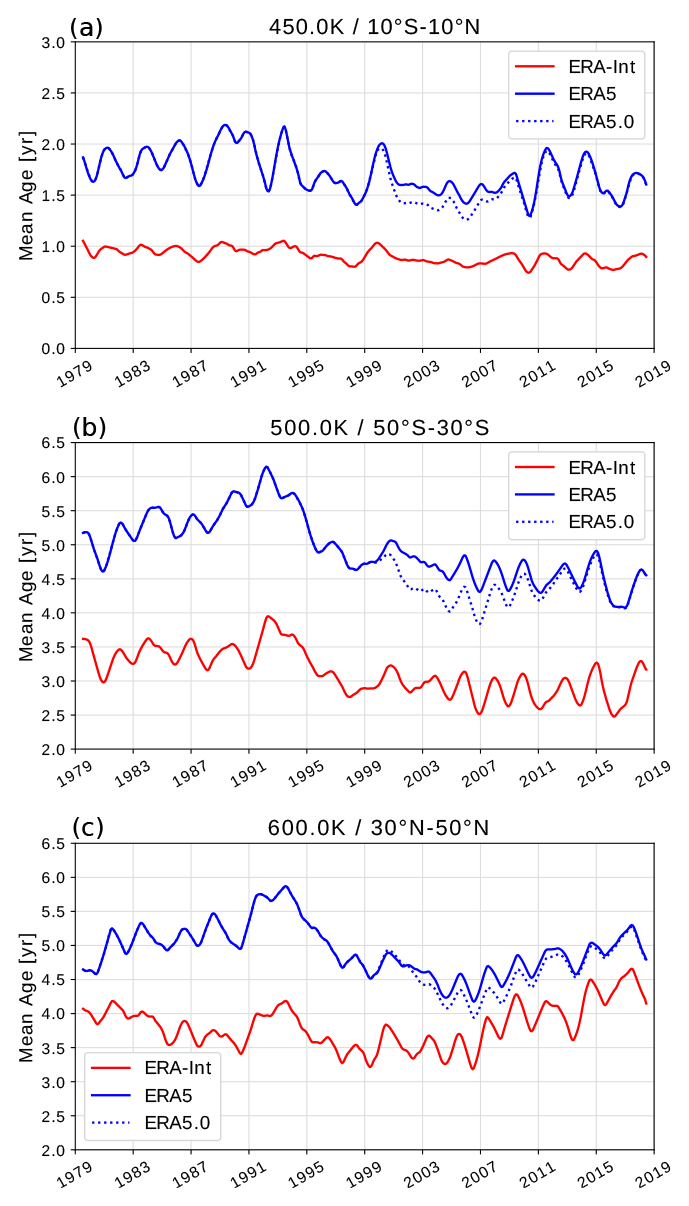
Figure 9 Mean age time series from ERA5 and ERA-Interim in the (a) tropics at 450 K and 10∘ S–10∘ N, in the (b) SH subtropics at 500 K and 30–50∘ S, and in the (c) SH subtropics at 600 K and 30–50∘ N. The blue dotted line shows mean age from the sensitivity model simulation driven by the uncorrected ERA5.0 data (see text). Data have been deseasonalized by applying a 12-month running mean.
While Fig. 6 suggests a clear decrease in ERA5 mean age throughout the global stratosphere, the time series in Fig. 9 show that this decrease is not a simple linear trend over the 30 years considered. In fact, outside the tropics, mean age appears to increase before about 1991 in both hemispheres as well as in the NH after about the year 2000. During the 1990s, mean age decreases in ERA5. These steplike changes are evident in both reanalyses. In the early 1990s, these age changes are likely related to the Pinatubo eruption (i.e. true atmospheric variability), whereas at the end of the 1990s, they could be related to changes in the observing system assimilated by the reanalyses (see Sect. 6 and Chabrillat et al., 2018). In particular in the NH (Fig. 9c), the negative age trend in ERA5 during the 1989–2018 period appears to be related to the strongly increased age values at the beginning of the period. Further discussion of these steplike changes in the age of air time series is presented in Sect. 6.
Climatological reanalysis mean age at 20 km altitude is compared to mean age from CO2 and SF6 trace gas measurements in Fig. 10. Comparison is made to data from in situ observations onboard the NASA ER-2 aircraft (as compiled by Waugh and Hall, 2002; see the references therein for a detailed description of the data). It should be noted that we consider this data set as an observational climatological benchmark here, as similarly done in other model comparisons (e.g. Chabrillat et al., 2018; Diallo et al., 2012), although the ER-2 flights were carried out during the 1992–1997 period, whereas the model data in Fig. 10a are a climatology over the 1989–2018 period. In general, uncertainties in observational mean age estimates are related to non-linearities and imperfect knowledge in tropospheric growth rates, sampling issues, chemistry effects, and measurement errors (Waugh and Hall, 2002). The mean age deduced from observed SF6 is higher than mean age deduced from CO2, which is consistent with the existence of a significant SF6 chemical sink in the mesosphere (Ray et al., 2017). The latitudinal age distribution in ERA-Interim agrees well with the in situ data (best for CO2-based mean age), whereas the higher ERA5 mean age values are just at the upper margin of the uncertainty range of the in situ SF6-based observations. Recently, Leedham Elvidge et al. (2018) showed that the SF6-based mean age may be biased high even outside of the polar vortex. On the other hand, the ERA5 age data show a steeper latitudinal gradient in the subtropics which agrees slightly better with the steep gradient in the age observed in situ compared with ERA-Interim.
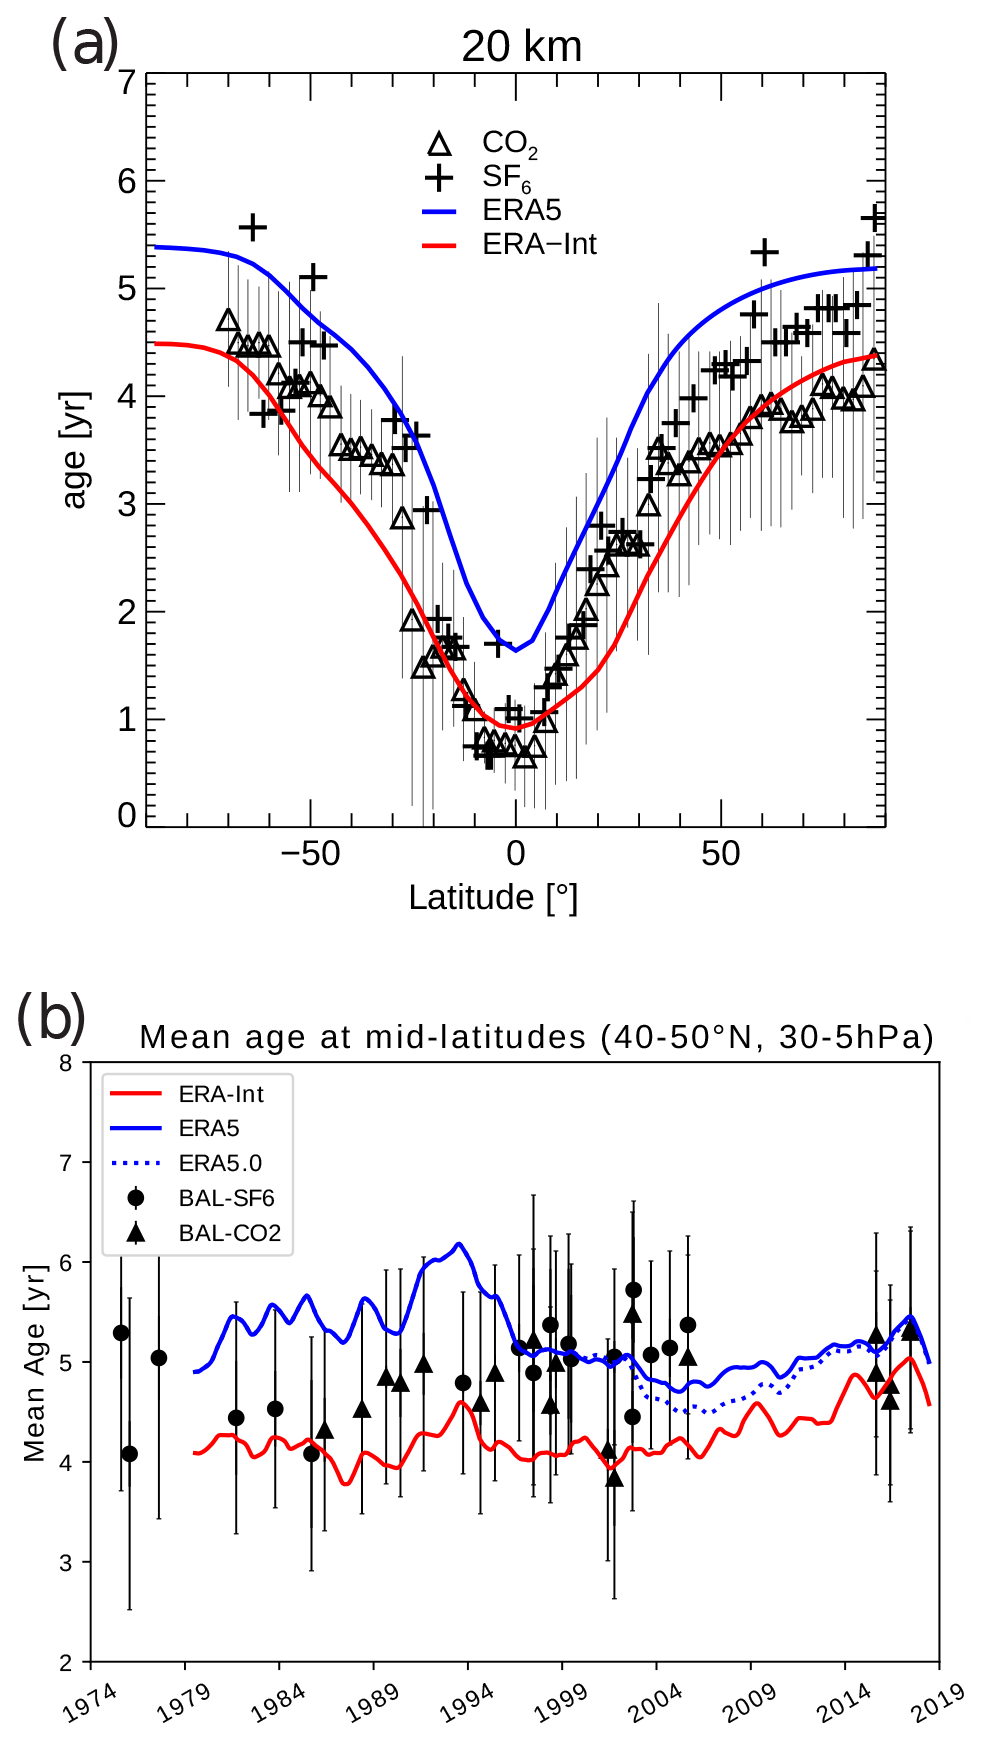
Figure 10 (a) Mean age of air at 20 km at different latitudes from in situ observations (black symbols, from Waugh, 2009), from ERA5 (blue) and ERA-Interim (red) driven CLaMS simulations. (b) Mean age time series in the NH middle latitudes (40–50∘ N and 30–5 hPa, approximately 600–1200 K for reanalyses). Coloured lines show the mean age from reanalyses (smoothed with a 12-month running mean), and black symbols show the mean age from the balloon-borne observations of Engel et al. (2017), with error bars representing the uncertainty of the observations.
Figure 10b presents a comparison of mean age time series in the NH middle stratosphere (model data averaged over 40–50∘ N, 30–5 hPa) with the balloon-borne observations of Engel et al. (2017). The observational uncertainty range includes uncertainty related to the sampling (representativeness), tropospheric mixing ratios, the age spectrum parameterization used, and the absolute measurement error (for details, see Engel et al., 2009). The comparison again shows that ERA5 age is at the upper edge of the observational uncertainty range before about 1997, whereas ERA-Interim is at the lower edge (Fig. 10b). Regarding the trend, the more gradual increase in ERA-Interim mean age appears to compare better to the observed data than the temporal evolution of ERA5 mean age. In particular the strong decrease in ERA5 age in the mid-1990s is not present in the observations. Although computing a linear trend for a time series with a steplike change (such as that for ERA5) is questionable, for completeness we note the trend values from a simple linear regression over the 1989–2018 period for ERA5 ( years per decade, where the error is the 1σ standard deviation range from the regression) and for ERA-Interim (0.15±0.01 years per decade). The trend value for ERA-Interim agrees with the value stated by Engel et al. (2017), although the observational trend is not significant. Furthermore, Fritsch et al. (2020) recently showed that the calculated value for the observed mean age trend depends critically on the estimated age spectrum shape, and it approaches zero for more recent parameter settings suggested by (Hauck et al., 2019). Hence, the comparison between the ERA-Interim and the observed trend values should not be over-interpreted, especially given the differences between the single data points of the two time series in Fig. 10b.
Figure 11 further compares the reanalysis mean age to in situ observations from Geophysica high-altitude aircraft flights in the NH lower stratosphere (for a detailed description of the measurement data, see Laube et al., 2020). The observations were taken during five measurement campaigns over the 2009–2017 period in the NH lower stratosphere (about 350–480 K potential temperature). Mean age has been calculated from measured mixing ratios of CF4, C2F6, C3F8, CHF3, and HFC-125. The observational uncertainty range has been estimated following (Engel et al., 2009), considering uncertainties related to non-linearities in tropospheric mixing ratios, age spectrum parameterization, and measurement errors, summing up to an overall uncertainty range of ±0.78 years (to be interpreted as 1σ range). The model output has been sampled along the measurement flight coordinates such that no representativeness errors need to be included. Figure 11 shows the distribution of differences between the model and observational mean age for mean ages higher than 1 year (to exclude the tropopause region, where the uncertainty in both the observational and model mean age is large, which is related to air entering across the extratropical tropopause). For ERA-Interim, the figure shows that the model bias distribution, estimated as the difference between simulated and observed mean age, is largely within the observational uncertainty range (shown as grey shading in Fig. 11, only 21 % of data are outside this range). For ERA5, on the other hand, the bias distribution is shifted to mean age differences of around 1 year and is skewed towards even higher values, such that 56 % of the data are outside the observational 1σ range. Hence, ERA5 mean age appears to be biased somewhat high in the lower stratosphere. However, the 1σ ranges of the mean ERA5 difference (0.43 years, also for ERA-Interim) and the observational uncertainty overlap (see Fig. 11), and the mean ERA5 bias in age here is not significant at the 66 % confidence level. Moreover, recent studies have indicated even higher uncertainties for observational mean age estimates (Hauck et al., 2019; Fritsch et al., 2020), and the considered Geophysica observations are only from five campaigns localized in time and space, such that it is unclear whether the differences found can be considered as a global bias.
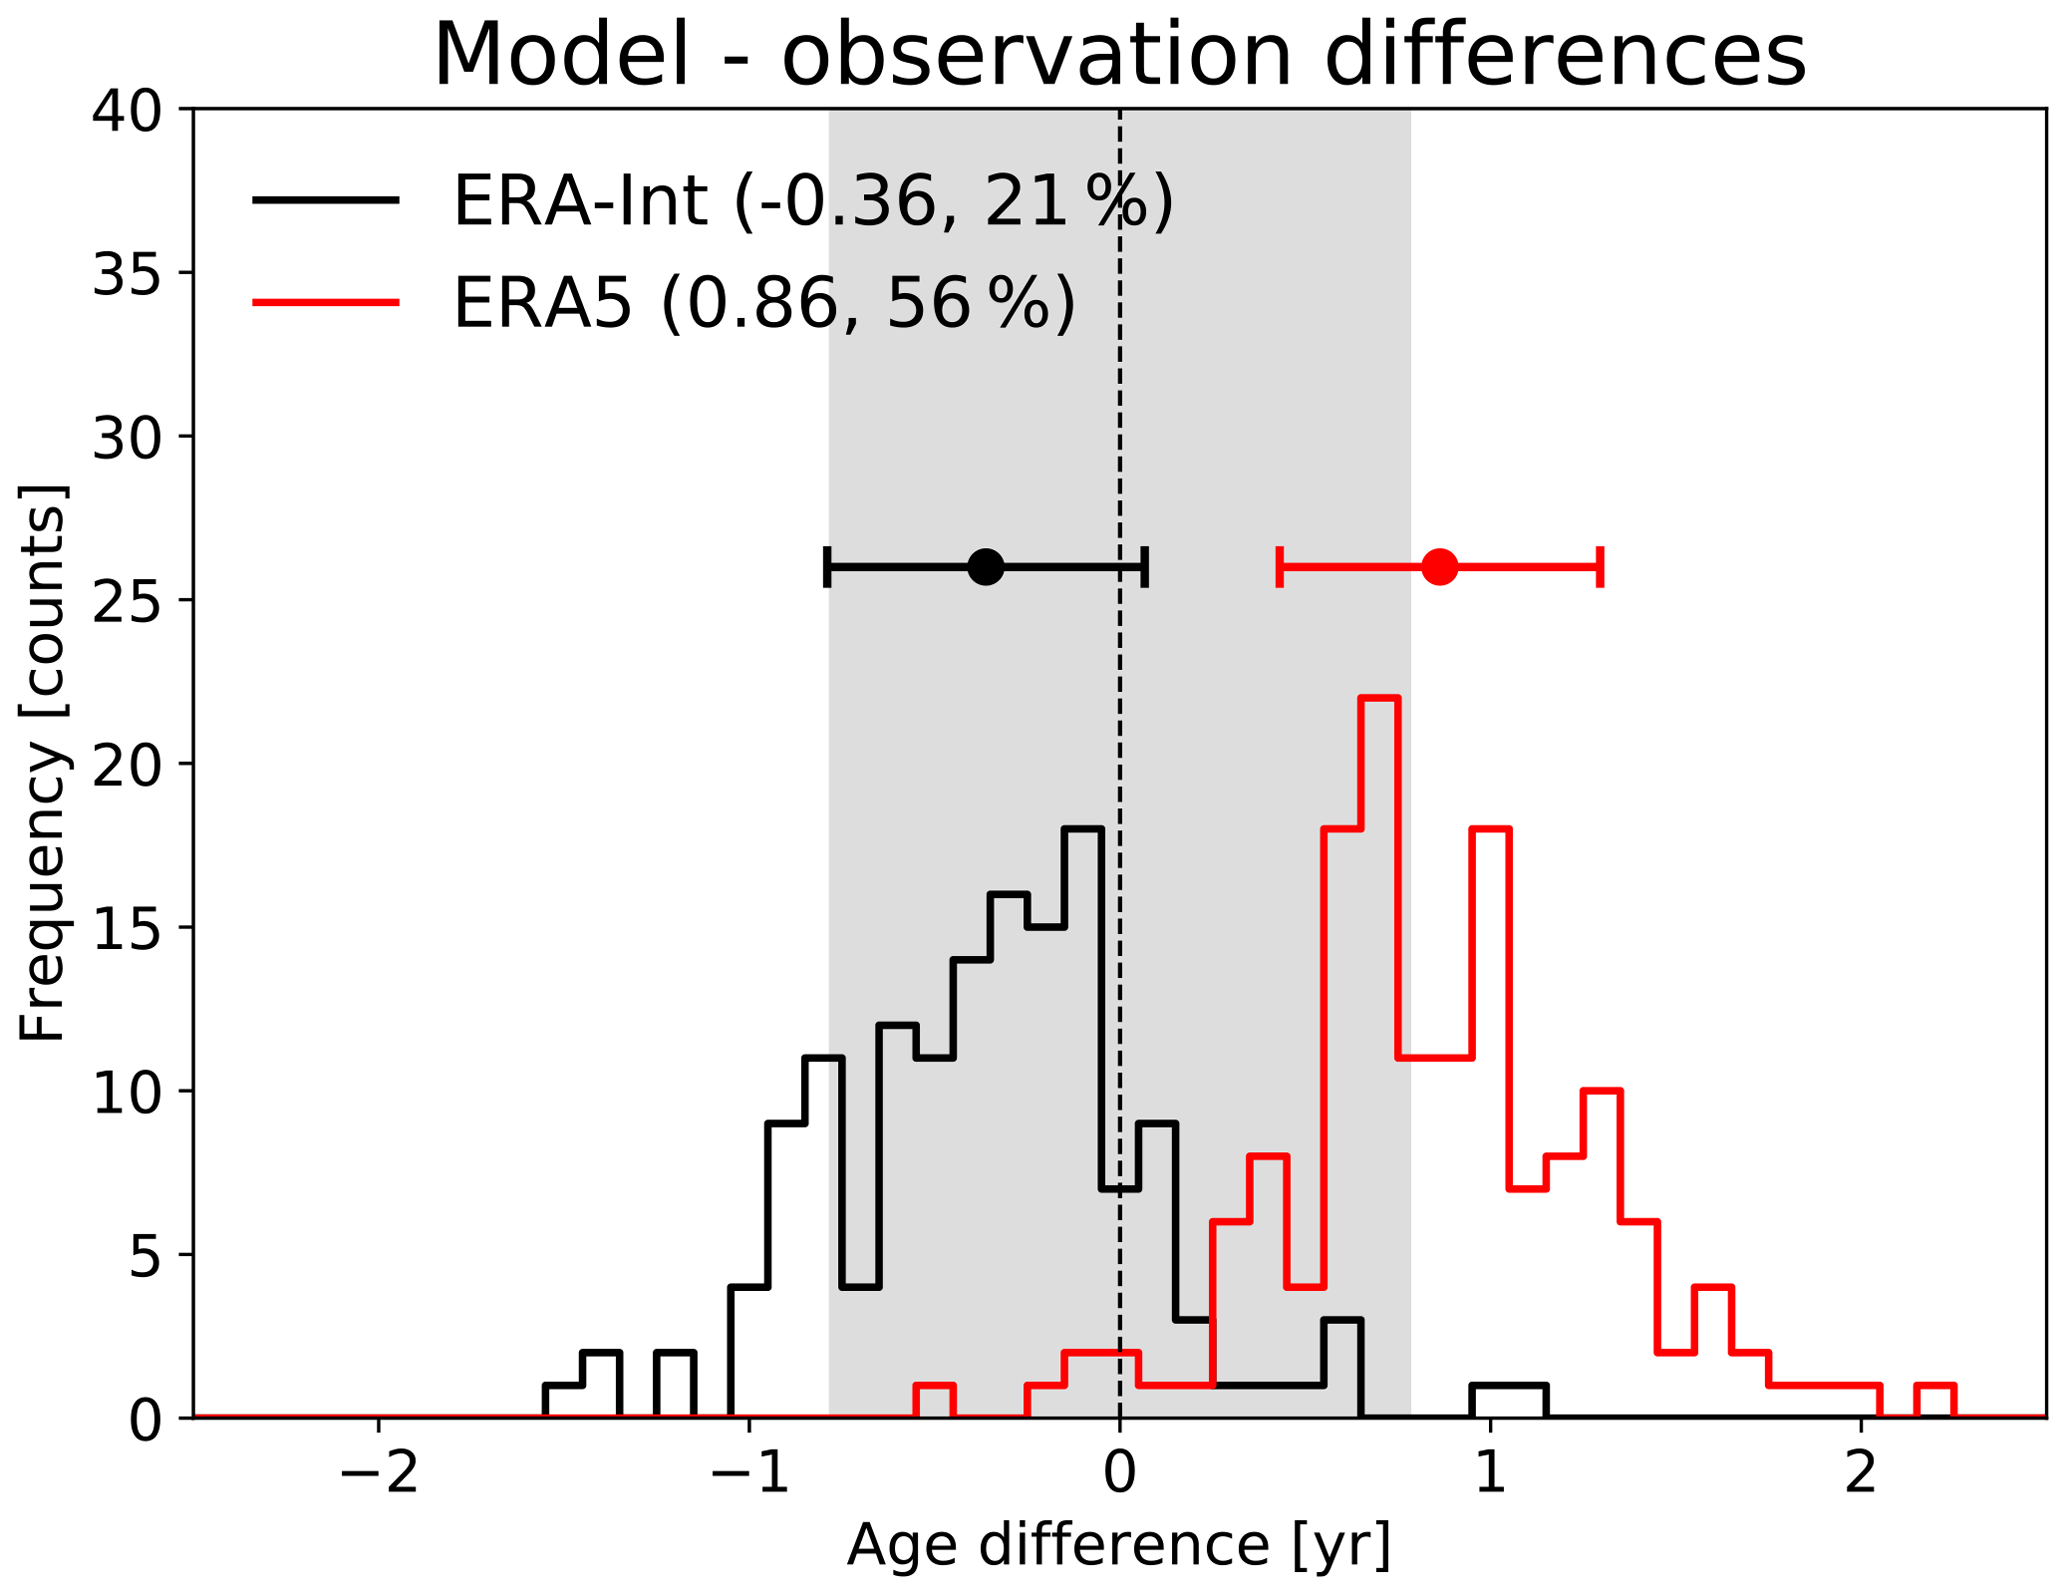
Figure 11 Difference in mean age between model and Geophysica aircraft observations for ERA5 (red) and ERA-Interim (black). Shown are frequency distributions of the mean age differences (bin size of 0.1 year) taken in the extratropical lower stratosphere, about 350–480 K (for details on the measurements, see Laube et al., 2020). The grey shading shows the mean uncertainty range of the observations (±0.78 years), the red and black symbols show the mean differences, and the error bars show their standard deviation (1σ) range. The numbers in the legend are the mean difference values (in years) and the percentage of data outside this uncertainty range.
Recent studies have stated a substantial uncertainty in the climatological strength and trends of the stratospheric BDC and age of air in current-generation reanalyses (e.g. Abalos et al., 2015; Miyazaki et al., 2016; Chabrillat et al., 2018; Ploeger et al., 2019). Among the reanalyses considered, JRA-55 was shown to have the fastest BDC and MERRA-2 was shown to have the slowest BDC, with ERA-Interim-based results in between. In the present study, we find the BDC in ERA5 to be significantly slower and age of air significantly higher than in ERA-Interim (e.g. Figs. 1 and 3).
It is currently unclear whether the representation of the BDC in ERA5 is improved compared with the older reanalyses. In the tropical lower stratosphere, the weaker heating rates in ERA5 are consistent with slower residual circulation upwelling found by Diallo et al. (2021), and they appear to correct the 30 %–40 % high bias in ERA-Interim heating rates in the tropical tropopause layer (TTL) found in previous studies (e.g. Ploeger et al., 2012; Schoeberl et al., 2012). On the other hand, the minimum in tropical upwelling around the level of zero radiative heating (around 350 K) is much more pronounced for ERA5 than for ERA-Interim, with heating rates even showing a gap in annual mean upwelling in a shallow layer, similar to the case in the MERRA-2 reanalysis (e.g. compare Fig. 1 in this paper with Fig. 5 of Ploeger et al., 2019). In a recent paper, Wright et al. (2020) linked differences in reanalysis diabatic heating rates to differences in the representation of clouds. They argued that the upwelling gap in ERA5 and MERRA-2 is likely caused by higher cloud water content in these two reanalyses and the related radiative effects. Indeed, seasonal means of ERA5 heating rates also show upwelling at the lower TTL levels, but it is very confined regionally and much weaker than for ERA-Interim. Hence, while the representation of tropical upwelling seems to be improved in ERA5 in the tropical lower stratosphere and upper TTL (about 100–50 hPa), it is unclear whether the very weak total diabatic heating rates in the upper troposphere and lower TTL (200–100 hPa) are realistic. Above the TTL and in the NH stratosphere, age of air in ERA5 is at the upper edge of the uncertainty range of in situ observations (Fig. 10a). In particular in the NH lower stratosphere, comparison to Geophysica aircraft in situ observations from Laube et al. (2020) shows that ERA5 mean age is biased somewhat high and the ERA5 BDC somewhat too slow (Fig. 11). Hence, all comparisons to observational data presented here indicate that the slow ERA5 BDC is at the upper margin of the observational uncertainty range. However, these differences are not significant due to the large observational uncertainty range and the fact that the observations considered are highly localized in time and space. Hence, it is unclear whether the high age and slow BDC in ERA5 represents a global bias.
Comparison of age of air trends shows a similar hemispheric dipole pattern over the 2002–2012 period for ERA5 as for ERA-Interim, which was argued by Stiller et al. (2017) to agree qualitatively with the structural circulation change observed by MIPAS. This observed increase in age in the NH and decrease in age in the SH has not been found for “non-ECMWF” reanalyses to date (Chabrillat et al., 2018; Ploeger et al., 2019). Regarding the long-term trend in the NH, ERA5 and ERA-Interim show differences. While ERA-Interim shows weakly increasing age of air, more consistent with non-significant trend values from balloon-borne in situ observations (Engel et al., 2017; Fritsch et al., 2020), ERA5 shows decreasing age. Overall, the agreement with stratospheric age of air observations appears slightly better for ERA-Interim compared with ERA5, although with both reanalyses within the observational uncertainty range.
The globally negative age of air trend in ERA5 over the 1989–2018 period agrees qualitatively with results from climate model simulations, showing an accelerating BDC and decreasing mean age over multi-decadal timescales in response to increasing greenhouse gas concentrations. In the tropical lower stratosphere, the residual circulation upwelling increase of 2.4 % per decade in ERA5, as inferred from RCTTs, even agrees quantitatively with climate model predictions of 2 % per decade to 3 % per decade (e.g. Butchart, 2014). In the lower tropical stratosphere, the residual circulation acceleration in ERA-Interim is similar (see Sect. 4). However, this acceleration of the residual circulation reaches substantially higher values in ERA5, whereas the deep BDC branch decelerates in ERA-Interim (Fig. 8).
In a recent study, Diallo et al. (2021) compared the residual circulation in ERA5 and ERA-Interim based on residual circulation vertical velocity and stream function. They showed, using these standard circulation metrics, that the BDC in ERA5 is significantly slower than in ERA-Interim, which is consistent with the findings here based on age of air and the diabatic circulation (heating rate based). Furthermore, they related the weaker residual circulation to weaker gravity wave drag at the upper flanks of the subtropical jets in ERA5 compared with ERA-Interim. Moreover, differences in trends in were shown to likely be caused by differences in gravity wave drag. Given the qualitatively similar results between age of air and residual circulation regarding both the weaker climatological BDC and more negative trends in ERA5, it seems likely that reanalysis differences between ERA5 and ERA-Interim in age of air are mainly caused by the differences in residual circulation and that mixing differences only play an amplifying role (as suggested for different data by Garny et al., 2014). The clear differences in the age spectrum peaks (modal ages; cf. Figs. 4, 5, and 7) corroborate the idea that residual circulation differences cause the mean age differences. An investigation of mixing in ERA5 based on the computation of effective diffusivity (e.g. Haynes and Shuckburgh, 2000), as has been realized for other reanalyses recently (e.g. Abalos et al., 2017), could shed more light on the role of mixing processes for age of air differences between the reanalyses.
A closer look shows that the decrease in mean age in ERA5 is not simply linear, particularly in the NH. Mean age time series even show weak increases before about 1991 and after about 2000 as well as a decrease in between. Although these steplike changes are also visible in ERA-Interim to some degree, they are much more distinct in ERA5. It is unclear whether these changes in mean age can be explained by known factors of multi-annual to decadal variability or whether they are related to changes in the observations included in the reanalysis assimilation system. To investigate potential discontinuities in the reanalysis, Fig. 12 presents tropical mean (30∘ N–30∘ S) anomaly time series for total diabatic vertical velocity and residual circulation vertical velocity . Above about 1000 K potential temperature (about 7 hPa), a clear discontinuity in heating rates in 1998 is evident for both reanalysis; for ERA-Interim, this has been related to the change from TOVS (TIROS Operational Vertical Sounder) to ATOVS (Advanced TIROS Operational Vertical Sounder) radiance data by Abalos et al. (2015). For ERA5, this discontinuity appears less pronounced but is still observable. In the lower stratosphere (below about 1000 K or 10 hPa), however, the heating rate time series indicate no discontinuities. The time series now show discontinuities over the entire vertical range and the 1979–2018 period. Hence, we find no indication of sudden changes in the assimilation that would cause the steplike change in lower stratospheric age of air in the mid-1990s.
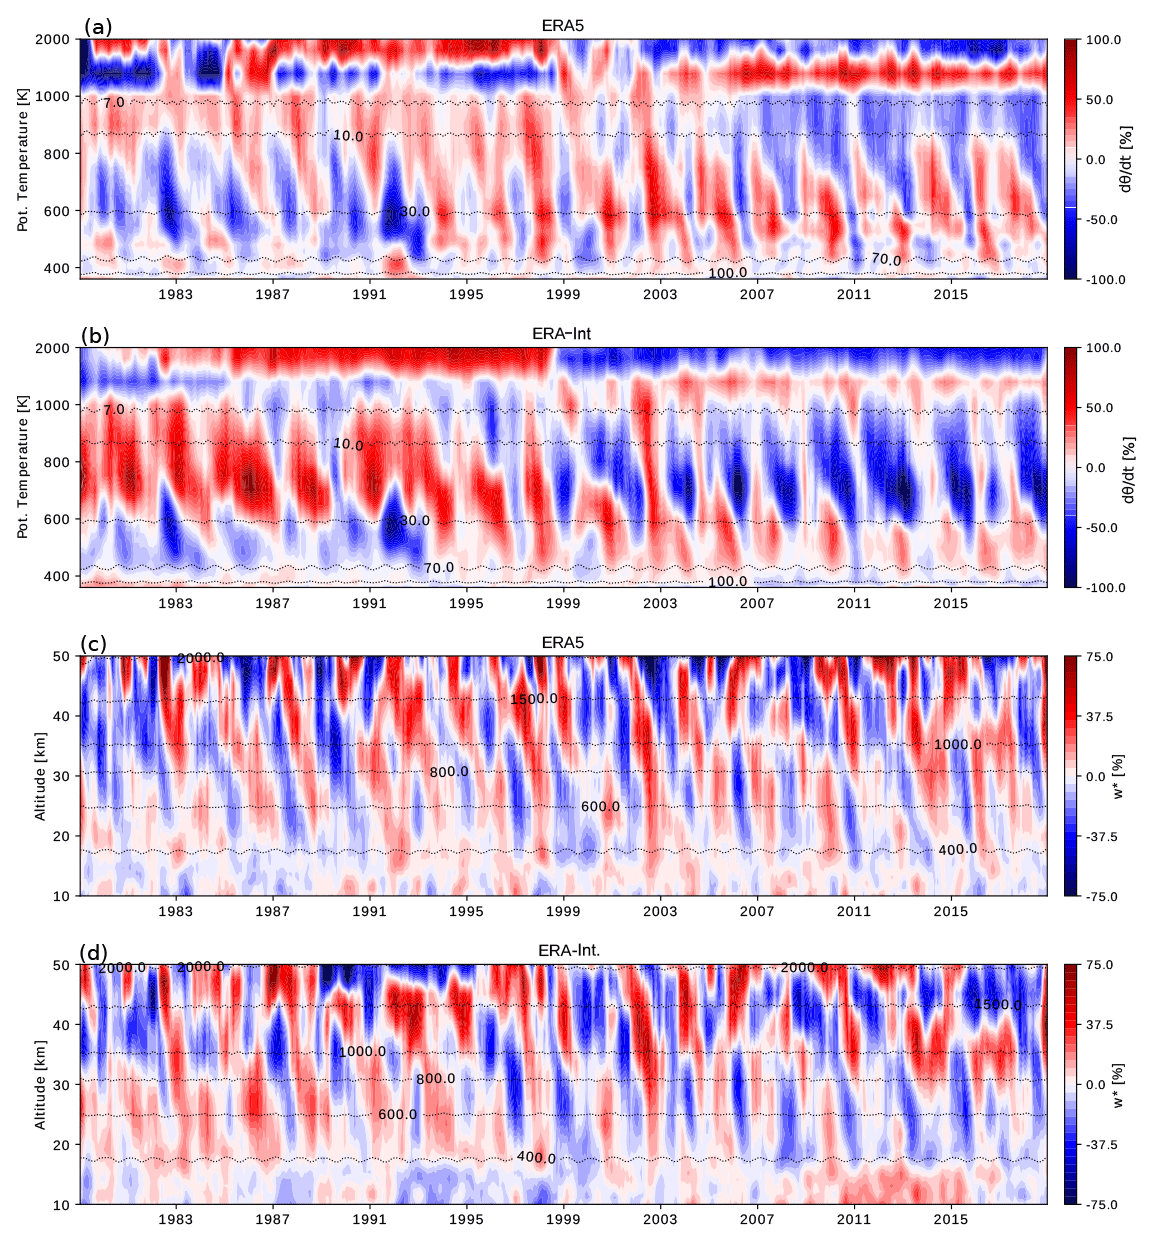
Figure 12 Tropical average monthly mean anomaly time series of total diabatic vertical velocities from ERA5 (a) and ERA-Interim (b), and residual circulation vertical velocity from ERA5 (c) and ERA-Interim (d). Data have been averaged over 30∘ N–30∘ S, deseasonalized by subtracting the mean annual cycle, and percentage values have been calculated with respect to the climatological mean. The thin black dashed lines show pressure (a, b) and potential temperature (c, d) levels. Note the scaled potential temperature y axis above 1000 K (in panels a and b), in order to emphasize the lower stratosphere.
A very prominent signal in the lower stratosphere (below about 800 K, 10 hPa) is the negative heating rate anomaly during the 1991–1992 period, following the Pinatubo eruption (and similarly in 1982–1983 after the El Chichón eruption). This weakening of tropical upwelling heating rates is even stronger for ERA5 compared with ERA-Interim and is related to the positive mean age anomaly during that period (Fig. 9; see also Diallo et al., 2017). Hence, the apparent steplike age change in the mid-1990s appears to be related to the significant age increase (BDC slowdown) after the Pinatubo eruption, in addition to a positive age trend over the 1980s in ERA5. It is likely that differences between the reanalyses are partly related to differences in the representation of the effect of volcanic aerosol on the BDC. Notably, the response of to volcanic eruptions (here Pinatubo and El Chichón) shows positive anomalies (increased tropical upwelling) and is the inverse of the heating rate response (see Fig. 12), as already noted for the older reanalysis products in previous studies (e.g. Abalos et al., 2015; Diallo et al., 2017). This difference in the volcanic response in heating rates and residual circulation velocity is an important issue for future research, particularly in view of its impact on decadal age of air (and BDC) trends.
If indeed related to real variability, these decadal variations in the BDC are significant compared with the potential long-term trend, with an even stronger impact in ERA5 than in ERA-Interim. The 30- to 40-year time series is presumably still too short for computing long-term trends in reanalysis, where stratospheric variability might be larger compared with climate models. However, studying variability on shorter timescales (e.g. inter-annual or decadal) in reanalysis is of value in itself. Whether the long-term mean age trend in the ERA5 reanalysis is indeed negative needs to be further analysed in the future by including more years after 2018 as well as more years before 1979 (as available from an extended ERA5 data product to be released soon).
As already mentioned in Sect. 2.2, we also carried out CLaMS model simulations with the preceding data set with an existing bias in stratospheric temperatures (termed ERA5.0 here). Mean age time series from this sensitivity simulation are included in Figs. 9 and 10 (dotted blue lines). The comparison between ERA5 and ERA5.0 shows that the bias correction indeed has a significant effect on the stratospheric BDC. Without the correction, mean age values suddenly decrease around the year 2000 and remain lower during the following years compared with the corrected ERA5 data. Therefore, the steplike age change is even stronger in ERA5.0 than in the corrected data. Consequently, trends over periods beginning during 2000–2010 (depending on the region under consideration) are more strongly positive for ERA5.0 compared with the corrected ERA5 data. Furthermore, the reduction of the steplike change in age due to the temperature bias correction raises the question of whether the remaining steplike change could, at least partly, be related to an incomplete bias correction in ERA5 or to the bias correction starting too late.
As explained in Sect. 2 the CLaMS model simulations are based on the diabatic circulation in the reanalysis as driven by the reanalysis diabatic heating rate. For ERA-Interim, it has been shown that the choice of a diabatic versus kinematic transport representation could indeed change the simulated BDC to some degree, in particular regarding trends over decadal periods (Chabrillat et al., 2018; Ploeger et al., 2019). Hence, comparison of the diabatic results here to a similar model study focusing on the ERA5 BDC using a kinematic transport model would be particularly interesting. Furthermore, the present study is based on ERA5 data with full vertical but truncated 1∘ × 1∘ horizontal resolution, as provided by ECMWF (see Sect. 2.2). We assume that differences in the global-scale BDC patterns caused by the truncation of horizontal resolution, and hence small-scale mixing processes, will be minor. However, at this stage this is just an assumption and cannot be proven, as full CLaMS simulations with full ERA5 resolution over the entire ERA5 period are currently not feasible due to the excessive amount of reanalysis data needed and further model developments are necessary with respect to the data handling.
We investigated the global stratospheric Brewer–Dobson circulation in the ECMWF ERA5 reanalysis based on age of air simulations with the Lagrangian chemistry transport model CLaMS driven by reanalysis winds and diabatic heating rates. The simulations include both mean age as well as the age of air spectrum. Results are compared against results based on the predecessor reanalysis ERA-Interim.
We find that the global structure and seasonality in both reanalyses are very similar. However, the BDC is substantially slower and the age of air is higher in ERA5 than in ERA-Interim. In the tropical lower stratosphere and in the upper TTL, the 30 %–40 % weaker heating rates in ERA5 appear to correct the overly strong vertical upwelling in ERA-Interim that has been found in previous studies. At higher stratospheric levels above the TTL and in the NH, on the other hand, ERA5 mean age is found to be biased somewhat high relative to observational estimates, and ERA-Interim is biased slightly low, although within the uncertainly associated with the data presented. The high bias of ERA5 is, if anything, larger than the low bias of ERA-Interim.
The mean age trend over the 1989–2018 period in ERA5 is globally negative, as expected from climate model simulations in response to increasing greenhouse gas concentrations. However, outside the tropics the ERA5 mean age decrease is not linear over the entire period but is largely related to a steplike change in the mid-1990s. Hence, it is unclear whether the negative age trend in the reanalysis can be interpreted as a response to climate change or is related to decadal variability or changes in the observations included in the data assimilation system. Based on the absence of sudden changes in heating rate and residual circulation velocity time series, the relation to variability, in particular caused by volcanic aerosol, seems more likely, but effects from the assimilation cannot be ruled out. Due to the slowness of the circulation and the existence of a negative age trend in the NH, the discrepancy with balloon-borne and aircraft in situ observations is larger for ERA5 than for ERA-Interim. The mean age change over the 2002–2012 period in ERA5 shows a similar hemispheric asymmetry as that found for ERA-Interim.
Overall, the new ERA5 reanalysis appears promising for transport studies of the BDC. It is certainly important for such studies to use the bias-corrected data set (termed ERA5.1 in ECMWF's documentation). However, the presented comparison to observationally based age indicates that the BDC is biased slow in ERA5, although further investigations would be needed to determine the global significance of this bias.
ERA5 and ERA-Interim reanalysis data are available from the ECMWF (for ERA5 via https://apps.ecmwf.int/data-catalogues/era5/?class=ea, last access: 15 April 2021, Hersbach et al., 2020; for ERA-Interim via https://apps.ecmwf.int/archive-catalogue/?class=ei, last access: 15 April 2021, Dee et al., 2011). The CLaMS model data used for this paper may be requested from the corresponding author (f.ploeger@fz-juelich.de)
FP carried out the CLaMS simulations and the respective analysis, with help from PK, and wrote the paper. MD, JUG, and GG downloaded and prepared the ERA5 reanalysis data, with advice from BL. EC contributed to the analysis of the model output. JCL and AE prepared and provided observational data. All authors contributed to finalizing the paper.
The authors declare that they have no conflict of interest.
This article is part of the special issue “The SPARC Reanalysis Intercomparison Project (S-RIP) (ACP/ESSD inter-journal SI)”. It is not associated with a conference.
We are particularly grateful to Nicole Thomas for programming support and help with setting up the CLaMS model simulations with the new ERA5 reanalysis. We further thank Rolf Müller for comments on an earlier version of the paper, the ECMWF for providing reanalysis data, and Simon Chabrillat and an anonymous reviewer for their comments on the submitted version of the paper. This study was funded by the Helmholtz Association (under grant no. VH-NG-1128; Helmholtz Young Investigators Group A–SPECi). Finally, we gratefully acknowledge the computing time for the CLaMS simulations which was granted on the JURECA supercomputer at the Jülich Supercomputing Centre (JSC) under the VSR project ID JICG11.
This research has been supported by the Helmholtz Association (grant no. VH-NG-1128; Helmholtz Young Investigators Group A–SPECi).
The article processing charges for this open-access publication were covered by the Forschungszentrum Jülich.
This paper was edited by Peter Haynes and reviewed by Simon Chabrillat and one anonymous referee.
Abalos, M., Legras, B., Ploeger, F., , and Randel, W. J.: Evaluating the advective Brewer-Dobson circulation in three reanalyses for the period 1979–2012, J. Geophys. Res., 120, 7534–7554, https://doi.org/10.1002/2015JD023182, 2015. a, b, c, d
Abalos, M., Shuckburgh, E., and Legras, B.: Interannual variability in effective diffusivity in the upper troposphere/lower stratosphere from reanalysis data, Q. J. Roy. Meteorol. Soc., 142, 1847–1861, https://doi.org/10.1002/qj.2779, 2017. a
Andrews, D. G., Holton, J. R., and Leovy, C. B.: Middle Atmosphere Dynamics, Academic Press, San Diego, USA, 1987. a, b
Birner, T. and Bönisch, H.: Residual circulation trajectories and transit times into the extratropical lowermost stratosphere, Atmos. Chem. Phys., 11, 817–827, https://doi.org/10.5194/acp-11-817-2011, 2011. a, b
Bönisch, H., Engel, A., Curtius, J., Birner, Th., and Hoor, P.: Quantifying transport into the lowermost stratosphere using simultaneous in-situ measurements of SF6 and CO2, Atmos. Chem. Phys., 9, 5905–5919, https://doi.org/10.5194/acp-9-5905-2009, 2009. a
Butchart, N.: The Brewer-Dobson circulation, Rev. Geophys., 52, 157–184, https://doi.org/10.1002/2013RG000448, 2014. a, b
Butchart, N., Cionni, I., Eyring, V., Shepherd, T., Waugh, D., Akiyoshi, H., Austin, J., Brühl, C., Chipperfield, M., Cordero, E., Dameris, M., Deckert, R., Dhomse, S., Frith, S., Garcia, R., Gettelman, A., Giorgetta, M., Kinnison, D., Li, F., Mancini, E., McLandress, C., Pawson, S., Pitari, G., Plummer, D., Rozanov, E., Sassi, F., Scinocca, J., Shibata, K., Steil, B., and Tian, W.: Chemistry-climate model simulations of 21st century stratospheric climate and circulation changes, J. Climate, 23, 5349–5374, https://doi.org/10.1175/2010JCLI3404.1, 2010. a
Calvo, N., Garcia, R. R., Randel, W. J., and Marsh, D.: Dynamical mechanism for the increase in tropical upwelling in the lowermost tropical stratosphere during warm ENSO events, J. Atmos. Sci., 67, 2331–2340, https://doi.org/10.1175/2010JAS3433.1, 2010. a
Chabrillat, S., Vigouroux, C., Christophe, Y., Engel, A., Errera, Q., Minganti, D., Monge-Sanz, B. M., Segers, A., and Mahieu, E.: Comparison of mean age of air in five reanalyses using the BASCOE transport model, Atmos. Chem. Phys., 18, 14715–14735, https://doi.org/10.5194/acp-18-14715-2018, 2018. a, b, c, d, e, f, g
Charlesworth, E. J., Dugstad, A.-K., Fritsch, F., Jöckel, P., and Plöger, F.: Impact of Lagrangian transport on lower-stratospheric transport timescales in a climate model, Atmos. Chem. Phys., 20, 15227–15245, https://doi.org/10.5194/acp-20-15227-2020, 2020. a
Dee, D. P., Uppala, S. M., Simmons, A. J., Berrisford, P., Poli, P., Kobayashi, S., Andrae, U., Balmaseda, M. A., Balsamo, G., Bauer, P., Bechtold, P., Beljaars, A. C. M., van de Berg, L., Bidlot, J., Bormann, N., Delsol, C., Dragani, R., Fuentes, M., Geer, A. J., Haimberger, L., Healy, S. B., Hersbach, H., Holm, E. V., Isaksen, L., Kallberg, P., Koehler, M., Matricardi, M., McNally, A. P., Monge-Sanz, B. M., Morcrette, J.-J., Park, B.-K., Peubey, C., de Rosnay, P., Tavolato, C., Thepaut, J.-N., and Vitart, F.: The ERA-Interim reanalysis: configuration and performance of the data assimilation system, Q. J. Roy. Meteorol. Soc., 137, 553–597, https://doi.org/10.1002/qj.828, 2011 (data available at: https://apps.ecmwf.int/archive-catalogue/?class=ei, last access: 15 April 2021). a, b, c
Diallo, M., Legras, B., and Chédin, A.: Age of stratospheric air in the ERA-Interim, Atmos. Chem. Phys., 12, 12133–12154, https://doi.org/10.5194/acp-12-12133-2012, 2012. a, b
Diallo, M., Ploeger, F., Konopka, P., Birner, T., Müller, R., Riese, M., Garny, H., Legras, B., Ray, E., Berthet, G., and Jegou, F.: Significant contributions of volcanic aerosols to decadal changes in the stratospheric circulation, Geophys. Res. Lett., 12, 10780–10791, 2017. a, b, c
Diallo, M., Ern, M., and Ploeger, F.: The advective Brewer–Dobson circulation in the ERA5 reanalysis: climatology, variability, and trends, Atmos. Chem. Phys., 21, 7515–7544, https://doi.org/10.5194/acp-21-7515-2021, 2021. a, b, c, d, e
Dietmüller, S., Garny, H., Plöger, F., Jöckel, P., and Cai, D.: Effects of mixing on resolved and unresolved scales on stratospheric age of air, Atmos. Chem. Phys., 17, 7703–7719, https://doi.org/10.5194/acp-17-7703-2017, 2017. a
Engel, A., Möbius, T., Bönisch, H., Schmidt, U., Heinz, R., Levin, I., Atlas, E., Aoki, S., Nakazawa, T., Sugawara, S., Moore, F., Hurst, D., Elkins, J., Schauffler, S., Andrews, A., and Boering, K.: Age of stratospheric air unchanged within uncertainties over the past 30 years, Nat. Geosci., 2, 28–31, https://doi.org/10.1038/ngeo388, 2009. a, b, c
Engel, A., Bönisch, H., Ullrich, M., Sitals, R., Membrive, O., Danis, F., and Crevoisier, C.: Mean age of stratospheric air derived from AirCore observations, Atmos. Chem. Phys., 17, 6825–6838, https://doi.org/10.5194/acp-17-6825-2017, 2017. a, b, c, d, e
Fritsch, F., Garny, H., Engel, A., Bönisch, H., and Eichinger, R.: Sensitivity of age of air trends to the derivation method for non-linear increasing inert SF6, Atmos. Chem. Phys., 20, 8709–8725, https://doi.org/10.5194/acp-20-8709-2020, 2020. a, b, c, d
Fujiwara, M., Wright, J. S., Manney, G. L., Gray, L. J., Anstey, J., Birner, T., Davis, S., Gerber, E. P., Harvey, V. L., Hegglin, M. I., Homeyer, C. R., Knox, J. A., Krüger, K., Lambert, A., Long, C. S., Martineau, P., Molod, A., Monge-Sanz, B. M., Santee, M. L., Tegtmeier, S., Chabrillat, S., Tan, D. G. H., Jackson, D. R., Polavarapu, S., Compo, G. P., Dragani, R., Ebisuzaki, W., Harada, Y., Kobayashi, C., McCarty, W., Onogi, K., Pawson, S., Simmons, A., Wargan, K., Whitaker, J. S., and Zou, C.-Z.: Introduction to the SPARC Reanalysis Intercomparison Project (S-RIP) and overview of the reanalysis systems, Atmos. Chem. Phys., 17, 1417–1452, https://doi.org/10.5194/acp-17-1417-2017, 2017. a
Garny, H., Birner, T., Bönisch, H., and Bunzel, F.: The effects of mixing on Age of Air, J. Geophys. Res., 119, 7015–7034, https://doi.org/10.1002/2013JD021417, 2014. a, b, c
Gelaro, R., McCarty, W., Suárez, M. J., Todling, R., Molod, A., Takacs, L., Randles, C. A., Darmenov, A., Bosilovich, M. G., Reichle, R., Wargan, K., Coy, L., Cullather, R., Draper, C., Akella, S., Buchard, V., Conaty, A., da Silva, A. M., Gu, W., Kim, G.-K., Koster, R., Lucchesi, R., Merkova, D., Nielsen, J. E., Partyka, G., Pawson, S., Putman, W., Rienecker, M., Schubert, S. D., Sienkiewicz, M., and Zhao, B.: The Modern-Era Retrospective Analysis for Research and Applications, Version 2 (MERRA-2), J. Climate, 30, 5419–5454, 2017. a
Haenel, F. J., Stiller, G. P., von Clarmann, T., Funke, B., Eckert, E., Glatthor, N., Grabowski, U., Kellmann, S., Kiefer, M., Linden, A., and Reddmann, T.: Reassessment of MIPAS age of air trends and variability, Atmos. Chem. Phys., 15, 13161–13176, https://doi.org/10.5194/acp-15-13161-2015, 2015. a
Hall, T. M. and Plumb, R. A.: Age as a diagnostic of stratospheric transport, J. Geophys. Res., 99, 1059–1070, 1994. a, b
Hauck, M., Fritsch, F., Garny, H., and Engel, A.: Deriving stratospheric age of air spectra using an idealized set of chemically active trace gases, Atmos. Chem. Phys., 19, 5269–5291, https://doi.org/10.5194/acp-19-5269-2019, 2019. a, b
Haynes, P. and Shuckburgh, E.: Effective diffusivity as a diagnostic of atmospheric transport, 1, Stratosphere, J. Geophys. Res., 105, 22777–22794, 2000. a
Haynes, P. H., Marks, C. J., McIntyre, M. E., Shepherd, T. G., and Shine, K. P.: On the “downward control” of extratropical diabatic circulations by eddy-induced mean zonal forces., J. Atmos. Sci., 48, 651–678, 1991. a
Hegglin, M. I. and Shepherd, T. G.: O3-N2O correlations from the Atmospheric Chemistry Experiment: Revisiting a diagnostic of transport and chemistry in the stratosphere, J. Geophys. Res., 112, D19301, https://doi.org/10.1029/2006JD008281, 2007. a
Hersbach, H., Bell, B., Berrisford, P., Hirahara, S., Horanyi, A., Munoz-Sabater, J., Nicolas, J., Peubey, C., Radu, R., Schepers, D., Simmons, A., Soci, C., Abdalla, S., Abellan, X., Balsamo, G., Bechtold, P., Biavati, G., Bidlot, J., Bonavita, M., De Chiara, G., Dahlgren, P., Dee, D., Diamantakis, M., Dragani, R., Flemming, J., Forbes, R., Fuentes, M., Geer, A., Haimberger, L., Healy, S., Hogan, R. J., Hólm, E., Janiskova, M., Keeley, S., Laloyaux, P., Lopez, P., Lupu, C., Radnoti, G., de Rosnay, P., Rozum, I., Vamborg, F., Villaume, S., and Thepaut, J.-N.: The ERA5 global reanalysis, Q. J. Roy. Meteorol. Soc., 146, 1999–2049, https://doi.org/10.1002/qj.3803, 2020 (data available at: https://apps.ecmwf.int/data-catalogues/era5/?class=ea, last access: 15 April 2021). a, b, c, d
Holton, J. R., Haynes, P., McIntyre, M. E., Douglass, A. R., Rood, R. B., and Pfister, L.: Stratosphere-troposphere exchange, Rev. Geophys., 33, 403–439, 1995. a
Kobayashi, S., Ota, Y., Harada, Y., Ebita, A., Moriya, M., Onoda, H., Onogi, K., Kamahori, H., Kobayashi, C., Endo, H., Miyaoka, K., and Takahashi, K.: The JRA–55 Reanalysis: General specifications and basic characteristics, J. Meteorol. Soc. Jpn., 93, 5–48, 2015. a
Konopka, P., Steinhorst, H.-M., Grooß, J.-U., Günther, G., Müller, R., Elkins, J. W., Jost, H.-J., Richard, E., Schmidt, U., Toon, G., and McKenna, D. S.: Mixing and Ozone Loss in the 1999–2000 Arctic Vortex: Simulations with the 3-dimensional Chemical Lagrangian Model of the Stratosphere (CLaMS), J. Geophys. Res., 109, D02315, https://doi.org/10.1029/2003JD003792, 2004. a
Konopka, P., Grooß, J.-U., Günther, G., Ploeger, F., Pommrich, R., Müller, R., and Livesey, N.: Annual cycle of ozone at and above the tropical tropopause: observations versus simulations with the Chemical Lagrangian Model of the Stratosphere (CLaMS), Atmos. Chem. Phys., 10, 121–132, https://doi.org/10.5194/acp-10-121-2010, 2010. a
Konopka, P., Ploeger, F., Tao, M., and Riese, M.: Zonally resolved impact of ENSO on the stratospheric circulation and water vapor entry values, J. Geophys. Res., 121, 11486–11501, https://doi.org/10.1002/2015JD024698, 2016. a
Laube, J. C., Elvidge, E. C. L., Adcock, K. E., Baier, B., Brenninkmeijer, C. A. M., Chen, H., Droste, E. S., Grooß, J.-U., Heikkinen, P., Hind, A. J., Kivi, R., Lojko, A., Montzka, S. A., Oram, D. E., Randall, S., Röckmann, T., Sturges, W. T., Sweeney, C., Thomas, M., Tuffnell, E., and Ploeger, F.: Investigating stratospheric changes between 2009 and 2018 with halogenated trace gas data from aircraft, AirCores, and a global model focusing on CFC-11, Atmos. Chem. Phys., 20, 9771–9782, https://doi.org/10.5194/acp-20-9771-2020, 2020. a, b, c
Leedham Elvidge, E., Bönisch, H., Brenninkmeijer, C. A. M., Engel, A., Fraser, P. J., Gallacher, E., Langenfelds, R., Mühle, J., Oram, D. E., Ray, E. A., Ridley, A. R., Röckmann, T., Sturges, W. T., Weiss, R. F., and Laube, J. C.: Evaluation of stratospheric age of air from CF4, C2F6, C3F8, CHF3, HFC-125, HFC-227ea and SF6; implications for the calculations of halocarbon lifetimes, fractional release factors and ozone depletion potentials, Atmos. Chem. Phys., 18, 3369–3385, https://doi.org/10.5194/acp-18-3369-2018, 2018. a
Li, D., Vogel, B., Müller, R., Bian, J., Günther, G., Ploeger, F., Li, Q., Zhang, J., Bai, Z., Vömel, H., and Riese, M.: Dehydration and low ozone in the tropopause layer over the Asian monsoon caused by tropical cyclones: Lagrangian transport calculations using ERA-Interim and ERA5 reanalysis data, Atmos. Chem. Phys., 20, 4133–4152, https://doi.org/10.5194/acp-20-4133-2020, 2020. a
Li, F., Waugh, D. W., Douglass, A. R., Newman, P. A., Pawson, S., Stolarski, R. S., Strahan, S. E., and Nielsen, J. E.: Seasonal variations in stratospheric age spectra in GEOSCCM, J. Geophys. Res., 117, D05134, https://doi.org/10.1029/2011JD016877, 2012. a, b, c, d
Lin, P. and Fu, Q.: Changes in various branches of the Brewer-Dobson circulation from an ensemble of chemistry climate models, J. Geophys. Res., 118, 73–84, https://doi.org/10.1029/2012JD018813, 2013. a
Mahowald, N. M., Plumb, R. A., Rasch, P. J., del Corral, J., and Sassi, F.: Stratospheric transport in a three-dimensional isentropic coordinate model, J. Geophys. Res., 107, 4254, https://doi.org/10.1029/2001JD001313, 2002. a
McKenna, D. S., Konopka, P., Grooß, J.-U., Günther, G., Müller, R., Spang, R., Offermann, D., and Orsolini, Y.: A new Chemical Lagrangian Model of the Stratosphere (CLaMS): 1. Formulation of advection and mixing, J. Geophys. Res., 107, 4309, https://doi.org/10.1029/2000JD000114, 2002. a, b
Minganti, D., Chabrillat, S., Christophe, Y., Errera, Q., Abalos, M., Prignon, M., Kinnison, D. E., and Mahieu, E.: Climatological impact of the Brewer–Dobson circulation on the N2O budget in WACCM, a chemical reanalysis and a CTM driven by four dynamical reanalyses, Atmos. Chem. Phys., 20, 12609–12631, https://doi.org/10.5194/acp-20-12609-2020, 2020. a
Miyazaki, K., Iwasaki, T., Kawatani, Y., Kobayashi, C., Sugawara, S., and Hegglin, M. I.: Inter-comparison of stratospheric mean-meridional circulation and eddy mixing among six reanalysis data sets, Atmos. Chem. Phys., 16, 6131–6152, https://doi.org/10.5194/acp-16-6131-2016, 2016. a, b
Monge-Sanz, B. M., Chipperfield, M. P., Dee, D. P., Simmons, A. J., and Uppala, S. M.: Improvements in the stratospheric transport achieved by a chemistry transport model with ECMWF (re)analyses: identifying effects and remaining challenges, Q. J. Roy. Meteorol. Soc., 139, 654–673, 2012. a
Neu, J. L. and Plumb, R. A.: Age of air in a “leaky pipe” model of stratospheric transport, J. Geophys. Res., 104, 243–255, https://doi.org/10.1029/1999JD900251, 1999. a
Ploeger, F. and Birner, T.: Seasonal and inter-annual variability of lower stratospheric age of air spectra, Atmos. Chem. Phys., 16, 10195–10213, https://doi.org/10.5194/acp-16-10195-2016, 2016. a, b, c
Ploeger, F., Konopka, P., Günther, G., Grooß, J.-U., and Müller, R.: Impact of the vertical velocity scheme on modeling transport across the tropical tropopause layer, J. Geophys. Res., 115, D03301, https://doi.org/10.1029/2009JD012023, 2010. a
Ploeger, F., Konopka, P., Müller, R., Fueglistaler, S., Schmidt, T., Manners, J. C., Grooß, J.-U., Günther, G., Forster, P. M., and Riese, M.: Horizontal transport affecting trace gas seasonality in the Tropical Tropopause Layer (TTL), J. Geophys. Res., 117, D09303, https://doi.org/10.1029/2011JD017267, 2012. a
Ploeger, F., Legras, B., Charlesworth, E., Yan, X., Diallo, M., Konopka, P., Birner, T., Tao, M., Engel, A., and Riese, M.: How robust are stratospheric age of air trends from different reanalyses?, Atmos. Chem. Phys., 19, 6085–6105, https://doi.org/10.5194/acp-19-6085-2019, 2019. a, b, c, d, e, f, g, h, i, j, k, l, m
Plumb, R. A.: Stratospheric transport, J. Meteorol. Soc. Jpn., 80, 793–809, 2002. a
Pommrich, R., Müller, R., Grooß, J.-U., Konopka, P., Ploeger, F., Vogel, B., Tao, M., Hoppe, C. M., Günther, G., Spelten, N., Hoffmann, L., Pumphrey, H.-C., Viciani, S., D'Amato, F., Volk, C. M., Hoor, P., Schlager, H., and Riese, M.: Tropical troposphere to stratosphere transport of carbon monoxide and long-lived trace species in the Chemical Lagrangian Model of the Stratosphere (CLaMS), Geosci. Model Dev., 7, 2895–2916, https://doi.org/10.5194/gmd-7-2895-2014, 2014. a
Ray, E. A., Moore, F. L., Elkins, J. W., Rosenlof, K. H., Laube, J., Röckmann, T., Marsh, D. R., and Andrews, A. E.: Quantification of the SF6 lifetime based on mesospheric loss measured in the stratospheric polar vortex, J. Geophys. Res., 122, 4626–4638, 2017. a
Reithmeier, C., Sausen, R., and Greve, V.: Invstigation lower stratospheric model ttransport: Lagrangian calculations of mean age and age spectra in the GCM ECHAM4, Clim. Dynam., 30, 225–238, 2007. a
Rosenlof, K. H.: Seasonal cycle of the residual mean meridional circulation in the stratosphere, J. Geophys. Res., 100, 5173–5191, 1995. a
Schoeberl, M. R., Dessler, A. E., and Wang, T.: Simulation of stratospheric water vapor and trends using three reanalyses, Atmos. Chem. Phys., 12, 6475–6487, https://doi.org/10.5194/acp-12-6475-2012, 2012. a
Simmons, A., Soci, C., Nicolas, J., Bell, B., Berrisford, P., Dragani, R., Flemming, J., Haimberger, L., Healy, S., Hersbach, H., Horanyi, A., Inness, A., Munoz-Sabater, J., Radu, R., and Schepers, D.: Global stratospheric temperature bias and other stratospheric aspects of ERA5 and ERA5.1, ECMWF Tech. Mem., https://doi.org/10.21957/rcxqfmg0, 2020. a
Stiller, G. P., von Clarmann, T., Haenel, F., Funke, B., Glatthor, N., Grabowski, U., Kellmann, S., Kiefer, M., Linden, A., Lossow, S., and López-Puertas, M.: Observed temporal evolution of global mean age of stratospheric air for the 2002 to 2010 period, Atmos. Chem. Phys., 12, 3311–3331, https://doi.org/10.5194/acp-12-3311-2012, 2012. a
Stiller, G. P., Fierli, F., Ploeger, F., Cagnazzo, C., Funke, B., Haenel, F. J., Reddmann, T., Riese, M., and von Clarmann, T.: Shift of subtropical transport barriers explains observed hemispheric asymmetry of decadal trends of age of air, Atmos. Chem. Phys., 17, 11177–11192, https://doi.org/10.5194/acp-17-11177-2017, 2017. a, b
Waugh, D. W.: The age of stratospheric air, Nat. Geosci., 2, 14–16, 2009. a
Waugh, D. W. and Hall, T. M.: Age of stratospheric air: Theory, observations, and models, Rev. Geophys., 40, 1–27, 2002. a, b, c, d
Wright, J. S., Sun, X., Konopka, P., Krüger, K., Legras, B., Molod, A. M., Tegtmeier, S., Zhang, G. J., and Zhao, X.: Differences in tropical high clouds among reanalyses: origins and radiative impacts, Atmos. Chem. Phys., 20, 8989–9030, https://doi.org/10.5194/acp-20-8989-2020, 2020. a
- Abstract
- Introduction
- Data and method
- Climatological view on the stratospheric circulation
- Circulation and age changes over (multi-)decadal timescales
- Comparison to trace gas observations
- Discussion
- Conclusions
- Data availability
- Author contributions
- Competing interests
- Special issue statement
- Acknowledgements
- Financial support
- Review statement
- References