the Creative Commons Attribution 4.0 License.
the Creative Commons Attribution 4.0 License.
 | 28 May 2021
Carbonaceous aerosol composition in air masses influenced by large-scale biomass burning: a case study in northwestern Vietnam
Dac-Loc Nguyen
Hendryk Czech
Simone M. Pieber
Jürgen Schnelle-Kreis
Martin Steinbacher
Jürgen Orasche
Stephan Henne
Olga B. Popovicheva
Gülcin Abbaszade
Guenter Engling
Nicolas Bukowiecki
Nhat-Anh Nguyen
Xuan-Anh Nguyen
Ralf Zimmermann
We investigated concentrations of organic carbon (OC), elemental carbon (EC), and a wide range of particle-bound organic compounds in daily sampled PM2.5 at the remote Pha Din (PDI) – Global Atmosphere Watch (GAW) monitoring station in northwestern Vietnam during an intense 3-week sampling campaign from 23 March to 12 April 2015. The site is known to receive trans-regional air masses during large-scale biomass burning (BB) episodes. BB is a globally widespread phenomenon and BB emission characterization is of high scientific and societal relevance. Emissions composition is influenced by multiple factors (e.g., fuel and thereby vegetation type, fuel moisture, fire temperature, available oxygen). Due to regional variations in these parameters, studies in different world regions are needed. OC composition provides valuable information regarding the health- and climate-relevant properties of PM2.5. Yet, OC composition studies from PDI are missing in the scientific literature to date. Therefore, we quantified 51 organic compounds simultaneously by in situ derivatization thermal desorption gas chromatography and time-of-flight mass spectrometry (IDTD-GC-TOFMS). Anhydrosugars, methoxyphenols, n-alkanes, fatty acids, polycyclic aromatic hydrocarbons, oxygenated polycyclic aromatic hydrocarbons, nitrophenols, and OC were used in a hierarchical cluster analysis highlighting distinctive patterns for periods under low, medium, and high BB influence. The highest particle phase concentration of the typical primary organic aerosol (POA) and possible secondary organic aerosol (SOA) constituents, especially nitrophenols, were found on 5 and 6 April. We linked the trace gas mixing ratios of methane (CH4), carbon dioxide (CO2), carbon monoxide (CO), and ozone (O3) to the statistical classification of BB events based on OA composition and found increased CO and O3 levels during medium and high BB influence. Likewise, a backward trajectory analysis indicates different source regions for the identified periods based on the OA clusters, with cleaner air masses arriving from the northeast, i.e., mainland China and the Yellow Sea. The more polluted periods are characterized by trajectories from the southwest, with more continental recirculation of the medium cluster and more westerly advection for the high cluster. These findings highlight that BB activities in northern Southeast Asia significantly enhance the regional organic aerosol loading and also affect the carbonaceous PM2.5 constituents and the trace gases in northwestern Vietnam. The presented analysis adds valuable data on the carbonaceous and chemical composition of PM2.5, in particular of OC, in a region of scarce data availability, and thus offers a reference dataset from Southeast Asian large-scale BB for future studies. Such a reference dataset may be useful for the evaluation of atmospheric transport simulation models, or for comparison with other world regions and BB types, such as Australian bush fires, African savannah fires, or tropical peatland fires.
- Article
(7673 KB) - Full-text XML
-
Supplement
(1854 KB) - BibTeX
- EndNote


Biomass burning (BB) is a globally widespread phenomenon, and emissions characterization is of high scientific and societal relevance. Fires release pollutants which are harmful for human and ecosystem health (Stott, 2000; Kanashova et al., 2018; Pardo et al., 2020; Ihantola et al., 2020) and alter the Earth's radiative balance (Che et al., 2021; Lu et al., 2015). Those fires, for instance, emit substantial amounts of carbon monoxide (CO), various volatile organic compounds (VOCs) of diverse chemical reactivity and level of harmfulness, and carbonaceous particulates such as elemental carbon (EC) and primary organic aerosol (POA) (Akagi et al., 2011; Aurell and Gullett, 2013; Popovicheva et al., 2017a). When the emissions are oxidized in the atmosphere, the primary constituents may also form secondary organic aerosol (SOA) and thus increase the organic aerosol (OA) loading further (Seinfeld and Pandis, 2016). Yet, the impact of various types of biomass burning on the global radiative forcing remains poorly constrained, especially in terms of the chemical composition of the emitted organic aerosol (OA) and its related light-absorbing properties (Martinsson et al., 2015; Zhong et al., 2014). Fire emissions composition is influenced by multiple factors (e.g., fuel and thereby vegetation type, fuel moisture, fire temperature, available oxygen). Due to regional variations in these parameters, studies in different world regions are needed.
The northern Southeast Asia region is well known for emission-intense and recurring wildfires and burning of after-harvest crop residue during the pre-monsoon season each February to April. Ambient aerosol concentrations and haze events typically peak during these periods and were previously found to be correlated with BB activity, which contributes considerably to the regional aerosol loadings (Streets et al., 2003; Carmichael et al., 2003; Gautam et al., 2013; Lee et al., 2016). Open BB plumes can be transported over long distances along with the prevailing westerly winds and may also influence the large-scale atmospheric circulation in northern Southeast Asia (Lin et al., 2013; Reid et al., 2013; Tsay et al., 2016). The widespread occurrence of episodic open BB emission in Southeast Asia results in the “river of smoke aerosols” from nearby source regions over northern Thailand–Laos–Vietnam and depicts the confluence of aerosol–cloud–radiation interactions prior to entering the receptor areas of Hong Kong, the southeastern Tibetan Plateau, or central Taiwan (Lin et al., 2013; Yen et al., 2013; Chan et al., 2003; Engling et al., 2017; Nguyen et al., 2016; Lee et al., 2016). Yet, long-term monitoring on the one hand and detailed chemical characterization of the atmosphere's gaseous and particulates constituents on the other hand are scarce in northern Southeast Asia. The availability of reliable scientific data and information on the chemical composition of the atmosphere is crucial for a sound assessment of air pollution sources and air quality impacts. To get full coverage such data must be consistent, of adequate quality, and available from various locations worldwide. Filling data gaps in data-scarce areas is thus a top priority.
The Pha Din Global Atmosphere Watch (GAW) regional monitoring station, PDI, is located in the north of mainland Southeast Asia. Continuous observations of aerosol optical properties and greenhouse gases (GHGs) have been implemented at PDI since early 2014, and aerosol optical properties have been previously presented by Bukowiecki et al. (2019). PDI was found to be well suited to study the recurrent large-scale fires on mainland Southeast Asia, whose pollution plumes are frequently transported towards the site. However, the source apportionment by Bukowicki et al. (2019) was only based on light-absorbing carbon and levoglucosan concentrations without investigation of other chemical species. Generally, so far, very few studies (Nguyen et al., 2016; Popovicheva et al., 2016, 2017b; Pham et al., 2019) analyzed the organic chemical composition of aerosol samples collected in northwestern Vietnam during BB events. We complement the analysis by Bukowiecki et al. (2019) and present results from the chemical analysis of PM2.5 samples (atmospheric fine particulate matter with aerodynamic diameter ≤ 2.5 µm) and trace gas measurements collected during large-scale BB in 2015 at PDI. We discuss the daily variations of bulk carbonaceous components (OC, EC) and provide a detailed chemical analysis of organic aerosol (OA) constituents, including anhydrous sugars (AS), methoxyphenols, n-alkanes, fatty acids, polycyclic aromatic hydrocarbons (PAHs), oxygenated PAHs (o-PAHs), and nitrophenols and add valuable data to the available body of literature. This allows for comparison of the chemical composition of large-scale BB at PDI to other types of BB around the globe in future studies. We deploy a hierarchical clustering approach to the OA constituents for source and process identification and complement this analysis with interpretation of hourly trace gas data (methane (CH4), carbon dioxide (CO2), carbon monoxide (CO), and ozone (O3)) and backward trajectory analysis from atmospheric transport simulations.
2.1 Site description
Aside from the measurements, data were collected at the PDI site (1466 m a.s.l., 21.573∘ N, 103.516∘ E), a meteorological station of the Vietnam Meteorological and Hydrological Administration (VNMHA) and a regional station of the World Meteorological Organization's (WMO) Global Atmosphere Watch (GAW) program since 2014. Aside from instrumentation to collect meteorological data, the site is equipped with continuous in situ observations of aerosol optical properties and trace gases, as described in Bukowiecki et al. (2019). The station is located in Dien Bien Province, which is 360 km northwest of Hanoi, 200 km south of the border with China, and 120 km east of the border with Laos (Fig. 1). The province covers a vast area of 9541 km2, and the population is estimated to be approximately 567 000 inhabitants as of 2017 (http://www.gso.gov.vn/, last access: 21 May 2021). The observation site is located on the top of a hill about 1 km north of the Pha Din pass. In the vicinity of the station, the national highway AH13 connects Son La city (to the southeast) and Dien Bien Phu city (to the west). Within 5 km of the sampling site, there are only a few ethnic H'mong households using wood log and debris for residential cooking and heating. There are no industrial facilities in vicinity of the station.
2.2 Sampling campaign
An intense sampling campaign was conducted from 23 March to 12 April in 2015 to complement continuous on-line monitoring with more detailed information on the aerosol particle composition. PM2.5 samples were collected on 47 mm quartz-fiber filters (Whatman QM/A, Piscataway, NJ, USA) by MiniVol™TAS (Airmetrics, Eugene, OR, USA) samplers (sampling height of 2 m) with an operating flow rate at 5 L min−1 in the meteorological garden. The sampling duration was 24 h, starting from 08:00 local time (UTC+7), and a total of 20 filters were collected. Sampling was conducted continuously, except for 25 March, when a filter had to be discarded due to a battery failure.

Figure 1Maps showing PDI monitoring station, Dien Bien Province, Vietnam, in three different scales of 200, 50, and 2 km. The maps are retrieved from the © Google Terrain Map product.
2.3 Analysis of organic PM2.5 composition
Bulk analysis of organic PM2.5 constituents was performed with a thermal–optical carbon analyzer (DRI model 2001A) for the determination of organic carbon (OC) and elemental carbon (EC) following the Improve A protocol (Chow et al., 2004a) defining four fractions of OC (OC1–OC4) and three fractions of EC (EC1–EC3). Pyrolytic OC (OP) caused by char formation was subtracted from apparent EC1 by using the filter reflectance via a He–Ne laser at 632.8 nm.
The measurement uncertainty δy was calculated as following Eq. (1):
with LOD being the limit of detection.
For targeted chemical analysis, the in situ derivatization thermal desorption and gas chromatography time-of-flight mass spectrometry (IDTD-GC-TOFMS) with electron ionization (EI) was used (Orasche et al., 2011). In order to avoid thermal decomposition of analytes and lowering limits of detection, hydroxyl and carboxyl groups of compounds, for example of anhydrosugars, were derivatized by N-methyl-N-trimethylsilyltrifluoroacetamide (MSTFA) during the step of thermal desorption from quartz-fiber filters in glass goose-neck liner at 300 ∘C. Detected compounds were identified by library match of EI mass spectra as well as retention index and quantified by isotope-labeled internal standards of the same substance or chemically similar substance. In total, 51 particle-bound organic compounds were quantified, covering the substance classes of polycyclic aromatic hydrocarbons (PAHs), oxygenated PAHs (o-PAHs), n-alkanes, anhydrosugars (AS), high molecular weight (HMW) fatty acids (carboxylic acids with ≥ 20 carbon atoms), methoxyphenols, and nitrophenols.
2.4 Statistical data analysis
The temporal component of organic compound groups during the sampling campaign was investigated by a clustergram for visualization of sample and variable relations using MATLAB® (Version 2010b, The MathWorks, MA, USA) and its Bioinformatic Toolbox. The dendrograms, which were obtained from Ward's minimum variance algorithm and Euclidean distance applied on standardized (autoscaled) variables, illustrate the similarity of variables (i.e., chemical compound class) or observations (i.e., days). The associated heatmap displays how many standard deviations a data point is distant from the mean. None of the included classes dropped below the limit of quantification on any sampling day, so we do not expect inflation of noise from the standardization.
A dendrogram may not accurately represent the distance matrix, which is known as ultrametric tree inequality. The cophenetic correlation coefficient denotes a metric to assess how well a dendrogram fits the distances between considered pairs of objects and is be interpreted similarly to Pearson's correlation coefficient (Sokal and Rohlf, 1962).
2.5 Meteorological data and trace gas analysis
Records of the meteorological parameters including wind speed, wind direction, relative humidity (RH), and temperature (T) followed the guidelines of the Vietnamese National Technical Regulation on Meteorological Observations (MONRE, 2012). The records were produced manually 4 times a day at midnight, 06:00, noon and 18:00 UTC, corresponding to 07:00, 13:00, 19:00 and 01:00 local time. In addition, hourly averaged T and RH data were retrieved from ambient sensors at the main inlet for the aerosol and trace gas measurements. Precipitation was collected as daily bulk samples at the station. Carbon monoxide (CO), carbon dioxide (CO2), and methane (CH4) were measured with a cavity ring-down spectrometer (G2401; Picarro Inc., CA, USA); ozone was measured by UV absorption (Ozone Analyzer 49i; Thermo Scientific, CA, USA). The inlet height was 12 m above ground, roughly 6 m above the rooftop and about 200 m from the location of the MiniVol sampler, which is further detailed in Bukowiecki et al. (2019).
2.6 MODIS/TERRA fire image and backward trajectory observation using FLEXTRA
The interpretation of the aerosol composition analyses was supported by air mass back-trajectory analysis combined with BB locations as retrieved from the Moderate Resolution Imaging Spectroradiometers (MODIS) from the Terra and Aqua platform (MODIS Collection 6 Hotspot/Active Fire Detections MCD14DL). Backward trajectories (BWT) were computed with the FLEXTRA trajectory model driven by 3-hourly meteorological analysis fields ( resolution) of the operational Integrated Forecast System (IFS) of the European Center for Medium-range Weather Forecast (ECMWF) (Stohl, 1996; Stohl and Seibert, 1998). Trajectories were initialized every 4 h at different heights above the site and were followed backwards in time for 10 d within the global model domain. For the discussion, trajectories started at 420 m above ground were selected, an altitude roughly in the middle between real surface and smoothed model elevation. Fire counts were aggregated for different periods of the measurement campaign and displayed as the total number of fire counts per day on a grid covering the area of interest.
3.1 Meteorology description
Figure 2 shows the time series of meteorological observations at PDI during the sampling campaign. From 23 March to 12 April 2015, ambient temperature ranged from 12 to 27 ∘C and ambient relative humidity from 29 % and 100 % was observed. PDI only occasionally received precipitation, with rainfall at the beginning and end of the sampling period. In the middle of the sampling period, hot and dry weather dominated with the highest observed temperature and lowest RH. Furthermore, the local wind direction was mostly from the west–southwest during the dry period and southeast during the middle of the sampling period.
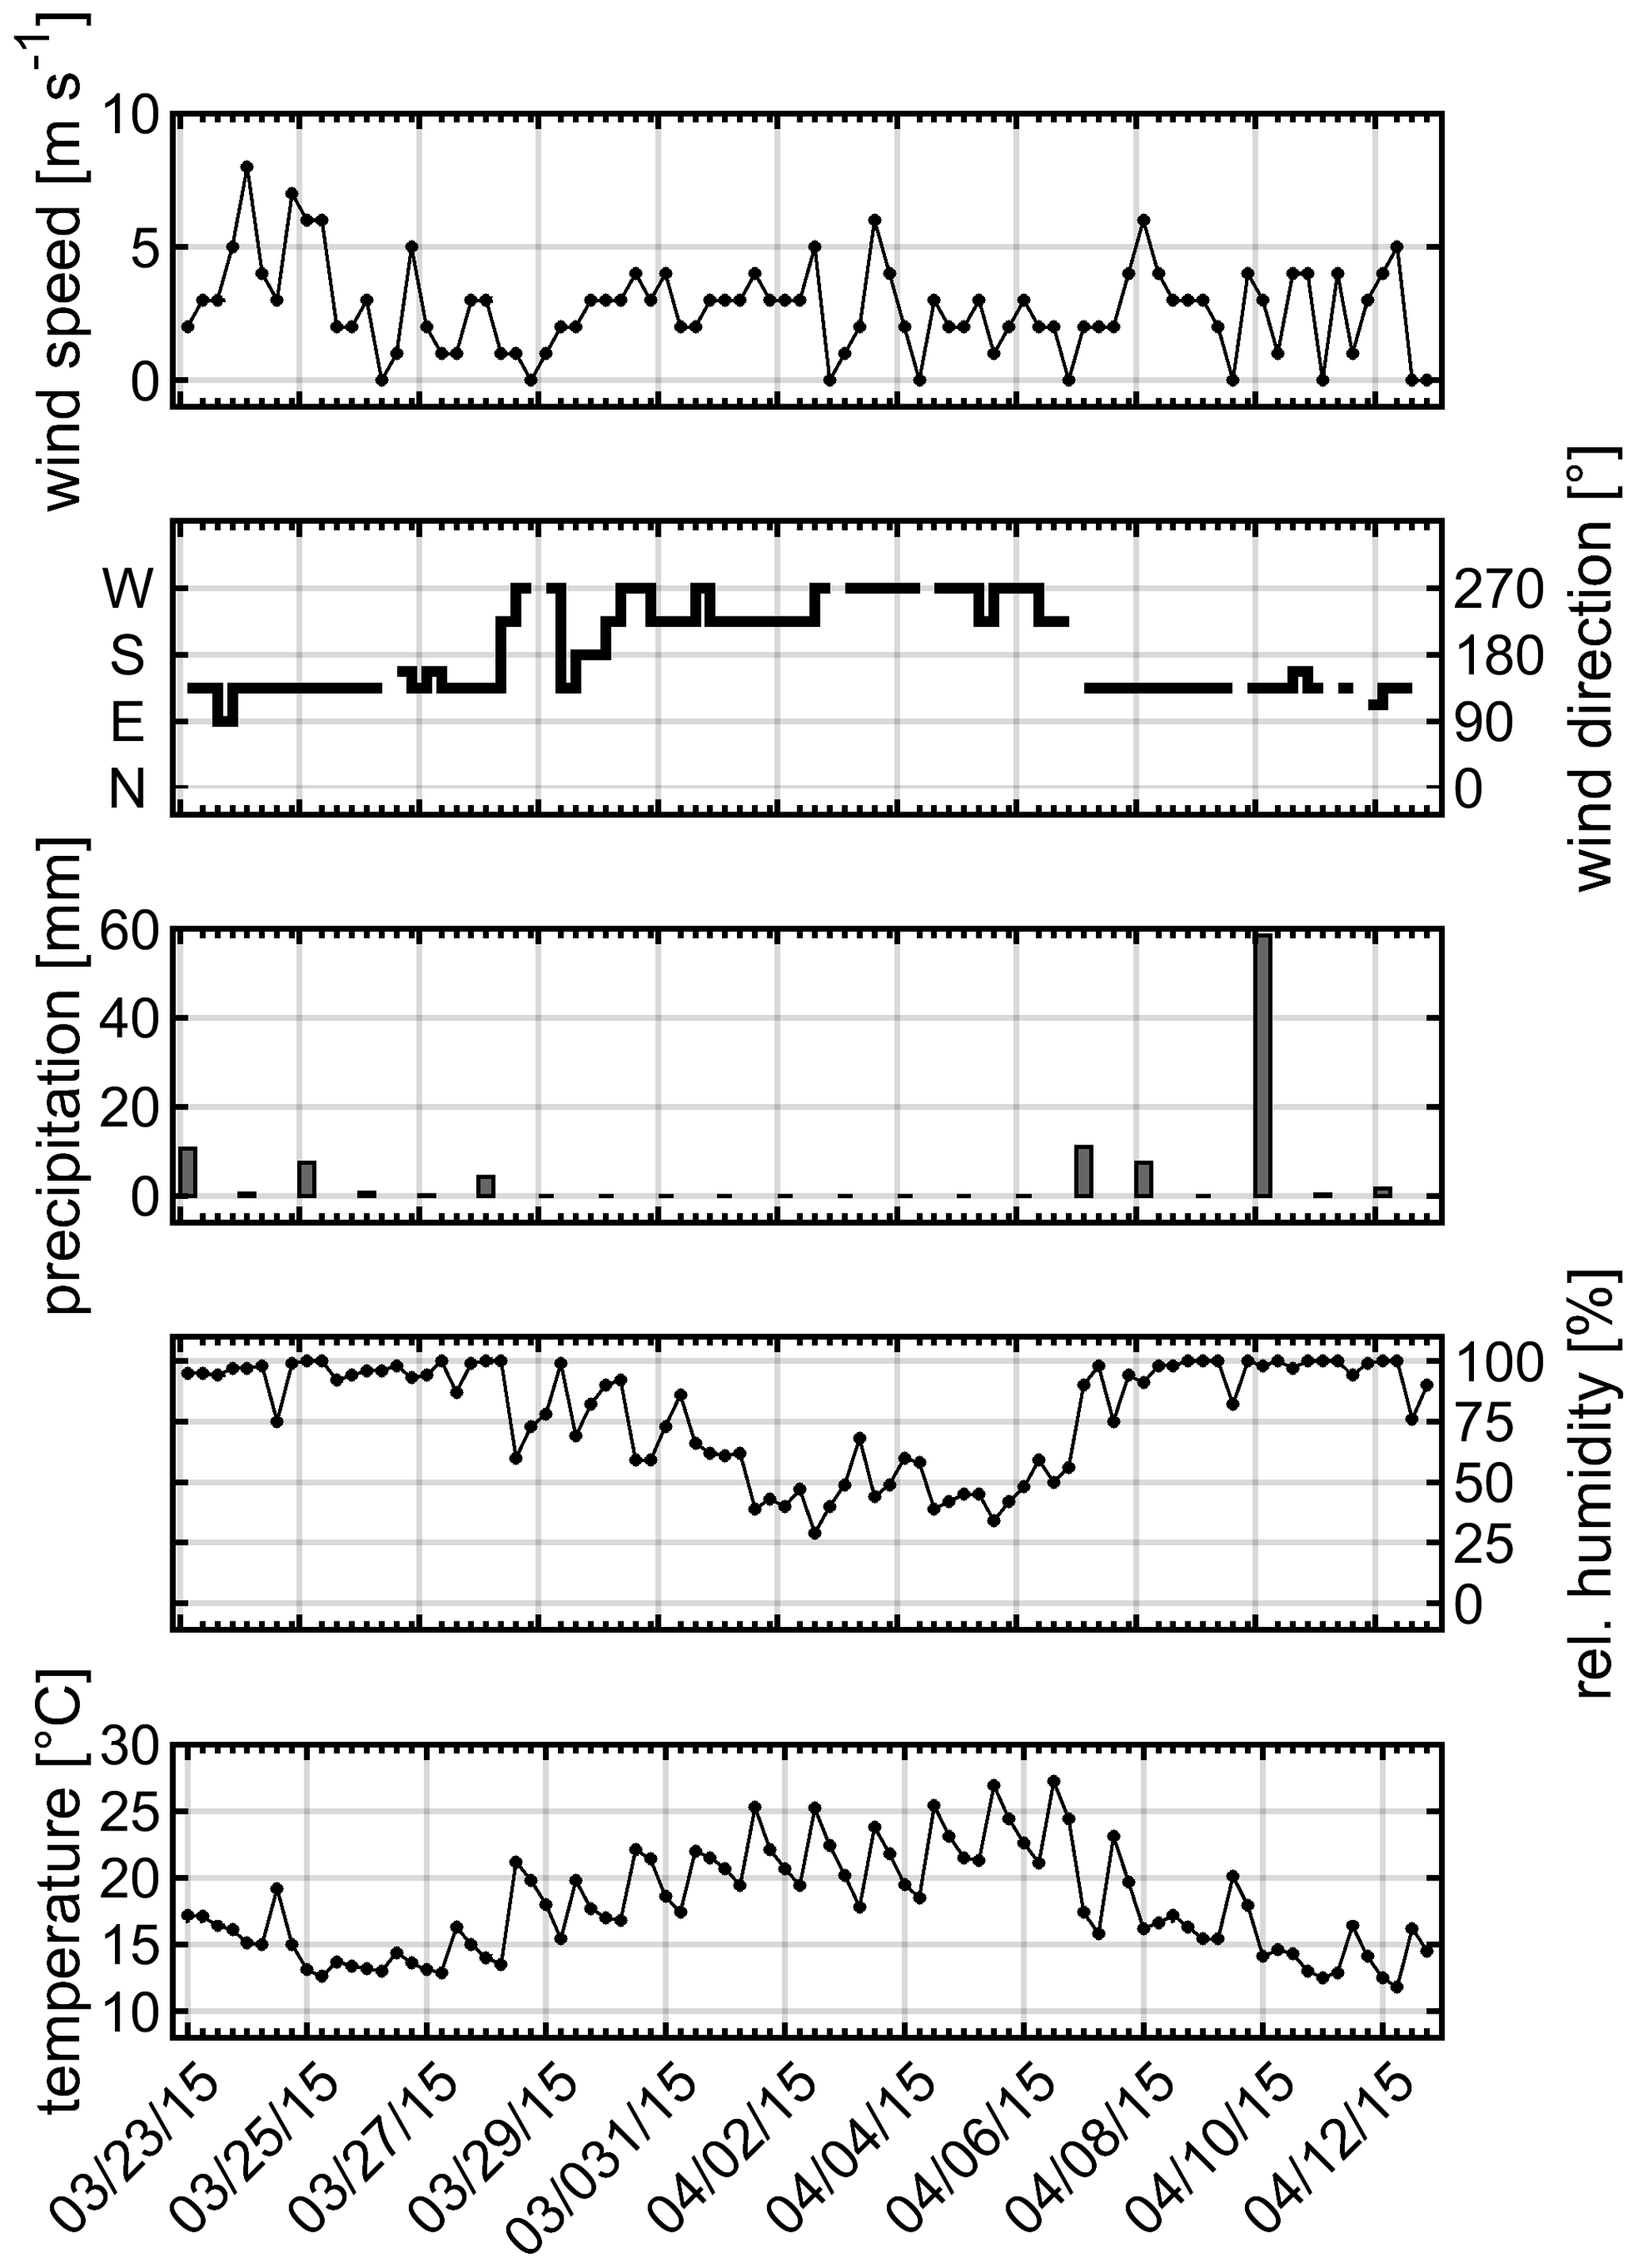
Figure 2Time series (local time) of observed meteorological conditions at PDI during the sampling campaign from 23 March to 12 April 2015.
3.2 PM2.5 bulk carbonaceous component and its organic compositions
3.2.1 Organic carbon (OC), elemental carbon (EC), and levoglucosan (LEV)
Figure 3a displays the temporal variations of organic carbon (OC), elemental carbon (EC), and levoglucosan concentrations determined in the daily aerosol particle samples. OC and EC concentrations span ranges of more than 1 order of magnitude from 1.8 to 38.3 µg m−3 (OC) and 0.13 to 17.8 µg m−3 (EC), respectively, which are comparable with those measured in the northern Southeast Asia region during the dry season, i.e., Son La, Vietnam, in 2012 and 2013 (OC: 1.0–40.6 µg m−3, EC: 0.0–7.1 µg m−3, Lee et al., 2016); Phimai, central Thailand, in 2006 (OC: 2.3–16.7 µg m−3, EC: 0.0–6.6 µg m−3, Li et al., 2013); Suthep Mountain, Chiang Mai, Thailand, in 2010 (OC: 5.1–26.8 µg m−3, EC: 1.6–10.4 µg m−3, Chuang et al., 2013); Doi An Khang, Thailand, in 2015 (OC: 20.0–75.6 µg m−3, EC: 3.1–11.1 µg m−3, Pani et al., 2019a). The highest concentrations of both OC and EC were observed on 5 and 6 April. The temporal trend of OC and EC correlated with the observed levoglucosan (LEV), which is known as a marker of BB (Simoneit et al., 1999), pointing towards the substantial influence of BB on the carbonaceous aerosol content. The data are also summarized in Table S1 as average concentrations of OC and EC together with further constituted organics and classes in Figs. S1 and S2.
The ratios of OC to EC have been widely used to derive information about emission sources (Chow et al., 2004b; Han et al., 2010). Ratios of about 5 were reported in the winter in Xi'an, China, which was attributed to coal combustion for residential heating and BB; on the other hand, low ratios about 1 were attributed to vehicle and traffic-related sources. BB-influenced aerosol OC-to-EC ratios were 4.8 in Phimai, Thailand (Li et al., 2013); ∼ 6 in Chiangmai, Thailand (Chuang et al., 2013; Pani et al., 2019a); and ∼ 6 in Son La, Vietnam (Lee et al., 2016). In our study, the ratio averaged at 4.8, which is comparable with BB-influenced aerosol in Southeast Asia. However, we emphasize that OC EC larger than unity only indicates the absence of efficient combustion as a dominant OC and EC source and does not permit a direct assignment to BB. We take two approaches to learn about the origin of the carbonaceous aerosol based on OC, EC, and LEV. Firstly, we link LEV to OC, and OC to EC, in order to derive primary OCBB and secondary OCsec. Secondly, we use char- and soot-EC to examine the sources of EC.
Simple OC source apportionment
Considering the ratios of LEV to OC, an estimation of the contribution of primary BB-derived OC (OCBB) to ambient OC can be made according to
LEV OC may vary considerably between different BB aerosol sources; hence an average value of 8.14 % has been used for (LEV OC)source (Wan et al., 2017). The results span an interquartile range from 35.7 % to 53.0 % with a median of 44.2 % and peak contribution on 3 April (Fig. 3b), showing that primary OCBB was the major source of OC during the sampling campaign and higher than 8.85 %–35.2 % during the pre-monsoon time in the Indo-Gangetic Plain (Wan et al., 2017). A second approach using OC data enables the amount of secondary OC (OCsec) to be estimated based on excess OC from the minimum ratio of OC to EC (OC EC)min (Turpin and Huntzicker, 1995), which was 2.15 and coincided with the highest OC concentrations on 6 April.
An interquartile range from 13.9 % to 50.0 % with a median of 22.1 % (Fig. 3b) was obtained, suggesting that atmospheric aging is also an important source of OC at PDI. However, on three days the sum of the relative contributions of OCsec and OCBB add up to more than 100 %. This might be a result of an underestimated (LEV OC)source and/or overestimated (OC EC)min. Moreover, the ratio of LEV to total carbon (TC) on 6 April accounted for 0.03. Within the range of LEV TC for various BB emissions compiled by Zhang et al. (2015), this result appears to be at the lower limit of softwood combustion and close to the burning of agricultural residues such as rice straw, which typical for this region.
Simple EC source apportionment
In our further analysis, we operationally defined char-EC as EC1apparent–OP and soot-EC as EC2 + EC3 according to Han et al. (2007) in order to examine the source of EC. At low concentrations of EC, soot-EC accounts for 50 % of EC species, whereas at high EC concentrations, the fraction of char-EC increases and becomes dominant (Fig. 3c). Soot-EC is considered to be more associated with motor vehicle emissions and char-EC with the combustion of solid fuels, such as biomass or coal (Han et al., 2010), indicating changing emission sources of EC and an association of high EC concentrations with solid fuel combustion during the sampling period. Furthermore, three distinct groups may be recognized from the EC species: (1) 12 d with less than 2.0 µg m−3 char-EC, (2) 6 d with char-EC between 2.0 µg m−3 and 7.0 µg m−3, and (3) 2 d with more than 7.0 µg m−3 char-EC. Since char-EC and levoglucosan are highly correlated (Pearson's r of 0.96), we derive that during the sampling campaign there were three periods with varying degrees of BB influence on PM2.5 composition.

Figure 3(a) Temporal variations of OC, EC, and levoglucosan (LEV) as BB markers in PM2.5 at PDI during the sampling campaign from 23 March to 12 April 2015. (b) Relative contributions of primary OC from BB (OCBB) and secondary organic carbon formation (OCsec). (c) Scatterplot of char-EC vs. soot-EC during the sampling campaign. Error bars represent measurement uncertainty calculated with formula (1) with precision and LOD of 10 % and 0.36 µg m−3 for char-EC and 5 % and 0.23 µg m−3 for soot-EC, respectively. Dashed lines indicate the ratio of char-EC to soot-EC.
3.3 Cluster analysis of organic aerosol composition
We grouped the data from chemical OA speciation into the classes PAH, o-PAH, anhydrous sugars (AS), methoxyphenols, nitrophenols, fatty acids, and n-alkanes and performed together with OC a hierarchical cluster analysis in order to examine if the broadly defined OA composition follows the same trend as OC, EC, and levoglucosan. A clustergram (Fig. 4) was used to illustrate days and classes related to organic particle constituents with similar composition and temporal behavior, respectively. A clustergram consists of a heatmap in the center with two dendrograms in horizontal and vertical position, generally illustrating similarities among variables and observations, respectively. The dendrogram of the upper part of the clustergram suggests three major time periods with distinctly different OA composition. Based on the previous section, we label the days “low BB influence”, “medium BB influence”, and “high BB influence”. The dendrogram on the left-hand side emphasizes which variables best represent the classification of the days and gives insights into why individual days stick out within one of the three major clusters. For both dendrograms in the clustergram, the cophenetic correlation coefficient is > 0.95, showing excellent representation of the pairwise distances within variables and within observation. It can be derived that the BB-related compound classes of methoxyphenols and anhydrosugars seem to originate from the same source and to a lesser extent fatty acids and alkanes. Since OC, PAHs, and o-PAH do not follow the same trend as the methoxyphenols and anhydrous sugars, we can expect significant contribution from other sources, such as traffic or, in the case of elevated levels of o-PAH and OC, atmospheric aging. In contrast, nitrophenols show a different temporal behavior, thus appearing on an isolated branch of the dendrogram. Considering the attribution of primary and both primary and secondary origin to all other compound classes, nitrophenols may be predominantly formed by atmospheric aging. Of all considered compound classes, nitrophenols on 5 April had the largest absolute distance of 4.1σ from the campaign mean, which may be a consequence of high concentrations of the primary BB-derived monoaromatic compounds and their transformation into nitrophenols during few days and nights of aging (e.g., as described in Wang et al., 2020). We keep the classification of the sampling days by the clustergram for further discussion of the data in the following sections.
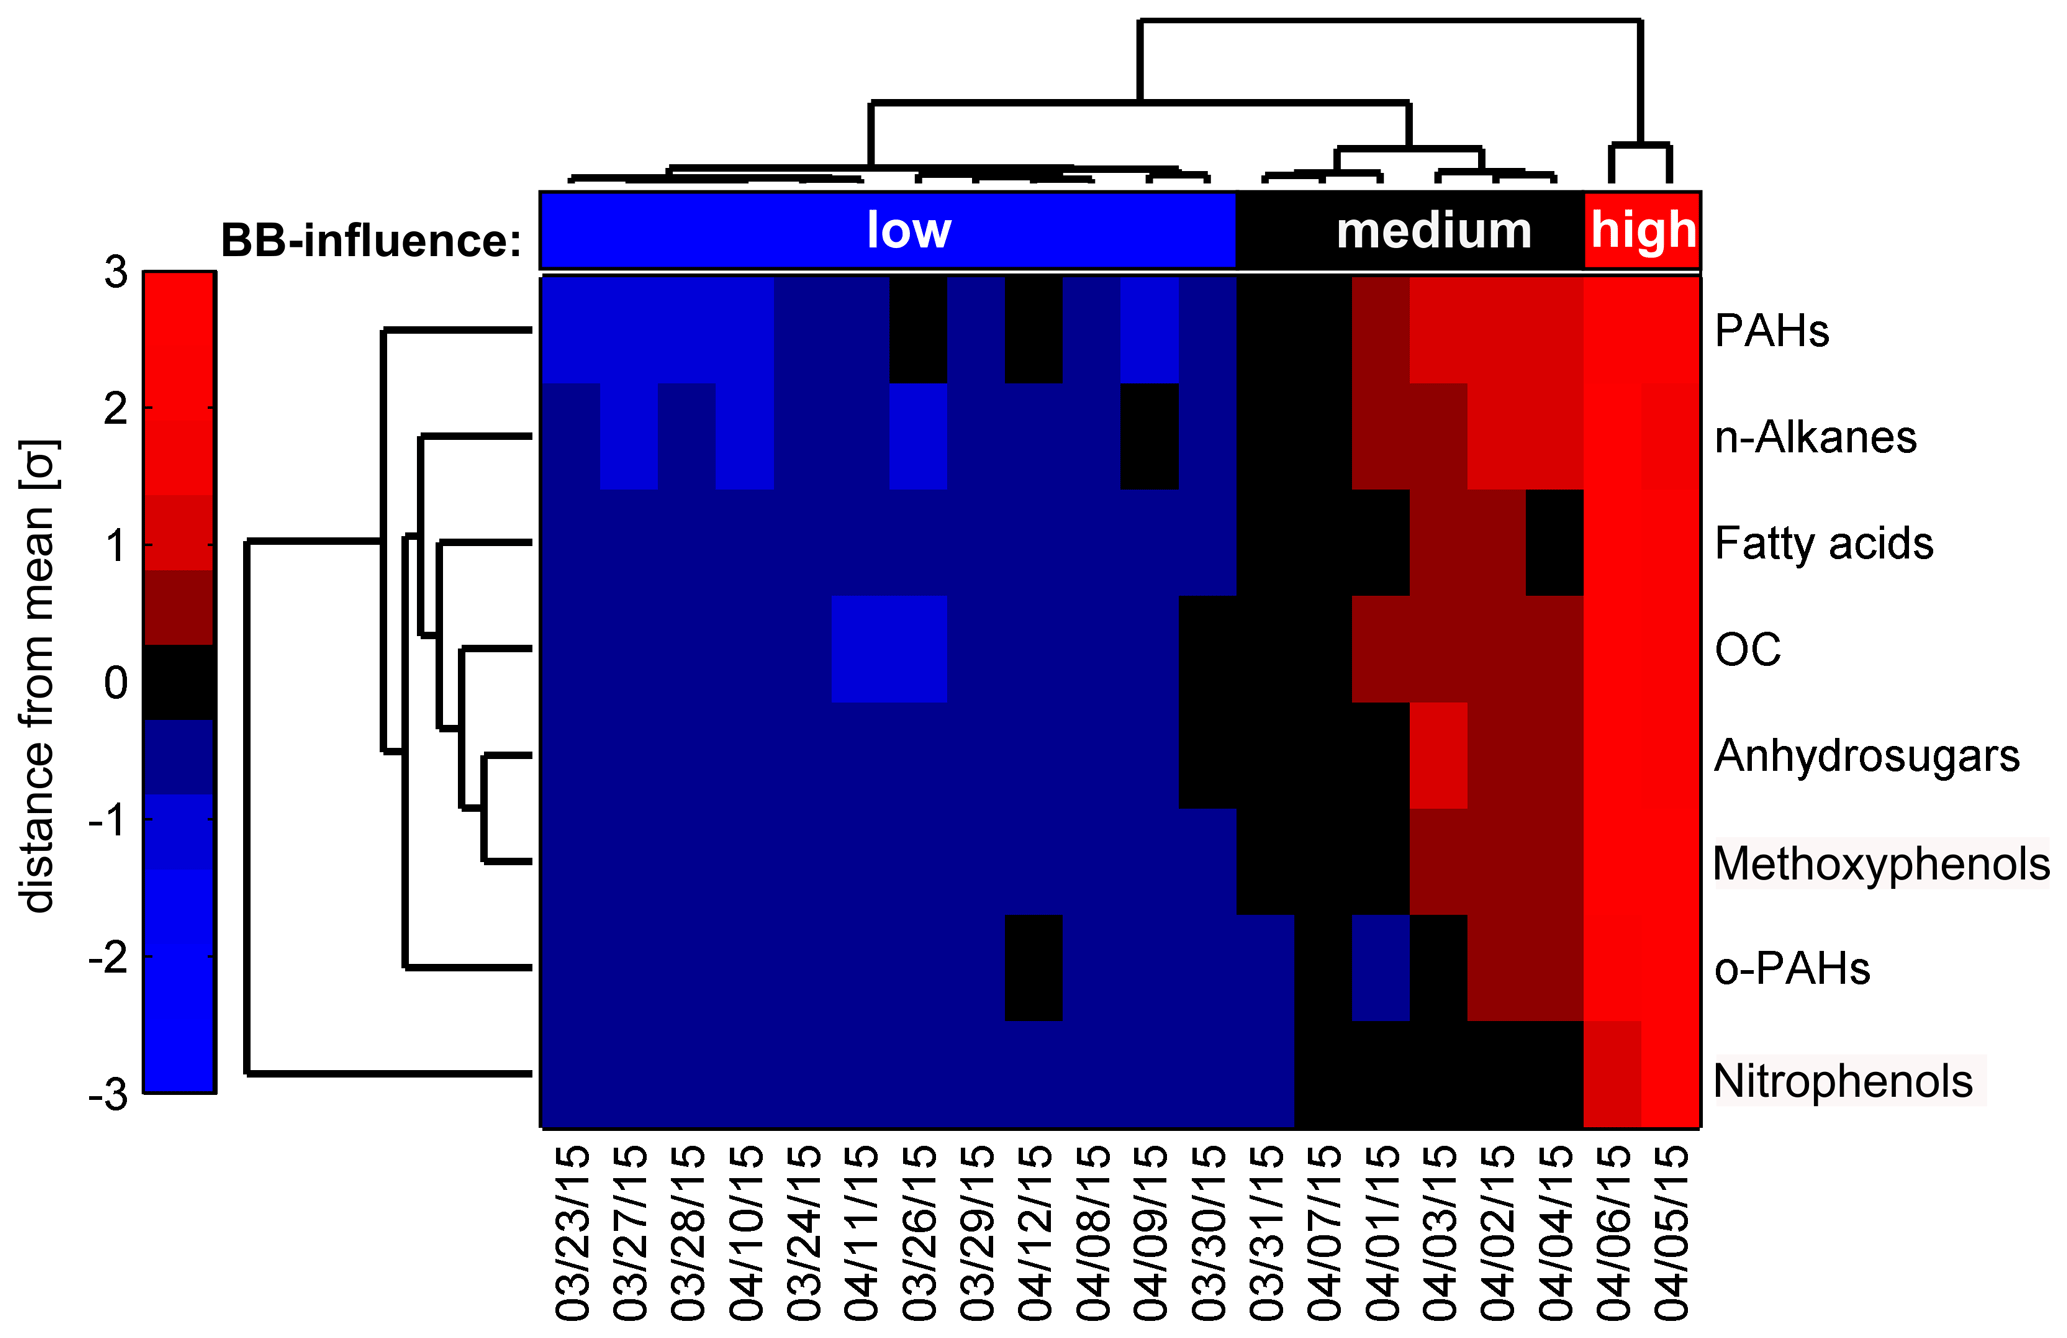
Figure 4Clustergram based on organic composition of PM2.5 sampled at PDI during the sampling campaign from 23 March to 12 April 2015. Dendrograms indicating organic compounds and OC can be seen at the top and sampling-day clustering on the left of the diagram. The color bar on the left indicates the shades associated with values in the cells and denotes the distance to the mean in multiples of the standard deviation σ: dark to bright blue denotes the lower values, dark to bright red the higher values, and black refers to values closest to the mean.
3.3.1 Molecular composition of aerosol constituents
In this section, molecular constituents of OA and their possible origins are discussed compound-class-wise and presented in Fig. 5. Additional information is provided in Figs. S1–S9 in the Supplement. In total, the speciated OA constituents account for up to 4 % of OC.
Anhydrosugars
Anhydrosugars, including levoglucosan (LEV), mannosan (MAN), and galactosan (GAL), produced by pyrolysis of cellulose and hemicellulose, are universal markers for BB (Simoneit and Elias, 2001). In the samples collected at PDI, LEV is the most abundant organic compound of the speciated OC (23–1710 ng m−3, 0.22 %–2.5 % of OC). LEV abundance increases with increasing OC concentrations, indicating a significant impact of BB at the receptor site. Ratios of LEV to MAN (LEV MAN) may give an indication of the type of biomass that was burned. However, due to very high LEV amounts on the PDI filter samples, broad peaks in IDTD-GCMS analysis partially overlapped with MAN and GAL. This leads to high uncertainty of the quantitative results for the latter components. However, LEV and MAN quantities were also determined through additional HPLC-based measurements on parallel samples as detailed in Bukowiecki et al. (2019). The quantities are reported in Table S2. During the 2 d with high BB influence, we obtain a ratio of LEV MAN of 16.7 and 18.1, and for medium BB-influenced days LEV MAN ranges from 9.2 to 18.3, whereas days with low BB influence have LEV MAN between 1 and 7.5. Sang et al. (2013) compiled LEV MAN for several types of biomass burning with evidence for low LEV MAN (4.0 ± 1.0) for softwood, medium LEV MAN (21.5 ± 8.3) for hardwood, and high LEV MAN (32.6 ± 19.1) for crop residue burning; the latter category may be expanded to plants with a low level of lignification, including Gramineae. Hence, it appears that softwood burning is the dominant BB source during days of low BB influence, whereas PM2.5 collected during days of medium and high BB influence must have contributions from the combustion of hardwood and/or plants with low level of lignification. Additional determination of the stable isotopes in AS might allow a more specific identification of the BB source, such as woody biomass or crop residues (Sang et al., 2012).
Methoxyphenols
Methoxyphenols are products from the pyrolysis of biomass containing lignin, a constituent of all vascular plants present mostly between cellular structures and cell walls, and admit differentiation between angiosperms, gymnosperms, and Gramineae (Simoneit, 2002). Vanillin and vanillic acid are markers for conifers (gymnosperm), whereas syringaldehyde and syringic acid are released from the combustion of angiosperms (and also found minor amounts in gymnosperm smoke.), and m-/p-hydroxybenzoic acid and acetosyringone are characteristic for Gramineae (referring to grasses and non-woody vegetation).
During the sampling period at PDI, m- and p-hydroxybenzoic acid and acetosyringone appeared in the range of 0.8–247 and 0.1–49.0 ng m−3, respectively, which may be linked to agricultural residue burning practices in northern Southeast Asia. Syringaldehyde and syringic acid were in the range of 0.0–40.2 and 0.1–47.9 ng m−3, respectively, whereas vanillin and vanillic acid were found in lower quantities (0.2–11.8 and 0.1–49.1 ng m−3). During the days of low BB influence, gymnosperm-related methoxyphenols of the vanillyl-type showed higher relative abundance values than during the other two periods, which agrees well with low observed values for LEV MAN. Vice versa, days of medium and high BB influence had a larger share of syringyl type methoxyphenols and hydroxybenzoic acids, but with ambiguous temporal trends. The ratio of syringic acid (SYAH) to vanillic acid (VAH) has been proposed as a diagnostic ratio to distinguish between different types of BB with 0.01 to 0.2 for gymnosperm burning and 0.1 to 2.44 for woody and non-woody angiosperm burning (Myers-Pigg et al., 2016). Across the entire sampling period, we observed 0.3 < SYAH VAH < 1.7 (Fig. S3), giving evidence for angiosperm burning being dominant. The peak of SYAH VAH appeared on 4 April, which still belongs to the period of medium BB influence, right before transition to high BB influence. Taking LEV MAN and high concentrations of hydroxybenzoic acids into consideration, hard wood burning and in particular burning of non-woody grasses such as in agricultural residue burning may be the main types of BB observed at PDI.
Atmospheric aging alters the composition of primary BB plumes. It may therefore also affect diagnostic ratios. However, a change in the contributions of different types of BB may also have a similar effect. Myers-Pigg et al. (2016) reported the ratio of syringic acid (SYAH) to syringaldehyde (SYA) as a useful metric to estimate the freshness, i.e., degree of atmospheric aging, of a BB plume. During days with medium and high BB influence, SYAH SYA did not drop below 0.81 and revealed highest values of 2.75 and 3.44 on 5 and 6 April, respectively, indicating rather fresh plumes and low influence of atmospheric aging (Fig. S4).
High molecular weight (HMW) n-alkanes (C20 : C33)
The daily summed concentrations of targeted n-alkanes ranged from 7.2 to 262 ng m−3 during the sampling period at PDI. The concentrations were in the range from 7.2 to 45 ng m−3 within days of low BB influence and concentrations up to 262 ng m−3 for days with high BB influence. We calculated the carbon preference index (CPI) from the relation of n-alkanes with odd and even carbon number and determined the most abundant n-alkane for each day (Cmax). Originally, the CPI for higher plant wax was calculated using n-alkanes from C21 to C34 (Simoneit, 1989). However, because of missing data for C34, we modified the CPI for this study by including n-alkanes from C21 to C32 to CPI21–32.
Generally speaking, the main source of n-alkanes is epicuticular plant growth showing a strong dominance of odd-numbered carbon chain lengths with a maximum concentration (Cmax) at C29 and C31. Another possible source of n-alkanes are vehicle emissions with a maximum abundance at C25 for gasoline and C20 for heavy duty within the range of C19 to C32 (Simoneit, 1986). Emissions from the combustion of fossil fuels have typically a CPI of about 1, while emissions of biogenic origin (e.g., plant abrasion, emissions from biomass combustion) often have a CPI of > 2 (Simoneit and Mazurek, 1982).
CPI values for days with low BB influence ranged from 0.95 to 1.6, which indicated a significant contribution of fossil carbon sources (Cohen et al., 2010) to the organic matter despite the remote location of the sampling station, but with the lowest concentrations of n-alkanes measured during the sampling period at PDI. On the other hand, CPI values for days with medium and high BB influence were from 1.5 to 2.8, inferring together with Cmax of 29 the input from biogenic sources and suspension of debris from BB (Fig. S4).
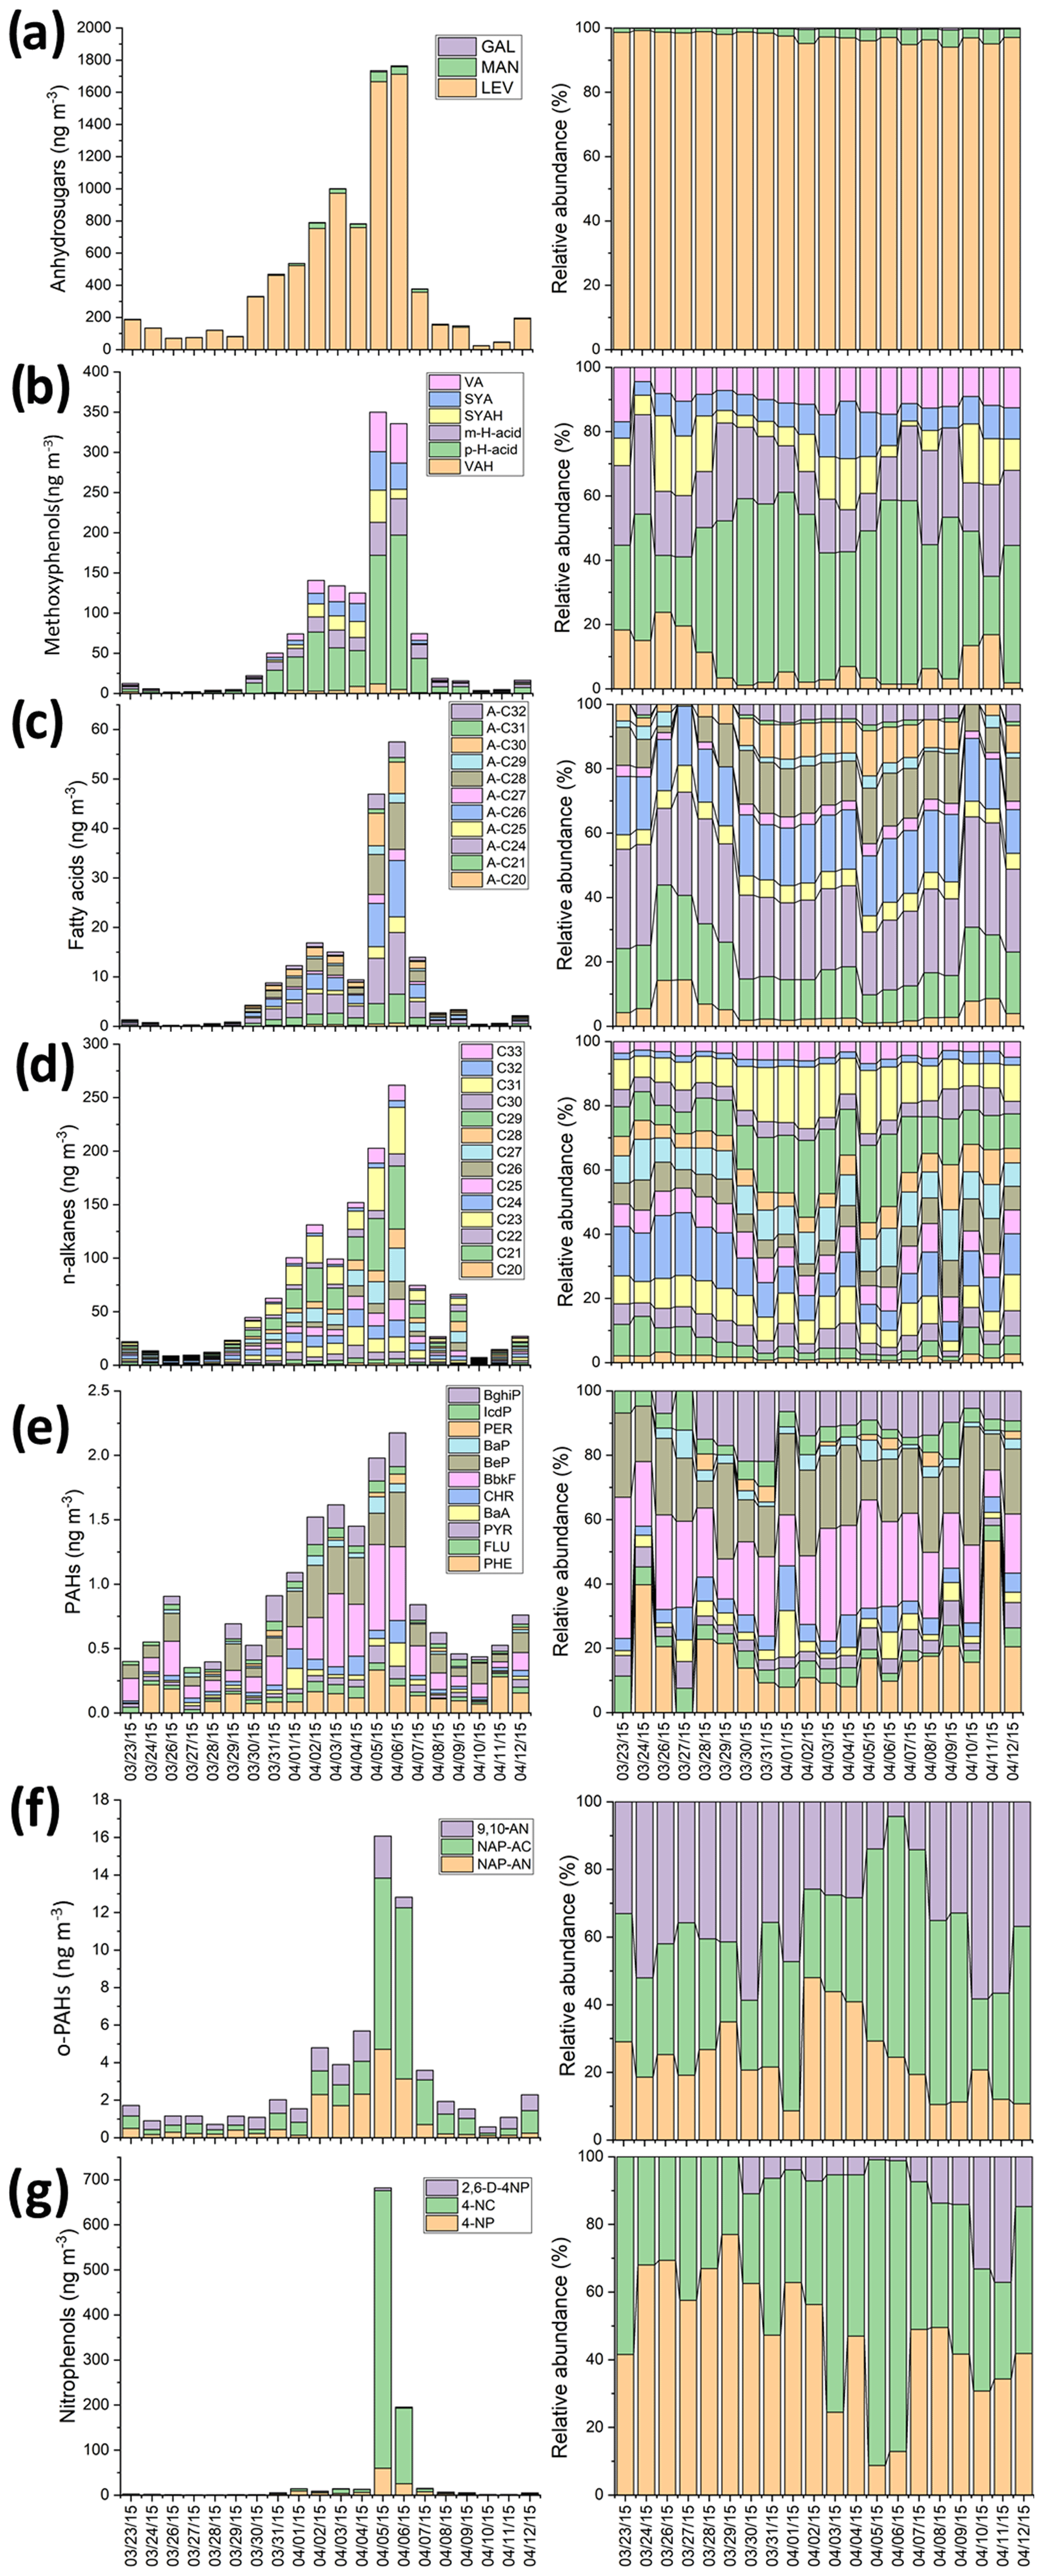
Figure 5Time series of organic constituents in daily aerosol particle samples (n=21) at PDI during the sampling campaign from 23 March to 12 April 2015. (a) Anhydrosugars, (b) methoxyphenols, (c) HMW fatty acids, (d) n-alkanes, (e) PAHs, (f) o-PAHs, (g) nitrophenols. The left column provides mass concentrations (ng m−3) and the right column provides relative mass fractions within the compound class.
High molecular weight (HMW) fatty acids (C20 : C32)
HMW fatty acids are known to be released from terrestrial higher plant waxes, but also from different kinds of BB, cooking, and vehicular emissions (Ren et al., 2020). In general, during BB events, lipid-related compounds that are originally present as leaf waxes can be emitted to the air together with smoke particles via volatilization and recondensation onto particulate matter without oxidative degradation. Enhancement of HMW fatty acid concentration is reported to coincide with levoglucosan and HMW n-alkanes during intensive wheat straw burning periods in Mt. Tai, northern China, and Nanjing, eastern China (Wang et al., 2009; Fu et al., 2012). The daily summed concentrations of HMW fatty acids at PDI ranged from 0.2–57.5 ng m−3 during the sampling period, in which the low range (0.2–3.4 ng m−3) of concentration took place at the beginning and at the end of sampling period, belonging to low-BB days. HMW fatty acids with even carbon number showed higher concentrations than the ones with odd carbon number and a fairly stable ratio of 5 to 7, pointing toward domination of biogenic or BB origin. Most of the individual HMW fatty acids at PDI were below the limit of quantification for more than 50 % of the days, so temporal trends are only examined for their total concentration. A linear trend could be observed for total HMW fatty acid vs. total AS concentrations for days with low and medium BB influence. However, the extrapolation of the linear fit from Deming regression to days of high BB influence would underestimate the observed HMW fatty acid concentrations (Fig. S5), suggesting a different combustion source or additional source such as possibly the atmospheric oxidation of n-alkanes or n-alkenes.
PAHs
A total of 11 PAHs, which are known as markers for incomplete combustion, were quantified from the samples collected at PDI: phenanthrene (PHE), fluoranthene (FLU), pyrene (PYR), benz[a]anthracene (BaA), chrysene (CHR), sum of benzo[b]fluoranthene and benzo[k]fluoranthene (BbkF), benz[e]pyrene (BeP), benz[a]pyrene (BaP), perylene (PER), indeno[1,2,3-cd]pyrene (IcdP), and benzo[ghi]perylene (BghiP). The total concentrations of detected PAHs cover the range of 0.35–2.17 and 0.26–1.95 ng m−3 without considering PHE, respectively, which is sensitive to sampling conditions because of its volatility. Among the targeted PAHs, PER showed the lowest average concentration (range: 0.00–0.07 ng m−3), while the BbkF showed the highest average concentration (range: 0.04–0.67 ng m−3). All individual PAHs reached their highest concentrations during 5 and 6 April with high suspected influence of BB (Fig. 5).
Comparing total PAH concentrations in the vicinity of the study area, the resolved PAHs were of a much lower concentration than those found in the BacGiang and HaNam, rural sites in the north of Vietnam (80–2200 and 170–800 ng m−3 respectively) (Anh et al., 2019), but comparable with those found in Chiangmai, Thailand, in the dry season (0.3–6.8 ng m−3) (Chuesaard et al., 2013).
The ratio of some selected PAHs can be useful to roughly discriminate PAH sources. During the entire campaign, there was a noticeable influence of pyrogenic (combustion-derived) PAH to ambient PM2.5, indicated by the median diagnostic ratio of 0.62. However, the diagnostic ratios for combustion sources neither follow the trends of molecular markers for BB, such as levoglucosan or lignin monomers, nor show elevated values for the days of high BB influence (Fig. S6). In the diagnostic ratio BaP (BaP + BeP), the faster degradation of BaP in the atmosphere is exploited with values below 0.5 indicating degradation of the aerosol by photochemical aging (Tobiszewski and Namiesnik, 2012). However, the BaP (BaP + BeP) is unknown as a fresh emission and recent studies revealed that BaP (BaP + BeP) for residential heating (Miersch et al., 2019; Vicente et al., 2016) may fall below the threshold of 0.5. Apart from on three days, all BaP (BaP + BeP) were below 0.15, pointing towards substantial atmospheric aging. The maximum of 0.35 was observed on 5 April, which belongs to one of the two days of high BB influence (Fig. S6). This indicates a fairly nearby combustion source of PAH. However, other specific values of PAH diagnostic ratios for IcdP (IcdP + BghiP), BaA (BaA + CHR), and FLU (FLU + PYR) during the sampling period at PDI appear outside the range suggested for vegetation fires or wood burning (Galarneau, 2008; Tobiszewski and Namiesnik, 2012) on any day. For example, during the entire campaign at PDI the diagnostic ratio IcdP (IcdP + BghiP) constantly appears below the value of 0.5 although values exceeding 0.5 are suggested as an indicator of grass, coal, and wood combustion. Consequently, it did not lead to further evidence for BB as the dominant aerosol source, which agrees with the relatively large distance of total PAHs to BB markers such as anhydrous sugars and methoxyphenols in the clustergram (Fig. 4). However, there is a clear trend between total four-ring to seven-ring PAHs and AS with a Pearson correlation coefficient of 0.941. Moreover, slopes and intercepts obtained from Deming regression either for days of low and medium BB influence only or over the entire sampling period at PDI are not significantly different at a significance level of 5 %, indicating that PAH concentrations are predominantly associated with BB (Fig. S7).
This disagreement between source apportionment by PAH diagnostic ratios and other molecular markers used in this study may have several causes. First, there is a considerable variation of PAH in combustion emissions which might be used for a limited number of PAH sources, combustion conditions, or fuel properties. Secondly, as exploited in BaP (BaP + BeP), individual PAHs of proposed diagnostic ratios may have different rate constants towards atmospheric oxidants, so even major primary emission sources can be less ambiguously identified. Furthermore, major differences in PAH patterns at PDI arise from semi-volatile three- and four-ring PAH PHE, FLU, and PYR, which may be caused by dynamic gas-particle partitioning. Katsoyiannis et al. (2011) demonstrated that using PAH diagnostic ratios from emissions at a site close to a highway were classified as originating from non-traffic sources. The classification of the days during the sampling period at PDI rather corresponds to the total concentrations of PAH, which were found to be significantly different at a significance level of 5 % between low-, medium-, and high-BB periods using a one-way analysis of variance (ANOVA) with Bonferroni post hoc correction. Altogether, PAH diagnostic ratios seem to be less specific than other molecular markers discussed for BB and do not increase the knowledge about the sources and processes relevant for the PM2.5 composition at PDI during the sampling period.
Oxygenated PAH (o-PAHs)
Three o-PAHs have been quantified in the samples from PDI: 9,10-anthracenedione (9,10-AN), 1,8-naphthalic anhydride (NAP-AN), and naphthoic acid (NAP-AC). o-PAHs are associated with incomplete gasoline, diesel, coal, or wood combustion as well as with the secondary formation from PAH precursors (Walgraeve et al., 2010). The total concentrations of the three o-PAHs varied between 0.19 and 5.36 ng m−3, peaking during the days of high BB influence on 5 and 6 April. Among the o-PAHs, 9,10-AN showed the lowest average concentration (0.75 ng m−3), while NAP-AC showed the highest average concentration (1.62 ng m−3). It seems that 9,10-AN is less associated with the observed BB plume due to its relatively low concentration range and distinctly lower relative contribution to total o-PAH concentrations during days of high BB influence. At the beginning of the medium-BB period, NAP-AN had its highest relative abundance during the sampling campaign and declined on the following days while NAP-AC steadily increased, which moderately correlates with the ambient temperature (Fig. 2). In the aqueous phase, NAP-AN may be rapidly hydrolyzed to NAP-AC depending on the temperature and pH (Barros et al., 2001). Therefore, we used the sum of NAP-AN and NAP-AC for source apportionment at PDI.
For the days of low and medium BB influence, we found a Pearson correlation coefficient of 0.8 between the sum of NAP-AN and NAP-AC and AS, indicating predominantly primary origin. However, the expected concentrations of NAP-AN and NAP-AC from a linear fit by Deming regression accounts for only 50 % of the observed concentrations (Fig. S8). Hence, NAP-AN and NAP-AC on days with high BB influence either originate from a combustion source with different biomass and/or combustion conditions, or to a similar extent from a common BB and another source such as secondary formation. In contrast to NAP-AN/-AC, 9,10-AN showed a linear correlation to AS over the entire sampling period with the exception of 6 April and is thus predominantly of origin from primary BB. Considering the peaking OC on 6 April and often higher reactivity of o-PAHs compared to their structural PAH analogues (Ringuet et al., 2012), lower concentrations of 9,10-ANT in the concentration range of days with low-BB influence might be a consequence of a lower influence of atmospheric aging compared to plumes arriving at PDI on 5 April.
Nitrophenols
Nitrophenols may generally originate from various primary sources, e.g., traffic, coal and biomass combustion, herbicide, and pesticide usage, but are also formed by reactions of monoaromatic compounds with nitrate radicals (NO3) or hydroxyl (OH) radicals in the presence of NOx (Harrison et al., 2005; Li et al., 2016; Kahnt et al., 2013). In particular, nitrocatechols refer to an important subclass of nitrophenols which belong to the group of UV-light-absorbing species called brown carbon (brC) and are known to affect the radiative balance and climate of Earth (Laskin et al., 2015). In a study done during wintertime in Dentling, UK, it was revealed that five nitrophenolic compounds (nitrophenol, methylnitrophenol, nitrocatechol, methylnitrocatechol, and dinitrophenol) accounted for (4 ± 2) % of the total UV absorption at 370 nm (Mohr et al., 2013) and, as constituents of semi-volatile brC, may be partly responsible for enhanced light absorption of black carbon (BC) through coating and the associated lensing effect (Liu et al., 2015).
In the samples from PDI, the compounds 4-nitrophenol (4-NP) and 4-nitrocatechol (4-NC) account for 0.4–60.0 ng m−3 and 0.2–616.0 ng m−3, respectively. Peak concentrations coincided with enhanced LEV abundance on 5 and 6 April and reached enhancement factors up to 10 (4-NP) and 600 (4-NC) compared to other low- and medium-BB-influenced days during the sampling campaign. The quantities of 4-NP in our study was lower than that of a haze episode in Shanghai (range 150–770 ng m−3), but much higher than in a 1-year study in Belgium (range 0.32–1.03 ng m−3). In contrast, 4-NC in our study was higher than that in Shanghai (22–154 ng m−3) and in Belgium (0.49–9.0 ng m−3) (Li et al., 2016; Kahnt et al., 2013).
Individual nitrophenols in ambient air have been recently attributed to their predominant sources in a rural site in China, assigning NP to predominantly BB and NC to predominantly secondary formation (Salvador et al., 2021). We examined the relation of individual nitrophenols at PDI to AS, which are strongly associated with BB (Fig. S9). For days of low and medium BB influence, we obtained moderate correlations for all nitrophenols with AS. However, on days with high BB influence the ratio of each individual nitrophenol to AS was higher than on days with low and medium BB influence many times over. Hence, nitrophenols have a different source on days of high BB influence, which might be a combustion source with different biomass, combustion conditions, or atmospheric aging. However, higher concentrations of 4-NC point towards formation by atmospheric aging as NC was found to originate to a greater extent from this source than BB (Salvador et al., 2021). Regarding 4-NP, it has been found that concentrations of 4-NP in wood combustion emissions aged in an oxidation flow reactor have a maximum after short aging of approximately 1–2 equivalent days because of the high reactivity of NP and NC towards OH radicals and photolysis (Hartikainen et al., 2020). Despite similar concentrations of AS on both days with high BB influence, the concentrations of 4-NP, 4-NC, and 2,6-D-4-NP on 5 April were 2.4-fold, 3.7-fold, and 2.7-fold higher than on 6 April. Additionally, the BB plume on 5 April arrived at PDI in the early morning, as indicated by lowest modified combustion efficiency (MCE) values (available on 1 h time resolution) during the campaign (see Sect. 3.4. and Fig. S10). It has been reported that the formation of 4-NC from catechol proceeds approximately 3 times faster during the night than during daytime (Finewax et al., 2018). Therefore, a possible explanation of elevated nitrophenol concentrations in the high-BB episode on 5 April might be associated with BB plumes that aged overnight before arriving at PDI. On 6 April, however, atmospheric aging might have been of less importance for nitrophenol concentrations at PDI, which agrees with the lowest ratio of OC EC and associated estimated contribution of OCsec to ambient OC (Sect. 3.2.1).
3.4 Trace gas observations and implications
Figure 6 shows the time series of hourly averaged CO, O3, CO2, and CH4 mixing ratios during the sampling campaign at PDI. The temporal evolution of these records also indicates the different conditions that were observed during the campaign.
CO mixing ratios were in the range of 220–600 ppb at the beginning and the end of the sampling campaign but increased slowly from 31 March before reaching up to 1270 ppb on 5 April. As shown by Bukowiecki et al. (2019), since the beginning of the monitoring in 2014, each year from February to May CO levels at PDI are systematically enhanced and do not represent background mixing ratios as expected to be observed at a pristine sampling site. The latter is the case from June to September when CO mixing ratios below 100 ppb are observed. The enhancement in spring can be explained by the large-scale BB in Southeast Asia (Lin et al., 2013) and particularly all over mainland Southeast Asia in spring (Yen et al., 2013), which leads to high emissions of CO (Shi and Yamaguchi, 2014; Lelieveld et al., 2001). The observed variability and the additional increase by more than 800 ppb of CO during specific days of the 2015 intensive campaign at PDI confirms the hypothesis of advection of more regional BB events (Kondo et al., 2004; Pochanart et al., 2003).
After rainfall on 7 April, CO dropped back to the range observed before but still did not reach typical values for the unpolluted boundary layer. Also, O3 shows a similar pattern to CO: mixing ratios had rather small variability in the beginning of the campaign before they increased to up to 90 ppb, followed by a sharp drop to only 4 ppb. CO2 and CH4 also show increases in their mixing ratios on 5 and 6 April, but with less variability. However, unlike CO and O3, the mixing ratios of CO2 and CH4 also remained elevated after the days of high BB influence and the following rainfall likely due to the northeasterly advection of other anthropogenic emission sources (see trajectory analysis of Sect. 3.5.).
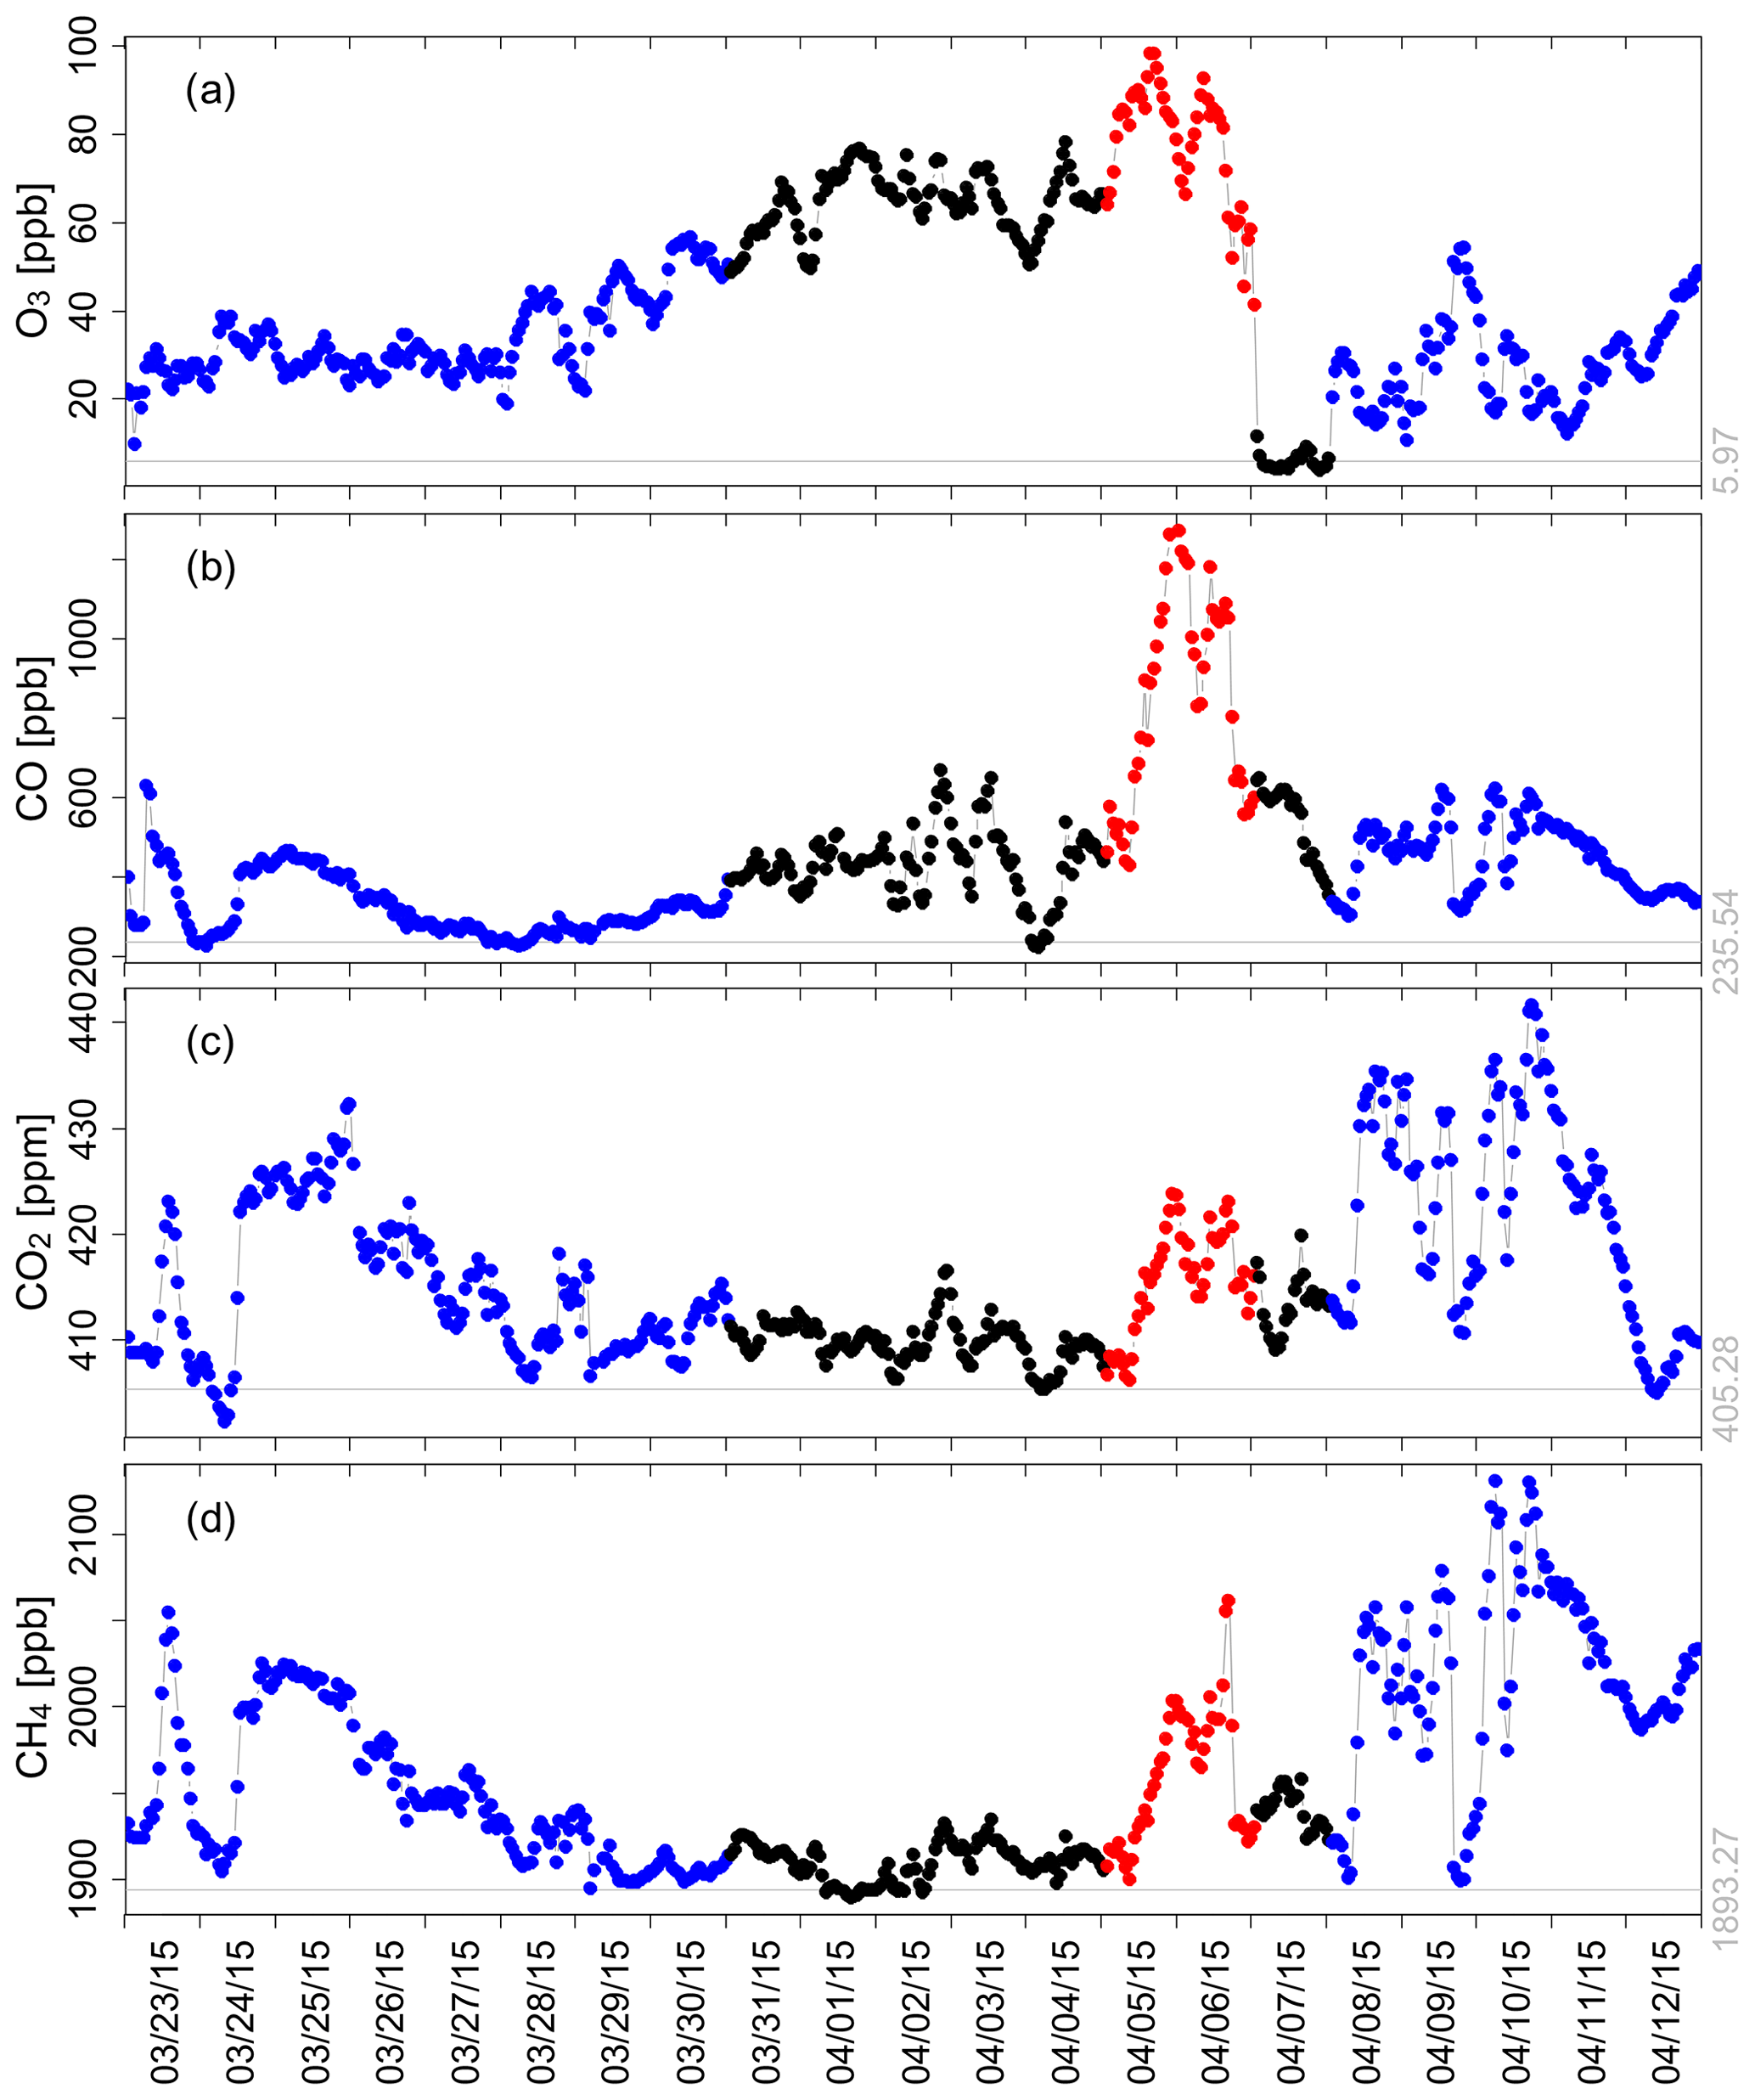
Figure 6Time series of hourly (a) ozone (O3), (b) carbon monoxide (CO), (c) carbon dioxide (CO2), and (d) methane (CH4) at PDI during the sampling campaign from 23 March to 12 April 2015. Three colors (green, black, and red) follow the clustergram from the statistical approach discussed in Sect. 3.2.2. Gray lines in the plots indicate the background values, calculated as the mean of the lowest 5 % of the dataset during the campaign.
Scatterplots of hourly averaged trace gases indicate different relationships between these gases during the sampling campaign (Fig. 7). The correlation between CO vs. CH4 reveals two apparent branches: the upper (in red) was observed on 5 and 6 April when BB influence was high, the lower (in green) at the beginning and the end of the campaign. The distinction of the different BB influence regimes is best seen in the scatter plots with CO, which reflects the large contribution of BB to the atmospheric CO burden, especially during the days of high BB influence. Therefore, the gas trace observations confirm the classification of the sampling days based on the chemical composition of PM2.5 in the clustergram.
Time series of CO2, CH4, and CO, being all predominantly emitted by primary sources, show different trends than O3, which is mainly of secondary origin, highly reactive, and also subject to deposition and removal. Therefore, the excess ratio, utilizing a primary and secondary combustion gas, is a commonly used proxy to investigate the age of BB plumes (Jaffe and Wigder, 2012) and to characterize O3 production in smoke plumes. In general, usually increases with increasing plume age of the BB plume due to net O3 production (Parrington et al., 2013; Akagi et al., 2011; Jaffe and Wigder, 2012). ΔO3 and ΔCO were calculated by subtracting the “baseline” during the campaign which was determined as the average of the lowermost 5 % of the data during the campaign (see the gray lines in Fig. 6). However, reported values for the ratio in aged plumes do not show a consistent pattern (between 0.1 and 0.9, Fig. S10) for some plumes associated with tropical fires (Andreae et al., 1994; Mauzerall et al., 1998) and boreal fires (Honrath et al., 2004; Bertschi and Jaffe, 2005) and are as low as 0.1 in aged plumes from Southeast Asian studies (Kondo et al., 2004), as ozone formation also depends on the availability of nitrogen oxides and volatile organic compounds. To account for BB influence, we linked ratios with levoglucosan during the sampling campaign. During days with low BB influence, levoglucosan concentrations were in the range of 20–400 ng m−3 and the ratio increased from 0.05 to 0.8 (Fig. S10), indicating other source contributions for O3 production, i.e., photochemical conversion of biogenic VOC emissions (Nguyen et al., 2016). During days with medium BB influence, levoglucosan levels increased up to 1000 ng m−3, and the excess ratio decreased slightly while being more variable. On 5 and 6 April with high BB influence, LEV concentrations reached up to 1.6 µg m−3 and the excess ratio dropped below 0.1, especially on 6 April, suggesting that the arriving BB plume was rather fresh. Right after the high-BB plume event, does not allow unambiguous interpretation because O3 leveled off close to the background. The last part of the campaign, identified to be under low BB influence, is characterized by mostly low ratios, which rose again toward the end of the campaign. It must be also emphasized that the calculation of the excess ratios is sensitive to the selection of the background levels, increasing uncertainty for and associated plume age.
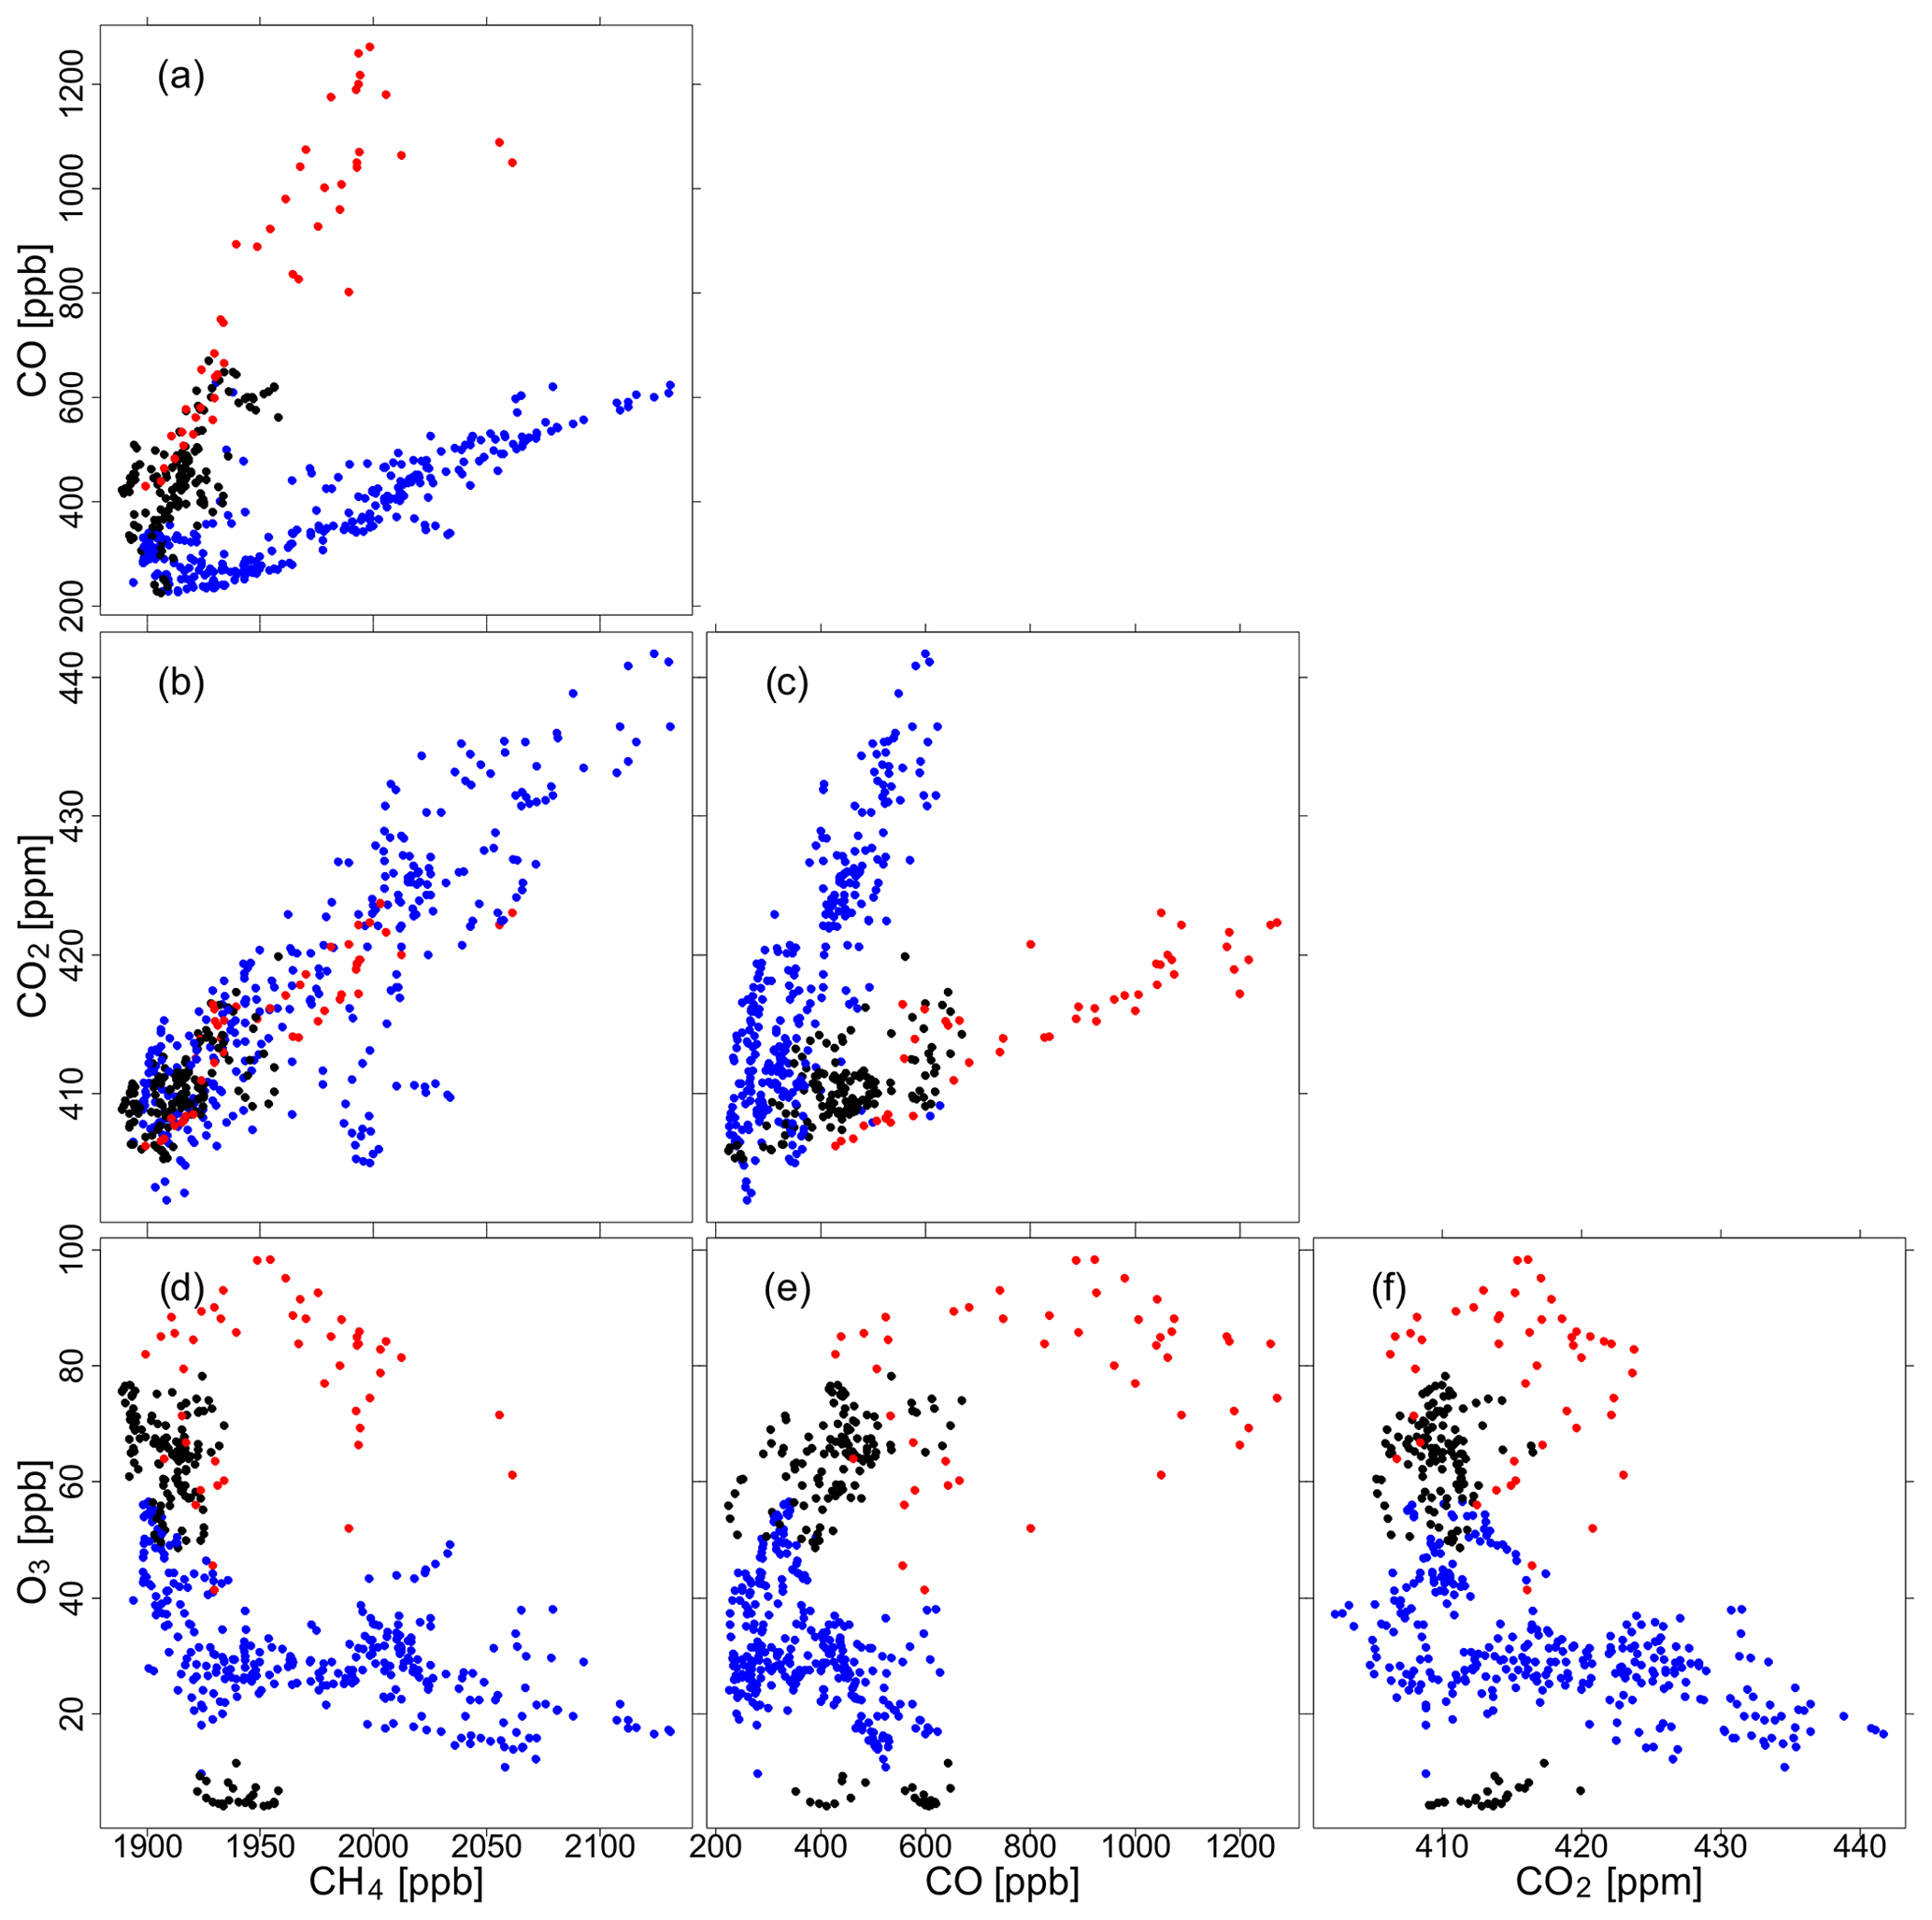
Figure 7Scatter plots of hourly ozone (O3), carbon monoxide (CO), carbon dioxide (CO2), and methane (CH4) vs. each other at PDI during the sampling campaign from 23 March to 12 April 2015. Three colors (blue, black, and red) follow the clusters of low, medium, and high BB influence discussed in Sect. 3.2.2.
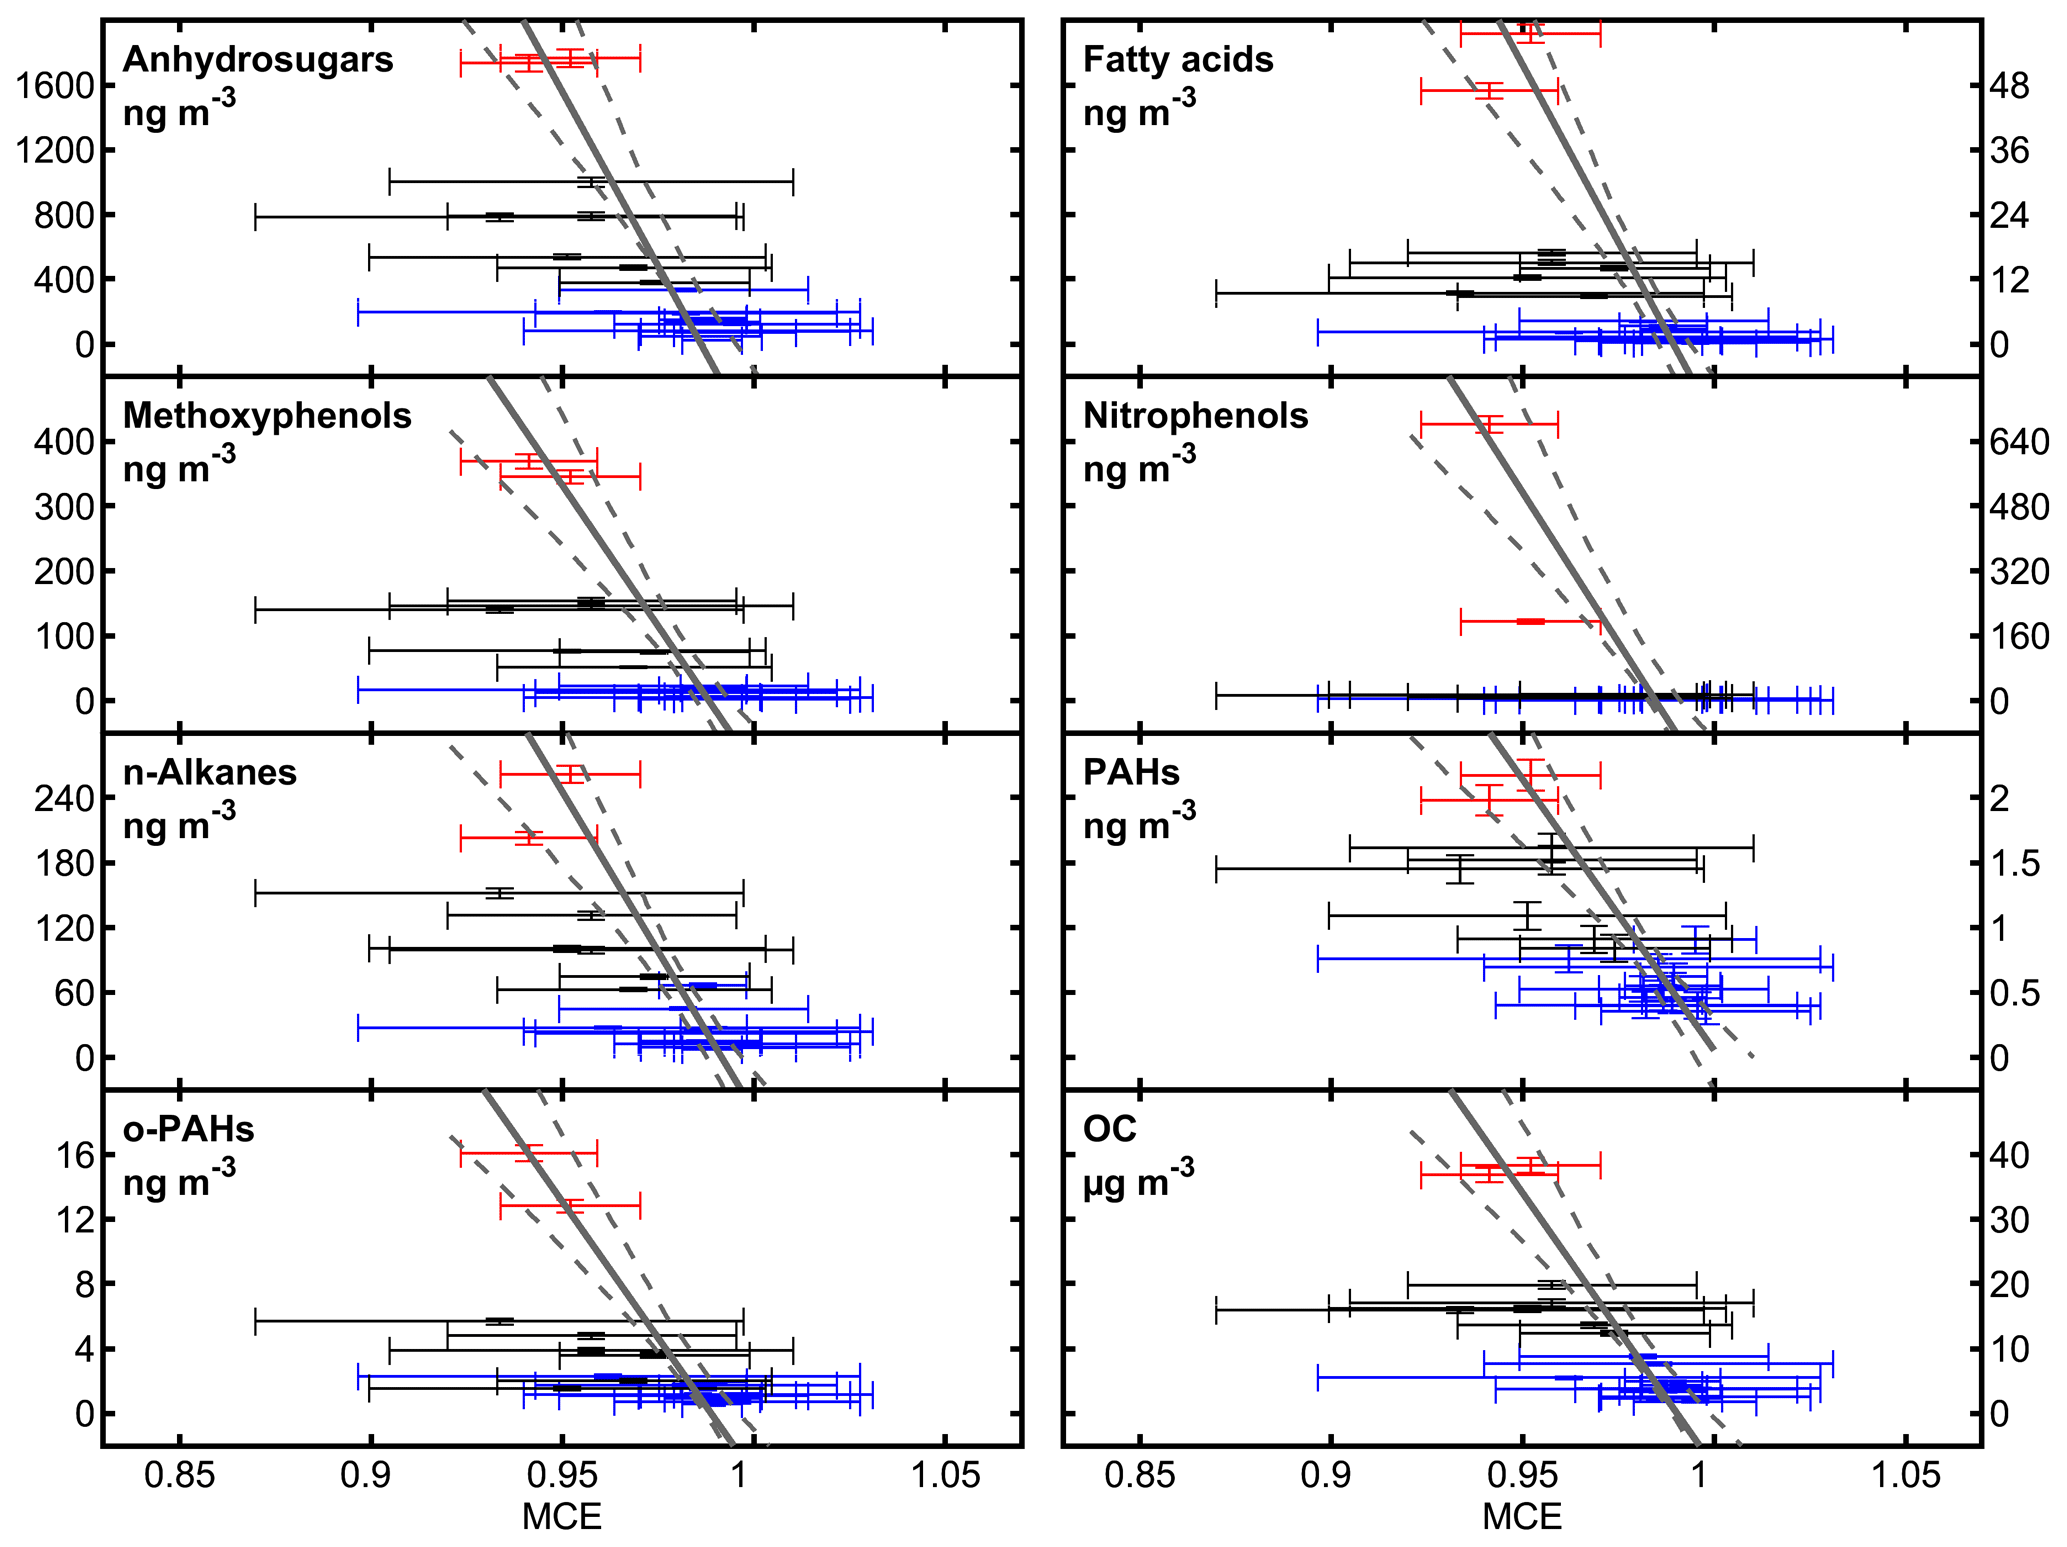
Figure 8Relation between modified combustion efficiency (MCE) and various compound classes. Blue, black, and red colors correspond to the periods of low, medium, and high BB influence, respectively. Error bars illustrate the uncertainty of each data point (please note that uncertainties for concentrations are partly too small to be visible in the figure). The gray lines refer to linear fits from Deming regression. Dashed lines denote the non-simultaneous prediction band of the fit function by means of 1σ.
3.5 Parametrization of organic aerosol (OA) constituents with MCE
The modified combustion efficiency (MCE), defined as
is widely used as an indicator of combustion emissions, with higher MCE values (close to 1) indicating higher proportions of flaming or complete combustion and lower MCEs referring to higher proportions of smoldering or incomplete combustion (Kondo et al., 2011). MCE values of 0.80 to 1.00 were observed for wildland fires in several vegetation zones (Akagi et al., 2011) and of 0.79 to 0.98 in regional smoke plumes at the Mount Bachelor Observatory (Briggs et al., 2016). At PDI, except for a few hours on 23 March, MCE was stable at around 0.98 from the beginning of the sampling period and decreased to values below 0.94 from 30 March to 4 April. It occasionally reached values below 0.9 on 5 April, while it rose again back to 0.99 afterwards (see Fig. S10). Variability in MCE at PDI was found particularly between 30 March and 6 April, which might be caused by variable degrees of mixing between the smoke plume and other air masses (Yokelson et al., 2013). The relatively high MCE values of the plume might be also a consequence of low precipitation over a longer period associated with biomass of low moisture, improving the combustion efficiency (Chen et al., 2010). For some days, both CO and CO2 are close to the chosen background levels, so consequently, at CO2 mixing ratios below 410 ppm, the uncertainty of MCE exceeds 0.04.
We examined the relation between MCE and the compound classes defined in Fig. 4. Concentrations of all compound classes declined with increasing MCE due to more efficient combustion conditions (Fig. 8) with a linear behavior as suggested by other studies considering a similar interval of MCE (Burling et al., 2010; Bertrand et al., 2017). To have null concentrations of OA at MCE = 1 (complete combustion), the slope of the regression should be equal to minus the intercept, which was in fact obtained from the regression (Table S3). PAHs, which are related to combustion processes, anhydrosugars, and methoxyphenols, show the best agreement with the regression function and therefore a direct relation to the MCE. During the days of medium BB influence, concentrations of other compound classes deviate from their regression function and are consistently underestimated (alkanes, o-PAHs, OC, fatty acids) because data points for days of high BB influence increase the steepness of the slope, indicating additional contributions by non-combustion sources such as vegetation and atmospheric aging. In particular the fit for nitrophenols is clearly dominated by the data points of the days of high BB influence. During the days with medium BB influence, we observed on average significantly higher (4.7-fold) concentrations ( from ANOVA) compared to low-BB days, which is also associated with lower MCE. The MCE values for days of high BB influence (0.941 and 0.952) appear within the interquartile range of the days with medium BB influence (0.933–0.969), therefore giving evidence of atmospheric aging being the most important source of nitrophenols.
3.6 Back-trajectory analysis
Average air mass backward trajectories for each of the periods identified by the organic aerosol clustering reveal a distinctly different advection pattern for the three pollution phases (Fig. 9). Similar plots of individual trajectories (initialized on a 4-hourly time step) can be found in the supplemental material (Fig. S5). For the days with low BB influence, atmospheric transport towards PDI was from the northeastern to eastern sector with a stronger tendency of trajectories arriving from mainland China after the polluted phase (April) as compared arriving over the Yellow Sea before the polluted phase (March). Very little active BB was observed by MODIS in these regions. In clear contrast, air mass trajectories indicate the arrival of air from the southwestern sector during the pollution event passing directly over large areas of active open BB in northern Laos (most intense) and Myanmar (less intense) (Pani et al., 2019b; Lin et al., 2013). A major difference between the more polluted cluster (high) and the medium polluted cluster (medium) seems to be a recirculation over land area for the medium cluster as compared to a more westerly advection for the high cluster. On average, air masses moved slightly faster in the high-BB cluster (larger distance between symbols in trajectory plot) than in the medium cluster. However, in both cases the area with the most intense fires was crossed within the last 24 to 36 h before arriving at PDI, supporting the finding of little aging in the aerosol composition as derived from . Nevertheless, ratios were lower in the high cluster as compared to the medium cluster, where variable ratios were observed. A possible explanation could be the longer residence time over land for the medium cluster, allowing ozone precursors to be taken up and ozone to be formed for a longer time, combined with an air mass origin over more NOx-rich regions (southern China), in contrast to the slightly faster advection above the fires and an oceanic (NOx-depleted) origin for the high cluster prior to arrival at PDI. Fire activities were more enhanced during the days of high BB influence than medium BB influence (Fig. S11), potentially explaining the observed differences in pollution loads. For all OA clusters, the average trajectories were traveling below 2 km above sea level in the last five days before arrival at PDI, suggesting that sampled air masses were in immediate contact with surface emissions.
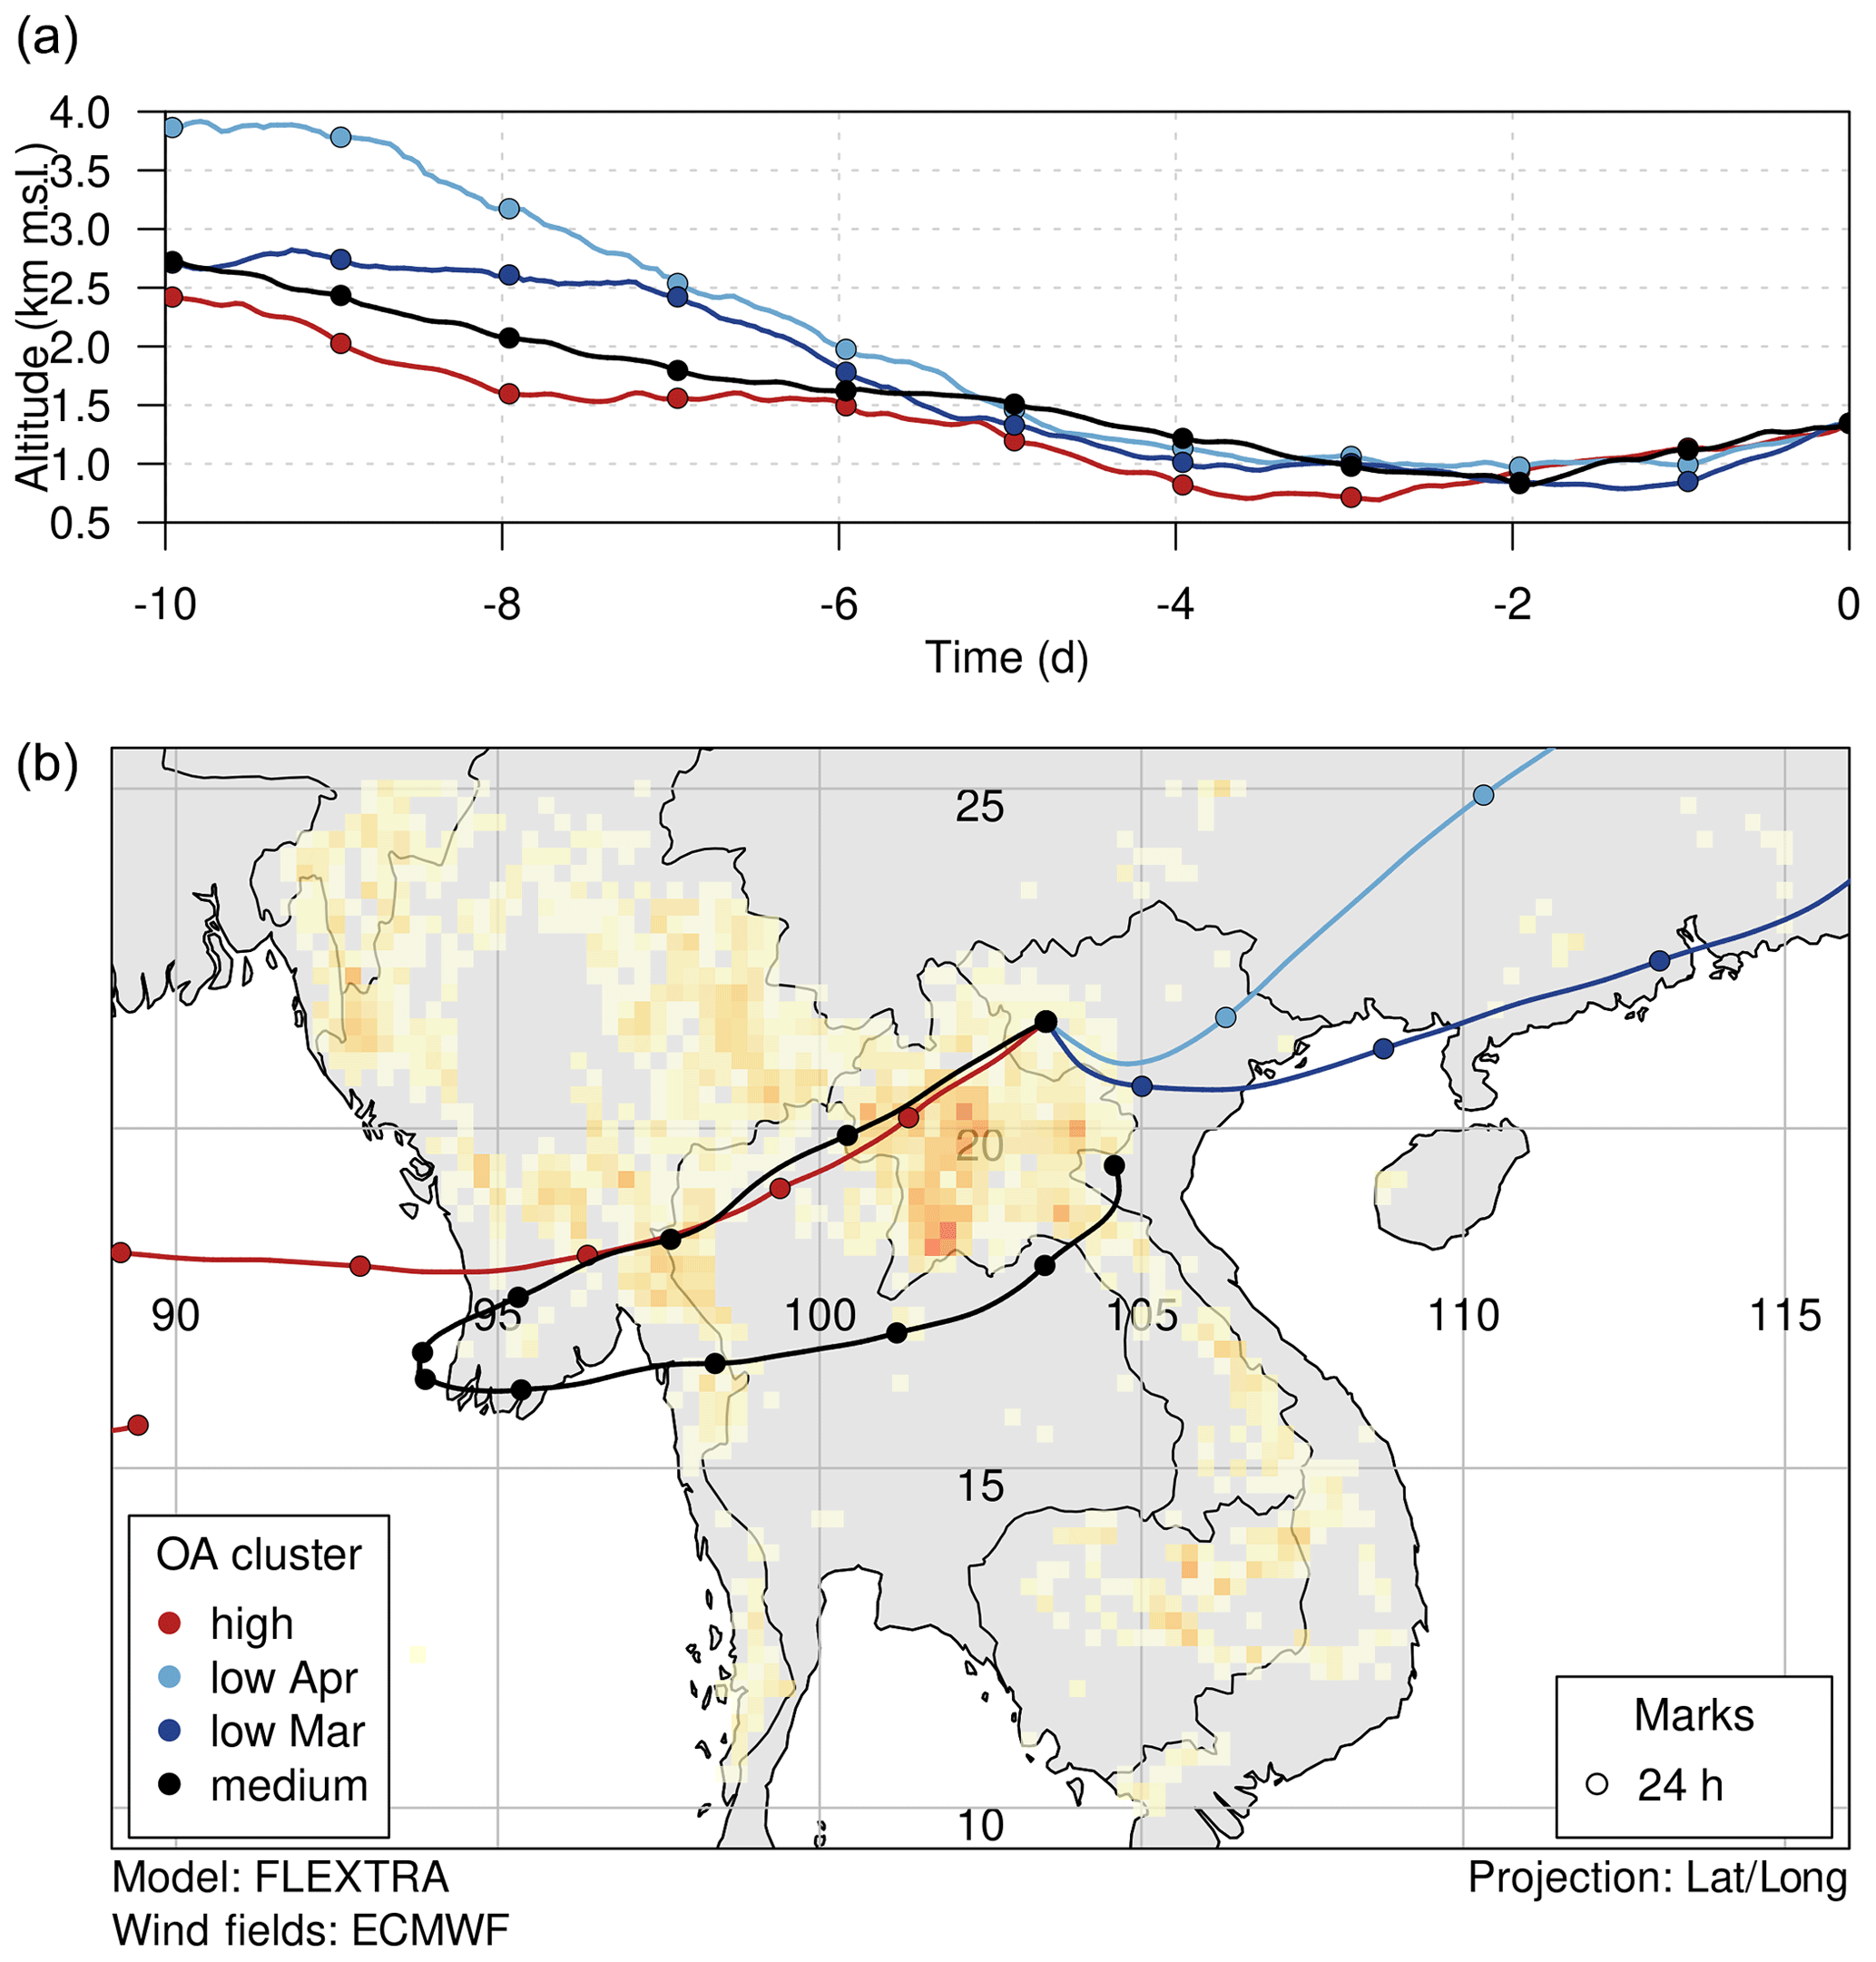
Figure 9The 10-day backward trajectories arriving at PDI averaged for the periods determined by the organic aerosol clustering. The “low” class was additionally split into the period before the days with medium and high BB influence (March: low Mar) and after (April: low Apr). Panel (a) displays the average height of the trajectories above sea level on a relative time axis before arrival at the site. Panel (b) gives the average location of the trajectories overlaid on a map of MODIS fire count densities for the period spanning from 5 d before until the end of the investigation period (from low (bright yellow) to high (orange-red) fire intensities). Filled circles on the trajectories mark a travel time of 24 h.
Our extensive characterization of carbonaceous PM2.5 species and monitoring of trace gases at the Pha Din (PDI) station in Vietnam from 23 March to 12 April 2015 gives insights into the atmospheric composition during the (dry) pre-monsoon season, which is impacted by large-scale open biomass burning (BB) on mainland Southeast Asia. OC and EC concentrations in PM2.5 were found in the range from 1.8 to 38.3 µg m−3 and 0.1 to 9.8 µg m−3, respectively, which is comparable with other studies in the region during the dry season. Among several OC classes and 51 quantified organic aerosol (OA) constituents, anhydrous sugars and levoglucosan were the most abundant compound class and species, respectively. In a combined statistical and molecular marker approach, together with trace gases and backward trajectory (BWT) analysis, a consistent picture could be drawn that there were three distinct pollution periods with elevated levels of OA loadings associated with BB aerosol. The analyses of BWT, fire counts, and point toward a short plume age of less than 36 h for the air masses of high-BB-influence days and local or regional BB events by implication. However, daily averaged MCE > 0.90 remained high compared to literature values of other BB plume studies, which might be a consequence of the low precipitation amount during the dry pre-monsoon seasons, availability of biomass with low moisture content, and finally improved combustion efficiency.
In addition to the statistical classification of the sampling period, we applied several molecular marker and diagnostic ratio approaches to prove BB as a major source of carbonaceous aerosol, to elucidate the type of BB and to estimate the role of atmospheric aging. Consistently, the molecular OA composition also points toward BB and suggests more precisely the combustion of angiosperm as the main OC origin. While we did not find sufficient evidence for an unambiguously linkage to either wildfires or agricultural residue burning on days of high BB influence, softwood burning appears to be of minor importance. Based on the ratio of levoglucosan to total carbon, agricultural residue burning is more likely than hardwood burning. Atmospheric aging was found to have a higher contribution to OC during days with low BB influence than medium or high BB influence. However, some OA constituents, such as nitrophenols and 9,10-anthracendione, which are known early-generation products of atmospheric aging of primary BB-related precursors, differed greatly from the expected concentrations based on their ratios to anhydrosugars. Therefore, we suggest that the plume arriving at PDI on 5 and 6 April underwent only a low degree of atmospheric aging and might have had a more local source.
Overall, our results agree with a previous source apportionment study based on optical aerosol properties by Bukowiecki et al. (2019) and add valuable data on the OC chemical composition of PM2.5 in a region of scarce data availability. These data provide valuable insights for a better characterization of OA emitted from BB in Southeast Asia and may also be considered as a reference dataset for future studies over more extended periods, or including more chemical parameters in other regions. The presented gas- and particle-phase data may also be used in the evaluation of atmospheric transport simulation models, or for comparison with BB emissions in other world regions and from other BB types, such as for instance Australian bush fires, African savannah fires, or tropical peatland fires.
The continuous trace gas records from Pha Din are available on the dedicated GAW data repositories; i.e., O3 data can be found at the World Data Centre for Reactive Gases (https://www.gaw-wdcrg.org, last access: 15 February 2021, VNMHA and Empa, 2021a), while CO2, CH4, and CO data are available on the World Data Centre for Greenhouse Gases (https://gaw.kishou.go.jp, last access: 15 February 2021, VNMHA and Empa, 2021b).
The trajectory model FLEXTRA is open-source software that can be obtained from https://www.flexpart.eu/downloads/25 (last access: 26 May 2021, Stohl et al., 2021). The data for trajectory plots of the site PDI are available at https://doi.org/10.5281/zenodo.4785390 (Henne, 2021). Further data are available from the corresponding author upon request.
The supplement related to this article is available online at: https://doi.org/10.5194/acp-21-8293-2021-supplement.
Experimental work at the sampling site was done by DLN. DLN performed IDTD-GC-TOF-MS and thermal-optical carbon analyses with assistance from JO and GA. DLN, HC, and JSK analyzed IDTD-GC-TOF-MS and TOR data. HC conducted the statistical analysis of IDTD-GC-TOFMS data. NAN, NB and MS were the principal investigators of the long-term aerosol and trace gas observations. MS and DLN performed the trace gas data analyses; SH conducted the back-trajectory analysis. Data interpretation was done by DLN, HC, SMP, MS, SH, OBP, and JSK. HC, JSK, GE, RZ, and XAN supervised the study. XAN, DLN, OBP, and JSK acquired the funding. The paper was written by DLN, HC, and SMP with contribution from all authors.
The authors declare that they have no conflict of interest.
This article is part of the special issue “The role of fire in the Earth system: understanding interactions with the land, atmosphere, and society (ESD/ACP/BG/GMD/NHESS inter-journal SI)”. It is a result of the EGU General Assembly 2020, 3–8 May 2020.
We thank the Vietnam Meteorological and Hydrological Administration (VNMHA) for providing access to the facilities and for the support of our measurements. We acknowledge the use of data and imagery from LANCE FIRMS operated by NASA's Earth Science Data and Information System (ESDIS) with funding provided by NASA Headquarters.
This research has been supported by the German Academic Exchange Service (DAAD) (grant no. 91614707), the Vietnamese Academy of Science and Technology (VAST) (grant no. QTRU05.01/18-20), the Federal German Helmholtz Association of Research Centers (HGF) through Helmholtz International Lab aeroHEALTH (grant no. InterLabs-0005), the Federal Office of Meteorology and Climatology MeteoSwiss through the project Capacity Building and Twinning for Climate Observing Systems (CATCOS) (grant no. 81025332) and GAW Quality Assurance/Science Activity Centre Switzerland, and the Russian Fond for Basic Research (RFBR) (grant no. 20-55-12001).
This paper was edited by Manvendra K. Dubey and reviewed by two anonymous referees.
Akagi, S. K., Yokelson, R. J., Wiedinmyer, C., Alvarado, M. J., Reid, J. S., Karl, T., Crounse, J. D., and Wennberg, P. O.: Emission factors for open and domestic biomass burning for use in atmospheric models, Atmos. Chem. Phys., 11, 4039–4072, https://doi.org/10.5194/acp-11-4039-2011, 2011.
Andreae, M., Anderson, B., Blake, D., Bradshaw, J., Collins, J., Gregory, G., Sachse, G., and Shipham, M.: Influence of plumes from biomass burning on atmospheric chemistry over the equatorial and tropical South Atlantic during CITE 3, J. Geophys. Res.-Atmos., 99, 12793–12808, 1994.
Anh, H. Q., Minh, T. B., Tran, T. M., and Takahashi, S.: Road dust contamination by polycyclic aromatic hydrocarbons and their methylated derivatives in northern Vietnam: concentrations, profiles, emission sources, and risk assessment, Environ. Pollut., 254, 113073, https://doi.org/10.1016/j.envpol.2019.113073, 2019.
Aurell, J. and Gullett, B. K.: Emission factors from aerial and ground measurements of field and laboratory forest burns in the southeastern US: PM2.5, black and brown carbon, VOC, and PCDD/PCDF, Environ. Sci. Technol., 47, 8443–8452, https://doi.org/10.1021/es402101k, 2013.
Barros, T. C., Yunes, S., Menegon, G., Nome, F., Chaimovich, H., Politi, M. J., Dias, L. G., and Cuccovia, I. M.: Hydrolysis of 1, 8-and 2, 3-naphthalic anhydrides and the mechanism of cyclization of 1, 8-naphthalic acid in aqueous solutions, J. Chem. Soc. Perk. T. 2, 2342–2350, https://doi.org/10.1039/B104148G, 2001.
Bertrand, A., Stefenelli, G., Bruns, E. A., Pieber, S. M., Temime-Roussel, B., Slowik, J. G., Prévôt, A. S., Wortham, H., El Haddad, I., and Marchand, N.: Primary emissions and secondary aerosol production potential from woodstoves for residential heating: Influence of the stove technology and combustion efficiency, Atmos. Environ., 169, 65–79, 2017.
Bertschi, I. T. and Jaffe, D. A.: Long-range transport of ozone, carbon monoxide, and aerosols to the NE Pacific troposphere during the summer of 2003: Observations of smoke plumes from Asian boreal fires, J. Geophys. Res.-Atmos., 110, D05303, https://doi.org/10.1029/2004JD005135, 2005.
Briggs, N. L., Jaffe, D. A., Gao, H., Hee, J. R., Baylon, P. M., Zhang, Q., Zhou, S., Collier, S. C., Sampson, P. D., and Cary, R. A.: Particulate matter, ozone, and nitrogen species in aged wildfire plumes observed at the Mount Bachelor Observatory, Aerosol Air Qual. Res., 16, 3075–3087, https://doi.org/10.4209/aaqr.2016.03.0120, 2016.
Bukowiecki, N., Steinbacher, M., Henne, S., Nguyen, N. A., Nguyen, X. A., Hoang, A. L., Nguyen, D. L., Duong, H. L., Engling, G., Wehrle, G., Gysel-Beer, M., and Baltensperger, U.: Effect of Large-scale Biomass Burning on Aerosol Optical Properties at the GAW Regional Station Pha Din, Vietnam, Aerosol Air Qual. Res., 19, 1172–1187, https://doi.org/10.4209/aaqr.2018.11.0406, 2019.
Burling, I. R., Yokelson, R. J., Griffith, D. W. T., Johnson, T. J., Veres, P., Roberts, J. M., Warneke, C., Urbanski, S. P., Reardon, J., Weise, D. R., Hao, W. M., and de Gouw, J.: Laboratory measurements of trace gas emissions from biomass burning of fuel types from the southeastern and southwestern United States, Atmos. Chem. Phys., 10, 11115–11130, https://doi.org/10.5194/acp-10-11115-2010, 2010.
Carmichael, G. R., Tang, Y., Kurata, G., Uno, I., Streets, D., Woo, J. H., Huang, H., Yienger, J., Lefer, B., Shetter, R., Blake, D., Atlas, E., Fried, A., Apel, E., Eisele, F., Cantrell, C., Avery, M., Barrick, J., Sachse, G., Brune, W., Sandholm, S., Kondo, Y., Singh, H., Talbot, R., Bandy, A., Thorton, D., Clarke, A., and Heikes, B.: Regional-scale chemical transport modeling in support of the analysis of observations obtained during the TRACE-P experiment, J. Geophys. Res.-Atmos., 108, 8823, https://doi.org/10.1029/2002jd003117, 2003.
Chan, C. Y., Chan, L. Y., Harris, J. M., Oltmans, S. J., Blake, D. R., Qin, Y., Zheng, Y. G., and Zheng, X. D.: Characteristics of biomass burning emission sources, transport, and chemical speciation in enhanced springtime tropospheric ozone profile over Hong Kong, J. Geophys. Res.-Atmos., 108, 4015, https://doi.org/10.1029/2001jd001555, 2003.
Che, H., Stier, P., Gordon, H., Watson-Parris, D., and Deaconu, L.: Cloud adjustments dominate the overall negative aerosol radiative effects of biomass burning aerosols in UKESM1 climate model simulations over the south-eastern Atlantic, Atmos. Chem. Phys., 21, 17–33, https://doi.org/10.5194/acp-21-17-2021, 2021.
Chen, L.-W. A., Verburg, P., Shackelford, A., Zhu, D., Susfalk, R., Chow, J. C., and Watson, J. G.: Moisture effects on carbon and nitrogen emission from burning of wildland biomass, Atmos. Chem. Phys., 10, 6617–6625, https://doi.org/10.5194/acp-10-6617-2010, 2010.
Chow, J. C., Watson, J. G., Chen, L. W., Arnott, W. P., Moosmuller, H., and Fung, K.: Equivalence of elemental carbon by thermal/optical reflectance and transmittance with different temperature protocols, Environ. Sci. Technol., 38, 4414–4422, https://doi.org/10.1021/es034936u, 2004a.
Chow, J. C., Watson, J. G., Kuhns, H., Etyemezian, V., Lowenthal, D. H., Crow, D., Kohl, S. D., Engelbrecht, J. P., and Green, M. C.: Source profiles for industrial, mobile, and area sources in the Big Bend Regional Aerosol Visibility and Observational study, Chemosphere, 54, 185–208, https://doi.org/10.1016/j.chemosphere.2003.07.004, 2004b.
Chuang, M.-T., Chou, C. C. K., Sopajaree, K., Lin, N.-H., Wang, J.-L., Sheu, G.-R., Chang, Y.-J., and Lee, C.-T.: Characterization of aerosol chemical properties from near-source biomass burning in the northern Indochina during 7-SEAS/Dongsha experiment, Atmos. Environ., 78, 72–81, https://doi.org/10.1016/j.atmosenv.2012.06.056, 2013.
Chuesaard, T., Chetiyanukornkul, T., Kameda, T., Hayakawa, K., and Toriba, A.: Influence of biomass burning on the levels of atmospheric polycyclic aromatic hydrocarbons and their nitro derivatives in Chiang Mai, Thailand, Aerosol Air Qual. Res., 14, 1247–1257, 2013.
Cohen, D. D., Crawford, J., Stelcer, E., and Bac, V. T.: Long range transport of fine particle windblown soils and coal fired power station emissions into Hanoi between 2001 to 2008, Atmos. Environ., 44, 3761–3769, https://doi.org/10.1016/j.atmosenv.2010.06.047, 2010.
Engling, G., Zhang, Y.-N., Chan, C.-Y., Sang, X.-F., Lin, M., Ho, K.-F., Li, Y.-S., Lin, C.-Y., and Lee, J. J.: Characterization and sources of aerosol particles over the southeastern Tibetan Plateau during the Southeast Asia biomass-burning season, Tellus B, 63, 117–128, https://doi.org/10.1111/j.1600-0889.2010.00512.x, 2017.
Finewax, Z., de Gouw, J. A., and Ziemann, P. J.: Identification and Quantification of 4-Nitrocatechol Formed from OH and NO3 Radical-Initiated Reactions of Catechol in Air in the Presence of NOx: Implications for Secondary Organic Aerosol Formation from Biomass Burning, Environ. Sci. Technol., 52, 1981–1989, 2018.
Fu, P. Q., Kawamura, K., Chen, J., Li, J., Sun, Y. L., Liu, Y., Tachibana, E., Aggarwal, S. G., Okuzawa, K., Tanimoto, H., Kanaya, Y., and Wang, Z. F.: Diurnal variations of organic molecular tracers and stable carbon isotopic composition in atmospheric aerosols over Mt. Tai in the North China Plain: an influence of biomass burning, Atmos. Chem. Phys., 12, 8359–8375, https://doi.org/10.5194/acp-12-8359-2012, 2012.
Galarneau, E.: Source specificity and atmospheric processing of airborne PAHs: Implications for source apportionment, Atmos. Environ., 42, 8139–8149, https://doi.org/10.1016/j.atmosenv.2008.07.025, 2008.
Gautam, R., Hsu, N. C., Eck, T. F., Holben, B. N., Janjai, S., Jantarach, T., Tsay, S.-C., and Lau, W. K.: Characterization of aerosols over the Indochina peninsula from satellite-surface observations during biomass burning pre-monsoon season, Atmos. Environ., 78, 51–59, https://doi.org/10.1016/j.atmosenv.2012.05.038, 2013.
Han, Y., Cao, J., Chow, J. C., Watson, J. G., An, Z., Jin, Z., Fung, K., and Liu, S.: Evaluation of the thermal/optical reflectance method for discrimination between char-and soot-EC, Chemosphere, 69, 569–574, 2007.
Han, Y. M., Cao, J. J., Lee, S. C., Ho, K. F., and An, Z. S.: Different characteristics of char and soot in the atmosphere and their ratio as an indicator for source identification in Xi'an, China, Atmos. Chem. Phys., 10, 595–607, https://doi.org/10.5194/acp-10-595-2010, 2010.
Harrison, M. A., Barra, S., Borghesi, D., Vione, D., Arsene, C., and Olariu, R. I.: Nitrated phenols in the atmosphere: a review, Atmos. Environ., 39, 231–248, 2005.
Hartikainen, A., Tiitta, P., Ihalainen, M., Yli-Pirilä, P., Orasche, J., Czech, H., Kortelainen, M., Lamberg, H., Suhonen, H., Koponen, H., Hao, L., Zimmermann, R., Jokiniemi, J., Tissari, J., and Sippula, O.: Photochemical transformation of residential wood combustion emissions: dependence of organic aerosol composition on OH exposure, Atmos. Chem. Phys., 20, 6357–6378, https://doi.org/10.5194/acp-20-6357-2020, 2020.
Honrath, R., Owen, R. C., Val Martin, M., Reid, J., Lapina, K., Fialho, P., Dziobak, M. P., Kleissl, J., and Westphal, D.: Regional and hemispheric impacts of anthropogenic and biomass burning emissions on summertime CO and O3 in the North Atlantic lower free troposphere, J. Geophys. Res.-Atmos., 109, D24310, https://doi.org/10.1029/2004JD005147, 2004.
Henne, S.: FLEXTRA back-trajectories for Pha Din, Viet Nam, atmospheric observatory [Data set], Zenodo, https://doi.org/10.5281/zenodo.4785390, 2021.
Ihantola, T., Di Bucchianico, S., Happo, M., Ihalainen, M., Uski, O., Bauer, S., Kuuspalo, K., Sippula, O., Tissari, J., and Oeder, S. J. P.: Influence of wood species on toxicity of log-wood stove combustion aerosols: a parallel animal and air-liquid interface cell exposure study on spruce and pine smoke, Part. Fibre Toxicol., 17, 27, https://doi.org/10.1186/s12989-020-00355-1, 2020.
Jaffe, D. A. and Wigder, N. L.: Ozone production from wildfires: A critical review, Atmos. Environ., 51, 1–10, 2012.
Kahnt, A., Behrouzi, S., Vermeylen, R., Shalamzari, M. S., Vercauteren, J., Roekens, E., Claeys, M., and Maenhaut, W.: One-year study of nitro-organic compounds and their relation to wood burning in PM10 aerosol from a rural site in Belgium, Atmos. Environ., 81, 561–568, 2013.
Kanashova, T., Sippula, O., Oeder, S., Streibel, T., Passig, J., Czech, H., Kaoma, T., Sapcariu, S. C., Dilger, M., Paur, H.-R., Schlager, C., Mülhopt, S., Weiss, C., Schmidt-Weber, C., Traidl-Hoffmann, C., Michalke, B., Krebs, T., Karg, E., Jakobi, G., Scholtes, S., Schnelle-Kreis, J., Sklorz, M., Orasche, J., Müller, L., Reda, A., Rüger, C., Neumann, A., Abbaszade, G., Radischat, C., Hiller, K., et al.: Emissions from a modern log wood masonry heater and wood pellet boiler: Composition and biological impact on air-liquid interface exposed human lung cancer cells, J. Mol. Clin. Med., 1, 23–35, 2018.
Katsoyiannis, A., Sweetman, A. J., and Jones, K. C.: PAH molecular diagnostic ratios applied to atmospheric sources: a critical evaluation using two decades of source inventory and air concentration data from the UK, Environ. Sci. Technol., 45, 8897–8906, 2011.
Kondo, Y., Morino, Y., Takegawa, N., Koike, M., Kita, K., Miyazaki, Y., Sachse, G., Vay, S., Avery, M., and Flocke, F.: Impacts of biomass burning in Southeast Asia on ozone and reactive nitrogen over the western Pacific in spring, J. Geophys. Res.-Atmos., 109, D15S12, https://doi.org/10.1029/2003JD004203, 2004.
Kondo, Y., Matsui, H., Moteki, N., Sahu, L., Takegawa, N., Kajino, M., Zhao, Y., Cubison, M., Jimenez, J., and Vay, S.: Emissions of black carbon, organic, and inorganic aerosols from biomass burning in North America and Asia in 2008, J. Geophys. Res.-Atmos., 116, D08204, https://doi.org/10.1029/2010JD015152, 2011.
Laskin, A., Laskin, J., and Nizkorodov, S. A.: Chemistry of atmospheric brown carbon, Chem. Rev., 115, 4335–4382, 2015.
Lee, C.-T., Ram, S. S., Nguyen, D. L., Chou, C. C., Chang, S.-Y., Lin, N.-H., Chang, S.-C., Hsiao, T.-C., Sheu, G.-R., and Ou-Yang, C.-F.: Aerosol chemical profile of near-source biomass burning smoke in Sonla, Vietnam during 7-SEAS campaigns in 2012 and 2013, Aerosol Air Qual. Res., 16, 2603–2617, 2016.
Lelieveld, J., Crutzen, P. J., Ramanathan, V., Andreae, M. O., Brenninkmeijer, C. M., Campos, T., Cass, G. R., Dickerson, R. R., Fischer, H., de Gouw, J. A., Hansel, A., Jefferson, A., Kley, D., de Laat, A. T., Lal, S., Lawrence, M. G., Lobert, J. M., Mayol-Bracero, O. L., Mitra, A. P., Novakov, T., Oltmans, S. J., Prather, K. A., Reiner, T., Rodhe, H., Scheeren, H. A., Sikka, D., and Williams, J.: The Indian Ocean experiment: widespread air pollution from South and Southeast Asia, Science, 291, 1031–1036, https://doi.org/10.1126/science.1057103, 2001.
Li, C., Tsay, S.-C., Hsu, N. C., Kim, J. Y., Howell, S. G., Huebert, B. J., Ji, Q., Jeong, M.-J., Wang, S.-H., Hansell, R. A., and Bell, S. W.: Characteristics and composition of atmospheric aerosols in Phimai, central Thailand during BASE-ASIA, Atmos. Environ., 78, 60–71, https://doi.org/10.1016/j.atmosenv.2012.04.003, 2013.
Li, X., Jiang, L., Lyu, Y., Xu, T., Yang, X., Iinuma, Y., Chen, J., and Herrmann, H.: Size distribution of particle-phase sugar and nitrophenol tracers during severe urban haze episodes in Shanghai, Atmos. Environ., 145, 115–127, 2016.
Lin, N.-H., Tsay, S.-C., Maring, H. B., Yen, M.-C., Sheu, G.-R., Wang, S.-H., Chi, K. H., Chuang, M.-T., Ou-Yang, C.-F., Fu, J. S., Reid, J. S., Lee, C.-T., Wang, L.-C., Wang, J.-L., Hsu, C. N., Sayer, A. M., Holben, B. N., Chu, Y.-C., Nguyen, X. A., Sopajaree, K., Chen, S.-J., Cheng, M.-T., Tsuang, B.-J., Tsai, C.-J., Peng, C.-M., Schnell, R. C., Conway, T., Chang, C.-T., Lin, K.-S., Tsai, Y. I., Lee, W.-J., Chang, S.-C., Liu, J.-J., Chiang, W.-L., Huang, S.-J., Lin, T.-H., and Liu, G.-R.: An overview of regional experiments on biomass burning aerosols and related pollutants in Southeast Asia: From BASE-ASIA and the Dongsha Experiment to 7-SEAS, Atmos. Environ., 78, 1–19, https://doi.org/10.1016/j.atmosenv.2013.04.066, 2013.
Liu, S., Aiken, A. C., Gorkowski, K., Dubey, M. K., Cappa, C. D., Williams, L. R., Herndon, S. C., Massoli, P., Fortner, E. C., and Chhabra, P. S.: Enhanced light absorption by mixed source black and brown carbon particles in UK winter, Nat. Commun., 6, 1–10, 2015.
Lu, Z., Streets, D. G., Winijkul, E., Yan, F., Chen, Y., Bond, T. C., Feng, Y., Dubey, M. K., Liu, S., Pinto, J. P., and Carmichael, G. R.: Light absorption properties and radiative effects of primary organic aerosol emissions, Environ. Sci. Technol., 49, 4868–4877, 2015.
Martinsson, J., Eriksson, A., Nielsen, I. E., Malmborg, V. B., Ahlberg, E., Andersen, C., Lindgren, R., Nystrom, R., Nordin, E., and Brune, W.: Impacts of combustion conditions and photochemical processing on the light absorption of biomass combustion aerosol, Environ. Sci. Technol., 49, 14663–14671, 2015.
Mauzerall, D. L., Logan, J. A., Jacob, D. J., Anderson, B. E., Blake, D. R., Bradshaw, J. D., Heikes, B., Sachse, G. W., Singh, H., and Talbot, B.: Photochemistry in biomass burning plumes and implications for tropospheric ozone over the tropical South Atlantic, J. Geophys. Res.-Atmos., 103, 8401–8423, 1998.
Miersch, T., Czech, H., Hartikainen, A., Ihalainen, M., Orasche, J., Abbaszade, G., Tissari, J., Streibel, T., Jokiniemi, J., and Sippula, O.: Impact of photochemical ageing on Polycyclic Aromatic Hydrocarbons (PAH) and oxygenated PAH (Oxy-PAH/OH-PAH) in logwood stove emissions, Sci. Total Environ., 686, 382–392, 2019.
Mohr, C., Lopez-Hilfiker, F. D., Zotter, P., Prévôt, A. S. H., Xu, L., Ng, N. L., Herndon, S. C., Williams, L. R., Franklin, J. P., and Zahniser, M. S.: Contribution of nitrated phenols to wood burning brown carbon light absorption in Detling, United Kingdom during winter time, Environ. Sci. Technol., 47, 6316–6324, 2013.
MONRE: National Technical Regulation on meteorological Observations – QCVN 46: 2012/BTNMT, Vietnam National Technical Regulations, Ministry of Natural Resources and Environment (MONRE), 2012.
Myers-Pigg, A. N., Griffin, R. J., Louchouarn, P., Norwood, M. J., Sterne, A., and Cevik, B. K.: Signatures of biomass burning aerosols in the plume of a saltmarsh wildfire in South Texas, Environ. Sci. Technol., 50, 9308–9314, 2016.
Nguyen, D. L., Kawamura, K., Ono, K., Ram, S. S., Engling, G., Lee, C.-T., Lin, N.-H., Chang, S.-C., Chuang, M.-T., and Hsiao, T.-C.: Comprehensive PM2.5 organic molecular composition and stable carbon isotope ratios at Sonla, Vietnam: Fingerprint of biomass burning components, Aerosol Air Qual. Res., 16, 2618–2634, 2016.
Orasche, J., Schnelle-Kreis, J., Abbaszade, G., and Zimmermann, R.: Technical Note: In-situ derivatization thermal desorption GC-TOFMS for direct analysis of particle-bound non-polar and polar organic species, Atmos. Chem. Phys., 11, 8977–8993, https://doi.org/10.5194/acp-11-8977-2011, 2011.
Pani, S. K., Chantara, S., Khamkaew, C., Lee, C.-T., and Lin, N.-H.: Biomass burning in the northern peninsular Southeast Asia: Aerosol chemical profile and potential exposure, Atmos. Res., 224, 180–195, 2019a.
Pani, S. K., Ou-Yang, C.-F., Wang, S.-H., Ogren, J. A., Sheridan, P. J., Sheu, G.-R., and Lin, N.-H.: Relationship between long-range transported atmospheric black carbon and carbon monoxide at a high-altitude background station in East Asia, Atmos. Environ., 210, 86–99, 2019b.
Pardo, M., Li, C., He, Q., Levin-Zaidman, S., Tsoory, M., Yu, Q., Wang, X., and Rudich, Y.: Mechanisms of lung toxicity induced by biomass burning aerosols, Part. Fibre Toxicol., 17, 1–15, 2020.
Parrington, M., Palmer, P. I., Lewis, A. C., Lee, J. D., Rickard, A. R., Di Carlo, P., Taylor, J. W., Hopkins, J. R., Punjabi, S., Oram, D. E., Forster, G., Aruffo, E., Moller, S. J., Bauguitte, S. J.-B., Allan, J. D., Coe, H., and Leigh, R. J.: Ozone photochemistry in boreal biomass burning plumes, Atmos. Chem. Phys., 13, 7321–7341, https://doi.org/10.5194/acp-13-7321-2013, 2013.
Pham, C. T., Boongla, Y., Nghiem, T. D., Le, H. T., Tang, N., Toriba, A., and Hayakawa, K.: Emission Characteristics of Polycyclic Aromatic Hydrocarbons and Nitro-Polycyclic Aromatic Hydrocarbons from Open Burning of Rice Straw in the North of Vietnam, Int. J. Env. Res. Pub. He., 16, 2343, https://doi.org/10.3390/ijerph16132343, 2019.
Pochanart, P., Akimoto, H., Kajii, Y., and Sukasem, P.: Carbon monoxide, regional-scale transport, and biomass burning in tropical continental Southeast Asia: Observations in rural Thailand, J. Geophys. Res.-Atmos., 108, 4552, https://doi.org/10.1029/2002JD003360, 2003.
Popovicheva, O. B., Engling, G., Diapouli, E., Saraga, D., Persiantseva, N. M., Timofeev, M., Kireeva, E. D., Shonija, N. K., Chen, S.-H., and Nguyen, D. L.: Impact of smoke intensity on size-resolved aerosol composition and microstructure during the biomass burning season in Northwest Vietnam, Aerosol Air Qual. Res., 16, 2635–2654, 2016.
Popovicheva, O. B., Kistler, M., Kireeva, E., Persiantseva, N., Timofeev, M., Shoniya, N., and Kopeikin, V.: Aerosol composition and microstructure in the smoky atmosphere of Moscow during the August 2010 extreme wildfires, Izv. Atmos. Ocean. Phy., 53, 49–57, 2017a.
Popovicheva, O. B., Shonija, N. K., Persiantseva, N., Timofeev, M., Diapouli, E., Eleftheriadis, K., Borgese, L., and Nguyen, X. A.: Aerosol pollutants during agricultural biomass burning: A case study in Ba Vi region in Hanoi, Vietnam, Aerosol Air Qual. Res., 17, 2762–2779, 2017b.
Reid, J. S., Hyer, E. J., Johnson, R. S., Holben, B. N., Yokelson, R. J., Zhang, J., Campbell, J. R., Christopher, S. A., Di Girolamo, L., and Giglio, L.: Observing and understanding the Southeast Asian aerosol system by remote sensing: An initial review and analysis for the Seven Southeast Asian Studies (7SEAS) program, Atmos. Res., 122, 403–468, 2013.
Ren, L., Zhou, T., and Zhang, W.: Attribution of the record-breaking heat event over Northeast Asia in summer 2018: the role of circulation, Environ. Res. Lett., 15, 054018, https://doi.org/10.1088/1748-9326/ab8032, 2020.
Ringuet, J., Albinet, A., Leoz-Garziandia, E., Budzinski, H., and Villenave, E.: Reactivity of polycyclic aromatic compounds (PAHs, NPAHs and OPAHs) adsorbed on natural aerosol particles exposed to atmospheric oxidants, Atmos. Environ., 61, 15–22, 2012.
Salvador, C. M. G., Tang, R., Priestley, M., Li, L., Tsiligiannis, E., Le Breton, M., Zhu, W., Zeng, L., Wang, H., Yu, Y., Hu, M., Guo, S., and Hallquist, M.: Ambient nitro-aromatic compounds – biomass burning versus secondary formation in rural China, Atmos. Chem. Phys., 21, 1389–1406, https://doi.org/10.5194/acp-21-1389-2021, 2021.
Sang, X. F., Gensch, I., Laumer, W., Kammer, B., Chan, C. Y., Engling, G., Wahner, A., Wissel, H., and Kiendler-Scharr, A.: Stable carbon isotope ratio analysis of anhydrosugars in biomass burning aerosol particles from source samples, Environ. Sci. Technol., 46, 3312–3318, 2012.
Sang, X., Zhang, Z., Chan, C., and Engling, G.: Source categories and contribution of biomass smoke to organic aerosol over the southeastern Tibetan Plateau, Atmos. Environ., 78, 113–123, https://doi.org/10.1016/j.atmosenv.2012.12.012, 2013.
Seinfeld, J. H. and Pandis, S. N.: Atmospheric chemistry and physics: from air pollution to climate change, John Wiley & Sons, p. 1047, 2016.
Shi, Y. and Yamaguchi, Y.: A high-resolution and multi-year emissions inventory for biomass burning in Southeast Asia during 2001–2010, Atmos. Environ., 98, 8–16, 2014.
Simoneit, B. R.: Characterization of organic constituents in aerosols in relation to their rigin and transport: a review, Int. J. Environ. An. Ch., 23, 207–237, 1986.
Simoneit, B. R.: Organic matter of the troposphere – V. application of molecular marker analysis to biogenic emissions into the troposphere for source reconciliations, J. Atmos. Chem., 8, 251–275, 1989.
Simoneit, B. R. and Elias, V. O.: Detecting organic tracers from biomass burning in the atmosphere, Mar. Pollut. Bull., 42, 805–810, https://doi.org/10.1016/s0025-326x(01)00094-7, 2001.
Simoneit, B. R. and Mazurek, M. A.: Organic matter of the troposphere – II. Natural background of biogenic lipid matter in aerosols over the rural western United States, Atmos. Environ., 16, 2139–2159, 1982.
Simoneit, B. R. T.: Biomass burning – a review of organic tracers for smoke from incomplete combustion, Appl. Geochem., 17, 129–162, https://doi.org/10.1016/S0883-2927(01)00061-0, 2002.
Simoneit, B. R. T., Schauer, J. J., Nolte, C. G., Oros, D. R., Elias, V. O., Fraser, M. P., Rogge, W. F., and Cass, G. R.: Levoglucosan, a tracer for cellulose in biomass burning and atmospheric particles, Atmos. Environ., 33, 173–182, https://doi.org/10.1016/S1352-2310(98)00145-9, 1999.
Sokal, R. R. and Rohlf, F. J.: The comparison of dendrograms by objective methods, Taxon, 11, 33–40, 1962.
Stohl, A.: Trajectory statistics – a new method to establish source-receptor relationships of air pollutants and its application to the transport of particulate sulfate in Europe, Atmos. Environ., 30, 579–587, 1996.
Stohl, A. and Seibert, P.: Accuracy of trajectories as determined from the conservation of meteorological tracers, Q. J. Roy. Meteor. Soc., 124, 1465–1484, 1998.
Stohl, A., Seibert, P., Wotawa, G., and Eckhardt, S.: FLEXTRA [model code], available at: https://www.flexpart.eu/downloads/25, last access: 26 May 2021
Stott, P.: Combustion in tropical biomass fires: a critical review, Prog. Phys. Geog., 24, 355–377, 2000.
Streets, D. G., Yarber, K. F., Woo, J. H., and Carmichael, G. R.: Biomass burning in Asia: Annual and seasonal estimates and atmospheric emissions, Global Biogeochem. Cy., 17, 1099, https://doi.org/10.1029/2003gb002040, 2003.
Tobiszewski, M. and Namiesnik, J.: PAH diagnostic ratios for the identification of pollution emission sources, Environ. Pollut., 162, 110–119, https://doi.org/10.1016/j.envpol.2011.10.025, 2012.
Tsay, S.-C., Maring, H. B., Lin, N.-H., Buntoung, S., Chantara, S., Chuang, H.-C., Wiriya, W., Yen, M.-C., Pani, S. K., Pantina, P., Sayer, A. M., Tao, W.-K., Wang, S.-H., Welton, E. J., Lau, W. K. M., Lee, C.-T., Lee, J., Loftus, A. M., Nguyen, A. X., Nguyen, C. M., Gabriel, P. M., Goodloe, C. S., Holben, B. N., Hsiao, T.-C., Hsu, N. C., and Janjai, S.: Satellite-Surface Perspectives of Air Quality and Aerosol-Cloud Effects on the Environment: An Overview of 7-SEAS/BASELInE, Aerosol Air Qual. Res., 16, 2581–2602, https://doi.org/10.4209/aaqr.2016.08.0350, 2016.
Turpin, B. J. and Huntzicker, J. J.: Identification of secondary organic aerosol episodes and quantitation of primary and secondary organic aerosol concentrations during SCAQS, Atmos. Environ., 29, 3527–3544, 1995.
Vicente, E. D., Vicente, A. M., Bandowe, B. A. M., and Alves, C. A.: Particulate phase emission of parent polycyclic aromatic hydrocarbons (PAHs) and their derivatives (alkyl-PAHs, oxygenated-PAHs, azaarenes and nitrated PAHs) from manually and automatically fired combustion appliances, Air Qual. Atmos. Hlth., 9, 653–668, 2016.
VNMHA and Empa: Hourly averages of O3 concentrations at Pha Din, Vietnam,Viet Nam Meteorological and Hydrological Administration (VNMHA) and Swiss Federal Laboratories for Materials Science and Technology (Empa), World Data Centre for Reactive Gases, available at: http://ebas.nilu.no/DataSets.aspx?stations=VN0001R&nations=VN704VNM&components=ozone&matrices=air&fromDate=1970-01-01&toDate=2021-12-31, last access: 15 February 2021a.
VNMHA and Empa: Hourly averages of CO2, CH4, and CO concentrations at Pha Din, Vietnam,Viet Nam Meteorological and Hydrological Administration (VNMHA) and Swiss Federal Laboratories for Materials Science and Technology (Empa), World Data Centre for Greenhouse Gases, available at: https://gaw.kishou.go.jp/search/station#PDI, last access: 15 February 2021b.
Walgraeve, C., Demeestere, K., Dewulf, J., Zimmermann, R., and Van Langenhove, H.: Oxygenated polycyclic aromatic hydrocarbons in atmospheric particulate matter: Molecular characterization and occurrence, Atmos. Environ., 44, 1831–1846, 2010.
Wan, X., Kang, S., Li, Q., Rupakheti, D., Zhang, Q., Guo, J., Chen, P., Tripathee, L., Rupakheti, M., Panday, A. K., Wang, W., Kawamura, K., Gao, S., Wu, G., and Cong, Z.: Organic molecular tracers in the atmospheric aerosols from Lumbini, Nepal, in the northern Indo-Gangetic Plain: influence of biomass burning, Atmos. Chem. Phys., 17, 8867–8885, https://doi.org/10.5194/acp-17-8867-2017, 2017.
Wang, G., Kawamura, K., Xie, M., Hu, S., Cao, J., An, Z., Waston, J. G., and Chow, J. C.: Organic molecular compositions and size distributions of chinese summer and autumn aerosols from nanjing: characteristic haze event caused by wheat straw burning, Environ. Sci. Technol., 43, 6493–6499, https://doi.org/10.1021/es803086g, 2009.
Wang, H., Gao, Y., Wang, S., Wu, X., Liu, Y., Li, X., Huang, D., Lou, S., Wu, Z., Guo, S., Jing, S., Li, Y., Huang, C., Tyndall, G. S., Orlando, J. J., Zhang, X.: Atmospheric Processing of Nitrophenols and Nitrocresols From Biomass Burning Emissions, J. Geophys. Res.-Atmos., 125, e2020JD033401, https://doi.org/10.1029/2020JD033401, 2020.
Yen, M.-C., Peng, C.-M., Chen, T.-C., Chen, C.-S., Lin, N.-H., Tzeng, R.-Y., Lee, Y.-A., and Lin, C.-C.: Climate and weather characteristics in association with the active fires in northern Southeast Asia and spring air pollution in Taiwan during 2010 7-SEAS/Dongsha Experiment, Atmos. Environ., 78, 35–50, https://doi.org/10.1016/j.atmosenv.2012.11.015, 2013.
Yokelson, R. J., Andreae, M. O., and Akagi, S. K.: Pitfalls with the use of enhancement ratios or normalized excess mixing ratios measured in plumes to characterize pollution sources and aging, Atmos. Meas. Tech., 6, 2155–2158, https://doi.org/10.5194/amt-6-2155-2013, 2013.
Zhang, Z., Gao, J., Engling, G., Tao, J., Chai, F., Zhang, L., Zhang, R., Sang, X., Chan, C.-Y., and Lin, Z. J.: Characteristics and applications of size-segregated biomass burning tracers in China's Pearl River Delta region, Atmos. Environ., 102, 290–301, 2015.
Zhong, M. and Jang, M.: Dynamic light absorption of biomass-burning organic carbon photochemically aged under natural sunlight, Atmos. Chem. Phys., 14, 1517–1525, https://doi.org/10.5194/acp-14-1517-2014, 2014.