the Creative Commons Attribution 4.0 License.
the Creative Commons Attribution 4.0 License.
 | 27 May 2021
Pollution trace gases C2H6, C2H2, HCOOH, and PAN in the North Atlantic UTLS: observations and simulations
Felix Friedl-Vallon
Norbert Glatthor
Jens-Uwe Grooß
Thomas Gulde
Michael Höpfner
Sören Johansson
Farahnaz Khosrawi
Oliver Kirner
Anne Kleinert
Erik Kretschmer
Guido Maucher
Hans Nordmeyer
Hermann Oelhaf
Johannes Orphal
Christof Piesch
Björn-Martin Sinnhuber
Jörn Ungermann
Bärbel Vogel
Measurements of the pollution trace gases ethane (C2H6), ethyne (C2H2), formic acid (HCOOH), and peroxyacetyl nitrate (PAN) were performed in the North Atlantic upper troposphere and lowermost stratosphere (UTLS) region with the airborne limb imager GLORIA (Gimballed Limb Observer for Radiance Imaging of the Atmosphere) with high spatial resolution down to cloud top. Observations were made during flights with the German research aircraft HALO (High Altitude and LOng Range Research Aircraft) in the frame of the WISE (Wave-driven ISentropic Exchange) campaign, which was carried out in autumn 2017 from Shannon (Ireland) and Oberpfaffenhofen (Germany). Enhanced volume mixing ratios (VMRs) of up to 2.2 ppbv C2H6, 0.2 ppbv C2H2, 0.9 ppbv HCOOH, and 0.4 ppbv PAN were detected during the flight on 13 September 2017 in the upper troposphere and around the tropopause above the British Isles. Elevated quantities of PAN were measured even in the lowermost stratosphere (locally up to 14 km), likely reflecting the fact that this molecule has the longest lifetime of the four species discussed herein. Backward trajectory calculations as well as global three-dimensional Chemical Lagrangian Model of the Stratosphere (CLaMS) simulations with artificial tracers of air mass origin have shown that the main sources of the observed pollutant species are forest fires in North America and anthropogenic pollution in South Asia and Southeast Asia uplifted and moved within the Asian monsoon anticyclone (AMA) circulation system. After release from the AMA, these species or their precursor substances are transported by strong tropospheric winds over large distances, depending on their particular atmospheric lifetime of up to months. Observations are compared to simulations with the atmospheric models EMAC (ECHAM5/MESSy Atmospheric Chemistry) and CAMS (Copernicus Atmosphere Monitoring Service). These models are qualitatively able to reproduce the measured VMR enhancements but underestimate the absolute amount of the increase. Increasing the emissions in EMAC by a factor of 2 reduces the disagreement between simulated and measured results and illustrates the importance of the quality of emission databases used in chemical models.
- Article
(17997 KB) - Full-text XML
- BibTeX
- EndNote


Organic compounds in the troposphere like ethane, ethyne, formic acid, and secondary (not directly emitted) pollutants like peroxyacetyl nitrate are involved in many atmospheric processes. These pollutants can be transported into remote regions due to their long lifetime under appropriate atmospheric conditions. In particular, rapid vertical transport by deep convection followed by strong horizontal transport associated with the upper troposphere subtropical jet stream is a particularly efficient means by which surface pollutants can be transported long distances (e.g. Lu et al., 2019; Alvarado et al., 2020). At these altitudes, such hydrocarbons and nitrogen-containing substances (like peroxyacetyl nitrate) may also influence the amount of ozone. This is important because ozone is known to be an effective greenhouse gas in the upper troposphere and lowermost stratosphere (UTLS) region since it largely influences the radiation budget around the tropopause (de Forster and Shine, 1997; Hansen et al., 1997; Xie et al., 2008; Riese et al., 2012).
Tropospheric emissions of ethane (C2H6), the most important non-methane hydrocarbon (NMHC) constituent of natural gas, are connected with biomass burning and natural gas losses (Rudolph, 1995; Singh et al., 2001). The production of fossil fuels together with biofuel use also are important sources of this molecule (Xiao et al., 2008). It is removed from the atmosphere by reaction with the hydroxyl (OH) radical (Xiao et al., 2008). The mean lifetime of C2H6 is about 2 months (Rudolph, 1995), enabling it to be transported far away from its source regions.
The trace gas ethyne (C2H2) is emitted into the troposphere by combustion of biofuels and fossil fuels, as well as biomass burning (Xiao et al., 2007). As in the case of C2H6, the reaction with the OH radical is also responsible for the loss of C2H2 in the atmosphere. The mean lifetime of C2H2 is shorter compared to the one of C2H6 and amounts to about 2 weeks (Xiao et al., 2007) but still allows for long-range transport of this species.
Formic acid (HCOOH) has many different sources. Direct emissions from plants, biomass burning, and fossil fuel combustion are important contributors to the tropospheric abundances of this molecule (Mungall et al., 2018). A secondary photochemical formation takes place from anthropogenic and biogenic precursors (Yuan et al., 2015) such as the oxidation of volatile organic compounds (Khare et al., 1999). The loss of HCOOH is possible due to wet and dry deposition as well as oxidation with the OH radical (Paulot et al., 2011). The atmospheric mean lifetime of HCOOH is very variable and ranges from 1 or 2 d in the boundary layer up to a few weeks in the free troposphere (Millet et al., 2015).
The molecule peroxyacetyl nitrate (CH3COO2NO2), commonly named as PAN, is formed via a three-body reaction of peroxyacetyl (CH3COO2) with nitrogen dioxide (NO2) and a third partner M (mainly N2 or O2):
The reverse reaction of (R1) is the thermal decomposition of PAN and defines the main loss of this molecule in the atmosphere (Fischer et al., 2014) while photolysis becomes dominant in the UTLS region (Fadnavis et al., 2014). Two minor loss processes of PAN are reactions with OH and dry deposition (Fischer et al., 2014). The mean atmospheric lifetime of PAN is very variable since it is strongly dependent on the ambient temperature. While the mean lifetime amounts to only 1 h at temperatures of 298 K, it rises up to a few months under cold upper tropospheric conditions (Singh, 1987; Fischer et al., 2014). Hence, enhanced PAN amounts (which serve as an NO2 reservoir) can be transported over wide geographical regions in the middle and upper troposphere. Thus, NO2 released by the backward reaction of (R1) may contribute to an increase of tropospheric ozone far away from the PAN sources (Singh, 1987; Fadnavis et al., 2014; Ungermann et al., 2016).
Scientific flights of the airborne limb imager GLORIA (Gimballed Limb Observer for Radiance Imaging of the Atmosphere; Friedl-Vallon et al., 2014; Riese et al., 2014) were carried out aboard HALO (High Altitude and LOng Range Research Aircraft) during the WISE (Wave-driven ISentropic Exchange) campaign in autumn 2017 above the North Atlantic. This atmospheric region is characterized by intense dynamical activity reflected in complex structures like tropopause folds and air masses of different origins. Tropospheric pollutants like C2H6, C2H2, HCOOH, and PAN were observed together with stratospheric trace gases like O3 in the UTLS region with high temporal and spatial resolution. An important goal of these measurements was to identify possible atmospheric regions with enhanced amounts of these pollutant trace gases far away from the emission locations. A description of the GLORIA instrument, data analysis, and chemical modelling are given in Sect. 2. A discussion of observed vertical volume mixing ratio (VMR) profiles of trace species follows in Sect. 3 together with a comparison of the measured data to simulations of the chemistry climate model EMAC (ECHAM5/MESSy Atmospheric Chemistry) and to assimilated data of CAMS (Copernicus Atmosphere Monitoring Service). A discussion on the possible origin of air masses at the Earth's boundary layer detected by GLORIA is also included in this section.
In the following subsections, we give an overview of the GLORIA instrument and the flights with the HALO aircraft, together with the corresponding data analysis and a description of atmospheric modelling performed for this study.
2.1 GLORIA instrument and HALO flights
The cryogenic Fourier transform limb emission spectrometer GLORIA operates in the thermal infrared spectral region between about 7 and 13 µm using a two-dimensional detector array observing 128 vertical and 48 horizontal interferograms per measurement (Friedl-Vallon et al., 2014; Riese et al., 2014, and references therein). The interferograms are Fourier transformed into the spectral domain and radiometrically calibrated using in-flight measurements of two black bodies (Kleinert et al., 2014). Furthermore, spectra in the horizontal direction were averaged to improve the signal-to-noise ratio such that the noise equivalent spectral radiance (NESR) finally amounts to about W (cm2 sr cm. Spectra recorded with maximum optical path difference of 8.0 cm, which corresponds to an un-apodized spectral resolution of 0.0625 cm−1, were used for this study. These so-called chemistry mode spectra are apodized with the Norton and Beer (1976) “strong” function. Due to the high spectral resolution, these measurements allow for the retrieval of many species with minor contribution to the spectra by the separation of individual spectral lines from continuum-like emissions. A comprehensive description of technical details of the GLORIA instrument is given by Friedl-Vallon et al. (2014) and Riese et al. (2014).
In this study, we report results from the WISE aircraft campaign, which was dedicated mainly to the investigation of dynamical processes and the evolution of air masses within the context of stratosphere–troposphere exchange. Sixteen flights with HALO were performed from Shannon (Ireland) and Oberpfaffenhofen (Germany) between 31 August and 21 October 2017, in a region within about 40∘ W and 15∘ E longitude and 40 and 75∘ N latitude. In the following sections, we focus on results of the flight on 13 September 2017 where strong enhancements in the VMR of the pollutant species C2H6, C2H2, HCOOH, and PAN were observed by GLORIA. Figure 1 shows the flight path consisting of two main legs together with tangent points of GLORIA where the instrument was operated in the chemistry mode.
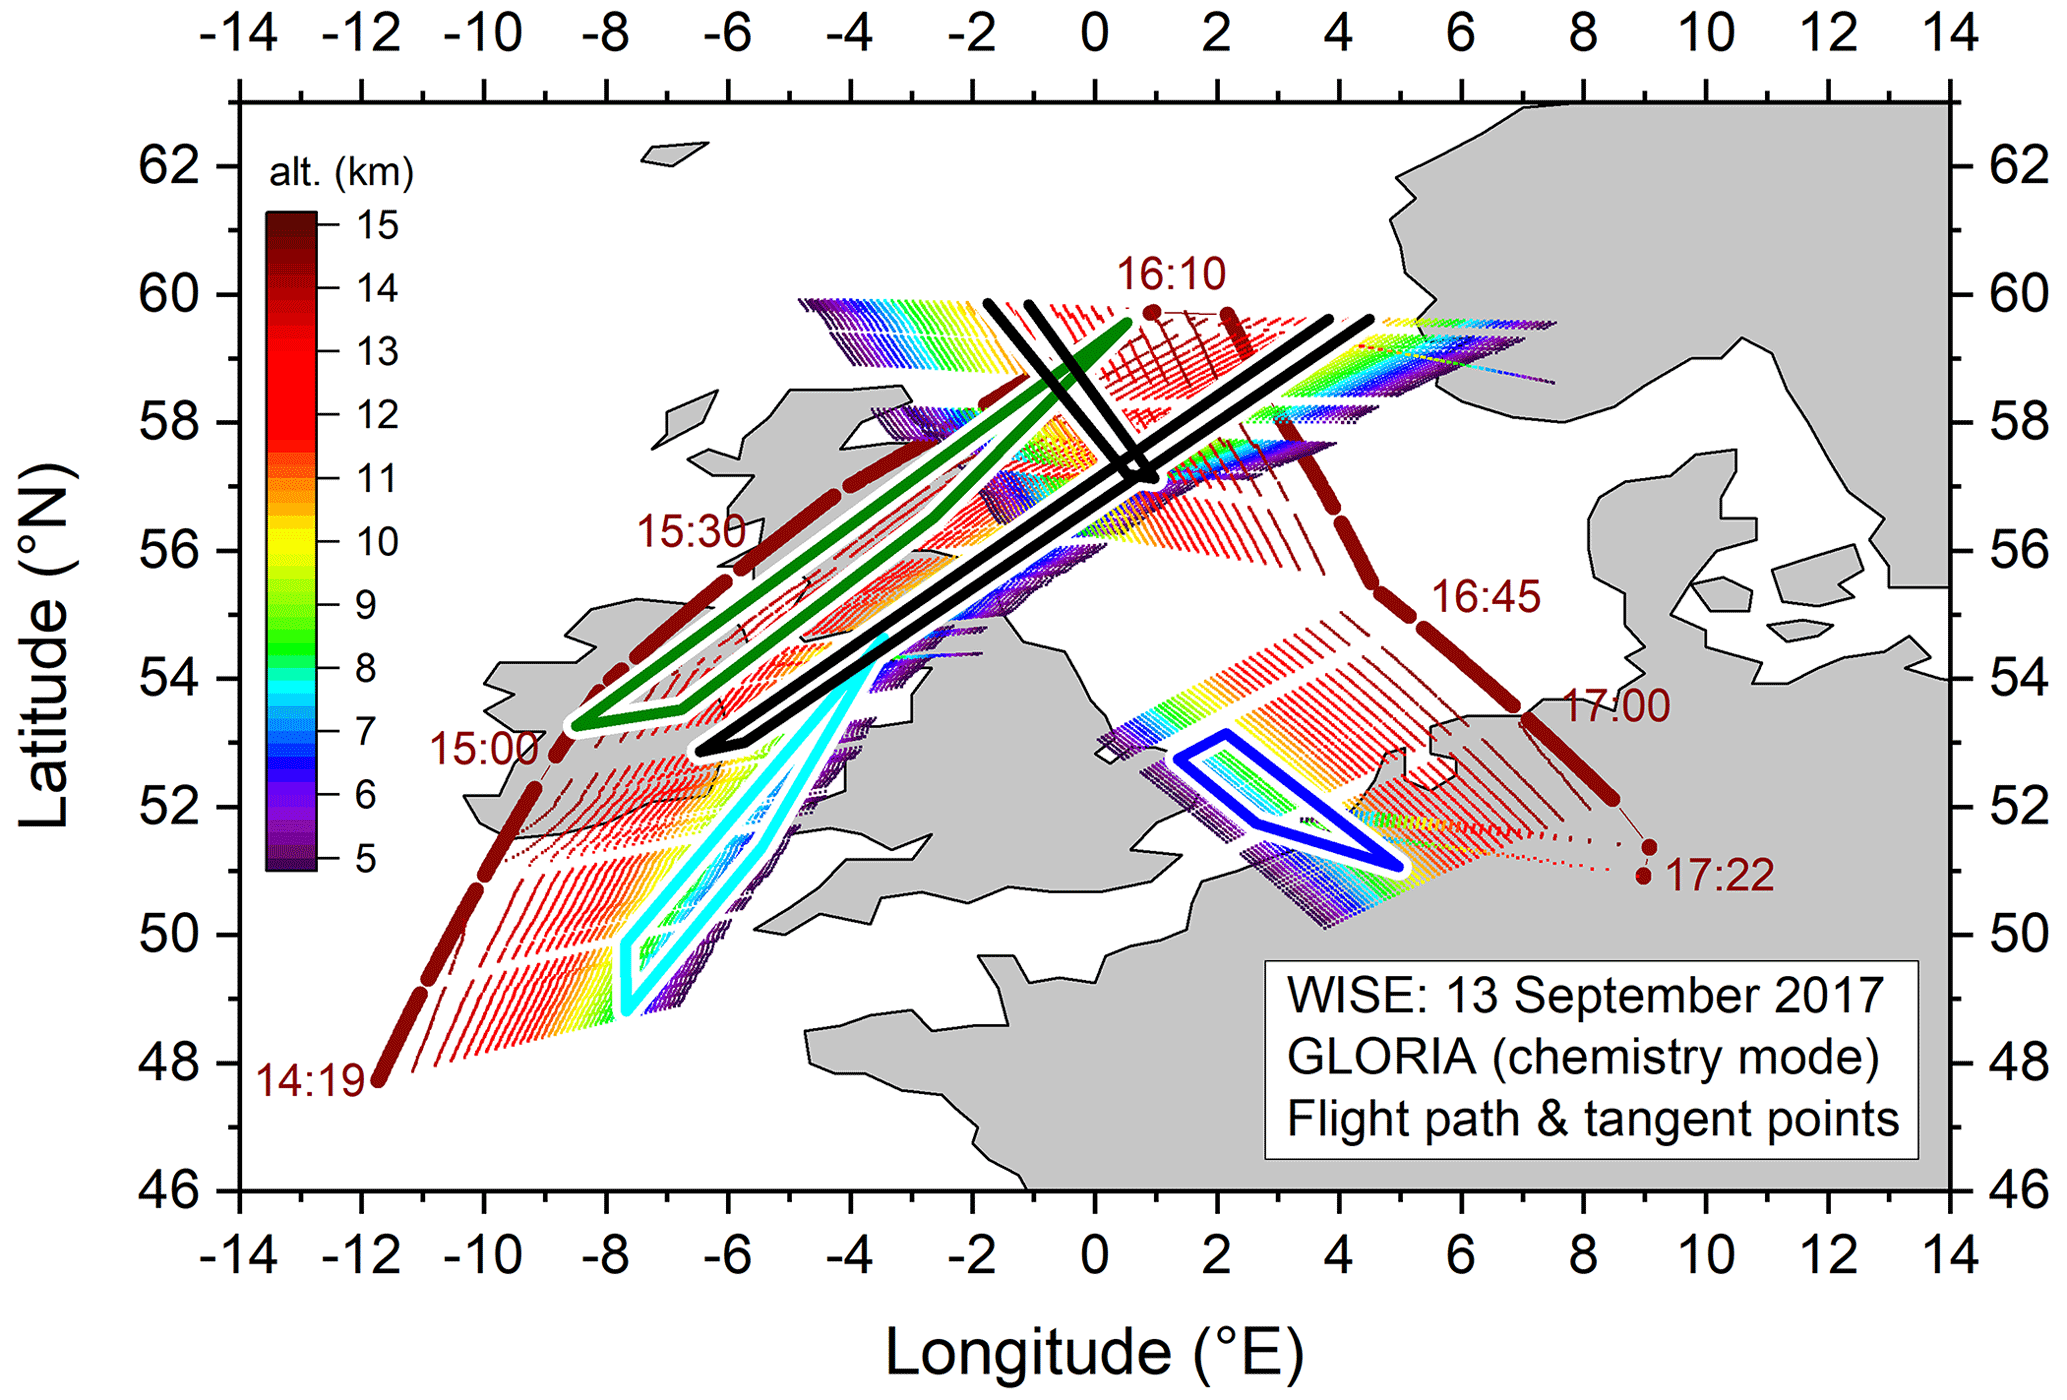
Figure 1Path of the HALO flight on 13 September 2017 during the WISE campaign (large dark brown points) together with GLORIA tangent points (small points with changing colour according to altitude). Measurement times are given in coordinated universal time (UTC). Coloured framed zones mark areas of special interest as discussed in Sect. 3. Note that only observations performed in the chemistry mode are shown.
2.2 Data analysis of measured spectra
Radiances are calculated with the Karlsruhe Optimized and Precise Radiative transfer Algorithm (KOPRA; Stiller et al., 2002) based on spectroscopic parameters from the high-resolution transmission molecular absorption database (HITRAN; Gordon et al., 2017). The retrieval itself is performed with the procedure KOPRAFIT (Höpfner et al., 2002) using derivatives of the radiance spectrum with respect to atmospheric state and instrument parameters (Jacobians) calculated by KOPRA. The inverse problem of radiative transfer is solved by KOPRAFIT with a Gauss–Newton iterative method (Rodgers, 2000) in combination with a Tikhonov–Phillips regularization approach (Phillips, 1962; Tikhonov, 1963) using a constraint with respect to a first derivative of the a priori profile of the target species. A detailed description of the general retrieval process together with the validation of major species (e.g. O3, HNO3, and ClONO2) observed by GLORIA is given by Johansson et al. (2018).
In a first step cloud-affected spectra are filtered out using a cloud index as described in Spang et al. (2004). Spectra with a colour ratio of the mean radiance in two spectral windows (788.20–796.25 and 832.30–834.40 cm−1) larger than 2 were chosen for the retrieval process. Prior to the trace gas retrievals, the pointing elevation angle was retrieved to compensate for systematic misalignment of the line of sight (LOS) of the instrument according to the method described in Johansson et al. (2018). The final pointing (LOS) error was estimated to 0.01∘. Vertical profiles of atmospheric species were taken from a climatological atmosphere (Remedios et al., 2007), updated with surface concentration data from NOAA ESRL GMD (National Oceanic and Atmospheric Administration, Earth System Research Laboratory, Global Monitoring Division; Montzka et al., 1999). Subsequently, a temperature retrieval was carried out using pressure–temperature a priori data from the European Centre for Medium-Range Weather Forecasts (ECMWF), which was interpolated to the GLORIA vertical retrieval grid. Spectral windows around 811 and 957 cm−1 containing appropriate CO2 transitions were used for this analysis. The total error of the temperature retrieval calculations is estimated to about 1.5 K (Johansson et al., 2018).
The spectral analysis of the target species C2H6, C2H2, HCOOH, and PAN is impeded by overlapping features of so-called disturbing gases in the corresponding spectral region. Hence, the retrieval of these pollution trace gases is more challenging compared to the species discussed in Johansson et al. (2018). A careful selection of appropriate microwindows is essential to perform retrievals of these pollutants with good accuracy. Test retrievals were used to identify microwindows that combine limited overlap of spectral signatures of disturbing gases with a high sensitivity to changes in the abundance of target gases. Main interfering species were either adjusted simultaneously together with the target molecule or pre-fitted in a different spectral interval.
The analysis of C2H6 was performed in four microwindows within the ν9 band between 819 and 833 cm−1 (see Fig. 2a). Many overlapping features of so-called disturbing gases are visible in this spectral region: first of all H2O and CO2. The error budget of C2H6 is shown in Fig. 2b. At higher altitudes with low C2H6 values, the total error of this molecule is dominated by the temperature error. Lower down in the VMR maximum region, the systematic spectroscopic error of C2H6 (as given in HITRAN) governs the error budget. The total error of C2H6 remains within about 15 % in the altitude region of the upper troposphere.

Figure 2Simulated limb emission spectra (with spectral resolution of GLORIA) for a mid-latitude summer standard atmosphere (Remedios et al., 2007) in four microwindows in the spectral region of the C2H6 ν9 band centred at 822 cm−1 for a tangent altitude of 8 km. Emissions of individual species contributing to the combined spectrum (all molecules, black line) are shown (a). Retrieved C2H6 VMR vertical profile (and a priori profile) of the limb sequence measured at 13 September 2017 at 16:55 UTC combined with absolute and relative errors and the altitude resolution (Alt. reso.), determined from the full width at half maximum of the rows of the averaging kernel matrix, together with the observer altitude (zobs). The following individual 1σ errors are shown: spectral noise (red solid line), temperature (green dashed line), line of sight (LOS; blue dotted line), field of view (FOV; dark yellow short dash dotted line), spectroscopic data of disturbing gases (cyan dash dotted line), spectroscopic data of target molecule C2H6 (dash dotted magenta line), and total error (solid black line) (b).
Retrieval calculations of C2H2 were carried out in the R-branch region of the ν5 band. Figure 3a shows spectral contributions of relevant species in four microwindows between 759 and 781 cm−1 that have been found most appropriate to derive C2H2 from GLORIA spectra. The corresponding retrieval error budget of C2H2 is given in Fig. 3b. The random noise error is dominating the budget over nearly the complete altitude range. The total error of C2H2 stays within 10 %–15 % in the region of the VMR maximum in the upper troposphere.

Figure 3Simulated limb emission spectra for four microwindows within the C2H2 ν5 band centred at 730 cm−1 for a tangent altitude of 8 km (a) and the error budget for a C2H2 vertical profile obtained on 13 September 2017 at 16:55 UTC (b). Annotation as per Fig. 2.
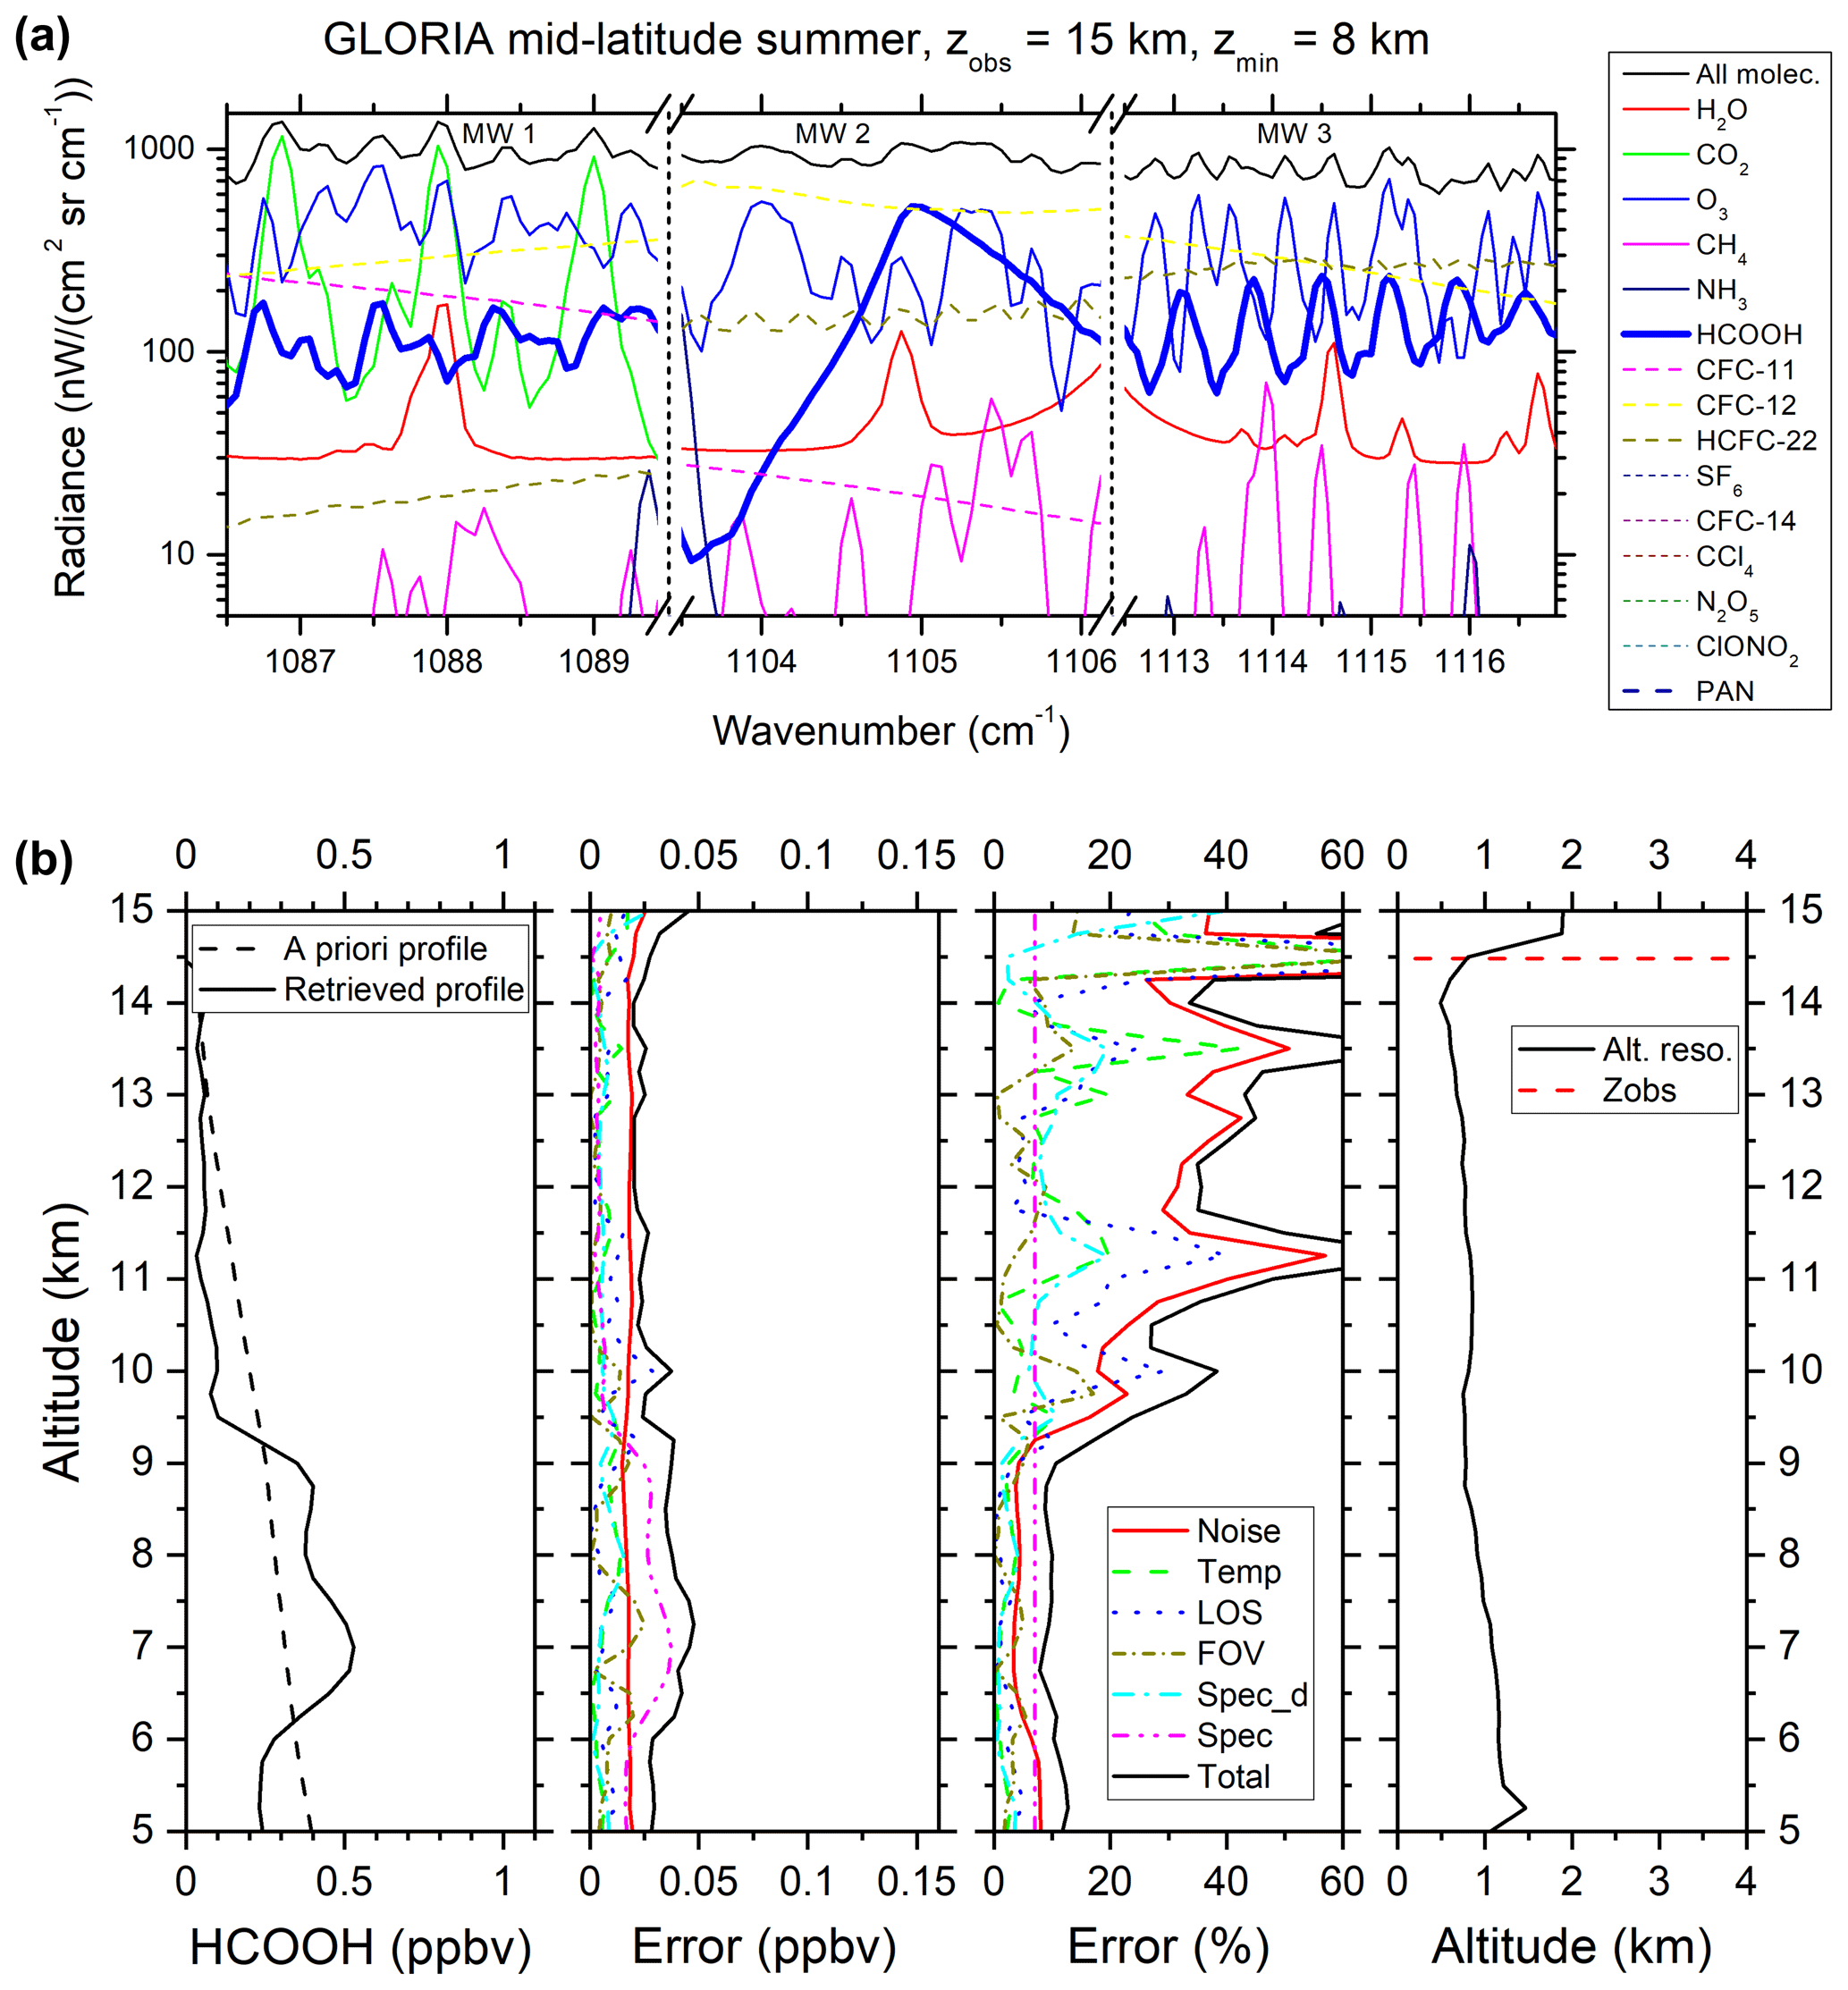
Figure 4Simulated limb emission spectra for three microwindows within the HCOOH ν6 band centred near 1105 cm−1 for a tangent altitude of 8 km (a) and the error budget for a HCOOH vertical profile obtained on 13 September 2017 at 16:55 UTC (b). Annotation as per Fig. 2.
The analysis of the molecule HCOOH was performed in the spectral range between 1086 and 1117 cm−1 (see Fig. 4a). Three microwindows were chosen including the strong Q-branch of the HCOOH ν6 vibrational band. The spectral region is dominated by spectral features due to O3, CO2, CFC-12, and HCFC-22 transitions. The spectroscopic part of the total error is dominant in the altitude region of the HCOOH VMR maximum in the upper troposphere (see Fig. 4b). Here, the total HCOOH error stays within 10 %. Apart from this altitude region, the error budget is governed by the random noise part and the total error increases significantly (mainly in the upper part of the profile with low HCOOH values).
The retrieval of PAN was conducted in two broad microwindows of the ν16 band between 780 and 805 cm−1 (see Fig. 5a). The spectral gap between these microwindows was chosen such that the strong CO2 Q-branch at 792 cm−1 was excluded from the data analysis. Besides CO2, the molecules H2O and CCl4 are the main interfering species in the spectral region of PAN. The retrieval error budget is depicted in Fig. 5b. Besides random noise, further error sources like inaccuracies in the FOV and the retrieved temperature profile contribute to the total PAN error that remains within 10 % in altitude regions with enhanced PAN amounts.
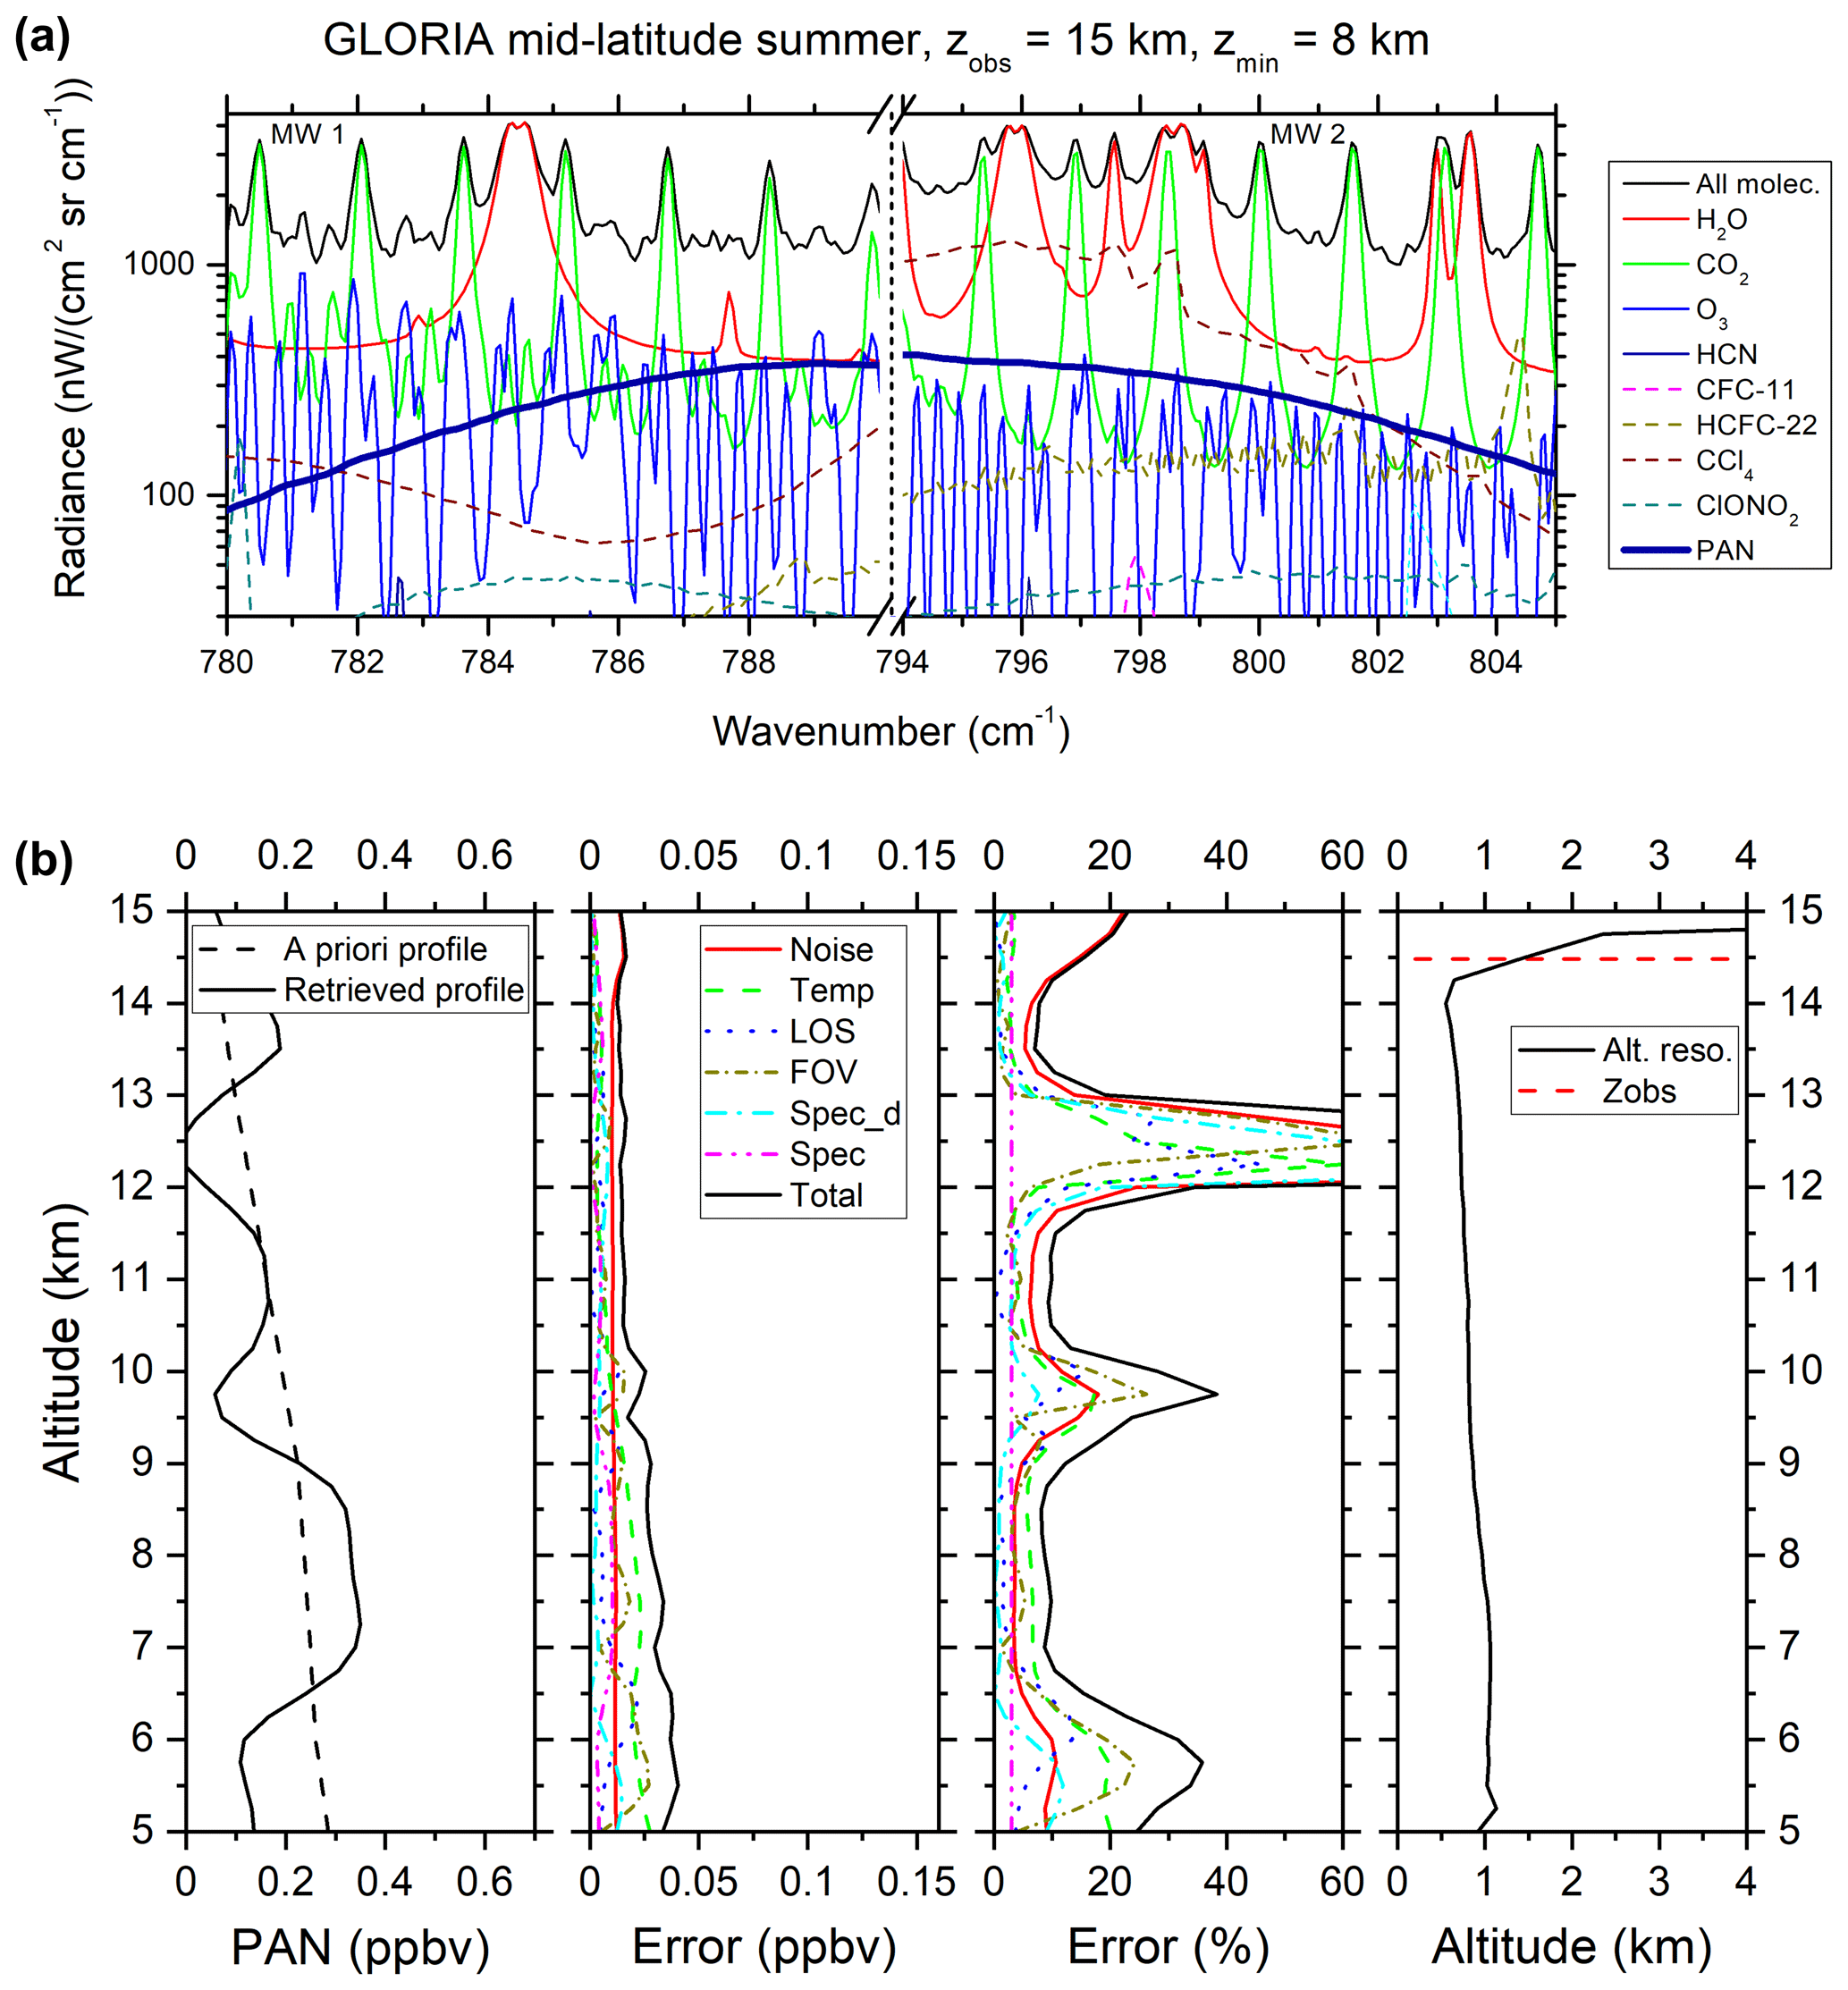
Figure 5Simulated limb emission spectra for two microwindows within the PAN ν16 band centred near 792 cm−1 for a tangent altitude of 8 km (a) and the error budget for a PAN vertical profile obtained on 13 September 2017 at 16:55 UTC (b). Annotation as per Fig. 2.
Besides the retrieval of the above-mentioned pollutant gases, the tracer species ozone was also inferred from the recorded spectra. Many spectral ozone lines are available in the mid-infrared spectral region. Transitions between 780 and 788 cm−1 within the ν2 band were chosen for the retrieval process similar to the method described in Johansson et al. (2018). The total ozone error is within 10 % with a vertical resolution of 0.3 to 1.5 km.
The altitude resolution of all retrievals, calculated from the full width at half maximum of the rows of the averaging kernel matrix, was used as an a posteriori quality filtering of the retrieved data. Only vertical profile parts with an altitude resolution of better than 2 km were finally used for the data interpretation.
2.3 Model simulations
2.3.1 EMAC
Retrieved vertical profiles of trace species are compared to a multi-year simulation of the chemistry climate model ECHAM5/MESSy Atmospheric Chemistry (EMAC). This Eulerian model includes submodels describing tropospheric and middle atmosphere processes (Jöckel et al., 2010). The core model is the fifth generation European Centre Hamburg general circulation model (ECHAM5; Roeckner et al., 2006) that is connected to the submodels using the interface Modular Earth Submodel System (MESSy). For the present study we applied EMAC (ECHAM5 version 5.3.02, MESSy version 2.53) with a spherical truncation of T106 (corresponding to a resolution of approximately 1.125∘ by 1.125∘ in latitude and longitude) with 90 hybrid pressure levels from the ground up to 0.01 hPa. Meteorological data fields are specified using a Newtonian relaxation technique of the surface pressure and prognostic variables below 1 hPa with the ECMWF reanalysis ERA-Interim (Dee et al., 2011). The simulation was initialized on 1 May 2017 and includes a comprehensive chemistry setup from the troposphere to the lower mesosphere. Rate constants of gas-phase reactions originate from Atkinson et al. (2007) and Sander et al. (2011). Photochemical reactions of precursor substances important for the build-up of the species PAN (Fischer et al., 2014) were integrated into the model setup. For surface emissions of non-methane volatile organic compounds (NMVOCs), a data set of the MACCity emission inventory (MACC/CityZEN; Granier et al., 2011), and ACCMIP (Atmospheric Chemistry and Climate Model Intercomparison Project; Lamarque et al., 2013) was used. Emission sources from biomass burning; agricultural waste burning; fossil fuels; and ship, road, and aircraft, as well as biogenic, emissions are considered. For the simulated year 2017, most recent available emissions of 2010 are repeated. In addition to this EMAC standard run, a second model simulation (called EMAC_2) was performed using NMVOC emissions enhanced by a factor of 2 as recommended by Monks et al. (2018). The model output data were saved every 5 h during the time period of the GLORIA observations. The model output to the GLORIA measurements was interpolated in time and space to the observation geolocations.
2.3.2 CAMS
The Copernicus Atmosphere Monitoring Service (CAMS) produced by ECMWF is a reanalysis data set that produces continuous data on atmospheric composition (Inness et al., 2019). The Integrated Forecast System (IFS) of ECMWF was integrated to allow for the data assimilation and modelling of aerosols, chemically reactive species, and greenhouse gases. Apart from assimilated ozone, no stratospheric chemistry is simulated by the model system. In this study, CAMS reanalyses were used with a horizontal resolution of about 80 km. The vertical resolution consists of 60 pressure levels up to 0.1 hPa. Three-dimensional model output fields are available every 3 h. Detailed information on the CAMS model architecture is given by Inness et al. (2019). An evaluation study of CAMS using aircraft observations was carried out by Wang et al. (2020). Biases of assimilated species like ozone are found to be less than 20 %, whereas discrepancies for gases like C2H6 and PAN are generally larger.
In this section, vertical profiles retrieved from GLORIA measurements during the WISE campaign on 13 September 2017 over the North Atlantic region are shown. Observed GLORIA chemistry mode data are compared to EMAC and CAMS simulation results. The possible origin of air masses detected by GLORIA is also discussed.
3.1 GLORIA measurements
Retrieved volume mixing ratios of C2H6, C2H2, HCOOH, and PAN together with O3 inferred from limb emission spectra during the WISE flight on 13 September 2017 are displayed in Fig. 6. Ozone is a molecule with highest concentrations in the stratosphere (Brasseur and Solomon, 2005). Hence, it can be used as a tracer to diagnose detected air masses whether they are of stratospheric or tropospheric origin. The general shape of O3 VMR is strongly correlated with the tropopause as shown in Fig. 6a. There are two regions where stratospheric air comes down to about 7 km (around 14:45 and around 16:50 UTC). Here, the tropopause layer reaches these low altitudes in the form of a stratospheric intrusion, while at the beginning and the end of the measurement phase the troposphere extends up to about 12 km. Trajectory calculations have shown that, due to a west-southwesterly mid- and upper tropospheric air flow in the region of the flight path shown in Fig. 1, GLORIA has sounded virtually the same air mass twice, yielding to a kind of symmetry in the horizontal trace gas distribution before and after 16:10 UTC. Measured stratospheric ozone volume mixing ratios are within 0.1 and 0.8 ppmv. These values are in line with other mid-latitude remote sensing and in situ observations performed in this altitude range (e.g. Cortesi et al., 2007; Livesey et al., 2008; Bourgeois et al., 2020).
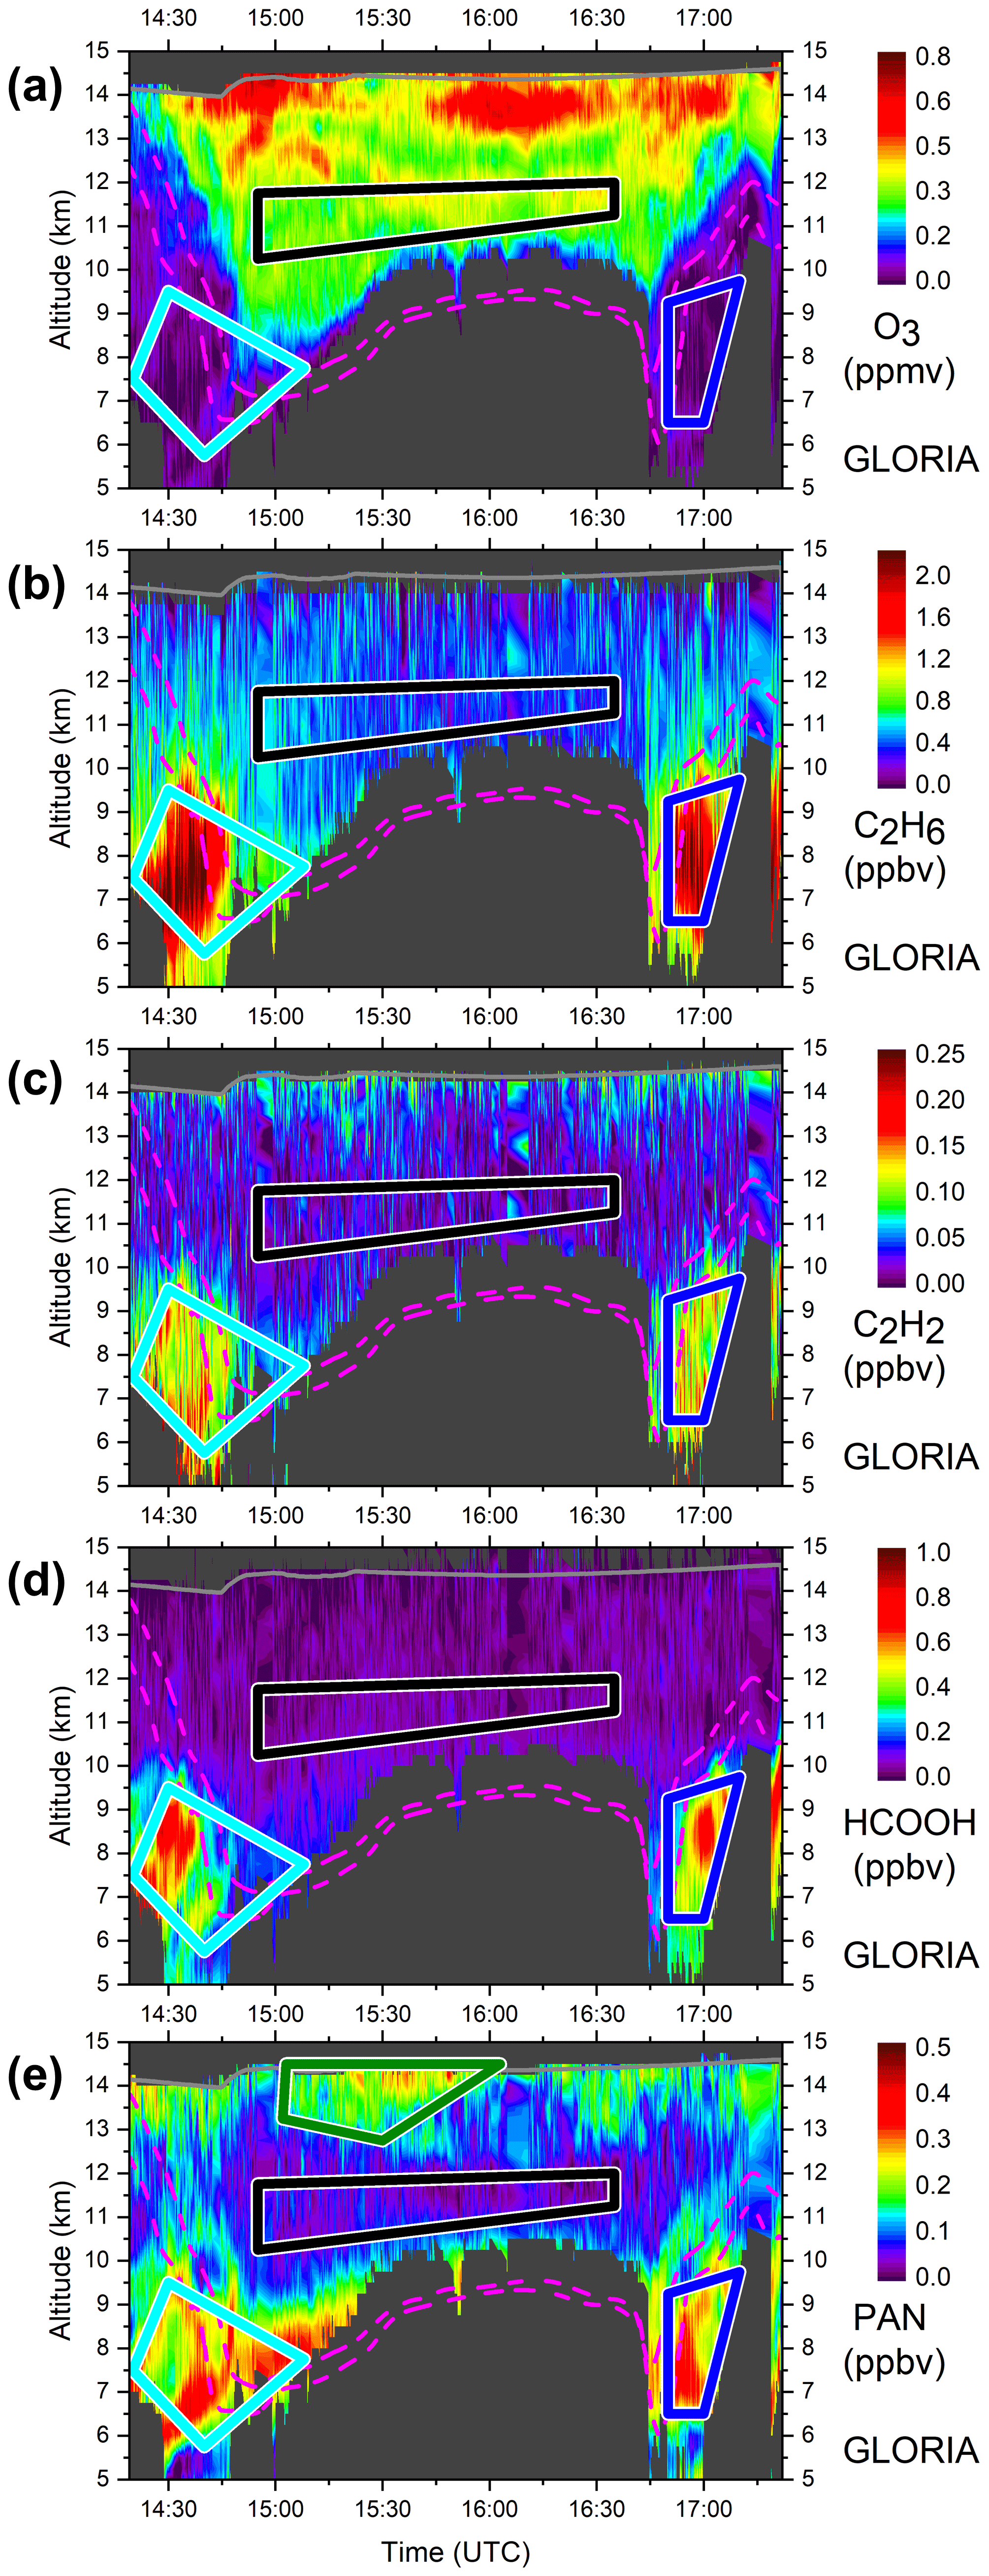
Figure 6Horizontal and vertical VMR distributions of (a) O3, (b) C2H6, (c) C2H2, (d) HCOOH, (e) PAN as seen by GLORIA above the North Atlantic region on 13 September 2017. Flight altitude is shown as grey line; dynamical tropopause (2 and 4 potential vorticity units from ECMWF) is plotted as dashed magenta lines. Cyan, blue, and green (only PAN) boxes mark regions with enhanced VMR levels (for pollutant species not for O3); black boxes comprise a region with low mixing ratios. For all these boxes, backward trajectories are calculated (see discussion in Sect. 3).
Measured concentrations of the species C2H6 are shown in Fig. 6b. The VMR distribution of C2H6 is in parts anti-correlated to the one of ozone. Two regions of stronger enhanced VMR up to about 2.2 ppbv can be seen in the upper troposphere at the beginning and at the end of the measurement period over the region south of Ireland and near the coastline of the Netherlands and Belgium. In the stratosphere, no stronger enhanced C2H6 VMR levels are visible and values remain below about 0.6 ppbv, which can be confirmed by mid-latitude satellite observations (Rinsland et al., 2005; Glatthor et al., 2009; Wiegele et al., 2012). For instance, up to about 1.7 ppbv C2H6 was observed by the Atmospheric Chemistry Experiment (ACE) instrument in the mid-latitude upper troposphere, but with less spatial resolution compared to GLORIA. In addition, in situ aircraft measurements recorded C2H6 amounts of more than 2 ppbv in the mid-latitude upper troposphere (Rudolph, 1995; Monks et al., 2018, and references therein) in accordance with the high values seen by GLORIA.
The same behaviour as seen for C2H6 is present in the vertical and horizontal distribution of C2H2 amounts (see Fig. 6c). Elevated volume mixing ratios of up to 0.2 ppbv in the upper troposphere are clearly visible at the beginning and close to the end of the observation period. In the stratosphere, measured C2H2 values appear noisy and stay clearly below 0.1 ppbv most of the time. C2H2 VMR measured by GLORIA lies within the range of satellite (Rinsland et al., 2005; Wiegele et al., 2012) and aircraft in situ data (Xiao et al., 2007, and references therein) obtained in the same altitude region at mid-latitudes with values of up to 0.45 ppbv as seen by the Michelson Interferometer for Passive Atmospheric Sounding (MIPAS) instrument under biomass burning conditions in October 2007 (Wiegele et al., 2012).
Measured HCOOH volume mixing ratios are depicted in Fig. 6d. As in the case of the previously mentioned species C2H6 and C2H2, large amounts of HCOOH are also visible at high altitudes in the troposphere during early and late times of the GLORIA observations with values up to 0.9 ppbv. Comparable amounts were seen by airborne in situ measurements in the mid-latitude upper troposphere (Reiner et al., 1999; Singh et al., 2000) with VMR maxima of up to 0.6 ppbv. Very high upper-tropospheric HCOOH mixing ratios of 3.1 ppbv and 2.0 ppbv were observed by the space-borne ACE Fourier transform spectrometer in two preceding years in austral spring (Rinsland et al., 2006). In contrast, stratospheric HCOOH values are low and not higher than 0.1 ppbv. These values are in accordance with space-borne mid-latitude observations by the ACE Fourier transform spectrometer and the MIPAS instrument in the altitude regime considered here (Rinsland et al., 2006; Grutter et al., 2010).
The two-dimensional cross section of PAN is shown in Fig. 6e. The distribution of VMR maxima and minima is more structured compared to the one of the previously regarded pollution trace gases. Increased amounts of PAN up to 0.4 ppbv are not only visible at the beginning and end of the observation period in the upper troposphere but also in the lowermost stratosphere around 15:00 UTC, at altitudes of 7 to 8 km. Somewhat less enhanced quantities are noticeable near 14 km around 15:30 UTC. Elevated PAN amounts of comparable magnitude have also been detected in the UTLS region by space-borne instruments. The Cryogenic Infrared Spectrometers and Telescopes for the Atmosphere (CRISTA) experiment detected up to 0.35 ppbv PAN in the mid-latitude UTLS over East Asia and the western Pacific (Ungermann et al., 2016). The ACE Fourier transform spectrometer recorded 0.52 ppbv PAN at 11.5 km in a biomass burning plume above eastern Africa in autumn 2005 (Coheur et al., 2007) and up to 0.6 ppbv PAN were seen by the MIPAS instrument under biomass burning conditions in the upper troposphere in October 2007 (Wiegele et al., 2012). PAN mixing ratios of up to 0.2 ppbv were detected by airborne in situ measurements in the free troposphere (Singh et al., 2000, 2001). A compilation of different aircraft observations given by Fischer et al. (2014) exhibits mid-latitude middle and upper-tropospheric PAN values of more than 0.5 ppbv over the Northern Atlantic during summer. These different shapes of VMR distributions might be explained by very long lifetimes of PAN under cold UTLS conditions and by the fact that PAN is not emitted directly but dependent on the availability of precursor substances as described in Sect. 1.
3.2 Comparison to model simulations
The comparison of measured species to model simulations is presented in Figs. 7 and 8. The observed data have been temporally smoothed with a 39-point adjacent averaging routine to permit a more realistic comparison given the different horizontal resolutions of the measurement and the EMAC and CAMS simulations. For O3, both simulations generally reproduce the tropospheric and stratospheric concentrations seen by GLORIA (see Fig. 7a–c) but with coarser spatial structure. The chemistry climate model EMAC is able to simulate finer structures while CAMS only produces a smooth distribution of assimilated ozone. Both models tend to slightly overestimate the amount of ozone in the troposphere. This is also visible in Fig. 8a–c where differences between both EMAC runs (with and without enhanced NMVOC emissions) and GLORIA observations are shown. The amount of simulated ozone in the EMAC_2 run is only slightly higher (less than 10 ppbv) compared to the EMAC simulation without enhanced NMVOC emissions (VMR differences in Fig. 8b and c are therefore nearly the same).
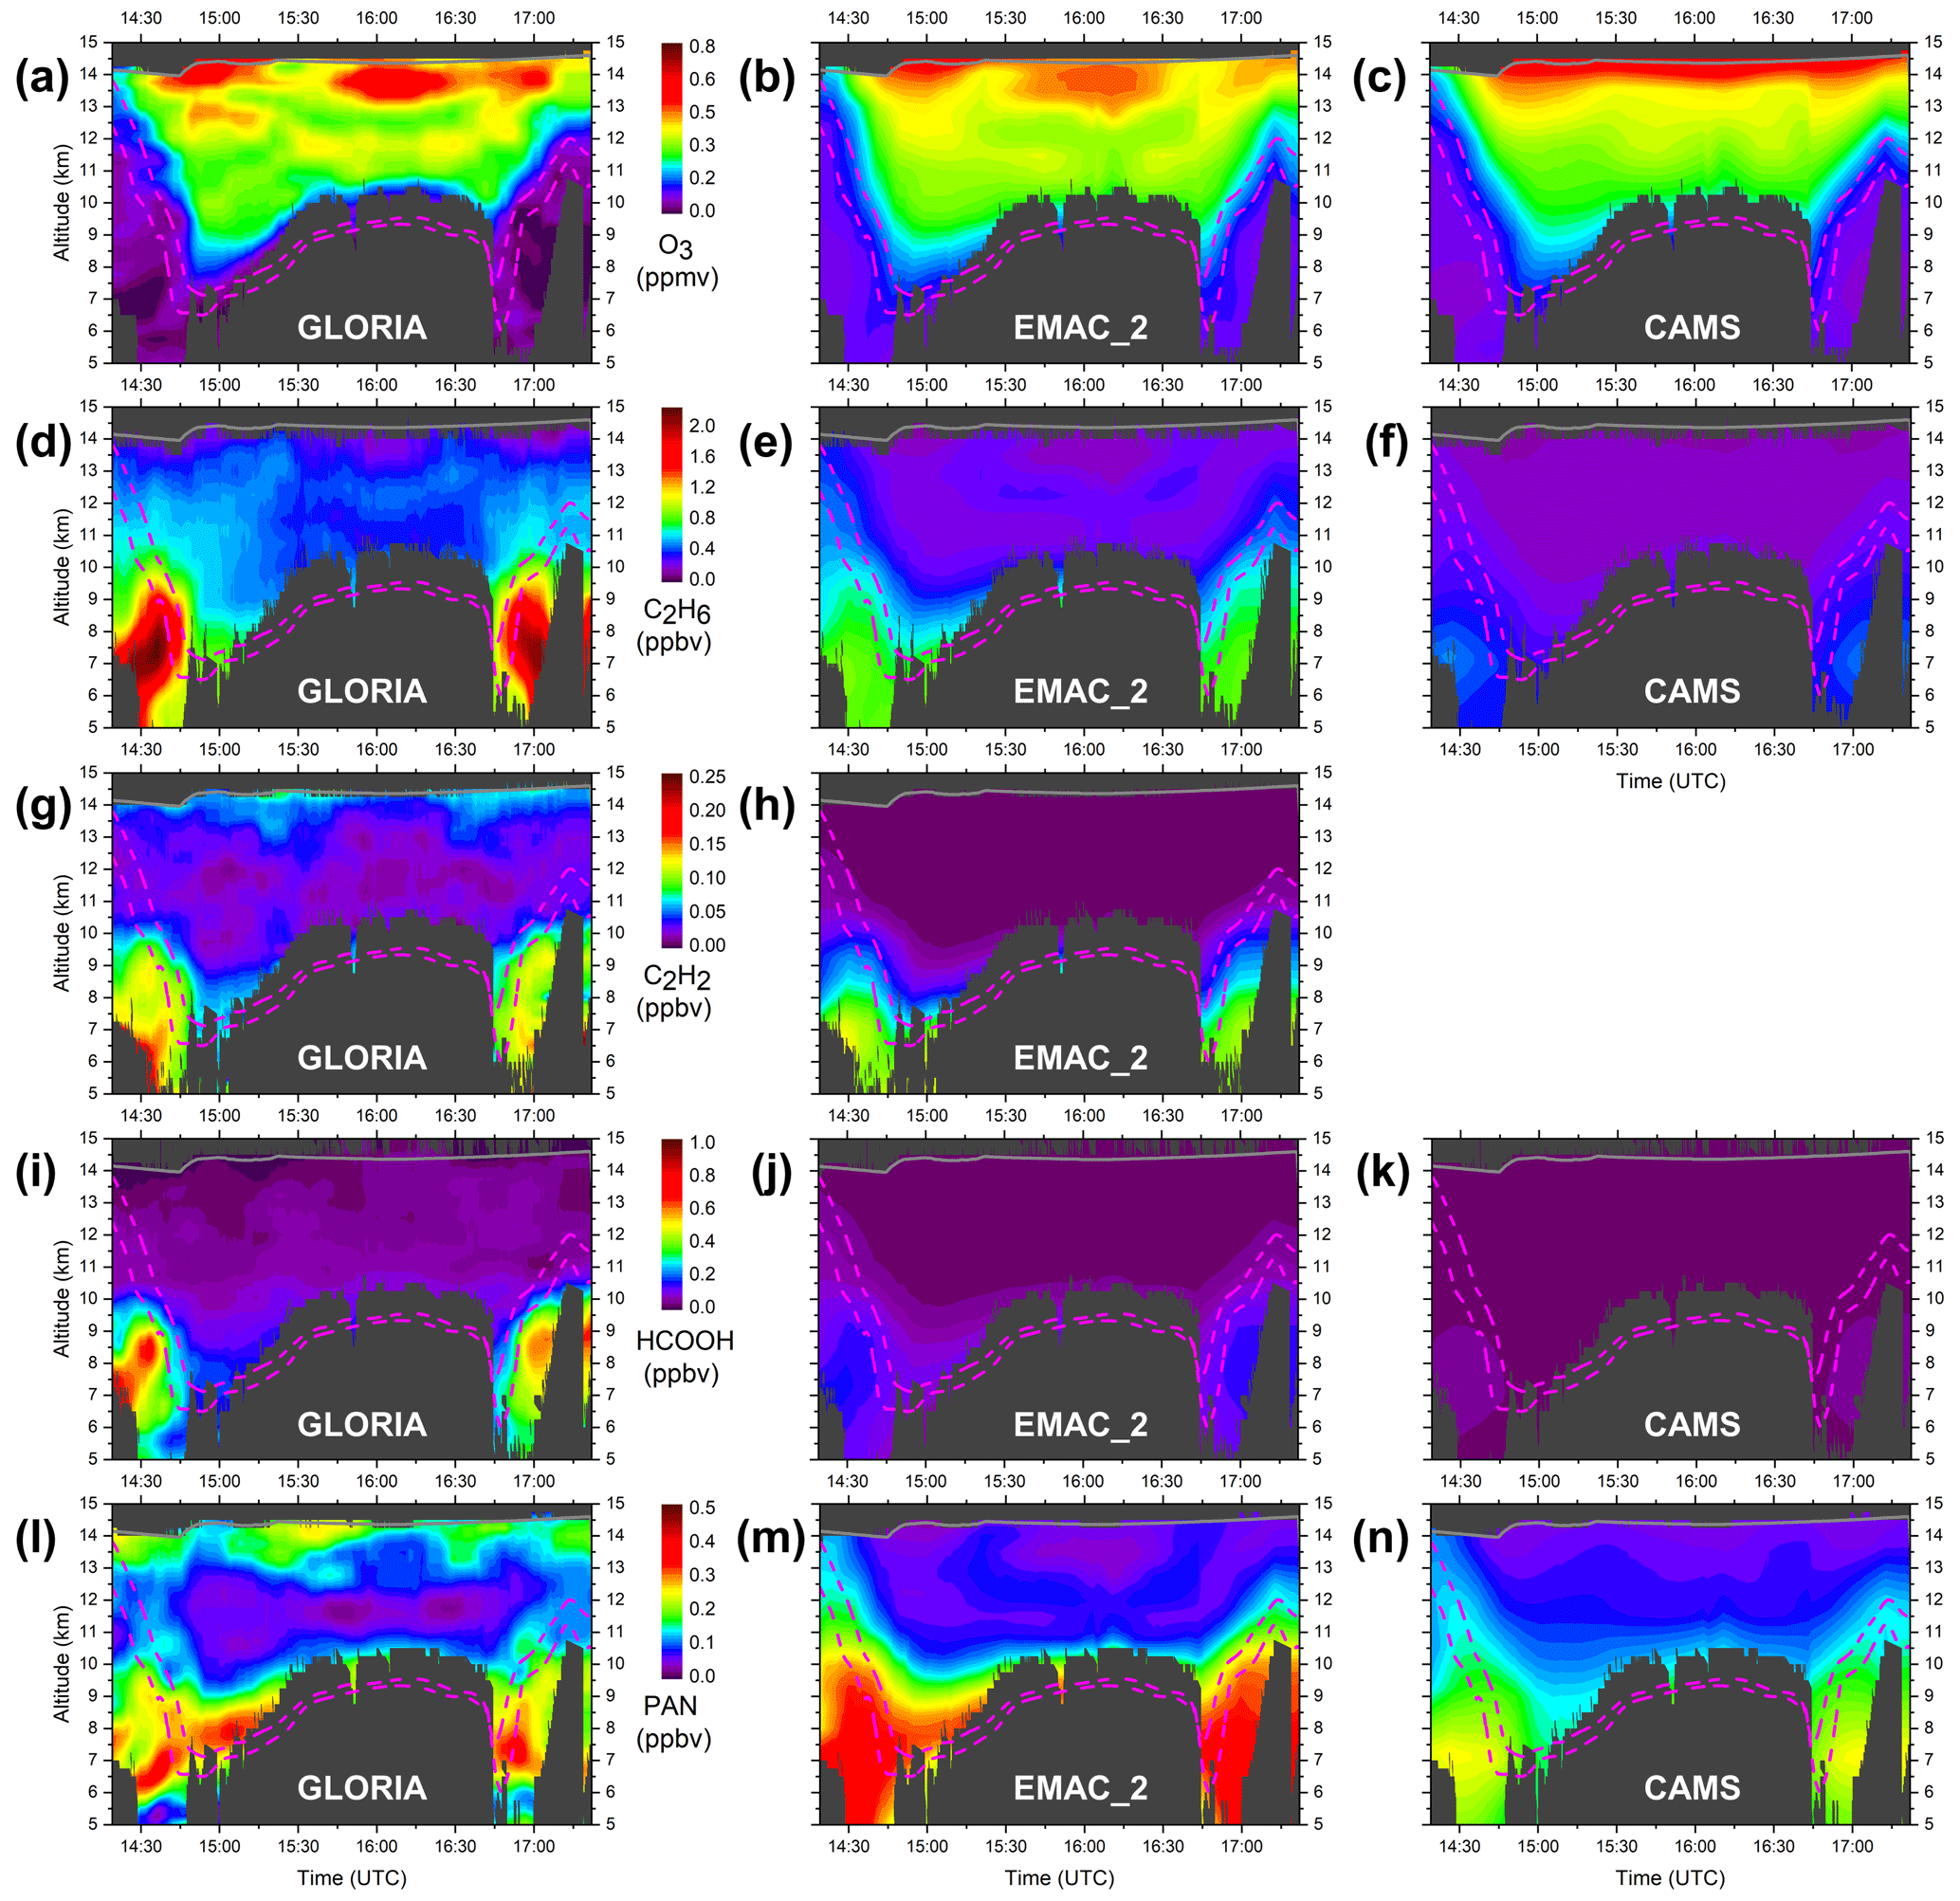
Figure 7Horizontal and vertical VMR distributions of GLORIA (repeated from Fig. 6 but temporally smoothed, left column), EMAC_2 (middle column), and CAMS (right column) of (a–c) O3, (d–f) C2H6, (g–h) C2H2, (i–k) HCOOH, and (l–n) PAN, as seen on 13 September 2017. The EMAC_2 simulation includes NMVOC emissions enhanced by a factor of 2 as recommended by Monks et al. (2018). No CAMS data for C2H2 are available. Annotation as per Fig. 6.
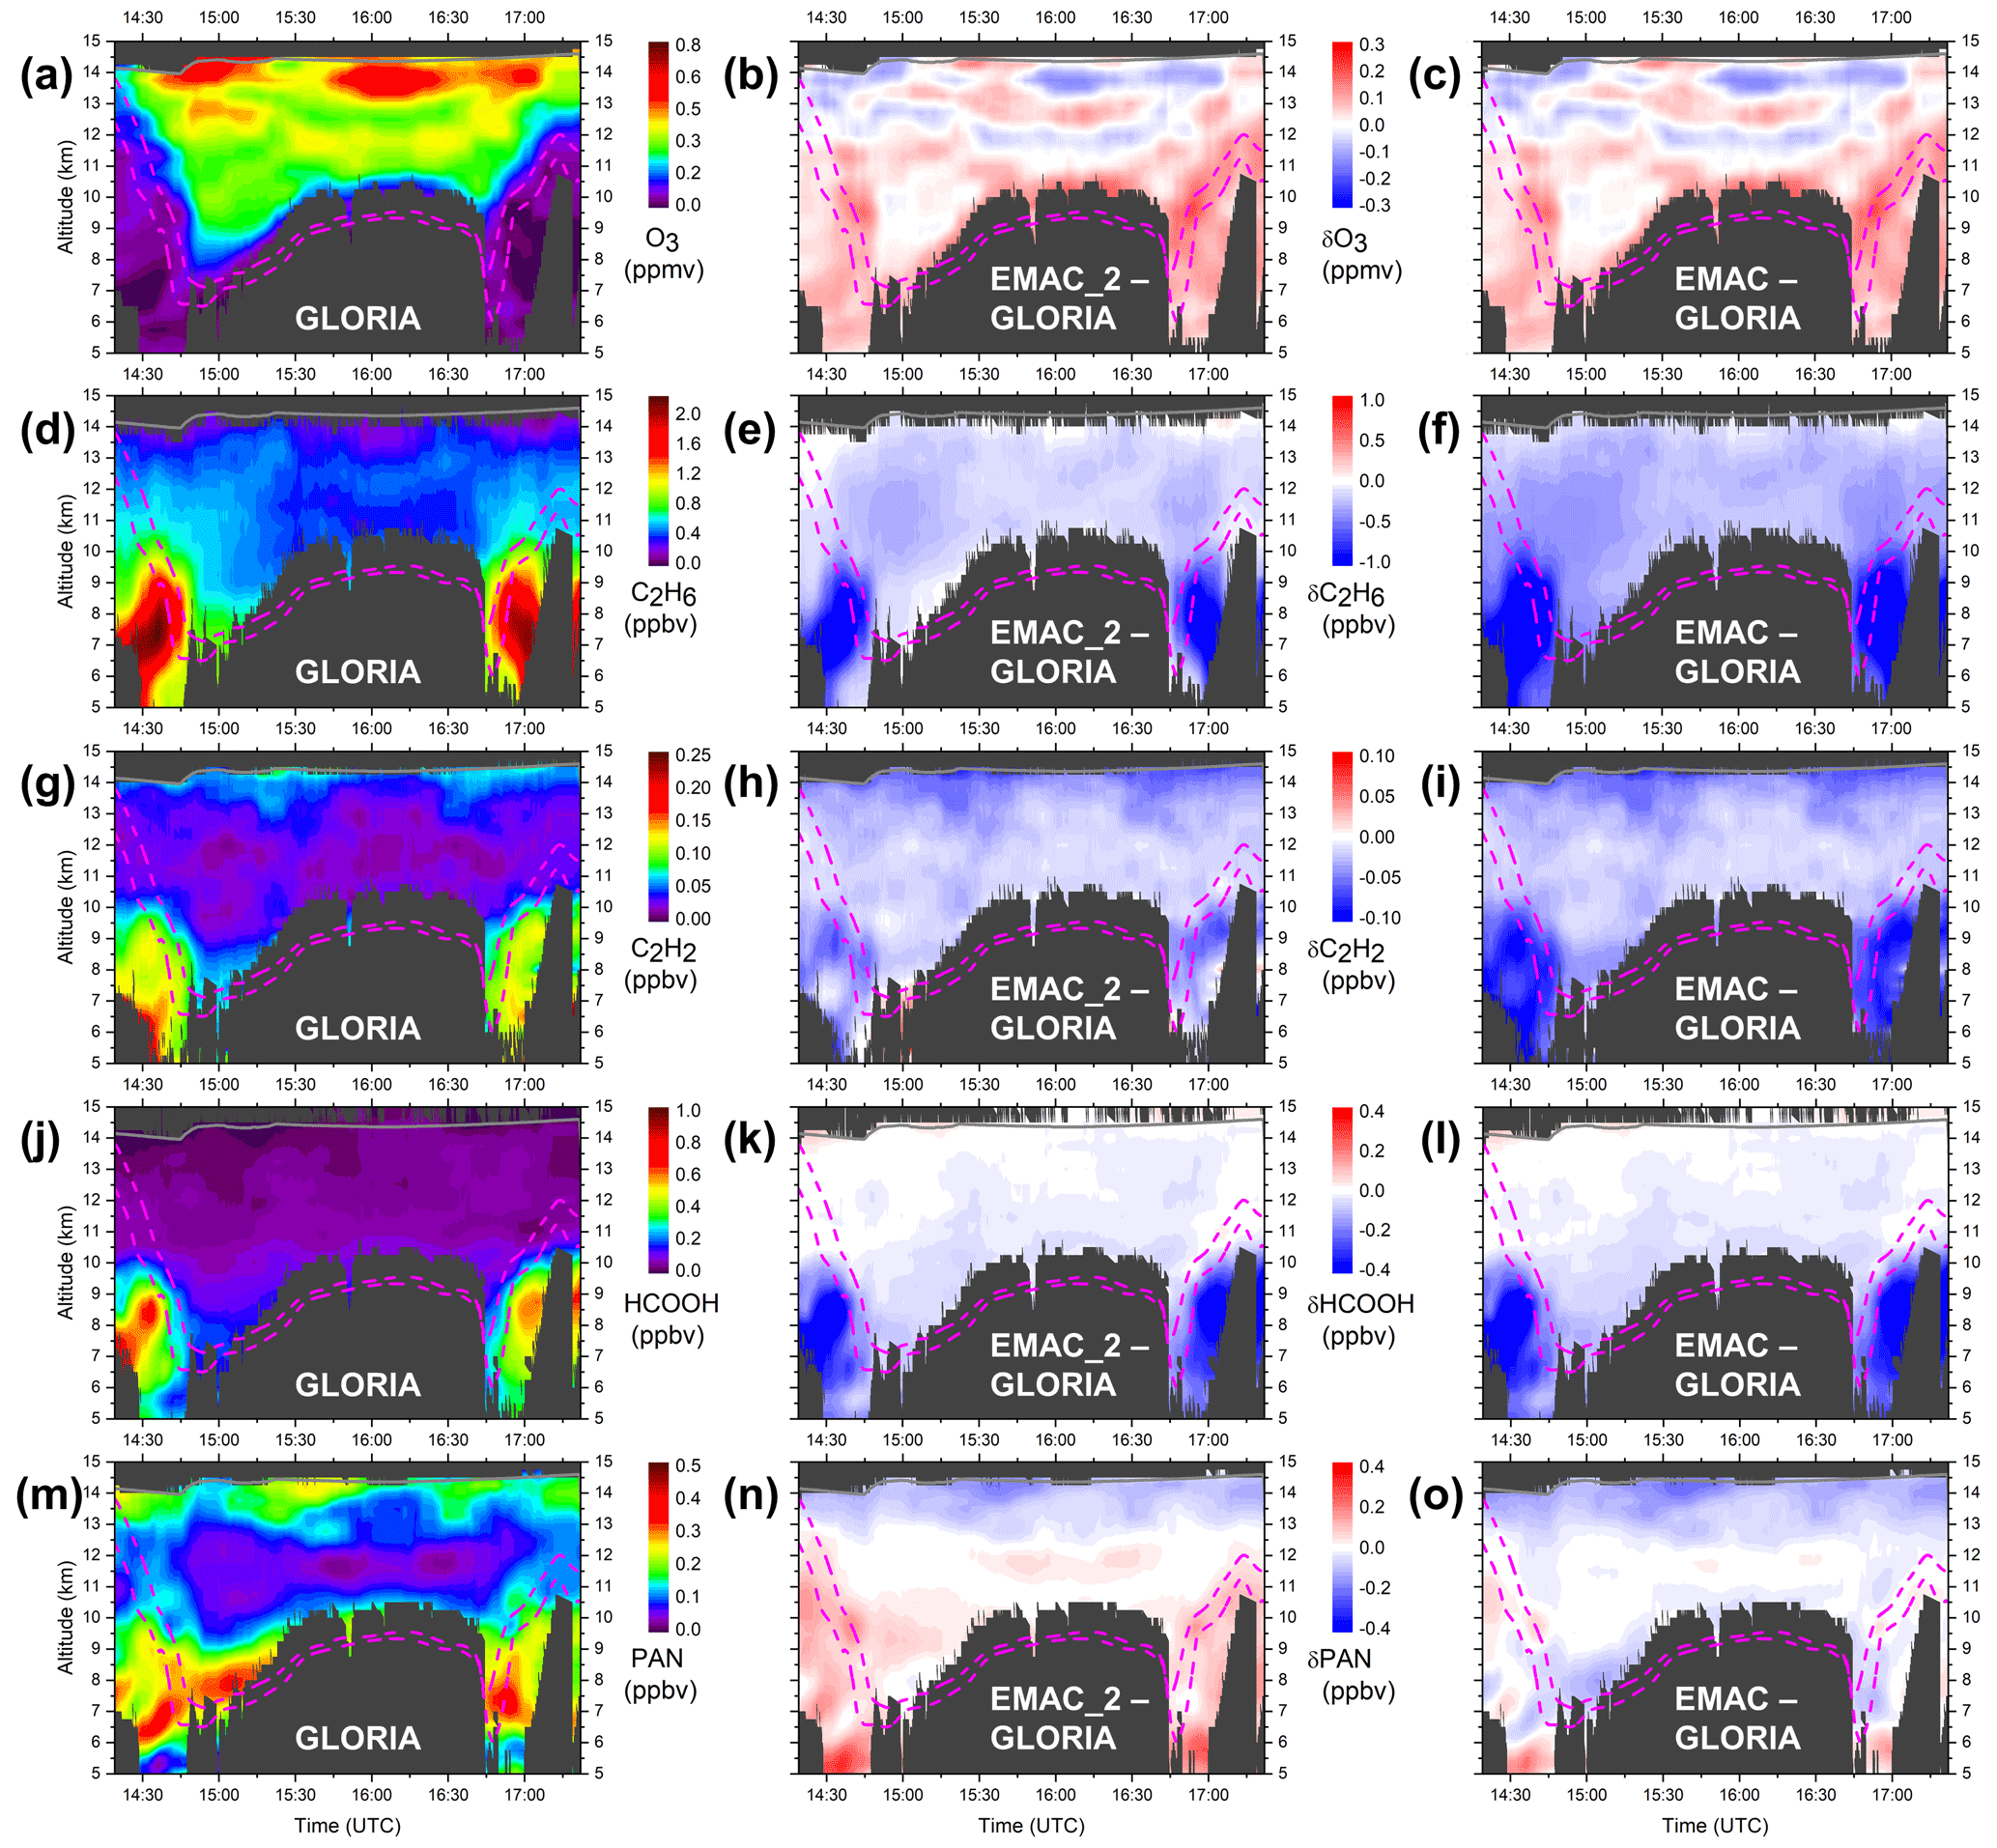
Figure 8Horizontal and vertical VMR distributions of GLORIA (temporally smoothed, left column), EMAC_2 (enhanced NMVOC emissions) minus GLORIA (middle column), and EMAC (standard NMVOC emissions) minus GLORIA (right column) of (a–c) O3, (d–f) C2H6, (g–i) C2H2, (j–l) HCOOH, and (m–o) PAN, as seen on 13 September 2017. Annotation as per Fig. 6.
Comparisons for C2H6 are displayed in Fig. 7d–f. Both models are able to qualitatively reproduce the temporal and spatial region of enhanced upper-tropospheric C2H6 as observed by GLORIA. As in the case of ozone, EMAC again is able to display finer structures in the vertical and horizontal distribution of C2H6 compared to CAMS. However, deficits in the simulated absolute C2H6 quantities are clearly visible in both models, especially in the case of CAMS. A considerable underestimation of CAMS C2H6 with respect to airborne observations was already reported by Wang et al. (2020). The EMAC_2 simulation with increased NMVOC emissions at least reduces the difference to the GLORIA observations compared to the EMAC run without these stronger NMVOC emissions (see Fig. 8d–f).
For C2H2, we note that EMAC predicts elevated concentrations in much the same region where GLORIA reports enhancements (see Fig. 7g–h). In addition, the measured VMRs in the upper troposphere are only a little underestimated in terms of their absolute amount by the EMAC_2 simulation using raised NMVOC emissions. In the stratosphere, simulated C2H2 amounts are too low compared to the measurement. Using standard NMVOC emissions in EMAC leads to an increased underestimation of C2H2 amounts compared to GLORIA (see Fig. 8g–i).
The comparison of the species HCOOH is shown in Figs. 7i–k and 8j–l. Elevated HCOOH concentrations, as recorded by GLORIA in the upper troposphere, are clearly underestimated by both models, especially in the CAMS simulation, although the atmospheric region of the (too weak) enhanced HCOOH amounts in the models agrees with the measured one. However, the EMAC_2 simulation at least reduces differences with respect to the GLORIA observations.
Looking at the temporal and spatial distribution of PAN the situation appears somewhat different to the comparisons discussed above (see Figs. 7l–n and 8m–o). The principal behaviour of enhanced PAN values in the upper troposphere is captured by both atmospheric models. EMAC produces slightly finer structures in the stratosphere compared to CAMS. However, the measured small-scale variations in the amount of PAN especially near 14:30 UTC between 6 and 8 km are not reproduced by the EMAC_2 simulation with enhanced NMVOC emissions, while the observed elevated PAN values around 15:00 UTC in the lowermost stratosphere from 7 to 8 km are also visible in the model output. Apart from the regions with the highest measured PAN amounts, EMAC_2 tends to overestimate the concentration of PAN below about 13 km (what is not the case in the standard EMAC run). Interesting VMR variations are also seen by GLORIA in the stratosphere above 13 km. The PAN VMR maximum detected around 15:40 UTC near 14 km is not visible in the model simulations. The PAN VMR minima near 15:00 UTC and between 16:00 and 16:15 UTC at about 13.5 km are reflected as a VMR minimum in EMAC_2, although with lower absolute quantities. The different shapes of the horizontal and vertical distributions of PAN VMR is most probably caused by long-range atmospheric transport. Compared to the species discussed before, sources and sinks are different, and atmospheric lifetime of PAN is considerably longer. In the following subsection, we will focus on the origin of the polluted air masses, which have been detected by GLORIA.
3.3 Origin of polluted air masses
To estimate the geographical region (within the Earth's upper planetary boundary layer) of the origin of the measured enhanced amounts of the pollutants and their pathways, we performed backward trajectory calculations as well as global three-dimensional CLaMS simulations with artificial tracers of air mass origin as described in the following subsections.
3.3.1 CLaMS backward trajectory calculations
To obtain a more detailed insight into the origin and transport pathways of air masses, backward trajectories with the three-dimensional Chemical Lagrangian Model of the Stratosphere (CLaMS; McKenna et al., 2002a, b; Pommrich et al., 2014) were performed starting from the GLORIA measurements. Although pure trajectories do not include mixing processes, they are well suited to analyse the history of transport pathways of air parcels in the tropics and in the region of the Asian monsoon into the UTLS (Vogel et al., 2014; Li et al., 2018; Ploeger et al., 2012). In this study, 20, 40, and 60 d diabatic backward trajectories with a horizontal resolution of ∘ were calculated using ERA-Interim reanalysis wind data (Dee et al., 2011). Frequently employed trajectory lengths to study transport processes in particular in the Asian monsoon region ranged from a couple of weeks to a few months depending on the transport times from Earth's surface to atmospheric altitudes (e.g. Chen et al., 2012; Bergman et al., 2013; Garny and Randel, 2016; Müller et al., 2016; Li et al., 2018; Vogel et al., 2019; Legras and Bucci, 2020; Hanumanthu et al., 2020). The transport of air from the planetary boundary layer to regions with enhanced PAN between 13 and 14.5 km (about 400 K) needs up to 60 d, therefore a maximum trajectory length of 60 d was chosen for our analysis.
These trajectories were generated for defined areas, where enhanced or low VMRs of pollutants have been detected by GLORIA. Selected regions are displayed as coloured boxes in Fig. 6. High amounts of pollutants are recorded within the cyan and blue boxes mainly in the upper troposphere. Air masses marked in these two boxes are located near the stratospheric intrusion. This region was probed twice: first at the beginning and second at the end of the flight (see Fig. 1). In addition, the green box marks enhanced quantities of observed PAN found in the stratosphere between 13 and 14.5 km (Fig. 6e). In contrast, the black box stands for an air mass where low pollution VMRs have been observed.
Figure 9 gives an overview of the trajectory calculations. It is obvious that air masses were transported by westerly winds to the place of GLORIA observations. If we first regard the black box (as defined in Fig. 6) in the lowermost stratosphere, where low mixing ratios for all pollutant species discussed here were observed, we find that only few trajectories penetrate the upper planetary boundary layer (PBL) limit of 800 hPa on their way back from the GLORIA observation points within 20, 40, and 60 d (Fig. 9a–c). Further, most of these areas are located over the southern part of the North Pacific where we would not expect much pollution in the PBL. In contrast, looking at the cyan and blue boxes (of Fig. 6), marking mainly air masses in the upper troposphere near the flank of the stratospheric intrusion with generally high amounts of the pollutants, we find lots of trajectories going into the PBL not only over the North Pacific region but also over densely populated regions in Southeast Asia (Fig. 9d–i) where we expect direct anthropogenic emissions or precursors of the considered species (Lelieveld et al., 2001). Furthermore, marked areas of PBL penetration are also visible over the North American continent, especially in Canada where forest fires were frequent and intense in August and September 2017 (Pumphrey et al., 2020; Torres et al., 2020; Hooghiem et al., 2020; Khaykin et al., 2018). These widespread Canadian fires correlate well with the marked PBL areas. Finally, we look at the green region in the stratosphere around 14 km (see Fig. 6) where enhanced amounts of PAN are visible in contrast to the non-elevated values of C2H6, C2H2, and HCOOH. The corresponding trajectory calculations (Fig. 9j–l) exhibit no PBL penetration areas in the case of 20 and 40 d backward trajectories. However, the 60 d backward calculations clearly show areas over densely populated Southeast Asia where trajectories entered the PBL. The ascending air masses are clearly visible in the changing colour of the potential temperature along the trajectories (Fig. 9l). This potential source region is located well within the Asian summer monsoon pollution pump (Lelieveld et al., 2018; Randel et al., 2010). The trajectory calculations show that the air parcels with enhanced PAN are slowly uplifted by diabatic heating superimposed on the anticyclonic motion within about 40 d, which Vogel et al. (2019) referred to as an “upward spiralling range”. Subsequent transport (within about 20 d) occurred along the subtropical jet to the extratropical UTLS over the Atlantic in agreement to previous aircraft measurements of long-lived trace gases (like CH4, H2O, CO, N2O, and SF6) in the extratropical UTLS over the Atlantic (e.g. Müller et al., 2016; Vogel et al., 2016). In this study, it is demonstrated that also for the pollutant PAN, with a lifetime of up to a few months, is this transport pathway from the Asian monsoon region to the extratropical UTLS important. Since PAN has this long lifetime in the free and upper troposphere, which is longer than the lifetimes of C2H6, C2H2, and HCOOH, it is likely that some amount of PAN still exists in the stratospheric region of the green box while concentrations of the three other pollutant species are already depleted.
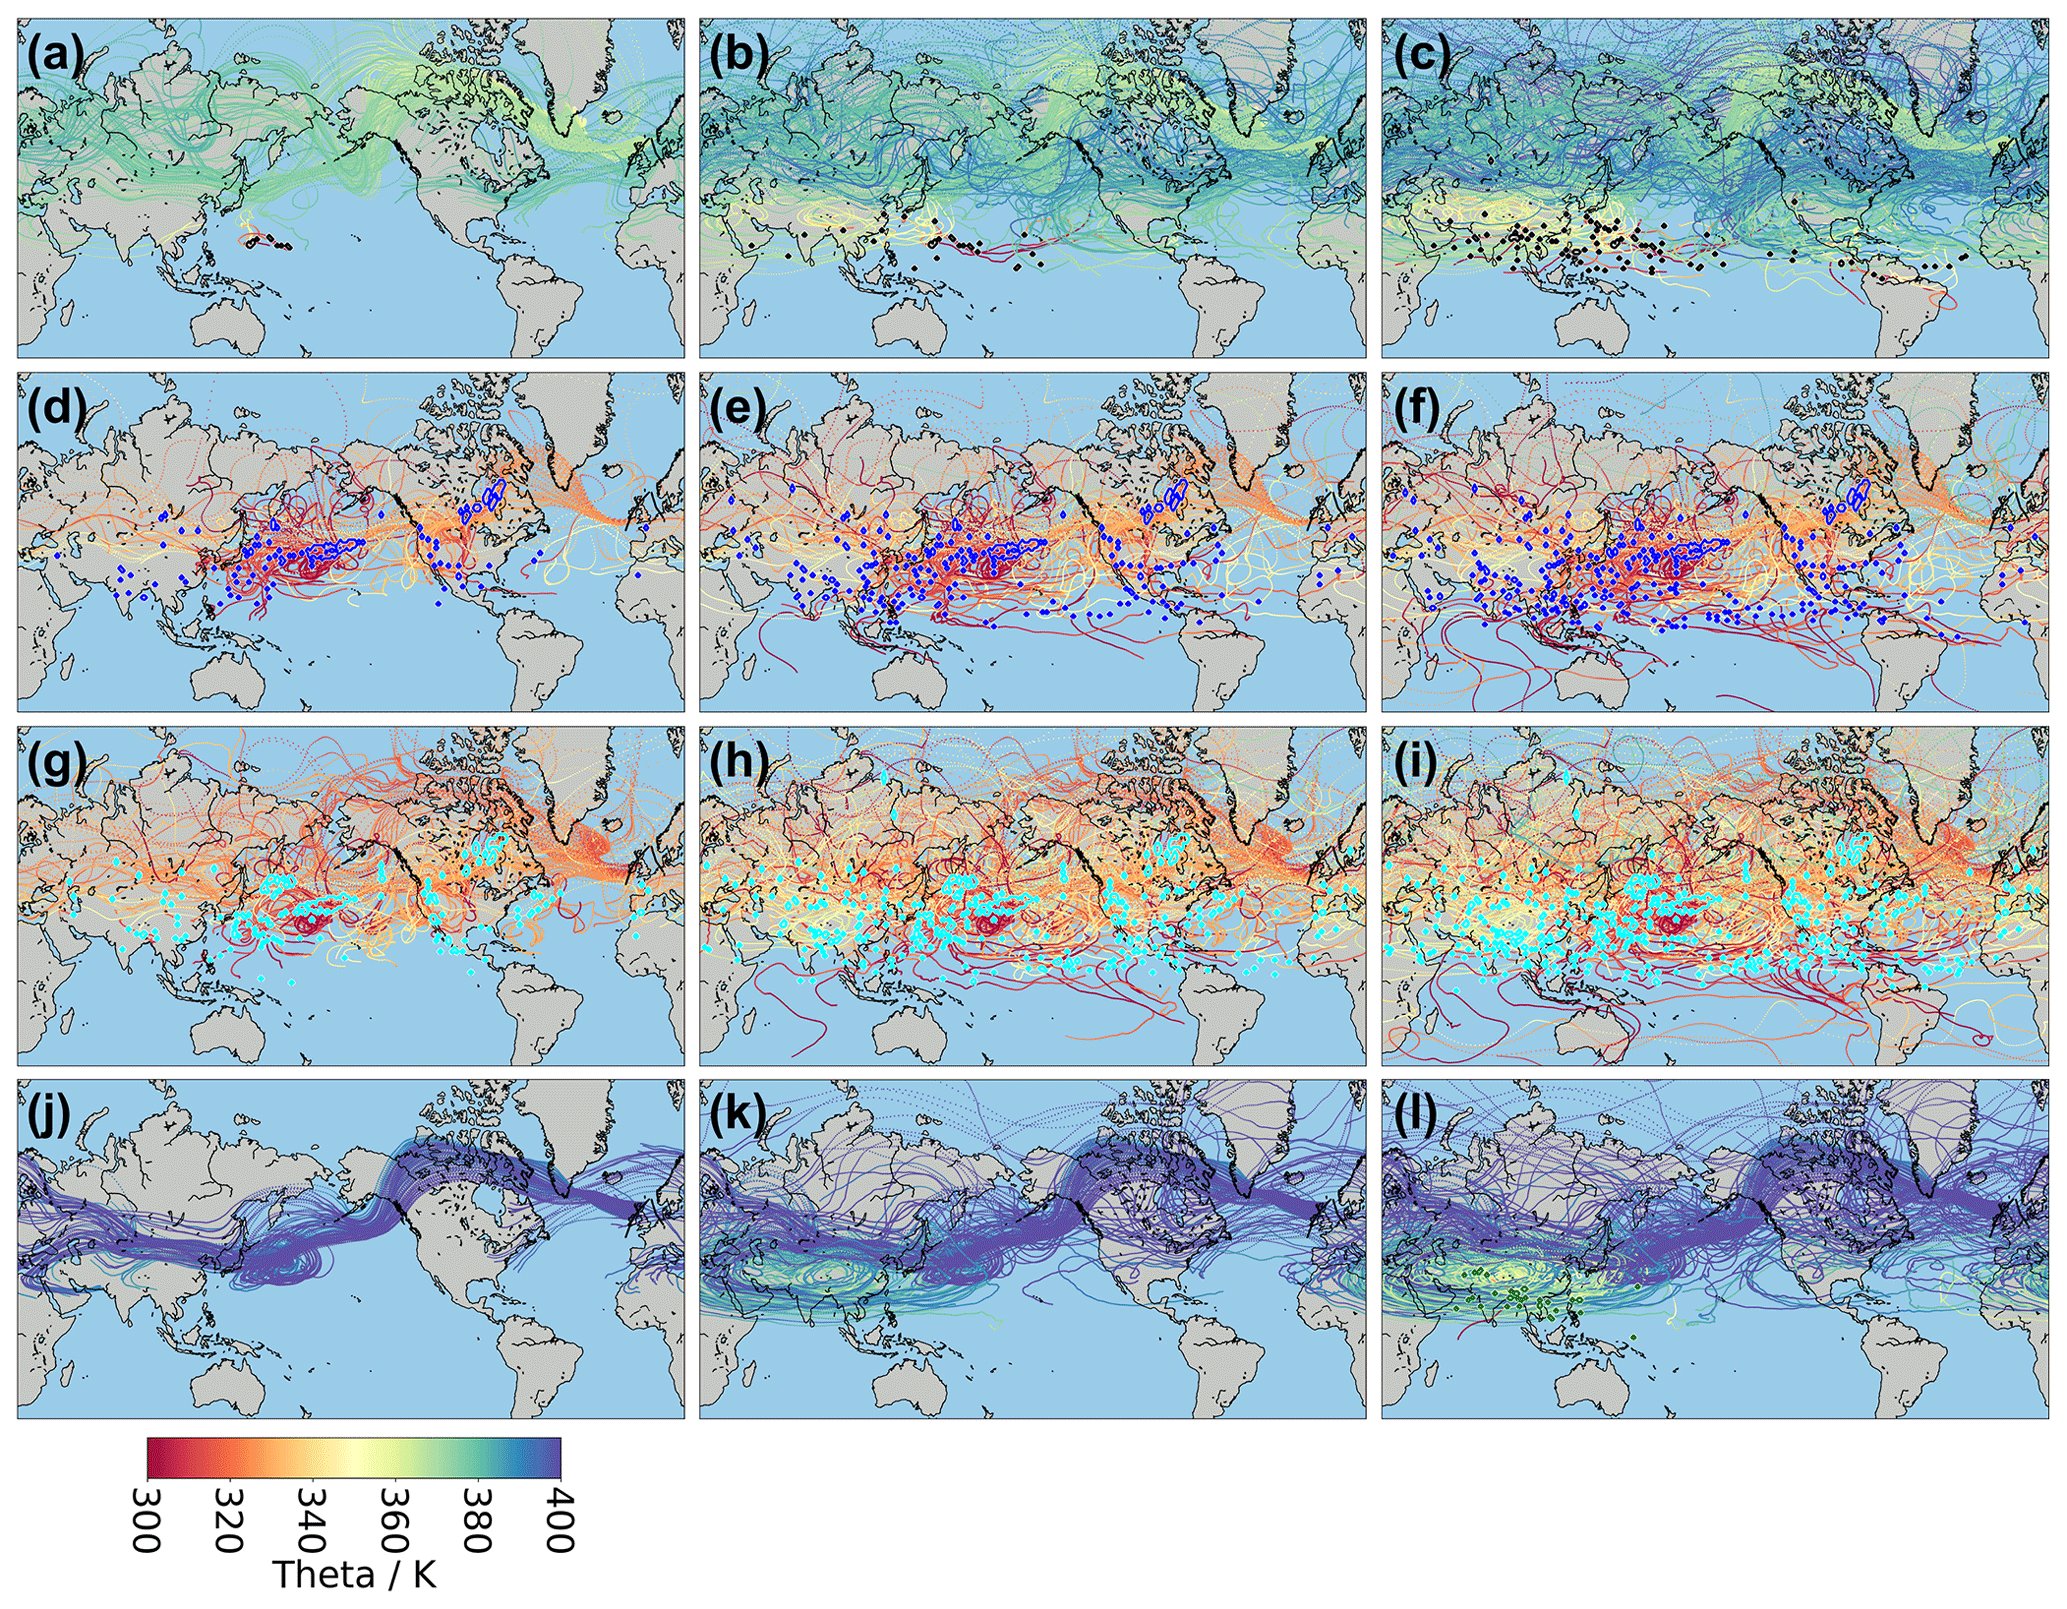
Figure 9Backward trajectory calculations performed by CLaMS using ERA-Interim wind data. Trajectories start at the GLORIA tangent points and are shown for 20 d (left column), 40 d (middle column), and 60 d (right column) within defined regions: black (a–c), blue (d–f), cyan (g–i), and green (j–l) as displayed in Fig. 6. Trajectory colours denote the potential temperature (which is also a measure of altitude) along the trajectory as indicated in the colour bar. Coloured encircled areas (black, blue, cyan, and green) mark regions where the backward trajectory penetrates the upper edge of the planetary boundary layer (800 hPa). For better clarity, only every tenth trajectory is displayed. Hence, encircled areas may occur where no trajectory is drawn.
Backward trajectory calculations are very useful to identify both the origin of an air parcel in the PBL and its detailed transport pathways and transport times; however, mixing processes between different air parcels are neglected. Therefore, we use in addition global three-dimensional CLaMS simulations considering mixing of air parcels to characterize the origin of air masses.
3.3.2 Artificial tracers of air mass origin calculations
The Lagrangian three-dimensional chemistry transport model CLaMS (Pommrich et al., 2014, and references therein) was used to calculate artificial tracers of air mass origin (e.g. Vogel et al., 2016, 2019). These artificial tracers refer to marked geographical regions in the boundary layer of the global atmosphere. An overview of these regions is given in Fig. 10 which is an updated configuration compared to previous studies using artificial tracers of air mass origin in CLaMS. The upper limit of the model boundary layer follows the orography and extends to about 2–3 km above the Earth's surface. In the currently used simulation, the model dynamics are driven by horizontal winds from the ERA-Interim reanalysis (Dee et al., 2011) provided by ECMWF. Transport of air masses from the model boundary into the free troposphere and above is considered from 1 May 2017, which is the starting time of the simulation. Every 24 h (time step for mixing in CLaMS), air masses in the model boundary layer are marked by the different tracers of air mass origin and can be transported like a chemical tracer to other regions of the free troposphere or stratosphere, and subsequent mixing processes between different air masses can occur. Therefore, the value of the individual artificial tracer of air mass origin counts the percentage of an air mass that originated in the specific model boundary layer region since 1 May 2017 considering advection and mixing processes.
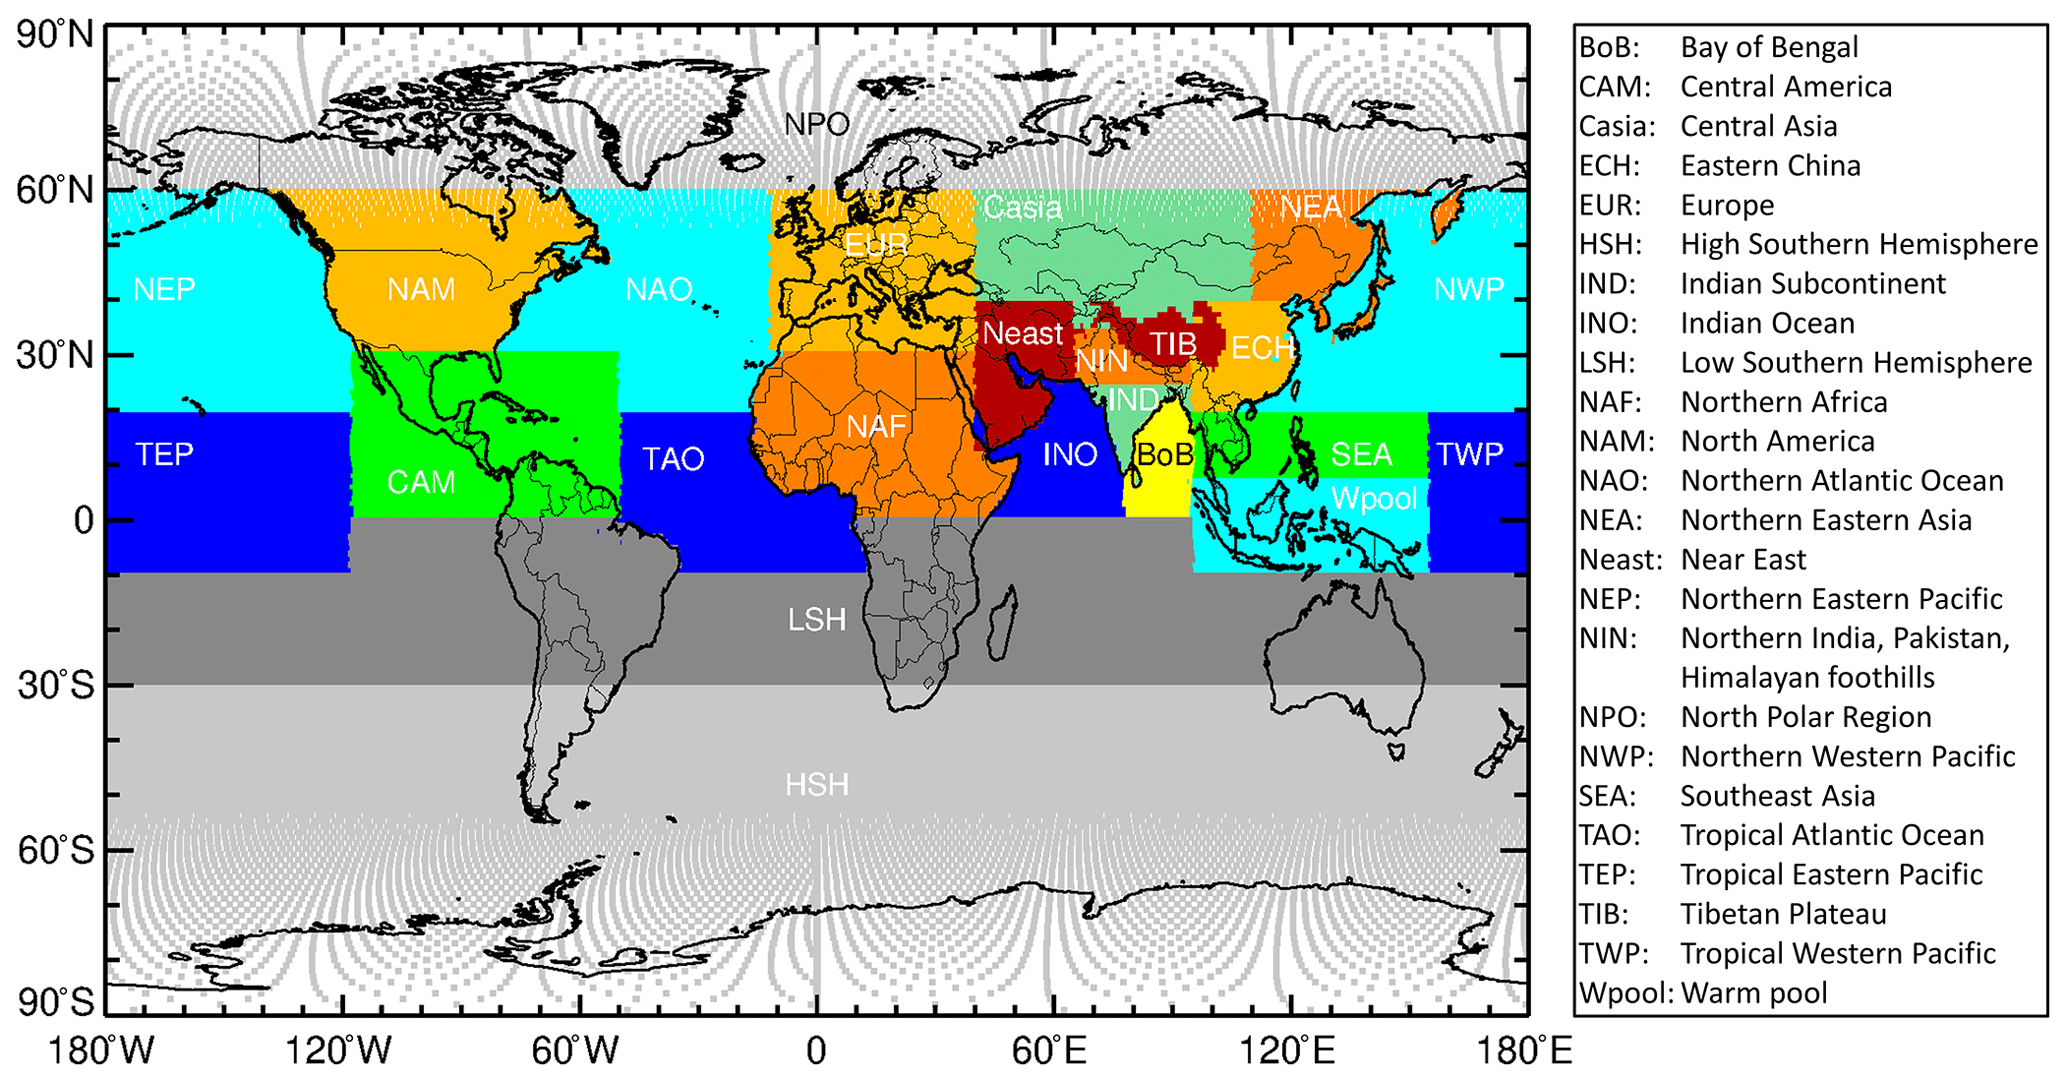
Figure 10Geographical locations of the artificial tracers of air mass origin used in the CLaMS model for the HALO WISE campaign in 2017. In some regions, the artificial tracers are defined to separate between continental and maritime areas as well as by different geopotential heights (e.g. Tibetan Plateau). The geographical locations of the artificial tracers of air mass origin used in previous CLaMS simulations can be found in Vogel et al. (2019).
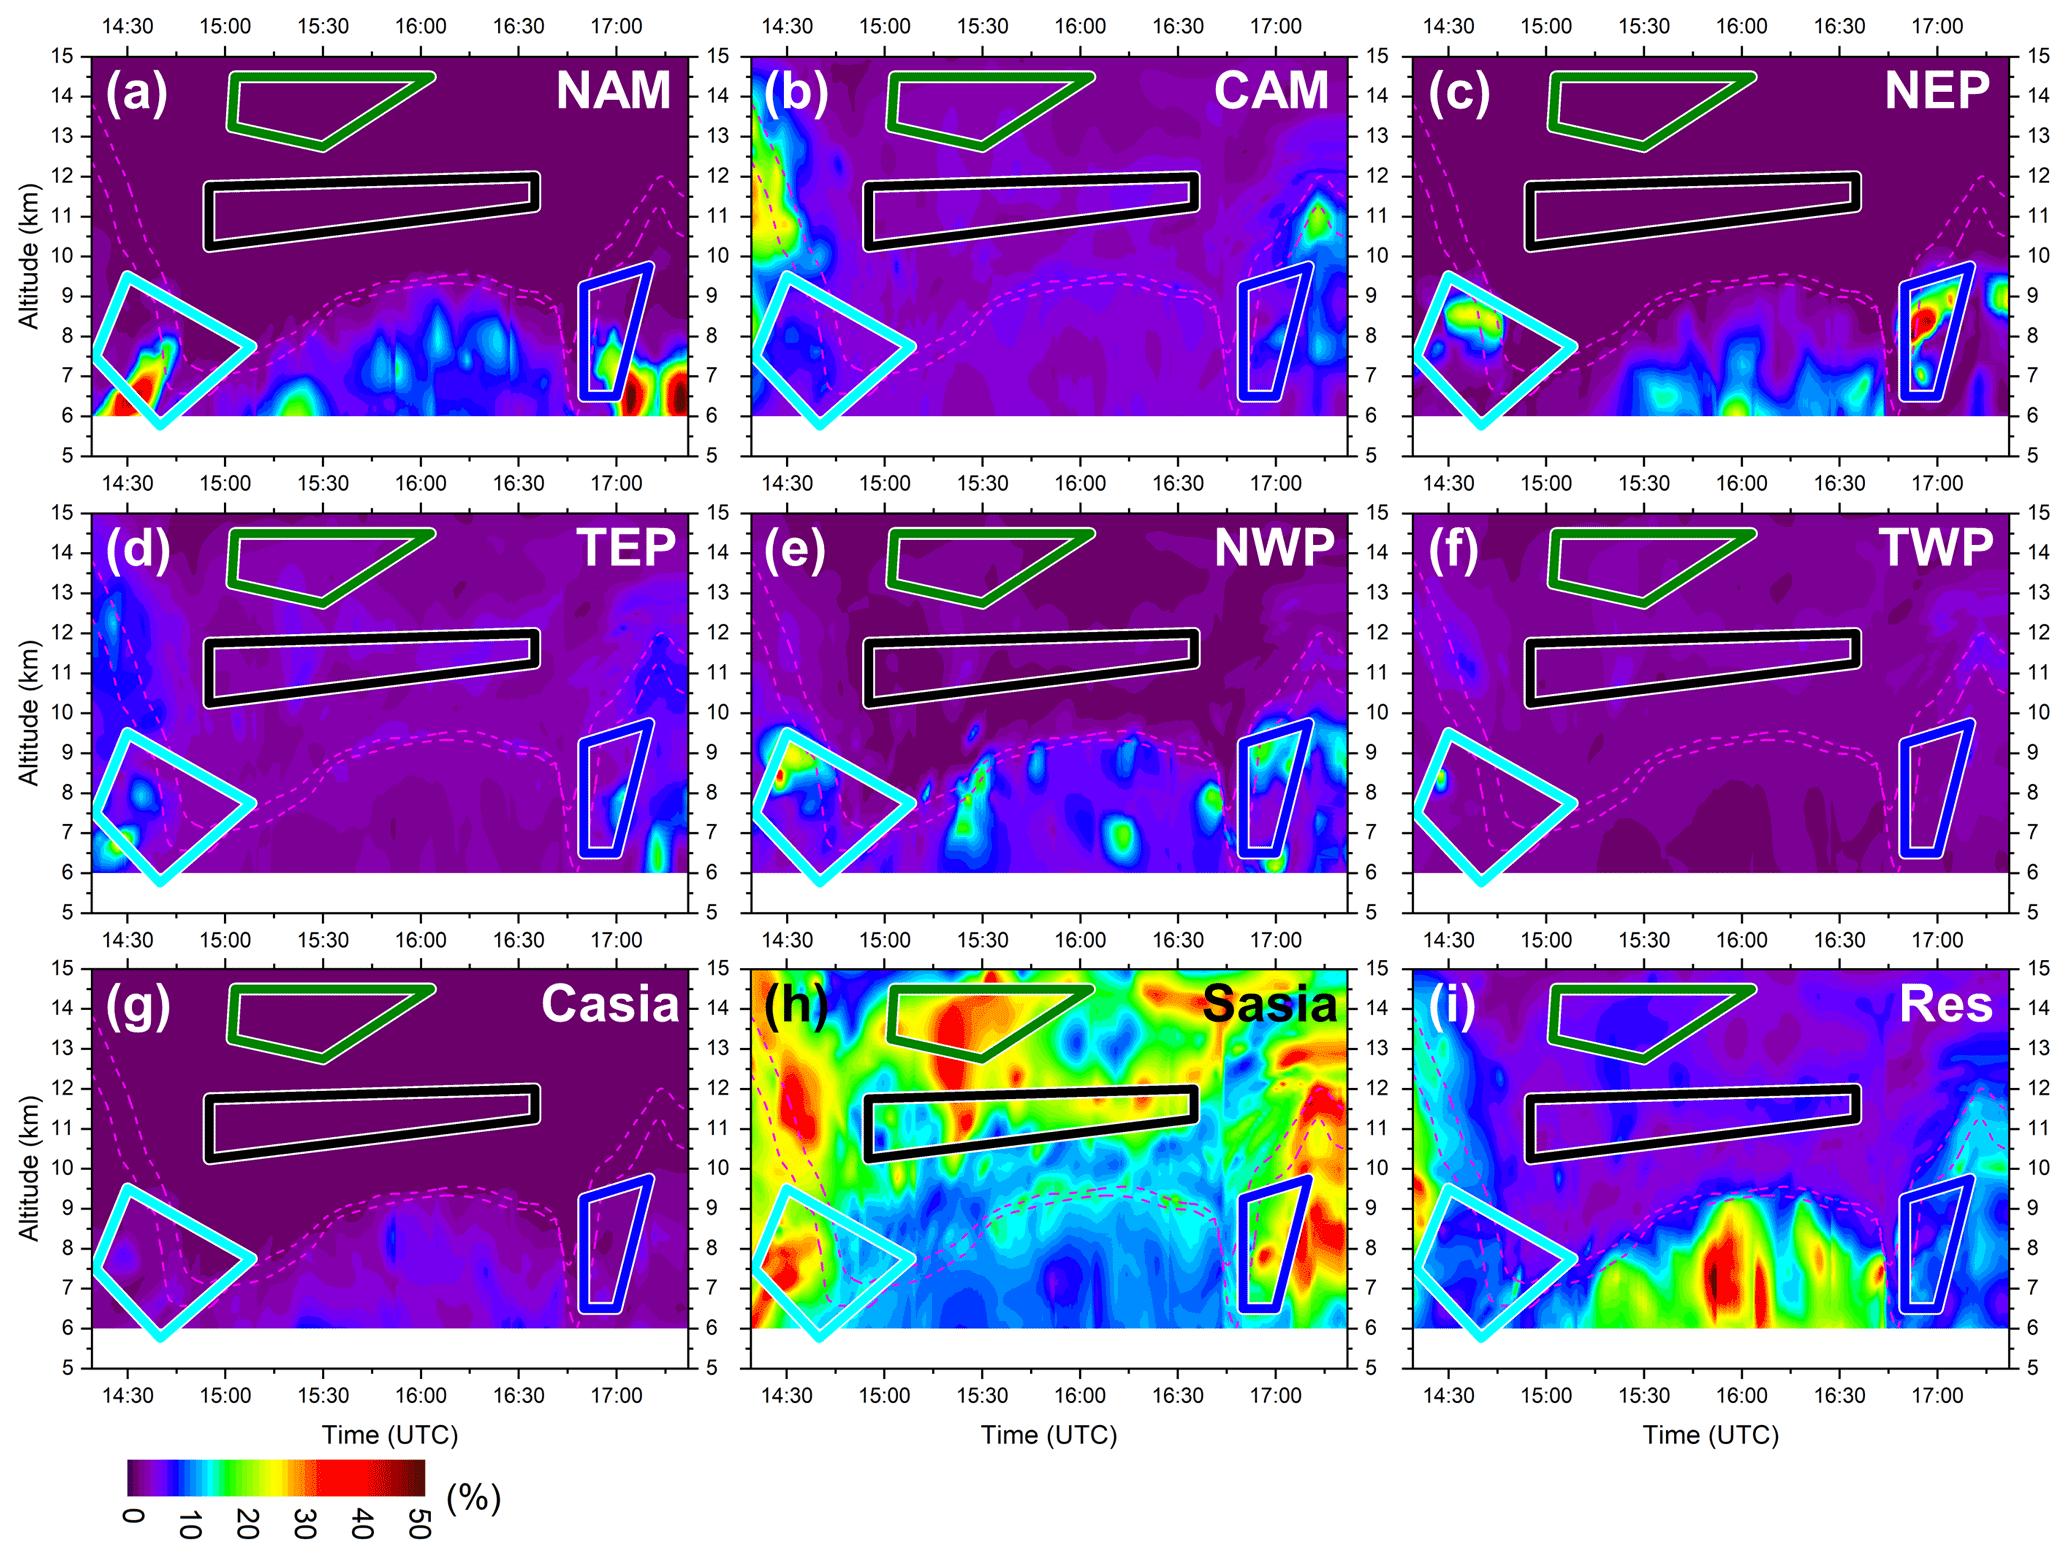
Figure 11Artificial tracers of air mass origin calculations performed with CLaMS for the GLORIA observation grid showing the horizontal and vertical distributions of fraction of air originating from the boundary layer of different geographical regions as defined in Fig. 10. Results are shown for zones from the North American, Central American, and Pacific regions (a–f) and zones for Central Asia (g) and South Asia (Sasia), which comprise the subregions INO, IND, NIN, TIB, ECH, BoB, SEA, and Wpool (g). The residual part (Res) displayed in (i) includes all global regions except the zones shown in (a–h) and is of little importance for the GLORIA observations. Annotations as per Fig. 6.
The results of the CLaMS simulation are displayed in Fig. 11. The origin of air masses seen inside the cyan and blue boxes (which contain the largest values of C2H6, C2H2, HCOOH, and PAN; see Fig. 6) below the tropical side of the stratospheric intrusion stems from, to a large part, North America, Northeast Pacific, Northwest Pacific, and the Tropical Eastern Pacific and also stems from, to a smaller part, Central America. Up to about 40 % in these boxes originate from the South Asian region which includes the Tibetan Plateau, Eastern China, Northern India, Indian Ocean, Bay of Bengal, Indian subcontinent, Southeast Asia, and Warm pool (see Fig. 10). This is consistent with the findings of the trajectory calculations as shown in the previous section. Air masses in the stratosphere within the green box where enhanced PAN mixing ratios were detected by GLORIA come mainly from the South Asian region. This is also in agreement with the PBL penetration region of the backward trajectories as discussed before. Concerning the black box in the stratosphere with low concentrations of C2H6, C2H2, HCOOH, and PAN, it is obvious that only fragments of air originate from the North American, Northeast Pacific, and Northwest Pacific regions. Some patches of South Asian air masses are visible in the black box zone, obviously from regions without enhanced amounts of the pollutants discussed here.
The artificial tracers of air mass origin mark specific geographical regions in the model boundary layer and are therefore very useful to identify the origin of observed air masses including atmospheric mixing processes. However, some regions on the Earth's surface where high emissions of chemical tracers such as C2H6, C2H2, HCOOH, and PAN (or their precursors) really occur are not included in the CLaMS simulations. Nevertheless, CLaMS simulations are useful to show that the enhanced PAN mixing rations in the lower stratosphere (green box) are mainly from South Asia in agreement to the trajectory calculations.
GLORIA observations of pollutant trace gases shown in this work were performed during a flight of the WISE aircraft campaign around the British Isles on 13 September 2017. One of the special characteristics of these remote sensing measurements are the high temporal and spatial resolution of the data. As discussed in Sect. 3.1, the amounts of these gases are in line with data from previously performed satellite and in situ aircraft measurements. The pollutants can be transported into remote regions due to their long lifetime under appropriate atmospheric conditions, like convective processes combined with strong wind regimes of the upper troposphere. The following main results can be stated.
First, enhanced volume mixing ratios of the pollutant gases C2H6, C2H2, HCOOH, and PAN were recorded by the GLORIA instrument in the upper troposphere with high temporal and spatial resolution. It is important to emphasize that these enhancements were detected far away from the emission sources of these species. This is possible due to their long atmospheric lifetimes in the order of weeks to months under free tropospheric conditions. Since PAN has the longest lifetime of this foursome, elevated quantities of this molecule could be measured even in the lowermost stratosphere. Backward trajectories and artificial tracers of air mass origin calculations indicate that the main sources of the emitted species are, on the one hand, biomass forest fires in North America which reached their maximum a couple of weeks before the GLORIA flight (Pumphrey et al., 2020; Torres et al., 2020) when air masses detected by GLORIA passed this region. On the other hand, another important source region is located in the vast region of South Asia and Southeast Asia where the Asian monsoon anticyclone governs the circulation regime during the summer months. Here, huge amounts of pollutants are lifted upwards into the upper troposphere and further transported to northern mid-latitudes via strong wind fields like the subtropical jet stream (see e.g. Ungermann et al., 2016; Vogel et al., 2016; Lelieveld et al., 2018; Legras and Bucci, 2020). Indeed, another GLORIA measurement carried out about 6 weeks earlier on 31 July 2017 during the StratoClim (Stratospheric and upper tropospheric processes for better climate predictions) campaign over India and Nepal also shows elevated amounts of more than 0.2 ppbv of C2H2, more than 0.2 ppbv of HCOOH, and more than 0.5 ppbv of PAN (Johansson et al., 2020). These values are of comparable magnitude to the ones observed during the WISE campaign. Our study demonstrates that PAN, with a lifetime of up to a few months, is transported from sources in Asia to the northern extratropical UTLS within about 2 months caused by the Asian monsoon which has implications for ozone and thus possibly for the radiative budget in that part of the atmosphere.
Second, the chemistry climate model EMAC and the CAMS assimilation system are able to simulate tropospheric and stratospheric dynamical ozone VMR structures as seen by GLORIA although with coarser spatial resolution compared to the measurement (particularly for CAMS). In addition, both models reproduce the temporal and spatial region of enhanced upper tropospheric VMR levels of the measured pollutant species (C2H2 not available in CAMS). However, CAMS clearly underestimates the amount of elevated C2H6, HCOOH, and, to a lesser extent, PAN. The EMAC_2 simulation using NMVOC emissions enhanced by a factor of 2 (as recommended by Monks et al., 2018) only slightly underestimates the C2H2 concentrations, while simulated values for C2H6 and HCOOH are also too low. Compared to the EMAC standard emission run, the EMAC_2 simulation reduces differences to the GLORIA observations for these gases. In contrast, the size of elevated PAN values is overestimated by the EMAC_2 model run. However, this does not hold for the local PAN VMR enhancements detected near 14 km, which are not captured by EMAC_2 nor by CAMS.
This study has shown that observations of pollutant species are further needed since biomass burning and wildfires will still occur in the future and seem to have increased in the last years (Witze, 2020). There is still potential to improve chemical models with regard to reproducing the measured VMR enhancements of the pollutant gases in more detail. The rather coarse model resolution together with deficits in the vertical transport from convection in the meteorological fields used to drive the model impede the reproduction of measured structures of the pollutant trace gas concentrations. A further aspect is to improve the emission databases in the models, because the simulated amount of pollution species is strongly dependent on the local emission place and the intensity of the emissions.
GLORIA measurements are available in the database HALO-DB (https://halo-db.pa.op.dlr.de/mission/96, Wetzel et al., 2021) and will be available on the KITopen repository. The CAMS model data are available from ECMWF (https://apps.ecmwf.int/data-catalogues/cams-reanalysis, ECMWF, 2020). EMAC and CLaMS data are available upon request.
GW wrote the paper and performed the bulk of the data analysis, with input from all co-authors. SJ, AK, JU, MH, and NG performed the GLORIA data processing. FFV, TG, EK, GM, HN, and CP operated GLORIA during the WISE campaign in Shannon and Oberpfaffenhofen. OK and FK performed the EMAC simulations and designed the sensitivity studies. BV and JUG performed the CLaMS trajectory and artificial tracers of air mass origin calculations. BMS, HO, and JO directed the research and flight planning. All authors commented on and improved the article.
The authors declare that they have no conflict of interest.
This article is part of the special issue “WISE: Wave-driven isentropic exchange in the extratropical upper troposphere and lower stratosphere (ACP/AMT/WCD inter-journal SI)”. It is not associated with a conference.
We acknowledge support by the German Research Foundation (Deutsche Forschungsgemeinschaft, DFG Priority Program SPP 1294). We are grateful to the WISE coordination team for excellently conducting the aircraft campaign. Results are based on the efforts of all members of the GLORIA team, including the technology institutes ZEA-1 and ZEA-2 at Forschungszentrum Jülich and the Institute for Data Processing and Electronics at the Karlsruhe Institute of Technology. We would also like to thank the pilots and ground-support team at the Flight Experiments facility of the Deutsches Zentrum für Luft- und Raumfahrt (DLR-FX). We thank ECMWF for providing CAMS data. The EMAC simulations were performed on the supercomputer ForHLR funded by the Ministry of Science, Research and the Arts Baden-Württemberg and by the Federal Ministry of Education and Research. The CLaMS activities contribute to the DFG project AMOS (HALO-SPP 1294/VO 1276/5-1) funded by the German Research Foundation (Deutsche Forschungsgemeinschaft, DFG). The authors gratefully acknowledge the computing time for the CLaMS simulations granted on the supercomputer JURECA at Jülich Supercomputing Centre (JSC) under the VSR project ID JICG11. We acknowledge support by Deutsche Forschungsgemeinschaft and the Open Access Publishing Fund of Karlsruhe Institute of Technology.
The article processing charges for this open-access publication were covered by the Karlsruhe Institute of Technology (KIT).
This paper was edited by Peter Haynes and reviewed by three anonymous referees.
Alvarado, L. M. A., Richter, A., Vrekoussis, M., Hilboll, A., Kalisz Hedegaard, A. B., Schneising, O., and Burrows, J. P.: Unexpected long-range transport of glyoxal and formaldehyde observed from the Copernicus Sentinel-5 Precursor satellite during the 2018 Canadian wildfires, Atmos. Chem. Phys., 20, 2057–2072, https://doi.org/10.5194/acp-20-2057-2020, 2020.
Atkinson, R., Baulch, D. L., Cox, R. A., Crowley, J. N., Hampson, R. F., Hynes, R. G., Jenkin, M. E., Rossi, M. J., and Troe, J.: Evaluated kinetic and photochemical data for atmospheric chemistry: Volume III – gas phase reactions of inorganic halogens, Atmos. Chem. Phys., 7, 981–1191, https://doi.org/10.5194/acp-7-981-2007, 2007.
Bergman, J. W., Fierli, F., Jensen, E. J., Honomichl, S., and Pan, L. L.: Boundary layer sources for the Asian anticyclone: Regional contributions to a vertical conduit, J. Geophys. Res.-Atmos., 118, 2560–2575, https://doi.org/10.1002/jgrd.50142, 2013.
Bourgeois, I., Peischl, J., Thompson, C. R., Aikin, K. C., Campos, T., Clark, H., Commane, R., Daube, B., Diskin, G. W., Elkins, J. W., Gao, R.-S., Gaudel, A., Hintsa, E. J., Johnson, B. J., Kivi, R., McKain, K., Moore, F. L., Parrish, D. D., Querel, R., Ray, E., Sánchez, R., Sweeney, C., Tarasick, D. W., Thompson, A. M., Thouret, V., Witte, J. C., Wofsy, S. C., and Ryerson, T. B.: Global-scale distribution of ozone in the remote troposphere from the ATom and HIPPO airborne field missions, Atmos. Chem. Phys., 20, 10611–10635, https://doi.org/10.5194/acp-20-10611-2020, 2020.
Brasseur, G. P. and Solomon, S.: Aeronomy of the Middle Atmosphere: Chemistry and Physics of the Stratosphere and Mesosphere, Third revised and enlarged edition, Atmospheric and Oceanographic Sciences Library, 32, Springer, Dordrecht, 2005.
Chen, B., Xu, X. D., Yang, S., and Zhao, T. L.: Climatological perspectives of air transport from atmospheric boundary layer to tropopause layer over Asian monsoon regions during boreal summer inferred from Lagrangian approach, Atmos. Chem. Phys., 12, 5827–5839, https://doi.org/10.5194/acp-12-5827-2012, 2012.
Coheur, P.-F., Herbin, H., Clerbaux, C., Hurtmans, D., Wespes, C., Carleer, M., Turquety, S., Rinsland, C. P., Remedios, J., Hauglustaine, D., Boone, C. D., and Bernath, P. F.: ACE-FTS observation of a young biomass burning plume: first reported measurements of C2H4, C3H6O, H2CO and PAN by infrared occultation from space, Atmos. Chem. Phys., 7, 5437–5446, https://doi.org/10.5194/acp-7-5437-2007, 2007.
Cortesi, U., Lambert, J. C., De Clercq, C., Bianchini, G., Blumenstock, T., Bracher, A., Castelli, E., Catoire, V., Chance, K. V., De Mazière, M., Demoulin, P., Godin-Beekmann, S., Jones, N., Jucks, K., Keim, C., Kerzenmacher, T., Kuellmann, H., Kuttippurath, J., Iarlori, M., Liu, G. Y., Liu, Y., McDermid, I. S., Meijer, Y. J., Mencaraglia, F., Mikuteit, S., Oelhaf, H., Piccolo, C., Pirre, M., Raspollini, P., Ravegnani, F., Reburn, W. J., Redaelli, G., Remedios, J. J., Sembhi, H., Smale, D., Steck, T., Taddei, A., Varotsos, C., Vigouroux, C., Waterfall, A., Wetzel, G., and Wood, S.: Geophysical validation of MIPAS-ENVISAT operational ozone data, Atmos. Chem. Phys., 7, 4807–4867, https://doi.org/10.5194/acp-7-4807-2007, 2007.
Dee, D. P., Uppala, S. M., Simmons, A. J., Berrisford, P., Poli, P., Kobayashi, S., Andrae, U., Balmaseda, M. A., Balsamo, G., Bauer, P., Bechtold, P., Beljaars, A. C. M., van de Berg, L., Bidlot, J., Bormann, N., Delsol, C., Dragani, R., Fuentes, M., Geer, A. J., Haimberger, L., Healy, S. B., Hersbach, H., Hólm, E. V., Isaksen, L., Kållberg, P., Köhler, M., Matricardi, M., McNally, A. P., Monge-Sanz, B. M., Morcrette, J.-J., Park, B.-K., Peubey, C., Rosnay, P. de, Tavolato, C., Thépaut, J.-N., and Vitart, F.: The ERA-Interim reanalysis: configuration and performance of the data assimilation system, Q. J. Roy. Meteor. Soc., 137, 553–597, https://doi.org/10.1002/qj.828, 2011.
de Forster, P. M. F. and Shine, K. P.: Radiative forcing and temperature trends from stratospheric ozone changes, J. Geophys. Res., 102, 10841–10855, https://doi.org/10.1029/96JD03510, 1997.
ECMWF: Copernicus Atmosphere Monitoring Service (CAMS) Reanalysis, available at: https://apps.ecmwf.int/data-catalogues/cams-reanalysis/, last access: 30 November 2020. a
Fadnavis, S., Schultz, M. G., Semeniuk, K., Mahajan, A. S., Pozzoli, L., Sonbawne, S., Ghude, S. D., Kiefer, M., and Eckert, E.: Trends in peroxyacetyl nitrate (PAN) in the upper troposphere and lower stratosphere over southern Asia during the summer monsoon season: regional impacts, Atmos. Chem. Phys., 14, 12725–12743, https://doi.org/10.5194/acp-14-12725-2014, 2014.
Fischer, E. V., Jacob, D. J., Yantosca, R. M., Sulprizio, M. P., Millet, D. B., Mao, J., Paulot, F., Singh, H. B., Roiger, A., Ries, L., Talbot, R. W., Dzepina, K., and Pandey Deolal, S.: Atmospheric peroxyacetyl nitrate (PAN): a global budget and source attribution, Atmos. Chem. Phys., 14, 2679–2698, https://doi.org/10.5194/acp-14-2679-2014, 2014.
Friedl-Vallon, F., Gulde, T., Hase, F., Kleinert, A., Kulessa, T., Maucher, G., Neubert, T., Olschewski, F., Piesch, C., Preusse, P., Rongen, H., Sartorius, C., Schneider, H., Schönfeld, A., Tan, V., Bayer, N., Blank, J., Dapp, R., Ebersoldt, A., Fischer, H., Graf, F., Guggenmoser, T., Höpfner, M., Kaufmann, M., Kretschmer, E., Latzko, T., Nordmeyer, H., Oelhaf, H., Orphal, J., Riese, M., Schardt, G., Schillings, J., Sha, M. K., Suminska-Ebersoldt, O., and Ungermann, J.: Instrument concept of the imaging Fourier transform spectrometer GLORIA, Atmos. Meas. Tech., 7, 3565–3577, https://doi.org/10.5194/amt-7-3565-2014, 2014.
Garny, H. and Randel, W. J.: Transport pathways from the Asian monsoon anticyclone to the stratosphere, Atmos. Chem. Phys., 16, 2703–2718, https://doi.org/10.5194/acp-16-2703-2016, 2016.
Glatthor, N., von Clarmann, T., Stiller, G. P., Funke, B., Koukouli, M. E., Fischer, H., Grabowski, U., Höpfner, M., Kellmann, S., and Linden, A.: Large-scale upper tropospheric pollution observed by MIPAS HCN and C2H6 global distributions, Atmos. Chem. Phys., 9, 9619–9634, https://doi.org/10.5194/acp-9-9619-2009, 2009.
Gordon, I. E., Rothman, L. S., Hill, C., Kochanov, R. V., Tan, Y., Bernath, P. F., Birk, M., Boudon, V., Campargue, A., Chance, K. V., Drouin, B. J., Flaud, J.-M., Gamache, R. R., Hodges, J. T., Jacquemart, D., Perevalov, V. I., Perrin, A., Shine, K. P., Smith, M.-A., Tennyson, J., Toon, G. C., Tran, H., Tyuterev, V. G., Barbe, A., Császár, A. G., Devi, V. M., Furtenbacher, T., Harrison, J. J., Hartmann, J.-M., Jolly, A., Johnson, T. J., Karman, T., Kleiner, I., Kyuberis, A. A., Loos, J., Lyulin, O. M., Massie, S. T., Mikhailenko, S. N., Moazzen-Ahmadi, N., Müller, H., Naumenko, O. V., Nikitin, A. V., Polyansky, O. L., Rey, M., Rotger, M., Sharpe, S. W., Sung, K., Starikova, E., Tashkun, S. A., Auwera, J. V., Wagner, G., Wilzewski, J., Wcisło, P., Yu, S., and Zak, E. J.: The HITRAN2016 molecular spectroscopic database, J. Quant. Spectrosc. Ra., 203, 3–69, https://doi.org/10.1016/j.jqsrt.2017.06.038, 2017.
Granier, C., Bessagnet, B., Bond, T., D'Angiola, A., van der Denier Gon, H., Frost, G. J., Heil, A., Kaiser, J. W., Kinne, S., Klimont, Z., Kloster, S., Lamarque, J.-F., Liousse, C., Masui, T., Meleux, F., Mieville, A., Ohara, T., Raut, J.-C., Riahi, K., Schultz, M. G., Smith, S. J., Thompson, A., van Aardenne, J., van der Werf, G. R., and van Vuuren, D. P.: Evolution of anthropogenic and biomass burning emissions of air pollutants at global and regional scales during the 1980–2010 period, Climatic Change, 109, 163–190, https://doi.org/10.1007/s10584-011-0154-1, 2011.
Grutter, M., Glatthor, N., Stiller, G. P., Fischer, H., Grabowski, U., Höpfner, M., Kellmann, S., Linden, A., and Clarmann, T. von: Global distribution and variability of formic acid as observed by MIPAS-ENVISAT, J. Geophys. Res., 115, D10303, https://doi.org/10.1029/2009JD012980, 2010.
Hansen, J., Sato, M., and Ruedy, R.: Radiative forcing and climate response, J. Geophys. Res., 102, 6831–6864, https://doi.org/10.1029/96JD03436, 1997.
Hanumanthu, S., Vogel, B., Müller, R., Brunamonti, S., Fadnavis, S., Li, D., Ölsner, P., Naja, M., Singh, B. B., Kumar, K. R., Sonbawne, S., Jauhiainen, H., Vömel, H., Luo, B., Jorge, T., Wienhold, F. G., Dirkson, R., and Peter, T.: Strong day-to-day variability of the Asian Tropopause Aerosol Layer (ATAL) in August 2016 at the Himalayan foothills, Atmos. Chem. Phys., 20, 14273–14302, https://doi.org/10.5194/acp-20-14273-2020, 2020.
Hooghiem, J. J. D., Popa, M. E., Röckmann, T., Grooß, J.-U., Tritscher, I., Müller, R., Kivi, R., and Chen, H.: Wildfire smoke in the lower stratosphere identified by in situ CO observations, Atmos. Chem. Phys., 20, 13985–14003, https://doi.org/10.5194/acp-20-13985-2020, 2020.
Höpfner, M., Oelhaf, H., Wetzel, G., Friedl-Vallon, F., Kleinert, A., Lengel, A., Maucher, G., Nordmeyer, H., Glatthor, N., Stiller, G., Clarmann, T. v., Fischer, H., Kröger, C., and Deshler, T.: Evidence of scattering of tropospheric radiation by PSCs in mid-IR limb emission spectra: MIPAS-B observations and KOPRA simulations, Geophys. Res. Lett., 29, 119-1–119-4, https://doi.org/10.1029/2001GL014443, 2002.
Inness, A., Ades, M., Agustí-Panareda, A., Barré, J., Benedictow, A., Blechschmidt, A.-M., Dominguez, J. J., Engelen, R., Eskes, H., Flemming, J., Huijnen, V., Jones, L., Kipling, Z., Massart, S., Parrington, M., Peuch, V.-H., Razinger, M., Remy, S., Schulz, M., and Suttie, M.: The CAMS reanalysis of atmospheric composition, Atmos. Chem. Phys., 19, 3515–3556, https://doi.org/10.5194/acp-19-3515-2019, 2019.
Jöckel, P., Kerkweg, A., Pozzer, A., Sander, R., Tost, H., Riede, H., Baumgaertner, A., Gromov, S., and Kern, B.: Development cycle 2 of the Modular Earth Submodel System (MESSy2), Geosci. Model Dev., 3, 717–752, https://doi.org/10.5194/gmd-3-717-2010, 2010.
Johansson, S., Woiwode, W., Höpfner, M., Friedl-Vallon, F., Kleinert, A., Kretschmer, E., Latzko, T., Orphal, J., Preusse, P., Ungermann, J., Santee, M. L., Jurkat-Witschas, T., Marsing, A., Voigt, C., Giez, A., Krämer, M., Rolf, C., Zahn, A., Engel, A., Sinnhuber, B.-M., and Oelhaf, H.: Airborne limb-imaging measurements of temperature, HNO3, O3, ClONO2, H2O and CFC-12 during the Arctic winter 2015/2016: characterization, in situ validation and comparison to Aura/MLS, Atmos. Meas. Tech., 11, 4737–4756, https://doi.org/10.5194/amt-11-4737-2018, 2018.
Johansson, S., Höpfner, M., Kirner, O., Wohltmann, I., Bucci, S., Legras, B., Friedl-Vallon, F., Glatthor, N., Kretschmer, E., Ungermann, J., and Wetzel, G.: Pollution trace gas distributions and their transport in the Asian monsoon upper troposphere and lowermost stratosphere during the StratoClim campaign 2017, Atmos. Chem. Phys., 20, 14695–14715, https://doi.org/10.5194/acp-20-14695-2020, 2020.
Khare, P., Kumar, N., Kumari, K. M., and Srivastava, S. S.: Atmospheric formic and acetic acids: An overview, Rev. Geophys., 37, 227–248, https://doi.org/10.1029/1998RG900005, 1999.
Khaykin, S. M., Godin-Beekmann, S., Hauchecorne, A., Pelon, J., Ravetta, F., and Keckhut, P.: Stratospheric smoke with unprecedentedly high backscatter observed by lidars above southern France, Geophys. Res. Lett., 45, 1639–1646, https://doi.org/10.1002/2017GL076763, 2018.
Kleinert, A., Friedl-Vallon, F., Guggenmoser, T., Höpfner, M., Neubert, T., Ribalda, R., Sha, M. K., Ungermann, J., Blank, J., Ebersoldt, A., Kretschmer, E., Latzko, T., Oelhaf, H., Olschewski, F., and Preusse, P.: Level 0 to 1 processing of the imaging Fourier transform spectrometer GLORIA: generation of radiometrically and spectrally calibrated spectra, Atmos. Meas. Tech., 7, 4167–4184, https://doi.org/10.5194/amt-7-4167-2014, 2014.
Lamarque, J.-F., Dentener, F., McConnell, J., Ro, C.-U., Shaw, M., Vet, R., Bergmann, D., Cameron-Smith, P., Dalsoren, S., Doherty, R., Faluvegi, G., Ghan, S. J., Josse, B., Lee, Y. H., MacKenzie, I. A., Plummer, D., Shindell, D. T., Skeie, R. B., Stevenson, D. S., Strode, S., Zeng, G., Curran, M., Dahl-Jensen, D., Das, S., Fritzsche, D., and Nolan, M.: Multi-model mean nitrogen and sulfur deposition from the Atmospheric Chemistry and Climate Model Intercomparison Project (ACCMIP): evaluation of historical and projected future changes, Atmos. Chem. Phys., 13, 7997–8018, https://doi.org/10.5194/acp-13-7997-2013, 2013.
Legras, B. and Bucci, S.: Confinement of air in the Asian monsoon anticyclone and pathways of convective air to the stratosphere during the summer season, Atmos. Chem. Phys., 20, 11045–11064, https://doi.org/10.5194/acp-20-11045-2020, 2020.
Lelieveld, J., Crutzen, P. J., Ramanathan, V., Andreae, M. O., Brenninkmeijer, C. M., Campos, T., Cass, G. R., Dickerson, R. R., Fischer, H., Gouw, J. A. de, Hansel, A., Jefferson, A., Kley, D., Laat, A. T. de, Lal, S., Lawrence, M. G., Lobert, J. M., Mayol-Bracero, O. L., Mitra, A. P., Novakov, T., Oltmans, S. J., Prather, K. A., Reiner, T., Rodhe, H., Scheeren, H. A., Sikka, D., and Williams, J.: The Indian Ocean experiment: widespread air pollution from South and Southeast Asia, Science, 291, 1031–1036, https://doi.org/10.1126/science.1057103, 2001.
Lelieveld, J., Bourtsoukidis, E., Brühl, C., Fischer, H., Fuchs, H., Harder, H., Hofzumahaus, A., Holland, F., Marno, D., Neumaier, M., Pozzer, A., Schlager, H., Williams, J., Zahn, A., and Ziereis, H.: The South Asian monsoon-pollution pump and purifier, Science, 361, 270–273, https://doi.org/10.1126/science.aar2501, 2018.
Li, D., Vogel, B., Müller, R., Bian, J., Günther, G., Li, Q., Zhang, J., Bai, Z., Vömel, H., and Riese, M.: High tropospheric ozone in Lhasa within the Asian summer monsoon anticyclone in 2013: influence of convective transport and stratospheric intrusions, Atmos. Chem. Phys., 18, 17979–17994, https://doi.org/10.5194/acp-18-17979-2018, 2018.
Livesey, N. J., Filipiak, M. J., Froidevaux, L., Read, W. G., Lambert, A., Santee, M. L., Jiang, J. H., Pumphrey, H. C., Waters, J. W., Cofield, R. E., Cuddy, D. T., Daffer, W. H., Drouin, B. J., Fuller, R. A., Jarnot, R. F., Jiang, Y. B., Knosp, B. W., Li, Q. B., Perun, V. S., Schwartz, M. J., Snyder, W. V., Stek, P. C., Thurstans, R. P., Wagner, P. A., Avery, M., Browell, E. V., Cammas, J.-P., Christensen, L. E., Diskin, G. S., Gao, R.-S., Jost, H.-J., Loewenstein, M., Lopez, J. D., Nedelec, P., Osterman, G. B., Sachse, G. W., and Webster, C. R.: Validation of Aura Microwave Limb Sounder O3 and CO observations in the upper troposphere and lower stratosphere, J. Geophys. Res., 113, D15S02, https://doi.org/10.1029/2007JD008805, 2008.
Lu, X., Zhang, L., and Shen, L.: Meteorology and Climate Influences on Tropospheric Ozone: a Review of Natural Sources, Chemistry, and Transport Patterns, Curr. Pollution Rep., 5, 238–260, https://doi.org/10.1007/S40726-019-00118-3, 2019.
McKenna, D. S., Konopka, P., Grooß, J.-U., Günther, G., Müller, R., Spang, R., Offermann, D., and Orsolini, Y.: A new Chemical Lagrangian Model of the Stratosphere (CLaMS) 1. Formulation of advection and mixing, J. Geophys. Res., 107, 4309, https://doi.org/10.1029/2000JD000114, 2002a.
McKenna, D. S., Grooß, J.-U., Günther, G., Konopka, P., Müller, R., Carver, G., and Sasano, Y.: A new Chemical Lagrangian Model of the Stratosphere (CLaMS) 2. Formulation of chemistry scheme and initialization, J. Geophys. Res., 107, 4256, https://doi.org/10.1029/2000JD000113, 2002b.
Millet, D. B., Baasandorj, M., Farmer, D. K., Thornton, J. A., Baumann, K., Brophy, P., Chaliyakunnel, S., de Gouw, J. A., Graus, M., Hu, L., Koss, A., Lee, B. H., Lopez-Hilfiker, F. D., Neuman, J. A., Paulot, F., Peischl, J., Pollack, I. B., Ryerson, T. B., Warneke, C., Williams, B. J., and Xu, J.: A large and ubiquitous source of atmospheric formic acid, Atmos. Chem. Phys., 15, 6283–6304, https://doi.org/10.5194/acp-15-6283-2015, 2015.
Monks, S. A., Wilson, C., Emmons, L. K., Hannigan, J. W., Helmig, D., Blake, N. J., and Blake, D. R.: Using an Inverse Model to Reconcile Differences in Simulated and Observed Global Ethane Concentrations and Trends Between 2008 and 2014, J. Geophys. Res.-Atmos., 123, 11262–11282, https://doi.org/10.1029/2017JD028112, 2018.
Montzka, S. A., Butler, J. H., Elkins, J. W., Thompson, T. M., Clarke, A. D., and Lock, L. T.: Present and future trends in the atmospheric burden of ozone-depleting halogens, Nature, 398, 690–694, https://doi.org/10.1038/19499, 1999.
Müller, S., Hoor, P., Bozem, H., Gute, E., Vogel, B., Zahn, A., Bönisch, H., Keber, T., Krämer, M., Rolf, C., Riese, M., Schlager, H., and Engel, A.: Impact of the Asian monsoon on the extratropical lower stratosphere: trace gas observations during TACTS over Europe 2012, Atmos. Chem. Phys., 16, 10573–10589, https://doi.org/10.5194/acp-16-10573-2016, 2016.
Mungall, E. L., Abbatt, J. P. D., Wentzell, J. J. B., Wentworth, G. R., Murphy, J. G., Kunkel, D., Gute, E., Tarasick, D. W., Sharma, S., Cox, C. J., Uttal, T., and Liggio, J.: High gas-phase mixing ratios of formic and acetic acid in the High Arctic, Atmos. Chem. Phys., 18, 10237–10254, https://doi.org/10.5194/acp-18-10237-2018, 2018.
Norton, R. H. and Beer, R.: New apodizing functions for Fourier spectrometry, J. Opt. Soc. Am., 66, 259, https://doi.org/10.1364/JOSA.66.000259, 1976.
Paulot, F., Wunch, D., Crounse, J. D., Toon, G. C., Millet, D. B., DeCarlo, P. F., Vigouroux, C., Deutscher, N. M., González Abad, G., Notholt, J., Warneke, T., Hannigan, J. W., Warneke, C., de Gouw, J. A., Dunlea, E. J., De Mazière, M., Griffith, D. W. T., Bernath, P., Jimenez, J. L., and Wennberg, P. O.: Importance of secondary sources in the atmospheric budgets of formic and acetic acids, Atmos. Chem. Phys., 11, 1989–2013, https://doi.org/10.5194/acp-11-1989-2011, 2011.
Phillips, D. L.: A technique for the numerical solution of certain integral equations of the first kind, J. Assoc. Comput. Math., 9, 84–97, https://doi.org/10.1145/321105.321114, 1962.
Ploeger, F., Konopka, P., Müller, R., Fueglistaler, S., Schmidt, T., Manners, J. C., Grooß, J.-U., Günther, G., Forster, P. M., and Riese, M.: Horizontal transport affecting trace gas seasonality in the Tropical Tropopause Layer (TTL), J. Geophys. Res., 117, D09303, https://doi.org/10.1029/2011JD017267, 2012.
Pommrich, R., Müller, R., Grooß, J.-U., Konopka, P., Ploeger, F., Vogel, B., Tao, M., Hoppe, C. M., Günther, G., Spelten, N., Hoffmann, L., Pumphrey, H.-C., Viciani, S., D'Amato, F., Volk, C. M., Hoor, P., Schlager, H., and Riese, M.: Tropical troposphere to stratosphere transport of carbon monoxide and long-lived trace species in the Chemical Lagrangian Model of the Stratosphere (CLaMS), Geosci. Model Dev., 7, 2895–2916, https://doi.org/10.5194/gmd-7-2895-2014, 2014.
Pumphrey, H. C., Schwartz, M. J., Santee, M. L., Kablick III, G. P., Fromm, M. D., and Livesey, N. J.: Stratospheric pollution from Canadian forest fires, Atmos. Chem. Phys. Discuss. [preprint], https://doi.org/10.5194/acp-2020-840, in review, 2020.
Randel, W. J., Park, M., Emmons, L., Kinnison, D., Bernath, P., Walker, K. A., Boone, C., and Pumphrey, H.: Asian monsoon transport of pollution to the stratosphere, Science, 328, 611–613, https://doi.org/10.1126/science.1182274, 2010.
Reiner, T., Möhler, O., and Arnold, F.: Measurements of acetone, acetic acid, and formic acid in the northern midlatitude upper troposphere and lower stratosphere, J. Geophys. Res., 104, 13943–13952, https://doi.org/10.1029/1999JD900030, 1999.
Remedios, J. J., Leigh, R. J., Waterfall, A. M., Moore, D. P., Sembhi, H., Parkes, I., Greenhough, J., Chipperfield, M. P., and Hauglustaine, D.: MIPAS reference atmospheres and comparisons to V4.61/V4.62 MIPAS level 2 geophysical data sets, Atmos. Chem. Phys. Discuss., 7, 9973–10017, https://doi.org/10.5194/acpd-7-9973-2007, 2007.
Riese, M., Ploeger, F., Rap, A., Vogel, B., Konopka, P., Dameris, M., and Forster, P.: Impact of uncertainties in atmospheric mixing on simulated UTLS composition and related radiative effects, J. Geophys. Res., 117, D16305, https://doi.org/10.1029/2012JD017751, 2012.
Riese, M., Oelhaf, H., Preusse, P., Blank, J., Ern, M., Friedl-Vallon, F., Fischer, H., Guggenmoser, T., Höpfner, M., Hoor, P., Kaufmann, M., Orphal, J., Plöger, F., Spang, R., Suminska-Ebersoldt, O., Ungermann, J., Vogel, B., and Woiwode, W.: Gimballed Limb Observer for Radiance Imaging of the Atmosphere (GLORIA) scientific objectives, Atmos. Meas. Tech., 7, 1915–1928, https://doi.org/10.5194/amt-7-1915-2014, 2014.
Rinsland, C. P., Dufour, G., Boone, C. D., Bernath, P. F., and Chiou, L.: Atmospheric Chemistry Experiment (ACE) measurements of elevated Southern Hemisphere upper tropospheric CO, C2H6, HCN, and C2H2 mixing ratios from biomass burning emissions and long-range transport, Geophys. Res. Lett., 32, 24043, https://doi.org/10.1029/2005GL024214, 2005.
Rinsland, C. P., Boone, C. D., Bernath, P. F., Mahieu, E., Zander, R., Dufour, G., Clerbaux, C., Turquety, S., Chiou, L., McConnell, J. C., Neary, L., and Kaminski, J. W.: First space-based observations of formic acid (HCOOH): Atmospheric Chemistry Experiment austral spring 2004 and 2005 Southern Hemisphere tropical-mid-latitude upper tropospheric measurements, Geophys. Res. Lett., 33, L23804, https://doi.org/10.1029/2006GL027128, 2006.
Rodgers, C. D.: Inverse Methods for Atmospheric Sounding: Theory and Practice, vol. 2 of Series on Atmospheric, Oceanic and Planetary Physics, edited by: Taylor, F. W., World Scientific, Singapore, New Jersey, London, Hong Kong, 2000.
Roeckner, E., Brokopf, R., Esch, M., Giorgetta, M., Hagemann, S., Kornblueh, L., Manzini, E., Schlese, U., and Schulzweida, U.: Sensitivity of Simulated Climate to Horizontal and Vertical Resolution in the ECHAM5 Atmosphere Model, J. Climate, 19, 3771–3791, https://doi.org/10.1175/JCLI3824.1, 2006.
Rudolph, J.: The tropospheric distribution and budget of ethane, J. Geophys. Res., 100, 11369, https://doi.org/10.1029/95JD00693, 1995.
Sander, S. P., Friedl, R. R., Barker, J. R., Golden, D. M., Kurylo, M. J., Wine, P. H., Abbatt, J. P. D., Burkholder, J. B., Kolb, C. E., Moortgat, G. K., Huie, R. E., and Orkin, V. L.: Chemical kinetics and photochemical data for use in atmospheric studies, Evaluation no. 17, JPL Publ. 10-6, Jet Propulsion Laboratory, Pasadena, CA, 2011.
Singh, H., Chen, Y., Tabazadeh, A., Fukui, Y., Bey, I., Yantosca, R., Jacob, D., Arnold, F., Wohlfrom, K., Atlas, E., Flocke, F., Blake, D., Blake, N., Heikes, B., Snow, J., Talbot, R., Gregory, G., Sachse, G., Vay, S., and Kondo, Y.: Distribution and fate of selected oxygenated organic species in the troposphere and lower stratosphere over the Atlantic, J. Geophys. Res., 105, 3795–3805, 2000.
Singh, H., Chen, Y., Staudt, A., Jacob, D., Blake, D., Heikes, B., and Snow, J.: Evidence from the Pacific troposphere for large global sources of oxygenated organic compounds, Nature, 410, 1078–1081, https://doi.org/10.1038/35074067, 2001.
Singh, H. B.: Reactive nitrogen in the troposphere, Environ. Sci. Technol., 21, 320–327, https://doi.org/10.1021/es00158a001, 1987.
Spang, R., Remedios, J., and Barkley, M.: Colour indices for the detection and differentiation of cloud types in infra-red limb emission spectra, Advances in Space Research, 33, 1041–1047, https://doi.org/10.1016/S0273-1177(03)00585-4, 2004.
Stiller, G. P., Clarmann, T. von, Funke, B., Glatthor, N., Hase, F., Höpfner, M., and Linden, A.: Sensitivity of trace gas abundances retrievals from infrared limb emission spectra to simplifying approximations in radiative transfer modelling, J. Quant. Spectrosc. Ra., 72, 249–280, https://doi.org/10.1016/S0022-4073(01)00123-6, 2002.
Tikhonov, A. N.: On the solution of incorrectly stated problems and method of regularization, Dokl. Akad. Nauk. SSSR, 151, 501–504, 1963.
Torres, O., Bhartia, P. K., Taha, G., Jethva, H., Das, S., Colarco, P., Krotkov, N., Omar, A., and Ahn, C.: Stratospheric Injection of Massive Smoke Plume From Canadian Boreal Fires in 2017 as Seen by DSCOVR-EPIC, CALIOP, and OMPS-LP Observations, J. Geophys. Res.-Atmos., 125, e2020JD032579, https://doi.org/10.1029/2020JD032579, 2020.
Ungermann, J., Ern, M., Kaufmann, M., Müller, R., Spang, R., Ploeger, F., Vogel, B., and Riese, M.: Observations of PAN and its confinement in the Asian summer monsoon anticyclone in high spatial resolution, Atmos. Chem. Phys., 16, 8389–8403, https://doi.org/10.5194/acp-16-8389-2016, 2016.
Vogel, B., Günther, G., Müller, R., Grooß, J.-U., Hoor, P., Krämer, M., Müller, S., Zahn, A., and Riese, M.: Fast transport from Southeast Asia boundary layer sources to northern Europe: rapid uplift in typhoons and eastward eddy shedding of the Asian monsoon anticyclone, Atmos. Chem. Phys., 14, 12745–12762, https://doi.org/10.5194/acp-14-12745-2014, 2014.
Vogel, B., Günther, G., Müller, R., Grooß, J.-U., Afchine, A., Bozem, H., Hoor, P., Krämer, M., Müller, S., Riese, M., Rolf, C., Spelten, N., Stiller, G. P., Ungermann, J., and Zahn, A.: Long-range transport pathways of tropospheric source gases originating in Asia into the northern lower stratosphere during the Asian monsoon season 2012, Atmos. Chem. Phys., 16, 15301–15325, https://doi.org/10.5194/acp-16-15301-2016, 2016.
Vogel, B., Müller, R., Günther, G., Spang, R., Hanumanthu, S., Li, D., Riese, M., and Stiller, G. P.: Lagrangian simulations of the transport of young air masses to the top of the Asian monsoon anticyclone and into the tropical pipe, Atmos. Chem. Phys., 19, 6007–6034, https://doi.org/10.5194/acp-19-6007-2019, 2019.
Wang, Y., Ma, Y.-F., Eskes, H., Inness, A., Flemming, J., and Brasseur, G. P.: Evaluation of the CAMS global atmospheric trace gas reanalysis 2003–2016 using aircraft campaign observations, Atmos. Chem. Phys., 20, 4493–4521, https://doi.org/10.5194/acp-20-4493-2020, 2020.
Wetzel, G., Johansson, S., Höpfner, M., Ungermann, J., Glatthor, N., Friedl-Vallon, F., and Kretschmer, E.: GLORIA data for: Pollution trace gases C2H6, C2H2, HCOOH, and PAN in the North Atlantic UTLS: observations and simulations, HALO-DB, available at: https://halo-db.pa.op.dlr.de/mission/96, last access: 20 May 2021. a
Wiegele, A., Glatthor, N., Höpfner, M., Grabowski, U., Kellmann, S., Linden, A., Stiller, G., and von Clarmann, T.: Global distributions of C2H6, C2H2, HCN, and PAN retrieved from MIPAS reduced spectral resolution measurements, Atmos. Meas. Tech., 5, 723–734, https://doi.org/10.5194/amt-5-723-2012, 2012.
Witze, A.: The Arctic is burning like never before – and that's bad news for climate change, Nature, 585, 336–337, https://doi.org/10.1038/d41586-020-02568-y, 2020.
Xiao, Y., Jacob, D. J., and Turquety, S.: Atmospheric acetylene and its relationship with CO as an indicator of air mass age, J. Geophys. Res., 112, D12305, https://doi.org/10.1029/2006JD008268, 2007.
Xiao, Y., Logan, J. A., Jacob, D. J., Hudman, R. C., Yantosca, R., and Blake, D. R.: Global budget of ethane and regional constraints on U.S. sources, J. Geophys. Res., 113, D21306, https://doi.org/10.1029/2007JD009415, 2008.
Xie, F., Tian, W., and Chipperfield, M. P.: Radiative effect of ozone change on stratosphere-troposphere exchange, J. Geophys. Res., 113, D00B09, https://doi.org/10.1029/2008JD009829, 2008.
Yuan, B., Veres, P. R., Warneke, C., Roberts, J. M., Gilman, J. B., Koss, A., Edwards, P. M., Graus, M., Kuster, W. C., Li, S.-M., Wild, R. J., Brown, S. S., Dubé, W. P., Lerner, B. M., Williams, E. J., Johnson, J. E., Quinn, P. K., Bates, T. S., Lefer, B., Hayes, P. L., Jimenez, J. L., Weber, R. J., Zamora, R., Ervens, B., Millet, D. B., Rappenglück, B., and de Gouw, J. A.: Investigation of secondary formation of formic acid: urban environment vs. oil and gas producing region, Atmos. Chem. Phys., 15, 1975–1993, https://doi.org/10.5194/acp-15-1975-2015, 2015.