the Creative Commons Attribution 4.0 License.
the Creative Commons Attribution 4.0 License.
 | 27 May 2021
Central role of nitric oxide in ozone production in the upper tropical troposphere over the Atlantic Ocean and western Africa
Clara M. Nussbaumer
Birger Bohn
Hartwig Harder
Daniel Marno
Monica Martinez
Florian Obersteiner
Uwe Parchatka
Andrea Pozzer
Roland Rohloff
Martin Zöger
Jos Lelieveld
Horst Fischer
Mechanisms of tropospheric ozone (O3) formation are generally well understood. However, studies reporting on net ozone production rates (NOPRs) directly derived from in situ observations are challenging and are sparse in number. To analyze the role of nitric oxide (NO) in net ozone production in the upper tropical troposphere above the Atlantic Ocean and western Africa, we present in situ trace gas observations obtained during the CAFE-Africa (Chemistry of the Atmosphere: Field Experiment in Africa) campaign in August and September 2018. The vertical profile of in situ measured NO along the flight tracks reveals lowest NO mixing ratios of less than 20 pptv between 2 and 8 km altitude and highest mixing ratios of 0.15–0.2 ppbv above 12 km altitude. Spatial distribution of tropospheric NO above 12 km altitude shows that the sporadically enhanced local mixing ratios (>0.4 ppbv) occur over western Africa, which we attribute to episodic lightning events. Measured O3 shows little variability in mixing ratios at 60–70 ppbv, with slightly decreasing and increasing tendencies towards the boundary layer and stratosphere, respectively. Concurrent measurements of CO, CH4, OH, HO2 and H2O enable calculations of NOPRs along the flight tracks and reveal net ozone destruction at −0.6 to −0.2 ppbv h−1 below 6 km altitude and balance of production and destruction around 7–8 km altitude. We report vertical average NOPRs of 0.2–0.4 ppbv h−1 above 12 km altitude with NOPRs occasionally larger than 0.5 ppbv h−1 over western Africa coincident with enhanced NO. We compare the observational results to simulated data retrieved from the general circulation model ECHAM/MESSy Atmospheric Chemistry (EMAC). Although the comparison of mean vertical profiles of NO and O3 indicates good agreement, local deviations between measured and modeled NO are substantial. The vertical tendencies in NOPRs calculated from simulated data largely reproduce those from in situ experimental data. However, the simulation results do not agree well with NOPRs over western Africa. Both measurements and simulations indicate that ozone formation in the upper tropical troposphere is NOx limited.
- Article
(6317 KB) - Full-text XML
-
Supplement
(1136 KB) - BibTeX
- EndNote


The importance of nitrogen oxides () and ozone (O3) in the photochemistry of the atmosphere is widely acknowledged. Both NO and NO2 are toxic gases, which degrade surface air quality and regulate the abundance of secondary tropospheric oxidants (Hosaynali Beygi et al., 2011; Silvern et al., 2018). They are the propagating agents in the formation of O3 and govern photochemical ozone production and removal from the atmosphere (Bozem et al., 2017; Schroeder et al., 2017). Ozone is a greenhouse gas, negatively affects human health and causes ecosystem damage (Jaffe et al., 2018). It is the primary precursor of the hydroxyl (OH) radical, which determines the oxidation capacity of the atmosphere and directly controls the concentrations of methane (CH4), carbon monoxide (CO) and many volatile organic compounds (VOCs) (Thornton et al., 2002; Bozem et al., 2017). The US Clean Air Act identified ozone as a criteria air pollutant in the 1970s (Jaffe et al., 2018). Since then and especially in the last decades, increasing effort has been put into the understanding and mitigation of tropospheric ozone pollution (Fiore et al., 2002; Dentener et al., 2005; West and Fiore, 2005; Lelieveld et al., 2009; Pusede et al., 2015; Jaffe et al., 2018; Nussbaumer and Cohen, 2020; Tadic et al., 2020). To further resolve the complexity of scientific and policy-related issues of the NOx–O3–VOCs relationship, careful evaluation of model simulations against in situ measurement data is required (Sillman et al., 1995).
Photochemical ozone formation in the troposphere has been comprehensively described in the literature. Briefly, O3 is photochemically formed in chemical reactions between NOx, HOx () and VOCs (Crutzen, 1974; Schroeder et al., 2017). VOCs are here referred to as RH where R stands for an organic residual. The oxidation of CO, CH4 and VOCs by OH results in the production of HO2 and peroxy radicals (RO2).
HO2 and RO2 (including CH3O2 and further organic peroxy radicals) rapidly oxidize NO to NO2, which will yield O3 in its subsequent photolysis (Reaction R6) followed by recombination of atomic ground-state oxygen with molecular oxygen (Reaction R7) (Thornton et al., 2002).
The net effect of Reactions (R1)–(R7) on HOx and NOx is zero, which is why both act as catalysts in photochemical O3 production. Ozone loss is due to photolysis (and subsequent reaction of O(1D) with H2O) and reactions of O3 with OH and HO2.
Note that the deactivation of O(1D) to O(3P) via collisions with N2 and O2 will result in the reformation of O3 (Bozem et al., 2017; Tadic et al., 2020). We express the portion of O3 that is effectively lost via photolysis by α (see Sect. 2.2). In this study, we neglect chemical loss reactions of O3 with alkenes, sulfides and halogen radicals. Note that Reactions (R8)–(R11) will be referred to as gross ozone loss, while the rate-limiting reactions of NO with HO2 or RO2 to produce NO2 will be referred to as gross ozone production (Zanis et al., 2000a; Thornton et al., 2002). The difference between these two quantities will yield net ozone production, conventionally given in units of ppbv h−1 (Bozem et al., 2017) or ppbv d−1 (Tadic et al., 2020).
The dependency of NOPRs on ambient levels of NOx is highly nonlinear (Bozem et al., 2017). Due to the abovementioned chemistry gross ozone loss will naturally prevail over gross ozone production at low NOx. Increasing ambient NOx will result in a linear increase in ozone formation such that the chemical air mass will shift from net destruction to net production in ozone (Bozem et al., 2017; Schroeder et al., 2017). However, at a certain NO mixing ratio, which depends on ambient levels of HOx and VOCs, adding more NO to the system will result in a saturation in ozone formation and eventually in a decrease in net ozone production towards higher NO levels (Tadic et al., 2020). This is due to the reaction of NO2 with OH to produce HNO3 followed by its deposition to the surface.
Reaction (R12) will decrease the pool of available HOx and NOx radicals from the atmosphere to produce O3 (Thornton et al., 2002). Ozone formation hence crucially depends on whether NOx or VOCs are available in excess. These two atmospheric states are commonly referred to as either VOC limited (if NOx is available in excess) or as NOx limited (if VOCs are available in excess) (Sillman et al., 1995, 2003; Duncan et al., 2010; Nussbaumer and Cohen, 2020; Tadic et al., 2020).
The lifetime of NOx in the atmosphere varies from a few hours in the planetary boundary layer (PBL) to 1–2 weeks in the upper troposphere/lower stratosphere (UTLS) (Beirle et al., 2010). In the latter, the reaction of NO2 with OH during daytime and NO3 formation at nighttime is slowed down due to low ambient pressure and temperature. Transport of NOx from polluted regions to pristine areas is limited due to the short lifetime of NOx in the PBL (Reed et al., 2016), which is why NOx in the troposphere can vary over several orders of magnitude (Miyazaki et al., 2017; Tadic et al., 2020). Whilst measurements performed in remote and pristine regions, such as in the unpolluted South Atlantic marine boundary layer (MBL), have reported NOx mixing ratios of only a few tens of pptv (Hosaynali Beygi et al., 2011; Fischer et al., 2015), NOx mixing ratios in urban areas can exceed several tens of ppbv (Lu et al., 2010). Measurements obtained in the polluted MBL around the Arabian Peninsula have shown that NOx mixing ratios can locally exceed several tens of ppbv even in marine environments in the proximity to strong emission sources such as passing ships or downwind of megacities (Tadic et al., 2020).
Ground-level NOx emissions include fossil fuel combustion, biomass burning and soil emissions (Silvern et al., 2018). Lightning NOx (LNOx), aircraft emissions, and, to a lesser extent, convective uplift of potentially NOx-rich planetary boundary air and intrusion of stratospheric air are predominant sources of NOx in the upper troposphere (Bozem et al., 2017; Miyazaki et al., 2017). However, estimates of lightning-produced NOx are uncertain (Beirle et al., 2010; Miyazaki et al., 2017) and can have large implications on the photochemistry of the upper troposphere such as over tropical areas where lightning flash rates are enhanced (Christian et al., 2003; Tost et al., 2007).
A number of previous studies have performed measurements in the region of interest, which is the troposphere over the Atlantic Ocean and western Africa (Lelieveld et al., 2004; Aghedo et al., 2007; Saunois et al., 2009; Real et al., 2010; Bourgeois et al., 2020). Lelieveld et al. (2004) indicated that positive ozone trends in the marine boundary layer over the Atlantic are likely caused by an increase in anthropogenic emissions of nitrogen oxides. Aghedo et al. (2007) showed that lightning acts as a major source of tropospheric NOx, leading to a significant increase in middle and upper tropospheric ozone over the African continent. Saunois et al. (2009) described results from airborne measurements in the region during the AMMA project. Deploying a two-dimensional model for further analysis, Saunois et al. (2009) determined positive trends in photochemical net ozone production in the boundary layer over western Africa. There are also results from the ATom airborne mission, which measured vertical profiles of O3 in the troposphere over the Atlantic Ocean (Bourgeois et al., 2020), which we will use to validate the results presented here. Real et al. (2010) investigated downwind O3 production in pollution plumes in the mid and upper troposphere and determined mean net ozone production rates of 2.6 ppbv d−1 over a period of 10 d. However, studies reporting on vertical profiles and spatial distributions of nitric oxide, ozone and net ozone production rates as part of one coherent measurement project in the troposphere over western Africa and the Atlantic Ocean are absent.
In the present study, we characterize the distribution of NO and the role of NO in photochemical processes in the upper tropical troposphere above the Atlantic Ocean and western Africa. The structure of the paper is as follows: we provide methodological, practical and technical information about the campaign and deployed instrumentation in Sect. 2. In Sect. 3 we present in situ NO and O3 data obtained during the campaign including vertical profiles and spatial distributions. Based on concurrent measurements of CO, CH4, OH, HO2, and H2O, the actinic flux density, pressure and temperature net O3 production rates (NOPRs) were calculated along the flight tracks. We also provide a comparison of the observational results to simulated data retrieved from the 3-D EMAC model and analyze the dependency of NOPRs on ambient NO. In Sect. 4, we summarize our results and draw conclusions based on our findings.
2.1 CAFE-Africa campaign
The airborne measurement-based CAFE-Africa project took place in August and September 2018 in the tropical troposphere over the central Atlantic Ocean and western Africa. Starting from and returning to the international airport on Sal, Cabo Verde (16.75∘ N, 22.95∘ W), a total of 14 scientific measurement flights (MFs) was carried out with the German High Altitude and Long-range research aircraft (HALO). For the analysis of the MFs, we consecutively numerate each MF, starting with MF03 on 7 August 2018 for the ferry flight from Oberpfaffenhofen (Germany, Deutsches Zentrum für Luft- und Raumfahrt) to Sal (Cabo Verde islands) on and ending with MF16 on 7 September 2018 for the back ferry flight from Sal to Oberpfaffenhofen. The test flights MF01 and MF02 conducted over Germany are not included in this study. MF03–MF16 covered a latitudinal range from 8∘ S to 48.2∘ N and a longitudinal range from 47.9∘ W to 12.5∘ E and reached maximum flight altitudes of about 15 km. Before landing at the home base airport in Sal, a fixed-altitude leg of 30 min duration at FL150 (∼4600 m altitude) was flown for calibration purposes. Take off (T/O) time of the flights was typically 09:00 or 10:00 UTC, except for MF08 with T/O at 04:00 UTC and landing around 13:00 UTC and MF11 with T/O at 16:00 UTC and landing around 01:00 UTC the next day.
The location of the campaign home base on Sal provided the unique possibility to analyze the impact of the Intertropical Convergence Zone (ITCZ) on physical and chemical processes in the airspace above the Atlantic Ocean and western Africa. The ITCZ is a low-pressure region evolving near the Equator, which is characterized by deep convection, strong precipitation and frequent lightning (Collier and Hughes, 2011), producing nitrogen oxides, mostly as NO through the Zeldovich reactions from atmospheric N2 and O2. The campaign was performed in late summer (August and September) 2018 when the ITCZ had reached its northernmost position at around 5–15∘ N (Collier and Hughes, 2011) and was henceforth located only a few degrees in latitude to the south of the campaign base at 16.75∘ N. The flight tracks of the 14 MFs performed during the campaign are shown in Fig. 1. An overview of the corresponding flight dates and objectives of each particular MF is given in Table S1 in the Supplement.
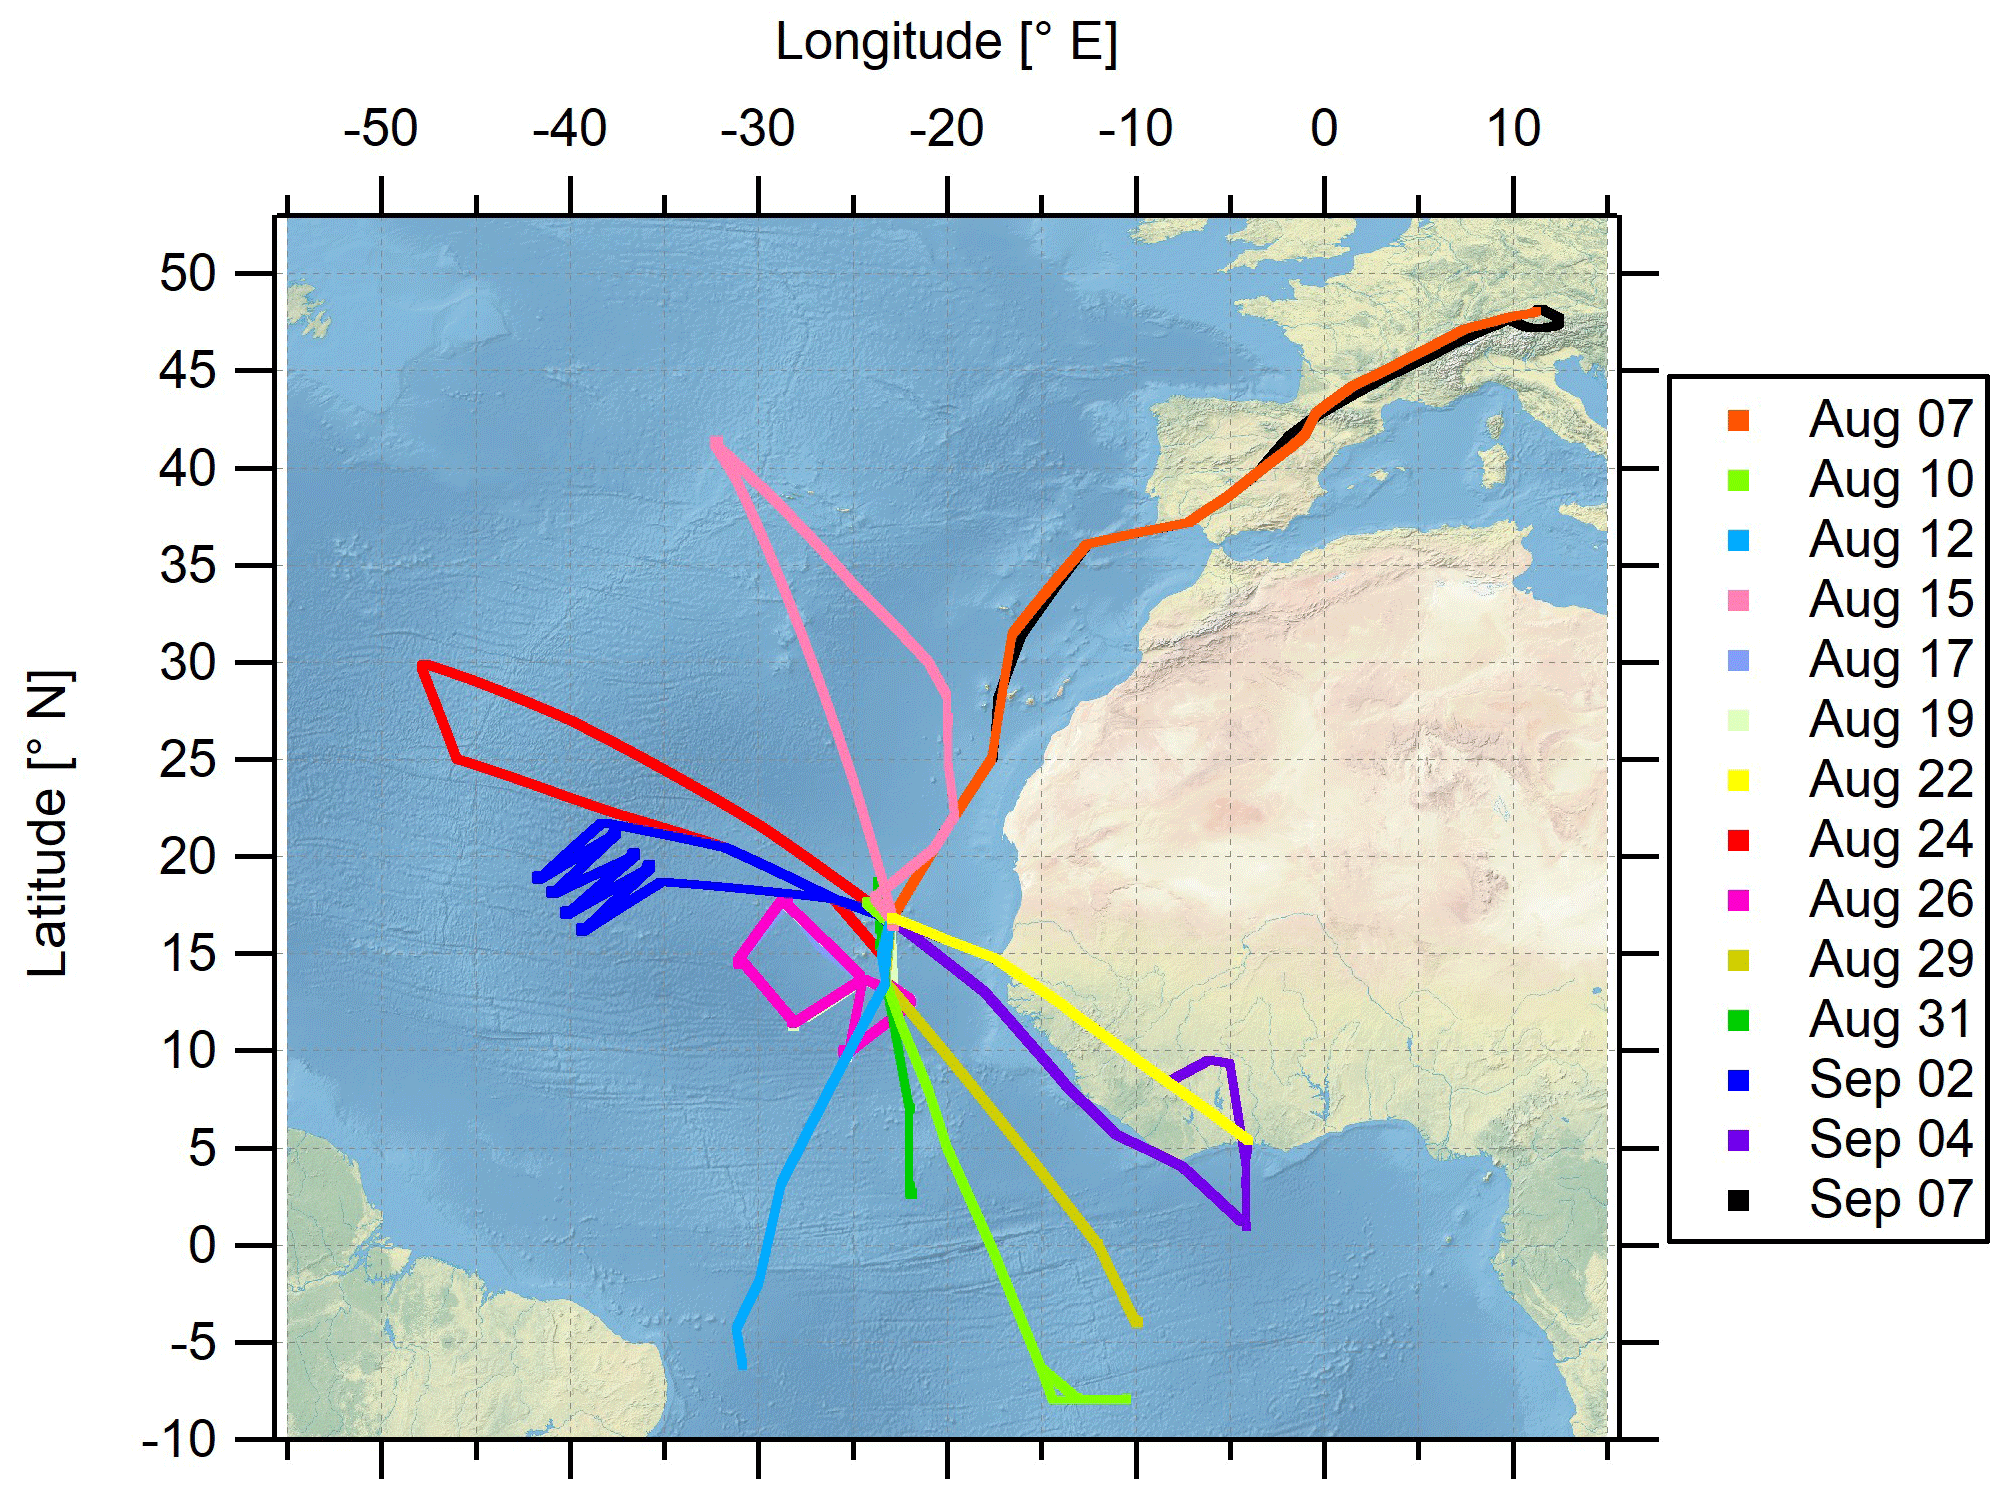
Figure 1Spatial orientation of the measurement flight tracks during CAFE-Africa. Note that MF07 (17 August 2018), MF08 (19 August 2018) and MF11 (26 August 2018) had identical flight tracks.
2.2 Chemiluminescent detection of NO
In situ measurements of NOx on ground-based and mobile platforms are challenging in terms of the demand for high sensitivity and high precision (Tadic et al., 2020). During CAFE-Africa, we deployed a modified commercially available chemiluminescent detector CLD 790 SR (ECO Physics Inc., Dürnten, Switzerland) aboard HALO. It is the same instrument that has been used during previous shipborne (Hosaynali Beygi et al., 2011; Tadic et al., 2020) and airborne campaigns (Bozem et al., 2017). The measurement method is based on the gas-phase reaction of NO with O3, which will partly produce excited-state followed by the spontaneous emission (chemiluminescence) of a photon (Ridley and Howlett, 1974; Ryerson et al., 2002).
Photons generated through the emissions from excited-state , which are directly proportional to the NO concentration in the sample flow (Ridley and Howlett, 1967), are detected by a photomultiplier tube and converted to an electric pulse. Carrying out the oxidation of NO by O3 at low pressure (7–8 mbar) and in a temperature-stabilized (25 ∘C) main reaction chamber minimizes quenching (non-radiative de-excitation of via collisions) (Reed et al., 2016; Tadic et al., 2020). Detector dark noise and artifacts due to the reaction of O3 with species other than NO (such as alkenes and sulfides) are corrected for by using a pre-chamber setup, as first described by Ridley and Howlett (1967). A residual instrumental background (due to memory effects within the instrument) is corrected for by regularly sampling synthetic zero air (Tadic et al., 2020). During the MFs, we sampled zero air from a tank (17 L composite tank, AVOX) with a Purafil-activated carbon adsorbent installed downstream of the zero-air tank to ensure NO-free zero-air measurements. The residual instrumental background of the NO measurement was calculated at 5 pptv from measurements obtained at nighttime during MF11. As chemiluminescent detection of NO is an indirect measurement method, regular calibrations against a known standard are needed. During the MFs, we diluted the secondary NO standard (1.187±0.036 ppmv NO in N2) at a mass flow of 8.6 sccm in a zero-air flow of 3.44 slpm (standard liter per minute), resulting in NO calibration gas mixing ratios of ∼3 ppbv. NO calibration measurements were performed six to eight times during a MF of 9–10 h duration by manually initiating calibration slots consisting of 2 min zero-air measurement, 2 min NO calibration and 2 min zero-air measurement, similar to previous deployments of the instrument (see Tadic et al., 2020).
The limit of detection (LOD) of the NO data was calculated at 9 pptv from the FWHM (full width at half maximum) of a Gauss fit applied to the distribution of 1 s NO data obtained at nighttime during MF11 (see Fig. S1 in the Supplement). Analogously we estimate the LOD of the NO data at 1 min time resolution to be 5 pptv from the FWHM of a Gauss fit applied to the distribution of 1 min NO data obtained at nighttime during MF11. The precision of the NO data was calculated from the average reproducibility of all in-flight calibrations to be 5 % at 1σ. The uncertainty in the used secondary standard mixing ratio was 3 %. The total measurement uncertainty (TMU) of the NO data was estimated at 6 % as the quadratic sum of the precision and the uncertainty of the secondary standard (Tadic et al., 2020).
2.3 Further measurements used in this study
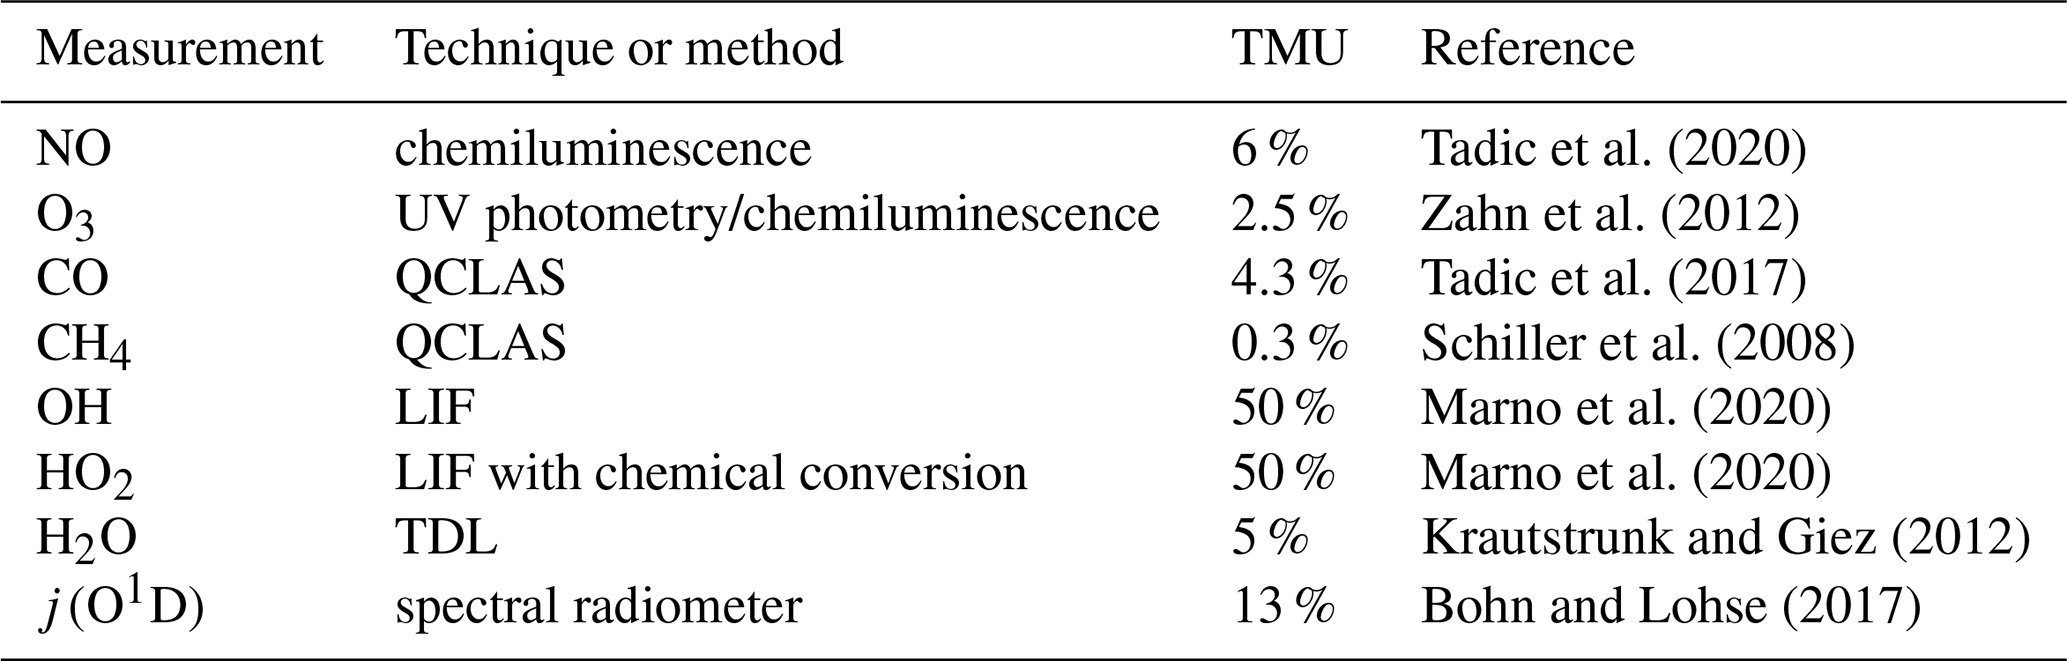
O3 was quantified with a chemiluminescence detector calibrated by a UV photometer (Fast AIRborne Ozone instrument; Zahn et al., 2012). CO and CH4 were measured by mid-infrared quantum cascade laser absorption spectroscopy (QCLAS) with TRISTAR, a multichannel spectrometer (Schiller et al., 2008; Tadic et al., 2017). OH and HO2 radicals were measured by laser-induced fluorescence with the custom-built HORUS instrument (Marno et al., 2020). Note that both OH and HO2 data are preliminary. We conservatively estimate the total relative measurement uncertainty of the OH and HO2 data at 50 %. Spectrally resolved actinic flux density measurements were obtained with upward- and downward-looking spectroradiometers installed on the top and bottom of the aircraft fuselage, respectively. The particular photolysis frequencies were calculated from the actinic flux density spectra between 280 and 650 nm (Bohn and Lohse, 2017). The uncertainty in the used j values was estimated to be 13 %. Water vapor mixing ratio and further derived humidity parameters were measured by SHARC (Sophisticated Hygrometer for Atmospheric ResearCh) based on dual-path direct absorption measurement by a tunable diode laser (TDL) system (Krautstrunk and Giez, 2012). The measurement range of SHARC covers the whole troposphere and lower stratosphere (5–40 000 ppmv) with an absolute accuracy of 5 % (+1 ppmv). The BAHAMAS (BAsic HALO Measurement And Sensor System) provided measurements of temperature and pressure (Krautstrunk and Giez, 2012). All instruments deployed on the aircraft have been developed to meet the high standards of airborne measurements in terms of operability, accuracy and sensitivity. Table 1 lists the used instrumentation with the associated total measurement uncertainties. A reference is given regarding the use of each method during previous measurements.
Table 1List of performed observations with the corresponding total measurement uncertainty (given as a percentage) during CAFE-Africa. The last column provides a reference regarding the practical use of the used measurement or instrument.
2.4 ECHAM/MESSy Atmospheric Chemistry (EMAC) model and data analysis
EMAC is a 3-D global general circulation, atmospheric chemistry–climate model, which has been used and described in a number of previous studies (Roeckner et al., 2006; Jöckel et al., 2010; Sander et al., 2019; Tadic et al., 2020). Briefly, EMAC comprises the fifth generation of the European Center Hamburg (ECHAM5) circulation model (Roeckner et al., 2006) and the Modular Earth Submodel System (MESSy) in version 2.52 (Jöckel et al., 2010). Here we use the model in the T63L47 resolution with a spatial resolution of roughly , with 47 vertical levels and one data point every 6 min. The model has been weakly nudged towards the ECMWF ERA-Interim data (Jeucken et al., 1996; Berrisford et al., 2009). The chemical mechanism (the Mainz Organic Mechanism, MOM) and the photolysis rate calculations used in this work have been presented in Sander et al. (2019) and in Sander et al. (2014), respectively. The Emissions Database for Global Atmospheric Research (EDGARv4.3.2; Crippa et al., 2018) data were used for anthropogenic emissions, while biomass burning emissions were from the GFAS (Global Fire Assimilation System) database with a daily temporal resolution (Kaiser et al., 2012). Important for this work, the NOx emissions from lightning activity have been estimated using the submodel LNOX (Tost et al., 2007), where the parameterization by Grewe et al. (2001) was applied. The global NOx emissions from lightning were scaled to 6.3 Tg(N) yr−1, following Miyazaki et al. (2014). Tracer and aerosol wet and dry deposition were estimated following Tost et al. (2006) and Kerkweg et al. (2006), respectively. The NOx soil biogenic emission flux is calculated based on a semiempirical emission algorithm implementation by Yienger and Levy (1995) and Kerkweg et al. (2006). For the current study, we use EMAC simulations of NO, O3, OH, HO2, CH3O2, specific humidity, j(O1D), temperature and pressure spatially interpolated to the flight tracks (latitude, longitude and altitude). Based on the simulations, we perform calculations of α and NOPRs along the flight tracks (see Sect. 2.5). To synchronize the time stamp of the model data (6 min) with the measurement data (1 min), we have calculated a running mean of the measurement data within ±2 min around the simulated data point along the measurement flight tracks such that every sixth measurement data point (if available) was neglected.
2.5 Calculation of net ozone production rates (NOPRs)
Calculation of NOPRs utilizes the chemical reactions related to ozone formation described in the introduction. EMAC model calculations show that during CAFE-Africa CH3O2 represents on average 80 % of the sum of all organic peroxy radicals with respect to ozone formation at typical flight altitudes of 200 hPa (and even up to 90 % at lower altitudes). Model calculations further show that the sum of HO2 and CH3O2 represents on average 95 % of the sum of HO2 and all organic peroxy radicals (RO2), yielding that the ratio is practically one. In analogy to Tadic et al. (2017), we estimated RO2 as the sum of all organic peroxy radicals with less than four carbon atoms. See Table S2 for an overview of the used organic peroxy radicals. Therewith we calculate photochemical gross production of O3 by the rate-limiting reaction of NO with HO2 and CH3O2 (Thornton et al., 2002; Bozem et al., 2017).
The IUPAC Task Group on Atmospheric Chemical Kinetic Data Evaluation (Atkinson et al., 2004, 2006) provides rate coefficients used in this study. Note that other studies use P(O3)gross as an acronym for P(O3) in Eq. (2). The photochemical lifetimes of both HO2 and CH3O2 are similar with respect to self-reactions yielding hydrogen peroxide and methyl hydroperoxide and reactions with NO and HOx (Bozem et al., 2017). We further assume photostationary steady state (PSS) for the probed air masses. As the typical time to acquire PSS during CAFE-Africa varied between 40 s at 2 km altitude and about 70–80 s at 15 km altitude (Mannschreck et al., 2004; Tadic et al., 2020), we can calculate the concentration of CH3O2 by the equation derived by Bozem et al. (2017).
Note that the reaction of CO with OH represents the dominant term in HO2 production during CAFE-Africa. Assuming mixing ratios of 500 ppbv and 100 pptv for H2 and HCHO, respectively, we find that HO2 production rate from the reaction of OH with CO is on average 5 times greater than the sum of the HO2 production rates from photolysis of HCHO and the reactions of HCHO and H2 with OH during CAFE-Africa. Note that the assumed mixing ratio of 100 pptv represents a rather conservative upper estimate for HCHO in the upper troposphere. As mentioned above, ozone loss due to photolysis (and subsequent reaction of O(1D) with H2O) will only partly lead to a net loss effect as most O(1D) will deactivate via collisions with air molecules, mostly N2 and O2, to O(3P) and reform O3 in the subsequent reaction with O2. The share of O3 photolysis that will eventually lead to a net loss in O3 can be calculated using Eq. (4) (Bozem et al., 2017; Tadic et al., 2020).
In the troposphere, α ranges from about 15 % in the PBL to 1 % in the upper troposphere, where absolute humidity is very low (Bozem et al., 2017). Further loss processes of O3 (reactions with alkenes, sulfides and halogen radicals) are considered small and are therefore neglected in this study. Equation (5) then gives gross loss of ozone.
j(O1D) expresses the photolysis frequency of ozone to O(1D). The NOPR is given as the difference of the gross ozone production rate (Eq. 2) and the gross ozone loss rate (Eq. 5) (Lin et al., 1988; Cantrell et al., 2003).
Note that other studies use P(O3)net as an acronym for NOPR in Eq. (6).
3.1 Vertical profiles of NO and O3 in the tropical troposphere
In the following, we will investigate averages of the vertical profiles, which are calculated based on an altitude bin width of 1 km. The profiles are calculated with respect to the center of the particular bin, e.g., the average at 3.5 km includes all data points obtained at or above 3 km altitude and below 4 km altitude. Data are filtered for stratospheric influence by removing all data points for which concurrent O3 concentration is larger than 100 ppbv; this is a conservative criterion which has been discussed by Prather et al. (2011). Figure 2 shows the vertical NO and O3 profiles obtained during CAFE-Africa. The orange and blue lines represent vertical average profiles of experimental and model-simulated data, respectively. The blue and orange shading in the respective colors represent the ±1 standard deviation of the vertical averages.
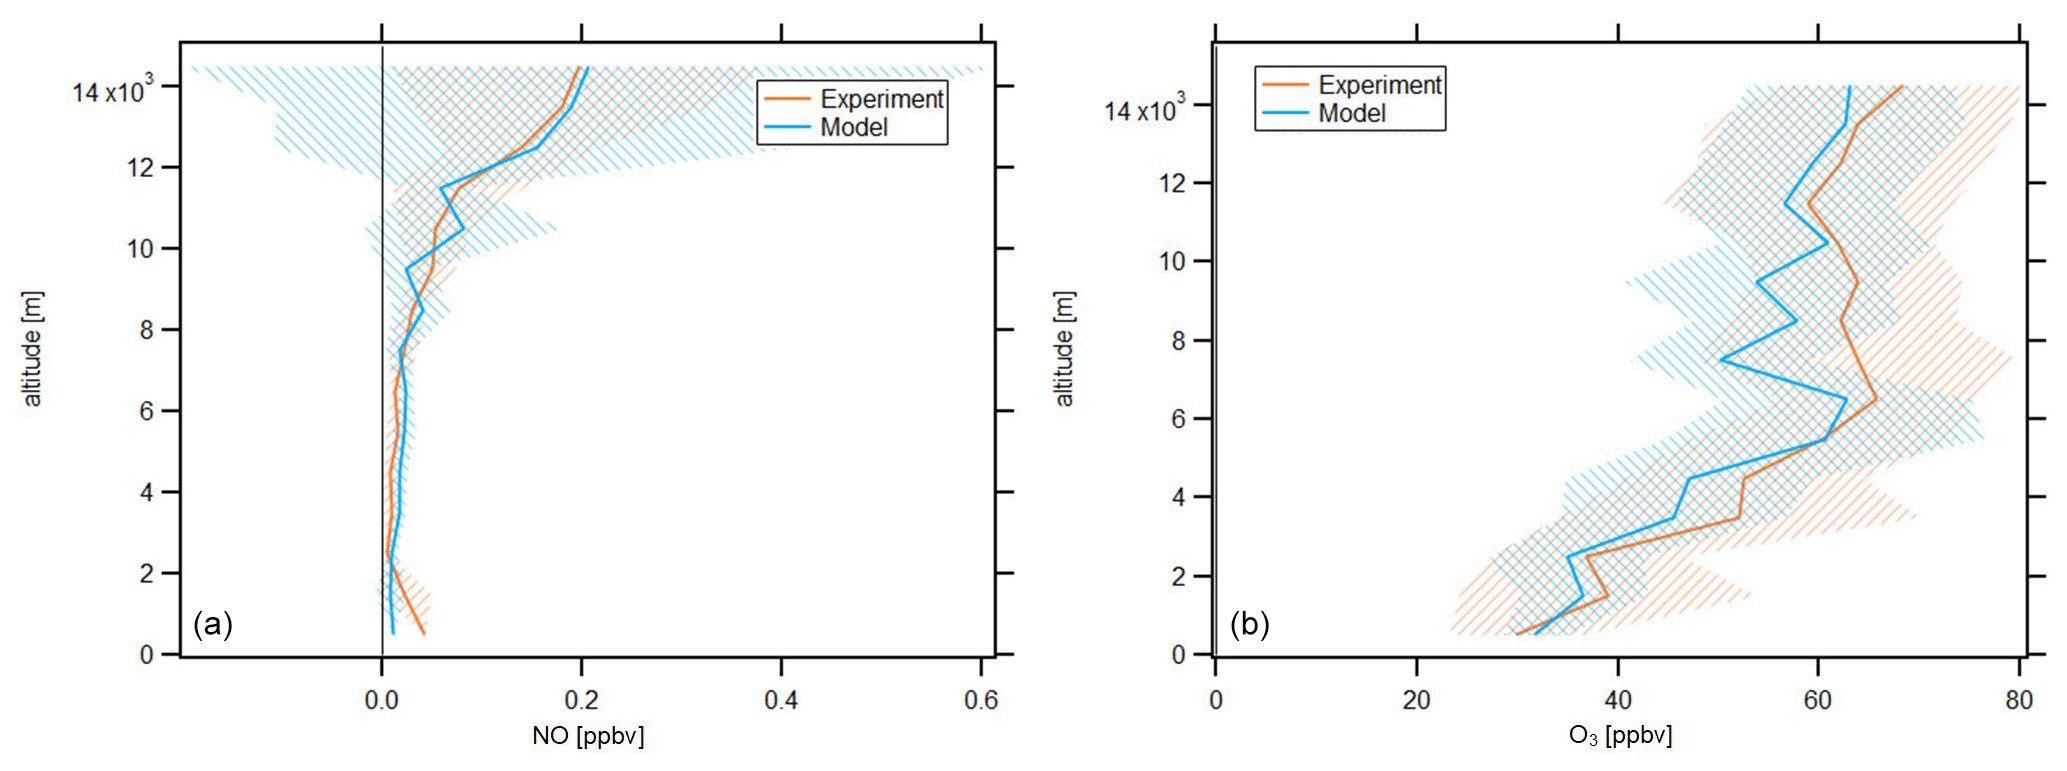
Figure 2Vertical NO (a) and O3 profiles (b) of measured and modeled data along the flight tracks during CAFE-Africa. Note the large variability of simulated NO mixing ratios above 10 km. The figures have been filtered for stratospheric measurements by removing data points for which O3 exceeds 100 ppbv.
The vertical profile of measured NO data shows lowest NO mixing ratios of less than 20 pptv observed between 2 and 8 km altitude, which reflect the absence of emission and transport sources at these altitudes. Highest NO mixing ratios of 0.15–0.2 ppbv are observed above 12 km altitude and reflect the increasing amount of lightning-produced NOx, and to a lesser extent influence of relatively NOx-rich stratospheric air. Below 2 km altitude, the vertical profile shows a weak increase of NO, which reproduces the low amount of anthropogenic sources in the investigated MBL and PBL in proximity to the Cabo Verde islands. This suggests that the contribution of local convective uplift of PBL air to the increased NOx above 12 km altitude is negligible.
The vertical average profile of simulated NO data is in good agreement with the vertical profile of measured NO data, which is also indicated by the median ratio throughout the whole campaign at 0.97. Although the vertical profiles are in overall agreement, the variability when comparing single measurement and simulation data points is substantial, as indicated by the large variability of simulated NO data above 10 km altitude. The 25th percentile, 75th percentile and average of the ratio throughout the whole campaign are 0.25, 2.2 and 2.27, respectively, which illustrate the significant spread among measurement and model data in a comparison of individual data points. The minimum and maximum mixing ratios of modeled NO are zero and 2.13 ppbv, respectively. The minimum and maximum mixing ratios of observed NO are zero and 0.95 ppbv, respectively.
The average vertical profile of measured O3 shows lowest mixing ratios of 30–40 ppbv below 3 km altitude and a steady increase in O3 at about 5–10 ppbv per kilometer altitude to mixing ratios of 60–65 ppbv at 6 km. Above this altitude, O3 is relatively constant (60–65 ppbv) until it further increases above 12 km altitude, simultaneous with the increase in NO.
Although simulated O3 slightly underestimates the measurement data throughout the troposphere, we find that the vertical profiles of simulated and measured O3 data are in again in good agreement. EMAC O3 data match lowest mixing ratios of 30–40 ppbv observed below altitudes of 3 km as well as the vertical gradient in O3 mixing ratios between 3 and 6 km with mixing ratios of 60 ppbv at 6 km altitude. Above 6 km altitude, both the vertically constant O3 mixing ratio as well as the further increase in O3 above 12 km altitude deduced from the measurements are well reproduced by the model. Except for lowest altitudes (<1 km), it seems that simulated O3 mixing ratios slightly underestimate the measurement data. This is confirmed by the median and average ratio throughout the campaign at 0.97 and 0.98, respectively, confirming the general agreement between measurements and simulations, as well as the slight underestimation by the latter. The 25th percentile and 75th percentile of the ratio are 0.85 and 1.11, respectively, and indicate that the spread among single data points when comparing measurement and model for O3 is less than for NO.
O3 profiles observed in this study are in good agreement with results from the ATom mission (Bourgeois et al., 2020). For the June–August season, Bourgeois et al. (2020) show that in the tropical troposphere O3 increased with altitude to 50 ppbv at 5–6 km, whereas above 9 km O3 varied from 40 to 80 ppbv, supporting the results presented here (see Figs. 9 and 10 in Bourgeois et al., 2020).
3.2 Spatial distribution of NO and O3 in the upper tropical troposphere
As most of the measurement time (>60 %) of the CAFE-Africa campaign was dedicated to upper tropospheric measurements above 12 km altitude and as both NO and O3 show highest mean mixing ratios above 12 km altitude, we characterize the spatial distribution of NO and O3 above that altitude in the following. Data above 12 km altitude have been aggregated and averaged over a spatial grid. We again remove stratospheric measurement data by only considering those for which O3 was below 100 ppbv. Note that this does not necessarily exclude influence of mixing with air of stratospheric origin. Figure 3 shows the color-coded spatial NO distributions based on the measured data (left plot) and simulated data (middle plot). The right plot shows the tropospheric average spatial distribution of the point-by-point ratio above 12 km. Note that the color scales presented in the following emphasize the most relevant features of the spatial distribution. Thus a few single data points might exceed the given color range, such as in the case of simulated NO (Fig. 3b) with single maximum NO mixing ratios of >1 ppbv.
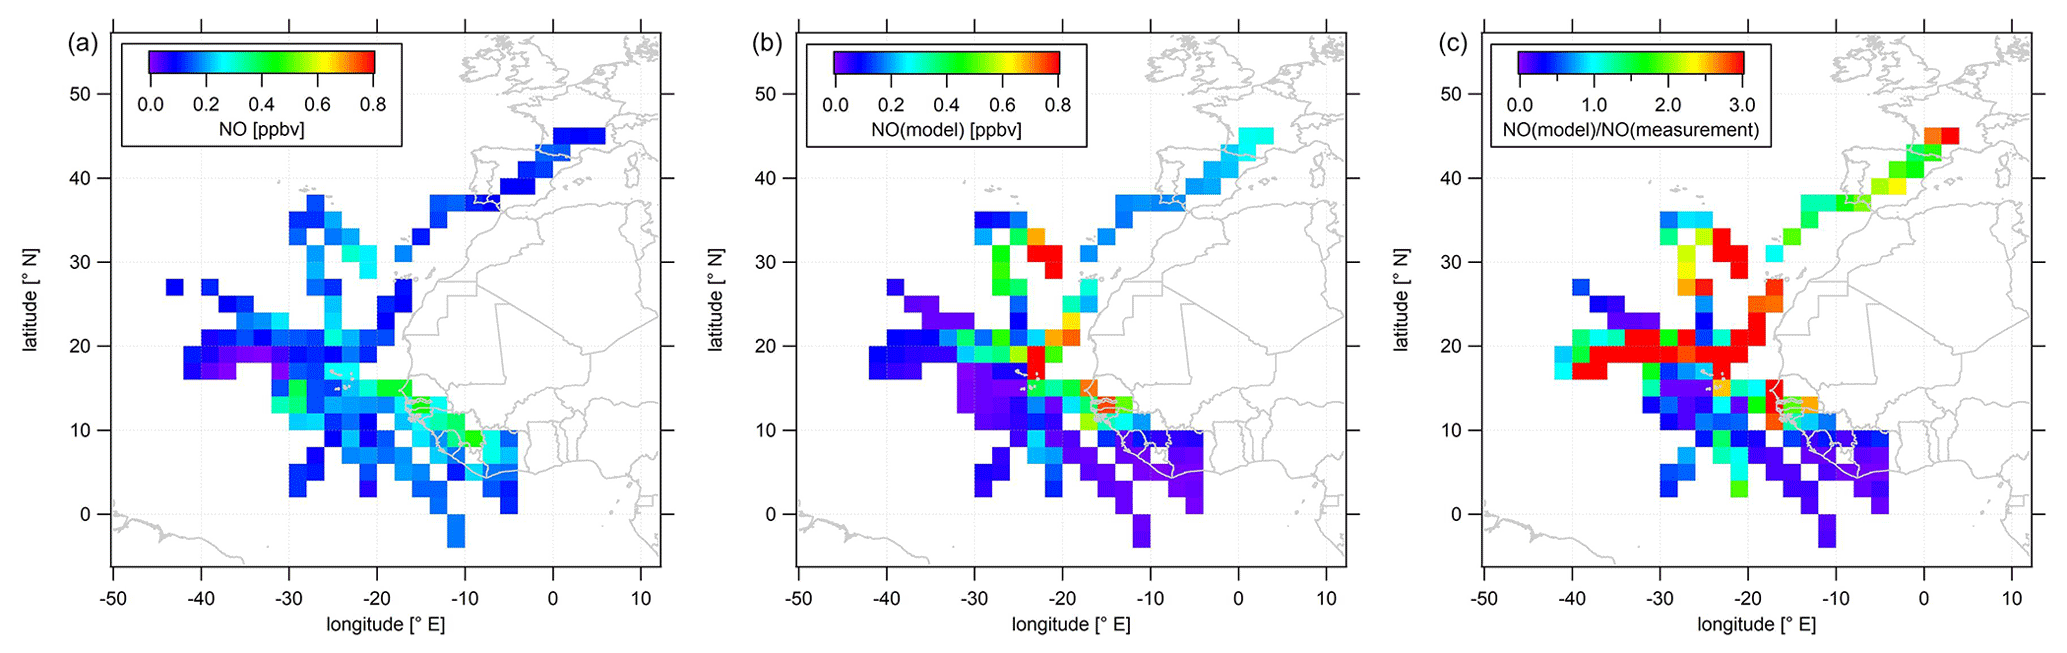
Figure 3Color-coded spatial, tropospheric NO distributions above 12 km during CAFE-Africa. Panels (a, b) show the measured and simulated NO concentrations, respectively. Panel (c) shows the spatial distribution of the ratio. The figures have been filtered for stratospheric measurements by removing data points for which O3 exceeds 100 ppbv.
The spatial distribution of NO from the measurement data shows that NO in the upper tropical troposphere above western Africa and the Atlantic Ocean is generally 0.1–0.2 ppbv. The range in mixing ratios includes lowest NO of less than 20 pptv observed between −30 to −40∘ E and 16 to 20∘ N close to a deep convective system without lightning to mixing ratios of 0.1–0.2 ppbv over wide areas over the Atlantic Ocean to (more than) 0.4 ppbv over western Africa. Although deep convective systems over oceanic regions rarely evolve lightning (Zipser, 1994), we encountered large amounts of NO close to a marine cumulonimbus cloud system with potential lightning activity resulting in more than 0.3 ppbv NO at −28 to −32∘ E and at 12 to 16∘ N. The coincidence of the ITCZ (5 to 15∘ N during August and September) and enhancements in upper tropospheric NO above western Africa underlines the substantial influence of the seasonal migration of the ITCZ and its impact on lightning and nitrogen oxides in the upper tropical troposphere (Zipser, 1994; Xu and Zipser, 2012). The data also suggest a longitudinal increase in NO from about 0.1 ppbv observed at −40∘ E westbound to 0.4 ppbv above western Africa. Note that we observe a slight decrease in upper tropospheric NO over the Côte d'Ivoire and partly also over Guinea compared to upper tropospheric NO over Senegal, although the lightning flash rate over the Côte d'Ivoire and Guinea is reported to be a factor of about 3 larger than that over Senegal (Collier and Hughes, 2011). A linear fit applied to the longitudinal average profile of all NO data weighted by the standard deviation and collected in the troposphere above 12 km altitude between −42 and −8∘ E reveals an increase in average NO of 4–5 pptv per degree longitude (see Fig. S2).
Although the comparison of the vertical profiles of measured and simulated NO suggests generally good correspondence between measurements and model simulations, the agreement with respect to the spatial NO distributions in the upper troposphere is much less satisfactory. The EMAC model does not reproduce the large NO enhancements in the area of the ITCZ, as shown in the latitudinal profile of measured and simulated tropospheric NO data above 12 km in Fig. S3. On contrary the model tends to underestimate the observations south of 10∘ N. Interestingly, this holds also for observations above western Africa (except for the airspace over Senegal around 12 to 14∘ N) where simulated NO mixing ratios are highest. This general underestimation of the measurements by the model over large parts of western Africa extends to large parts of the Atlantic Ocean between 5 to 15∘ N. On the other hand, further north the model tends to overestimate the measurements across large areas north of 16∘ N and west of −20∘ E with spatially averaged mixing ratios that exceed 1 ppbv. However, reasonable agreement between measurements and numerical results is observed towards and over southern Europe.
Figure 4 shows color-coded spatial O3 distributions based on observations (a) and simulated data (b). Figure 4c shows the average tropospheric distribution of the point-by-point ratio. In analogy to Fig. S3, Fig. S4 shows latitudinal profiles of measured and simulated O3 mixing ratios obtained above 12 km in the troposphere.

Figure 4Color-coded spatial, tropospheric O3 distributions above 12 km during CAFE-Africa. Panels (a, b) show the spatial distribution of measured and simulated O3, respectively. Panel (c) shows the spatial distribution of the ratio. The figures have been filtered for stratospheric measurements by removing data points for which O3 exceeds 100 ppbv.
Measured O3 shows a rather uniform distribution in the upper troposphere above the Atlantic Ocean and western Africa. The observed mixing ratios range from less than 40 ppbv between −30 to −40∘ E and 16 to 20∘ N, areas where NO is likewise decreased compared to other regions with more than 80 ppbv towards and over southern Europe, which partly reflects the increasing stratospheric impact above 12 km altitude. Over western Africa, we observed average O3 at 50–70 ppbv, which is in approximate agreement with previous studies (Galanter et al., 2000). Note that measured O3 mixing ratios over the African continent are not significantly different from O3 mixing ratios over adjacent oceanic areas.
In general, the simulated O3 reproduces the observed absolute O3 mixing ratios in the upper tropical troposphere, as well as regional tendencies. It is of note that, although the model underestimates NO over the tropical continental area of Africa, O3 is reproduced remarkably well. Nevertheless, the model is not able to reproduce local O3 variations such as at −20∘ E and 10∘ N or at −10∘ E and 0∘ N. Moreover, simulated O3 seems to be rather uniformly distributed throughout the whole ITCZ region. The right panel of Fig. 4 further illustrates that the majority of the simulated data points deviate by less than 10 %–15 % from the observational data and that larger deviations between model simulations and measurement are mainly restricted to situations when the measurements show either the lowest or highest mixing ratios not reproduced by the simulations. The overall spatial agreement between O3 observation and O3 simulation is also demonstrated in the latitudinal profile given in Fig. S4. Furthermore, Figs. S5 and S6 show 2-D latitudinal or altitudinal distributions of measured, tropospheric NO and O3, respectively.
3.3 Net ozone production rates in the tropical troposphere
In the following, NOPRs are calculated based on Eq. (6) and analyzed both vertically and spatially. The left graph of Fig. 5 shows the vertical profile of NOPRs derived from measured and simulated data in orange and blue (±1 standard deviation of the corresponding vertical average), respectively. The middle and right graph show the vertical average profiles of the components of gross ozone loss and gross ozone production derived from experimental in situ data and simulated data, respectively. We provide a vertical profile of α calculated based on Eq. (4), for which we obtain good agreement between measurements and simulations, for which we refer to the left graph of Fig. S7. Figure S7 also provides a comparison of vertical profiles of measured and simulated H2O mixing ratios. The vertical profiles are calculated based on an altitudinal bin width of 1 km and are filtered for stratospheric influence by removing data points for which O3 is higher than 100 ppbv. Figure S8 presents latitudinal profiles of NOPRs above 12 km altitude in the troposphere derived from measured and simulated data. A spatial distribution of OH and HO2 (derived from both measured and simulated data) is given in Fig. S9.
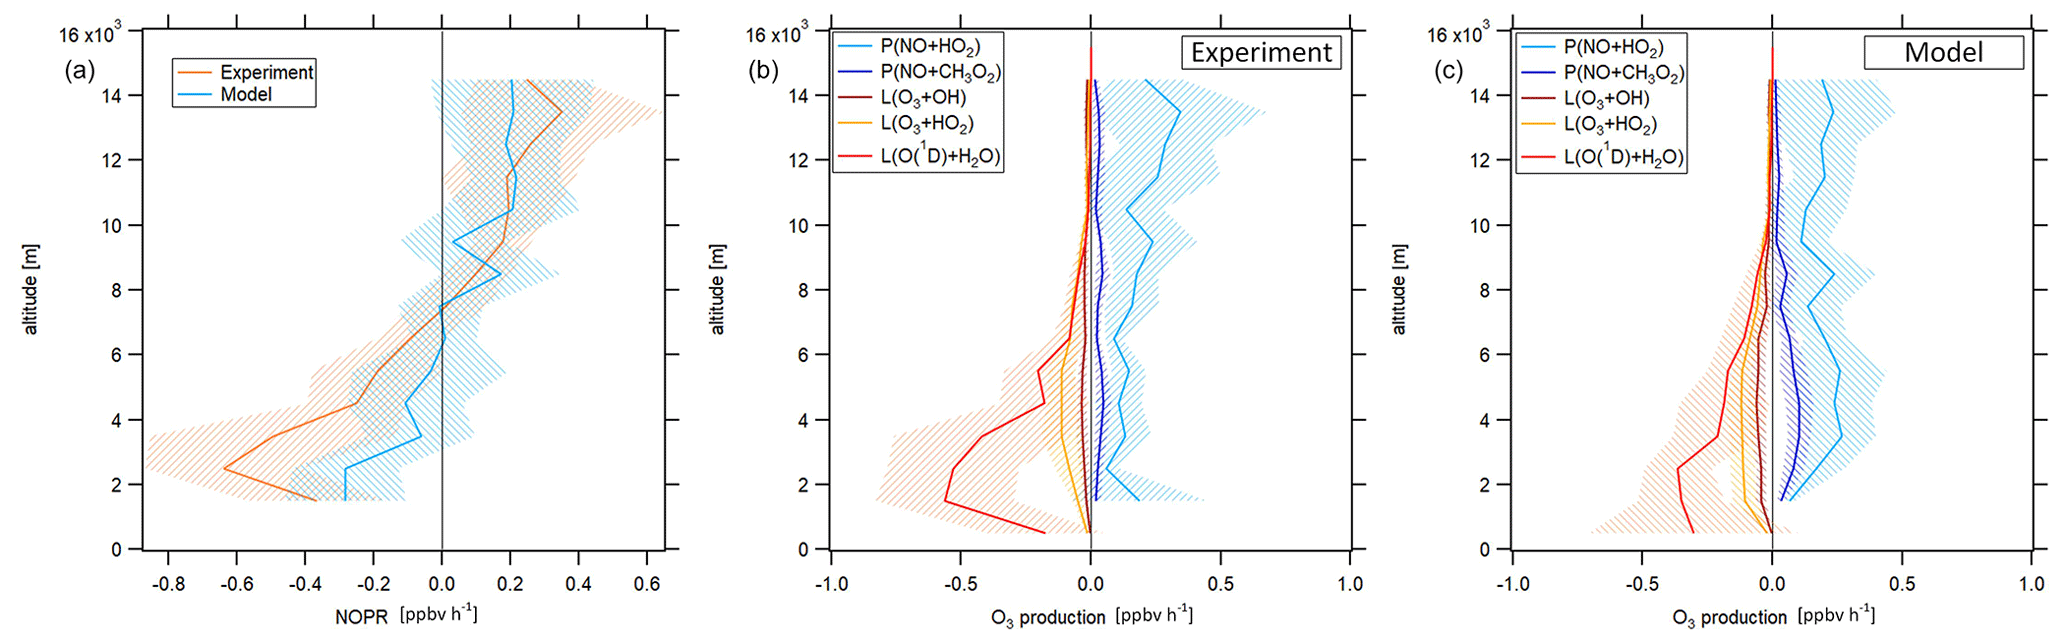
Figure 5Vertical profile of tropospheric NOPRs calculated based on Eq. (6) during CAFE-Africa (a). The orange and blue lines represent NOPR calculations based on measured and simulated data, respectively. Panels (b, c) show the components of net ozone production in Eq. (6) derived from experimental data (b) and simulated data (c). The figures have been filtered for stratospheric measurements by removing data points for which O3 exceeds 100 ppbv.
During CAFE-Africa NOPRs derived from in situ measurements varied between −1 to about 0.6 ppbv h−1 within ±1 standard deviation of the vertical average. We found net ozone destruction for all altitudes below 7–8 km with a minimum of () ppbv h−1 between 2 and 3 km. A general increase of NOPRs with altitude results in net ozone production of 0.2–0.4 ppbv h−1 above 9 km altitude with a maximum of (0.4±0.3) ppbv h−1 between 13 and 14 km altitude. The large standard deviation associated with the vertical profile at 13–14 km altitude reflects the large variation in NOPRs along the flight tracks. The vertical NOPR profile derived from in situ data further shows a rather smooth transition from net ozone destruction to net ozone production between 7–8 km altitude, which is in good agreement with the value estimated by Bozem et al. (2017) for the tropical troposphere over the South American rainforest at latitudes of 5 to 10∘ N. The negative net ozone tendencies observed between 3 and 5 km altitude for the tropical troposphere stand in opposition to positive net ozone tendencies of about 0.1 ppbv h−1 (Zanis et al., 2000a) and balance net ozone tendencies (NOPR=0) (HOOVER campaign over Europe; Bozem et al., 2017) deduced from previous measurements at similar altitudes at mid-latitudes.
In general, the vertical tendencies in NOPRs derived from the observations are well reproduced by the NOPR calculation based on simulated data. However, the model calculations indicate a minimum in net ozone destruction at () ppbv h−1 between 1 to 3 km, which represents about half of that derived from the in situ measurements for these altitudes. This underestimation of the measurement by the model is directly related to an underestimation of simulated humidity and j(O1D), which are both underestimated by EMAC by about 15 %–20 % below 4 km altitude (see the right graph of Fig. S7 for a comparison of the vertical profiles of measured and simulated j(O1D)). The model reports net ozone production of 0.2 ppbv h−1 above 8 km (except between 9 and 10 km altitude) and also suggests that the transition from net destruction to net production occurs between 6 and 8 km altitude, which again agrees with the measurement-based calculation. Nevertheless, the atmospheric variability of the (simulation-based) average NOPR profile reveals that transition from net ozone destruction to net ozone production occurs within a wider altitudinal range of 4 to 10 km altitude.
The reaction of NO with HO2 dominates gross ozone production (Fig. 5b) for NOPRs derived from measured in situ data. Whilst the reaction of NO with CH3O2 contributes about 0.03 ppbv h−1 to gross ozone production throughout the whole troposphere, the vertical average of the ozone production rate from the reaction of NO with HO2 yields 0.1 ppbv h−1 at the lowest altitudes with a linear increase (r2≈0.6) to about 0.3 ppbv h−1 at 14–15 km altitude. From our observations, it follows that the ozone production rate due to the reaction of NO with HO2 is from a factor of 2–3 (below 3 km altitude) to a factor of 10 (above 12 km altitude) stronger than gross ozone production due to the reaction of NO with CH3O2. For the measurement-based estimate, photolysis of ozone dominates gross ozone loss below 6 km altitude. Between 1 and 2 km, it is largest in absolute values at −0.8 ppbv h−1, where it contributes to about 80 % of total gross ozone loss. With increasing altitude, the gross ozone loss rate due to photolysis sharply decreases in absolute value to less than −0.05 ppbv h−1 above 8 km altitude. Between 6 and 10 km altitude, (total) gross ozone loss is on the order of −0.15 ppbv h−1, mainly due to photolysis of O3 while reaction of HO2 with O3 (−0.05 ppbv h−1) and the reaction of OH with O3 (−0.03 ppbv h−1) are significantly smaller in absolute values. Above 10 km, gross ozone loss rate decreases to −0.03 to −0.05 ppbv h−1. This is mainly due to a diminishing ozone loss via photolysis and reaction with H2O at low humidity, leaving ozone loss by the reaction of O3 with OH and HO2 at −0.01 to 0.02 ppbv h−1 as major loss processes. Ozone loss rates observed above 10 km during CAFE-Africa have only little impact on NOPRs as they balance only about 10 %–20 % of the absolute value of concurrent gross ozone production rates at these altitudes.
The model generally reproduces the NOPR tendencies in gross production and loss as shown above, yielding net ozone destruction at a rate of −0.1 to −0.3 ppbv h−1 below 4 km altitude, which is significantly lower in absolute values than the measurement-based calculation. This is due to a combination of a weaker loss term due to photolysis and of a larger production term due to the reaction of NO with HO2 and CH3O2 represented in the model. The contribution of the reaction of NO with HO2 represents a vertically constant value of about 0.2–0.3 ppbv h−1 with a slightly larger production rate from the reaction of NO with CH3O2 at 0.05 to 0.1 ppbv h−1 than inferred from the measurements. Above 10 km altitude, EMAC reproduces the relative and absolute tendencies of the particular gross ozone loss rates remarkably well.
Our results are comparable to a previous study on NOPRs derived from in situ airborne observations at similar latitudes over the rainforest in South America (Bozem et al., 2017). Bozem et al. (2017) report net ozone destruction of −0.2 to −0.6 ppbv h−1 between 2 to 4 km and net ozone production between 7 and 9 km altitude with the transition from net ozone destruction to net ozone production occurring at 7 km, similar to our results. Below 6 km altitude gross ozone loss is dominated by photolysis in both studies (Bozem et al., 2017). Bozem et al. (2017) found net ozone production in the continental PBL layer. In this study O3 destruction prevails, most likely due to the absence of large emission sources in the proximity of the Cabo Verde islands. In the marine boundary layer both studies tend towards net ozone destruction (Bozem et al., 2017).
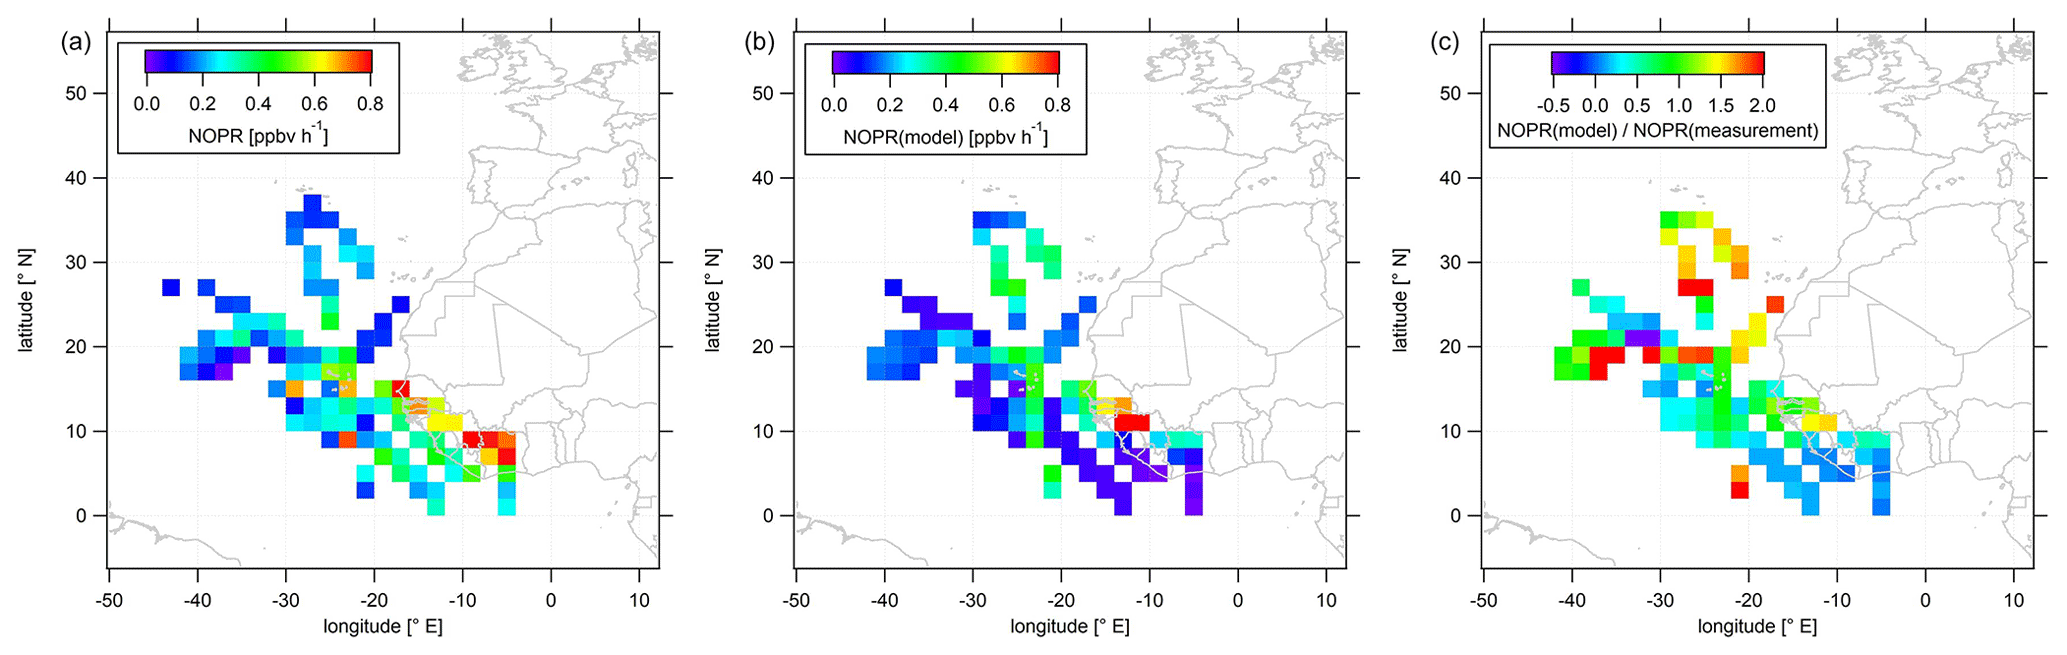
Figure 6Color-coded spatial, tropospheric distributions of calculated NOPRs above 12 km during CAFE-Africa. Panels (a, b) show the spatial distribution of measured and simulated O3, respectively. Panel (c) shows the spatial distribution of the ratio. The figures have been filtered for stratospheric measurements by removing data points for which O3 exceeds 100 ppbv.
Our results add to the understanding of photochemical net ozone production in the upper troposphere of the region. Using a photochemical trajectory model initiated by in situ measurements, Real et al. (2010) derived photochemical net ozone production rates of 2.6 ppbv d−1 over a period of 10 d downwind of western Africa. Our study supports the findings by Real et al. (2010) by underlining that photochemical ozone production in the upper troposphere over the tropics is positive at about 0.2–0.4 ppbv h−1, which supports the concept of significant photochemical ozone production in the upper troposphere of the region. Note that during CAFE-Africa, measurements at low altitudes were generally performed over the Atlantic Ocean. Hence, we cannot compare to previous results from Saunois et al. (2009) reporting ozone production ranging from 0.25 to 0.75 ppbv h−1 in the continental boundary layer over western Africa.
In the following, we investigate the spatial distribution of NOPRs derived from measured and simulated data. Figure 6 shows the color-coded spatial, tropospheric distribution of upper tropospheric (>12 km altitude) NOPRs calculated from observations (a) and model simulated data (b). The right plot shows the spatial, average tropospheric distribution of the point-by-point ratio. Note that a few single data points exceed the given color scales. Also note that NOPR calculations based on observational data are restricted to periods of simultaneous availability of a number measured species and parameters so that data gaps will be more likely than for spatial distributions of in situ NO or O3.
The spatial distribution of NOPRs calculated based on measured data shows the already discussed, generally positive net ozone production tendencies in the upper tropical troposphere, but with distinct, characteristic regional features. While NOPRs are generally on the order of (0.2±0.1) ppbv h−1 north of 16∘ N and west of −20∘ E; spatially averaged NOPRs in the area of the ITCZ are ∼0.4 ppbv h−1 at several locations. Largest spatially averaged NOPRs based on the observations (>0.8 ppbv h−1) are found over tropical western Africa, mirroring strong NO enhancements (see Fig. 3). Nevertheless, the highest NOPR values are inferred over the Côte d'Ivoire although NO is lower than over Guinea or over Senegal, where the NOPR calculation yields comparable, but slightly smaller values. Over the Côte d'Ivoire ozone formation is mainly driven by large HO2 mixing ratios of up to 15–20 pptv (see Fig. S9 for spatial distributions of in situ measured and simulated OH and HO2 data). Similar as for NO, the spatial distribution further suggest a longitudinal increase of NOPRs towards the western African coast reflecting the general absence of LNOx over oceanic areas and increased lightning flash rates over the tropical parts of western and central Africa (Williams and Satori, 2004; Collier and Hughes, 2011).
The spatial distribution of NOPRs calculated based on simulated data largely follows the spatial distribution of simulated NO. Although the model indicates lowest NOPRs of less than 0.2 ppbv h−1 over most oceanic area, NOPRs derived from simulated data exhibit values of about 0.4 ppbv h−1 at several locations between −20 and −30∘ E, which correlate with enhancements in NO retrieved from EMAC. Over Africa, EMAC yields significant enhancements in NOPRs only between 10 and 14∘ N over Senegal, where NO is also enhanced.
The strong dependence of ozone formation on ambient NO concentrations for both measurement and model raises the question to which extent ozone formation was NOx limited. Figure 7 shows NOPRs calculated based on measured and simulated data in orange and blue, respectively, aggregated to a bin width of 0.025 ppbv of NO on the x axis. There is only limited data coverage for measured NO above 0.325 ppbv and for simulated NO above 0.15 ppbv. See Table S3 for the number of data points in each NO mixing ratio bin.
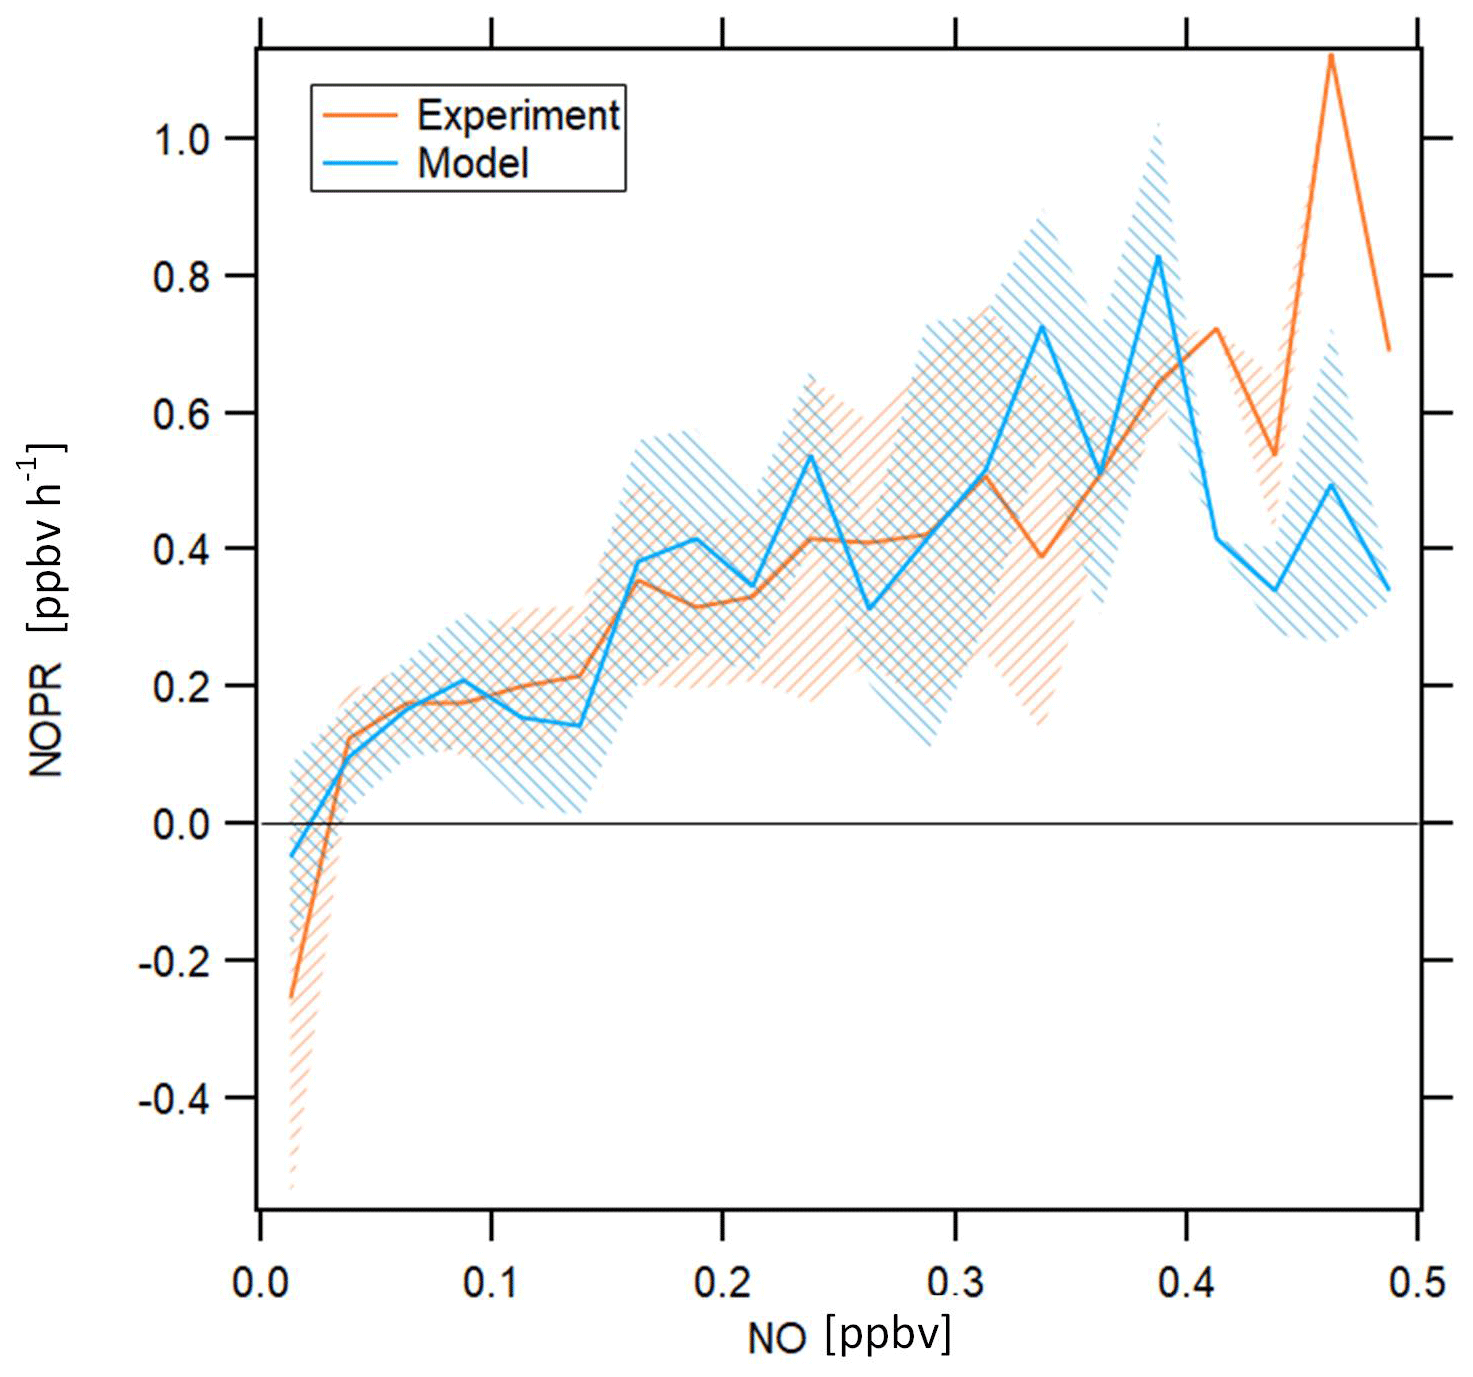
Figure 7NOPRs derived from measured and simulated data as a function of NO mixing ratios. The orange and blue lines represent average profiles calculated based on measured and simulated data, respectively. The blue and orange shading represent ±1 standard deviations of the average lines. The profiles have been filtered for stratospheric measurements by removing data points for which O3 exceeds 100 ppbv.
NOPRs derived from both observations and model simulations exhibit similar dependencies on ambient NO mixing ratios. Both measurements and model simulations show net ozone destruction below 30 and 20 pptv, respectively, and a nearly linear increase in NOPRs with increasing ambient NO mixing ratios above this threshold value, with an NOPR increase of 0.1 to 0.15 ppbv h−1 per 100 pptv increase in NO. Especially the NO compensation mixing ratio (for which ozone production equals ozone loss) reproduces results from previous studies remarkably well. Cantrell et al. (2003) report NO compensation mixing ratios between 10 and 30 pptv over the Pacific, depending on whether modeled or measured HO2 and RO2 is used. A study conducted by Zanis et al. (2000b) for the Swiss Alps also reports balance in ozone production for similar NO compensation mixing ratios. Due to low data coverage above 0.4 ppbv, we cannot resolve with much certainty whether beyond this value the increase in NOPR will continue. Note that one possible limitation of this figure arises from the fact that the data aggregated in the respective NO mixing ratio bins stem from different atmospheric layers and origins, which causes the spiky signature of the profile for both measurement and model. However, both model simulations and observations indicate that O3 in the upper troposphere in the tropics is NOx limited.
We presented in situ observations of NO, O3 and a number of species involved in photochemical O3 formation obtained in the upper tropical troposphere above the Atlantic Ocean and western Africa and compared these experimental results to simulated data retrieved from the global EMAC chemistry–climate model. Our results corroborate the overall eightfold increase of lightning flash rates over land compared to oceanic areas, and the associated NO production (Christian et al., 2003), as well as the notion that tropical Africa is one of the world's lightning hot spots (Williams and Satori, 2004) where large amounts of NO are naturally produced in the process of convection. Observed NO mixing ratios reveal a typical vertical average profile with lowest NO mixing ratios of less than 20 pptv in the free and middle troposphere and highest mixing ratios of 150–200 pptv above 12 km altitude. We report highest NO (>0.4 ppbv) in the latitudinal range of the ITCZ (5 to 15∘ N) and moreover over tropical western Africa. While we find overall good agreement when comparing average profiles of observed and EMAC model simulated NO, large deviations are sometimes found for point-to-point comparisons. The model does not reproduce the largest NO enhancements over western Africa and instead predicts highest NO values above 12 km altitude over large areas of the North Atlantic, which highlights the importance of an accurate representation of lightning NO in the model. Based on in situ measurements we found 60–70 ppbv O3 in the upper tropical troposphere, which is well reproduced by the model. While the average vertical profile of NOPRs derived from in situ measurements varied vertically between −0.6 ppbv h−1 between 2 and 4 km altitude and 0.2–0.4 ppbv h−1 in the upper tropical troposphere, with a crossover in O3 formation at around 8 km. A spatial distribution of NOPRs in the upper tropical troposphere created based on experimental in situ data indicates highest values over western Africa, which is a result of large NO and HO2 over the particular regions. Although the model simulations largely reproduce the observation-based NOPR values, this is at least partly due to compensating effects, e.g., low NO in the model, and is partly associated with enhanced HO2 leading to locally increased NOPRs in the simulations. Overall both the observations and the model simulations exhibit a nearly linear dependency of NOPRs on ambient NO indicating NOx limitation of O3 formation.
| General | |
| CAFE-Africa | Chemistry of the Atmosphere: Field Experiment in Africa |
| HALO | High Altitude and Long-range research aircraft |
| Scientific | |
| CLD | Chemiluminescence detector |
| ECHAM5 | Fifth generation European Centre Hamburg general circulation model |
| EMAC | ECHAM/MESSy Atmospheric Chemistry |
| FAIRO | Fast AIRborne Ozone |
| HORUS | Hydr Oxyl Radical measurement Unit based on fluorescence Spectroscopy |
| HOx | OH+HO2 |
| ITCZ | Intertropical Convergence Zone |
| LIF | Laser-induced fluorescence |
| MBL | Marine boundary layer |
| MESSy | Modular Earth Submodel System |
| MF | Measurement flight |
| NOPR | Net ozone production rate |
| NOx | NO+NO2 |
| PBL | Planetary boundary layer |
| PSS | Photostationary steady state |
| QCLAS | Quantum cascade laser absorption spectroscopy |
| SHARC | Sophisticated Hygrometer for Atmospheric ResearCh |
| slpm | Standard liter per minute |
| TDL | Tunable diode laser |
| TMU | Total measurement uncertainty |
| T/O | Take off |
| VOC | Volatile organic compound |
| UTC | Coordinated universal time |
| UTLS | Upper troposphere/lower stratosphere |
Data used in this study are available to all scientists agreeing to the CAFE-Africa data protocol at https://doi.org/10.5281/zenodo.4442616 (Tadic and Fischer, 2021).
The supplement related to this article is available online at: https://doi.org/10.5194/acp-21-8195-2021-supplement.
IT, CMN, JL and HF designed the study. IT wrote the article. IT and CMN processed and analyzed the data. IT and UP performed the NO, CO and CH4 measurements during the campaign. IT processed the NO, CO and CH4 data. DM, HH, MM and RR performed the OH and HO2 measurements. BB supervised measurements and processed the actinic flux data. MZ supervised measurements and processed the water vapor data. FO supervised measurements and processed the O3 data. AP generated model data.
The authors declare that they have no conflict of interest.
We acknowledge the collaborations with Forschungszentrum Jülich, Karlsruhe Institute of Technology, Heidelberg University, Deutsches Zentrum für Luft- und Raumfahrt and Wuppertal University during the CAFE-Africa campaign. We thank all involved in the CAFE-Africa project for a successful campaign.
The article processing charges for this open-access publication were covered by the Max Planck Society.
This paper was edited by Christopher Cantrell and reviewed by two anonymous referees.
Aghedo, A. M., Schultz, M. G., and Rast, S.: The influence of African air pollution on regional and global tropospheric ozone, Atmos. Chem. Phys., 7, 1193–1212, https://doi.org/10.5194/acp-7-1193-2007, 2007.
Atkinson, R., Baulch, D. L., Cox, R. A., Crowley, J. N., Hampson, R. F., Hynes, R. G., Jenkin, M. E., Rossi, M. J., and Troe, J.: Evaluated kinetic and photochemical data for atmospheric chemistry: Volume I – gas phase reactions of Ox, HOx, NOx and SOx species, Atmos. Chem. Phys., 4, 1461–1738, https://doi.org/10.5194/acp-4-1461-2004, 2004.
Atkinson, R., Baulch, D. L., Cox, R. A., Crowley, J. N., Hampson, R. F., Hynes, R. G., Jenkin, M. E., Rossi, M. J., Troe, J., and IUPAC Subcommittee: Evaluated kinetic and photochemical data for atmospheric chemistry: Volume II – gas phase reactions of organic species, Atmos. Chem. Phys., 6, 3625–4055, https://doi.org/10.5194/acp-6-3625-2006, 2006.
Beirle, S., Huntrieser, H., and Wagner, T.: Direct satellite observation of lightning-produced NOx, Atmos. Chem. Phys., 10, 10965–10986, https://doi.org/10.5194/acp-10-10965-2010, 2010.
Berrisford, P., Dee, D. P. K. F., Fielding, K., Fuentes, M., Kallberg, P., Kobayashi, S., and Uppala, S.: The ERA-Interim archive, ERA report series, No. 1, ECMWF, Reading, UK, 2009.
Bohn, B. and Lohse, I.: Calibration and evaluation of CCD spectroradiometers for ground-based and airborne measurements of spectral actinic flux densities, Atmos. Meas. Tech., 10, 3151–3174, https://doi.org/10.5194/amt-10-3151-2017, 2017.
Bourgeois, I., Peischl, J., Thompson, C. R., Aikin, K. C., Campos, T., Clark, H., Commane, R., Daube, B., Diskin, G. W., Elkins, J. W., Gao, R.-S., Gaudel, A., Hintsa, E. J., Johnson, B. J., Kivi, R., McKain, K., Moore, F. L., Parrish, D. D., Querel, R., Ray, E., Sánchez, R., Sweeney, C., Tarasick, D. W., Thompson, A. M., Thouret, V., Witte, J. C., Wofsy, S. C., and Ryerson, T. B.: Global-scale distribution of ozone in the remote troposphere from the ATom and HIPPO airborne field missions, Atmos. Chem. Phys., 20, 10611–10635, https://doi.org/10.5194/acp-20-10611-2020, 2020.
Bozem, H., Butler, T. M., Lawrence, M. G., Harder, H., Martinez, M., Kubistin, D., Lelieveld, J., and Fischer, H.: Chemical processes related to net ozone tendencies in the free troposphere, Atmos. Chem. Phys., 17, 10565–10582, https://doi.org/10.5194/acp-17-10565-2017, 2017.
Cantrell, C. A., Edwards, G. D., Stephens, S., Mauldin, R. L., Zondlo, M. A., Kosciuch, E., Eisele, F. L., Shetter, R. E., Lefer, B. L., Hall, S., Flocke, F., Weinheimer, A., Fried, A., Apel, E., Kondo, Y., Blake, D. R., Blake, N. J., Simpson, I. J., Bandy, A. R., Thornton, D. C., Heikes, B. G., Singh, H. B., Brune, W. H., Harder, H., Martinez, M., Jacob, D. J., Avery, M. A., Barrick, J. D., Sachse, G. W., Olson, J. R., Crawford, J. H., and Clarke, A. D.: Peroxy radical behavior during the Transport and Chemical Evolution over the Pacific (TRACE-P) campaign as measured aboard the NASA P-3B aircraft, J. Geophys. Res., 108, D20, https://doi.org/10.1029/2003JD003674, 2003.
Christian, H. J., Blakeslee, R. J., Boccippio, D. J., Boeck, W. L., Buechler, D. E., Driscoll, K. T., Goodman, S. J., Hall, J. M., Koshak, W. J., Mach, D. M., and Stewart, M. F.: Global frequency and distribution of lightning as observed from space by the Optical Transient Detector, J. Geophys. Res., 108, 4005, https://doi.org/10.1029/2002JD002347, 2003.
Collier, A. B. and Hughes, A. R. W.: A harmonic model for the temporal lightning activity over Africa, J. Geophys. Res., 116, D05105, https://doi.org/10.1029/2010JD014455, 2011.
Crippa, M., Guizzardi, D., Muntean, M., Schaaf, E., Dentener, F., van Aardenne, J. A., Monni, S., Doering, U., Olivier, J. G. J., Pagliari, V., and Janssens-Maenhout, G.: Gridded emissions of air pollutants for the period 1970–2012 within EDGAR v4.3.2, Earth Syst. Sci. Data, 10, 1987–2013, https://doi.org/10.5194/essd-10-1987-2018, 2018.
Crutzen. P. J.: Photochemical reactions initiated by and influencing ozone in unpolluted tropospheric air, Tellus, 26, 48–57, https://doi.org/10.1111/j.2153-3490.1974.tb01951.x, 1974.
Dentener, F., Stevenson, D., Cofala, J., Mechler, R., Amann, M., Bergamaschi, P., Raes, F., and Derwent, R.: The impact of air pollutant and methane emission controls on tropospheric ozone and radiative forcing: CTM calculations for the period 1990–2030, Atmos. Chem. Phys., 5, 1731–1755, https://doi.org/10.5194/acp-5-1731-2005, 2005.
Duncan, B. N., Yoshida, Y., Olson, J. R., Sillman, S., Martin, R. V., Lamsal, L., Hu, Y., Pickering, K. E., Retscher, C., Allen, D. J., and Crawford, J. H.: Application of OMI observations to a space-based indicator of NOx and VOC controls on surface ozone formation, Atmos. Environ., 44, 2213–2223, https://doi.org/10.1016/j.atmosenv.2010.03.010, 2010.
Fiore, A. M., Jacob, D. J., Bey. I., Yantosca, R. M., Field, B. D., Fusco, A. C., and Wilkinson, J. G.: Background ozone over the United States in summer: Origin, trend, and contribution to pollution episodes, J. Geophys. Res., 107, D15, 4275, https://doi.org/10.1029/2001JD000982, 2002.
Fischer, H., Pozzer, A., Schmitt, T., Jöckel, P., Klippel, T., Taraborrelli, D., and Lelieveld, J.: Hydrogen peroxide in the marine boundary layer over the South Atlantic during the OOMPH cruise in March 2007, Atmos. Chem. Phys., 15, 6971–6980, https://doi.org/10.5194/acp-15-6971-2015, 2015.
Galanter, M., Levy, H., and Carmichael, G. R.: Impacts of biomass burning on tropospheric CO, NOx and O3, J. Geophys. Res., 105, D5, 6633–6653, https://doi.org/10.1029/1999JD901113, 2000.
Grewe, V., Brunner, D., Dameris, M., Grenfell, J., Hein, R., Shindell, D., and Staehelin, J.: Origin and variability of upper tropospheric nitrogen oxides and ozone at northern mid-latitudes, Atmos. Environ., 35, 3421–3433, https://doi.org/10.1016/S1352-2310(01)00134-0, 2001.
Hosaynali Beygi, Z., Fischer, H., Harder, H. D., Martinez, M., Sander, R., Williams, J., Brookes, D. M., Monks, P. S., and Lelieveld, J.: Oxidation photochemistry in the Southern Atlantic boundary layer: unexpected deviations of photochemical steady state, Atmos. Chem. Phys., 11, 8497–8513, https://doi.org/10.5194/acp-11-8497-2011, 2011.
Jaffe, D. A., Cooper, O. R., Fiore, A. M., Henderson, B. H., Tonnesen, G. S., Russell, A. G., Henze, D. K., Langford, A. O., Lin, M., and Moore, T.: Scientific assessment of background ozone over the US.: Implications for air quality management, Elementa, 6, 56, https://doi.org/10.1525/elementa.309, 2018.
Jeucken, A. B. M., Siegmund, P. C., and Heijboer, L. C.: On the potential of assimilating meteorological analyses in a global climate model for the purpose of model validation, J. Geophys, Res., 101, 16939–16950, https://doi.org/10.1029/96JD01218, 1996.
Jöckel, P., Kerkweg, A., Pozzer, A., Sander, R., Tost, H., Riede, H., Baumgaertner, A., Gromov, S., and Kern, B.: Development cycle 2 of the Modular Earth Submodel System (MESSy2), Geosci. Model Dev., 3, 717–752, https://doi.org/10.5194/gmd-3-717-2010, 2010.
Kaiser, J. W., Heil, A., Andreae, M. O., Benedetti, A., Chubarova, N., Jones, L., Morcrette, J.-J., Razinger, M., Schultz, M. G., Suttie, M., and van der Werf, G. R.: Biomass burning emissions estimated with a global fire assimilation system based on observed fire radiative power, Biogeosciences, 9, 527–554, https://doi.org/10.5194/bg-9-527-2012, 2012.
Kerkweg, A., Buchholz, J., Ganzeveld, L., Pozzer, A., Tost, H., and Jöckel, P.: Technical Note: An implementation of the dry removal processes DRY DEPosition and SEDImentation in the Modular Earth Submodel System (MESSy), Atmos. Chem. Phys., 6, 4617–4632, https://doi.org/10.5194/acp-6-4617-2006, 2006.
Krautstrunk, M. and Giez, A.: The Transition From FALCON to HALO Era Airborne Atmospheric Research, in: Atmospheric Physics. Research Topics in Aerospace, edited by: Schumann, U., Springer, Berlin, Heidelberg, https://doi.org/10.1007/978-3-642-30183-4_37, 2012.
Lelieveld, J., van Aardenne, J., Fischer, H., de Reus, M., Williams, J., and Winkler, P.: Increasing Ozone over the Atlantic Ocean, Science, 304, 1483–1487, https://doi.org/10.1126/science.1096777, 2004.
Lelieveld, J., Hoor, P., Jöckel, P., Pozzer, A., Hadjinicolaou, P., Cammas, J.-P., and Beirle, S.: Severe ozone air pollution in the Persian Gulf region, Atmos. Chem. Phys., 9, 1393–1406, https://doi.org/10.5194/acp-9-1393-2009, 2009.
Lin, X., Trainer, M., and Liu, S. C.: On the nonlinearity of the tropospheric ozone production, J. Geophys. Res., 93, 15879–15888, https://doi.org/10.1029/JD093iD12p15879, 1988.
Lu, K., Zhang, Y., Su, H., Brauers, T., Chou, C. C., Hofzumahaus, A., Liu, S. C., Kita, K., Kondo, Y., Shao, M., Wahner, A., Wang, J., Wang, X., and Zhu, T.: Oxidant (O3+NO2) production processes and formation regimes in Beijing, J. Geophys. Res., 115, D07303, https://doi.org/10.1029/2009JD012714, 2010.
Mannschreck, K., Gilge, S., Plass-Duelmer, C., Fricke, W., and Berresheim, H.: Assessment of the applicability of photostationary state to long-term measurements at the Hohenpeissenberg GAW Station, Germany, Atmos. Chem. Phys., 4, 1265–1277, https://doi.org/10.5194/acp-4-1265-2004, 2004.
Marno, D., Ernest, C., Hens, K., Javed, U., Klimach, T., Martinez, M., Rudolf, M., Lelieveld, J., and Harder, H.: Calibration of an airborne HOx instrument using the All Pressure Altitude-based Calibrator for HOx Experimentation (APACHE), Atmos. Meas. Tech., 13, 2711–2731, https://doi.org/10.5194/amt-13-2711-2020, 2020.
Miyazaki, K., Eskes, H. J., Sudo, K., and Zhang, C.: Global lightning NOx production estimated by an assimilation of multiple satellite data sets, Atmos. Chem. Phys., 14, 3277–3305, https://doi.org/10.5194/acp-14-3277-2014, 2014.
Miyazaki, K., Eskes, H., Sudo, K., Boersma, K. F., Bowman, K., and Kanaya, Y.: Decadal changes in global surface NOx emissions from multi-constituent satellite data assimilation, Atmos. Chem. Phys., 17, 807–837, https://doi.org/10.5194/acp-17-807-2017, 2017.
Nussbaumer, C. M. and Cohen, R. C.: The role of temperature and NOx in ozone trends in the Los Angeles Basin, Environ. Sci. Technol., 54, 15652–15659, https://doi.org/10.1021/acs.est.0c04910, 2020.
Prather, M. J., Zhu, X., Tang, Q., Hsu, J., and Neu, J. L.: An atmospheric chemist in search of the tropopause, J. Geophys. Res., 116, D04306, https://doi.org/10.1029/2010JD014939, 2011.
Pusede, S. E., Steiner, A., and Cohen, R. C.: Temperature and recent trends in the chemistry of continental surface ozone, Chem. Rev., 115, 3898–3918, https://doi.org/10.1021/cr5006815, 2015.
Real, E., Orlandi, E., Law, K. S., Fierli, F., Josset, D., Cairo, F., Schlager, H., Borrmann, S., Kunkel, D., Volk, C. M., McQuaid, J. B., Stewart, D. J., Lee, J., Lewis, A. C., Hopkins, J. R., Ravegnani, F., Ulanovski, A., and Liousse, C.: Cross-hemispheric transport of central African biomass burning pollutants: implications for downwind ozone production, Atmos. Chem. Phys., 10, 3027–3046, https://doi.org/10.5194/acp-10-3027-2010, 2010.
Reed, C., Evans, M. J., Di Carlo, P., Lee, J. D., and Carpenter, L. J.: Interferences in photolytic NO2 measurements: explanation for an apparent missing oxidant?, Atmos. Chem. Phys., 16, 4707–4724, https://doi.org/10.5194/acp-16-4707-2016, 2016.
Ridley, B. A. and Howlett, L. C.: An instrument for nitric oxide measurements in the stratosphere, Rev. Sci. Instrum., 45, 742, https://doi.org/10.1063/1.1686726, 1974.
Roeckner, E., Brokopf, R., Esch, M., Giorgetta, M., Hagemann, S., Kornblueh, L., Manzini, E., Schlese, U., and Schulzweida, U.: Sensitivity of Simulated Climate to Horizontal and Vertical Resolution in the ECHAM5 Atmosphere Model, J. Climate, 19, 3771–3791, https://doi.org/10.1175/JCLI3824.1, 2006.
Ryerson, T. B., Williams, E. J., and Fehsenfeld, F. C.: An efficient photolysis system for fast-response NO2 measurements, J. Geophys. Res., 105, 26447–26461, https://doi.org/10.1029/2000JD900389, 2002.
Sander, R., Jöckel, P., Kirner, O., Kunert, A. T., Landgraf, J., and Pozzer, A.: The photolysis module JVAL-14, compatible with the MESSy standard, and the JVal PreProcessor (JVPP), Geosci. Model Dev., 7, 2653–2662, https://doi.org/10.5194/gmd-7-2653-2014, 2014.
Sander, R., Baumgaertner, A., Cabrera-Perez, D., Frank, F., Gromov, S., Grooß, J.-U., Harder, H., Huijnen, V., Jöckel, P., Karydis, V. A., Niemeyer, K. E., Pozzer, A., Riede, H., Schultz, M. G., Taraborrelli, D., and Tauer, S.: The community atmospheric chemistry box model CAABA/MECCA-4.0, Geosci. Model Dev., 12, 1365–1385, https://doi.org/10.5194/gmd-12-1365-2019, 2019.
Saunois, M., Reeves, C. E., Mari, C. H., Murphy, J. G., Stewart, D. J., Mills, G. P., Oram, D. E., and Purvis, R. M.: Factors controlling the distribution of ozone in the West African lower troposphere during the AMMA (African Monsoon Multidisciplinary Analysis) wet season campaign, Atmos. Chem. Phys., 9, 6135–6155, https://doi.org/10.5194/acp-9-6135-2009, 2009.
Schiller, C. I., Bozem, H., Gurk, C., Parchatka, U., Königstedt, R., Harris, G. W., Lelieveld, J., and Fischer, H.: Applications of quantum cascade lasers for sensitive trace gas measurements of CO, CH4, N2O, and HCHO, Appl. Phys. B, 92, 419–430, https://doi.org/10.1007/s00340-008-3125-0, 2008.
Schroeder, J. S., Crawford, J. H., Fried, A., Walega, J., Weinheimer, A., Wisthaler, A., Müller, M., Mikoviny, T., Chen, G., Shook, M., Blake, D. R., and Tonnesen, G. S.: New insights into the column ratio as an indicator of near-surface ozone sensitivity, J. Geophys. Res.-Atmos., 122, 8885–8907, https://doi.org/10.1002/2017JD026781, 2017.
Sillman, S., Al-Wali, K., Marsik, F. J., Nowacki, P., Samson, P. J., Rodgers, M. O., Garland, L. J., Martinez, J. E., Stoneking, C., Imhoff, R., Lee, J. H., Newman, L., Weinstein-Lloyd, J., and Aneja, V.: Photochemistry of ozone formation in Atlanta, GA-models and measurements, Atmos. Environ., 29, 3055–3066, https://doi.org/10.1016/1352-2310(95)00217-M, 1995.
Sillman, S., Vautard, R., Menut, L., and Kley, D.: O3–NOx–VOC sensitivity and NOx-VOC indicators in Paris: Results from models and Atmospheric Pollution Over the Paris Area (ESQUIF) measurements, J. Geophys. Res., 108, 8563, https://doi.org/10.1029/2002JD001561, 2003.
Silvern, R. F., Jacob, D. J., Travis, K. R., Sherwen, T., Evans, M. J., Cohen, R. C., Laughner, J. L., Hall, S. R., Ullmann, K., Crounse, J. D., Wennberg, P. O., Peischl, J., and Pollack, I. B.: Observed ratios in the upper troposphere imply errors in NO–NO2–O3 cycling kinetics or an unaccounted NOx reservoir, Geophys. Res. Lett., 45, 4466–4474, https://doi.org/10.1029/2018GL077728, 2018.
Tadic, I. and Fischer, H.: Central role of nitric oxide in ozone production in the upper tropical troposphere over the Atlantic Ocean and West Africa (Version 2), Zenodo [data set], https://doi.org/10.5281/zenodo.4442616, 2021.
Tadic, I., Parchatka, U., Königstedt, R., and Fischer, H.: In-flight stability of quantum cascade laser-based infrared absorption spectroscopy measurements of atmospheric carbon monoxide, Appl. Phys. B, 123, 146, https://doi.org/10.1007/s00340-017-6721-z, 2017.
Tadic, I., Crowley, J. N., Dienhart, D., Eger, P., Harder, H., Hottmann, B., Martinez, M., Parchatka, U., Paris, J.-D., Pozzer, A., Rohloff, R., Schuladen, J., Shenolikar, J., Tauer, S., Lelieveld, J., and Fischer, H.: Net ozone production and its relationship to nitrogen oxides and volatile organic compounds in the marine boundary layer around the Arabian Peninsula, Atmos. Chem. Phys., 20, 6769–6787, https://doi.org/10.5194/acp-20-6769-2020, 2020.
Thornton, J. A., Wooldridge, P. J., Cohen, R. C., Martinez, M., Harder, H., Brune, W. H., Williams, E. J., Roberts, J. M., Fehsenfeld, F. C., Hall, S. R., Shetter, R. E., Wert, B. P., and Fried, A.: Ozone production rates as a function of NOx abundances and HOx production rates in the Nashville urban plume, J. Geophys. Res., 107, ACH 7-1–ACH 7-17, https://doi.org/10.1029/2001JD000932, 2002.
Tost, H., Jöckel, P., Kerkweg, A., Sander, R., and Lelieveld, J.: Technical note: A new comprehensive SCAVenging submodel for global atmospheric chemistry modelling, Atmos. Chem. Phys., 6, 565–574, https://doi.org/10.5194/acp-6-565-2006, 2006.
Tost, H., Jöckel, P., and Lelieveld, J.: Lightning and convection parameterisations – uncertainties in global modelling, Atmos. Chem. Phys., 7, 4553–4568, https://doi.org/10.5194/acp-7-4553-2007, 2007.
West, J. J. and Fiore, A. M.: Management of tropospheric ozone by reducing methane emissions, Environ. Sci. Technol., 39, 4685–4691, https://doi.org/10.1021/es048629f, 2005.
Williams, E. R. and Satori, G.: Lightning, thermodynamic and hydrological comparison of the two tropical continental chimneys, J. Atmos. Sol.-Terr. Phy., 66, 1213–1231, https://doi.org/10.1016/j.jastp.2004.05.015, 2004.
Xu, W. and Zipser, E. J.: Properties of deep convection in tropical continental, monsoon, and oceanic rainfall regimes, Geophys. Res. Lett., 39, L07802, https://doi.org/10.1029/2012GL051242, 2012.
Yienger, J. and Levy II, H.: Empirical model of global soil-biogenic NOx emissions, J. Geophys. Res., 100, 11447–11464, https://doi.org/10.1029/95JD00370, 1995.
Zahn, A., Weppner, J., Widmann, H., Schlote-Holubek, K., Burger, B., Kühner, T., and Franke, H.: A fast and precise chemiluminescence ozone detector for eddy flux and airborne application, Atmos. Meas. Tech., 5, 363–375, https://doi.org/10.5194/amt-5-363-2012, 2012.
Zanis, P., Monks, P. S., Schuepbach, E., and Penkett, S. A.: The Role of In Situ Photochemistry in the Control of Ozone during Spring at the Jungfraujoch (3,580 m asl) – Comparison of Model Results with Measurements, J. Atmos. Chem., 37, 1–27, https://doi.org/10.1023/A:1006349926926, 2000a.
Zanis, P., Monks, P. S., Schuepbach, E., Carpenter, L. J., Green, T. J., Mills, G. P., Bauguitte, S., and Penkett, S. A.: In situ ozone production under free tropospheric conditions during FREETEX '98 in the Swiss Alps, J. Geophys. Res., 105, 24223–24234, https://doi.org/10.1029/2000JD900229, 2000b.
Zipser, E. J.: Deep Cumulonimbus Cloud System in the Tropics with and without Lightning, Mon. Weather Rev., 122, 1837–1851, https://doi.org/10.1175/1520-0493(1994)122<1837:DCCSIT>2.0.CO;2, 1994.