the Creative Commons Attribution 4.0 License.
the Creative Commons Attribution 4.0 License.
 | 17 May 2021
Secondary aerosol formation alters CCN activity in the North China Plain
Nan Ma
Juan Hong
Wanyun Xu
Yanyan Zhang
Yao He
Qingwei Luo
Linhong Xie
Yafang Cheng
Secondary aerosols (SAs, including secondary organic and inorganic aerosols, SOAs and SIAs) are predominant components of aerosol particles in the North China Plain (NCP), and their formation has significant impacts on the evolution of particle size distribution (PNSD) and hygroscopicity. Previous studies have shown that distinct SA formation mechanisms can dominate under different relative humidity (RH). This would lead to different influences of SA formation on the aerosol hygroscopicity and PNSD under different RH conditions. Based on the measurements of size-resolved particle activation ratio (SPAR), hygroscopicity distribution (GF-PDF), PM2.5 chemical composition, PNSD, meteorology and gaseous pollutants in a recent field campaign, McFAN (Multiphase chemistry experiment in Fogs and Aerosols in the North China Plain), conducted during the autumn–winter transition period in 2018 at a polluted rural site in the NCP, the influences of SA formation on cloud condensation nuclei (CCN) activity and CCN number concentration (NCCN) calculation under different RH conditions were studied. Results suggest that during daytime, SA formation could lead to a significant increase in NCCN and a strong diurnal variation in SPAR at supersaturations lower than 0.07 %. During periods with daytime minimum RH exceeding 50 % (high RH conditions), SA formation significantly contributed to the particle mass and size changes in a broad size range of 150 to 1000 nm, leading to NCCN (0.05 %) increases within the size range of 200 to 500 nm and mass concentration growth mainly for particles larger than 300 nm. During periods with daytime minimum RH below 30 % (low RH conditions), SA formation mainly contributed to the particle mass and size and NCCN changes for particles smaller than 300 nm. As a result, under the same amount of mass increase induced by SA formation, the increase of NCCN (0.05 %) was stronger under low RH conditions and weaker under high RH conditions. Moreover, the diurnal variations of the SPAR parameter (inferred from CCN measurements) due to SA formation varied with RH conditions, which was one of the largest uncertainties within NCCN predictions. After considering the SPAR parameter (estimated through the number fraction of hygroscopic particles or mass fraction of SA), the relative deviation of NCCN (0.05 %) predictions was reduced to within 30 %. This study highlights the impact of SA formation on CCN activity and NCCN calculation and provides guidance for future improvements of CCN predictions in chemical-transport models and climate models.
- Article
(5433 KB) - Full-text XML
-
Supplement
(1536 KB) - BibTeX
- EndNote


The cloud condensation nuclei (CCN) activity of aerosol particles describes the ability to activate and grow into cloud droplets at given supersaturations and thus has important impacts on cloud microphysics and the aerosol indirect effect on climate. CCN activity is dependent on the physicochemical properties of aerosol particles, including particle size distributions, hygroscopicity (determined by chemical composition) and mixing state. Thus, atmospheric processes influencing these aerosol properties may exert influences on CCN activity.
Secondary aerosol (SA) formation contributes greatly to aerosol populations and impacts CCN properties in many ways, generally increasing CCN number concentrations (NCCN) and leading to changes in the CCN activity (Wiedensohler et al., 2009; Kerminen et al., 2012; Wu et al., 2015; Farmer et al., 2015; Ma et al., 2016; Zhang et al., 2019, and references therein). Differences in precursor and oxidant concentrations as well as SA formation mechanisms lead to particle size growth in different size ranges (Dal Maso et al., 2005; Kulmala et al., 2007; Zhang et al., 2012; Farmer et al., 2015; Cheng et al., 2016; Kuang et al., 2020c), thus impacting CCN activities in different ways. SA formation includes both the formation and subsequent growth of new particles (new particle formation, NPF) and the growth of existing particles. NPF can directly provide particles large enough to act as CCN (Wiedensohler et al., 2009; Kerminen et al., 2012; Farmer et al., 2015), generally affecting aerosol particles smaller than 100 nm, thereby elevating NCCN at higher supersaturations (SSs > 0.2 %) (Wiedensohler et al., 2009; Kerminen et al., 2012; Ma et al., 2016; Zhang et al., 2019, and references therein). SA formation on existing particles, especially under polluted conditions, significantly adds mass to and changes the chemical composition of accumulation-mode particles (Farmer et al., 2015), thus affecting CCN at lower SSs (< 0.2 %) (Wiedensohler et al., 2009; Mei et al., 2013; Yue et al., 2016; Thalman et al., 2017; Duan et al., 2018). SSs vary greatly among different clouds categories. Cumulus clouds are formed under higher SSs and are thus mostly influenced by Aitken-mode particles formed in NPF events (Reuter et al., 2009; Gryspeerdt and Stier, 2012; Fan et al., 2016; Jia et al., 2019, and references therein). Stratus clouds and fogs that exert stronger effects on climate and environment, however, are generally formed at SSs lower than 0.2 %, indicating that only accumulation-mode particles can serve as CCN (Ditas et al., 2012; Hammer et al., 2014a, b; Krüger et al., 2014; Shen et al., 2018). Numerous studies have investigated the impact of NPF on CCN (Gorden et al., 2016; Ma et al., 2016; Yu et al., 2020, and references therein); however, only few studies have focused on the influence of SA formation on CCN activity of accumulation-mode particles, which might exhibit strong climate and environment impacts and urgently requires attention.
SA formation affects the CCN activity of accumulation-mode particles, not only by enlarging their size, but also by changing their chemical compositions. At a specific particle size, the CCN activity is determined both by the chemical composition of particles which originally were and stayed this size and that of particles which grew into this size via added SA mass. These two groups of particles can exert different variations to CCN activity at the same particle size (Wiedensohler et al., 2009, and references therein). In general, the SA formation can increase the hygroscopicity of particles by adding chemical compounds with lower volatility and higher oxidation state, which are usually more hydrophilic, thereby enhancing the CCN activity of accumulation-mode particles (Mei et al., 2013; Yue et al., 2016). However, CCN activity may also remain unchanged (Wiedensohler et al., 2009) or be weakened in some cases (Thalman et al., 2017; Duan et al., 2018). In SA formation observed in central Amazon forests, Thalman et al. (2017) reported enhanced CCN activity in the dry season and constant CCN activity in the wet season. In SA formation events under polluted conditions in Guangzhou (Pearl River Delta, China), Duan et al. (2018) found that bulk CCN activity can be enhanced in summer due to the formation of large and inorganic-rich particles but weakened in winter due to the formation of small and organic-rich particles, where RH seemed to have been an important factor in the variations of bulk CCN activity due to different particle formation pathways. Aside from variations of particle chemical composition, changes in aerosol mixing states caused by SA formation can also change CCN activity (Su et al., 2010; Rose et al., 2011; Cheng et al., 2012). The fast condensation of SA components on accumulation-mode particles led to the turnover of soot particle mixing state from externally to internally mixed, which contributed mostly to enhancements of CCN activity (Cheng et al., 2012). Thus, SA formation influences the CCN activity of accumulation-mode particles through its integrated impacts on their size, hygroscopicity and mixing state, which requires more detailed and comprehensive investigations.
The North China Plain (NCP) frequently experiences severe aerosol pollution due to both strong emissions of primary aerosol and strong SA formation caused by the abundance of gaseous precursors and oxidants (Zheng et al., 2015; Liu et al., 2010; Huang et al., 2014; Xu et al., 2019). In the SA formation events on the NCP, both aqueous-phase processes and gas-phase photochemical processes can play important roles, depending on atmospheric conditions such as RH (Hu et al., 2016; Xu et al., 2017a; Wang et al., 2019). A recent observational study on the NCP found that SA formation dominantly contributed to different particle size since SA formation mechanisms varied with RH conditions (Kuang et al., 2020c). Under dry conditions, SAs were mainly formed through gas-phase photochemical processing and mostly added mass to accumulation-mode particles. While under high RH conditions or supersaturated conditions, SA was also formed in the aqueous phase, contributing to the formation of both accumulation-mode and coarse-mode particles. The difference in particle size where SA formation took place and the difference in SA chemical compositions could result in distinct variations of CCN activity, which has not been evaluated yet. In this study, we will study the influence of SA formation on the size-resolved particle activation ratio (SPAR) of accumulation-mode particles in the NCP under different RH conditions, which fills a gap of knowledge within CCN studies in the NCP and may provide guidance for the improvement of current CCN parameterization schemes in chemical-transport and climate models.
2.1 Measurements
2.1.1 Site
Under the framework of McFAN (Multiphase chemistry experiment in Fogs and Aerosols in the North China Plain) (Li et al., 2021), from 16 November to 16 December 2018, physical and chemical properties of ambient aerosol particles as well as meteorological parameters were continuously measured at the Gucheng site in Dingxing County, Hebei Province, China. This site is an Ecological and Agricultural Meteorology Station (39∘09′ N, 115∘44′ E) of the Chinese Academy of Meteorological Sciences, which is located between Beijing (∼ 100 km) and Baoding (∼ 40 km), two megacities in the North China Plain, and surrounded by farmlands and small towns. Measurements at this site can represent the polluted background conditions of the NCP well. All aerosol measurement instruments were placed in a container with temperature maintained at 24 ∘C, while conventional trace gas instruments including CO were housed in an air-conditioned room on a two-story building located ∼ 80 m to the south of the container, with no taller buildings between them blocking the air flow.
2.1.2 Instrumentation
In this study, ambient aerosol was sampled by an inlet system consisting of a PM10 inlet (Rupprecht & Patashnick Co., Inc., Thermo, 16.67 L min−1), a Nafion dryer that dried relative humidity to below 30 % and an isokinetic flow splitter directing the air sample to each instrument.
A DMA-CCNC (differential mobility analyzer–cloud condensation nuclei counter) system measured SPAR at five supersaturations (SSs), 0.05 %, 0.07 %, 0.2 %, 0.44 % and 0.81 %, with a running time of 20 min for 0.05 % and 10 min for the other SSs. This system consisted of a differential mobility analyzer (DMA model 3081; TSI, Inc, MN USA), a condensation particle counter (CPC model 3772; TSI, Inc., MN USA) and a continuous-flow CCN counter (model CCN200, Droplet Measurement Technologies, USA; Roberts and Nenes, 2005). The system was operated in a size-scanning mode over the particle size range from 9 to 400 nm. SPAR can be obtained by combining the measurements of CPC and CCNC at different particle size. The sample and sheath flow rate of the DMA were set to 1 and 5 L min−1, respectively; hence the resultant measured particle diameter ranged from 9 to 500 nm. Since the low number concentration of particles above 300 nm could lead to large uncertainty in CCNC counting, the measurements for particles larger than 300 nm were excluded, except for 0.05 % SS. In order to characterize the variations of particles with low hygroscopicity of about 0.1, SPAR measurement up to about 400 nm is used at 0.05 % SS. There are 12 size distribution scans during a complete 1 h cycle, with four scans for the first SS and two scans for each of the remaining four SSs. Only the last scan for each SS is used as the CCNC needs time for SS stabilization. The SSs of CCNC were calibrated with monodispersed ammonium sulfate particles (Rose et al., 2008) both before and after the campaign. The flow rates were checked regularly (every few days) during the campaign, as the flows (sample flow and sheath flow) of the instrument can affect both the counting of droplets and the SS in the column. A modified algorithm based on Hagen and Alofs (1983) and Deng et al. (2011, 2013) was used to correct the influence of multiple-charge particles and DMA transfer function on SPAR. Details about the system are described in Ma et al. (2016), and the description about the inversion method can be found in the Supplement.
Non-refractory particulate matter (NR-PM) including SO, NO, NH, Cl− and organics with dry aerodynamic diameters below 2.5 µm was measured by an Aerodyne Time-of-Flight Aerosol Chemical Speciation Monitor (ToF-ACSM hereafter) equipped with a PM2.5 aerodynamic lens (Williams et al., 2010) and a capture vaporizer (Xu et al., 2017b; Hu et al., 2017a) at 2 min time resolution. The ToF-ACSM data were analyzed with standard data analysis software (Tofware v2.5.13; https://sites.google.com/site/ariacsm/, last access: 21 January 2020). The organic mass spectra from 12 to 214 were analyzed with an Igor Pro-based positive matrix factorization (PMF) evaluation tool (v3.04) and then evaluated following the procedures described in Zhang et al. (2011). The chosen five-factor solution includes four primary factors, i.e., hydrocarbon-like OA (HOA), cooking OA (COA), biomass burning OA (BBOA) and coal combustion OA (CCOA), and a secondary factor, i.e., oxygenated OA (OOA). More detailed descriptions on the ACSM measurements and data analysis can be found in Kuang et al. (2020b) and Sun et al. (2020).
A hygroscopocity-tandem differential mobility analyzer (HTDMA; Tan et al., 2013) measured the size-resolved aerosol growth factor (GF) at 90 % RH. The sampled particles were subsequently charged by a neutralizer (Kr85, TSI Inc.) and size-selected by a DMA (DMA1, model 3081L, TSI Inc.). A Nafion humidifier (model PD-70T-24ss, Perma Pure Inc., USA) was used to humidify the monodisperse particles with a specific diameter (Dd) at a fixed RH of (90 ± 0.44) %, and then the number size distribution of the humidified particles (Dwet) was measured by another DMA (DMA2, model 3081L, TSI Inc.) and a condensation particle counter (CPC, model 3772, TSI Inc.). Thus, the GF of the particles can be calculated as
During the campaign, four dry mobility diameters (60, 100, 150 and 200 nm) were selected for the HTDMA measurements. A full scan takes about 1 h in order to cover the four sizes. Regular calibration using standard polystyrene latex spheres and ammonium sulfate was performed to ensure the instrument functioned normally. The tandem differential mobility analyzer (TDMA) inversion algorithm (Gysel et al., 2009) was applied to calculate the probability density function of GF (GF-PDF). More details about this system can be found in Cai et al. (2018) and Hong et al. (2018).
Particle number size distributions (PNSDs) were measured by combining the measurements of a scanning mobility particle sizer (SMPS; TSI model 3080) and an aerodynamic particle sizer (APS; TSI Inc., Model 3321), that measured particle mobility diameter size distributions in the range of 12 to 760 nm and particle aerodynamic diameter size distribution in the range of 700 nm to 10 µm, respectively. A commercial instrument from Thermo Electronics (Model 48C) was used to measure CO concentration. Besides monthly multipoint calibrations and weekly zero-span check, additional 6-hourly zero checks were also performed for the CO instrument.
2.2 Data processing
2.2.1 Aerosol hygroscopicity and cloud activation: κ-Köhler theory
The ability of particles to act as CCN and their dependence on particle size and particle chemical composition on CCN activity can be described by the Köhler theory (Köhler, 1936). A hygroscopic parameter κ is calculated based on the κ-Köhler theory (Petters and Kreidenweis, 2007) to evaluate the influence of particle chemical compositions:
where S represents the saturation ratio, ρw is the density of water, Mw is the molecular weight of water, is the surface tension of the solution–air interface, R is the universal gas constant, T is the temperature, Dd is the diameter of dry particle and Dwet is the diameter of the humidified particle. In this study, is assumed to be the surface tension of the pure water–air interface. Based on the κ-Köhler theory, the surface equilibrium water vapor saturation ratio of particles with a specific κ at different wet particle size can be calculated, and the maximum value of the surface equilibrium saturation ratio (which is generally supersaturated) is defined as the critical SS for CCN activation. As a result, the variation of the critical diameter (Da) for particles with different hygroscopicity (or GF at a specific RH) at different SSs can be determined.
2.2.2 Aerosol growth factor and its probability density function
In practice, the growth factor probability density function (GF-PDF) was inversed from the measured GF distribution using a TDMAinv algorithm (Gysel et al., 2009). After obtaining the GF-PDF, the ensemble average GF and corresponding critical diameter under a certain SS (Da,GF) can be calculated. Furthermore, the number fraction and the weighted-average GF of hygroscopic particles (κ > 0.1 and GF(90 %, 200 nm) > 1.22) were calculated as
Based on the κ-Köhler theory, the hygroscopicity parameter κ and corresponding critical diameter (Da,hygro) under a certain SS for particles with GFhygro can be calculated. As GFhygro is higher than the average GF, Da,hygro is smaller than Da,GF.
2.2.3 Calculations of aerosol hygroscopicity from aerosol chemical composition measurements
For the calculation of aerosol hygroscopicity parameter κ based on measured chemical composition data (κchem), detailed information on the chemical species is needed. The ACSM can only provide bulk mass concentrations of SO, NO, NH and Cl− ions and organic components, which cannot be used to calculate size-resolved hygroscopicity. However, in the North China Plain, accumulation-mode particles are the dominant contributors to the bulk particle mass concentration (Liu et al., 2014; Xu et al., 2015; Hu et al., 2017b), and thus the bulk chemical compositions can be used as a proxy for those of accumulation-mode particles. For the inorganic ions, a simplified ion pairing scheme was used to convert ion mass concentrations to mass concentrations of corresponding inorganic salts (Gysel et al., 2007; Wu et al., 2016). Thus, mass concentrations of SO, NO, NH and Cl− are specified into ammonium sulfate (AS), ammonium nitrate (AN), ammonium chloride (AC) and ammonium bisulfate (ABS), for which the κ values under supersaturated conditions were specified according to Petters and Kreidenweis (2007). For a given internal mixture of different aerosol chemical species, the Zdanovskii–Stokes–Robinson (ZSR) mixing rule can be applied to predict the overall κchem using volume fractions of each chemical species (εi) (Petters and Kreidenweis, 2007):
where κi and εi represent the hygroscopicity parameter κ and volume fraction of chemical component i in the mixture. Based on Eq. (2), κchem can be calculated as follows:
where κBC is assumed to be zero as black carbon is non-hygroscopic. κorg and εorg represent κ and volume fraction of total organics. The values of hygroscopicity parameter for inorganic compounds can be found in Table 1 of Petters and Kreidenweis (2007). Large variations in κorg have been reported in former studies, and a linear relationship between κorg and organic aerosol oxidation state (f44) was detected in our campaign (Kuang et al., 2020b), which was adopted to calculate κorg in this study:
It should be noted that the κ-Köhler theory is not perfect, even for inorganic compounds. Numerous studies have been focusing on the performance of its application on measurements under different RH conditions (Liu et al., 2011; Wang et al., 2017). And κorg used in this study was determined by the measurement of a humidified nephelometer at RH of 85 % in Kuang et al. (2020b), due to the lack of κorg measured under supersaturated conditions. In this study, we focus on the variations of κ values derived from HTDMA and CCN measurement during the SA formation events, rather than the closure between κ values derived using different techniques, which will be addressed in an upcoming study.
2.2.4 Fitting parameterization scheme of SPAR
In general, the variation in CCN activity of a particle population can be attributed to the variation in the number fraction of hygroscopic particles or its hygroscopicity, which can be indicated by fitting parameters of SPAR curve parameterization. SPAR curves are often parameterized using a sigmoidal function with three parameters. This parameterization assumes aerosols to be an external mixture of apparently hygroscopic particles that can act as CCN and non-hygroscopic particles that cannot be measured by CCNC within the measured particle size range below 400 nm (Rose et al., 2010). SPAR (Ra(Dp)) at a specific SS can be described as follows (Rose et al., 2008):
where erf is the error function, MAF is the asymptote of the measured SPAR curve at large particle sizes, Da is the midpoint activation diameter and is associated with the hygroscopicity of CCN and σ is the standard deviation of the cumulative Gaussian distribution function and indicates the heterogeneity of CCN hygroscopicity. As reported by Jiang et al. (2021), based on the investigation of the covariations between SPAR curves and parameterized hygroscopicity distribution, it was found that the MAF can be used to estimate the number fraction of hygroscopic (thus CCN-active) particles, for aerosol hygroscopicity distributions generally observed in the ambient atmosphere, and thus half MAF can be used to represent the number fraction of CCN to total particles at particle size around Da. Although the influence of particles whose κ is less than 0.1 on SPAR cannot be considered in this parameterization scheme, significant deviations were only found under higher SSs (Tao et al., 2020) and need not be considered under the low SSs discussed in this study.
It should be noted that the meaning of MAF can be different with regards to the SS, and SPAR measurement up to about 400 nm is needed for the MAF fitting for SPAR at SS of 0.05 % to represent the particles with κ values higher than 0.1. For SPAR at SS of 0.8 %, MAF should be 1 at 400 nm diameter. However, a MAF of 1 in this case can lead to overestimations of hygroscopic particle number fraction due to the significant difference between SPAR curves and sigmoidal fitting curves. In the former study on SPAR fitting curves in the NCP, it was found that a fitting parameterization with the combination of two sigmoidal fitting curves was needed for SPAR fitting at SSs higher than 0.4 % (Tao et al., 2020). However, in this study, we investigate SA formation on accumulation-mode particles and particle CCN activity at SSs below 0.1 %, under which condition non-hygroscopic particles smaller than 400 nm are typically CCN-inactive. The MAF fitted in the particle size range below 400 nm was used to indicate the variations of SPAR that was of the main focus here in this work. In addition, due to the very low NCCN in particle size ranges larger than 400 nm, the deviations of NCCN due to the limited range of measured particle size are also very small.
3.1 Overview of the measurements
The time series of meteorological parameters, SPAR, NCCN at SS of 0.05 % and mass concentration of non-refractory particulate matter of PM2.5 (NR-PM2.5), PM2.5 SA (inorganic compounds and OOA) and PM2.5 PA (primary aerosol, defined as the sum of POA) are shown in Fig. 1. The mass concentration of OOA and four POAs were quantified by the ACSM PMF analysis (Zhang et al., 2011). During the campaign, PM2.5 PA was generally lower than 100 µg m−3 under both high and low RH periods. Meanwhile, PM2.5 SA can approach about 400 µg m−3, especially during the strong SA formation events under high RH conditions, but can be lower than 100 µg m−3 under low RH conditions. Strong diurnal variations were found in SPAR with varying meteorological parameters. During the whole period, the wind speed was generally lower than 4 m s−1, which is in favor of aerosol particle accumulation and SA formation on existing particles. However, RH, NCCN (0.05 %), PM2.5 SA and NR-PM2.5 mass concentrations revealed very distinct levels before and after 4 December, and thus the whole campaign was divided into two stages with different RH and SA pollution conditions: higher RH and stronger SA pollution before 4 December and lower RH and lighter SA pollution after 4 December. In the following discussions, the high RH stage corresponds to days before 4 December with daily maximum and minimum RH higher than 75 % and 50 %, respectively. Two events that occurred during 25 to 27 November (Event 1) and 30 November to 2 December (Event 2), respectively, displayed especially high RH conditions with successive nighttime fogs (blue shaded areas). The low RH stage corresponds to the period after 4 December with daily maximum and minimum RH below 70 % and 30 %, which was represented by two events that occurred during 9 to 11 December (Event 3) and 13 to 15 December (Event 4), respectively. These events were selected based on the similarity of PM2.5 concentration and evolution, while the time window was fixed to 2 d for the convenience of intercomparison. In addition, during these events, the wind speed was generally low, the RH followed a general diurnal variations and SA mass grew steadily and continuously. Thus the interference of the variations of air mass and short-term local emissions can be eliminated, and the influence of SA formation can be highlighted. It should be noted that variations of NCCN at 0.07 % were similar to those at 0.05 %, which followed the variations of SA mass concentration, while at higher SSs, the variations of NCCN differed from those of SA mass concentration, especially under high RH conditions, suggesting different responses of CCN activity towards distinct SA formation processes. As reported in Kuang et al. (2020c), during the high RH stage, aqueous-phase SA formation was promoted, leading to persistent increases in NCCN(0.05 % and 0.07 %), mass concentration of NR-PM2.5 and especially mass concentration of PM2.5 SA during Events 1 and 2. During the low RH stage, the SA formation dominantly occurred in the gas-phase, that generated much less SA than aqueous-phase formation (Kuang et al., 2020c). Thus, the persistent increases of NCCN (0.05 % and 0.07 %) and PM2.5 during Events 3 and 4 were much weaker than those in Events 1 and 2. Due to the different SA mass fractions, SPAR during the high RH stage was generally higher than that during the low RH stage. However, the ratios between NCCN (0.05 %) and mass concentration of PM2.5 SA or NR-PM2.5 were lower during the high RH period and demonstrated strong decreases, especially in Event 1 and 2. The response of CCN activity and NCCN (0.05 %) to the different SA formation mechanisms will be discussed comprehensively in the following parts.
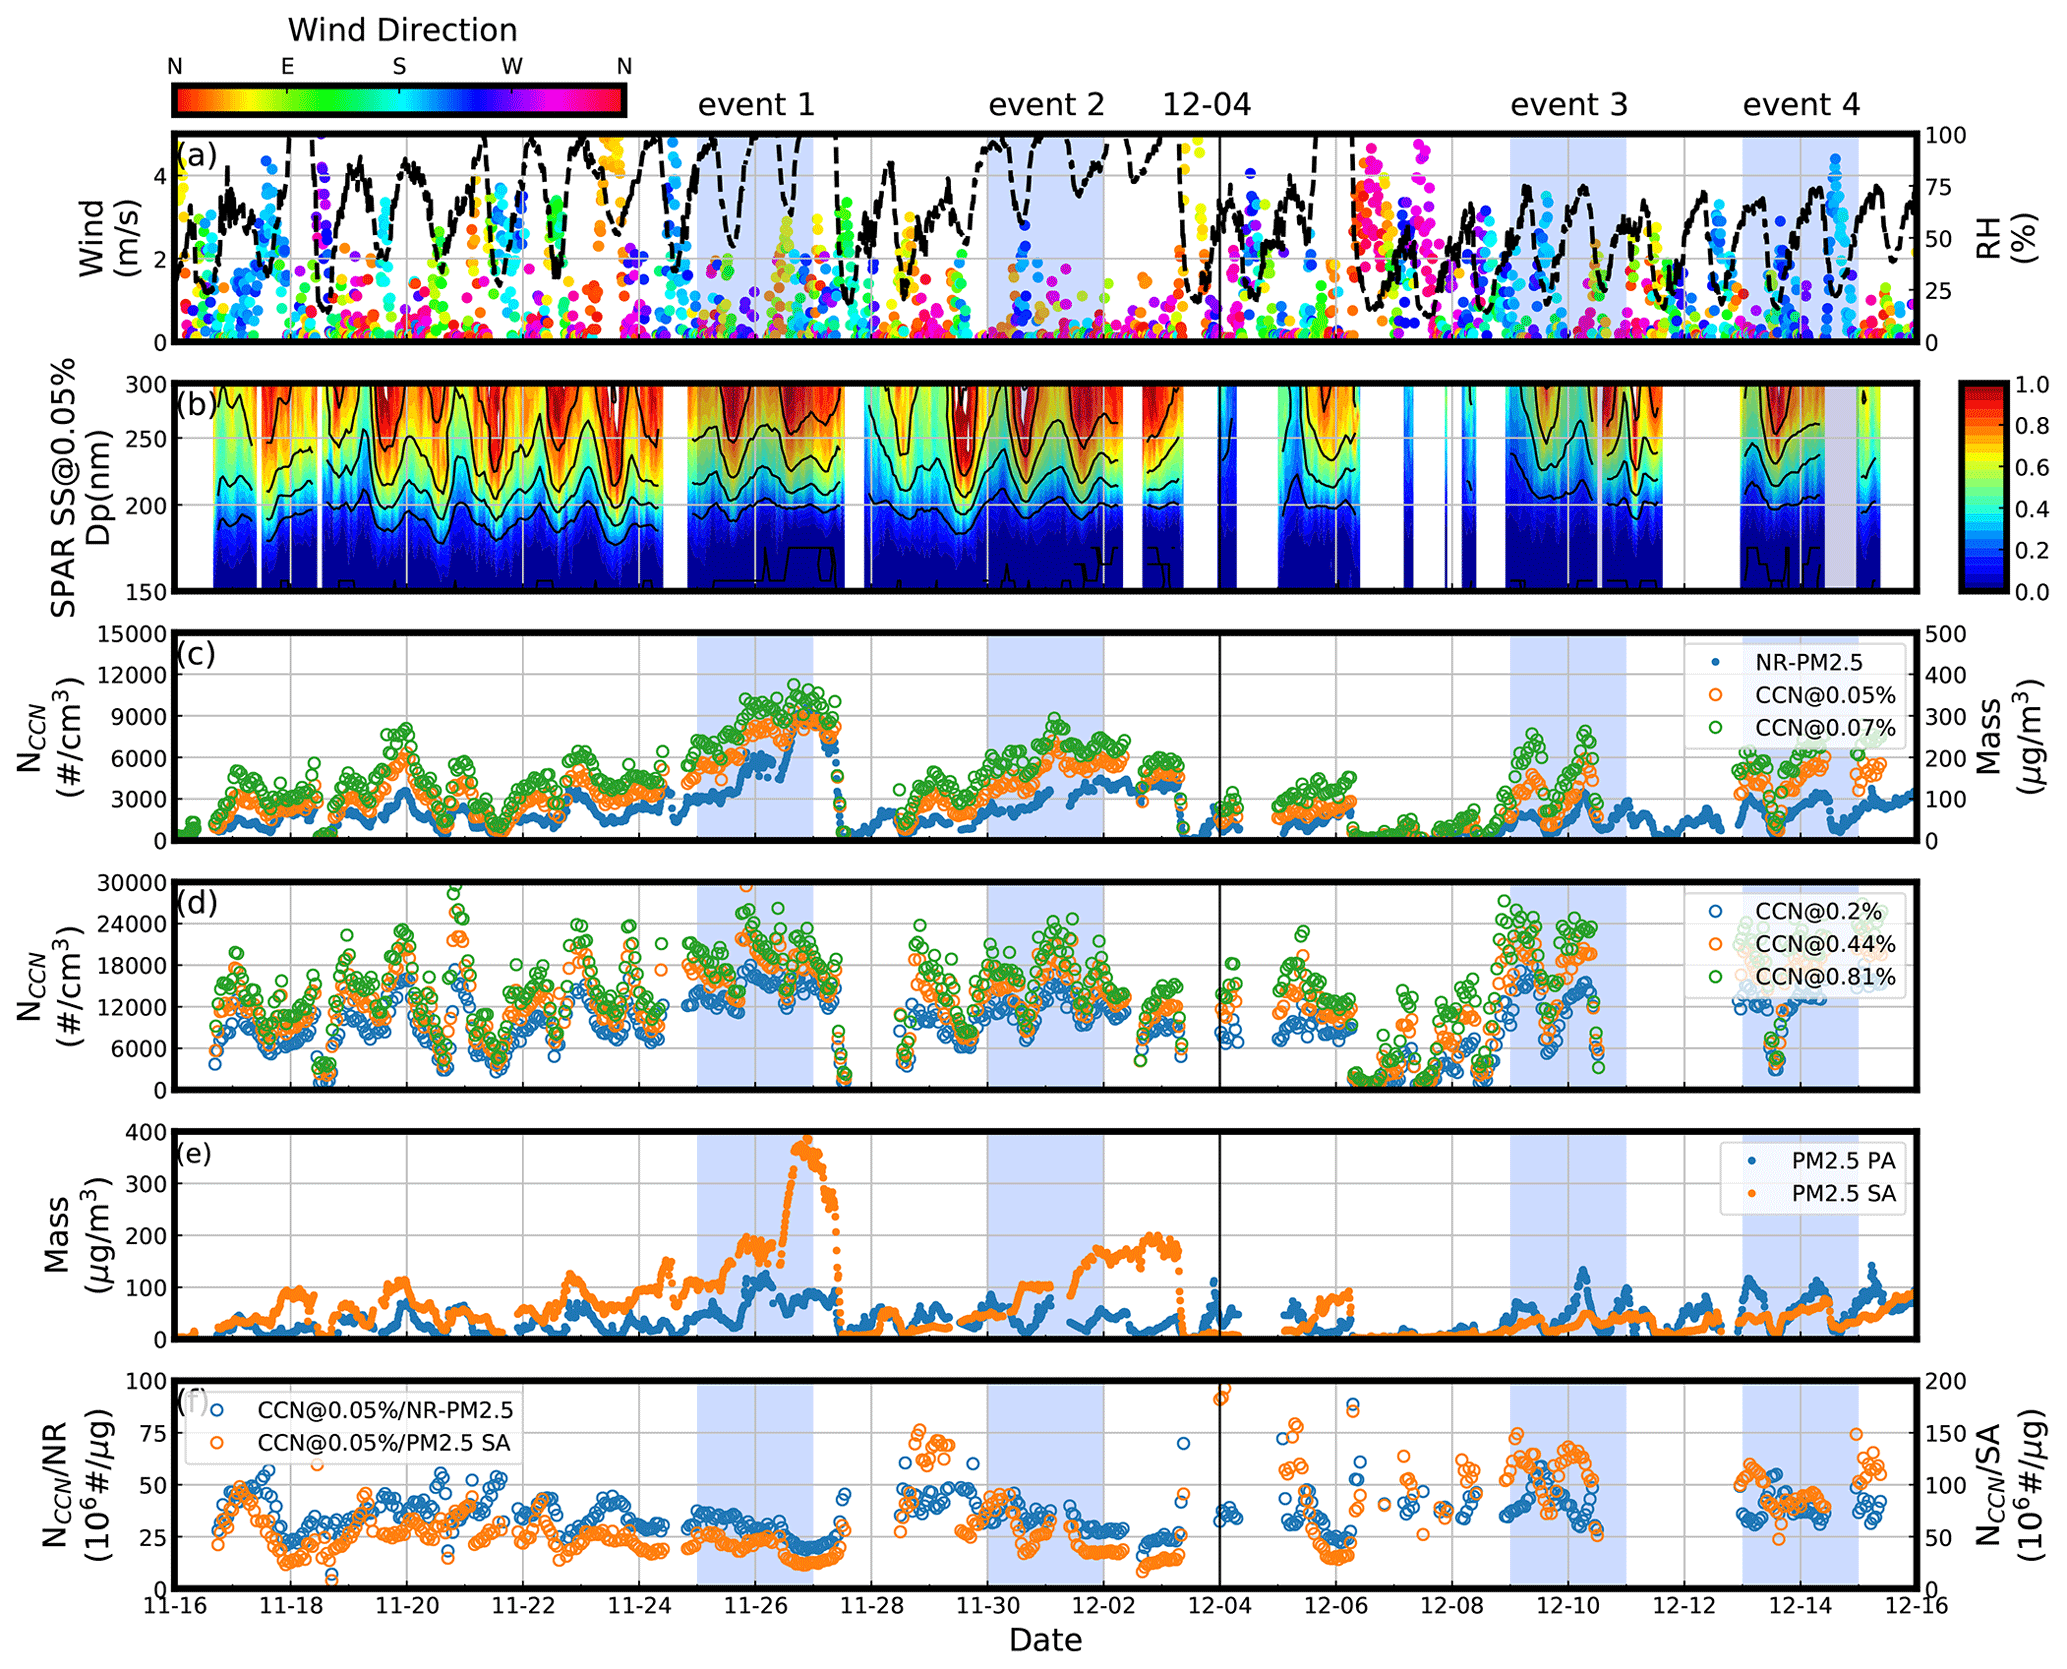
Figure 1Overview of the measurements during the campaign: (a) dots represent wind speed, with color indicating wind direction, and black lines represent RH; (b) SPAR under SS of 0.05 %; (c) blue, green and yellow dots represent NCCN under SS of 0.05 % and 0.07 % and mass concentration of NR-PM2.5, respectively; (d) blue, green and yellow dots represent NCCN under SS of 0.2 %, 0.44 % and 0.81 %, respectively; (e) blue and yellow dots represent the mass concentration of PM2.5 PA and PM2.5 SA respectively; (f) blue and yellow dots represent the ratio between NCCN and mass concentration of NR-PM2.5 and PM2.5 SA, respectively. There were four events with significant enhancements of NCCN during the blue shaded periods.
3.2 The influence of different secondary aerosol formation on the diurnal variation of CCN activity
The diurnal averages of PNSD, SPAR at SS of 0.05 %, GF-PDF for 200 nm particle and mass fraction of particle chemical compositions during high RH periods before 4 December, low RH periods after 4 December and the four events are shown in Fig. 2, respectively. It should be noted that the “high (or low) RH events” is used to refer to the SA formation events under high (or low) RH conditions for convenience, and it does not mean that RH caused variations of CCN behavior. As can be seen in Fig. 2(1b) and (2b), different variations of SPAR due to SA formation can be found during the periods with different RH conditions. The average diurnal variations of these parameters for the entire high RH stage and low RH stage as shown in Fig. 2(1a)–(1d) and (2a)–(2d) revealed similar but more smoothed variations as in the four selected events. The four events are discussed and intercompared in the following to magnify the differences under distinct RH conditions. For accumulation-mode particles, particle number concentrations were higher during daytime in high RH events, while stronger diurnal variations occurred in low RH events. Simultaneous daytime increases in particle SPAR in the size range from 200 to 400 nm, GF-PDF in the GF range from 1.2 to 1.8 and SA mass fraction were found in all four events, suggesting that SA formation led to increasing hygroscopic particle number concentration, which in turn enhanced particle CCN activity. This effect was more pronounced in Events 1 and 2 than in Events 3 and 4. In Events 1 and 2, SPAR values were generally higher than 0.4 at 200 nm and reached the maximum of 1 during noontime at 300 nm. A hygroscopic mode with GF > 1.4 was found throughout the day, which dominated aerosol hygroscopicity during daytime. Mass fractions of SA were generally higher than 70 % and reach a maximum of 80 % at noon, while in Events 3 and 4, SPAR at 200 nm was lower than 0.4 at night, and the maximum SPAR at 300 nm was lower than 0.9. A particle mode with GF < 1.1 dominates particle hygroscopicity, and the mass fraction of SA was lower than 60 % and 30 % at noon and at night, respectively. However, a stronger daytime increase of SA mass fraction and accordingly larger variation in SPAR was observed in Events 3 and 4 than in Events 1 and 2.
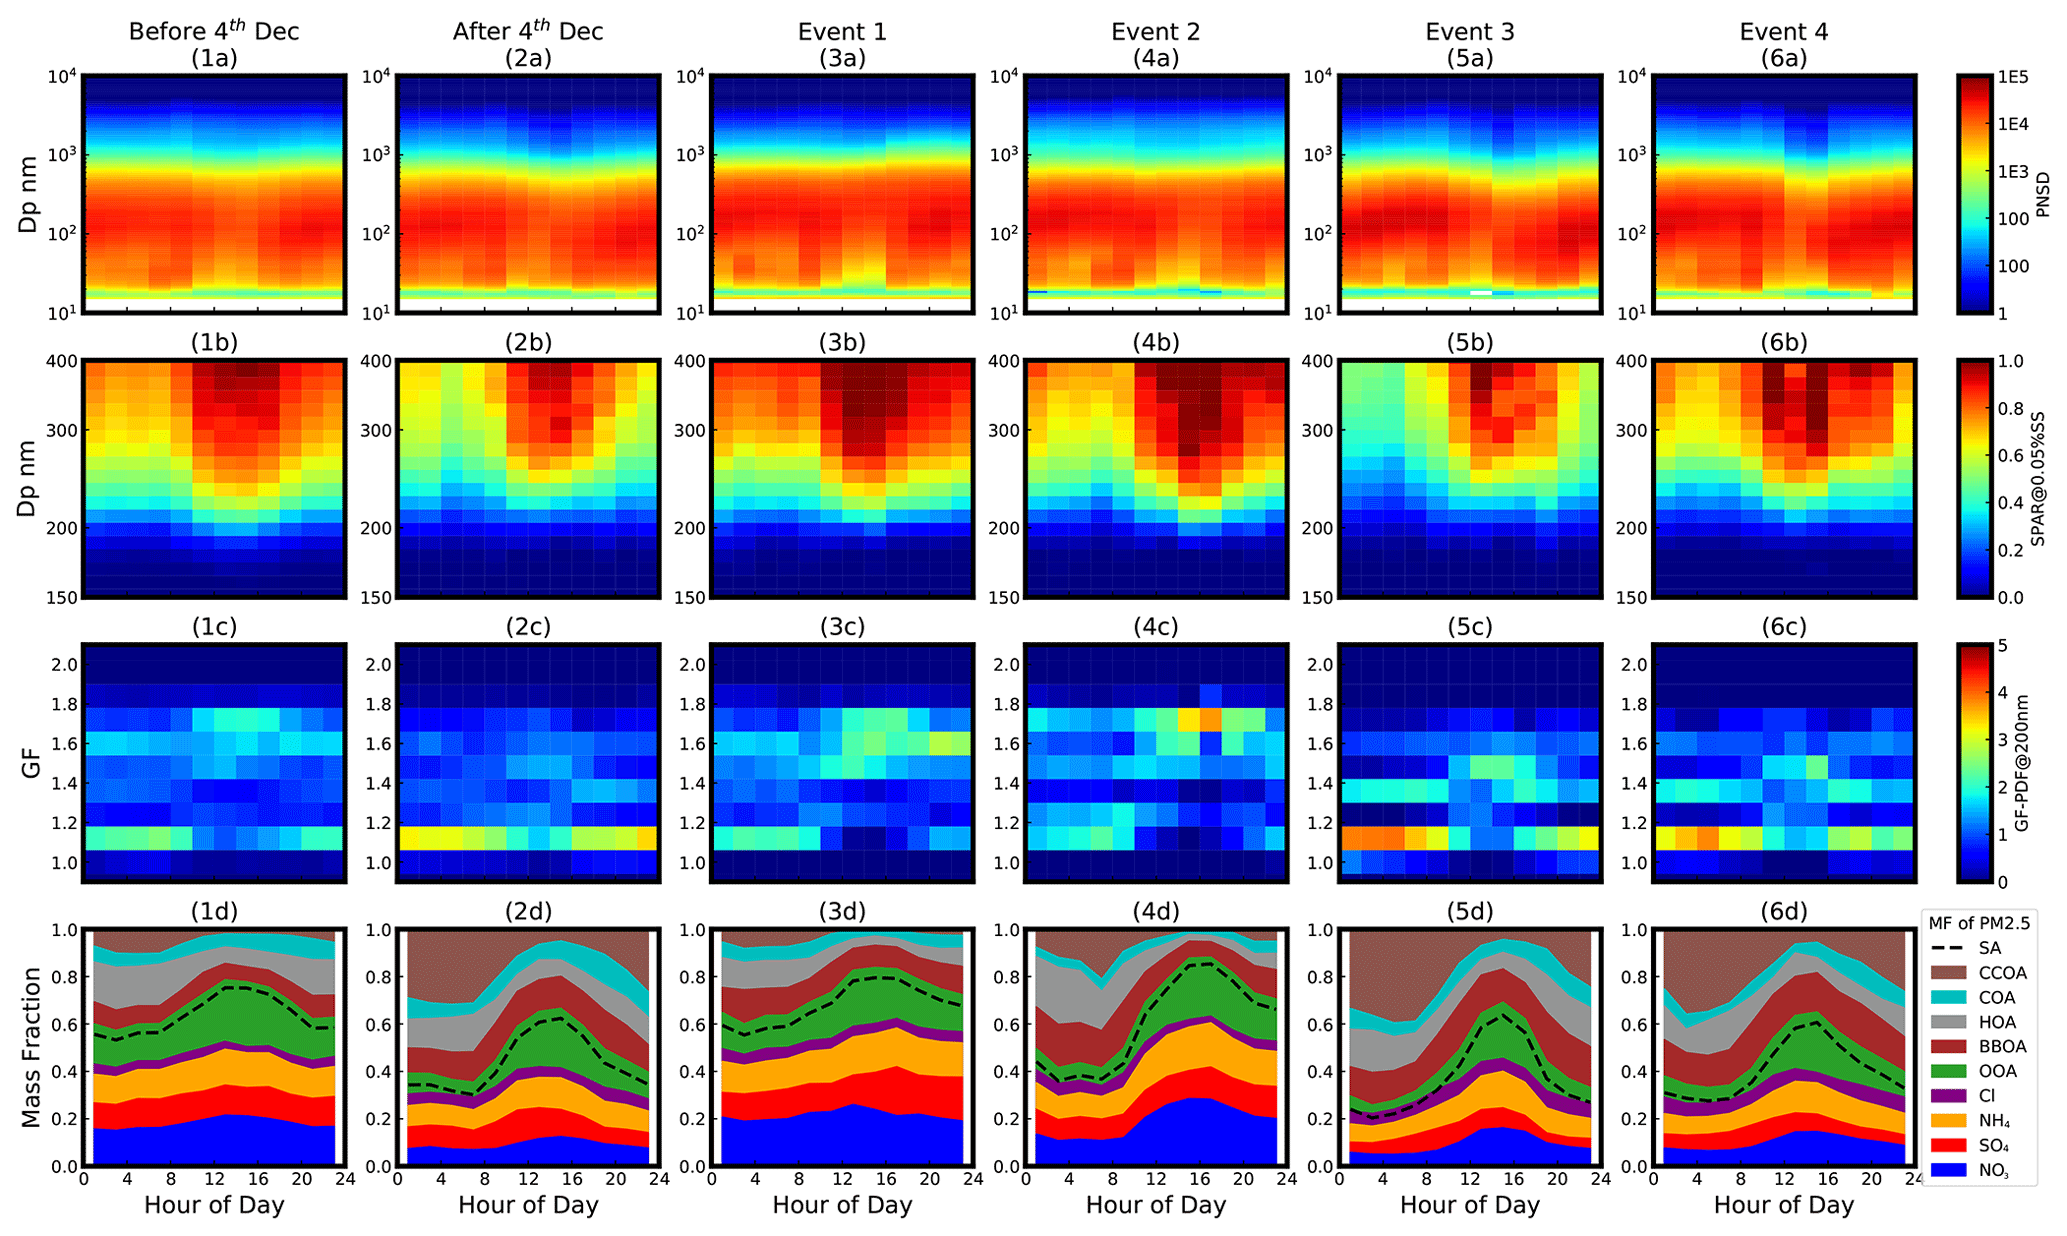
Figure 2Diurnal variation of (a) PNSD, (b) SPAR at SS of 0.05 %, (c) GF-PDF at 200 nm and (d) mass fraction of different PM2.5 chemical species during high RH periods before 4 December (1), low RH periods after 4 December (2) and the four events (3–6), including OA factors: hydrocarbon-like OA (HOA), cooking OA (COA), biomass burning OA (BBOA), coal combustion OA (CCOA) and oxygenated OA (OOA).
Besides SS of 0.05 %, variations of SPAR at SSs of 0.07 % and 0.2 % are also shown in Figs. S1 and S2 in the Supplement. And as shown in Figs. S1 and S2, the variations of SPAR and NCCN PM at SS of 0.07 % are similar but lighter, compared with those at SS of 0.05 %, while for SS of 0.2 %, the difference of SPAR between different periods or events is smaller (Fig. S1) and so were the diurnal variations of SPAR and GF-PDF at a particle size of 100 nm (Fig. S2). Because CCN activity at SS of 0.2 % was strong enough (indicated by SPAR value close to 1) in the particle size range where the SA formation dominates, the different SA formation under high or low RH conditions cannot lead to significant variations of CCN activity at SS of 0.2 %. In summary, based on CCN measurements in this study, the RH-dependent influence of SA formation on CCN activity can be found obviously at SSs of 0.05 % and 0.07 %. As the variations of SPAR at SS of 0.07 % were quite similar to those at SS of 0.05 %, further analysis was only based on CCN activity at SS of 0.05 %.
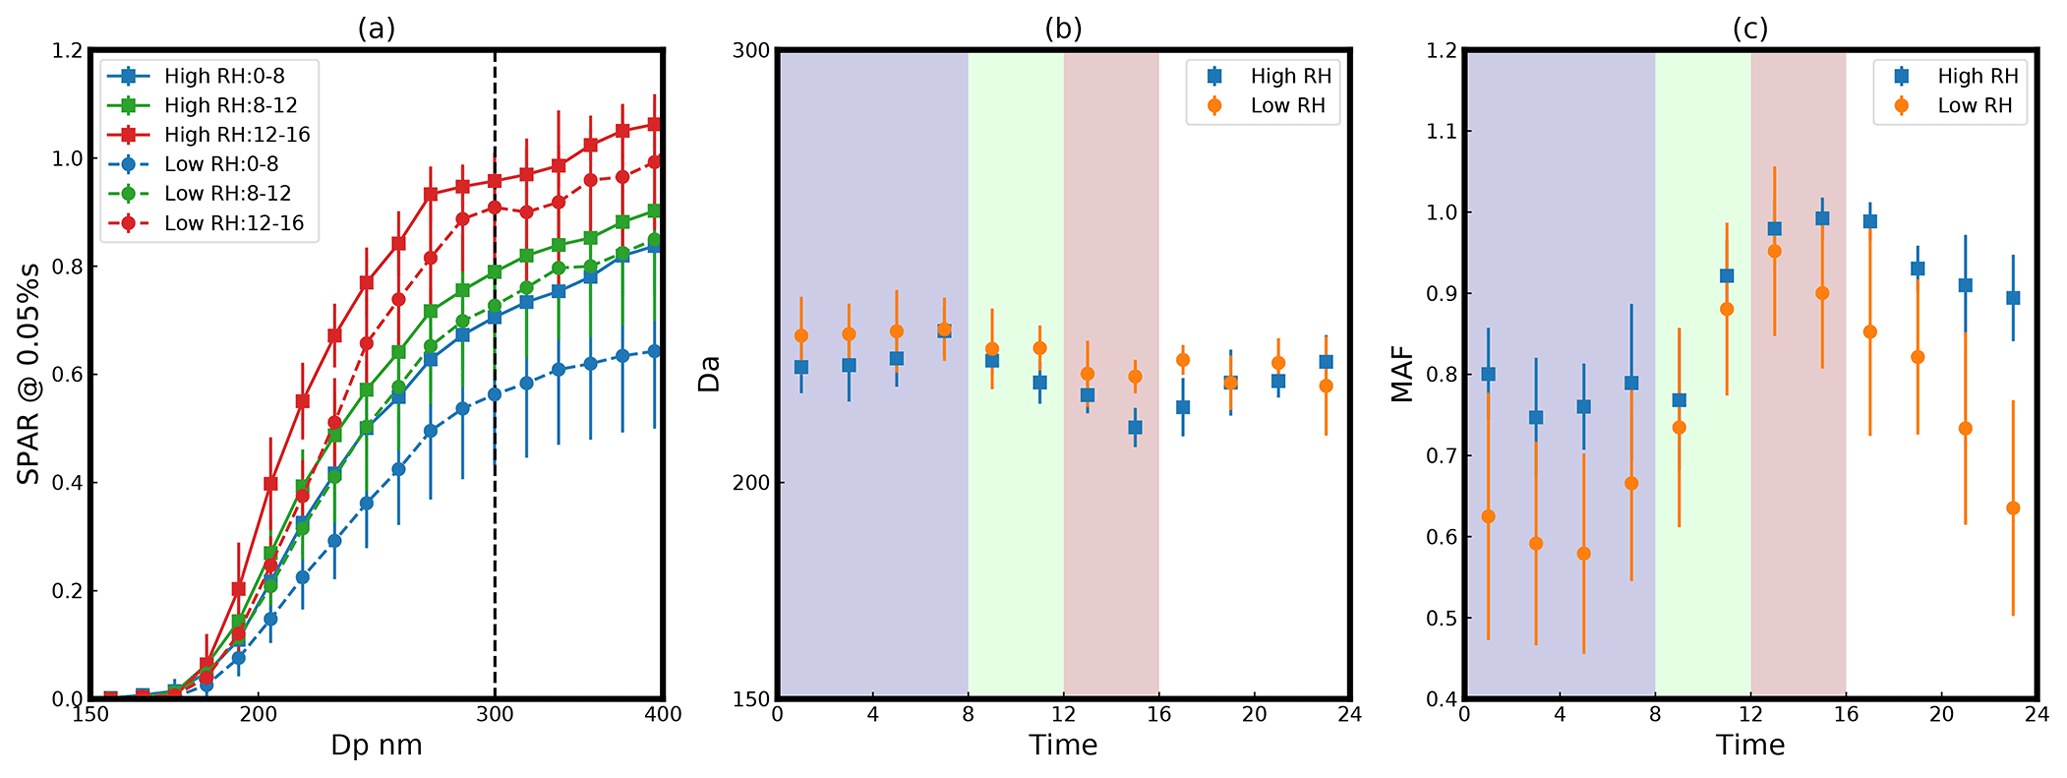
Figure 3(a) The averages of SPAR curves at SS of 0.05 % in three different time periods (blue: 00:00–08:00 LT; green: 08:00–12:00 LT; red: 12:00–16:00 LT) during high (squares with solid line, event 1 and 2) and low (dots with dashed line, event 3 and 4) RH events. Diurnal variation of (b) Da and (c) MAF under high (blue) and low (yellow) RH conditions. The blue, green and red shades correspond to the three periods in panel (a). Error bars indicate the standard deviations of data.
In Fig. 3a, a detailed comparison of particle CCN activity during SA formation events of NCCN enhancements at SS of 0.05 % under different RH conditions shows the variations of SPAR curves. Particle CCN activity in Events 1 and 2 were combined due to their similar diurnal variations (as shown in Fig. 2). Besides SPAR curves (Fig. 3a), corresponding fitting parameters of the SPAR curve including Da and MAF were also shown in Fig. 3b and c, respectively, as enhanced SPAR for particle population can be attributed to hygroscopic particle number fraction increase (MAF increase) or enhancement of hygroscopic particle hygroscopicity (Da decrease). The same as demonstrated in Fig. 2, SPAR was generally higher, and thus particle CCN activity (0.05 %) was generally stronger in high RH events than those in low RH events. However, as shown in Fig. 3a, the difference between SPAR in high and low RH events at 300 nm decreased from 0.2 to 0.1 during the SA formation, indicating a stronger enhancement in low RH events, probably due to both the stronger increase of SA mass fraction and the higher nighttime PA mass fraction (Fig. 2e). Furthermore, in high RH events, there were daytime enhancements of SPAR within the 150 to 300 nm size range, as was indicated by the daytime increase of MAF and decrease of Da, which mainly resulted from number fraction and hygroscopicity increases of CCN-active particles, while in low RH events, the daytime enhancement of SPAR was only observed for particles larger than 200 nm. This can be attributed to the strong increase of MAF and the slight decrease of Da, which indicates significant increasing number fraction, yet slightly enhanced hygroscopicity of hygroscopic particles, respectively. Overall, the enhancement of SPAR was weaker but occurred at a broader particle size range in high RH events than in low RH events, as shown in Fig. 3a. This is in accordance with the previous results from Kuang et al. (2020c), suggesting that SA formation occurred mainly in the aqueous phase within a broad particle size range (up to 1 µm) in high RH events, while SA formation dominantly proceeded via gas-phase reactions and contributed to aerosol sizes smaller than 300 nm in low RH events. At SS of 0.05 % (Fig. 3a), the variation of SPAR from 08:00–12:00 to 12:00–16:00 local time (LT) in particle sizes smaller than 200 nm was very small during low RH events, suggesting a smaller CCN activity enhancement due to SA formation compared with high RH events. In detail, the different variations of SPAR in high and low RH events indicated by MAF and Da (shown in Fig. 3b and c) suggested different variations of hygroscopicity, number fraction and size of SA particles. Before SA formation, there was a significant difference between the MAF in high and low RH events, which disappeared after the SA formation. The stronger variations in MAF in low RH events suggested stronger enhancement of number concentration of formed SA particles. As for Da during SA formation, there were similar, little decreases in both high and low RH events, suggesting similar hygroscopicity of the SA formed under low and high RH conditions. Thus differences of SPAR and the resultant NCCN during low and high RH events were mainly due to the different variations of number fraction of formed SA particles.
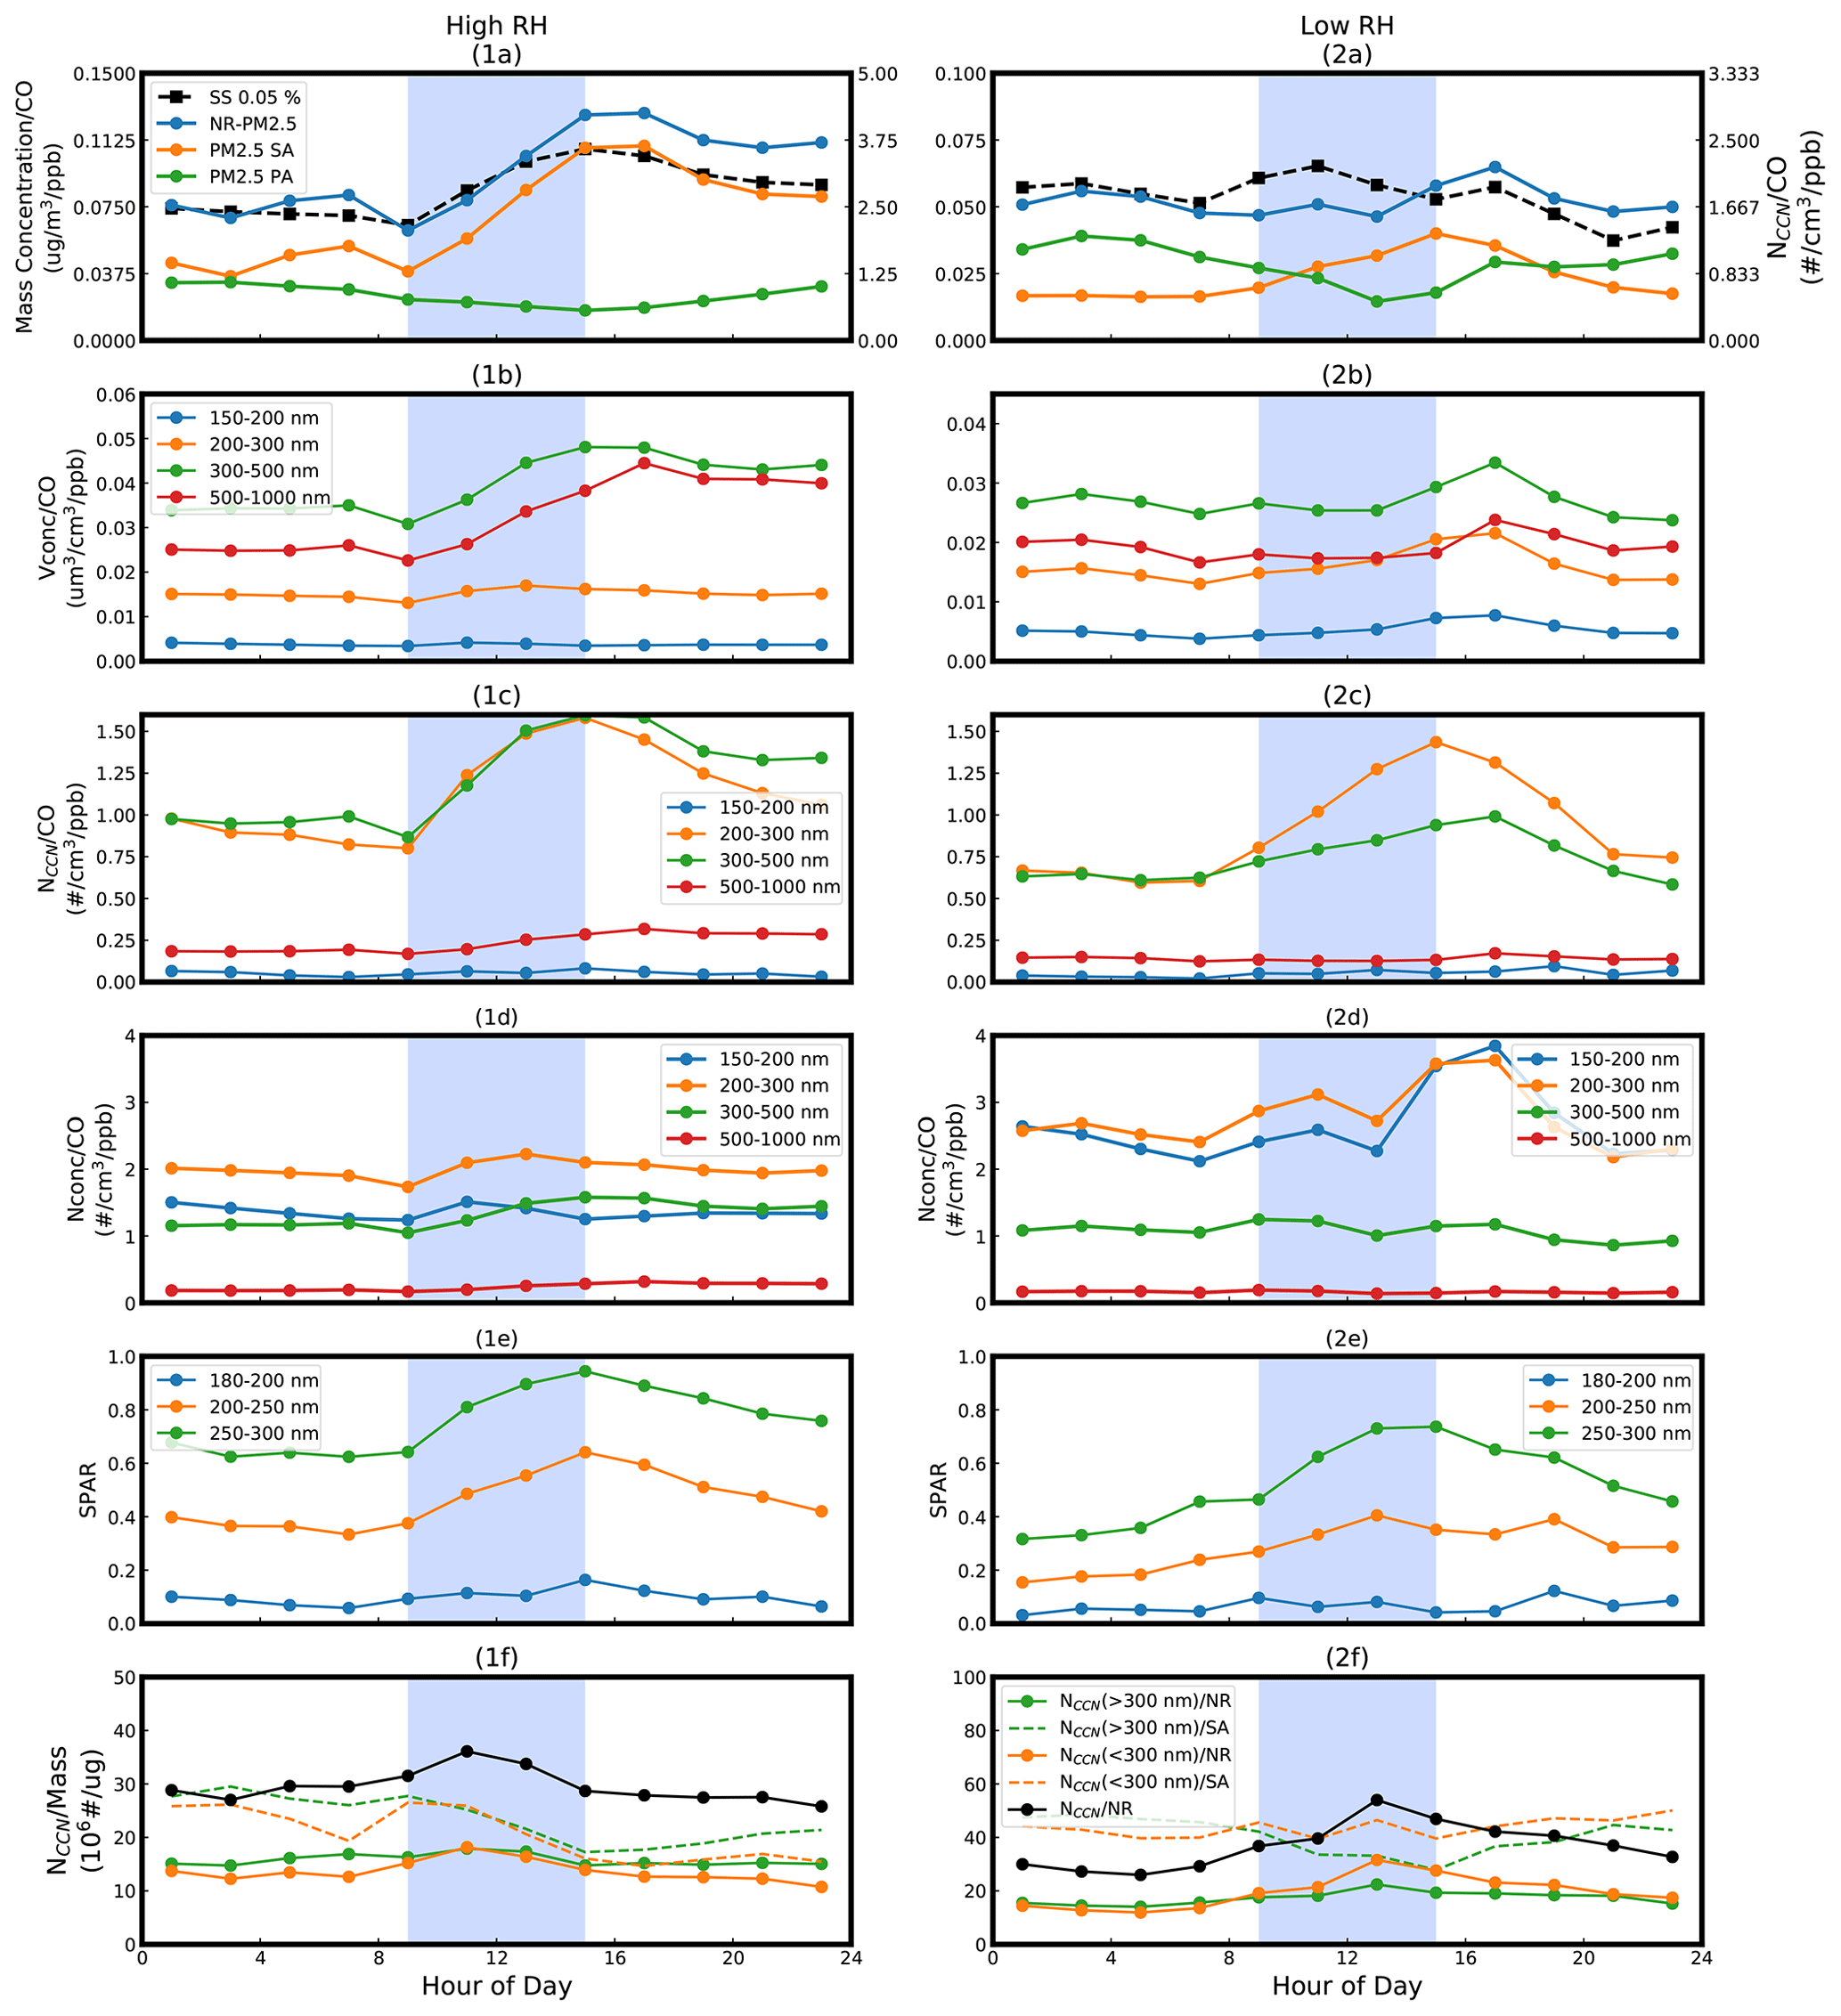
Figure 4During different RH events, the average diurnal variation of (a) the ratios between particle mass concentration (dots with solid lines; blue: NR-PM2.5; yellow: PM2.5 SA; green: PM2.5 PA) and CO concentration and the ratio between NCCN at SS of 0.05 % and CO concentration (squares with solid line); (b) the ratios between particle volume concentration (Vconc) of different particle size range (indicated by colors) and CO concentration; (c) the ratios between NCCN of different particle size range at SS of 0.05 % (indicated by colors) and CO concentration; (d) the ratios between particle number concentration (Nconc) of different particle size range (indicated by colors) and CO concentration; (e) SPAR of different particle size range (indicated by colors); (f) the ratios between NCCN at SS of 0.05 % (black: bulk NCCN; yellow: NCCN with particle size larger than 300 nm; blue: NCCN with particle size smaller than 300 nm) and mass concentration of NR-PM2.5 SA and the ratios between NCCN and mass concentration of NR-PM2.5 (dashed lines).
As there were different influences of SA formation on both CCN activity at SS of 0.05 % and PNSD under different RH conditions, different variation of NCCN (0.05 %) due to SA formation can also be expected. Figure 4 displays the diurnal variation of PM2.5 mass concentration, volume concentration (Vconc), number concentration (Nconc) and NCCN (0.05 %) (all divided by CO to partially compensate for changes in planetary boundary layer height), as well as the NCCN PM2.5 mass concentration ratio and SPAR during high and low RH events, respectively. Variables in Fig. 4 are also presented in Fig. S3 averaged for the entire high RH and low RH stages, respectively. Compared with the selected case events featuring significant NCCN enhancement (Fig. 4(1c)–(2c)), the diurnal variations averaged for the entire high and low RH stages were similar, with higher levels of particle mass concentration but weaker enhancement of SA and NCCN, indicating a similar but weakened impact of SA formation on CCN activity due to the interference of other aerosol processes. Hereinafter, we discuss the variations in the four events to magnify the discrepancies of SA formation under high RH and low RH conditions and its distinct impact on NCCN. The Vconc size distribution variations can be used as a proxy for the evolution of NR-PM2.5 size distributions, considering the relatively small variations in particle density (ranging from 1.2 to 1.8 and with relative variations within 20 %; Hu et al., 2012; Zhao et al., 2019). The variations of the ratio between NCCN (in different particle size range) and the mass concentration of PM2.5 SA (referred to as NCCN SA) or NR-PM2.5 (referred to as NCCN NR) can be used to evaluate the response of NCCN to SA formation.
During high RH events, normalized NCCN (0.05 %) increased by ∼ 50 % from 08:00 to 14:00 LT, with a similar increase in normalized PM2.5 SA mass concentration (Fig. 4(1a)). As the PM2.5 PA mass concentration decrease was much smaller than the SA increase, the NR-PM2.5 mass concentration increase can be expected to be similar to the SA increase. As reported by Kuang et al. (2020c), SAs during daytime were mainly formed at larger particle sizes, featuring Vconc increase in the particle size range of 400 to 1000 nm. In Fig. 4(1d), significant increases of particle number concentration (Nconc) in particle size range of 150 to 1000 nm can be observed. At larger particle size, the increase of Nconc led to a stronger increase of Vconc, which is why there were simultaneous but much weaker increases of Vconc in the particle size range of 150 to 300 nm compared with increases of those in the particle size of larger than 300 nm (Fig. 4(1b)). This suggests that PM2.5 SA mainly contributed to particle sizes of larger than 300 nm. In addition, because the SA formation enhanced hygroscopicity and number fraction of CCN-active particles in the particle size range of 150 to 300 nm, simultaneous enhancements of SPAR can be found throughout the measured particle size range of 180 to 300 nm (Fig. 4(1e)). By combining the enhancements of Nconc and SPAR in measured particle size ranges, there were increases of NCCN from 200 to 500 nm (Fig. 4(1c)). Thus while SA formation processes contributed to their volume (mass) and hygroscopicity increase, it had no further impact on NCCN. As a result, NCCN (> 300 nm) SA, NCCN (< 300 nm) SA, NCCN (> 300 nm) NR and NCCN (< 300 nm) NR all decreased during the SA formation (Fig. 4(1f)), suggesting that weakening enhancement of NCCN (0.05 %) in SA formation under high RH condition as SA formation mainly added mass to already CCN-active particles .
During low RH events, weaker increases of both NCCN (0.05 %) and PM2.5 SA mass concentration from 08:00 to 14:00 LT were found (Fig. 4(2a)). At the same time, PA mass decreased by 50 %, and the variation of total NR mass was small. Under low RH conditions, SA formation mainly contributed to mass enhancements of smaller particle sizes (Kuang et al., 2020c). Vconc increased mostly in the range of 150 to 300 nm (Fig. 4(2b)), while Nconc only increased within 300 nm (Fig. 4(2d)), suggesting that PM2.5 SA mainly formed in the particle size range below 300 nm. SA formation mainly enhanced the number fraction of CCN-active particles in the particle size range of 200 to 300 nm, as SPAR only revealed evident enhancement (Fig. 4(2e)) and NCCN only significantly increased (Fig. 4(2c)) in that size range. As a result, although NCCN (> 300 nm) SA decreased similar to that under high RH conditions, NCCN (< 300 nm) SA and NCCN (> 300 nm) NR generally stayed constant, and NCCN (< 300 nm) NR even increased during SA formation in daytime (Fig. 4(2f)). The ratio between bulk NCCN and mass concentration of NR-PM2.5 became larger due to the SA formation, suggesting stronger enhancement of NCCN (0.05 %) in SA formation under low RH conditions because SA formation mainly added mass to CCN-inactive particles and turned them into CCN-active particles.
In summary, during the campaign in this study, two kinds of SA formation events were observed under different RH conditions with different variations of PM and NCCN at SSs lower than 0.07 %. Under high RH conditions, there was strong secondary inorganic aerosol (SIA)-dominated SA formation, leading to stronger enhancements of CCN-active particle number fraction and NCCN. Meanwhile, under low RH conditions, there was moderate secondary organic aerosol (SOA)-dominated SA formation, with moderate enhancements of CCN-active particle number fraction and NCCN. However, for a unit amount of SA formation, the increase of NCCN was stronger under low RH conditions and weaker under high RH conditions. This was because SA formation under low RH conditions was more concentrated on particle sizes smaller than 300 nm and added more mass to CCN-inactive particles, turning them into CCN-active particles. In addition, strong and distinct diurnal variations of CCN activity of particles were observed during different SA formation processes, whose effects on NCCN calculation need to be evaluated further.
3.3 The influence of diurnal variation of CCN activity on NCCN prediction
Since PNSD measurements are generally simpler and more common than NCCN measurements, NCCN is usually estimated from real-time PNSD combined with parameterized CCN activity. In former sections, it was already manifested that SA formation under different RH conditions led to distinct variations in PNSD and SPAR at SS of 0.05 % and hence different variations in NCCN. Thus, it is important for the prediction of NCCN to quantify sensitivity towards changes in PNSD and SPAR during SA formation processes under different RH conditions.
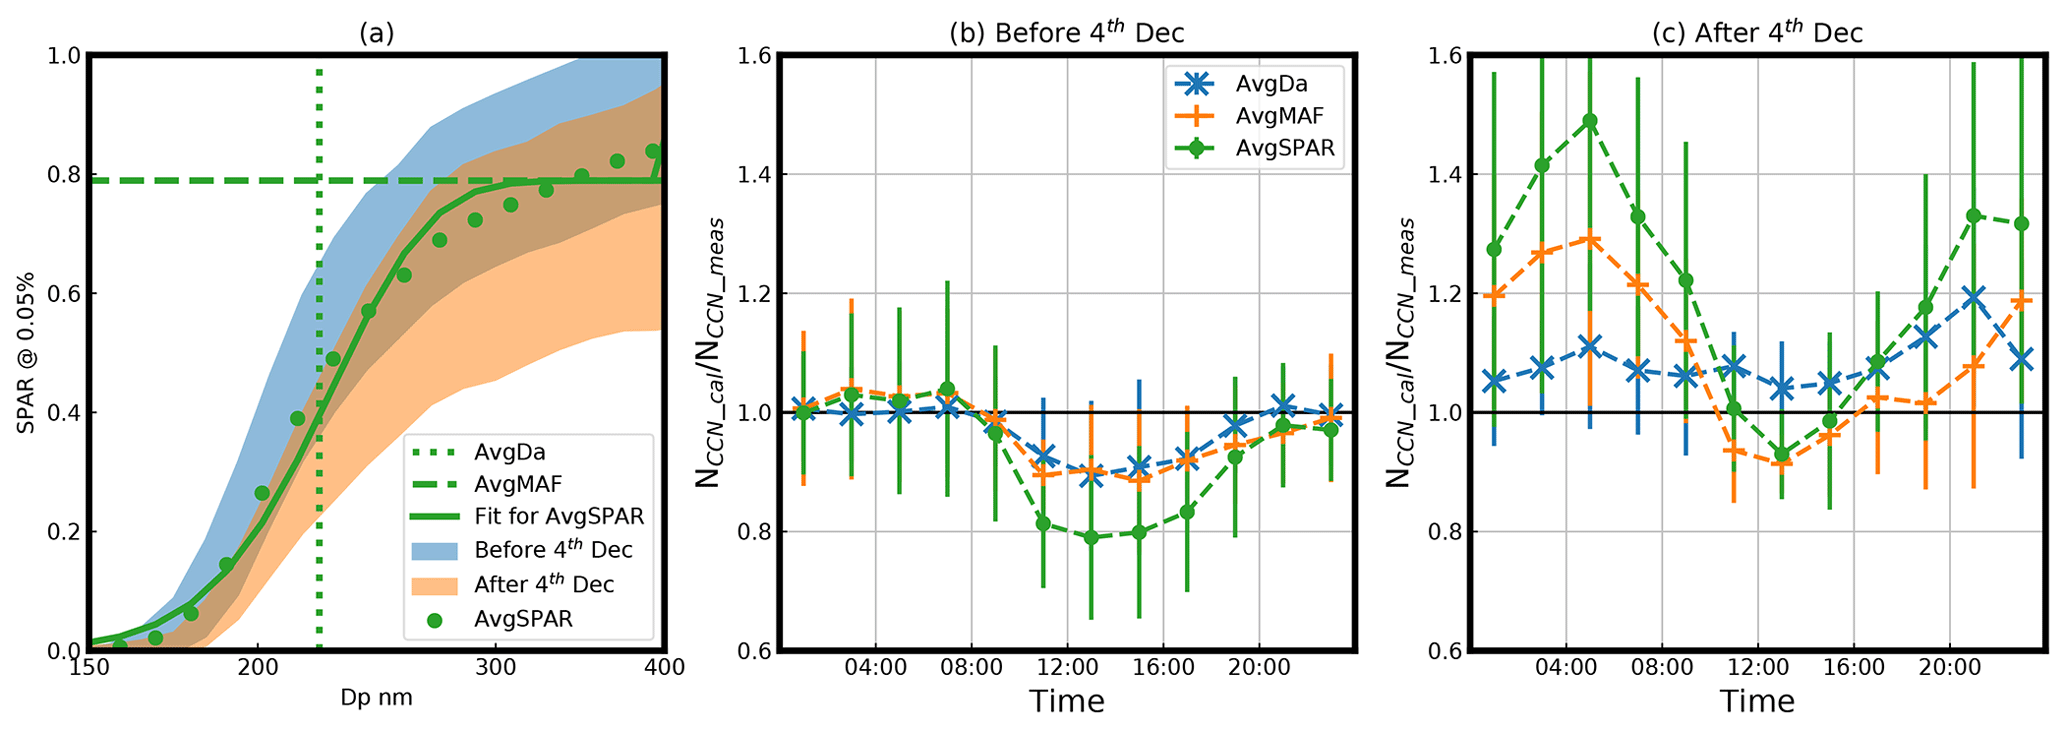
Figure 5(a) The averaged SPAR at SS of 0.05 % during the campaign (green scatters), the corresponding fitting curve (green line) and the averaged fitting parameters (dotted line for Da and dashed line for MAF). The blue and yellow shaded areas represent the variations of SPAR before 4 December and after 4 December, respectively. The ratio between calculated NCCN and measured NCCN (b) before and (c) after 4 December. Bars represent 1 standard deviation, and colors represent different calculation of SPAR curves: green represents average SPAR during the campaign (AvgSPAR), yellow represents SPAR calculated with average Da and real-time MAF (AvgDa) and blue represents SPAR calculated with average MAF and real-time Da (AvgMAF).
In this study, NCCN was mostly determined by PNSD, as was generally the case in former studies (Dusek et al., 2006). During SA formation events, however, the variation of CCN activity also contributed significantly to the deviation of NCCN calculation. In former discussions, CCN activity (indicated by SPAR) at 0.05 % SS revealed significant diurnal variations during this campaign, which were different during SA formation under distinct RH conditions. The ratio of NCCN calculated based on campaign-averaged SPAR (NCCN_cal) to those measured at 0.05 % SS (NCCN_meas) before and after 4 December are shown in Fig. 5. SPAR is determined by the variation of Da and MAF, which reflects changes in the hygroscopicity and number fraction of hygroscopic particles. Thus, to investigate the respective influences of MAF and Da variations on NCCN predictions, NCCN_AvgMAF (or NCCN_avgDa) was calculated based on the real-time PNSD and SPAR estimated by replacing MAF (or Da) in Eq. (7) with the campaign-averaged value. During the high RH stage, underestimation of daytime NCCN_cal can reach up to 20 %, since SPAR variations due to CCN activity enhancement were not considered. Similar deviations of both NCCN_AvgMAF and NCCN_avgDa from NCCN_meas were detected, suggesting that both MAF and Da variations contributed to NCCN_cal underestimation under high RH conditions. During the low RH stage, up to 50 % overestimation existed in NCCN_AvgSPAR outside SA formation time periods. Only NCCN_AvgMAF displayed similar deviations from NCCN_meas as NCCN_AvgSPAR, indicating that differences between NCCN_cal and NCCN_meas were mainly contributed by variations in MAF brought on by significant CCN-active particles number fraction growth due to SA formation. To be noted, NCCN_AvgSPAR before and after 4 December were both calculated based on the SPAR averaged over the entire campaign (green dots in Fig. 5a), since the applicability of campaign-averaged SPAR in NCCN calculations was confirmed by many former studies in the NCP (Deng et al., 2013; Wang et al., 2013; Ma et al., 2016). During low RH periods, SPAR was generally lower than the campaign-averaged SPAR, and the ratio between the calculated and measured NCCN was systematically higher (lasting for the whole night). In summary, SA formation processes can induce significant deviation to NCCN prediction that varied with RH conditions and mainly resulted from the variation in MAF. Thus, for accurate NCCN estimations, considering the variation of MAF (changes in the fraction of the hygroscopic particles) is highly essential.
As SOA is generally considered to be more hygroscopic than POA (Frosch et al., 2011; Lambe et al., 2011; Kuang et al., 2020a), the increase of hygroscopic particles or SA particles (both SIA and SOA) were considered to be the cause for the increase of SPAR within the 200 to 300 nm size range (Fig. 2). In order to account for the variations of hygroscopic particles or SA particles in NCCN calculation, in the following part, the number fraction of hygroscopic particles (GF(90 %, 200 nm)> 1.22, NFhygro) measured by HTDMA and the mass fraction of SA particles (MFSA) measured by ACSM in this campaign were used to represent MAF variations and to provide calculation of NCCN at SS of 0.05 % with smaller deviations combined with PNSD measurement. It should be noted that in order to highlight the application of using MFSA as an estimation of MAF variations in NCCN calculation, the campaign-averaged Da from SPAR curves was used.
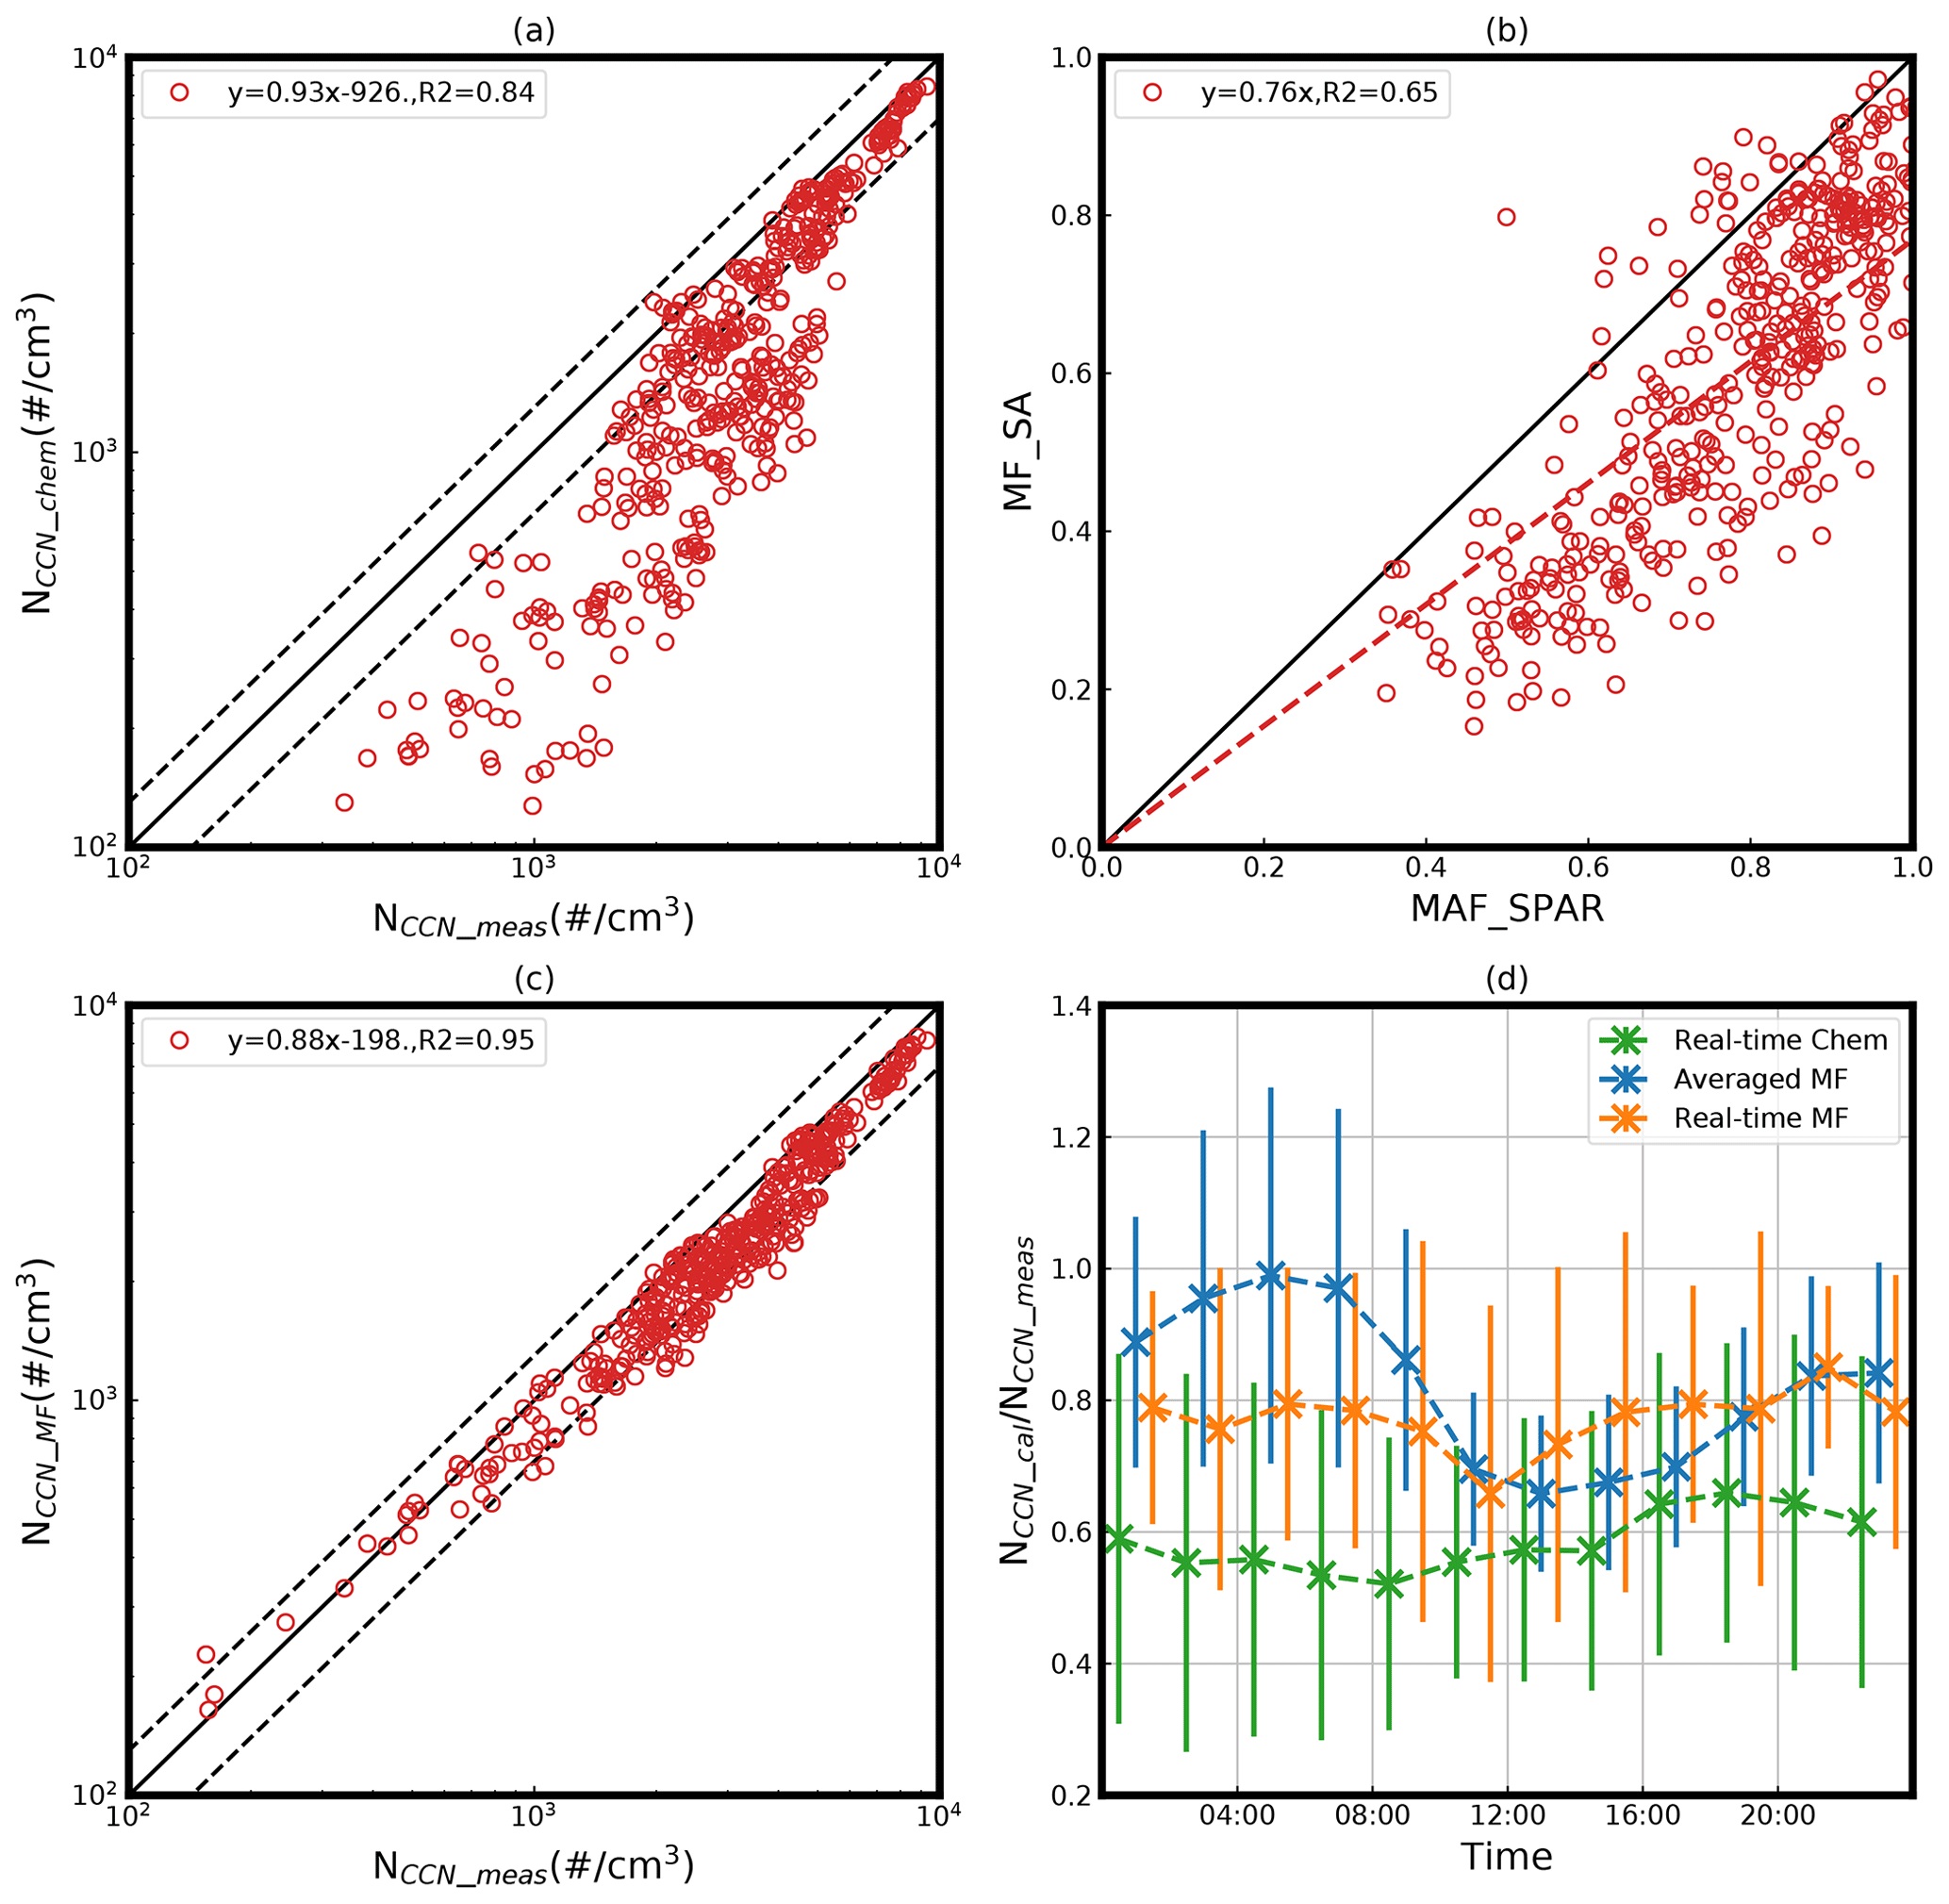
Figure 6(a) The comparison between calculated NCCN based on κ derived from bulk particle chemical compositions (NCCN_chem) and measured NCCN at SS of 0.05 %. (b) The correlation between MAF and mass fraction of secondary aerosol (MFSA). (c) The comparison between calculated NCCN based on SPAR derived from real-time MFSA and average Da (NCCN_MF) and measured NCCN. The dashed black lines represent the relative deviation of 30 %. (d) The diurnal variations of the ratio between the calculated and measured NCCN during the whole campaign based on different methods (green: NCCN_chem; blue: NCCN calculated based on SPAR derived from averaged MFSA and average Da; yellow: NCCN_MF).
Based on the bulk hygroscopicity derived from particle chemical compositions measurements (κchem), a critical diameter for CCN activation can be calculated based on κ-Köhler theory. With this critical diameter, NCCN (0.05 %) can be predicted incorporating measured PNSD (NCCN_Chem). The κ value of accumulation-mode particles derived from chemical composition of the bulk aerosol might bear significant uncertainties, which leads to significant deviations of NCCN prediction. However, in practice, chemical composition measurements specifically for accumulation-mode particles are not common; thus bulk aerosol chemical compositions are commonly applied in CCN studies as substitute (Zhang et al., 2014, 2016; Che et al., 2017; Cai et al., 2018), especially when particle hygroscopicity measurements are lacking. As can be seen in Fig. 6a, NCCN_meas at 0.05 % SS was strongly underestimated by NCCN_Chem, especially at lower NCCN_meas (∼ 102 cm−3), which is similar to the results of studies that encountered high fractions of organics (Chang et al., 2010; Kawana et al., 2016). This deviation between NCCN_meas and NCCN_Chem may have resulted from the hypothesis of internal mixing state and the difference of particle hygroscopicity derived by particle chemical composition measurements and CCN activity. Figure 6b depicts the correlation between mass fraction of SA (MFSA) and MAF at 0.05 % SS. MFSA was generally positively correlated to MAF (r=0.8) with slight underestimations, suggesting externally mixed SA-dominated CCN-active particles. Thus, in the prediction of NCCN, real-time SPAR can be calculated from campaign-averaged Da and MAF assumed to be equal to real-time MFSA (NCCN_MF). As displayed in Fig. 6c, the underestimation and correlation between NCCN_cal and NCCN_meas were improved after introducing MFSA into NCCN calculation. Additionally, the diurnal variations of the ratio based on different methods of NCCN calculation during the whole campaign are shown in Fig. 6d. By considering real-time MFSA variations, the deviation of calculated NCCN (real-time MF) can be reduced throughout the day, compared to NCCN_Chem (real-time chem). Meanwhile, using an averaged MFSA to estimate SPAR and NCCN could also reduce deviations of calculated NCCN (averaged MF); however, it demonstrated a much stronger diurnal variation than the deviation of NCCN_MF.
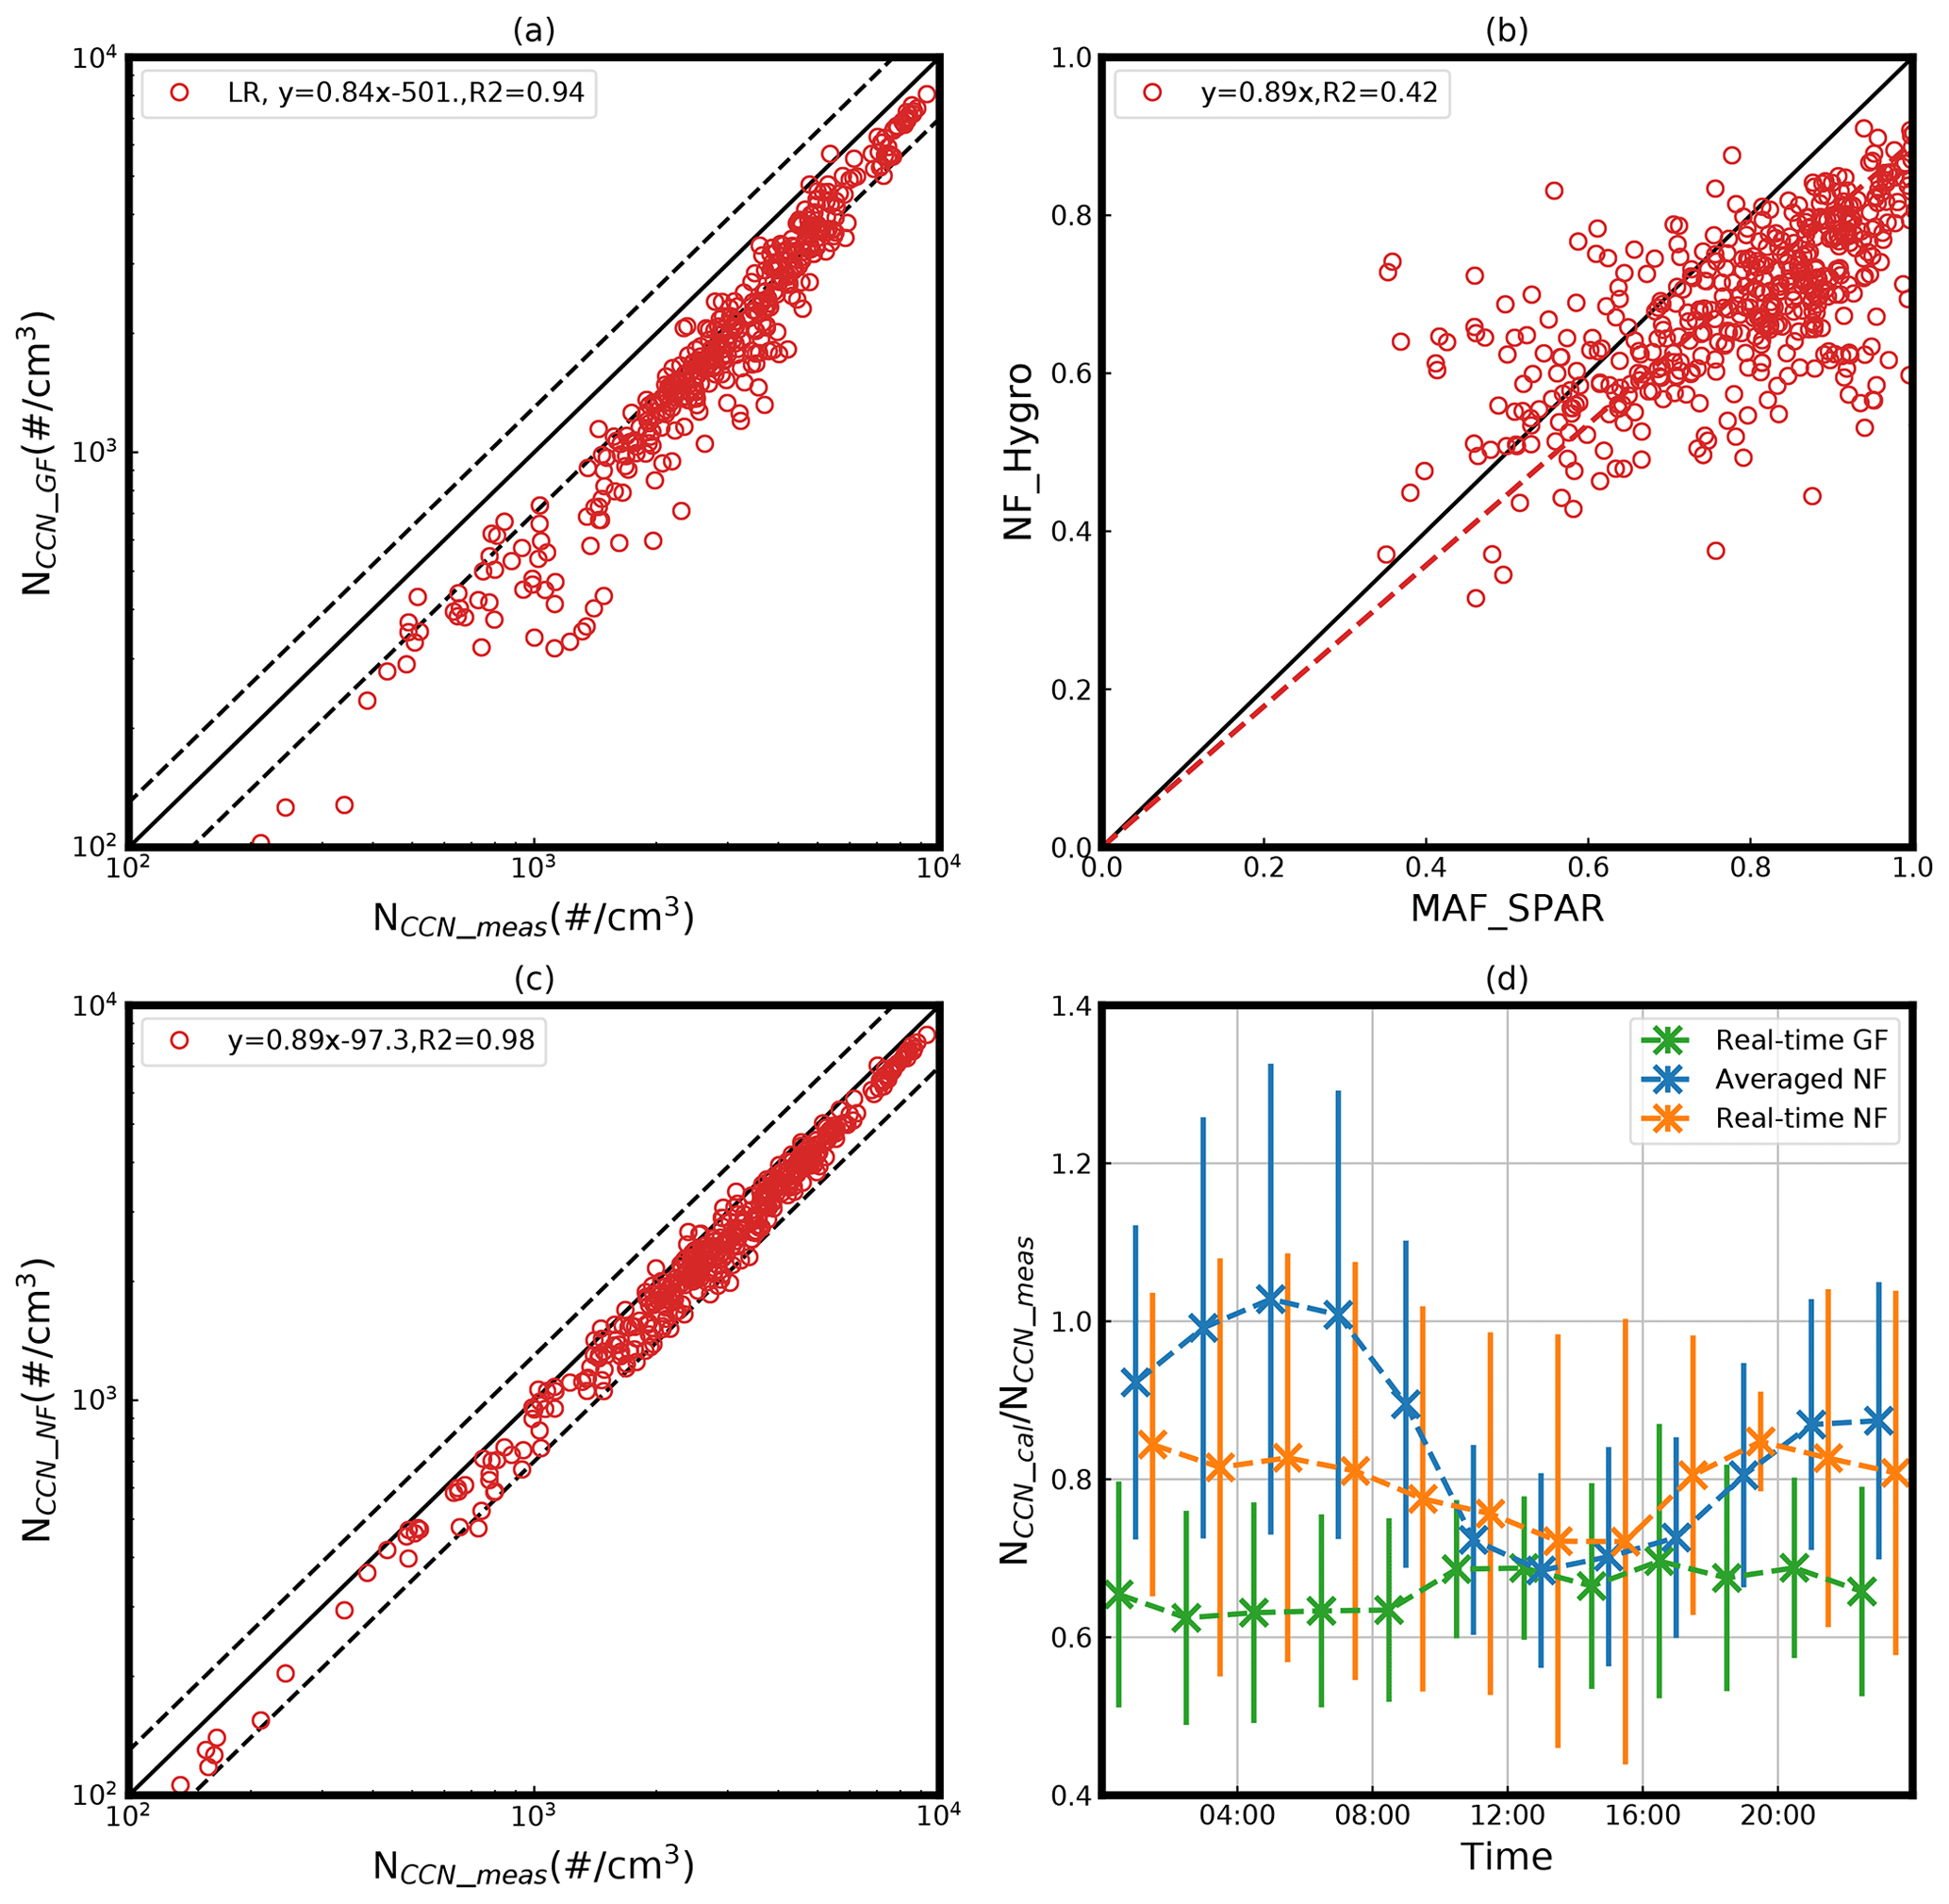
Figure 7(a) The comparison between calculated NCCN based on κ derived from bulk GF at 200 nm (NCCN_GF) and measured NCCN at SS of 0.05 %. (b) The correlation between MAF and number fraction of hygroscopic particles (NFhygro, GF > 1.2). (c) The comparison between calculated NCCN based on SPAR derived from real-time NFhygro and average Da (NCCN_NF) and measured NCCN. The dashed black lines represent the relative deviation of 30 %. (d) The diurnal variations of the ratio between the calculated and measured NCCN during the whole campaign based on different methods (green: NCCN_GF; blue: NCCN based on SPAR derived from averaged NFhygro and average Da; yellow: NCCN_NF).
Based on the bulk hygroscopicity derived from GF measurements (κGF) at 200 nm, Da can be calculated based on the κ-Köhler theory, which can be applied to predict NCCN at 0.05 % SS (NCCN_GF) in combination with measured PNSD. Figure 7a reveals that NCCN_meas was strongly underestimated by NCCN_GF (by more than 30 %), which might have resulted from the hypothesis of internal mixing state and the difference of particle hygroscopicity derived by GF and particle CCN activity measured under different water vapor saturated conditions. Figure 7b depicts the positive correlation between NFhygro and MAF at 0.05 % SS, which was weaker than that between MFSA and MAF. Similarly to before, NFhygro was applied as a proxy for MAF in the NCCN calculation, which also improved the underestimation and correlation between NCCN_cal and NCCN_meas (Fig. 7c). Also, the campaign-averaged Da in Fig. 5a was used to calculate SPAR curves and NCCN. The diurnal variations of the ratio based on different methods of NCCN calculation during the whole campaign are shown in Fig. 7d. By considering the real-time variation of NFhygro, the deviation of NCCN_NF (real-time NF) was mainly reduced during nighttime compared to NCCN_GF (real-time GF). Meanwhile, applying an averaged NFhygro to estimate SPAR and NCCN reduced the deviations of calculated NCCN (averaged NF) during nighttime as well, but its deviations demonstrated stronger diurnal variations than those of NCCN_NF. If GF-PDF were directly used to calculate NCCN, NCCN_cal would agree well with measured NCCN (Fig. S4) because in this way the mixing state of aerosol would have been accounted for. However, compared to the approach using GF-PDF, NFhygro is easier to apply in NCCN calculation and can yield similar accuracies.
In summary, MAF exhibited strong diurnal variation that varied under different RH conditions due to different SA formation mechanisms, which contributed most to NCCN estimation deviations if unaccounted for. The diurnal variations of MAF at the five measured SSs (Fig. S5) revealed significant diurnal variations at low SSs (0.05 % and 0.07 %) that were dependent on RH conditions, while only small diurnal variations that were insensitive to the RH conditions were detected at SSs above 0.2 %. In general, MAF became lower at lower SSs, especially during nighttime. As the fraction of CCN-active particles was generally hygroscopic and composed of secondary compounds, positive correlation was found between MAF, MFSA and NFhygro. Although a good prediction of NCCN (0.05 %) was achieved by applying an averaged MAF (Figs. 5, 6d and 7d), in practice, this would still require CCN measurements or HTDMA/chemical composition measurements as proxies. Additionally, deviations of NCCN_cal based on the averaged MAF can be large under low RH conditions (Fig. 5c), while time-dependent MAF can eliminate a great part of these deviations. Thus, by replacing MAF with real-time MFSA or NFhygro when deriving SPAR curves, the relative deviation of NCCN (0.05 %) calculation can be reduced. The proposed NCCN parameterization using MFSA can also be easily adopted by chemical-transport and climate models, improving their representation of NCCN changes due to distinct SA formation processes.
SA formation drives the development of haze pollution in the NCP and can result in significant variations of PNSD and aerosol hygroscopicity. Studies in the NCP have shown that the mechanism of SA formation can be affected by relative humidity (RH) and thus has different influences on the aerosol hygroscopicity and PNSD under distinct RH conditions. The difference in particle size where SA formation is taking place and the different chemical compositions of formed SA can result in different variations of CCN activity. Thus, it is essential to study the influence of SA formation on the CCN activity of existing accumulation-mode particles under different RH conditions in the NCP. As NCCN is often predicted based on real-time PNSD and parameterized SPAR, the influence of varying SPAR in distinct SA formation processes on NCCN calculation needs to be evaluated in detail.
Based on the measurements of CCN activity, particle hygroscopicity, particle chemical composition and PNSD during the McFAN campaign in Gucheng in winter 2018, the influences of SA formation on CCN activity and NCCN calculation under different RH conditions were investigated, especially at SSs lower than 0.07 %. Two kinds of SA formation events were identified under different RH conditions, with distinct variations in PM and NCCN at 0.05 % SS. Under high RH conditions, which correspond to the periods with minimum RH higher than 50 % in daytime, strong SA formation and NCCN (0.05 %) enhancements with strong hygroscopic particles and SIA-dominated contribution to SA (> 70 %) were found, while under low RH conditions, which correspond to the periods with daytime minimum RH below 30 %, moderate SA formation and NCCN (0.05 %) enhancements with moderately hygroscopic particles and SOA dominated contribution to SA were found. However, the increase of NCCN under the same amount of SA formation was stronger under low RH conditions and weaker under high RH conditions. This was because the formation of SA under low RH conditions was more concentrated in the particle size range smaller than 300 nm and added more mass to CCN-inactive particles, turning them into CCN-active ones after SA formation.
In addition, strong diurnal variations of the CCN activity of particles at 0.05 % SS due to the strong SA formation were also observed, both varying with RH conditions. NCCN (0.05 %) was significantly underestimated when MAF (SPAR parameter) variations were not considered. As the fraction of CCN-active particles was generally hygroscopic and composed of secondary compounds, there was good correlation among MAF inferred from measurements of CCN activity, particle hygroscopicity and particle chemical compositions. Thus, the relative deviation of NCCN (0.05 %) estimation can be reduced by applying measurements of particle hygroscopicity or particle chemical compositions as a proxy for aerosol mixing state.
This study can further the understanding of the impact of SA formation on CCN activity and NCCN calculation, specifically for SA formation on existing particles, which can strongly affect cloud microphysics properties in stratus clouds and fogs. The investigation of the influence of SA formation on the CCN activity of existing particles in this study is important for improving NCCN parameterizations in chemical-transport and climate models, so that they can account for the large variations induced by SA formation processes.
The data used in this study are available from https://doi.org/10.5281/zenodo.4706227 (Tao and Ma, 2021).
The supplement related to this article is available online at: https://doi.org/10.5194/acp-21-7409-2021-supplement.
JT, YK and NM designed this research. JT performed the data analysis and wrote the manuscript. YC, HS, NM, YK, JT and JH planned this campaign. JT and YZ conducted the CCN measurements. YS and YH conducted the ACSM measurements and the ACSM PMF analysis. JH and QL conducted the HTDMA measurements. LX and YZ conducted the particle number size distribution measurements. WX conducted the measurements of CO and meteorological parameters. YC, HS, YS, YK and NM contributed to the revisions of this manuscript, and all other coauthors have contributed to this paper in different ways.
The authors declare that they have no conflict of interest.
We acknowledge the National Key Research and Development Program of China (grant no. 2017YFC0210104), the National Natural Science Foundation of China (grant nos. 91644218 and 41805110), the Guangdong Innovative and Entrepreneurial Research Team Program (Research team on atmospheric environmental roles and effects of carbonaceous species: 2016ZT06N263), the Special Fund Project for Science and Technology Innovation Strategy of Guangdong Province (2019B121205004) and the Basic Research Fund of CAMS (2020Z002).
This research has been supported by the Ministry of Science and Technology of the People's Republic of China (grant no. 2017YFC0210104), the National Natural Science Foundation of China (grant nos. 91644218 and 41805110), the Guangdong Innovative and Entrepreneurial Research Team Program (Research team on atmospheric environmental roles and effects of carbonaceous species, grant no. 2016ZT06N263), the Special Fund Project for Science and Technology Innovation Strategy of Guangdong Province (grant no. 2019B121205004), and the Basic Research Fund of CAMS (grant no. 2020Z002).
This paper was edited by Markus Petters and reviewed by two anonymous referees.
Cai, M., Tan, H., Chan, C. K., Qin, Y., Xu, H., Li, F., Schurman, M. I., Liu, L., and Zhao, J.: The size-resolved cloud condensation nuclei (CCN) activity and its prediction based on aerosol hygroscopicity and composition in the Pearl Delta River (PRD) region during wintertime 2014, Atmos. Chem. Phys., 18, 16419–16437, https://doi.org/10.5194/acp-18-16419-2018, 2018.
Chang, R. Y.-W., Slowik, J. G., Shantz, N. C., Vlasenko, A., Liggio, J., Sjostedt, S. J., Leaitch, W. R., and Abbatt, J. P. D.: The hygroscopicity parameter (κ) of ambient organic aerosol at a field site subject to biogenic and anthropogenic influences: relationship to degree of aerosol oxidation, Atmos. Chem. Phys., 10, 5047–5064, https://doi.org/10.5194/acp-10-5047-2010, 2010.
Che, H., Zhang, X., Zhang, L., Wang, Y., Zhang, Y., Shen, X., Ma, Q., Sun, J., and Zhong, J.: Prediction of size-resolved number concentration of cloud condensation nuclei and long-term measurements of their activation characteristics, Sci. Rep., 7, 1–12, 2017.
Cheng, Y. F., Su, H., Rose, D., Gunthe, S. S., Berghof, M., Wehner, B., Achtert, P., Nowak, A., Takegawa, N., Kondo, Y., Shiraiwa, M., Gong, Y. G., Shao, M., Hu, M., Zhu, T., Zhang, Y. H., Carmichael, G. R., Wiedensohler, A., Andreae, M. O., and Pöschl, U.: Size-resolved measurement of the mixing state of soot in the megacity Beijing, China: diurnal cycle, aging and parameterization, Atmos. Chem. Phys., 12, 4477–4491, https://doi.org/10.5194/acp-12-4477-2012, 2012.
Cheng, Y. F., Zheng, G., Wei, C., Mu, Q., Zheng, B., Wang, Z., Gao, M., Zhang, Q., He, K., and Carmichael, G.: Reactive nitrogen chemistry in aerosol water as a source of sulfate during haze events in China, Sci. Adv., 2, e1601530, https://doi.org/10.1126/sciadv.1601530, 2016.
Dal Maso, M., Kulmala, M., Riipinen, I., Wagner, R., Hussein, T., Aalto, P. P., and Lehtinen, K. E. J.: Formation and growth of fresh atmospheric aerosols: eight years of aerosol size distribution data from SMEAR II, Hyytiala, Finland, Boreal Environ. Res., 10, 323–336, 2005.
Deng, Z. Z., Zhao, C. S., Ma, N., Liu, P. F., Ran, L., Xu, W. Y., Chen, J., Liang, Z., Liang, S., Huang, M. Y., Ma, X. C., Zhang, Q., Quan, J. N., Yan, P., Henning, S., Mildenberger, K., Sommerhage, E., Schäfer, M., Stratmann, F., and Wiedensohler, A.: Size-resolved and bulk activation properties of aerosols in the North China Plain, Atmos. Chem. Phys., 11, 3835–3846, https://doi.org/10.5194/acp-11-3835-2011, 2011.
Deng, Z. Z., Zhao, C. S., Ma, N., Ran, L., Zhou, G. Q., Lu, D. R., and Zhou, X. J.: An examination of parameterizations for the CCN number concentration based on in situ measurements of aerosol activation properties in the North China Plain, Atmos. Chem. Phys., 13, 6227–6237, https://doi.org/10.5194/acp-13-6227-2013, 2013.
Ditas, F., Shaw, R. A., Siebert, H., Simmel, M., Wehner, B., and Wiedensohler, A.: Aerosols-cloud microphysics-thermodynamics-turbulence: evaluating supersaturation in a marine stratocumulus cloud, Atmos. Chem. Phys., 12, 2459–2468, https://doi.org/10.5194/acp-12-2459-2012, 2012.
Duan, J., Wang, Y., Xie, X., Li, M., Tao, J., Wu, Y., Cheng, T., Zhang, R., Liu, Y., Li, X., He, Q., Gao, W., and Wang, J.: Influence of pollutants on activity of aerosol cloud condensation nuclei (CCN) during pollution and post-rain periods in Guangzhou, southern China, Sci. Total Environ., 642, 1008–1019, https://doi.org/10.1016/j.scitotenv.2018.06.053, 2018.
Dusek, U., Frank, G., Hildebrandt, L., Curtius, J., Schneider, J., Walter, S., Chand, D., Drewnick, F., Hings, S., and Jung, D.: Size matters more than chemistry for cloud-nucleating ability of aerosol particles, Science, 312, 1375–1378, 2006.
Fan, J., Wang, Y., Rosenfeld, D., and Liu, X.: Review of Aerosol–Cloud Interactions: Mechanisms, Significance, and Challenges, J. Atmos. Sci., 73, 4221–4252, https://doi.org/10.1175/JAS-D-16-0037.1, 2016.
Farmer, D. K., Cappa, C. D., and Kreidenweis, S. M.: Atmospheric Processes and Their Controlling Influence on Cloud Condensation Nuclei Activity, Chem. Rev., 115, 4199–4217, https://doi.org/10.1021/cr5006292, 2015.
Frosch, M., Bilde, M., DeCarlo, P., Jurányi, Z., Tritscher, T., Dommen, J., Donahue, N., Gysel, M., Weingartner, E., and Baltensperger, U.: Relating cloud condensation nuclei activity and oxidation level of α-pinene secondary organic aerosols, J. Geophys. Res.-Atmos., 116, D22212, https://doi.org/10.1029/2011JD016401, 2011.
Gordon, H., Sengupta, K., Rap, A., Duplissy, J., Frege, C., Williamson, C., Heinritzi, M., Simon, M., Yan, C., Almeida, J., Trostl, J., Nieminen, T., Ortega, I. K., Wagner, R., Dunne, E. M., Adamov, A., Amorim, A., Bernhammer, A.-K., Bianchi, F., Breitenlechner, M., Brilke, S., Chen, X., Craven, J. S., Dias, A., Ehrhart, S., Fischer, L., Flagan, R. C., Franchin, A., Fuchs, C., Guida, R., Hakala, J., Hoyle, C. R., Jokinen, T., Junninen, H., Kangasluoma, J., Kim, J., Kirkby, J., Krapf, M., Kuerten, A., Laaksonen, A., Lehtipalo, K., Makhmutov, V., Mathot, S., Molteni, U., Monks, S. A., Onnela, A., Perakyla, O., Piel, F., Petaja, T., Praplan, A. P., Pringle, K. J., Richards, N. A. D., Rissanen, M. P., Rondo, L., Sarnela, N., Schobesberger, S., Scott, C. E., Seinfeldo, J. H., Sharma, S., Sipila, M., Steiner, G., Stozhkov, Y., Stratmann, F., Tome, A., Virtanen, A., Vogel, A. L., Wagner, A. C., Wagner, P. E., Weingartner, E., Wimmer, D., Winkler, P. M., Ye, P., Zhang, X., Hansel, A., Dommen, J., Donahue, N. M., Worsnop, D. R., Baltensperger, U., Kulmala, M., Curtius, J., and Carslaw, K. S.: Reduced anthropogenic aerosol radiative forcing caused by biogenic new particle formation, P. Natl. Acad. Sci. USA, 113, 12053–12058, https://doi.org/10.1073/pnas.1602360113, 2016.
Gryspeerdt, E. and Stier, P.: Regime-based analysis of aerosol-cloud interactions, Geophys. Res. Lett., 39, L21802, https://doi.org/10.1029/2012GL053221, 2012.
Gysel, M., Crosier, J., Topping, D. O., Whitehead, J. D., Bower, K. N., Cubison, M. J., Williams, P. I., Flynn, M. J., McFiggans, G. B., and Coe, H.: Closure study between chemical composition and hygroscopic growth of aerosol particles during TORCH2, Atmos. Chem. Phys., 7, 6131–6144, https://doi.org/10.5194/acp-7-6131-2007, 2007.
Gysel, M., McFiggans, G. B., and Coe, H.: Inversion of tandem differential mobility analyser (TDMA) measurements, J. Aerosol Sci., 40, 134–151, https://doi.org/10.1016/j.jaerosci.2008.07.013, 2009.
Hagen, D. E. and Alofs, D. J.: Linear Inversion Method to Obtain Aerosol Size Distributions from Measurements with a Differential Mobility Analyzer, Aerosol Sci. Tech., 2, 465–475, https://doi.org/10.1080/02786828308958650, 1983.
Hammer, E., Bukowiecki, N., Gysel, M., Jurányi, Z., Hoyle, C. R., Vogt, R., Baltensperger, U., and Weingartner, E.: Investigation of the effective peak supersaturation for liquid-phase clouds at the high-alpine site Jungfraujoch, Switzerland (3580 m a.s.l.), Atmos. Chem. Phys., 14, 1123–1139, https://doi.org/10.5194/acp-14-1123-2014, 2014a.
Hammer, E., Gysel, M., Roberts, G. C., Elias, T., Hofer, J., Hoyle, C. R., Bukowiecki, N., Dupont, J.-C., Burnet, F., Baltensperger, U., and Weingartner, E.: Size-dependent particle activation properties in fog during the ParisFog 2012/13 field campaign, Atmos. Chem. Phys., 14, 10517–10533, https://doi.org/10.5194/acp-14-10517-2014, 2014b.
Hong, J., Xu, H., Tan, H., Yin, C., Hao, L., Li, F., Cai, M., Deng, X., Wang, N., Su, H., Cheng, Y., Wang, L., Petäjä, T., and Kerminen, V.-M.: Mixing state and particle hygroscopicity of organic-dominated aerosols over the Pearl River Delta region in China, Atmos. Chem. Phys., 18, 14079–14094, https://doi.org/10.5194/acp-18-14079-2018, 2018.
Hu, M., Peng, J., Sun, K., Yue, D., Guo, S., Wiedensohler, A., and Wu, Z.: Estimation of Size-Resolved Ambient Particle Density Based on the Measurement of Aerosol Number, Mass, and Chemical Size Distributions in the Winter in Beijing, Environ. Sci. Technol., 46, 9941–9947, https://doi.org/10.1021/es204073t, 2012.
Hu, W., Hu, M., Hu, W., Jimenez, J. L., Yuan, B., Chen, W., Wang, M., Wu, Y., Chen, C., Wang, Z., Peng, J., Zeng, L., and Shao, M.: Chemical composition, sources, and aging process of submicron aerosols in Beijing: Contrast between summer and winter, J. Geophys. Res.-Atmos., 121, 1955–1977, https://doi.org/10.1002/2015JD024020, 2016.
Hu, W., Campuzano-Jost, P., Day, D. A., Croteau, P., Canagaratna, M. R., Jayne, J. T., Worsnop, D. R., and Jimenez, J. L.: Evaluation of the new capture vapourizer for aerosol mass spectrometers (AMS) through laboratory studies of inorganic species, Atmos. Meas. Tech., 10, 2897–2921, https://doi.org/10.5194/amt-10-2897-2017, 2017a.
Hu, W., Hu, M., Hu, W.-W., Zheng, J., Chen, C., Wu, Y., and Guo, S.: Seasonal variations in high time-resolved chemical compositions, sources, and evolution of atmospheric submicron aerosols in the megacity Beijing, Atmos. Chem. Phys., 17, 9979–10000, https://doi.org/10.5194/acp-17-9979-2017, 2017b.
Huang, R.-J., Zhang, Y., Bozzetti, C., Ho, K.-F., Cao, J.-J., Han, Y., Daellenbach, K. R., Slowik, J. G., Platt, S. M., Canonaco, F., Zotter, P., Wolf, R., Pieber, S. M., Bruns, E. A., Crippa, M., Ciarelli, G., Piazzalunga, A., Schwikowski, M., Abbaszade, G., Schnelle-Kreis, J., Zimmermann, R., An, Z., Szidat, S., Baltensperger, U., Haddad, I. E., and Prévôt, A. S. H.: High secondary aerosol contribution to particulate pollution during haze events in China, Nature, 514, 218–222, https://doi.org/10.1038/nature13774, 2014.
Jia, H., Ma, X., Yu, F., Liu, Y., and Yin, Y.: Distinct Impacts of Increased Aerosols on Cloud Droplet Number Concentration of Stratus/Stratocumulus and Cumulus, Geophys. Res. Lett., 46, 13517–13525, https://doi.org/10.1029/2019GL085081, 2019.
Jiang, X., Tao, J., Kuang, Y., Hong, J., and Ma, N.: Mathematical derivation and physical interpretation of particle size-resolved activation ratio based on particle hygroscopicity distribution: Application on global characterization of CCN activity, Atmos. Environ., 246, 118137, https://doi.org/10.1016/j.atmosenv.2020.118137, 2021.
Kawana, K., Nakayama, T., and Mochida, M.: Hygroscopicity and CCN activity of atmospheric aerosol particles and their relation to organics: Characteristics of urban aerosols in Nagoya, Japan, J. Geophys. Res.-Atmos., 121, 4100–4121, https://doi.org/10.1002/2015jd023213, 2016.
Kerminen, V.-M., Paramonov, M., Anttila, T., Riipinen, I., Fountoukis, C., Korhonen, H., Asmi, E., Laakso, L., Lihavainen, H., Swietlicki, E., Svenningsson, B., Asmi, A., Pandis, S. N., Kulmala, M., and Petäjä, T.: Cloud condensation nuclei production associated with atmospheric nucleation: a synthesis based on existing literature and new results, Atmos. Chem. Phys., 12, 12037–12059, https://doi.org/10.5194/acp-12-12037-2012, 2012.
Köhler, H.: The nucleus in and the growth of hygroscopic droplets, T. Faraday Soc., 32, 1152–1161, 1936.
Krüger, M. L., Mertes, S., Klimach, T., Cheng, Y. F., Su, H., Schneider, J., Andreae, M. O., Pöschl, U., and Rose, D.: Assessment of cloud supersaturation by size-resolved aerosol particle and cloud condensation nuclei (CCN) measurements, Atmos. Meas. Tech., 7, 2615–2629, https://doi.org/10.5194/amt-7-2615-2014, 2014.
Kuang, Y., Xu, W., Tao, J., Ma, N., Zhao, C., and Shao, M.: A Review on Laboratory Studies and Field Measurements of Atmospheric Organic Aerosol Hygroscopicity and Its Parameterization Based on Oxidation Levels, Current Pollution Reports, 6, 410–424, 2020a.
Kuang, Y., He, Y., Xu, W., Zhao, P., Cheng, Y., Zhao, G., Tao, J., Ma, N., Su, H., Zhang, Y., Sun, J., Cheng, P., Yang, W., Zhang, S., Wu, C., Sun, Y., and Zhao, C.: Distinct diurnal variation in organic aerosol hygroscopicity and its relationship with oxygenated organic aerosol, Atmos. Chem. Phys., 20, 865–880, https://doi.org/10.5194/acp-20-865-2020, 2020b.
Kuang, Y., He, Y., Xu, W., Yuan, B., Zhang, G., Ma, Z., Wu, C., Wang, C., Wang, S., Zhang, S., Tao, J., Ma, N., Su, H., Cheng, Y., Shao, M., and Sun, Y.: Photochemical Aqueous-Phase Reactions Induce Rapid Daytime Formation of Oxygenated Organic Aerosol on the North China Plain, Environ. Sci. Technol., 54, 3849–3860, https://doi.org/10.1021/acs.est.9b06836, 2020c.
Kulmala, M., Riipinen, I., Sipila, M., Manninen, H. E., Petaja, T., Junninen, H., Dal Maso, M., Mordas, G., Mirme, A., Vana, M., Hirsikko, A., Laakso, L., Harrison, R. M., Hanson, I., Leung, C., Lehtinen, K. E. J., and Kerminen, V.-M.: Toward direct measurement of atmospheric nucleation, Science, 318, 89–92, https://doi.org/10.1126/science.1144124, 2007.
Lambe, A. T., Onasch, T. B., Massoli, P., Croasdale, D. R., Wright, J. P., Ahern, A. T., Williams, L. R., Worsnop, D. R., Brune, W. H., and Davidovits, P.: Laboratory studies of the chemical composition and cloud condensation nuclei (CCN) activity of secondary organic aerosol (SOA) and oxidized primary organic aerosol (OPOA), Atmos. Chem. Phys., 11, 8913–8928, https://doi.org/10.5194/acp-11-8913-2011, 2011.
Li, G., Su, H., Ma, N., Tao, J., Kuang, Y., Wang, Q., Hong, J., Zhang, Y., Kuhn, U., and Zhang, S.: Multiphase chemistry experiment in Fogs and Aerosols in the North China Plain (McFAN): integrated analysis and intensive winter campaign 2018, Faraday Discuss., 226, 207–222, https://doi.org/10.1039/d0fd00099j, 2021.
Liu, H. J., Zhao, C. S., Nekat, B., Ma, N., Wiedensohler, A., van Pinxteren, D., Spindler, G., Müller, K., and Herrmann, H.: Aerosol hygroscopicity derived from size-segregated chemical composition and its parameterization in the North China Plain, Atmos. Chem. Phys., 14, 2525–2539, https://doi.org/10.5194/acp-14-2525-2014, 2014.
Liu, P. F., Zhao, C. S., Göbel, T., Hallbauer, E., Nowak, A., Ran, L., Xu, W. Y., Deng, Z. Z., Ma, N., Mildenberger, K., Henning, S., Stratmann, F., and Wiedensohler, A.: Hygroscopic properties of aerosol particles at high relative humidity and their diurnal variations in the North China Plain, Atmos. Chem. Phys., 11, 3479–3494, https://doi.org/10.5194/acp-11-3479-2011, 2011.
Liu, Z., Wang, Y., Gu, D., Zhao, C., Huey, L. G., Stickel, R., Liao, J., Shao, M., Zhu, T., Zeng, L., Liu, S.-C., Chang, C.-C., Amoroso, A., and Costabile, F.: Evidence of Reactive Aromatics As a Major Source of Peroxy Acetyl Nitrate over China, Environ. Sci. Technol., 44, 7017–7022, https://doi.org/10.1021/es1007966, 2010.
Ma, N., Zhao, C., Tao, J., Wu, Z., Kecorius, S., Wang, Z., Größ, J., Liu, H., Bian, Y., Kuang, Y., Teich, M., Spindler, G., Müller, K., van Pinxteren, D., Herrmann, H., Hu, M., and Wiedensohler, A.: Variation of CCN activity during new particle formation events in the North China Plain, Atmos. Chem. Phys., 16, 8593–8607, https://doi.org/10.5194/acp-16-8593-2016, 2016.
Mei, F., Hayes, P. L., Ortega, A., Taylor, J. W., Allan, J. D., Gilman, J., Kuster, W., de Gouw, J., Jimenez, J. L., and Wang, J.: Droplet activation properties of organic aerosols observed at an urban site during CalNex-LA, J. Geophys. Res.-Atmos., 118, 2903–2917, https://doi.org/10.1002/jgrd.50285, 2013.
Petters, M. D. and Kreidenweis, S. M.: A single parameter representation of hygroscopic growth and cloud condensation nucleus activity, Atmos. Chem. Phys., 7, 1961–1971, https://doi.org/10.5194/acp-7-1961-2007, 2007.
Reutter, P., Su, H., Trentmann, J., Simmel, M., Rose, D., Gunthe, S. S., Wernli, H., Andreae, M. O., and Pöschl, U.: Aerosol- and updraft-limited regimes of cloud droplet formation: influence of particle number, size and hygroscopicity on the activation of cloud condensation nuclei (CCN), Atmos. Chem. Phys., 9, 7067–7080, https://doi.org/10.5194/acp-9-7067-2009, 2009.
Roberts, G. C. and Nenes, A.: A continuous-flow streamwise thermal-gradient CCN chamber for atmospheric measurements, Aerosol Sci. Tech., 39, 206–221, 2005.
Rose, D., Gunthe, S. S., Mikhailov, E., Frank, G. P., Dusek, U., Andreae, M. O., and Pöschl, U.: Calibration and measurement uncertainties of a continuous-flow cloud condensation nuclei counter (DMT-CCNC): CCN activation of ammonium sulfate and sodium chloride aerosol particles in theory and experiment, Atmos. Chem. Phys., 8, 1153–1179, https://doi.org/10.5194/acp-8-1153-2008, 2008.
Rose, D., Nowak, A., Achtert, P., Wiedensohler, A., Hu, M., Shao, M., Zhang, Y., Andreae, M. O., and Pöschl, U.: Cloud condensation nuclei in polluted air and biomass burning smoke near the mega-city Guangzhou, China – Part 1: Size-resolved measurements and implications for the modeling of aerosol particle hygroscopicity and CCN activity, Atmos. Chem. Phys., 10, 3365–3383, https://doi.org/10.5194/acp-10-3365-2010, 2010.
Rose, D., Gunthe, S. S., Su, H., Garland, R. M., Yang, H., Berghof, M., Cheng, Y. F., Wehner, B., Achtert, P., Nowak, A., Wiedensohler, A., Takegawa, N., Kondo, Y., Hu, M., Zhang, Y., Andreae, M. O., and Pöschl, U.: Cloud condensation nuclei in polluted air and biomass burning smoke near the mega-city Guangzhou, China – Part 2: Size-resolved aerosol chemical composition, diurnal cycles, and externally mixed weakly CCN-active soot particles, Atmos. Chem. Phys., 11, 2817–2836, https://doi.org/10.5194/acp-11-2817-2011, 2011.
Shen, C., Zhao, C., Ma, N., Tao, J., Zhao, G., Yu, Y., and Kuang, Y.: Method to Estimate Water Vapor Supersaturation in the Ambient Activation Process Using Aerosol and Droplet Measurement Data, J. Geophys. Res.-Atmos., 123, 10606–10619, https://doi.org/10.1029/2018JD028315, 2018.
Su, H., Rose, D., Cheng, Y. F., Gunthe, S. S., Massling, A., Stock, M., Wiedensohler, A., Andreae, M. O., and Pöschl, U.: Hygroscopicity distribution concept for measurement data analysis and modeling of aerosol particle mixing state with regard to hygroscopic growth and CCN activation, Atmos. Chem. Phys., 10, 7489–7503, https://doi.org/10.5194/acp-10-7489-2010, 2010.
Sun, Y., He, Y., Kuang, Y., Xu, W., Song, S., Ma, N., Tao, J., Cheng, P., Wu, C., Su, H., Cheng, Y., Xie, C., Chen, C., Lei, L., Qiu, Y., Fu, P., Croteau, P., and Worsnop, D. R.: Chemical Differences Between PM1 and PM2.5 in Highly Polluted Environment and Implications in Air Pollution Studies, Geophys. Res. Lett., 47, e2019GL086288, https://doi.org/10.1029/2019GL086288, 2020.
Tan, H., Xu, H., Wan, Q., Li, F., Deng, X., Chan, P. W., Xia, D., and Yin, Y.: Design and Application of an Unattended Multifunctional H-TDMA System, J. Atmos. Ocean. Tech., 30, 1136–1148, https://doi.org/10.1175/JTECH-D-12-00129.1, 2013.
Tao, J. and Ma, N.: Data for “Secondary aerosol formation alters CCN activity in the North China Plain”, Zenodo [data set], https://doi.org/10.5281/zenodo.4706227, 2021.
Tao, J., Kuang, Y., Ma, N., Zheng, Y., Wiedensohler, A., and Zhao, C.: An improved parameterization scheme for size-resolved particle activation ratio and its application on comparison study of particle hygroscopicity measurements between HTDMA and DMA-CCNC, Atmos. Environ., 226, 117403, https://doi.org/10.1016/j.atmosenv.2020.117403, 2020.
Thalman, R., de Sá, S. S., Palm, B. B., Barbosa, H. M. J., Pöhlker, M. L., Alexander, M. L., Brito, J., Carbone, S., Castillo, P., Day, D. A., Kuang, C., Manzi, A., Ng, N. L., Sedlacek III, A. J., Souza, R., Springston, S., Watson, T., Pöhlker, C., Pöschl, U., Andreae, M. O., Artaxo, P., Jimenez, J. L., Martin, S. T., and Wang, J.: CCN activity and organic hygroscopicity of aerosols downwind of an urban region in central Amazonia: seasonal and diel variations and impact of anthropogenic emissions, Atmos. Chem. Phys., 17, 11779–11801, https://doi.org/10.5194/acp-17-11779-2017, 2017.
Wang, Y., Chen, J., Wang, Q., Qin, Q., Ye, J., Han, Y., Li, L., Zhen, W., Zhi, Q., Zhang, Y., and Cao, J.: Increased secondary aerosol contribution and possible processing on polluted winter days in China, Environ. Int., 127, 78–84, https://doi.org/10.1016/j.envint.2019.03.021, 2019.
Wang, Z., Cheng, Y., Ma, N., Mikhailov, E., Pöschl, U., and Su, H.: Dependence of the hygroscopicity parameter κ on particle size, humidity and solute concentration: implications for laboratory experiments, field measurements and model studies, Atmos. Chem. Phys. Discuss. [preprint], https://doi.org/10.5194/acp-2017-253, in review, 2017.
Wang, Z. B., Hu, M., Sun, J. Y., Wu, Z. J., Yue, D. L., Shen, X. J., Zhang, Y. M., Pei, X. Y., Cheng, Y. F., and Wiedensohler, A.: Characteristics of regional new particle formation in urban and regional background environments in the North China Plain, Atmos. Chem. Phys., 13, 12495–12506, https://doi.org/10.5194/acp-13-12495-2013, 2013.
Wiedensohler, A., Cheng, Y. F., Nowak, A., Wehner, B., Achtert, P., Berghof, M., Birmili, W., Wu, Z. J., Hu, M., Zhu, T., Takegawa, N., Kita, K., Kondo, Y., Lou, S. R., Hofzumahaus, A., Holland, F., Wahner, A., Gunthe, S. S., Rose, D., Su, H., and Poeschl, U.: Rapid aerosol particle growth and increase of cloud condensation nucleus activity by secondary aerosol formation and condensation: A case study for regional air pollution in northeastern China, J. Geophys. Res., 114, D00G08, https://doi.org/10.1029/2008JD010884, 2009.
Williams, B. J., Goldstein, A. H., Kreisberg, N. M., Hering, S. V., Worsnop, D. R., Ulbrich, I. M., Docherty, K. S., and Jimenez, J. L.: Major components of atmospheric organic aerosol in southern California as determined by hourly measurements of source marker compounds, Atmos. Chem. Phys., 10, 11577–11603, https://doi.org/10.5194/acp-10-11577-2010, 2010.
Wu, Z. J., Poulain, L., Birmili, W., Größ, J., Niedermeier, N., Wang, Z. B., Herrmann, H., and Wiedensohler, A.: Some insights into the condensing vapors driving new particle growth to CCN sizes on the basis of hygroscopicity measurements, Atmos. Chem. Phys., 15, 13071–13083, https://doi.org/10.5194/acp-15-13071-2015, 2015.
Wu, Z. J., Zheng, J., Shang, D. J., Du, Z. F., Wu, Y. S., Zeng, L. M., Wiedensohler, A., and Hu, M.: Particle hygroscopicity and its link to chemical composition in the urban atmosphere of Beijing, China, during summertime, Atmos. Chem. Phys., 16, 1123–1138, https://doi.org/10.5194/acp-16-1123-2016, 2016.
Xu, W., Han, T., Du, W., Wang, Q., Chen, C., Zhao, J., Zhang, Y., Li, J., Fu, P., Wang, Z., Worsnop, D. R., and Sun, Y.: Effects of Aqueous-Phase and Photochemical Processing on Secondary Organic Aerosol Formation and Evolution in Beijing, China, Environ. Sci. Technol., 51, 762–770, https://doi.org/10.1021/acs.est.6b04498, 2017a.
Xu, W., Croteau, P., Williams, L., Canagaratna, M., Onasch, T., Cross, E., Zhang, X., Robinson, W., Worsnop, D., and Jayne, J.: Laboratory characterization of an aerosol chemical speciation monitor with PM2.5 measurement capability, Aerosol Sci. Tech., 51, 69–83, https://doi.org/10.1080/02786826.2016.1241859, 2017b.
Xu, W., Sun, Y., Wang, Q., Zhao, J., Wang, J., Ge, X., Xie, C., Zhou, W., Du, W., Li, J., Fu, P., Wang, Z., Worsnop, D. R., and Coe, H.: Changes in Aerosol Chemistry From 2014 to 2016 in Winter in Beijing: Insights From High-Resolution Aerosol Mass Spectrometry, J. Geophys. Res.-Atmos., 124, 1132–1147, https://doi.org/10.1029/2018JD029245, 2019.
Xu, W. Q., Sun, Y. L., Chen, C., Du, W., Han, T. T., Wang, Q. Q., Fu, P. Q., Wang, Z. F., Zhao, X. J., Zhou, L. B., Ji, D. S., Wang, P. C., and Worsnop, D. R.: Aerosol composition, oxidation properties, and sources in Beijing: results from the 2014 Asia-Pacific Economic Cooperation summit study, Atmos. Chem. Phys., 15, 13681–13698, https://doi.org/10.5194/acp-15-13681-2015, 2015.
Yu, F., Luo, G., Nair, A. A., Schwab, J. J., Sherman, J. P., and Zhang, Y.: Wintertime new particle formation and its contribution to cloud condensation nuclei in the Northeastern United States, Atmos. Chem. Phys., 20, 2591–2601, https://doi.org/10.5194/acp-20-2591-2020, 2020.
Yue, D., Zhong, L., Zhang, T., Shen, J., Yuan, L., Ye, S., Zhou, Y., and Zeng, L.: Particle Growth and Variation of Cloud Condensation Nucleus Activity on Polluted Days with New Particle Formation: A Case Study for Regional Air Pollution in the PRD Region, China, Aerosol and Atmospheric Chemistry, 16, 323–335, https://doi.org/10.4209/aaqr.2015.06.0381, 2016.
Zhang, F., Li, Y., Li, Z., Sun, L., Li, R., Zhao, C., Wang, P., Sun, Y., Liu, X., Li, J., Li, P., Ren, G., and Fan, T.: Aerosol hygroscopicity and cloud condensation nuclei activity during the AC3Exp campaign: implications for cloud condensation nuclei parameterization, Atmos. Chem. Phys., 14, 13423–13437, https://doi.org/10.5194/acp-14-13423-2014, 2014.
Zhang, F., Li, Z., Li, Y., Sun, Y., Wang, Z., Li, P., Sun, L., Wang, P., Cribb, M., Zhao, C., Fan, T., Yang, X., and Wang, Q.: Impacts of organic aerosols and its oxidation level on CCN activity from measurement at a suburban site in China, Atmos. Chem. Phys., 16, 5413–5425, https://doi.org/10.5194/acp-16-5413-2016, 2016.
Zhang, F., Ren, J., Fan, T., Chen, L., Xu, W., Sun, Y., Zhang, R., Liu, J., Jiang, S., Jin, X., Wu, H., Li, S., Cribb, M. C., and Li, Z.: Significantly enhanced aerosol CCN activity and number concentrations by nucleation-initiated haze events: a case study in urban Beijing, J. Geophys. Res.-Atmos., 124, 14102–14113, https://doi.org/10.1029/2019JD031457, 2019.
Zhang, Q., Jimenez, J. L., Canagaratna, M. R., Ulbrich, I. M., Ng, N. L., Worsnop, D. R., and Sun, Y.: Understanding atmospheric organic aerosols via factor analysis of aerosol mass spectrometry: a review, Anal. Bioanal. Chem., 401, 3045–3067, https://doi.org/10.1007/s00216-011-5355-y, 2011.
Zhang, R., Khalizov, A., Wang, L., Hu, M., and Xu, W.: Nucleation and Growth of Nanoparticles in the Atmosphere, Chem. Rev., 112, 1957–2011, https://doi.org/10.1021/cr2001756, 2012.
Zhao, G., Tan, T., Zhao, W., Guo, S., Tian, P., and Zhao, C.: A new parameterization scheme for the real part of the ambient urban aerosol refractive index, Atmos. Chem. Phys., 19, 12875–12885, https://doi.org/10.5194/acp-19-12875-2019, 2019.
Zheng, G. J., Duan, F. K., Su, H., Ma, Y. L., Cheng, Y., Zheng, B., Zhang, Q., Huang, T., Kimoto, T., Chang, D., Pöschl, U., Cheng, Y. F., and He, K. B.: Exploring the severe winter haze in Beijing: the impact of synoptic weather, regional transport and heterogeneous reactions, Atmos. Chem. Phys., 15, 2969–2983, https://doi.org/10.5194/acp-15-2969-2015, 2015.