the Creative Commons Attribution 4.0 License.
the Creative Commons Attribution 4.0 License.
 | 17 May 2021
Measurement report: Effects of NOx and seed aerosol on highly oxygenated organic molecules (HOMs) from cyclohexene ozonolysis
Otso Peräkylä
Matthieu Riva
Lauriane Quéléver
Olga Garmash
Matti Rissanen
Cyclohexene (C6H10) is commonly used as a proxy for biogenic monoterpenes, when studying their oxidation mechanisms and secondary organic aerosol (SOA) formation. The ozonolysis of cyclohexene has been shown to be effective at producing highly oxygenated organic molecules (HOMs), a group of molecules known to be important in the formation of SOA. Here, we provide an in-depth look at how the formation and fate of the broad range of observed HOMs changed with perturbations from NOx and seed particles.
HOMs were produced in a chamber from cyclohexene ozonolysis and measured with a chemical ionisation mass spectrometer (CIMS) using nitrate () as reagent ion. As high-resolution CIMS instruments provide mass spectra with numerous ion signals and a wealth of information that can be hard to manage, we employed a primarily statistical approach for the data analysis. To utilise as many individual HOM signals as possible, each compound was assigned a parameter describing the quality of the observed signal. These parameters were then used as weights or to determine the inclusion of a given signal in further analyses.
Under unperturbed ozonolysis conditions, known HOM peaks were observed in the chamber, including C6H8O9 as the largest HOM signal and C12H20O9 as the largest “dimer” product. With the addition of nitric oxide (NO) into the chamber, the spectrum changed considerably, as expected. Dimer product signals decreased overall, but an increase in dimers with nitrate functionalities was seen, as a result of NO3 radical oxidation. The response of monomer signals to NO addition varied, and while nitrate-containing monomers increased, non-nitrate signals either increased or decreased, depending on the individual molecules.
The addition of seed aerosol increased the condensation sink, which markedly decreased the signals of all low-volatility compounds. Larger molecules were seen to have a higher affinity for condensation, but a more detailed analysis showed that the uptake was controlled mainly by the number of oxygen atoms in each molecule. Nitrates required higher mass and higher oxygen content to condense at similar rates as the non-nitrate HOMs. We also tested two existing elemental-composition-based parameterisations for their ability to reproduce the condensation observed in our cyclohexene system. Both predicted higher volatilities than observed, most likely due to the number of oxygen atoms enhancing the product uptake more than the models would suggest.
- Article
(2303 KB) - Full-text XML
- BibTeX
- EndNote


Secondary organic aerosol (SOA) plays an important role in the climate system, and its formation and growth have been a major focus of research in recent years (Shrivastava et al., 2017). Low-volatility organic vapours, like highly oxygenated organic molecules (HOMs), are a crucial ingredient in many of these aerosols (Ehn et al., 2014; Bianchi et al., 2019). They are naturally formed in the atmosphere in the oxidation of initially volatile organic species (Jimenez et al., 2009).
Many of the hydrocarbons emitted to the atmosphere have natural sources, mainly in vegetation (Laothawornkitkul et al., 2009). The oxidation of some of these biogenic volatile organic compounds (BVOCs) have been linked to high SOA yields, e.g. monoterpenes (C10H16) (Tunved et al., 2006; Ehn et al., 2014; Jokinen et al., 2015). Notably, the monoterpenes that have a carbon ring structure with a double bond (i.e. endocyclic alkenes) can be oxidised by ozone without fragmentation, producing a larger oxygenated molecule (Chuong et al., 2004; Jokinen et al., 2015), often resulting in a higher SOA-forming potential.
The lower the volatility of an oxidation product is, the more it has a tendency to condense onto existing aerosol particles (Kroll and Seinfeld, 2008). In addition to typically having a relatively large molecular mass, low-volatility products generally have high oxygen content. More specifically, low volatility has typically been linked to the oxygen to carbon ratio (O : C) (Aiken et al., 2008). However, there have also been implications that the relationship between low volatility and O : C ratio might not always be as straightforward as was previously thought (Kurtén et al., 2016). Volatility depends on molecular functionality, and products with more hydrogen-bonding functional groups have been linked to lower volatilities (Donahue et al., 2013). In addition to simple condensation, reactive uptake may also be responsible for some of the growth of SOA particles (Zhang et al., 2015).
The most emitted monoterpene in the atmosphere is α-pinene, contributing to SOA formation and growth especially in the boreal regions (Spanke et al., 2001; Ehn et al., 2014; Jokinen et al., 2015). Like most monoterpenes, α-pinene has a relatively complex structure. Therefore, the simple symmetrical cyclohexene (C6H10) molecule has regularly been used as its surrogate in SOA studies (e.g. Chuong et al., 2004; Rissanen et al., 2014). As the carbon ring is the common site for oxidation in BVOCs with endocyclic double bonds (Rissanen et al., 2014), the simple cyclohexene can also provide insight into the oxidation pathways of larger molecules.
In this work, we studied cyclohexene ozonolysis in an environmental chamber, with the main focus of understanding the formation and fates of HOM products under perturbations. NO was added to the chamber in order to investigate the resulting changes in the formation of HOMs, while introducing seed aerosol allowed us to examine the connection between volatility and HOM elemental composition. We also assessed the applicability of two existing volatility parameterisations on our cyclohexene system. This allows for investigating the link between elemental composition and volatility of cyclohexene HOM in the broader context of other volatile organic compounds (VOCs), such as the atmospherically relevant BVOCs.
2.1 Chamber conditions and instrumentation
The measurements were conducted during a 5 d period in the COALA chamber, which is described in detail by Riva et al. (2019a) and Peräkylä et al. (2020), with the latter also giving a comprehensive description of chamber dynamics relevant in our experiments as well. The chamber is 2 m3 in volume and has fluorinated ethylene propylene (FEP) as its wall material. The cyclohexene ozonolysis was performed under dark conditions. Temperature in the chamber was 27 ± 2 ∘C, and relative humidity (RH) was 29 ± 2 %. Mass flow controllers (MKS, G-Series, 0.05–50 L min−1, Andover, MA, USA) were used to control the injections of reactants. Ozone was generated from purified air with an ozone generator (Dasibi 1008-PC), and cyclohexene was produced by flowing air through a glass bubbler with liquid cyclohexene. Both were continuously injected into the chamber, together with purified air (AADCO model 737-14, Ohio, USA). The ozone concentration without cyclohexene in the chamber was on average 25 ppb (23–27 ppb), and when cyclohexene was added the steady-state ozone concentration was approximately 18 ppb (16–19 ppb). The cyclohexene concentration was not measured and therefore had to be estimated from the drop in ozone concentration at its introduction. This produced a rough estimation of 70 ppb of cyclohexene. The average chamber residence time was approximately 50 min. Ozone and NOx levels were monitored with gas analysers (UV photometric ozone monitor, model 49p, Thermo Environmental Instruments; NO-NO2-NOx analyser, model 42i, Thermo Fisher Scientific). Concentrations of all substances in the different experiments are presented in Table A1.
NOx experiments were conducted by injecting NO into the chamber. As NO quickly reacts with ozone to form NO2, the resulting ratio in the chamber was fairly low, a few percent at most. This meant that the NO concentration remained below the detection limit of the analyser during our experiments. Therefore, only the total NOx was considered in the analyses. The total NOx concentrations in the chamber during different experiments were approximately 1, 3 or 9 ppb (Table A1)
The condensation of vapours was studied with a 9 µg m−3 loading of ammonium bisulfate (ABS) ((NH4)HSO4) particles that were produced by nebulising aqueous ammonium sulfate solution with sulfuric acid. They were dried and size selected (80 nm) with a differential mobility analyser (DMA) before injection. The condensation sink was calculated for sulfuric acid, from aerosol size distribution data (Maso et al., 2005) measured with a differential mobility particle sizer (DMPS, Aalto et al., 2001). Due to the acidity of the ammonium bisulfate aerosol, there is a possibility that a fraction of the overall sink might be a result of reactive uptake (Zhang et al., 2015). However, in their similar experiments with α-pinene, Peräkylä et al. (2020) did not observe the uptake of HOMs to differ significantly between ammonium sulfate (AS) and ABS seeds.
Oxygenated gas-phase products were monitored by a chemical ionisation atmospheric pressure interface time-of-flight mass spectrometer (CI-APi-TOF, TOFWERK AG, Aerodyne; Junninen et al., 2010; Jokinen et al., 2012). It consists of three components: a chemical ionisation inlet (CI), an atmospheric pressure interface (APi) and the time-of-flight (TOF) mass spectrometer, which in our setup was a HTOF that has a mass resolving power of ∼ 5000 Th Th−1. Nitrate ions produced by subjecting an air stream containing nitric acid (HNO3) to soft X-rays, are used to charge the sample molecules drawn from the chamber into the CI inlet. After charging, ions are directed into the APi. Quadruple ion guides and an ion lens stack focus and guide the ions through the APi chambers where the air is pumped out, with the pressures ultimately reaching 10−6 mbar in the TOF chamber, where the ion mass-to-charge ratio is determined. Nitrate ions have been shown to cluster readily with HOMs (Ehn et al., 2014; Bianchi et al., 2019). The clustering is not equally efficient between all compounds however, and signals are therefore not directly representative of the actual relative concentrations of the compounds. This selectivity of the nitrate ions has been described by, for example, Hyttinen et al. (2015).
The CI-APi-TOF mass spectrometry data were analysed in MATLAB (R2016a) with the toolbox tofTools (R607) (Junninen et al., 2010). In further analysis the signals at different times were made comparable by normalising all time series by dividing them with the sum of the three reagent ion time series (, , ; Jokinen et al., 2012). As quantification of HOMs remains challenging (Riva et al., 2019b), we opted for analysing only the relative changes to HOM concentrations in this work.
2.2 Peak fit analysis
The toolbox tofTools fits peaks based on a given list of compounds. Some of the compounds could potentially have very similar masses and fitting them correctly can sometimes prove challenging for an automatic routine (Cubison and Jimenez, 2015; Zhang et al., 2019). Problems can also arise if the spectra are noisy or if an observed ion is not listed in the compound list but something with a close mass is. These types of issues may result in fitting a peak either too small or too large.
Including potentially false signals would be undesirable in the analysis. Individually estimating the quality of each peak fit at each time point is extremely time-consuming and presents an inherent challenge for high-resolution mass spectral analysis. This motivated us to attempt to use a quantitative measure to describe the quality of the automatically generated fits. By assigning this variable for each fit, signals with poorly fitted peaks could be easily identified and down-weighted or removed from the analysis.
The variable, which we will call the FitFactor, was used to quantify how well the fitted peak matched the spectra. The residual area, i.e. the difference between the spectral peak and the sum of all fitted peaks is compared to the surface area of the fitted peak of interest. This residual-to-peak ratio is subtracted from unity, and the reached value is the FitFactor of the peak fit.
Thus, a FitFactor of 1 would describe a perfect fit. Decreasing FitFactor values indicate increasing uncertainties associated with the peak fit, and the quality of a peak fit with a FitFactor close to zero or even negative, is likely to be very poor. Each product was described with a single FitFactor value that was an average of the fits in the spectra that had reasonable signal (at least 50 % of time series maximum).
Visual examples of the FitFactor determination from a few different peak fits are shown in Fig. A1, alongside a discussion concerning the limitations of the method (Appendix A1). Since the peak list was generated semi-automatically by simply listing all compositions within chosen element number limits, the FitFactor was a helpful tool for identifying the most reliable signals.
2.3 Peroxy radical chemistry and product formation
The mechanisms of cyclohexene ozonolysis, related autoxidation steps and other reactions leading to RO2 radical formation are detailed elsewhere (Rissanen et al., 2014). In this section, we only focus on the radical chemistry most relevant in the context of our study. The primary peroxy radical in cyclohexene ozonolysis is C6H9O4 (Berndt et al., 2015), and radicals may acquire higher oxygen numbers by undergoing several steps of autoxidation (Crounse et al., 2013). Before reaching termination, some radicals may be susceptible to a decrease in carbon number, following a loss of a CO group (Mereau et al., 2001; Rissanen et al., 2014):
Unimolecular termination of RO2 typically takes place through the loss of a hydroxyl radical (OH) (Rissanen et al., 2014):
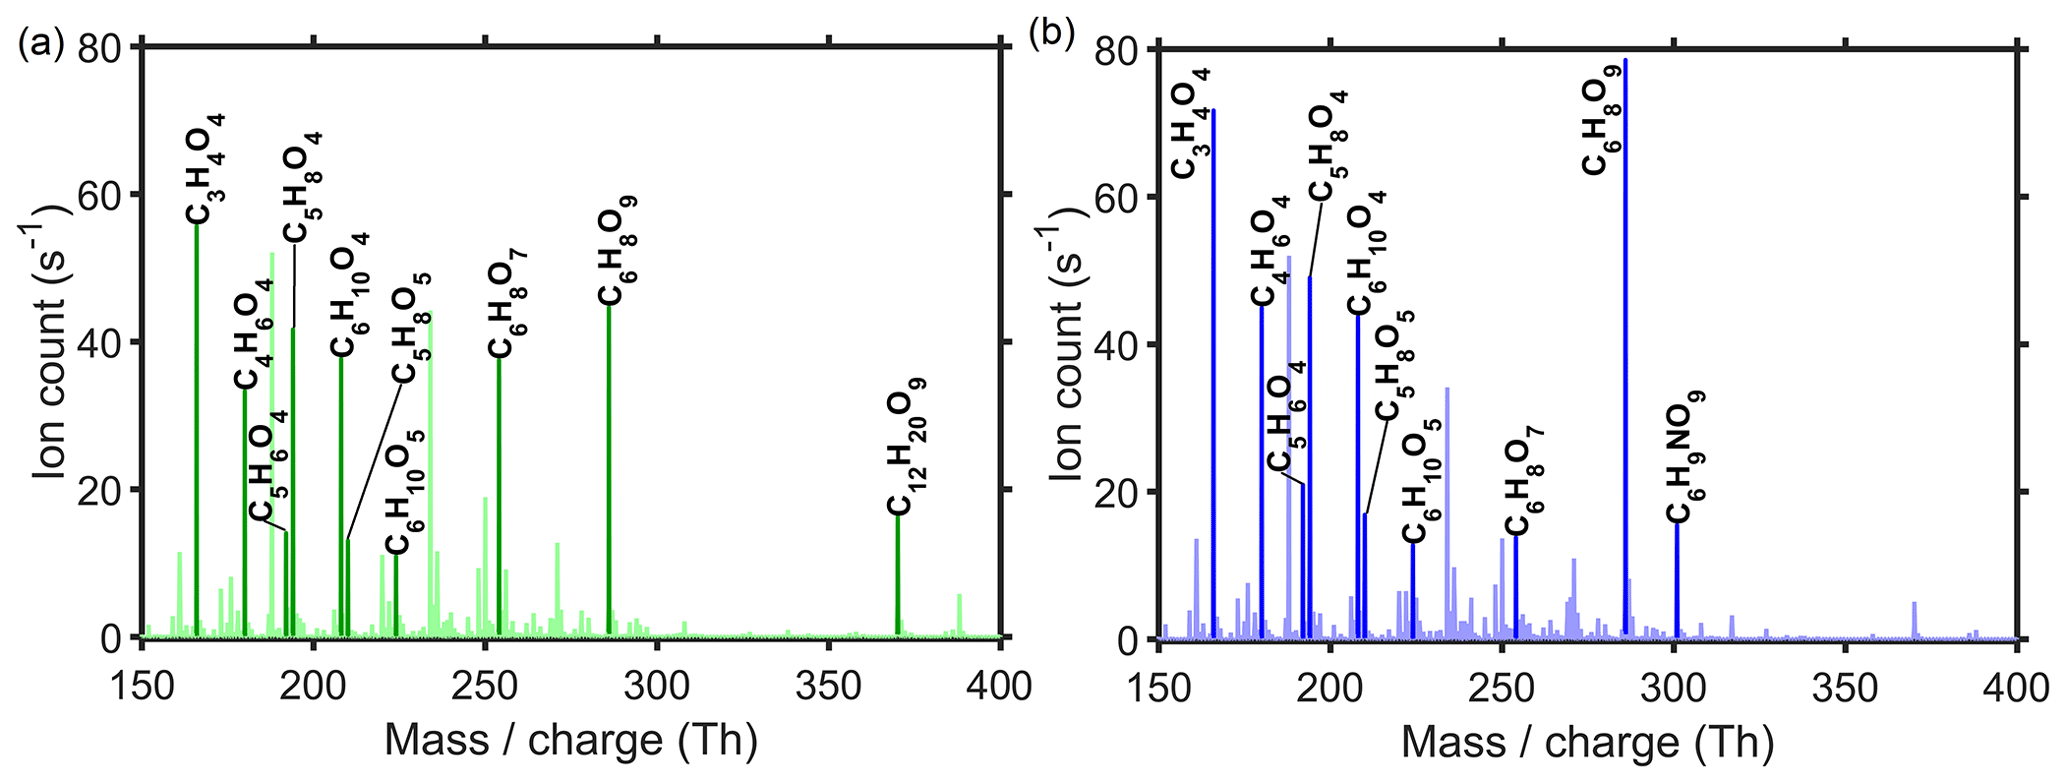
Figure 1Two example 10 min average spectra showing the largest product peaks that were all observed within the mass range 150–400 Th. Panel (a) shows a spectrum without NOx, while in panel (b) NOx concentration was approximately 9 ppb. Ten of the biggest product peaks are highlighted with a darker colour and labelled with their chemical composition. All products were detected as cluster with , the mass of which is included in the masses shown in the x axis.
A loss of HO2 is another previously suggested mechanism that has since been shown not to be likely under atmospheric temperatures (Hyttinen et al., 2016). Bimolecular reactions between RO2 and HO2 or between two RO2 radicals also produce closed-shell species (Orlando and Tyndall, 2012; Rissanen et al., 2014). The former can typically produce ROOH molecules (Reaction R3), whereas the latter can lead to a production of a dimer molecule (ROOR) (Reaction R4) or two monomers (ROH and R⋄CHO) (Reaction R5). Alternatively, bimolecular reactions can also produce reactive open-shell alkoxy radicals (RO) (Reaction R6).
Peroxy radicals are also a part of the chemistry of pollutants such as NOx (i.e. NO and NO2). The reactions between NOx and RO2 usually take one of the following forms (Orlando and Tyndall, 2012):
Only Reaction (R8) is typically significant in producing closed-shell end products, as products formed in Reaction (R9) tend to be thermally unstable, unless under very cold conditions (Orlando and Tyndall, 2012). A high NO2 concentration also has the capability to suppress dimer formation, at least on shorter timescales, by terminating acylperoxy radicals (RC(O)O2) and producing peroxy acylnitrates that are more stable than the common RO2NO2 (Rissanen, 2018). Our experiments, however, allowed for long reaction times, and the NO2 concentration was a mere fraction of the value associated with such an effect. Therefore, the equilibrium in Reaction (R9) is likely to reside strongly on the reactant side and not allow a significant nitrate pool under our experimental conditions.
A fraction of NO2 radicals may go on to react with ozone to produce NO3, which is another main oxidising species in the atmosphere. Oxidation of a BVOCs by NO3 radicals produces nitrogen-containing peroxy radicals. Similarly to ozone-derived radicals, these NO3-derived radicals can also form both monomer and dimer products (Yan et al., 2016; Zhang et al., 2020).
The left panel in Fig. 1 shows a HOM spectrum from cyclohexene ozonolysis without NO addition. Ten of the biggest observed oxidation product peaks are labelled. Other large peaks shown are the nitrate dimer at 188 Th and an unidentified peak at 234 Th. Strong signals of the HOM monomers C6H8O7 and C6H8O9 are observed, which is a typical observation reported also in earlier studies (Rissanen et al., 2014; Berndt et al., 2015). A number of the largest signal peaks are from relatively little-oxidised compounds, with only four to five oxygen atoms. Based on their elemental formulas, these species are most likely semi-volatile organic compounds (SVOCs), which might accumulate in the chamber due to minimal wall losses (Peräkylä et al., 2020), making them much more abundant than the low-volatility HOMs that are much more efficiently removed by condensation. This might explain the large signals even though the charging efficiency of such compounds is generally low (Hyttinen et al., 2015). In addition to the monomers, also one dimer signal, C12H20O9, reaches the top 10. One potential formation pathway for this dimer is a bimolecular reaction (R4) between radicals C6H9O8 and C6H11O3. The latter is the primary peroxy radical formed form OH oxidation of cyclohexene (Berndt et al., 2015).
3.1 Influence of NO on cyclohexene oxidation products
Injecting NO into the chamber has a significant impact on the chemistry within, which consequently leads to changed product signals. Although we expect NO to have the largest effect on the radical chemistry (Eqs. R7–R9), due to the aforementioned technical limitations leading to a lack of separate measurements of NO, we compare signals to the total measured NOx. NO2 can also have some noticeable effect, by reactions with acylperoxy radicals (Reaction R9), which are expected to be abundant in this system (Rissanen et al., 2014; Rissanen, 2018), but as discussed in Sect. 2.3, we do not expect this to be a significant process in our system. In addition, also oxidation by NO3 radicals will take place in the chamber. As our observations are limited to the elemental composition of the products, and we have no additional information on specific structures, we do not attempt to distinguish between the effects of NO, NO2 and NO3.
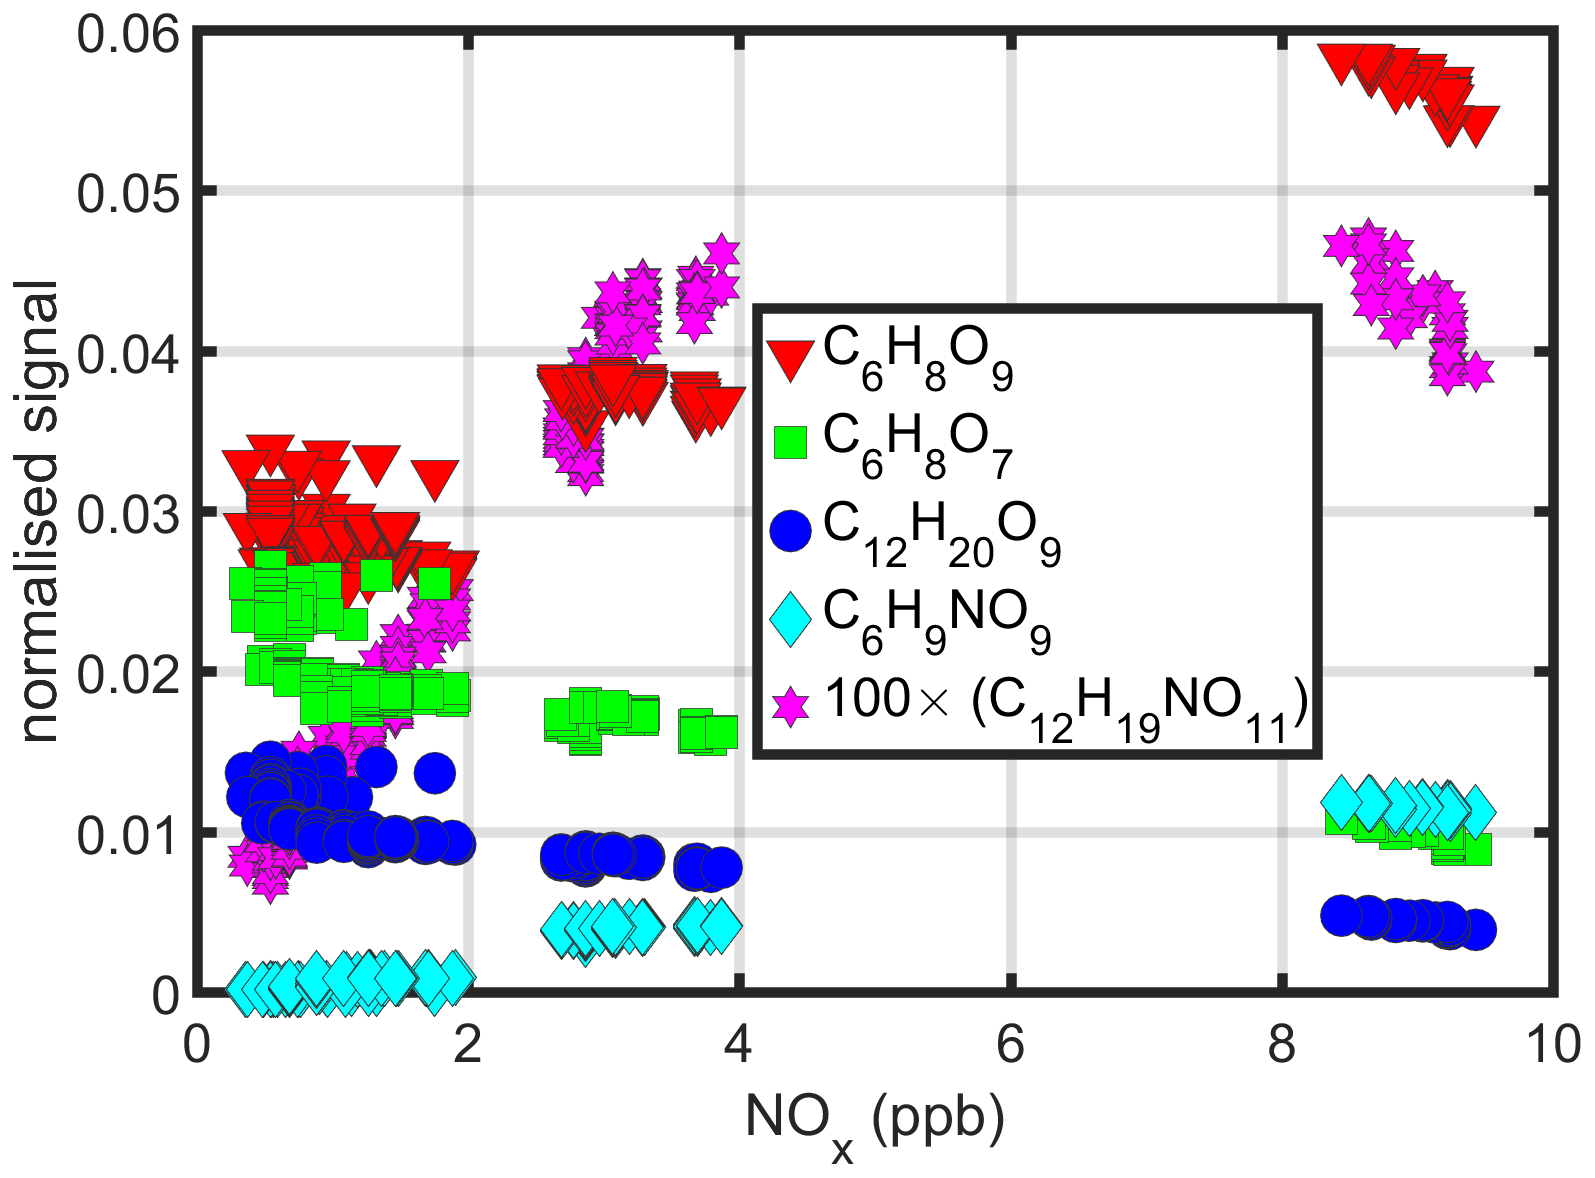
Figure 2Examples of signal changes due to increased NOx levels in the chamber. Shown are examples of two differently behaving monomers and a dimer without nitrogen, as well as a nitrogen-containing monomer and dimer. The last one had a signal so small that in the figure it is multiplied by a factor of 100. No measurements were done with NOx concentrations between 4 and 8 ppb.
An example spectrum during a NOx experiment is shown in Fig. 1b. The 10 biggest signals are otherwise the same as in the absence of NOx (Fig. 1a), except for the dimer signal (C12H20O9) having dropped to a fraction of the original and thus off the list, while a nitrate signal, C6H9NO9 (Reaction R8), has replaced it. The monomer signal peaks are also on average larger in the presence of NOx than without it.
A few examples of changes in product signals with increasing NOx are shown in Fig. 2. Species with comparable signal sizes are purposely selected (except for the nitrogen-containing dimer that has a much smaller signal). Shown are the increasing monomer C6H8O9 signal, decreasing C6H8O7 monomer signal, decreasing C12H20O9 dimer signal, and increasing C6H9NO9 nitrate and C12H19NO11 nitrogen-containing dimer signals. These trends are expected, as in the presence of NOx the occurrence of RO2+NOx reactions (Eqs. R7–R9) also reduce the likelihood for other bimolecular reactions (Eqs. R3–R6). This figure also exemplifies the possible non-linear effects of NOx on different molecules. While some molecules do show a linear trend with the NOx addition, the signal of the nitrate dimer C12H19NO11, for example, initially increases with the added NOx, as oxidation by NO3 generates nitrogen-containing radicals, allowing for the formation of such a dimer. However, when NOx concentration increases (> 8 ppb), the suppression of RO2+RO2 reactions by NO (and NO2) starts to become more important, and we observe a decreasing trend.
For a broader overview of signal changes in response to NOx loading, Fig. 3 shows the relative change of all non-nitrate products signals that were fitted (nitrate-containing molecules are presented in Fig. 4 and discussed later). Signals with 9 ppb of NOx were compared to signals without NOx addition. All compounds with even hydrogen numbers are closed-shell products, whereas ones with an odd number are radicals.

Figure 3The effect of NOx on observed signals of molecules that do not contain nitrogen. Signals from when NOx concentration was 9 ppb are compared to signals during no NO injection (with small NOx residual of < 0.9 ppb). The bottom x axis shows the carbon number of each compound, with the white vertical lines separating the different C-atom numbers. The top x axis shows the hydrogen number, and the y axis the oxygen number. Compounds with an odd number of H atoms are radicals. Marker colour corresponds to the relative change in the signal size, when moving from zero NOx to high NOx; marker size describes the size of the signal at zero NOx; and the marker transparency describes the quality of the peak fit (if FitFactor = 1, marker is fully opaque; if FitFactor ≤ 0, marker is fully transparent). The two colour bars show the colour scale with two different opacities (0.5 and 1). Some products had values outside the colour axis limits. (C6H9O5, C6H9O9 and C11H18O11 being only such products with FitFactor values of 0.7 and above, experiencing relative changes of 3.6, 4.8 and −0.7, respectively). Columns with no appreciable signals were omitted from the figure.
The results in Fig. 3 paint a complicated picture on the formation of the non-nitrate compounds. While some features are expected and easy to explain, others remain less clear. Here we summarise some aspects of the findings. As adding NO into the chamber leads to peroxy radicals reacting with NO (Eqs. R7–R8), other bimolecular reactions (Eqs. R3–R6) consequently decrease. The most clear effect is the general decrease of almost all dimers, as the RO2 cross-reactions forming them decrease. For monomers, the effects are more complicated, with some increasing and some decreasing. For example, the signals of the two largest HOMs, C6H8O7 and C6H8O9, showed opposite behaviour, with the former decreasing and the latter increasing.
This varied response in the monomer signals highlights how complicated the formation pathways can be, even when the initial reactant is a relatively simple molecule like cyclohexene. Speculating on the exact reasons for differences between individual signal responses is difficult. A single observed elemental composition may often contain a collection of isomers, each with distinct formation pathways. The reaction rate constants and different branching ratios of reactions between different combinations of RO2 are also unknown and can vary by orders of magnitude depending on the specific structures (Shallcross et al., 2005; Berndt et al., 2018). Therefore, any change in the reactant concentration, timescales or other conditions can yield very different results, with highly non-linear responses, making direct comparisons with other studies challenging.
For these reasons, we will only briefly look at certain example molecules and compound groups in more detail. The reason for the decreasing C6H8O7 could be a decrease in bimolecular reactions of intermediate peroxy radicals. Rissanen et al. (2014) have previously suggested their likely formation pathway to involve a termination to a closed-shell molecule in a RO2+RO2 reaction. With the addition of NO, these types of reactions should decrease, and our results indeed show such a decrease (Fig. 3). The concurrent rising trend of C6H8O9 suggests that its formation pathway may involve alkoxy radical intermediates, which can form both from RO2+RO2 (Reaction R6) and RO2+NO (Reaction R7) reactions. Similar to our results, Rissanen (2018) saw an increase of C6H8O8 with NO and suggested the involvement of alkoxy radicals. Overall, we noticed increasing trends for at least 20 different monomer compounds that did not contain N atoms. As a notable exception, most of the C6H10Ox compounds showed a decrease, which may be explained by a decrease in the bimolecular reactions (R3) and (R5). Most of the less oxidised SVOCs only showed relatively small changes. Finally, NOx will also function as a sink for OH, although cyclohexene should still dominate the OH reactivity in the chamber even at the highest NOx concentration.
The increase of the observed nitrate signals under high NOx (9 ppb) conditions is shown in Fig. 4. Many compounds were associated with an unexpectedly high signal even outside of NOx experiments, and the size of this background signal is also shown in the figure. We opted to show the background signal instead of simply subtracting it, because in some cases the background was much larger than the signal increase, which would have caused large uncertainties when subtracting two relatively large numbers. In this way, the size of the background is also visible, and one can identify more clearly which increases are most reliable, i.e. the markers with the thickest yellow lines. Low NOx concentrations were measured continuously even outside the experiments, and although the NOx concentration during the measurement of the background signals was low in comparison to the concentration used in the experiment (less than 10 %), some of these signals could be from actual nitrate production. Alternatively, they could be residues from earlier experiments, re-evaporating from the chamber walls. The signals could also be partially an artefact, as signals assigned to organic nitrates may also have some contribution from RO2 radicals, as the two can be difficult to separate due to their relatively close masses (Peräkylä et al., 2020). This is perhaps the case especially with many of the nitrate monomers that appeared to change very little. Some of them also had relatively low FitFactor values (indicated by high transparency in the figure), also suggesting issues with peak fitting.
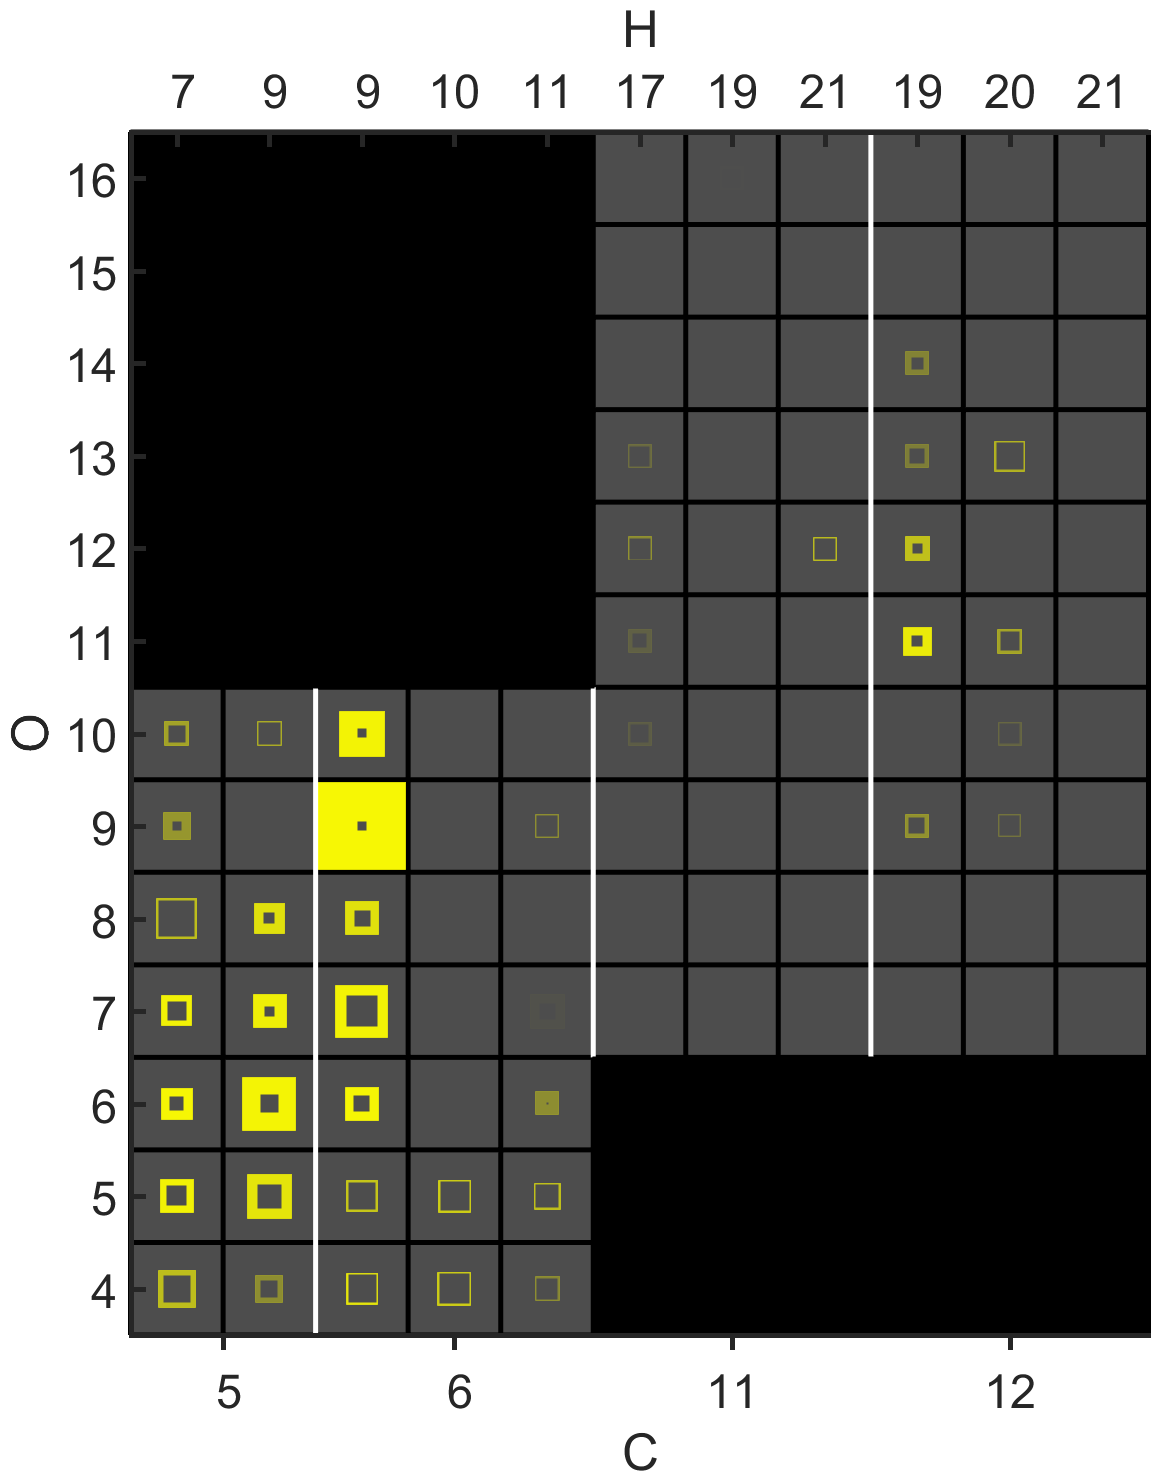
Figure 4Signal changes in N-containing molecules upon NOx addition during cyclohexene ozonolysis. The axes and transparency follow the same logic as in Fig. 5. The areas of the yellow squares show the size of the signal under high NOx (9 ppb) conditions. The “holes” in the square correspond to the size of the background signal, i.e. the signal before NOx addition.
Despite the difficulties with pre-existing signals, the formation of many nitrate products was clearly observed in the experiment. C6H9NO9 was clearly produced the most and likely formed in the reaction between NO and the radical C6H9O8, which is one of the most abundant highly oxygenated RO2 radicals in this system (Berndt et al., 2015) (Reaction R8). Nitrogen-containing dimers are also detected. This implies that some of the cyclohexene had been oxidised by NO3, which had led to the formation of nitrogen-containing radicals. These radicals then likely formed dimers in reactions with ozone-derived RO2, as the dimers only had one nitrate functionality. Similar nitrogen-containing HOM dimers have been observed also in field measurements where monoterpenes were the dominant VOC (Zha et al., 2018; Jokinen et al., 2017), and in studies by Yan et al. (2016) and Zhang et al. (2020), they have been directly implicated as cross-reaction products of RO2 formed in NO3 and O3 oxidation. The most abundant dimer was C12H19NO11. It could for example form in the reaction of the C6H9O8 radical, from ozonolysis, together with the primary RO2 radical C6H10NO5, from NO3 oxidation of cyclohexene. For the nitrate dimers to form, NO concentrations cannot be so high that they completely dominate the RO2 termination. In Fig. 2, the C12H19NO11 signal was seen to already experience a decreasing trend when the total NOx was above 8 ppb.
3.2 Condensation properties of cyclohexene oxidation products
The condensation sink of ABS seed aerosol was used to assess species volatilities. Compounds with low volatilities are expected to rapidly condense onto the particle surfaces, whereas the more volatile compounds should remain in the gas phase. The loss rate of the latter is mainly governed by flush out from the chamber, while the low-volatility compounds condense either onto the walls or onto particles (). For a more detailed discussion on the dynamics of the chamber, see Peräkylä et al. (2020). Although we expect the seed aerosol to be the main driver of the changes observed during the experiment, we cannot completely rule out the possibility for some influence from other changes in the product sources or sinks. Figure 5 shows the signal response of three species against the condensation sink (CS) of the injected ABS particles. The signals are normalised so that the median of the initial signal value before the seed experiment equals 1. As a result, the fraction that remains following the seed addition is easy to observe. The three compounds in Fig. 5 vary only by their oxygen number. The most highly oxygenated vapour, that is, C6H10O8, condenses most readily and thus can be described as being the least volatile.
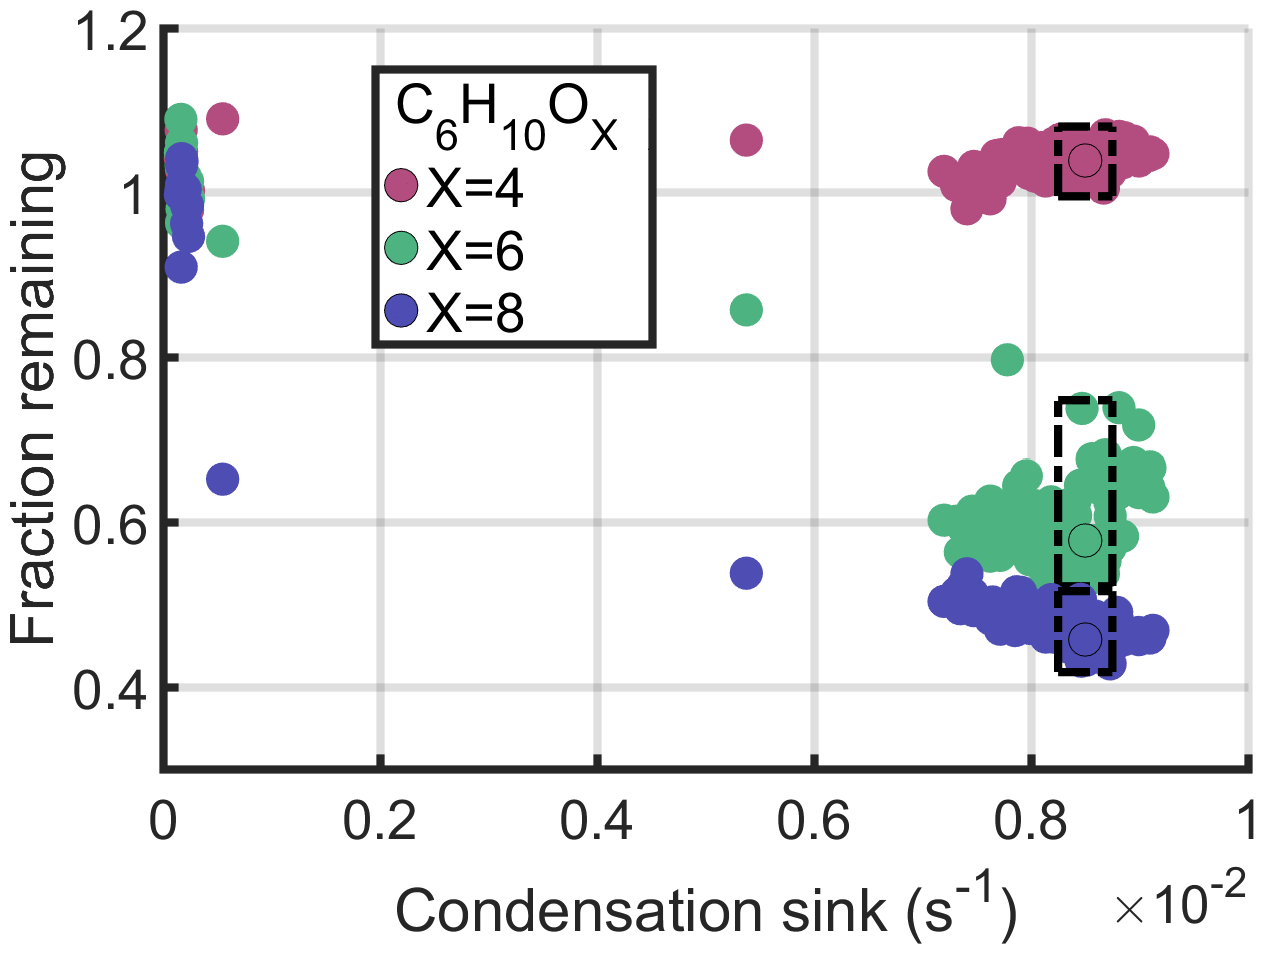
Figure 5Condensation behaviour of three C6H10Ox species. Signals are normalised so that the median of the signal before the ABS seed experiment is set to 1. Thus, shown on the y axis is the remaining fraction of the signal of each molecule at a given condensation sink. The dashed-line boxes encircle data points between the condensation sink values and s−1, and circles with a black outline show the median of these boxed-in data points.
The fraction remaining (FR) at a condensation sink of approximately s−1 (see Fig. 5) was calculated for all compounds fitted in the mass spectra. These are plotted in Fig. 6 against the mass of each compound. The methodology here closely follows that outlined by Peräkylä et al. (2020). Although a single seed experiment such as this will not provide us detailed information on the variation in volatility between different non-condensing or irreversibly condensing species, the transition between the two states can give us a qualitative understanding of the main properties determining the volatility of cyclohexene products. Only the clearest signals are shown in the figure, to focus on the most meaningful signals while minimising noise. In practice, this means compounds with FitFactor values of at least 0.7 are shown, which was deemed to strike a good balance between quality (see Fig. A1) and quantity. Non-nitrate and nitrate products are both plotted, while radicals are not, since condensation is only a minor sink for these species because of their high reactivities with other radicals (Peräkylä et al., 2020).
In addition to observations, also predictions based on two different models are shown in Fig. 6. For both models, the modelled values were scaled to the range of observed remaining fractions (between 0.43 and 1). Estimates in the upper panel are modelled with the parameterisation by Peräkylä et al. (2020),
that was originally based on measurements with α-pinene oxidation products. nC, nH, nO and nN correspond to the numbers of carbon, hydrogen, oxygen and nitrogen atoms in the molecule (charging ion excluded).
The model for volatility used in Fig. 6b is given by Bianchi et al. (2019), and the modification accounting for nitrate functionalities is also included. In nitrates, three oxygen atoms are bonded in the nitrate group, which as a whole reduces volatility by a factor of 2.5. We assumed an activity coefficient (γ) of 1 so that . Given the small precursor molecules in our study, the formed SOA is expected to have very high O : C ratios, just like the majority of potentially condensing molecules we measure in the gas phase. Under these circumstances, and considering the low relative humidity of our experiments, an activity coefficient close to unity is likely to be a valid assumption (Donahue et al., 2011). Thereby, the equation used in this work is
Here the additional constants are nC0=25, bC=0.475, bO=0.2, bCO=0.9 and bN=2.5 (Bianchi et al., 2019). To be able to compare the modelled volatilities to our observations of FR, we converted the C* values to remaining fractions they would theoretically correspond to under our experimental conditions. The conversion was done similarly to Peräkylä et al. (2020), who fitted a logistic curve , where ymin and ymax are limits for scaling, between FR of model compounds and the common logarithm of their saturation concentration from the ADCHAM model (Roldin et al., 2014). The original conversion equation had to be modified, as the SOA concentration in our experiment was an order of magnitude lower than in the Peräkylä et al. (2020) experiment, which would lead to lesser condensation and higher FR at similar C*. By following equilibrium partitioning theory (Donahue et al., 2012), to account for the difference, we shifted the original fit between FR and log 10(C*) left by 1 (i.e. plugging in ), thus adjusting the relationship between FR and C* by a factor of 10. While certainly introducing additional uncertainty, we expect this approach to allow for an adequate comparison of our findings with those of Peräkylä et al. (2020) and Bianchi et al. (2019).
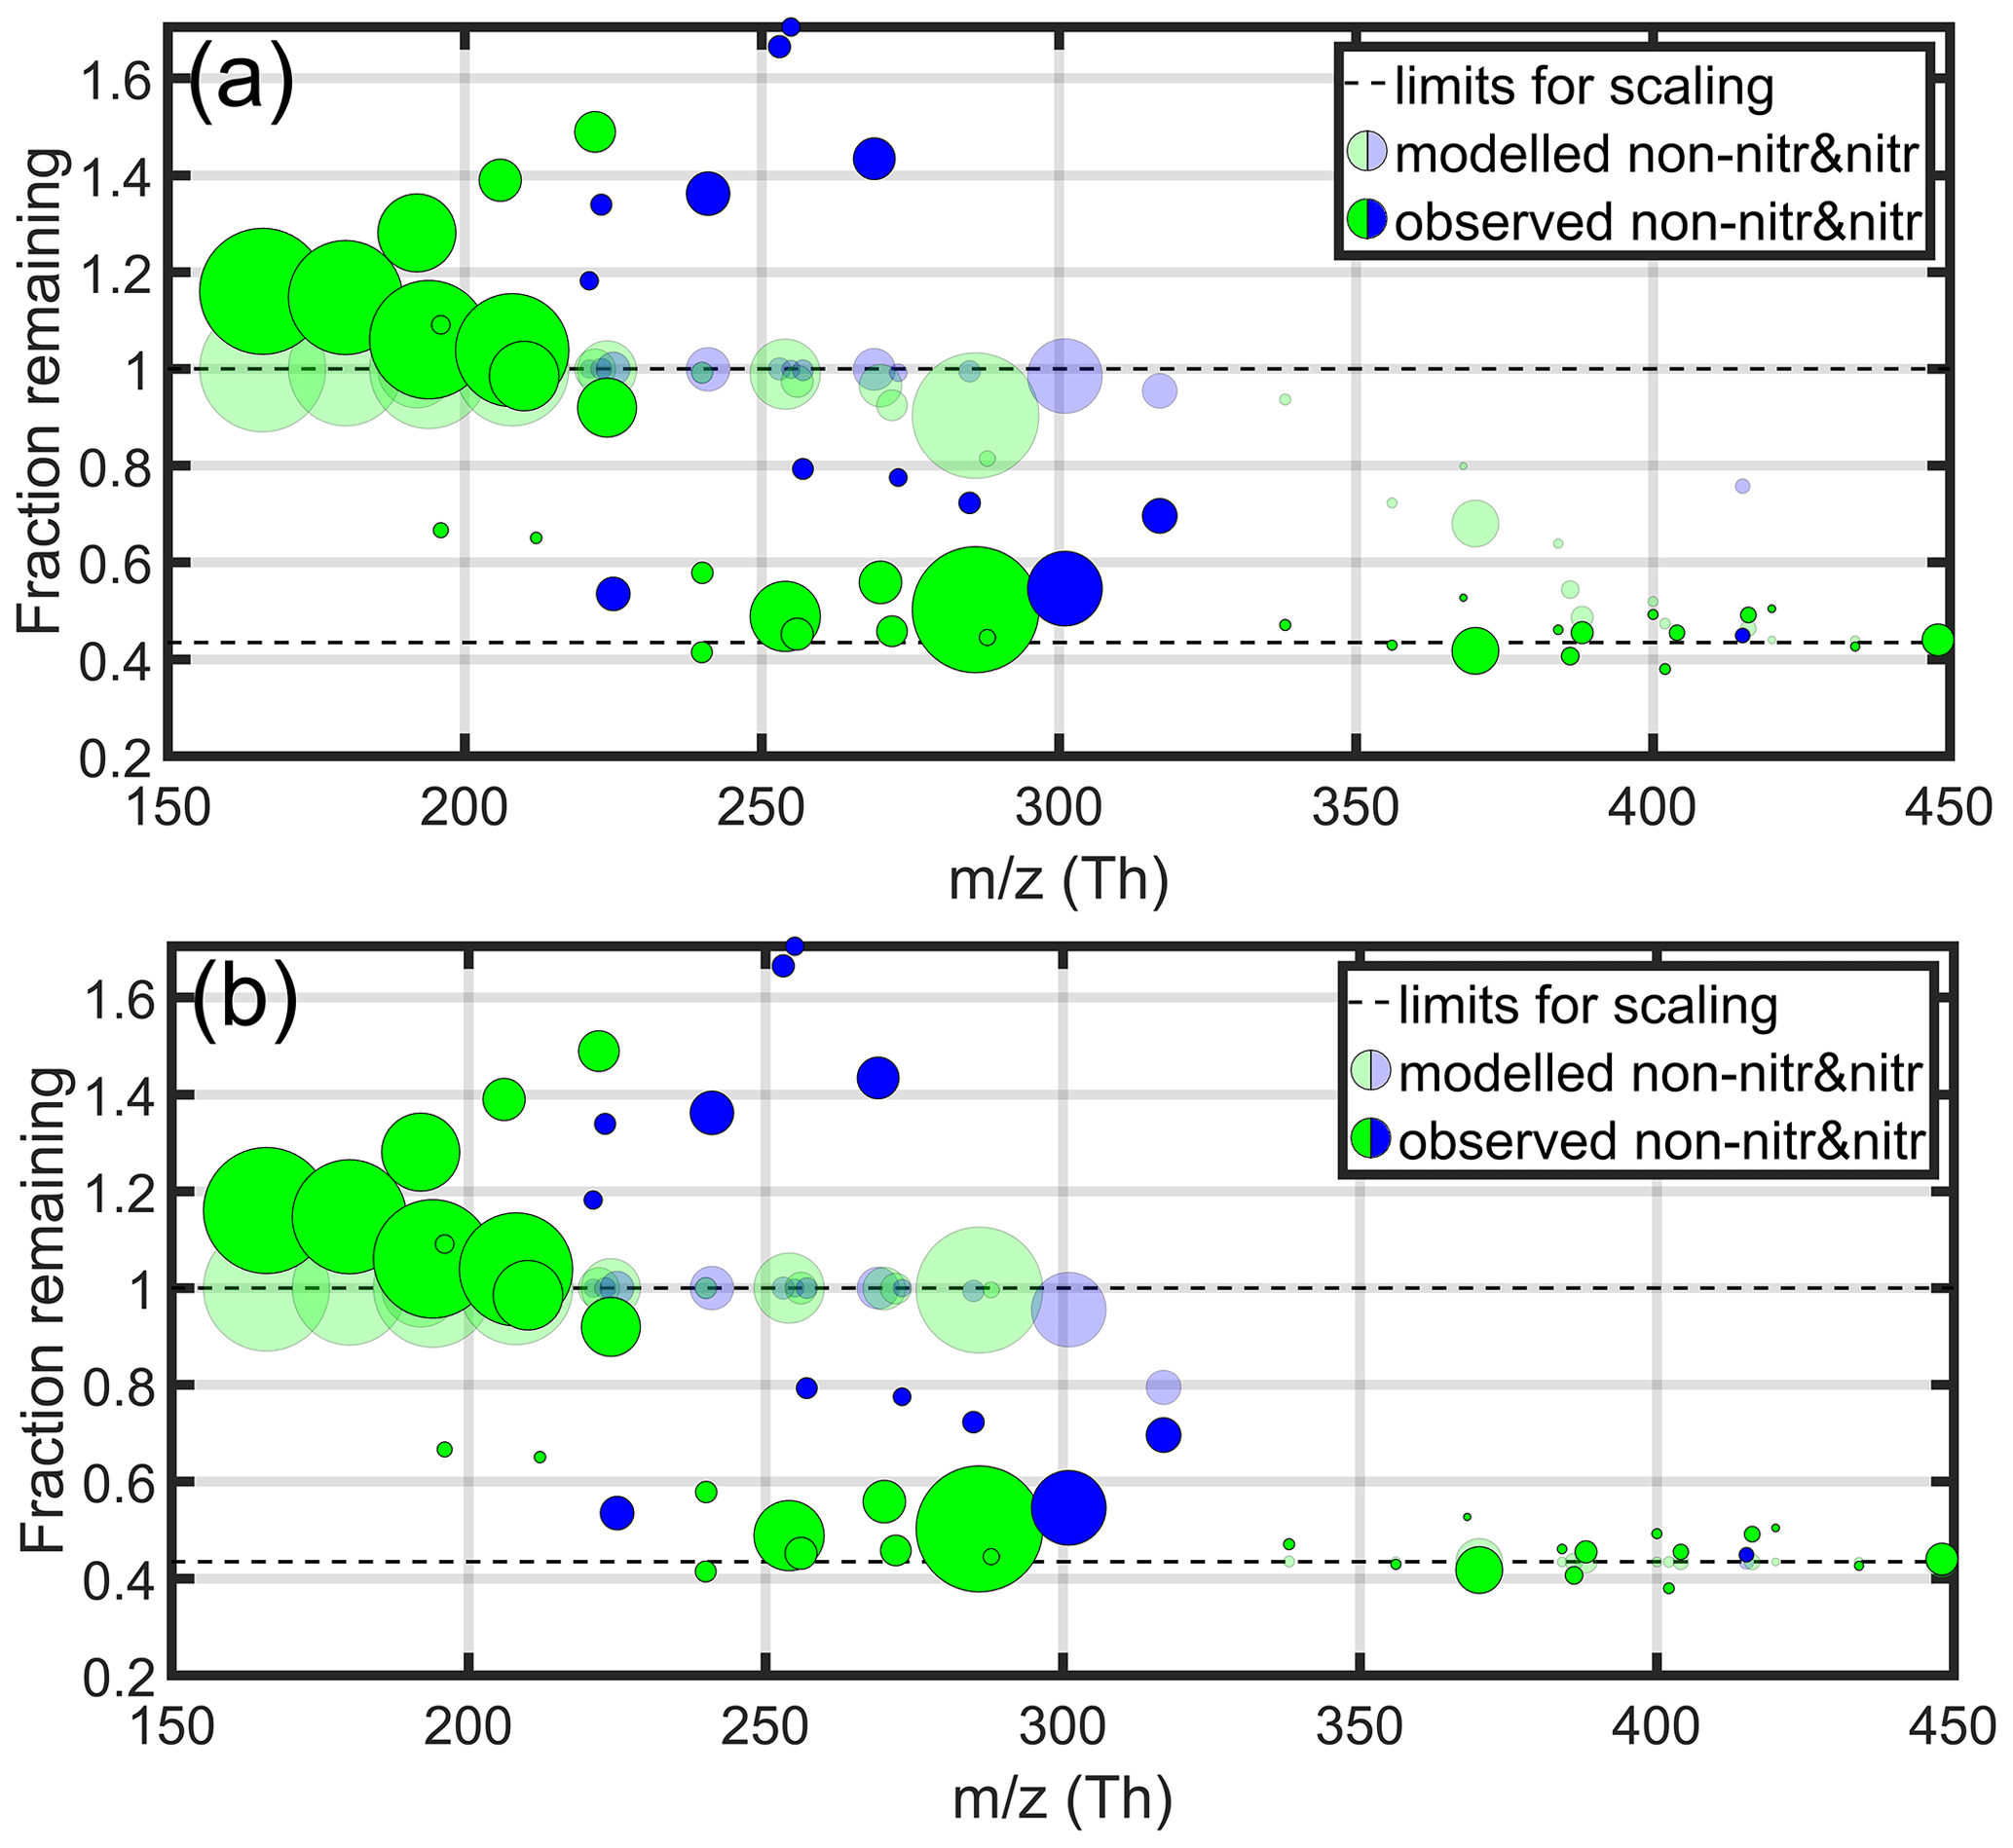
Figure 6The observed (opaque) and modelled (transparent) decrease in signal during an ABS seed experiment, for non-nitrate (green) and nitrate (blue) products. Panel (a) compares our observations with the model presented by Peräkylä et al. (2020), while panel (b) compares to the model by Bianchi et al. (2019). Only compounds with the best peak fits (FitFactor ≥ 0.7) are shown. The circle sizes are based on the relative sizes of the initial signals before the ABS aerosol injection, with the exception of the two biggest signals, which were slightly scaled down. The condensation sink was approximately s−1, meaning that these points correspond to the circles with a black outline in Fig. 5. All molecules were charged with a nitrate ion, which has a mass-to-charge ratio of 62 Th. One outlier (C5H7NO6) is not shown as its signal more than tripled.
Many monomers had remaining fractions above 1, indicating that the signal increased. A likely explanation is that these compounds are semivolatile and were still equilibrating with the chamber walls, thus having not yet reached steady state. This type of behaviour is likely the largest source of uncertainty in our data, and the potential error will be different for all molecules and therefore difficult to quantify in any detail. A rough estimate is that this would at most cause an error of 10 %–20 % to the relative changes reported above for the relatively fast seed addition experiments. Another possible reason for the increased signal is that these molecules have particle-phase sources, which would explain the increased formation upon seed addition. Due to these associated uncertainties, we do not try to interpret these points further. Some molecules with FR < 1 may have also experienced similar effects, but most likely to a smaller degree, as the lower-volatility compounds are less likely to evaporate from particles or walls.
The product volatilities were closely related to the molecular mass. The condensation sink caused most of the non-nitrate signals with masses above 250 Th to drop to values less than 50 % of the original, suggesting irreversible condensation and low volatilities. At masses below 225 Th, on the other hand, compounds remained fairly volatile, as all signals either remained the same or increased. Two exceptions to this with FR < 0.7 at masses close to 200 Th were C5H10O4 and C5H10O5, which are less oxidised than most molecules typically observed with the nitrate adduct CI-APi-TOF. This may mean that they contain multiple hydroxyl and/or carboxylic acid groups (which may improve their clustering ability with ) that decrease their volatility more than if the O atoms were incorporated as carbonyl and hydroperoxide functionalities, which is more typical for HOMs.
Similarly to non-nitrates, the volatility of nitrates decreases with mass. However, the transition from high to low volatility appears to happen at a larger mass than for non-nitrates, which is in line with previously determined group additivity trends of volatility (Pankow and Asher, 2008; Kroll and Seinfeld, 2008). A clear outlier is C5H9NO5 (225.04 Th), as the signal comparison suggests an unexpectedly low volatility for the compound. This might, however, be an artefact from issues with the fitting of multiple peaks, as shown specifically for this ion in Fig. A1b.
Both the Peräkylä et al. (2020) and Bianchi et al. (2019) models successfully predict the high volatility of the least oxidised monomers, and the irreversible condensation of the largest dimers. They locate the steepest transition in volatility at the region between monomers and dimers, and in disagreement with our observations, they fail to capture the observed nearly irreversible condensation of many of the more oxygenated monomers as well. The Bianchi et al. (2019) model predicts the irreversible condensation of all of the dimers, but the decrease in volatility in the Peräkylä et al. (2020) model is a more gradual function of mass and therefore predicts a condensation weaker than observed. The discrepancy between the observations and modelled FR is also clearly visible in Fig. B1.
As the models misplace the transition between non-condensing and irreversibly condensing compounds, they also over-predict the product volatilities in general. Since we cannot distinguish between the differences in volatilities of compounds that condensed irreversibly in our experiments, we are not able to confirm where the observed volatilities merge with the ones predicted by the models.
In order to better understand what controls the volatility of cyclohexene products and where these models might fail, we had a more detailed look into the effect of elemental composition on FR. In Fig. 7, the fraction remaining is plotted separately against carbon, hydrogen and oxygen numbers, as well as the “effective O : C ratio” . The incentive for choosing this ratio, rather than simply O : C, is the same as for the modification of the Bianchi et al. (2019) model, i.e. to account for nitrate functionalities. For non-nitrates, this expression reduces to an O : C ratio.
Cyclohexene oxidation products with the lowest carbon and hydrogen contents hardly condensed, while the opposite was true for the molecules with the highest C and H contents, mostly associated with the dimers (Fig. 7a and b). However, in the regions between these extremes, e.g. around C6 and H8, molecules range from volatile to effectively non-volatile, and thus pure C- or H-atom content is not a good predictor for volatility.
However, the fraction remaining as a function of the oxygen content of the molecule (Fig. 7c) shows the most clearly monotonically decreasing trend. The transition from non-condensing to condensing occurs at an O-atom content of six to seven, with nitrates again being slightly more volatile than non-nitrates. Finally, Fig. 7d demonstrates that the effective O : C ratio appears to be the worst predictor for volatility out of the parameters plotted. Despite O : C ratios of organic aerosol often being used as a reference for volatility, it does not correlate well with the volatility of an individual molecule. This is not surprising, as high-molecular-weight dimers require only a relatively small number of oxygen atoms (thus having low O : C ratio) to condense, while small molecules with one to three C atoms are unlikely to condense regardless of their O : C ratios. Therefore, the absolute oxygen number alone seems to be the best predictor for the FR.
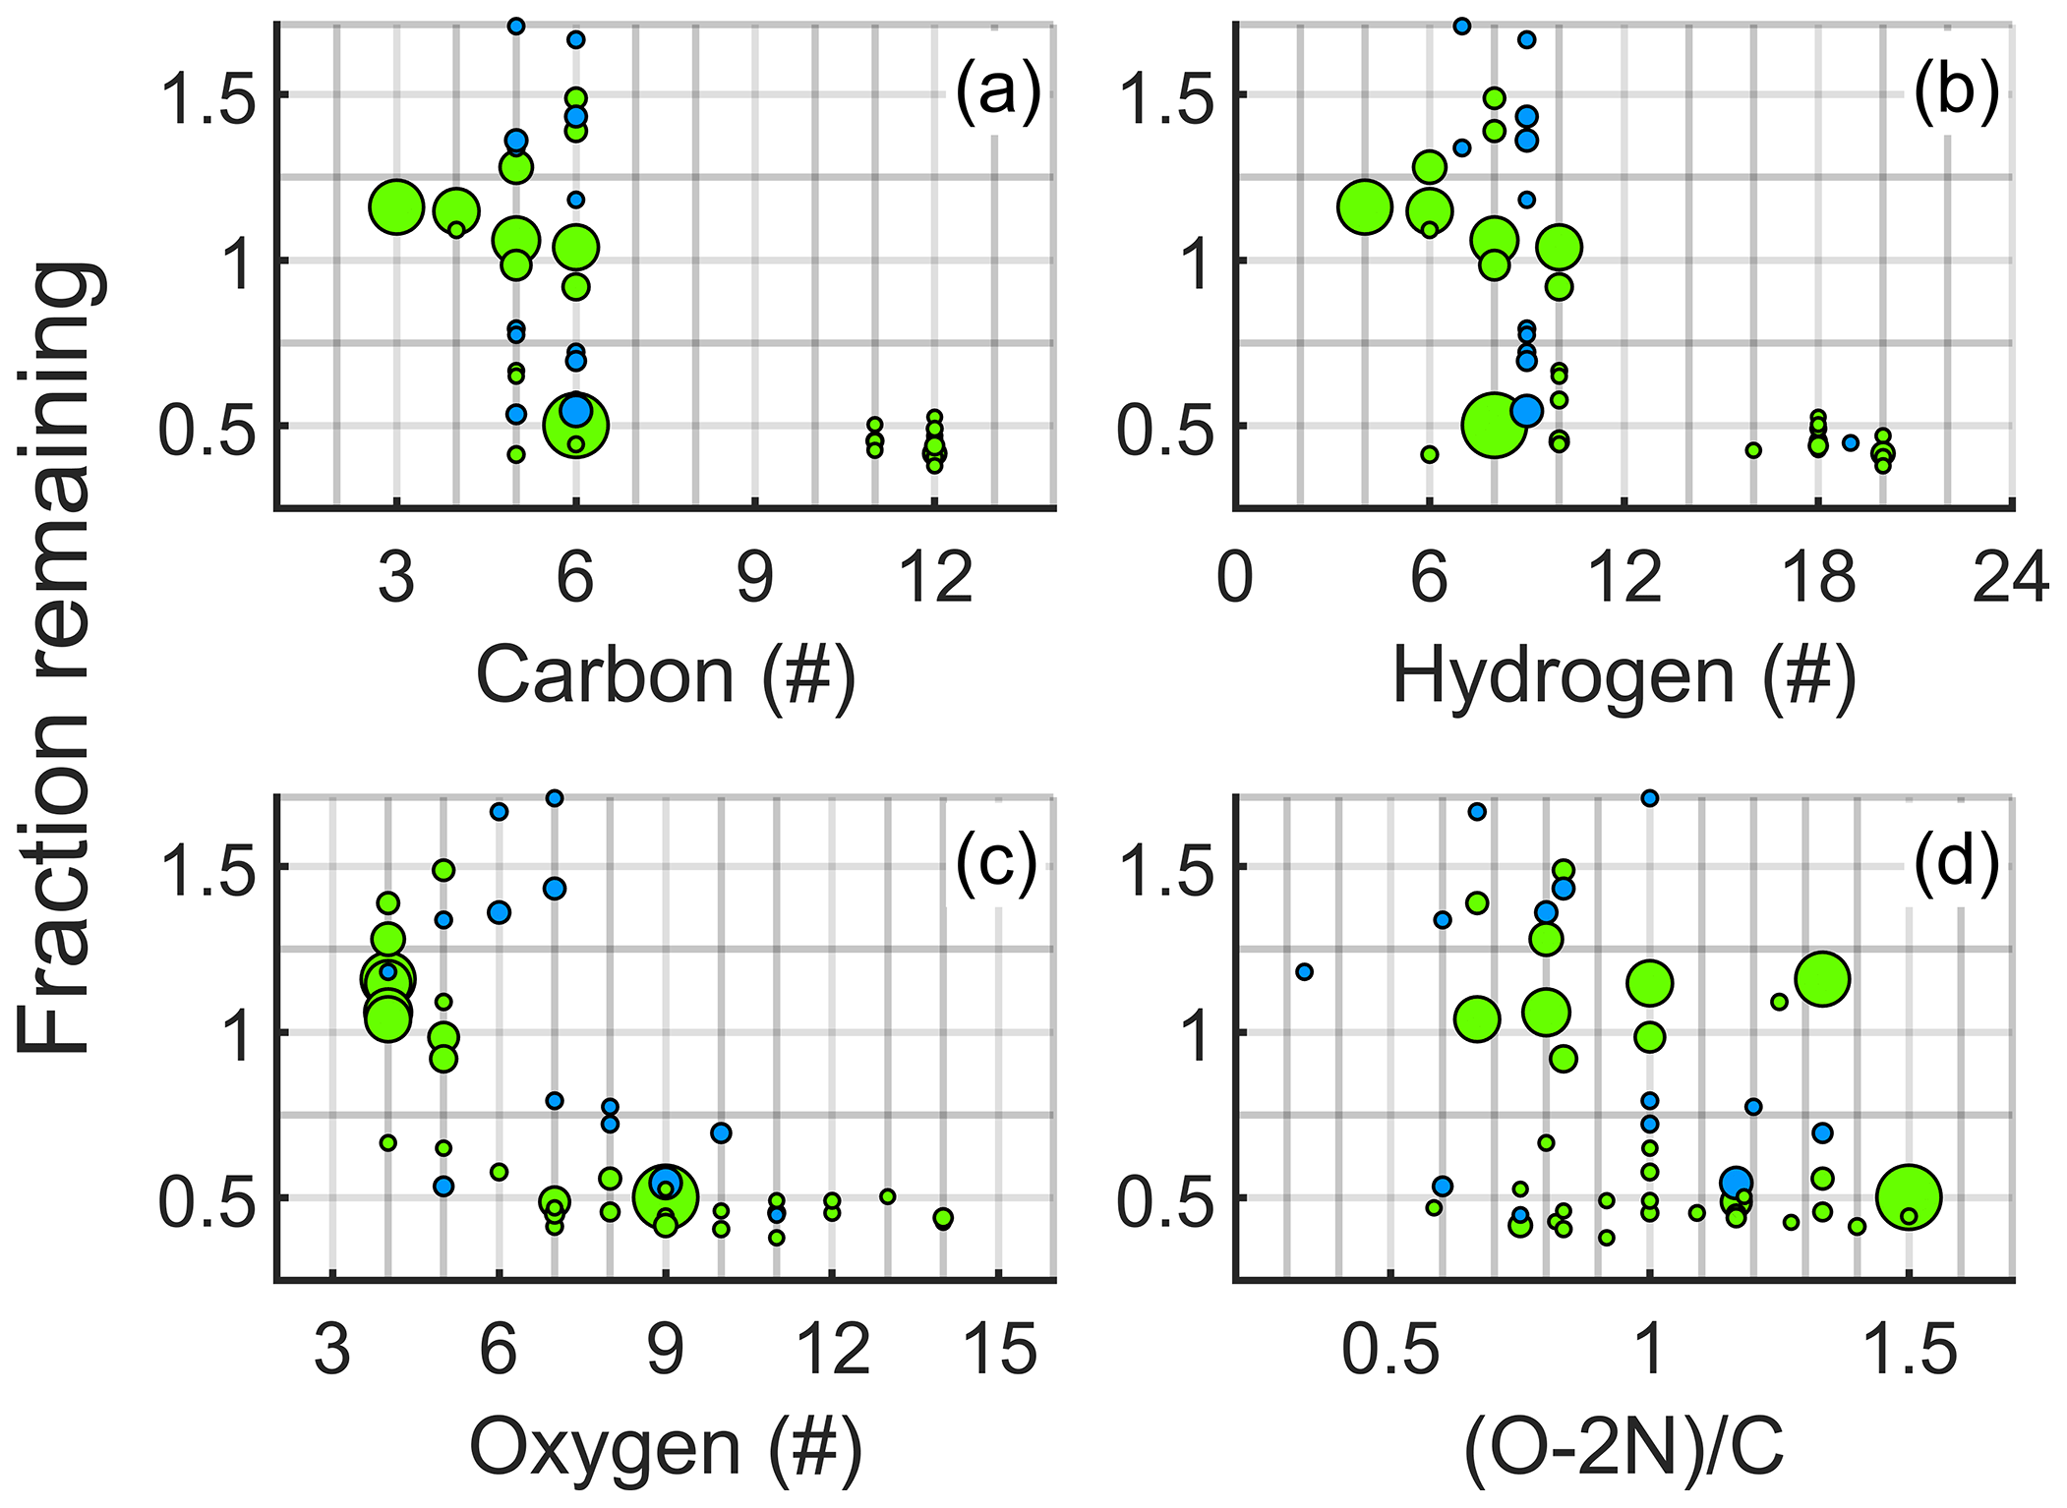
Figure 7Fraction remaining (FR) after seed addition as a function of elemental composition. This figure is similar to Fig. 6, except that here the FR of products is plotted against the (a) carbon, (b) hydrogen and (c) oxygen contents of the compounds, as well as against (d) the effective O : C ratio .
Elemental composition can be a good indication of the possible functional groups in the molecule that ultimately determine the volatility of a compound (Kroll and Seinfeld, 2008; Pankow and Asher, 2008). This is essentially the basis of models, such as the two by Peräkylä et al. (2020) and Bianchi et al. (2019) that we tested (Fig. 6), that aim to estimate volatility directly from the easily measurable elemental composition. As such, however, they always contain some intrinsic assumptions of the structure and the likely functional groups in the molecule. The Peräkylä et al. (2020) model is developed from an observed condensation of α-pinene products (C10H16), while the Bianchi et al. (2019) model is also primarily constructed with larger precursors in mind. An underlying assumption of a larger carbon frame, or a lower O : C might explain the discrepancy between our observations and the modelled FR, as an extrapolation to molecules with less C and much higher O : C, might cause the models to fail, especially in fully capturing the observed effect the O-atom content has on the uptake (Fig. 7). Incidentally, the Bianchi et al. (2019) model-predicted transition in condensation (Fig. 6) appears to be misplaced by approximately the mass difference between monoterpenes and cyclohexene. Furthermore, if the additional four carbon atoms that separate the two compounds are imagined into the model (replacing nC with nC+4), the modified Bianchi et al. (2019) model predicts our observed cyclohexene product FR remarkably well (Fig. B2). While anecdotal, it does support our conclusion that the oxygen content of the HOM is the primary contributor to their uptake efficiency. If the Peräkylä et al. (2020) model is adjusted similarly for both the number of C atoms (+4) as well as the number of H atoms (+6), which is also part of the parameterisation, the result is a negligible change in the modelled FR, as the added C- and H-atom contents have opposing effects on the estimated volatility. The lesser sensitivity to oxygen content of the Peräkylä et al. (2020) model could also partly explain its comparatively slow decrease in volatility as a function of mass. Peräkylä et al. (2020) themselves already contemplated that the parameterisation might not be able to predict volatilities of products with less than 10 carbon atoms, thinking that they might depend differently on the number of oxygen atoms, for example.
Another possible explanation to some of the model–observation discrepancies is if the monomer HOM in our experiments not only condense but are also lost by reactive uptake on the particles due to labile hydroperoxide functionalities. Separating between these effects is not possible from our data but would be extremely important for understanding, and modelling, SOA formation. We hope our work will help spur future studies to design experiments where these open questions could be tackled. Currently, volatility estimates for HOMs are highly uncertain, with different computational methods predicting vapour pressures differing by many orders of magnitude for a given HOM (Kurtén et al., 2016).
We have investigated the formation and fates of cyclohexene ozonolysis products, with a focus on the most oxidised species. These highly oxygenated organic molecules (HOMs) were measured with a CI-APi-TOF mass spectrometer. A statistical approach was utilised for evaluating the reliability of compound signals that had been determined from the spectra by means of an automatic peak-fitting procedure. By assigning each peak fit with a so-called FitFactor value that compared the fitted peak and spectral residual areas, we could fast and feasibly sort through the fitted compounds and identify the most reliable signals.
Perturbations to product signals by NOx were analysed species by species. Monomers (C3−C6) had a widely varied response to the addition. Although most of them increased, they did so in varying degrees, while some products also experienced an opposite effect and decreased. This variability highlights the complexities involved in HOM formation. Even resembling compounds can have very different main formation pathways under the same conditions, leading to even contrasting responses to added NOx. We expect the introduction of RO2+NO reactions to have caused most of the changes, and depending on whether the product benefited from resulting RO formation or suffered from the reduced bimolecular cross-reactions, the signal either increased or decreased. Interpreting individual signal changes any further is challenging, as any signal peak assigned to a given chemical formula is likely to contain many different isomers with possibly distinct formation pathways, which may have different responses to changes in the prevailing conditions.
The lower rate of RO2 cross-reactions during the NOx experiment also resulted in a decline in the formation of dimer products (C11−C12) that had no nitrate functionalities. The addition of NOx also led to nitrate formation, and both nitrate monomers and dimers were observed. The latter suggested multi-oxidant chemistry, as nitrate dimers are likely to form in a bimolecular reaction involving a NO3-derived radical. This can lead to the formation of nitrate dimers, as long as the NO concentration is not high enough to completely dominate the RO2 termination in the system.
The condensation of the oxidation products was probed in experiments where ammonium bisulfate seed aerosol was added to the chamber. The concentration of lighter products either remained the same or even increased, while after a narrow transition zone, all non-nitrate products heavier than 250 Th condensed onto the particles at nearly equal rates, dropping to at least half of the initial signal. Nitrates condensed less than non-nitrates with similar masses. A breakdown of the elemental composition of the different products indicated that the main factor determining the volatility of cyclohexene HOM is the number of oxygen atoms in the molecule. Products that had seven or more oxygen atoms, all condensed irreversibly in our experiment. Carbon- and hydrogen-atom contents also correlated with volatility, but this was mostly limited to the different condensational behaviour of monomers and dimers, while the effect of C and H content specifically was somewhat ambiguous. For example, molecules with five or six C atoms were observed to range anywhere from non-condensing to irreversibly condensing. We also found that the effective O : C ratio is by itself not a good measure for volatility, as small monomers can have a much higher volatility than many dimers, even with an O : C ratio twice as high.
Several parameterisations with the aim of predicting product volatilities based on their elemental composition have been developed. Being typically applied to larger reactants, such as monoterpenes (C10H16), we investigated if two such models, by Bianchi et al. (2019) and Peräkylä et al. (2020), would also be able to reproduce the condensation of cyclohexene (C6H10) products. While both were able to capture the lack of condensation in lighter monomers and the irreversible condensation of heavier dimers, they overpredicted the volatilities of many compounds and misplaced the transition between these two extremes to occur at a larger mass than observed. This was likely primarily due to the models overestimating the impact of C and underestimating the impact of O on the uptake efficiency. Although misplacing the transition from non-condensing to condensing, the parameterisation by Bianchi et al. (2019) was able to reproduce the shape of the transition, suggesting that it was still able to capture the number of oxygen atoms in the cyclohexene products as the main cause for increased condensation. The Peräkylä et al. (2020) model, on the other hand, is less sensitive to oxygen and produced a volatility transition too gradual to fit our observations, and while it unlike the Bianchi et al. (2019) model predicted some condensation for the largest monomers as well, it did not reproduce the observed irreversible condensation of smaller dimers. This analysis demonstrates the challenges and limitations in estimating product volatilities with simple composition-based parameterisations. Any parameterisation contains some intrinsic assumptions on the functional groups possibly present in the molecule. These assumptions may no longer hold true if the model is extrapolated outside its limits, which seems to be the case with the models we tested and the cyclohexene products.
The highly species-specific effects of NOx, especially in monomers, highlights the complex formation pathways involved in HOM formation, even when the reactant is the relatively simple cyclohexene. Therefore, any effects interfering with formation pathways cannot necessarily be generalised across different species. The mismatch between the parameterisations and the observed condensation of cyclohexene products highlights the role of oxygen as a primary driver for increased condensation, an effect which may be especially pronounced in the oxidation products of the smaller VOCs. As the number of oxygen atoms alone enhanced the condensation of cyclohexene oxidation products so effectively, an efficient progression of autoxidation could potentially be more important for SOA formation than the size of the initial VOC reactant. Finally, the relative roles of volatility-driven condensation and potential reactive uptake remains an open question, and further studies will be needed to address this important issue.
A1 Reactant, oxidant and particle concentrations
Table A1The approximate reactant, oxidant and particle concentrations during the conducted experiments. Cyclohexene concentration is a very rough estimate based on changes in ozone concentration.

A2 Peak fit analysis with the FitFactor parameter
By applying the FitFactor, a majority of the very poorly fitted peaks, such as the one shown in Fig. A1d, could easily be identified and removed from the analysis. However, some compounds could have a relatively good FitFactor, despite the fit being somewhat questionable, like in the case of shown in Fig. A1b. These types of fits are especially difficult. The automatic peak-fitting routine is capable of producing a sum peak that matches the spectra relatively well, which translates into a high FitFactor value. However, as so many peaks (three compound peaks, one large isotope peak) have been closely fitted onto the same spectral peak, there is still a great deal of uncertainty related to the individual peak fits. Thus, the FitFactor might not be optimal for this type of multiple fit problems, but thanks to the selectivity of the nitrate CI-APi-TOF, such peaks are not very prevalent in the spectra. The problem could be avoided by setting a minimum separation between fitted peaks, which we did not do in this work.
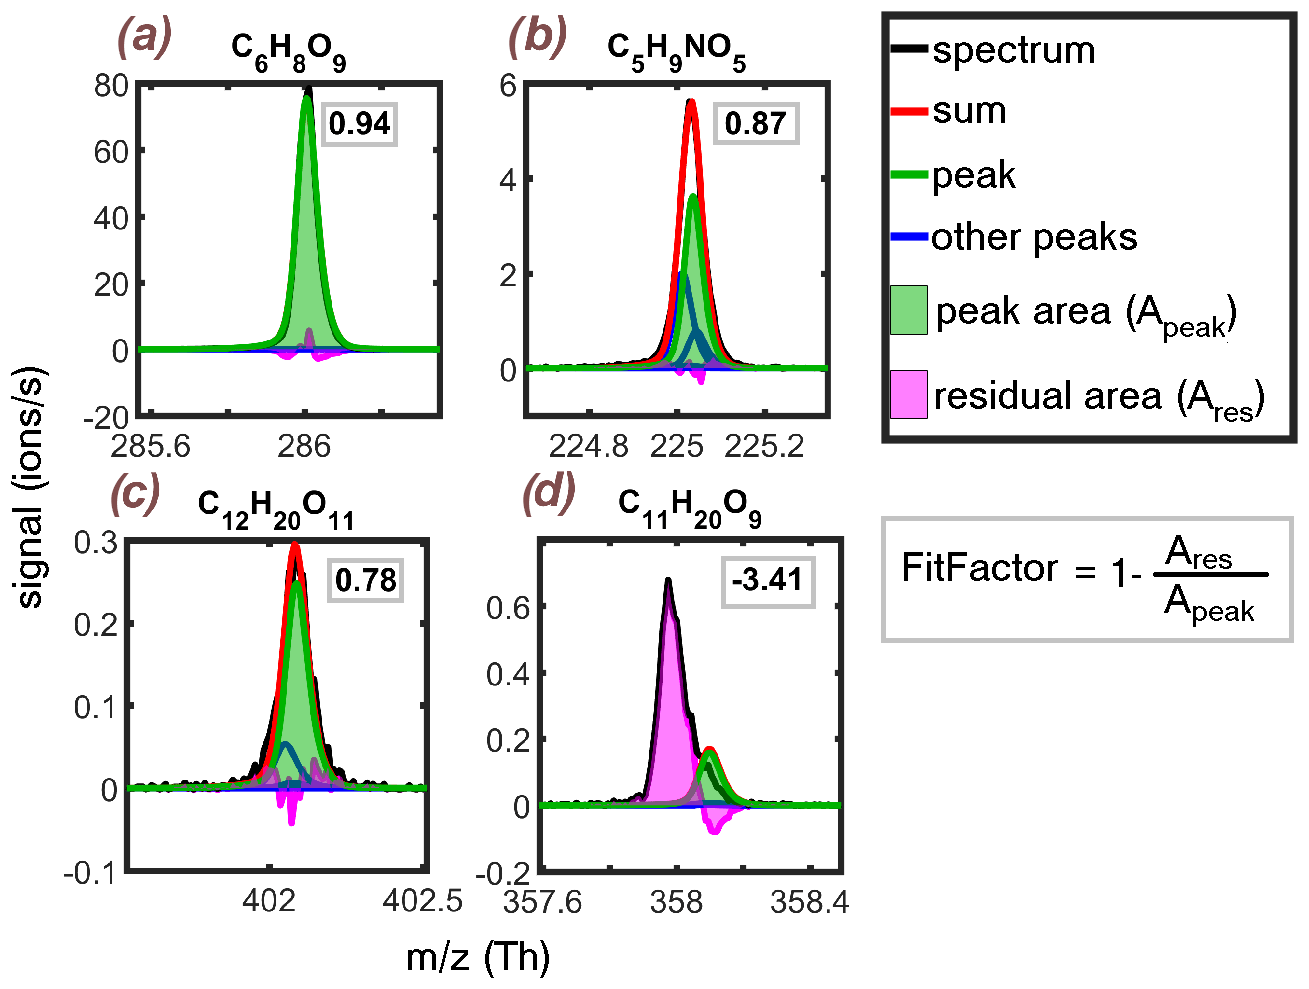
Figure A1Examples of determining the FitFactor from the residual-to-peak ratio of four different compounds. The title compounds are indicated by green lines and shading. The FitFactor value for each is shown in the upper right corner of the subplots. (a) A good fit results in a FitFactor close to 1. (b) Accurate determination of the fit quality is tricky when this many compounds and/or isotopes are fitted to the same spectral peak. Automatic fitting can artificially produce a good sum fit, which translates into a good FitFactor, but single compound fits may lack credibility. (c) The two fitted peaks match the spectra relatively well, resulting in a reasonably good FitFactor for the bigger peak. (d) A very poor fit results in low or even negative FitFactor.
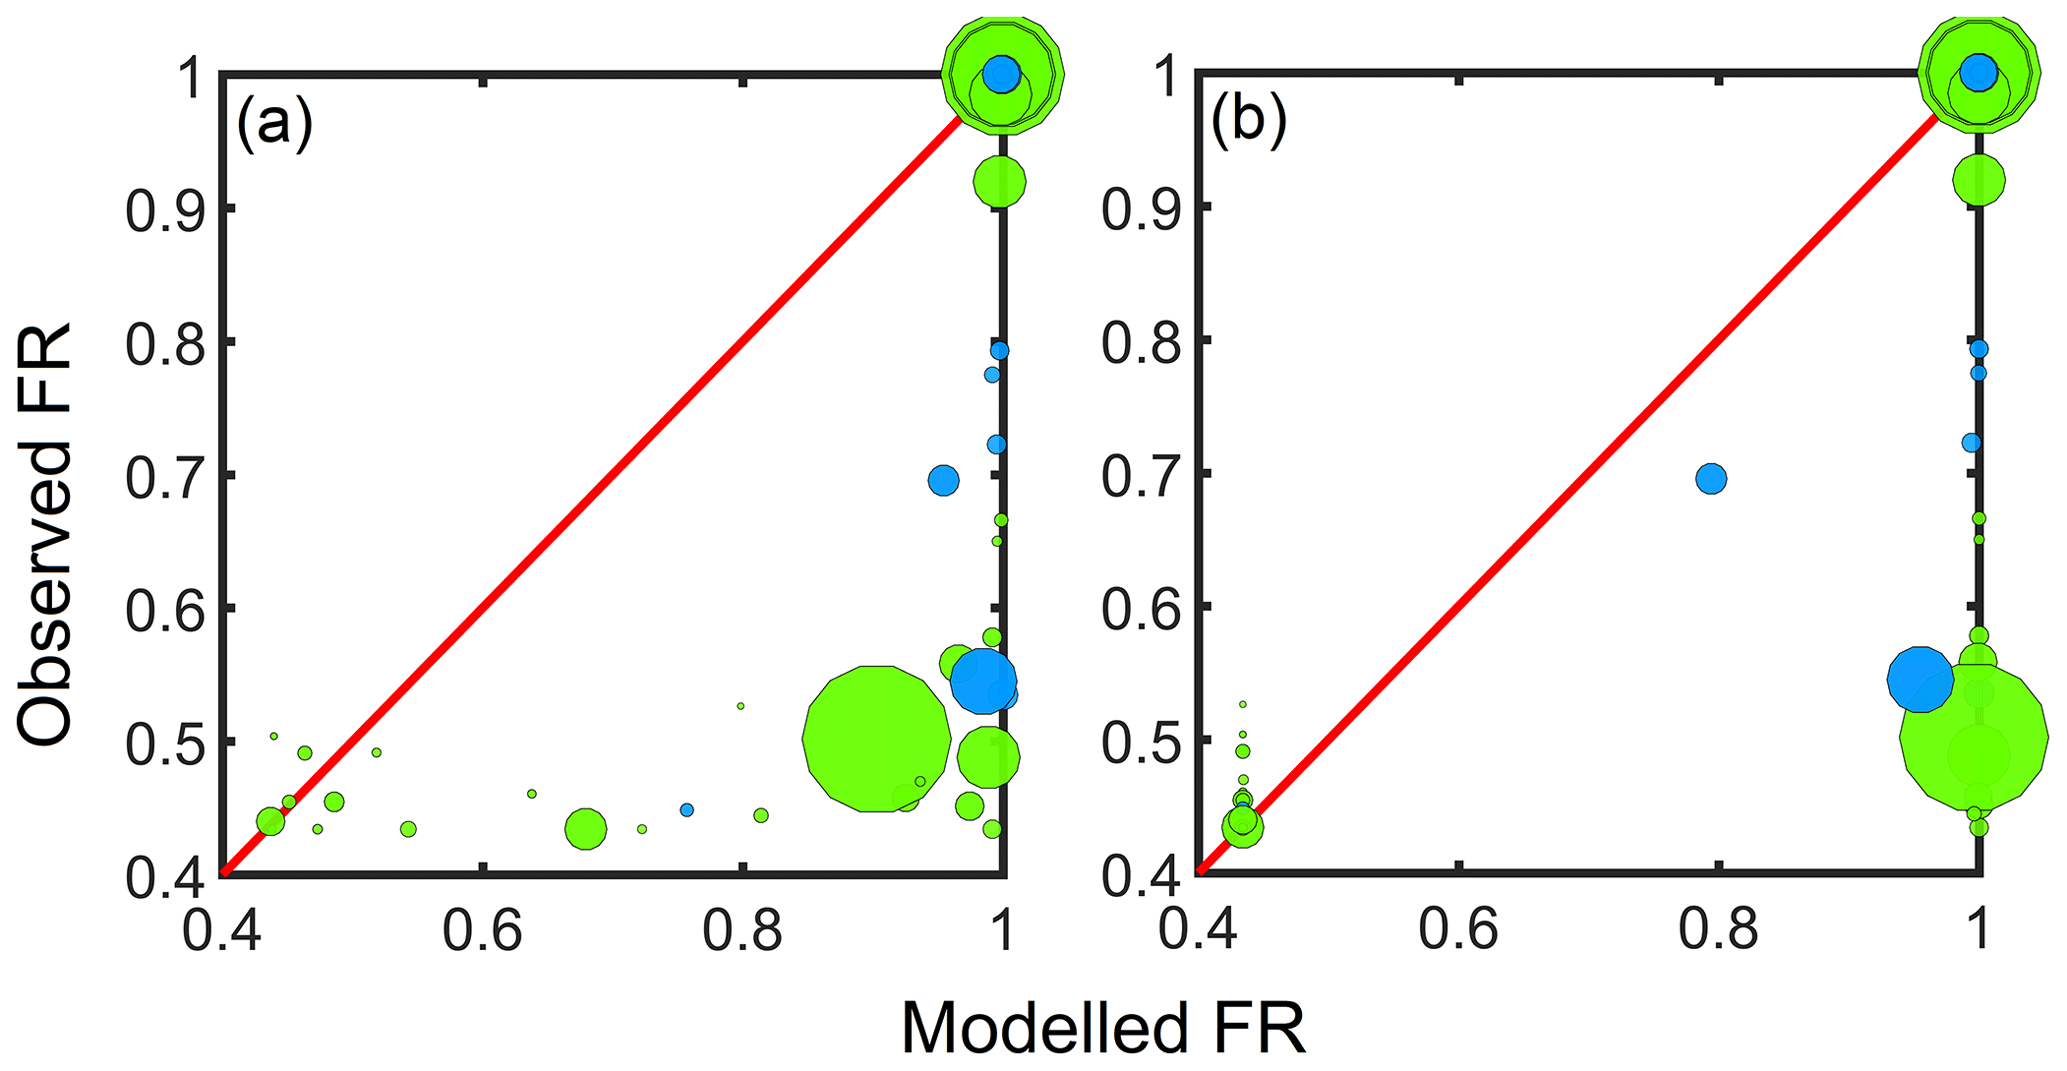
Figure B1Similar to Fig. 6 except here the observed fraction remaining (FR) is plotted against the FR modelled by (a) the Peräkylä et al. (2020) parameterisation and (b) the Bianchi et al. (2019) parameterisation.
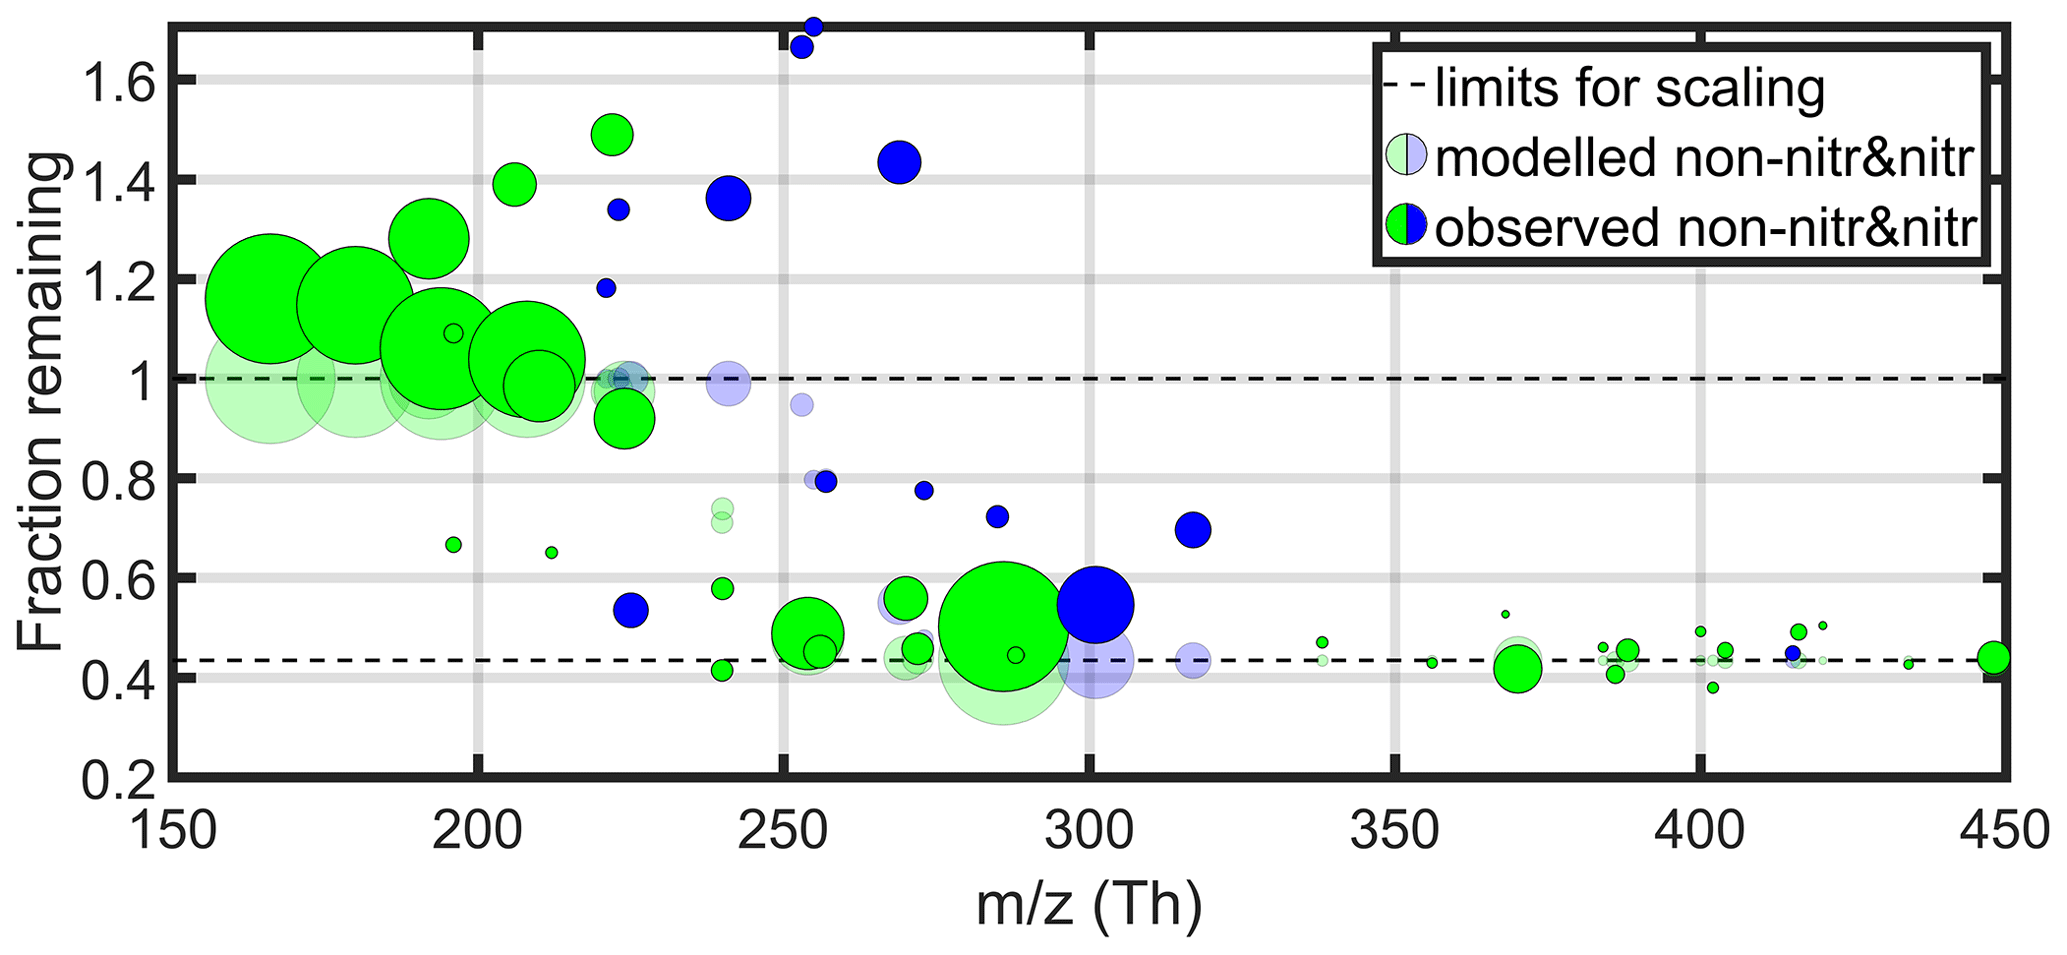
Figure B2Similar to Fig. 6 except here the Bianchi et al. (2019) model is modified to give a volatility of a hypothetical product with four more carbon atoms than in our observed products: .
Scripts used in the analysis are available from corresponding author Meri Räty upon reasonable request.
Data are available at https://doi.org/10.5281/zenodo.4001576 (Räty, 2021).
The study was conceived by ME, MRiv and MRis. The measurements were performed by MRiv, OG and LQ. MRä did the main data analysis and visualisation under the supervision of ME with additional guidance from OP and MRis. MRä wrote the article, and it was reviewed and commented on by the other authors.
The authors declare that they have no conflict of interest.
We thank Liine Heikkinen for assistance during the experiments, Pontus Roldin for helpful discussion and the tofTools team for providing tools for mass spectrometry data analysis.
This research has been supported by the King Abdullah University of Science and Technology (grant no. OSR-2016-CRG5-3022), the European Research Council (grant no. 638703-COALA) and the Academy of Finland (grant nos. 307331, 317380, 320094 and 326948).
Open-access funding was provided by the Helsinki University Library.
This paper was edited by Manabu Shiraiwa and reviewed by two anonymous referees.
Aalto, P., Hämeri, K., Becker, E., Weber, R., Salm, J., Mäkelä, J., Hoell, C., O'Dowd, C., Karlsson, H., Hansson, H., Väkevä, M., Koponen, I., Buzorius, G., and Kulmala, M.: Physical characterization of aerosol particles during nucleation events, Tellus B, 53, 344–358, https://doi.org/10.1034/j.1600-0889.2001.530403.x, 2001. a
Aiken, A. C., Decarlo, P. F., Kroll, J. H., Worsnop, D. R., Huffman, J. A., Docherty, K. S., Ulbrich, I. M., Mohr, C., Kimmel, J. R., Sueper, D., Sun, Y., Zhang, Q., Trimborn, A., Northway, M., Ziemann, P. J., Canagaratna, M. R., Onasch, T. B., Alfarra, M. R., Prevot, A. S. H., Dommen, J., Duplissy, J., Metzger, A., Baltensperger, U., and Jimenez, J. L.: O C and OM OC ratios of primary, secondary, and ambient organic aerosols with high-resolution time-of-flight aerosol mass spectrometry, Environ. Sci. Technol., 42, 4478–4485, https://doi.org/10.1021/es703009q, 2008. a
Berndt, T., Richters, S., Kaethner, R., Voigtländer, J., Stratmann, F., Sipilä, M., Kulmala, M., and Herrmann, H.: Gas-Phase Ozonolysis of Cycloalkenes: Formation of Highly Oxidized RO2 Radicals and Their Reactions with NO, NO2, SO2, and Other RO2 Radicals, J. Phys. Chem. A, 119, 10336–10348, https://doi.org/10.1021/acs.jpca.5b07295, 2015. a, b, c, d
Berndt, T., Scholz, W., Mentler, B., Fischer, L., Herrmann, H., Kulmala, M., and Hansel, A.: Accretion Product Formation from Self- and Cross-Reactions of RO2 Radicals in the Atmosphere, Angew. Chem. Int. Edn., 57, 3820–3824, https://doi.org/10.1002/anie.201710989, 2018. a
Bianchi, F., Kurtén, T., Riva, M., Mohr, C., Rissanen, M. P., Roldin, P., Berndt, T., Crounse, J. D., Wennberg, P. O., Mentel, T. F., Wildt, J., Junninen, H., Jokinen, T., Kulmala, M., Worsnop, D. R., Thornton, J. A., Donahue, N., Kjærgaard, H. G., and Ehn, M.: Highly Oxygenated Organic Molecules (HOM) from Gas-Phase Autoxidation Involving Peroxy Radicals: A Key Contributor to Atmospheric Aerosol, Chem. Rev., 119, 3472–3509, https://doi.org/10.1021/acs.chemrev.8b00395, 2019. a, b, c, d, e, f, g, h, i, j, k, l, m, n, o, p, q, r
Chuong, B., Zhang, J., and Donahue, N.: Cycloalkene ozonolysis: Collisionally mediated mechanistic branching, J. Am. Chem. Soc., 126, 12363–12373, https://doi.org/10.1021/ja0485412, 2004. a, b
Crounse, J. D., Nielsen, L. B., Jørgensen, S., Kjærgaard, H. G., and Wennberg, P. O.: Autoxidation of Organic Compounds in the Atmosphere, J. Phys. Chem. Lett., 4, 3513–3520, https://doi.org/10.1021/jz4019207, 2013. a
Cubison, M. J. and Jimenez, J. L.: Statistical precision of the intensities retrieved from constrained fitting of overlapping peaks in high-resolution mass spectra, Atmos. Meas. Tech., 8, 2333–2345, https://doi.org/10.5194/amt-8-2333-2015, 2015. a
Donahue, N. M., Epstein, S. A., Pandis, S. N., and Robinson, A. L.: A two-dimensional volatility basis set: 1. organic-aerosol mixing thermodynamics, Atmos. Chem. Phys., 11, 3303–3318, https://doi.org/10.5194/acp-11-3303-2011, 2011. a
Donahue, N. M., Kroll, J. H., Pandis, S. N., and Robinson, A. L.: A two-dimensional volatility basis set – Part 2: Diagnostics of organic-aerosol evolution, Atmos. Chem. Phys., 12, 615–634, https://doi.org/10.5194/acp-12-615-2012, 2012. a
Donahue, N. M., Ortega, I. K., Chuang, W., Riipinen, I., Riccobono, F., Schobesberger, S., Dommen, J., Baltensperger, U., Kulmala, M., Worsnop, D. R., and Vehkamäki, H.: How do organic vapors contribute to new-particle formation?, Faraday Discuss., 165, 91–104, https://doi.org/10.1039/c3fd00046j, 2013. a
Ehn, M., Thornton, J. A., Kleist, E., Sipilä, M., Junninen, H., Pullinen, I., Springer, M., Rubach, F., Tillmann, R., Lee, B., Lopez-Hilfiker, F., Andres, S., Acir, I.-H., Rissanen, M., Jokinen, T., Schobesberger, S., Kangasluoma, J., Kontkanen, J., Nieminen, T., Kurtén, T., Nielsen, L. B., Jørgensen, S., Kjærgaard, H. G., Canagaratna, M., Maso, M. D., Berndt, T., Petäjä, T., Wahner, A., Kerminen, V.-M., Kulmala, M., Worsnop, D. R., Wildt, J., and Mentel, T. F.: A large source of low-volatility secondary organic aerosol, Nature, 506, 476–479, https://doi.org/10.1038/nature13032, 2014. a, b, c, d
Hyttinen, N., Kupiainen-Määttä, O., Rissanen, M. P., Muuronen, M., Ehn, M., and Kurtén, T.: Modeling the Charging of Highly Oxidized Cyclohexene Ozonolysis Products Using Nitrate-Based Chemical Ionization, J. Phys. Chem. A, 119, 6339–6345, https://doi.org/10.1021/acs.jpca.5b01818, 2015. a, b
Hyttinen, N., Knap, H. C., Rissanen, M. P., Jørgensen, S., Kjærgaard, H. G., and Kurtén, T.: Unimolecular HO2 Loss from Peroxy Radicals Formed in Autoxidation Is Unlikely under Atmospheric Conditions, J. Phys. Chem. A, 120, 3588–3595, https://doi.org/10.1021/acs.jpca.6b02281, 2016. a
Jimenez, J. L., Canagaratna, M. R., Donahue, N. M., Prevot, A. S. H., Zhang, Q., Kroll, J. H., DeCarlo, P. F., Allan, J. D., Coe, H., Ng, N. L., Aiken, A. C., Docherty, K. S., Ulbrich, I. M., Grieshop, A. P., Robinson, A. L., Duplissy, J., Smith, J. D., Wilson, K. R., Lanz, V. A., Hueglin, C., Sun, Y. L., Tian, J., Laaksonen, A., Raatikainen, T., Rautiainen, J., Vaattovaara, P., Ehn, M., Kulmala, M., Tomlinson, J. M., Collins, D. R., Cubison, M. J., Dunlea, E. J., Huffman, J. A., Onasch, T. B., Alfarra, M. R., Williams, P. I., Bower, K., Kondo, Y., Schneider, J., Drewnick, F., Borrmann, S., Weimer, S., Demerjian, K., Salcedo, D., Cottrell, L., Griffin, R., Takami, A., Miyoshi, T., Hatakeyama, S., Shimono, A., Sun, J. Y., Zhang, Y. M., Dzepina, K., Kimmel, J. R., Sueper, D., Jayne, J. T., Herndon, S. C., Trimborn, A. M., Williams, L. R., Wood, E. C., Middlebrook, A. M., Kolb, C. E., Baltensperger, U., and Worsnop, D. R.: Evolution of Organic Aerosols in the Atmosphere, Science, 326, 1525–1529, https://doi.org/10.1126/science.1180353, 2009. a
Jokinen, T., Sipilä, M., Junninen, H., Ehn, M., Lönn, G., Hakala, J., Petäjä, T., Mauldin III, R. L., Kulmala, M., and Worsnop, D. R.: Atmospheric sulphuric acid and neutral cluster measurements using CI-APi-TOF, Atmos. Chem. Phys., 12, 4117–4125, https://doi.org/10.5194/acp-12-4117-2012, 2012. a, b
Jokinen, T., Berndt, T., Makkonen, R., Kerminen, V.-M., Junninen, H., Paasonen, P., Stratmann, F., Herrmann, H., Guenther, A. B., Worsnop, D. R., Kulmala, M., Ehn, M., and Sipilä, M.: Production of extremely low volatile organic compounds from biogenic emissions: Measured yields and atmospheric implications, P. Natl. Aca. Sci. USA, 112, 7123–7128, https://doi.org/10.1073/pnas.1423977112, 2015. a, b, c
Jokinen, T., Kontkanen, J., Lehtipalo, K., Manninen, H. E., Aalto, J., Porcar-Castell, A., Garmash, O., Nieminen, T., Ehn, M., Kangasluoma, J., Junninen, H., Levula, J., Duplissy, J., Ahonen, L. R., Rantala, P., Heikkinen, L., Yan, C., Sipilä, M., Worsnop, D. R., Bäck, J., Petäjä, T., Kerminen, V.-M., and Kulmala, M.: Solar eclipse demonstrating the importance of photochemistry in new particle formation, Sci. Rep., 7, 45707, https://doi.org/10.1038/srep45707, 2017. a
Junninen, H., Ehn, M., Petäjä, T., Luosujärvi, L., Kotiaho, T., Kostiainen, R., Rohner, U., Gonin, M., Fuhrer, K., Kulmala, M., and Worsnop, D. R.: A high-resolution mass spectrometer to measure atmospheric ion composition, Atmos. Meas. Tech., 3, 1039–1053, https://doi.org/10.5194/amt-3-1039-2010, 2010. a, b
Kroll, J. H. and Seinfeld, J. H.: Chemistry of secondary organic aerosol: Formation and evolution of low-volatility organics in the atmosphere, Atmos. Environ., 42, 3593–3624, https://doi.org/10.1016/j.atmosenv.2008.01.003, 2008. a, b, c
Kurtén, T., Tiusanen, K., Roldin, P., Rissanen, M., Luy, J.-N., Boy, M., Ehn, M., and Donahue, N. M.: Alpha-Pinene Autoxidation Products May Not Have Extremely Low Saturation Vapor Pressures Despite High O : C Ratios, J. Phys. Chem. A, 120, 2569–2582, https://doi.org/10.1021/acs.jpca.6b02196, 2016. a, b
Laothawornkitkul, J., Taylor, J. E., Paul, N. D., and Hewitt, C. N.: Biogenic volatile organic compounds in the Earth system, New Phytologist, 183, 27–51, 2009. a
Maso, M. D., Kulmala, M., Riipinen, I., Wagner, R., Hussein, T., Aalto, P., and Lehtinen, K.: Formation and growth of fresh atmospheric aerosols: eight years of aerosol size distribution data from SMEAR II, Hyytiälä, Finland, Boreal Environ. Res., 10, 323–336, 2005. a
Mereau, R., Rayez, M., Rayez, J., Caralp, F., and Lesclaux, R.: Theoretical study on the atmospheric fate of carbonyl radicals: kinetics of decomposition reactions, Phys. Chem. Chem. Phys., 3, 4712–4717, https://doi.org/10.1039/b105824j, 2001. a
Orlando, J. J. and Tyndall, G. S.: Laboratory studies of organic peroxy radical chemistry: an overview with emphasis on recent issues of atmospheric significance, Chem. Soc. Rev., 41, 6294–6317, https://doi.org/10.1039/c2cs35166h, 2012. a, b, c
Pankow, J. F. and Asher, W. E.: SIMPOL.1: a simple group contribution method for predicting vapor pressures and enthalpies of vaporization of multifunctional organic compounds, Atmos. Chem. Phys., 8, 2773–2796, https://doi.org/10.5194/acp-8-2773-2008, 2008. a, b
Peräkylä, O., Riva, M., Heikkinen, L., Quéléver, L., Roldin, P., and Ehn, M.: Experimental investigation into the volatilities of highly oxygenated organic molecules (HOMs) , Atmos. Chem. Phys., 20, 649–669, https://doi.org/10.5194/acp-20-649-2020, 2020. a, b, c, d, e, f, g, h, i, j, k, l, m, n, o, p, q, r, s, t, u, v
Räty, M.: Data for “Measurement report: Effects of NOx and seed aerosol on highly oxygenated organic molecules (HOM) from cyclohexene ozonolysis”, Data set, Zenodo, https://doi.org/10.5281/zenodo.4001577, 2021. a
Rissanen, M. P.: NO2 Suppression of Autoxidation-Inhibition of Gas-Phase Highly Oxidized Dimer Product Formation, Acs Earth Space Chem., 2, 1211–1219, https://doi.org/10.1021/acsearthspacechem.8b00123, 2018. a, b, c
Rissanen, M. P., Kurtén, T., Sipilä, M., Thornton, J. A., Kangasluoma, J., Sarnela, N., Junninen, H., Jørgensen, S., Schallhart, S., Kajos, M. K., Taipale, R., Springer, M., Mentel, T. F., Ruuskanen, T., Petäjä, T., Worsnop, D. R., Kjærgaard, H. G., and Ehn, M.: The Formation of Highly Oxidized Multifunctional Products in the Ozonolysis of Cyclohexene, J. Am. Chem. Soc., 136, 15596–15606, https://doi.org/10.1021/ja507146s, 2014. a, b, c, d, e, f, g, h, i
Riva, M., Heikkinen, L., Bell, D. M., Peräkylä, O., Zha, Q., Schallhart, S., Rissanen, M. P., Imre, D., Petäjä, T., Thornton, J. A., Zelenyuk, A., and Ehn, M.: Chemical transformations in monoterpene-derived organic aerosol enhanced by inorganic composition, npj Clim. Atmos. Sci., 2, 2, https://doi.org/10.1038/s41612-018-0058-0, 2019a. a
Riva, M., Rantala, P., Krechmer, J. E., Peräkylä, O., Zhang, Y., Heikkinen, L., Garmash, O., Yan, C., Kulmala, M., Worsnop, D., and Ehn, M.: Evaluating the performance of five different chemical ionization techniques for detecting gaseous oxygenated organic species, Atmos. Meas. Tech., 12, 2403–2421, https://doi.org/10.5194/amt-12-2403-2019, 2019b. a
Roldin, P., Eriksson, A. C., Nordin, E. Z., Hermansson, E., Mogensen, D., Rusanen, A., Boy, M., Swietlicki, E., Svenningsson, B., Zelenyuk, A., and Pagels, J.: Modelling non-equilibrium secondary organic aerosol formation and evaporation with the aerosol dynamics, gas- and particle-phase chemistry kinetic multilayer model ADCHAM, Atmos. Chem. Phys., 14, 7953–7993, https://doi.org/10.5194/acp-14-7953-2014, 2014. a
Shallcross, D., Raventos-Duran, M., Bardwell, M., Bacak, A., Solman, Z., and Percival, C.: A semi-empirical correlation for the rate coefficients for cross- and self-reactions of peroxy radicals in the gas-phase, Atmos. Environ., 39, 763–771, https://doi.org/10.1016/j.atmosenv.2004.09.072, 2005. a
Shrivastava, M., Cappa, C. D., Fan, J., Goldstein, A. H., Guenther, A. B., Jimenez, J. L., Kuang, C., Laskin, A., Martin, S. T., Ng, N. L., Petäjä, T., Pierce, J. R., Rasch, P. J., Roldin, P., Seinfeld, J. H., Shilling, J., Smith, J. N., Thornton, J. A., Volkamer, R., Wang, J., Worsnop, D. R., Zaveri, R. A., Zelenyuk, A., and Zhang, Q.: Recent advances in understanding secondary organic aerosol: Implications for global climate forcing, Rev. Geophys., 55, 509–559, https://doi.org/10.1002/2016RG000540, 2017. a
Spanke, J., Rannik, U., Forkel, R., Nigge, W., and Hoffmann, T.: Emission fluxes and atmospheric degradation of monoterpenes above a boreal forest: field measurements and modelling, Tellus B, 53, 406–422, https://doi.org/10.1034/j.1600-0889.2001.d01-29.x, 2001. a
Tunved, P., Hansson, H., Kerminen, V., Strom, J., Maso, M. D., Lihavainen, H., Viisanen, Y., Aalto, P., Komppula, M., and Kulmala, M.: High natural aerosol loading over boreal forests, Science, 312, 261–263, https://doi.org/10.1126/science.1123052, 2006. a
Yan, C., Nie, W., Äijälä, M., Rissanen, M. P., Canagaratna, M. R., Massoli, P., Junninen, H., Jokinen, T., Sarnela, N., Häme, S. A. K., Schobesberger, S., Canonaco, F., Yao, L., Prévôt, A. S. H., Petäjä, T., Kulmala, M., Sipilä, M., Worsnop, D. R., and Ehn, M.: Source characterization of highly oxidized multifunctional compounds in a boreal forest environment using positive matrix factorization, Atmos. Chem. Phys., 16, 12715–12731, https://doi.org/10.5194/acp-16-12715-2016, 2016. a, b
Zha, Q., Yan, C., Junninen, H., Riva, M., Sarnela, N., Aalto, J., Quéléver, L., Schallhart, S., Dada, L., Heikkinen, L., Peräkylä, O., Zou, J., Rose, C., Wang, Y., Mammarella, I., Katul, G., Vesala, T., Worsnop, D. R., Kulmala, M., Petäjä, T., Bianchi, F., and Ehn, M.: Vertical characterization of highly oxygenated molecules (HOMs) below and above a boreal forest canopy, Atmos. Chem. Phys., 18, 17437–17450, https://doi.org/10.5194/acp-18-17437-2018, 2018. a
Zhang, X., McVay, R. C., Huang, D. D., Dalleska, N. F., Aumont, B., Flagan, R. C., and Seinfeld, J. H.: Formation and evolution of molecular products in alpha-pinene secondary organic aerosol, P. Natl. Acad. Sci. USA, 112, 14168–14173, https://doi.org/10.1073/pnas.1517742112, 2015. a, b
Zhang, Y., Peräkylä, O., Yan, C., Heikkinen, L., Äijälä, M., Daellenbach, K. R., Zha, Q., Riva, M., Garmash, O., Junninen, H., Paatero, P., Worsnop, D., and Ehn, M.: A novel approach for simple statistical analysis of high-resolution mass spectra, Atmos. Meas. Tech., 12, 3761–3776, https://doi.org/10.5194/amt-12-3761-2019, 2019. a
Zhang, Y., Peräkylä, O., Yan, C., Heikkinen, L., Äijälä, M., Daellenbach, K. R., Zha, Q., Riva, M., Garmash, O., Junninen, H., Paatero, P., Worsnop, D., and Ehn, M.: Insights into atmospheric oxidation processes by performing factor analyses on subranges of mass spectra, Atmos. Chem. Phys., 20, 5945–5961, https://doi.org/10.5194/acp-20-5945-2020, 2020. a, b
- Abstract
- Introduction
- Methods
- Results and discussion
- Conclusions
- Appendix A: Supporting material for Methods section
- Appendix B: Supporting material for Results section
- Code availability
- Data availability
- Author contributions
- Competing interests
- Acknowledgements
- Financial support
- Review statement
- References