the Creative Commons Attribution 4.0 License.
the Creative Commons Attribution 4.0 License.
 | 12 May 2021
Measurement report: Fourteen months of real-time characterisation of the submicronic aerosol and its atmospheric dynamics at the Marseille–Longchamp supersite
Benjamin Chazeau
Brice Temime-Roussel
Grégory Gille
Boualem Mesbah
Barbara D'Anna
Henri Wortham
Nicolas Marchand
This study reports results of PM1 chemical composition determined using a Time-of-Flight Aerosol Chemical Speciation Monitor (ToF-ACSM) over a 14-month period (1 February 2017–13 April 2018) at the Marseille–Longchamp supersite (MRS-LCP) in France. Parallel measurements were performed with an aethalometer, an ultrafine particle monitor and a suite of instruments to monitor regulated pollutants (PM2.5, PM10, NOx, O3 and SO2). The average PM1 chemical composition over the period was dominated by organic aerosol (OA; 49.7 %) and black carbon (BC; 17.1 %), while sulfate accounted for 14.6 %, nitrate for 10.2 %, ammonium for 7.9 % and chloride for 0.5 % only. Wintertime was found to be the season contributing the most to the annual PM1 mass concentration (30 %), followed by autumn (26 %), summer (24 %) and spring (20 %). During this season, OA and BC concentrations were found to contribute 32 % and 31 % of their annual concentrations, respectively, as a combined result of heavy urban traffic, high emissions from residential heating and low planetary boundary layer (PBL) height. Most (75 %) of the 15 days exceeding the target daily PM2.5 concentration value recommended by the World Health Organization (WHO) occurred during this season. Local and long-range pollution episodes with contrasting chemical composition could be distinguished, accounting for 40 % and 60 % of the exceedance days, respectively. Enhanced OA and BC concentrations, mostly originating from domestic wood burning under nocturnal land breeze conditions, were observed during local pollution episodes, while high levels of oxygenated OA and inorganic nitrate were associated with medium-/long-range transported particles.
In summertime, substantially higher concentrations of sulfate were found, with an average and a maximum contribution to the PM1 mass of 24 % and 66 %, respectively. Results from k-means clustering analysis of daily profiles of sulfate concentrations clearly reveal the significant influence of local harbour/industrial activities on air quality in addition to the more regional contribution of shipping traffic that originates from the Mediterranean basin.
- Article
(16194 KB) - Full-text XML
-
Supplement
(2545 KB) - BibTeX
- EndNote


A major societal concern in European Union (EU) countries is related to air quality as it is nowadays recognised as the first sanitary risk of environmental origin. The exposure to fine particles causes premature mortality in European cities according to the report from the Environmental European Agency (EEA, 2019). Recent models predict that premature deaths would reach 380 000 per year and could even increase up to 500 000 by 2050 (Lelieveld et al., 2015). In France, according to a recent study, 48 000 premature deaths per year are linked to fine particles, representing the third-highest cause of mortality behind alcohol and tobacco (Pascal et al., 2016). Regarding annual safety threshold recommendations for both PM10 (20 µg m−3) and PM2.5 (10 µg m−3) addressed by the World Health Organization (WHO, 2006), most European countries still exceed the limit values (48 % and 68 % of air quality monitoring stations, respectively). In southern France, 85 % of the population lives in areas exceeding the WHO recommendations for particle matter (Rouaud and Channac, 2019). Even though it is well recognised that smaller particles may cause more damage to human health than PM10 (Kreyling et al., 2006), an air quality standard for PM1 has still not been set up in France. Therefore, it appears important to focus on this specific size fraction, and extensive studies on high polluted episodes are needed. They are directly linked to several features such as chemical composition, physical properties of fine particles, proximity of anthropogenic activities and meteorological conditions. Moreover, Pandolfi et al. (2020) showed that long-range sources could affect local urban pollution as more than 60 % of PM in five European urban sites was of regional and continental origins.
In the last 15 years, aerosol mass spectrometer (AMS) technology dedicated to the real-time analysis of the submicron aerosol chemical composition (Canagaratna et al., 2007; Jayne et al., 2000) has been widely used to investigate the emissions and transformation processes of aerosol chemical species. Unfortunately, most of the studies are limited to short-term campaign measurements, hindering our understanding of aerosol chemical composition over long temporal scales. The recently developed Aerodyne Aerosol Chemical Speciation Monitor (ACSM) is more robust and easily deployed for long-term monitoring of submicron aerosol chemical composition (Fröhlich et al., 2013; Ng et al., 2011), even if the ability to measure particle size distribution is no longer available and the poor resolution of ACSM mass spectra does not allow high-resolution peak fitting (Timonen et al., 2016).
Studies of several months' duration using AMS were previously conducted in Europe: Melpitz (3 months; Poulain et al., 2011), Puy-de-Dôme (5 months; Freney et al., 2011), London (1 year; Young et al., 2015) and Mace Head (3 years; Ovadnevaite et al., 2014). In recent years ACSM studies were performed for yearly trends in remote/regional sites such as Jungfraujoch (14 months; Fröhlich et al., 2015), Montseny (1 year; Minguillón et al., 2015), Ispra (1 year; Bressi et al., 2016) or Aukstaitija in Lithuania (9 months; Pauraite et al., 2019). Similarly yearly and seasonal investigations were also carried out in large European cities at urban background scale in Paris (2 years; Petit et al., 2015), Zurich (1 year; Canonaco et al., 2015), Helsinki (4 months; Aurela et al., 2015), London (10 months; Reyes-Villegas et al., 2016) and Athens (1 year; Stavroulas et al., 2019).
The Mediterranean city of Marseille, as a highly urbanised area, exposed to a variety of anthropic (traffic, residential heating, shipping, industries) and biogenic (terrestrial vegetation, marine aerosols) sources, is a challenging area for fine-particle studies. The ESCOMPTE experiment (2001) demonstrated that the topography and the air mass circulation, characterised by local and mesoscale winds, drive the pollution levels in the city (Cachier et al., 2005; Drobinski et al., 2007; Mestayer et al., 2005; Puygrenier et al., 2005). High levels of atmospheric pollutants such as fine particles have often been observed in Marseille, where mortality rate and cardiovascular hospital admissions are significantly elevated, even higher than in Paris, whose population is 6 times higher (Pascal et al., 2013).
Fine particles have been previously characterised in Marseille during an intensive field campaign (3 weeks in summer 2008) (El Haddad et al., 2011a, b, 2013). The seasonal variations and sources of aerosol have been well documented through the offline analysis of daily filter samples collected over 1 year (Bozzetti et al., 2017; Salameh et al., 2015, 2018), but this methodology only gives poor temporal resolution compared to online instruments and therefore cannot capture the fast changes in concentration and chemical composition.
In this context a new atmospheric urban background supersite dedicated to the long-term and real-time chemical and physical characterisation of submicron aerosol was recently implemented in Marseille. This supersite gathers state-of-the-art instruments for the measurement of aerosols (chemical composition and size distribution) and a suite of instruments for the monitoring of regulated pollutants (PM2.5, PM10, NOx, O3 and SO2). The goal of the present paper is to characterise the 14-month phenomenology of submicron aerosol in a coastal city. The seasonal variations, diurnal profiles, and geographical origins of PM1 are presented with a focus on local and long-range pollution episodes when PM exceedance days occur. Also, the chemical characteristics of shipping/industrial emissions in summer are explored through back-trajectory analysis.
2.1 Marseille supersite
The Marseille–Longchamp supersite (MRS-LCP) is in the downtown park “Longchamp” (43∘18′18.84′′ N; 5∘23′40.89′′ E; 71 m a.s.l.) of Marseille. This site, run by a joint effort between the Laboratory of Environmental Chemistry (LCE) and the French regional air quality network (AtmoSud, https://www.atmosud.org, last access: 5 May 2021), gathers a complete set of instruments for the measurement of both regulated and non-regulated pollutants (see Sect. 2.2). This infrastructure is intended to become a high-level research platform for monitoring air pollution and contributing to collaborative research programmes. It is classified as an urban background site based on the criteria used by the European Environment Agency (Larssen et al., 1999). Marseille is the second-most populated city in France, with more than 1.8 million inhabitants. The city also encounters the second-most traffic congestion in France (TOMTOM, 2020). The number of vehicle kilometres travelled was 2.4 billion within a 5 km radius around the supersite in 2017 (AtmoSud traffic database). Considering the relative road network size, it was 2.3 times higher than the largest city in the EU, London (Department for Transport, 2020). The city hosts the second-largest harbour of the Mediterranean Sea and the largest French harbour, with almost 4000 ships berthing in the several basins of Marseille for the year 2017 (based on port call statistics registered at the “Grand Port Maritime de Marseille”). At 40 km north-west of the city is located the large industrial complex of Fos-sur-mer with petroleum refining, shipbuilding, steel facilities, and coke production plants (El Haddad et al., 2011b; Salameh et al., 2018). The region is well known for active photochemistry, inducing high ozone concentrations (Flaounas et al., 2009) during summer periods and frequent secondary organic aerosol formation events (El Haddad et al., 2013). Air mass circulation is complex in the Marseille area (Drobinski et al., 2007; El Haddad et al., 2013; Flaounas et al., 2009) and is driven by the surrounding topography. The city is bordered by the Mediterranean Sea from the south-west and enclosed from the north, east and south by mountain ranges up to 700 m a.s.l. The synoptic air masses come from the Rhône Valley, the Atlantic Ocean and the Mediterranean Sea (Drobinski et al., 2007). Moreover, Marseille's air quality is often affected by two regional winds (mistral and south-easterly Mediterranean wind) and local sea–land breeze cycles. The mistral is a strong wind blowing from the north-west (300–360∘) along the lower Rhône River valley toward the Mediterranean Sea. South-easterly Mediterranean wind (105–135∘) blows at similar intensity from the sea toward the lands. The south-westerly sea breeze (210–270∘) and north-easterly land breeze (5–90∘) are local winds prevailing during weak mistral wind (Fig. S1). Land breeze circulation is often associated with high pollution levels over Marseille due to the low pollutant dispersion (El Haddad et al., 2013). In the early morning of summer days, Marseille is directly downwind of the industrial area and the harbour basins. As the temperature of the land surface rises, sea breeze sets in and the polluted air masses from the industrial area are transported over the Mediterranean Sea before reaching the city.
2.2 Instrumentation and data analysis
2.2.1 ACSM sampling and data corrections
Ambient submicron particles (NR-PM1) were measured continuously from 1 February 2017 to 13 April 2018 using a Time-of-Flight Aerosol Chemical Speciation Monitor (ToF-ACSM, Aerodyne Research Inc., USA). The instrument provides quantitative assessment of non-refractory species as organics, nitrate, sulfate, ammonium and chloride in the size range 40–1000 nm. The aerosol is sampled at the main inlet at a flow rate of 3 L min−1 and dried using a Nafion dryer system (Perma Pure, New Jersey, USA) to keep the relative humidity (RH) below 40 %. A subsample flow of 0.085 L min−1 passes through a critical orifice and enters an aerodynamic lens that focuses the particles into a narrow beam; these are then flash-vaporised upon impaction on a heated tungsten plate at 600 ∘C. The resulting vapours are ionised using 70 eV electron impact (EI) ionisation. The time-of-flight mass spectrometer (ETOF, TOFWERK, Thun, Switzerland) provides mass spectra at a mass-to-charge resolution of 600. The data were acquired at a time resolution of 15 min using Igor-DAQ v.2.1.4 software and by Tofware v.2.5.13 written in Igor Pro (Wavemetrics inc., Lake Oswego, Oregon, USA). Further description and detail of the instrument are presented by Fröhlich et al. (2013, 2015) and Timonen et al. (2016). Calibrations of ionisation efficiency (IE) of nitrate and relative ionisation efficiency (RIE) of ammonium and sulfate were repeated three times over the 14-month measurement period. The calculated values are summarised in Table S1. Table S2 lists the detection limits, calculated as 3 times the noise level, for the five quantified species. The collection efficiency (CE) values were corrected using algorithms described by Middlebrook et al. (2012); the composition-dependent CE is shown in Fig. S2. On average over the entire period, a composition-dependent CE of 0.47 ± 0.05 is obtained, which is comparable to values typically found for ambient aerosol (≈ 0.5, Middlebrook et al., 2012). An overall uncertainty of ±30 % is associated with the total mass concentrations. It includes the uncertainties in the IE, RIE and CE values (Bahreini et al., 2009).
The organic aerosol (OA) mass was corrected to account for measurement interferences. According to Pieber et al. (2016), ammonium nitrate induces an overestimation of OA at 44. A correction is introduced in the fragmentation table by measuring the relationship between measured CO and the NH4NO3 mass measured during ToF-ACSM calibrations (see Eq. S1). Our dataset showed very little contribution of NH4NO3 on the organic 44, with values ranging from 0.1 % to 0.5 % (Table S3).
The ion fragments at 30 and 46 assigned to nitrate (NO+ and NO) may contain interferences from organic species like CH2O+ at 30 and CH2O at 46. These interferences lead to an overestimation of UMR nitrate and can falsely suggest the presence of organic nitrate in high OA/NO environments. Here the 30 and 46 signals have been corrected for these interferences by using correlated organic signals, respectively, at 29 from CHO+ and 45 from CHO (Eq. S2), as recommended by Fry et al. (2018). These peaks were the closest organic signals to the nitrate peaks with organic interferences.
2.2.2 Collocated instruments
ACSM measurements were combined with several online collocated instruments. A dual-spot seven-wavelength AE33 aethalometer (Magee Scientific) (Drinovec et al., 2015) equipped with a PM2.5 cut-off inlet and a Nafion dryer operating at 5 L min−1 was used to measure equivalent black carbon (BC) concentrations at a 1 min time resolution. Equivalent black carbon concentrations were calculated from the absorption coefficient at 880 nm with the default mass absorption cross section (MAC) implemented in the AE33 (7.77 m2 g−1). The submicron aerosol number size distribution was investigated with the model 3031 ultrafine particle monitor (TSI Inc., Minnesota, USA) equipped with a PM10 cut-off inlet and a Nafion dryer and running at 16.7 L min−1 for the whole study period. This instrument provides measurements from 20 to 1000 nm, with six channels of size resolution. The aerosol number size distribution in the range 10.25–1084 nm was further explored over 45 channels using a Scanning Mobility Particle Sizer (SMPS, L-DMA, CPC5403, GRIMM) system for two periods: from 23 June to 12 August 2017 (summer period) and from 6 November 2017 to 11 January 2018 (winter period). The SMPS was connected to the ACSM sampling line under the dryer system with a bypass flow rate of 0.3 L min−1.
Offline measurements were carried out to collect particles (24 h PM1) onto pre-fired (during 24 h at 500 ∘C) 150 mm diameter quartz filters (Pall Gellman, TISSUQUARTZ) (08:00 to 08:00 UTC) using a high-volume sampler (Digitel DA-80) operating at a flow rate of 30 m3 h−1; 45 filters were discontinuously sampled from 1 March to 1 May 2017 (22 filters) and from 1 July to 23 September 2017 (23 filters). Major anions and cations (SO, NO, and NH) were analysed using ion chromatography (Sciare et al., 2008) after extraction of filter punches in ultra-pure water and following recommendations from the EN 16913 European standard. Elemental/organic content was analysed using a Sunset OC/EC analyser (EUSAAR2 thermal protocol) according to Cavalli et al. (2010).
Continuous measurements of SO2, NOx and O3, and PMx were carried out by the air quality monitoring station. A M100E UV fluorescence analyser, a M200E chemiluminescence analyser (Teledyne API, California, USA) and a Serinus 10 ozone analyser (Ecotech, Australia) were deployed for the SO2, NOx and O3 measurements, respectively. A continuous beta-attenuation continuous particulate monitor (BAM 1020, Met One Instruments Inc., Oregon, USA) was used to measure the mass concentrations of PM2.5 and PM10, and an optical particle counter (FIDAS 200, PALAS, Germany) has been used for the measurement of PM1, PM2.5 and PM10 since February 2018. Each sampler operated with a dedicated sampling line at a flow rate of 16.7 L min−1 for the BAM 1020 and 5 L min−1 for the FIDAS. Both instruments were equipped with a drying set-up (smart heater system for the BAM 1020, Intelligent Aerosol Drying System for the FIDAS).
The sampling inlets of all the instruments of the station were located at approximately 3 m above the ground. All the time resolutions of this instrumental panel were synchronised to 15 min, and time was UTC based.
2.3 Meteorological data and back-trajectory analysis
The site is equipped with a three-dimensional sonic anemometer to provide temperature and wind measurements (directions and speeds). Precipitations and relative humidity parameters were taken from the Vaudrans meteorological station located 6 km away from the MRS-LC site (43∘18′26′′ N; 5∘28′28′′ E). Non-parametric wind regression (NWR; Henry et al., 2009) and sustained wind incidence method-2 (SWIM-2; Olson et al., 2012) algorithms were used to examine the geographical origin of pollutants. NWR and SWIM-2 analyses were performed using the ZeFir toolkit (Petit et al., 2017a). SWIM-2 analysis can be preferred over standard NWR analysis in specific cases when rapid changes in wind direction occur, as it includes a down-weighting function related to the standard deviation of the wind direction (Petit et al., 2017a). To investigate air mass origin during specific pollution episodes, 72 h back trajectories were calculated every hour from the PC-based version of HYSPLIT (Draxler et al., 1999) with weekly 1∘ Global Data Assimilation System (GDAS) meteorological field data. Back trajectories were set to end at MRS-LCP coordinates (43∘18′18.84′′ N, 5∘23′40.89′′ E; 64 m a.g.l.). Planetary boundary layer (PBL) height data were directly extracted from the GDAS files with HYSPLIT. Finally, a concentration-weighted trajectory (CWT) was performed with ZeFir to investigate the locations most frequently associated with elevated concentrations. CWT approach relates pollutant concentrations measured at a receptor site (MRS-LCP) to back trajectories and displays the localisation of air masses associated with high concentrations at the site (Ashbaugh et al., 1985; Petit et al., 2017b). For this study, the CWT domain was set in the range of (40–46∘ N; −5–10∘ E) with the grid cell size of 0.05∘ × 0.05∘.
3.1 Air quality overview
Figure 1 shows the annual average concentrations of regulated pollutants (NO2, O3, SO2, PM10, PM2.5) measured over 11 years (2008–2018) at the MRS-LCP station and the corresponding number of days exceeding the daily WHO guidelines during the period of the present study (2017–2018). Based on the Theil–Sen approach, the annual concentrations of NO2, PM10, and PM2.5 have decreased at yearly rates of −0.58, −0.40, and −0.57 µg m−3 since 2010, in a comparable way to that observed in urban sites within Europe (EEA, 2020). These trends can be related to the parallel reduction in air pollutant emissions resulting from the EU policies that have been continuously implemented.
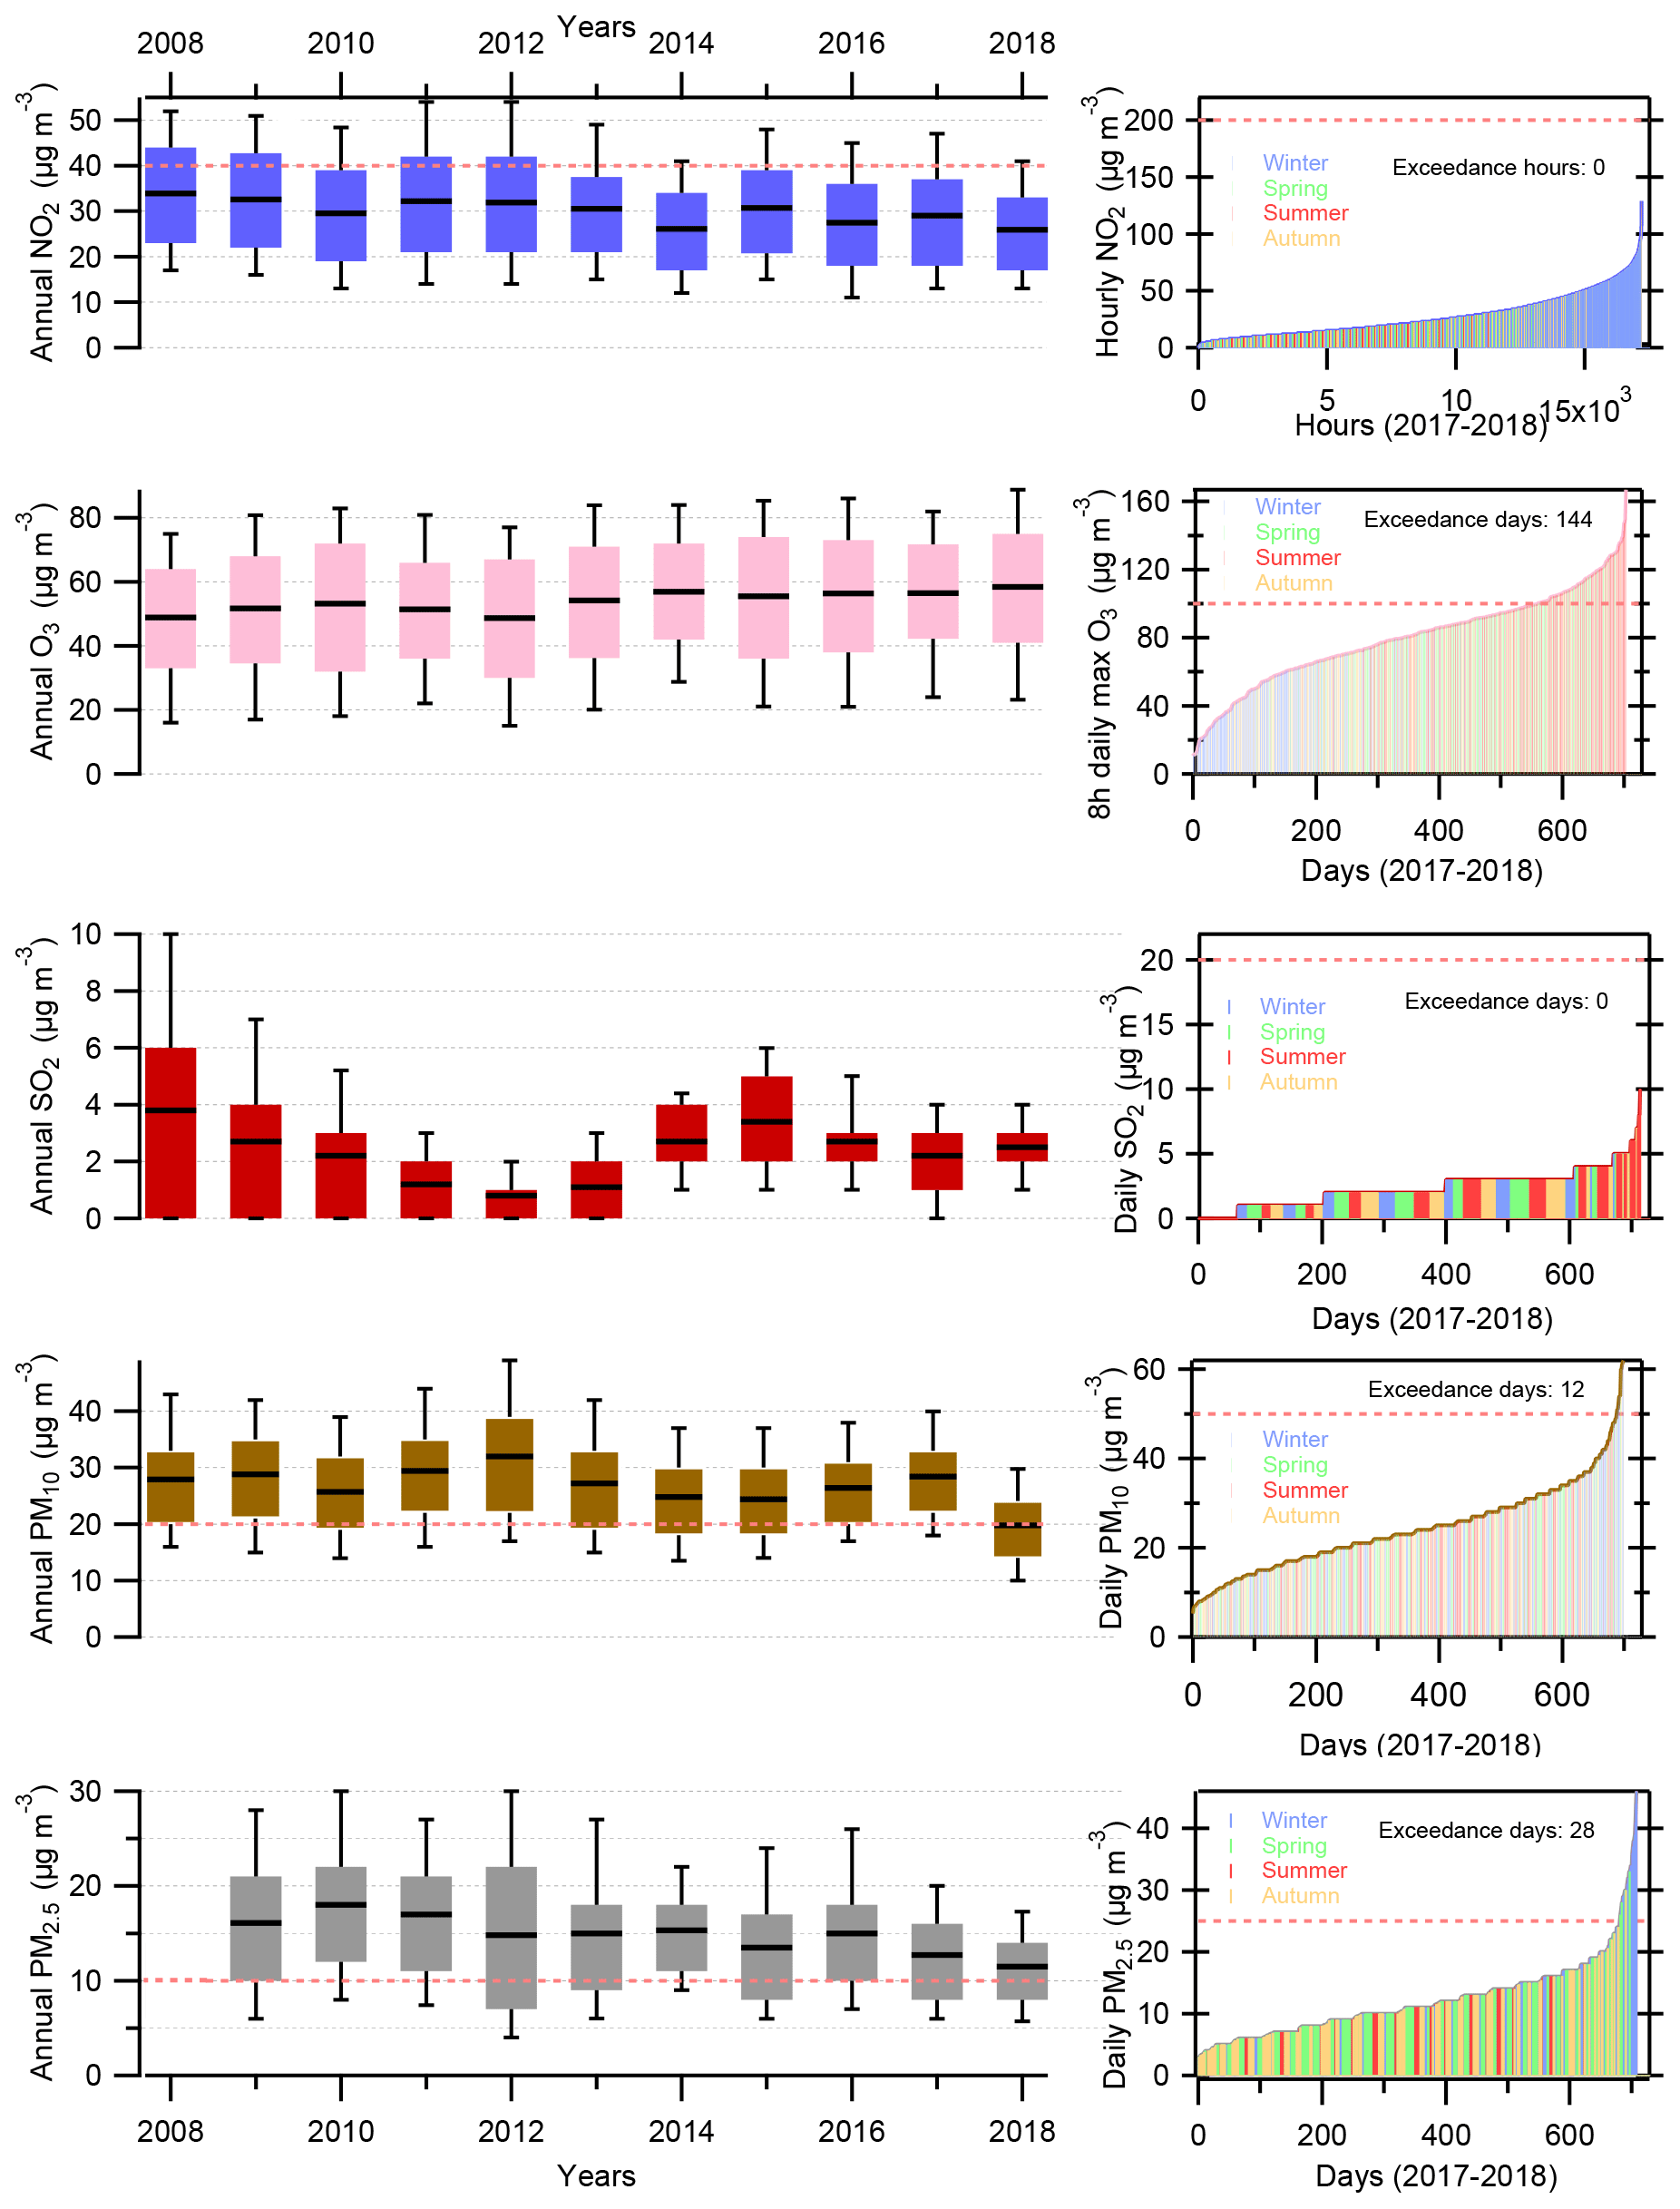
Figure 1Graphs on the left show annual average concentrations of the following pollutants during the last 11 years in Marseille–Longchamp: nitrogen dioxide (blue), ozone (pink), sulfur dioxide (red), PM10 (brown) and PM2.5 (grey). The slopes of NOx, O3, PM10 and PM2.5 trends were estimated by the Sen–Theil method, and their significance was evaluated through the non-parametric Mann–Kendall test. The red dotted thresholds correspond to the annual concentrations recommended by the WHO (World Health Organisation) for nitrogen dioxide, PM10 and PM2.5. Graphs on the right show data sorted by increasing daily values together with the number of days in excess according to the WHO recommendations (again the red dotted lines) for the years 2017 and 2018. For ozone, it corresponds to the daily maximum 8 h average. Sticks for daily values are colour-coded depending on the seasons (winter: blue; spring: green; summer: red; autumn: orange).
Despite these significant progresses towards better air quality, the city is still experiencing days with exceedance concentrations for PM10 and PM2.5, mainly in winter periods (Fig. 1). In the period 2017 to 2018, about 28 and 12 exceedance days were recorded for PM2.5 and PM10, respectively.
Moreover, as a coastal city in the Mediterranean basin, Marseille exhibits high ozone concentrations, especially during summertime. The annual mean concentration of ozone measured at the MRS-LCP station reached 60 µg m−3 in 2018, and 144 d above the 8 h average threshold of 100 µg m−3 (WHO) were recorded in 2017 and 2018, mostly during summertime when temperatures are highest. The annual mean increases at a yearly rate of +0.84 µg m−3 yr−1, which is consistent with the general trend observed in cities in Europe. Part of this increase is believed to reflect the reduction of the NO emitted locally and its resulting lower NO titration effect in an urban environment (Escudero et al., 2014).
Another feature of the city shown in Fig. 1 is that the decreasing trend observed from most primary pollutants does not apply to SO2, as the annual average concentrations have increased again since 2014. It is believed that the trend toward lower concentration expected from the use of low fuel sulfur content has been hindered by the increasing influence of in-port ship emissions and the spreading of cruise tourism in the city (+31 % of cruise passengers in the period 2014–2018; MedCruise, 2018). As a result, SO2 constitutes a potential source of secondary particulate matter produced locally.
3.2 Cross-validation of PM1 chemical species concentrations
The PM1 mass concentrations measured by the ToF-ACSM were compared with 24 h PM1 filter measurements and displayed in Fig. S3. The concentrations of chemical species were daily averaged and compared with respective offline measurements from 1 March to 23 September 2017 (n= 45). Orthogonal distance regressions were performed for the analysis, and the terms “a” and “b” referred to the intercept and the slope, respectively. A good agreement is found for ammonium and sulfate (R2= 0.71 and a slope of 1.0 and R2= 0.76 and a slope of 1.03, respectively). For nitrate the results are less consistent (R2= 0.69 and a slope of 1.59). This higher slope can be attributed to the volatilisation of nitrate from the filters during hot periods (Ripoll et al., 2015; Schaap et al., 2004a). The NH4 measured NH4 predicted ratio was also investigated from 1 February 2017 to 13 April 2018 (Fig. S4) as an indirect proxy for particle acidity (Zhang et al., 2007) and/or the presence of high organic nitrate concentrations (Petit et al., 2017b). The NH4 predicted represents the theoretical ammonium concentration needed to neutralise the inorganic species concentrations (NO, SO, Cl−). For most of the cities inorganic species tend to be fully neutralised, and a limited amount of acidic particles can only be observed when the site is located close to an emission source (e.g. industries, harbour, fire event, etc.). Here the slope value close to 1 (0.95) reflects a full neutralisation for all anions and suggests that there is enough ammonia in the gas phase to neutralise these species despite the nearby harbour and industrial complex. In addition to agricultural activity, ammonia can be emitted by sources closed to urban areas, such as vehicular exhausts, sewage, industrial emissions or residential biomass burning (Meng et al., 2017; Sun et al., 2017; Sutton et al., 2013).
The organics-to-OC comparison (ACSM concentrations vs. filters) showed a good correlation with R2= 0.79, whereas the intercept value was low (−1.23) and the slope was high (2.37) (Fig. S3). The slope, interpreted as the OM-to-OC ratio, is higher than the recommended values for urban areas (1.6 ± 0.2, Petit et al., 2015; Stavroulas et al., 2019; Turpin and Lim, 2001). It is possible that the chosen sampling periods for the comparison (spring and summer 2017) bias high the OM-to-OC value partly because of the volatilisation of semi-volatile species from the filters. The high correlation obtained between OA and OC in Fig. S3 (R2= 0.79) suggests that this artefact does not significantly affect the sample integrity. The photochemical activity and thus atmospheric aging are also expected to increase this OM-to-OC value. Ratios up to 2.2 have been observed when a significant fraction of particulate matter is made of aged aerosol (Aiken et al., 2008; Minguillón et al., 2011). Minguillón et al. (2015) and Via et al. (2020) also suggest a possible overestimation of OA due to the underestimation of the RIE applied to organics with the ACSM. RIE for organics varies within a wide range which strongly depends on the carbon oxidation state (Xu et al., 2018) and thus would need further investigations. A theoretical OM-to-OC ratio can be calculated based on a fractional contribution of 44 (f44) mainly due to CO (Canagaratna et al., 2015). The determined ratio was 1.94 over the offline measurement period, which is lower than the ratio obtained from the OC filter comparison method but remains elevated for an urban site. From this method, a value of 1.91 was found for the entire study period.
BC measurements from AE33 are compared with EC offline filters, and excellent agreement is found with R2= 0.87. The slope of 1.68 relates the difference in measurement properties between EC (thermic) and BC (absorption). The difference between the measured BC and EC could be attributed to the variability of the mass absorption coefficient (MAC) value used to convert the absorbance to BC mass concentrations in the AE33 instrument. This value could be influenced by light-absorbing OC like brown carbon from biomass burning. Here the slope is in agreement with values from other studies: 1.14 to 2.13 through 1 year at the Fresno supersite (California, USA; Park et al., 2006; 1.62 and 1.92 using EUSAAR2 and NIOSH870 protocols, respectively) and between January 2015 and July 2016 at the Environment-Climate Observatory of Lecce (Italy; Merico et al., 2019).
Finally the sums of ACSM species and BC mass concentrations were compared to the estimated mass using SMPS volume during the two deployment periods of this instrument (from 23 June to 12 August 2017 and from 6 November 2017 to 11 January 2018). For the SMPS mass conversion, a density (dcalc) was estimated taking into account the chemical composition of PM1 with respective densities of 1.75 g cm−3 for nitrate, sulfate and ammonium and 1.52 g cm−3 for chloride (Cross et al., 2007). The organic aerosol density can increase whether there are high contributions of carboxylic/dicarboxylic acids (1.46 ± 0.23 g cm−3) and/or polycyclic aromatic hydrocarbons (1.28 ± 0.12 g cm−3). In contrast, this density would decrease with high contributions of n-alkanes (0.79 ± 0.01 g cm−3) and/or n-alkanoic acids (0.89 ± 0.07 g cm−3) (Turpin and Lim, 2001). Finally, a density of 1.2 g cm−3 was chosen for organic aerosol (Cross et al., 2007). A default density of 1.77 g cm−3 is applied for BC as recommended by Poulain et al. (2014). The calculated density is based on the following equation (Salcedo et al., 2006):
where the time-dependent mass fractions are based on ACSM and AE33 measurements. The density was found to range between 1.24 and 1.77, with an average value of 1.43. The scatter plot of ACSM+BC concentrations vs. PM1 concentrations from SMPS in Fig. 2a shows strong correlation (R2= 0.81) and slope close to unity (slope = 1.02 and intercept = 0.46). Reconstituted mass (ACSM + AE33) was also compared to PM1 mass measurements from FIDAS for the last 3 months of the database (19 February to 13 April 2018) in Fig. S3. Again, satisfactory results are displayed with R2= 0.89, slope = 0.9 and intercept = 1.67 and show the consistency of the different measurements. The linear regression analysis of reconstituted PM1 vs. PM2.5 yielded a slope of 0.89 for a confidence interval of 99 % and R2=0.77 (Fig. 2b), so we can assume that PM2.5 concentrations are mainly composed of submicron particles.
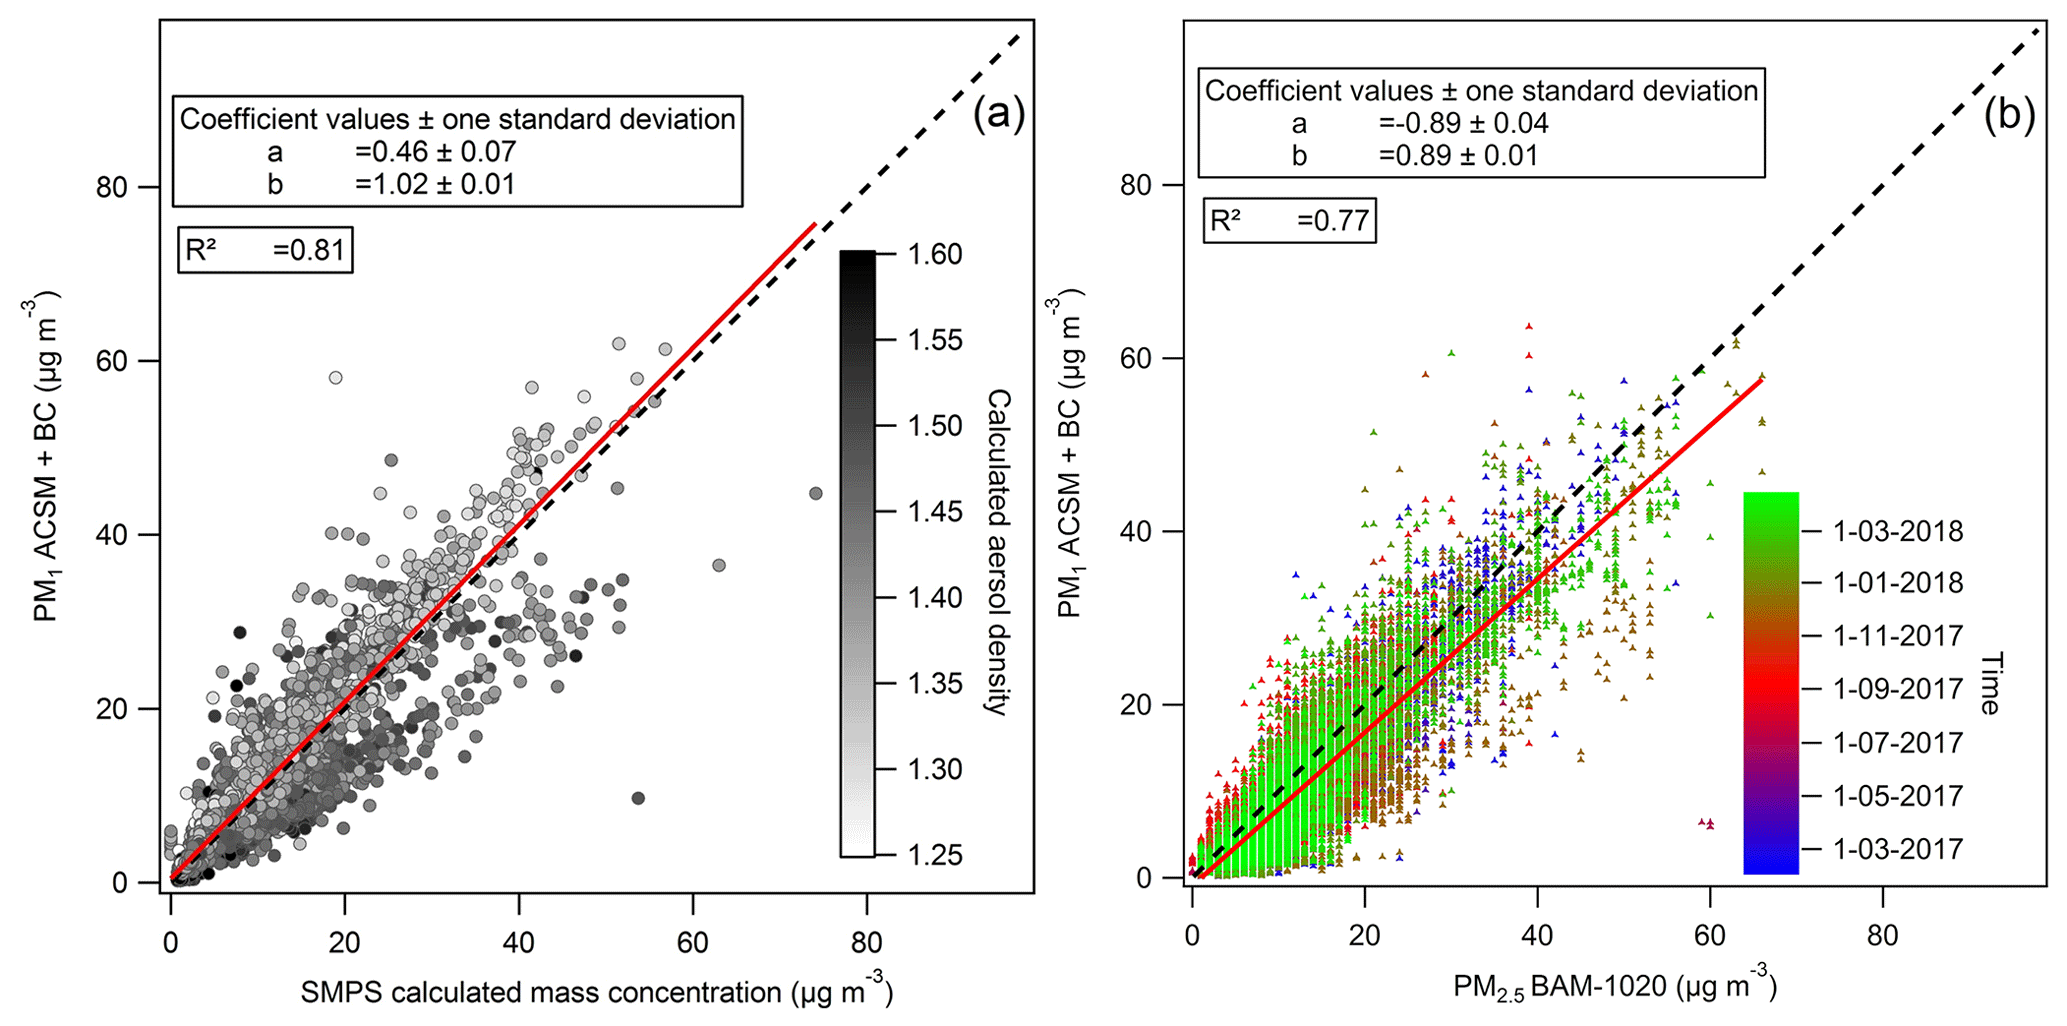
Figure 2Reconstructed PM1 (ACSM + BC) vs. PM1 calculated from SMPS measurements, with the colour-coded density evaluated from the PM1 chemical composition (a) and reconstructed PM1 vs. PM2.5 measurements by BAM-1020, coloured according to the sampling time (dd-mm-yyyy) (b). Red lines correspond to orthogonal distance fits and black dashed lines to 1:1 lines. R2 are determined with least square fits.
3.3 Submicron aerosol temporal variability
3.3.1 PM average composition
Figure 3 shows the time series of the concentrations of ACSM components, black carbon, daily PM2.5 and ultrafine particle (UFP; diameter < 100 nm) number along with the seasonal PM1 chemical composition. The average concentration over the period was 9.9 and 12.0 µg m−3 for PM1 (ACSM + BC) and PM2.5 (BAM), respectively. While these results comply with the EU PM2.5 annual mean standard of 25 µg m−3, the value does not meet the WHO guideline of 10 µg m−3, like most of the cities in Europe (EEA, 2019). The site experienced several episodes of elevated PM1 (> 30 µg m−3), most frequently during the coldest months in late autumn, winter and early spring, resulting occasionally in an exceedance of daily PM2.5 limit WHO values.
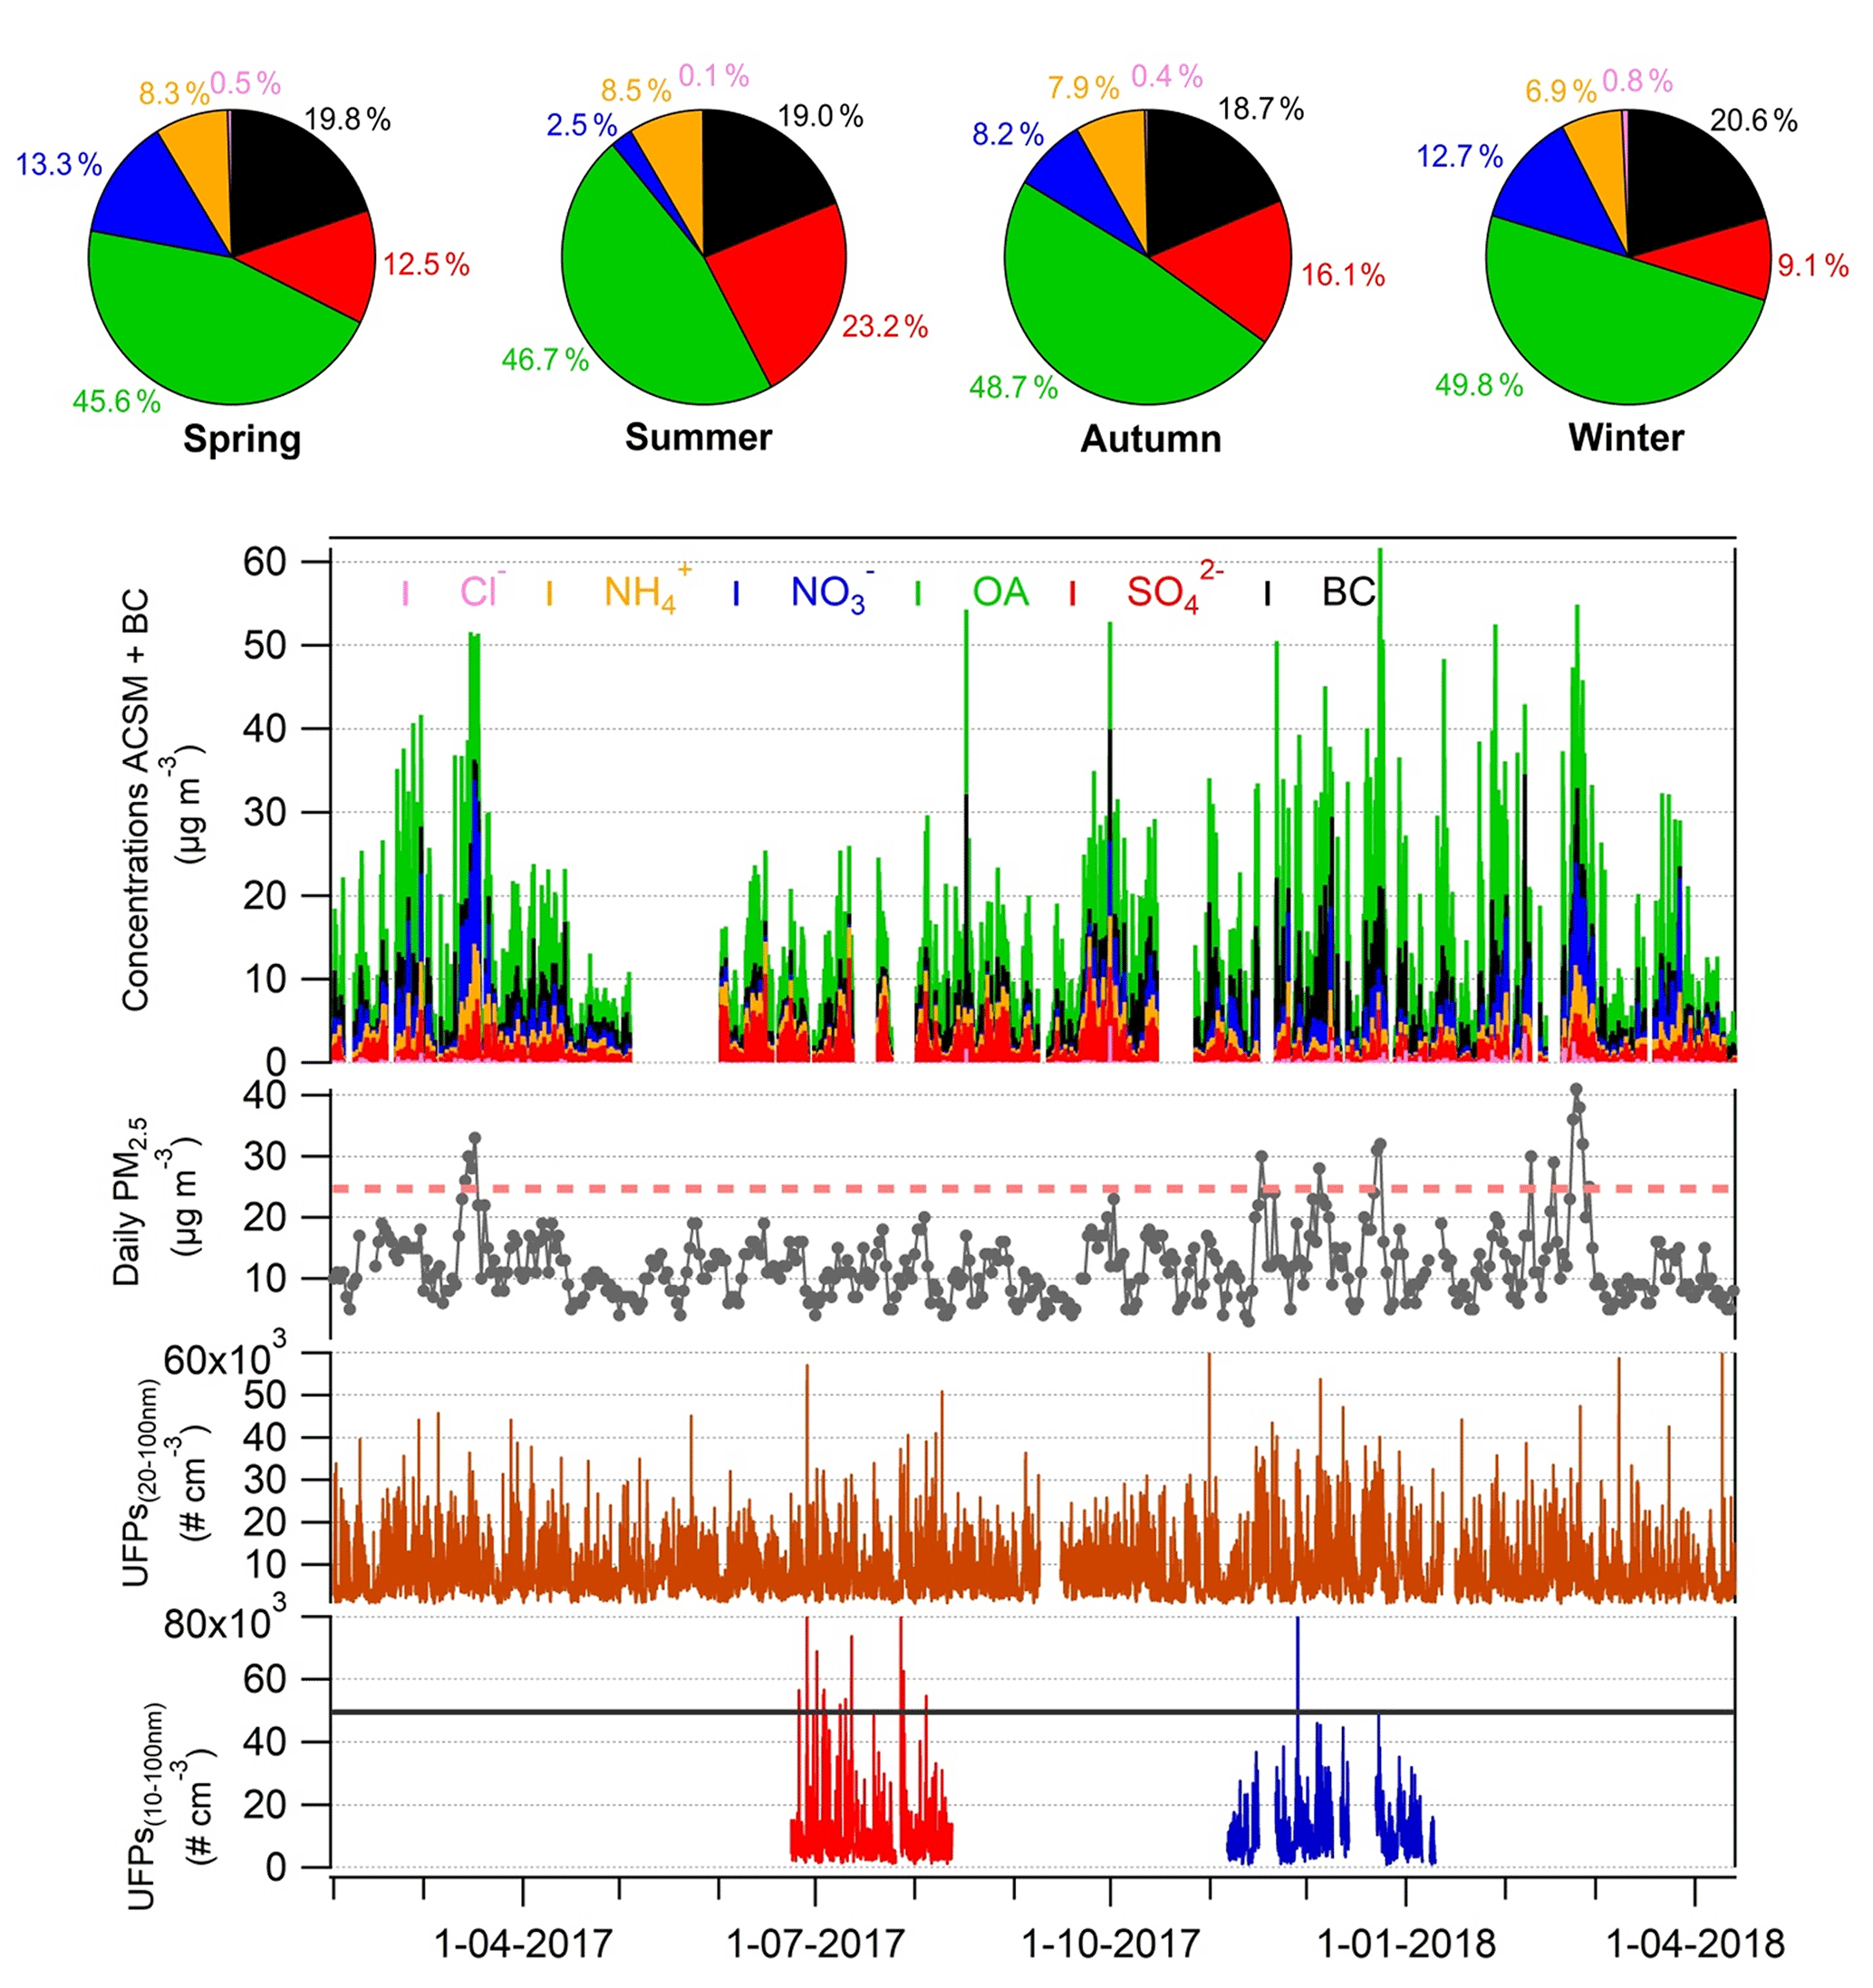
Figure 3Time series of 1 h PM1 chemical species (Cl−, OA, NH, NO, SO and BC), daily PM2.5, total UFPs (20–100 nm) measured with 3031 and total UFPs (10–100 nm) measured with SMPS GRIMM (summer period in red and winter period in blue) from 1 February 2017 to 13 April 2018. The average particle number concentrations were higher in winter; however, sharp events exceeding 50 000 cm−3 (black line) were more abundant in the summer period. This feature is traceable for the 10–100 nm size range measured with the SMPS GRIMM. The pink dotted thresholds correspond to the daily PM2.5 concentrations recommended by the WHO. Pie charts of the average PM1 component contribution for each season are shown in the upper panel.
The PM1 chemical composition is dominated by organics (49.7 %) and BC (17.1 %), while sulfate accounts for 14.6 %, nitrate for 10.2 %, ammonium for 7.9 % and chloride for 0.5 % only. The PM1 chemical composition is consistent with results from PM2.5 filters in MRS-LCP reported over the August 2011 to July 2012 period (Bozzetti et al., 2017; Salameh et al., 2015). The results are also comparable to those found in other Mediterranean coastal cities, where a noticeable proportion of sulfate is generally observed (Mallet et al., 2019; Minguillón et al., 2015; Stavroulas et al., 2019), whereas most urban sites in northern/central Europe show higher nitrate contribution (Lianou et al., 2011; Petit et al., 2015; Young et al., 2015).
The UFP average concentration as determined by the UFP monitor was less than 8000 cm−3 in the range of 20–100 nm. These values are similar to those observed in Barcelona but are higher than those found in Madrid and Rome for the same size range (Brines et al., 2015). In Marseille, UFPs represented 85 % of the total submicron particle number, in agreement with previous observations in urban environments (Rodríguez and Cuevas, 2007; Wehner and Wiedensohler, 2003).
3.3.2 Seasonal variability
A summary of the seasonal statistics (average and standard deviation) relative to PM1 mass, chemical composition and number concentrations is reported in Table 1. PM1 concentrations estimated from the sum of all species measured by the ACSM + black carbon vary between 8.1 µg m−3 (spring) and 11.9 µg m−3 in winter.
Table 1Seasonal average concentrations and associated standard deviation (SD) of the main chemical species of submicron aerosol and specific organic fragments for the study period. Average concentrations and SD of BC, nitrate, and particle number (20–100 nm) components are also represented.

The concentrations of organic and black carbon follow this trend as the highest values are observed during winter and autumn with OA BC concentrations of 6.2 2.1 and 5.1 1.9 µg m−3, respectively. The higher carbonaceous concentrations during the cold months are expected considering (i) a reduction of the PBL height resulting in the accumulation of pollutants at ground level compared to other seasons and (ii) increasing emissions from residential heating and open combustion of green wastes (Bozzetti et al., 2017).
The relative contribution of the biomass burning throughout the seasons can be estimated using the aethalometer model (Sandradewi et al., 2008) that allows us to apportion black carbon into fossil fuel and wood burning (respectively, BCFF and BCWB). The methodology applied is further described in the Supplement. Seasonal estimations of BCWB and BCFF contributions in MRS-LCP are shown in Fig. 4. BCWB shows a clear seasonal variability with a mean value of 0.59 µg m−3 corresponding to the highest contribution to the total BC in winter (28 %). By comparison, a summer average value of 0.11 µg m−3 BCWB represents the lowest contribution (7 %). Overall, the magnitudes of the seasonal variations are similar to those reported recently in Athens and Milan (Diapouli et al., 2017; Liakakou et al., 2020; Mousavi et al., 2019). Biomass burning also contributes to the seasonal variability of organic aerosol concentration as shown by the magnitude between winter and summer of f60 (the relative signal intensity of 60, commonly attributed to , a characteristic fragment ion of biomass-burning tracer anhydrosugars; Alfarra et al., 2007) (Table 1). Despite the mild climate in the south of France, wood heating is an important source of pollution. Almost 15 % of housing uses wood for heating in the Aix–Marseille metropolis (use of chimneys, wood stoves or wood boilers) (ADEME, 2009), and around 50 % of the identified equipment is still considered non-efficient in France (ADEME, 2020). Additionally, several wood-fired heating plants located in Aubagne, Gardanne and Aix-en-Provence (15, 18 and 25 km from Marseille, respectively) might contribute to biomass-burning emissions. Besides wood heating, the open burning is expected to contribute to the increasing concentration of carbonaceous aerosol, particularly in autumn. This includes the agricultural burning, since one-third of the department surface area is dedicated to agricultural activities but also green waste burning. While this latter practice is prohibited, it is suspected of still being used nowadays. The close link between the temperature and the magnitude of the wood-burning contribution suggests that the residential heating is the main source of biomass-burning carbonaceous aerosol (Fig. S7a).
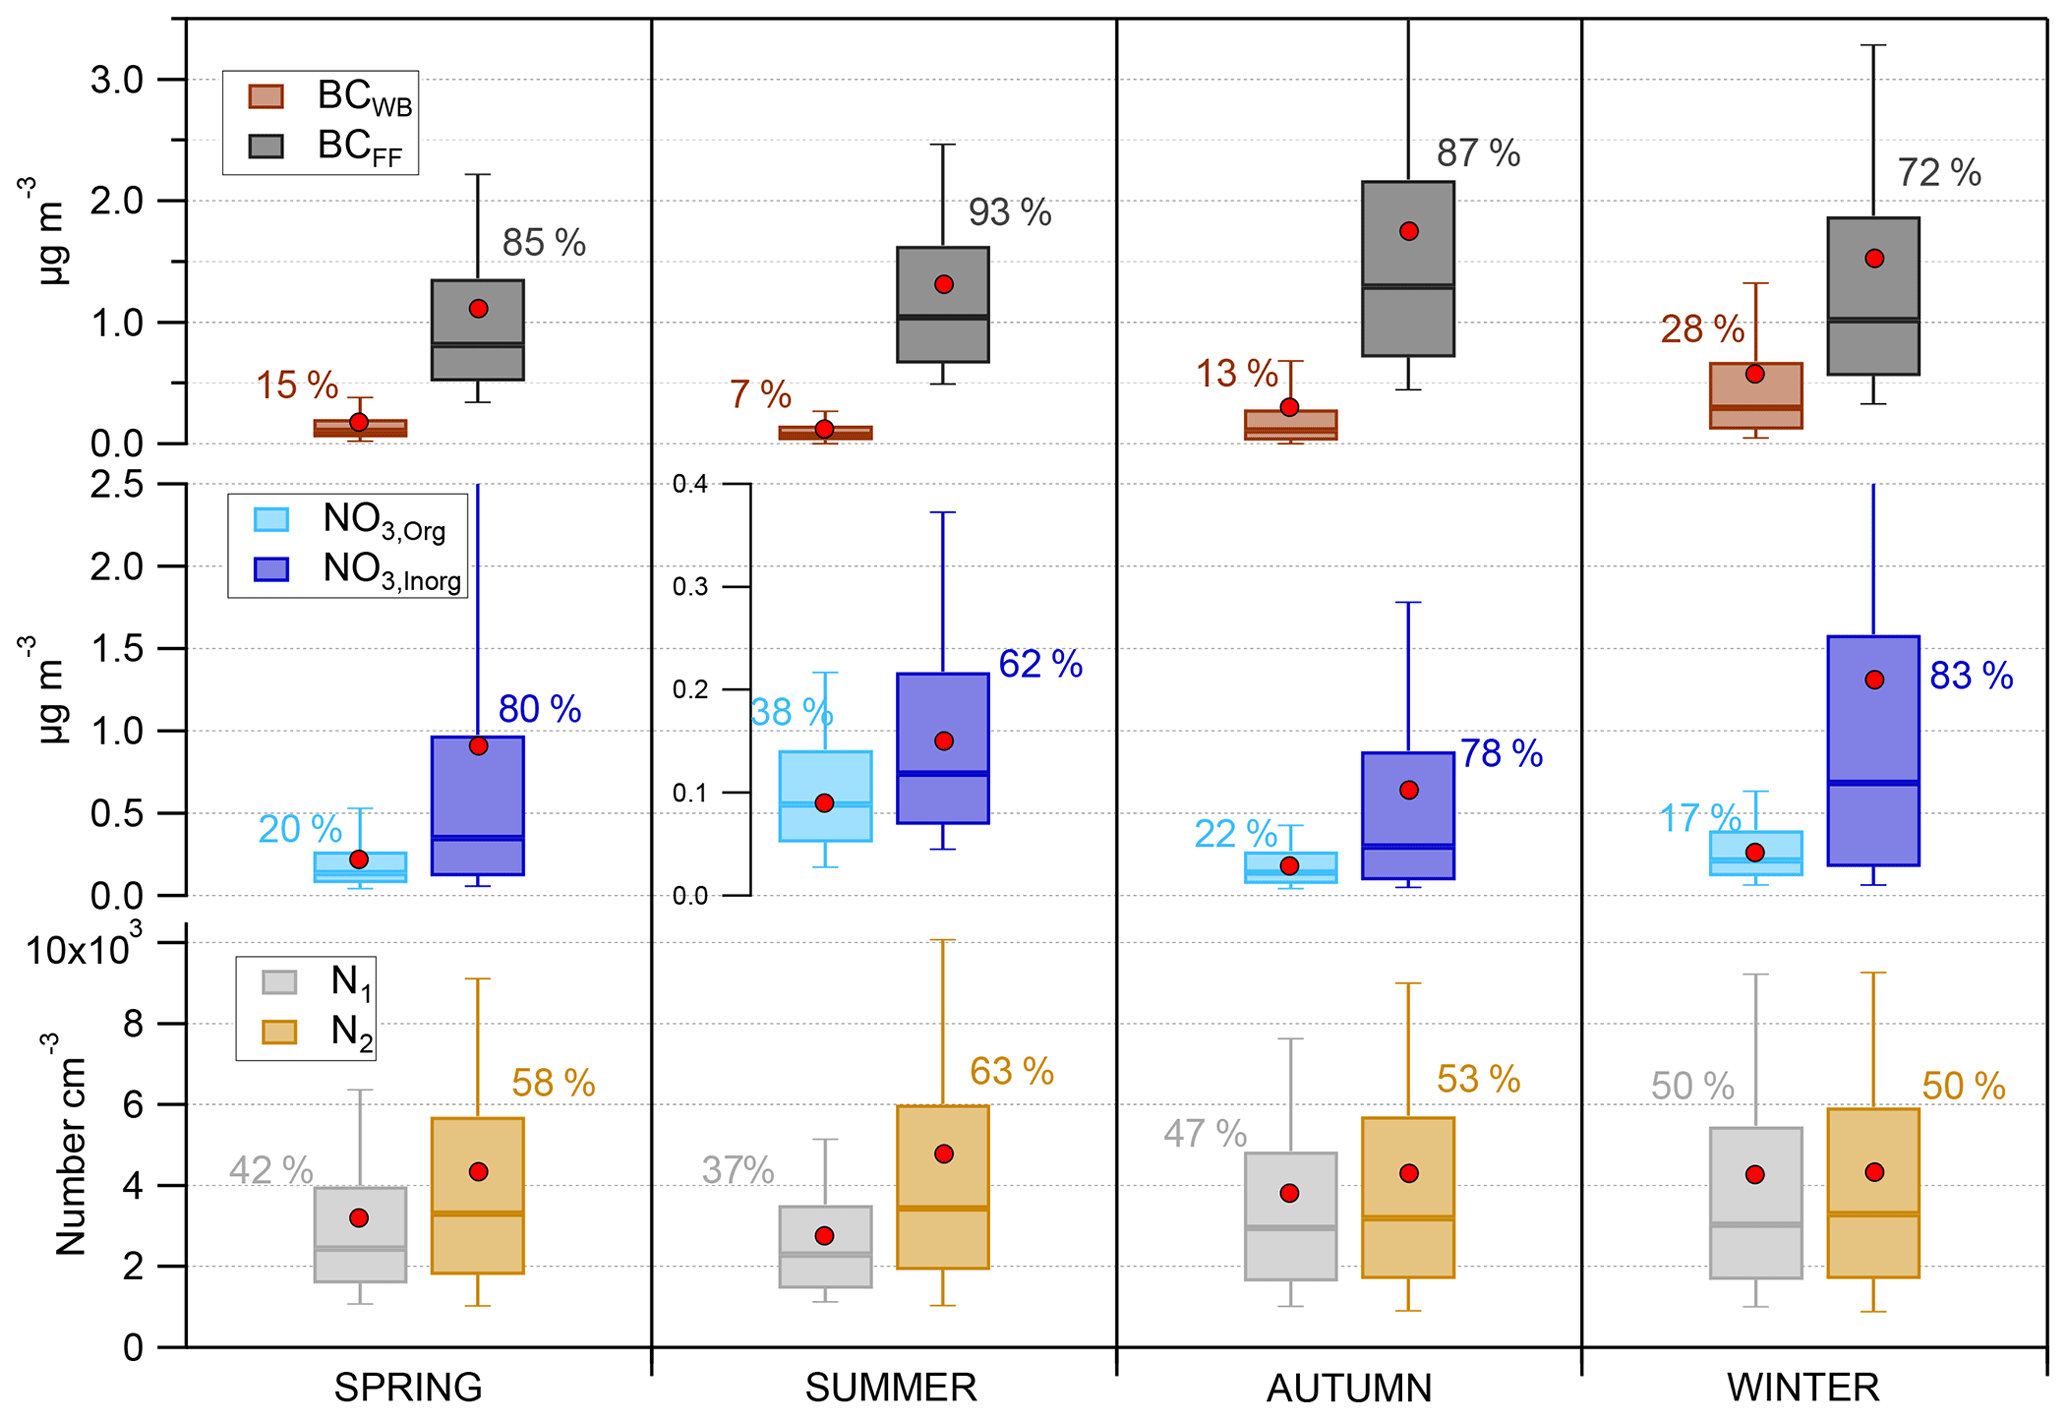
Figure 4Seasonal concentrations for the different fractions of BC (BCWB and BCFF), NO (NO3,Org, NO3,Inorg), and UFP number between 20 and 100 nm (N1, N2) represented as box plots. The band inside the box is the median (50th percentile); the bottom and top of the box represent the lower and upper quartiles, respectively (the 25th and 75th percentiles). The ends of the whiskers denote here the 10th and 90th percentiles. The red dots refer to the mean of each component.
The BCFF is nevertheless the main contributor to ambient black carbon (72 %–93 % of total BC) but has a much lower seasonal fluctuation than biomass burning, with values ranging from 1.1 µg m−3 (spring) to 1.7 µg m−3 (autumn). The elevated BCFF contribution and lower seasonal variations are consistent with the high traffic emissions that remain constant in the city throughout the year. A similar low seasonal amplitude is observed in f57, the fraction of the C4H organic fragment, commonly considered a proxy for primary organic aerosol and emitted mostly by traffic emissions (Zhang et al., 2005). Vehicular emissions highly contribute to carbonaceous aerosols in Marseille, as demonstrated by El Haddad et al. (2011b), and can be a significant source of OA.
The secondary organic aerosol is known to substantially contribute to the OA in Marseille (Bozzetti et al., 2017; El Haddad et al., 2013). The contribution of this fraction to the total OA seems to remain relatively constant during the year, as suggested by the variation of f44 (the relative signal intensity of 44, commonly attributed to CO, a characteristic fragment ion of oxygenated organic aerosol) across the seasons (Table 1). It is worth noting the clear correlation between f44 and the temperature in summer, as shown in Fig. S7b. This observation supports the conclusion that biogenic precursors strongly contribute to the secondary organic aerosol formation in this season. Previous studies based on radiocarbon measurements of PM2.5 in summer evaluated that ≈ 70 %–80 % of organic carbon was of non-fossil origin and was mainly attributed to biogenic secondary organic carbon (BSOC) (El Haddad et al., 2011, 2013).
Sulfate concentrations exhibit an opposite seasonal pattern to that observed for the total carbonaceous fraction, as the highest concentration is observed in summer (2.26 µg m−3). During this season, the average contribution of sulfate to the total mass of PM1 accounts for ≈ 23 % of the PM1. Sulfate exhibits its lowest concentrations in spring and winter (1.06 and 1.12 µg m−3, respectively). The origin of sulfate aerosol is further examined in Sect. 3.4.2.
Nitrate shows a distinct seasonal pattern as maximum concentrations occur in winter and early spring, with average values of 1.58 and 1.13 µg m−3, respectively, making up ≈ 14.0 % of the particle mass and minimum concentration in summer (0.24 µg m−3). This feature has already been observed in other European cities (Minguillón et al., 2015; Petit et al., 2015; Reyes-Villegas et al., 2016; Young et al., 2015) and is generally attributed to the lower temperature and higher relative humidity that shift the partitioning of semi-volatile ammonium nitrate toward the particulate phase (Huffman et al., 2009; Stelson and Seinfeld, 1982). This is supported by Fig. S8, where the lowest temperature and highest relative humidity values are found in winter and early spring. The episodes with high nitrate concentration reported in late winter/early spring (see Sect. 3.3.1) are also expected to bias high the average for these seasons though. Nitrate was further categorised into inorganic and organic fractions using the method described by Farmer et al. (2010). The detailed methodology is presented in the Supplement. Inorganic nitrate makes up a large fraction (62 %–80 %) of the total nitrate as shown in Fig. 4 and explains most of its variability throughout the seasons. NO3,Org average concentration ranges from 0.09 µg m−3 in summer to 0.26 µg m−3 in winter. The resulting average NO3,Org fraction for the whole dataset is 20 ± 7 %. The error here is determined from error propagation calculations described by Farmer et al. (2010) and is detailed in the Supplement. This fraction is in the range of reported values for European urban sites (28 %, Mohr et al., 2012; 24 %, Saarikoski et al., 2012). Assuming a molecular weight between 200 and 300 g mol−1 for particle organic nitrates, contribution of organic nitrates to total OA can be estimated (Xu et al., 2015). Results presented in Table S4 give a contribution to total OA of about 6 %–10 % in summer, 11 %–17 % in autumn, 14 %–20 % in winter and 18 %–28 % in spring. These results suggest that despite the low contribution of NO3,Org to total nitrate, organic nitrates can be an significant fraction of OA in Marseille.
As ammonium is closely connected to sulfate and inorganic nitrate, the combination of both components with opposite trends induces a rather flat seasonal pattern. Chloride maximum and minimum concentrations occur in winter and summer, respectively. This is consistent with the expected dominant form of chloride usually detected in PM1 with ACSM, that is, semi-volatile NH4Cl.
The seasonal variation of UFPs followed the general patterns observed for BC and OA concentrations over the year (Fig. S8). UFP average concentrations were slightly higher in winter and autumn, with average values of 8600 and 8100 cm−3, respectively, while an average value of 7500 cm−3 was found in spring and summer.
To get insights into the sources and processes contributing to ultrafine particles in urban ambient air, number concentrations were investigated using the methodology developed by Rodríguez and Cuevas (2007). This methodology has been extensively applied in urban environments to apportion the number concentration of primary and secondary sources (del Águila et al., 2018; González et al., 2011; Hama et al., 2017a, b; Reche et al., 2011; Rodríguez and Cuevas, 2007; Tobías et al., 2018). The total measured UFP number concentration (N) can be split into two components:
where N1 accounts for fresh primary emissions of vehicle exhaust, directly emitted in the particle phase or nucleating immediately after emission (Arnold et al., 2006; Burtscher, 2005; Kittelson, 1998), and N2 accounts mostly for secondary particles formed in the atmosphere during the dilution and cooling of the exhaust emissions (see Fig. S11 for details). To refine the method, BCFF was used instead of total BC to better apportion primary traffic emissions.
The N1 and N2 fractions were derived from the TSI 3031 measurements, and average number concentrations during each season are reported in Table 1 and Fig. 4. It should be emphasised that results obtained from this analysis are sensitive to the sampling strategy (cut size of the particle counter, distance from the sources) and to the physicochemical properties of the primary particles (presence and size of the BC core) (Kerminen et al., 2018; Kulmala et al., 2016). In the present work, an underestimation of N2 is expected, as particles smaller than 20 nm are not accounted for when the TSI 3031 is used.
The N2 fraction was predominant, with number concentrations 1.02 to 1.7 times higher than N1. The N2 average particle numbers were higher in spring and summer as the concentrations reached their highest value (≈ 4300 and 4800 cm−3). In contrast, the N1 emissions appear to be dominant in winter and autumn, with average concentrations of ≈ 4200 and 3800 cm−3. An explanation for these results could be either the higher traffic rate or the low temperature influencing the soot particle formation during combustion in these seasons. The N1 seasonal trend slightly varied through the measurement period with a contribution between 37 % and 50 %.
While it appears that the highest UFP mean number concentrations are observed in autumn and winter, a different picture is found when the frequency of occurrence of short-term high-concentration episodes is investigated as a function of the season. Figure 5 shows the box plots of 15 min average UFP number concentrations, binned into intervals of SO2 concentrations classes, a proxy industrial and shipping activity. It clearly shows that the most intense episodes occur preferentially in summer and are associated with high SO2 concentrations. This season gathers more than 55 % of the highest SO2 concentrations (> 20 µg m−3) episodes. The higher occurrence of sharp and intense UFP peaks in summer is confirmed by the SMPS data as 10 events exceeding 50 000 cm−3 were observed in summer against only 1 in winter (Fig. 3).
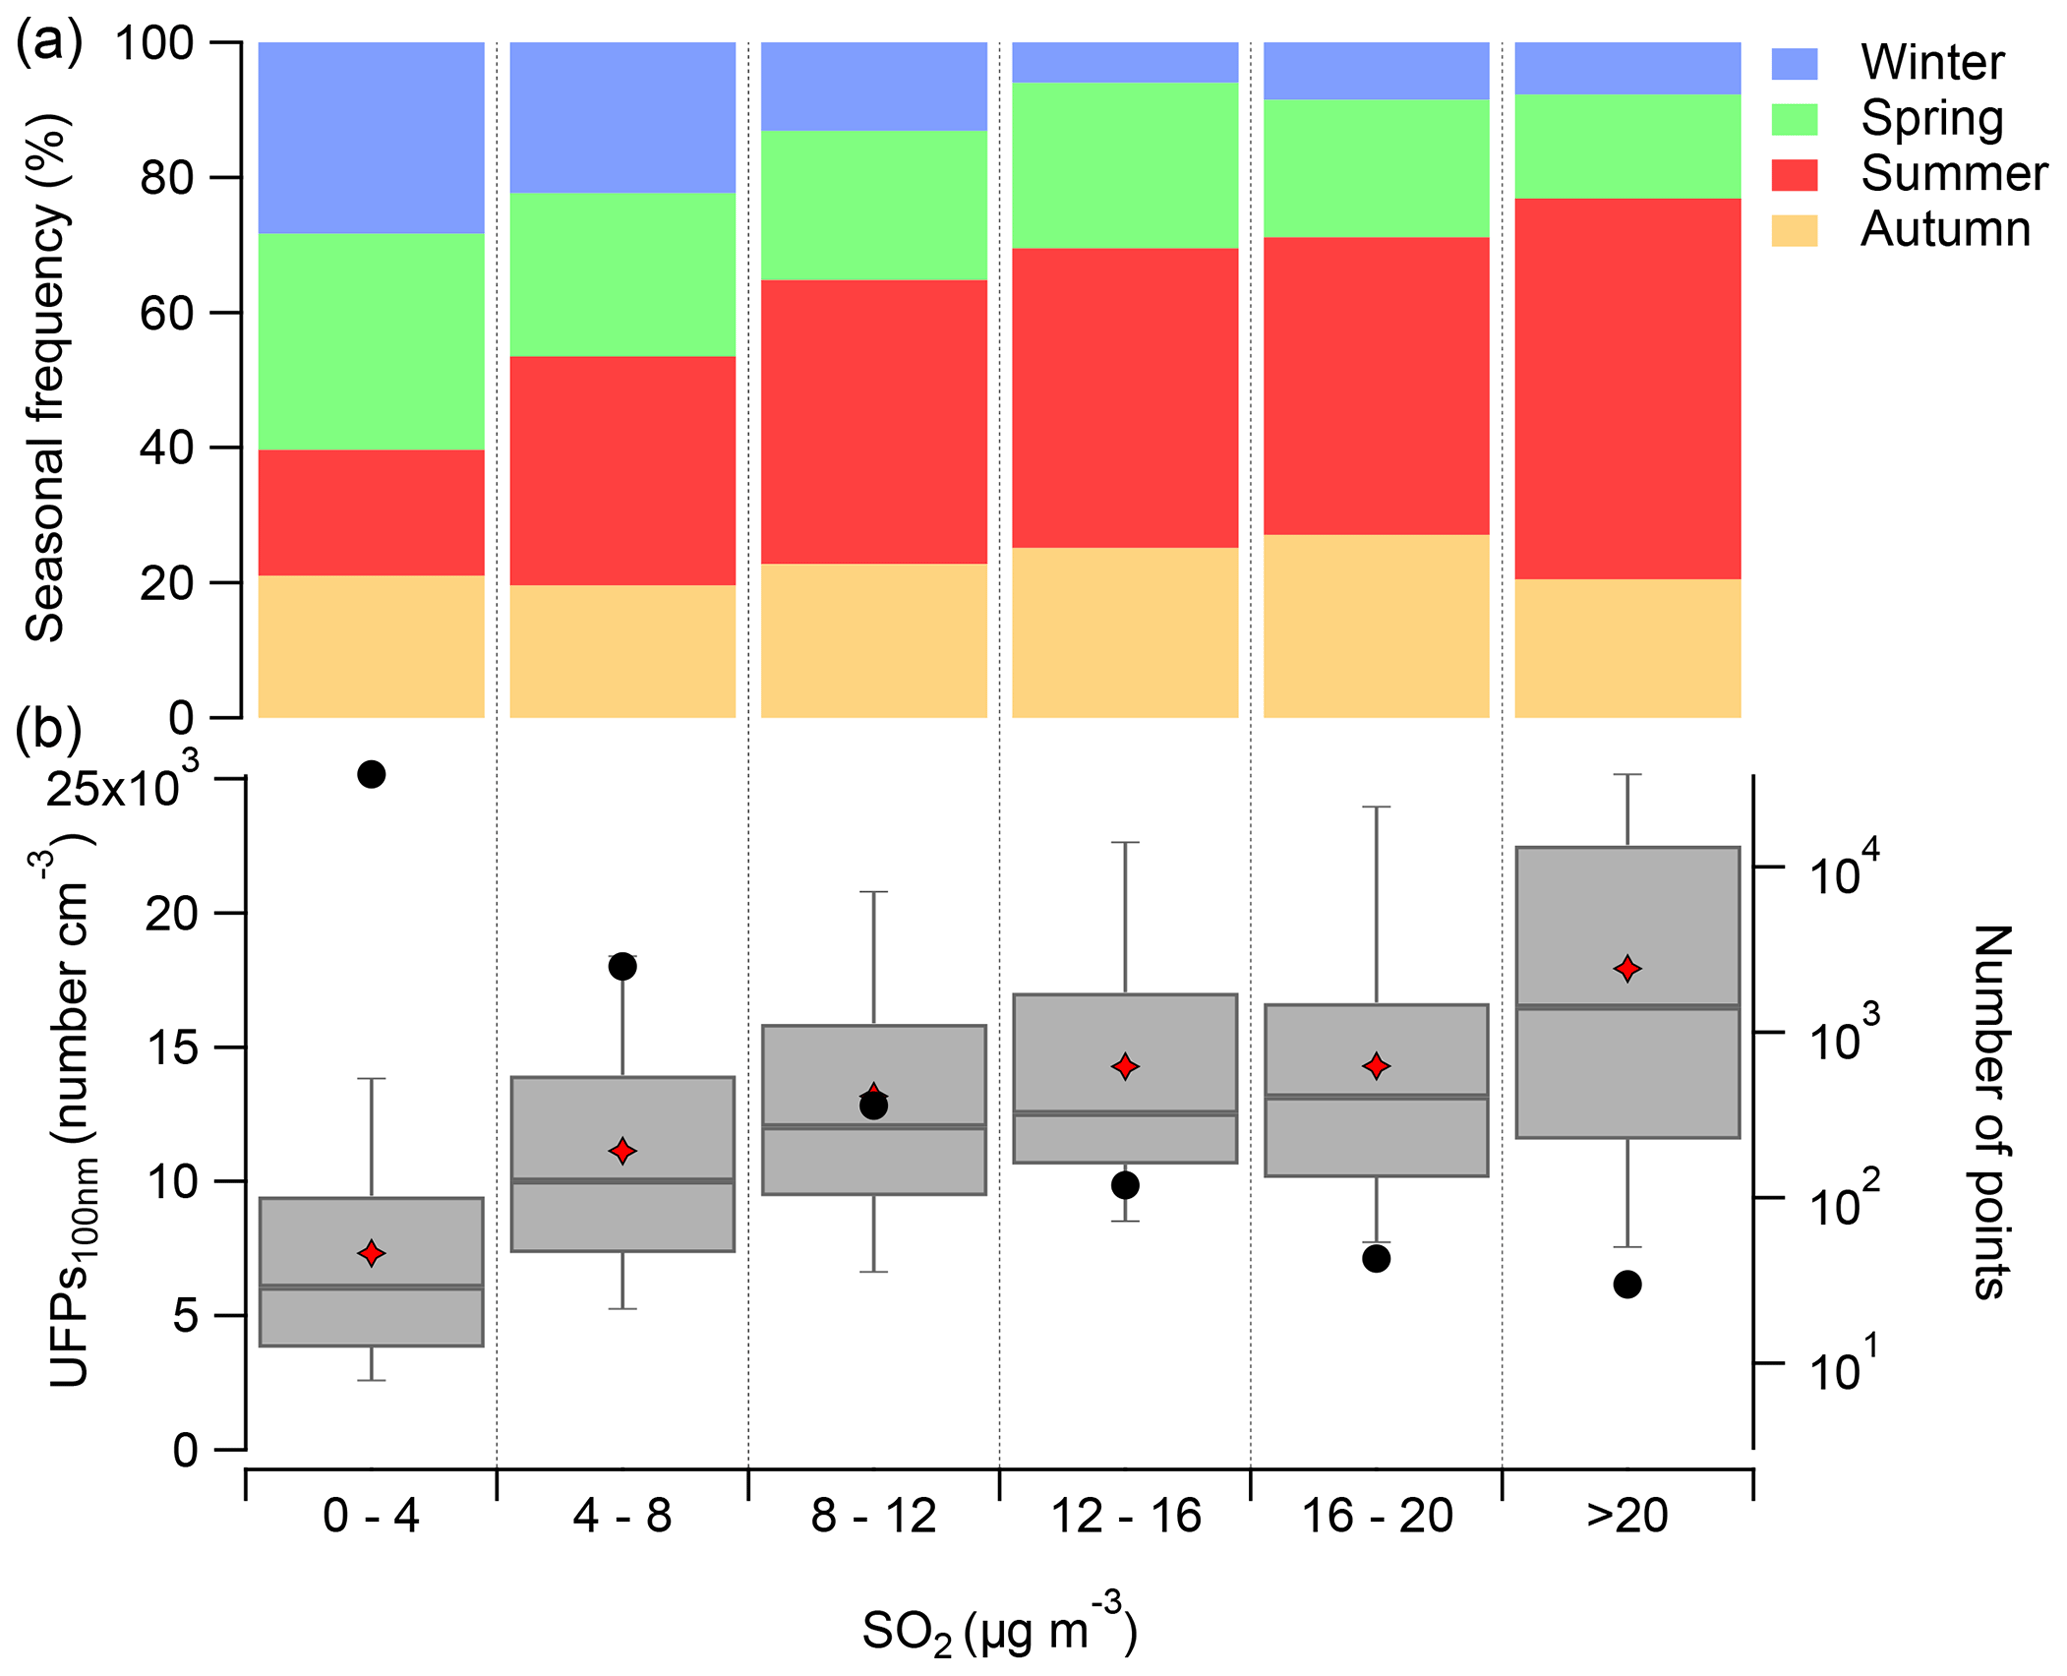
Figure 5Box plots of UFP< 100 nm number for different SO2 concentration bins (b) and seasonal occurrence frequency for each bin (a). The red diamonds are the mean, the bands inside the box are the median, the bottom and top of the box represent the lower and upper quartiles, respectively, and the ends of the whiskers show the 10th and 90th percentiles. The black circles denote the number of data points (15 min resolution) encountered in each bin.
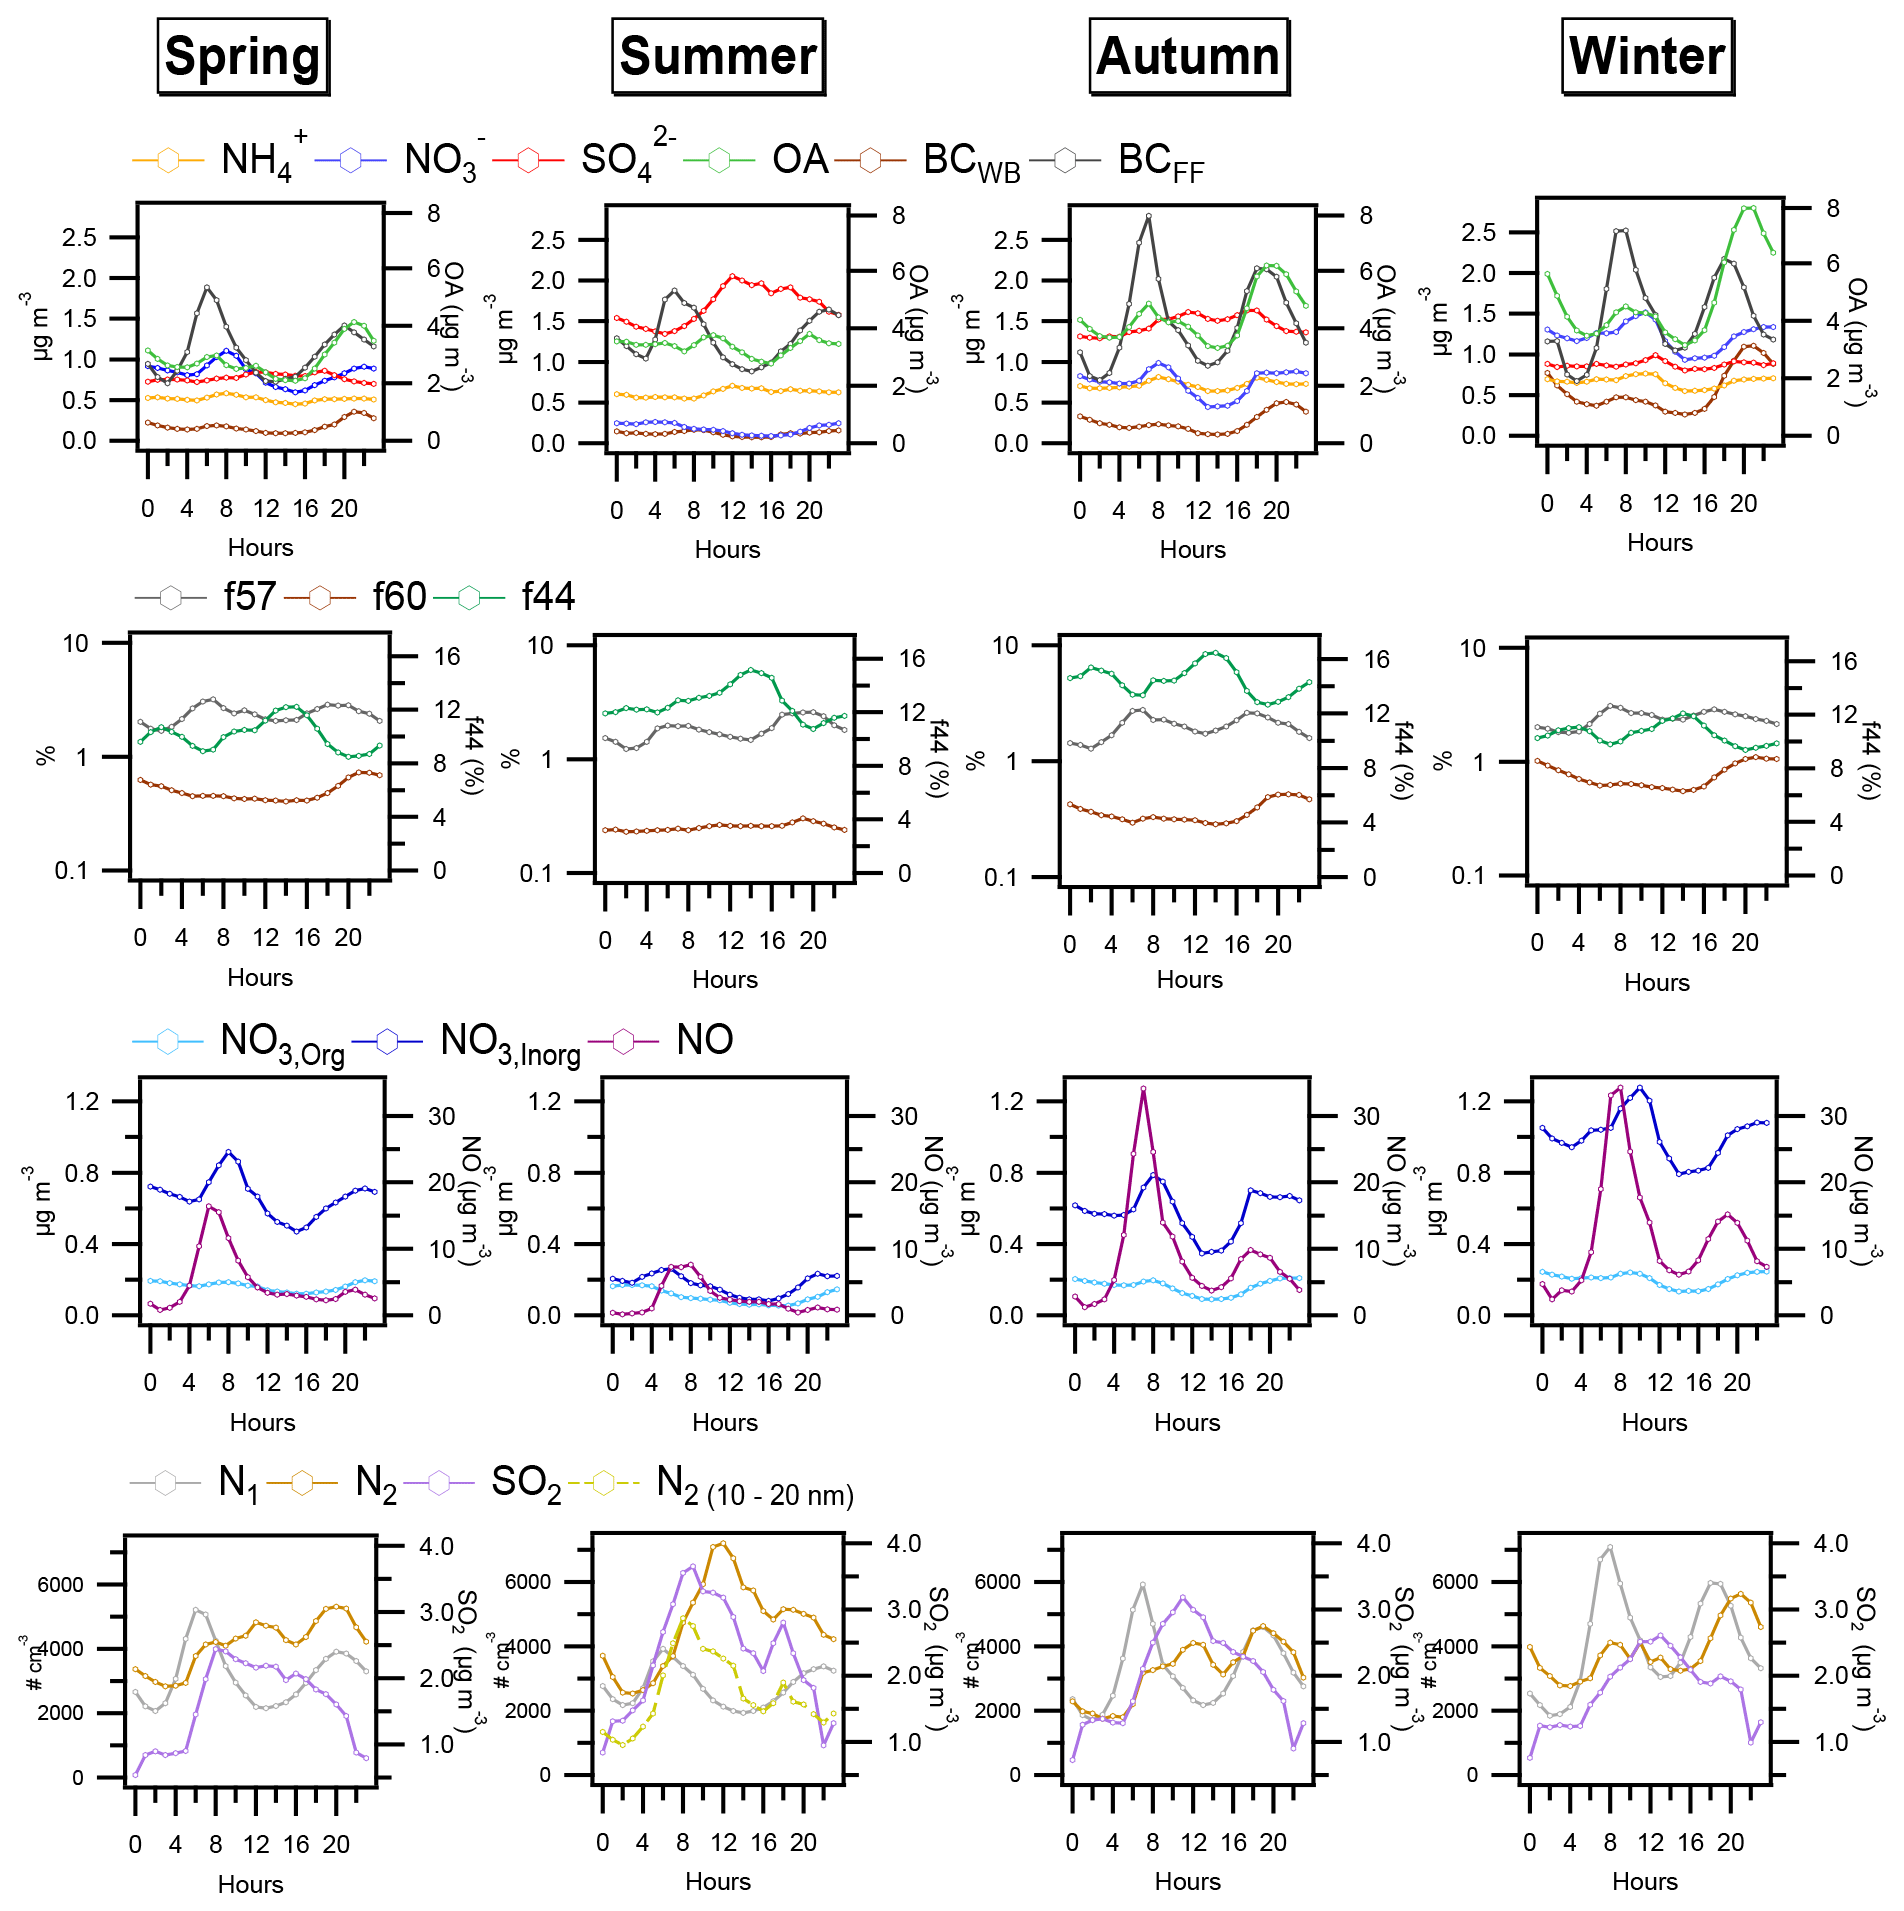
Figure 6Seasonal diurnal profiles of PM1 species, specific fractions of organic fragments (f60, f44 and f57), nitrate components (NO3,Org, NO3,Inorg) and NO, and UFP components (N1, N2) and SO2. Note that the left axis for f60 and f57 values is on a logarithm scale for clarity reasons. For summer, a secondary number of particles N2 was also calculated for N between 10 and 20 nm from SMPS GRIMM measurements during the 23 June–12 August 2017 period (yellow dashed line).
3.3.3 Diurnal profiles
Figure 6 shows the average diurnal profiles of ACSM components (OA, NH, NO, SO) and specific organic markers (f44, f57, f60), BCFF, BCWB and particle number concentrations (N1 and N2) across the different seasons.
Distinctive diurnal patterns are found for carbonaceous aerosols. First, a clear traffic-related diurnal profile was observed for BCFF, with a morning peak and an evening peak starting at the typical rush hours (04:00 and 16:00 UTC, respectively). This pattern confirms that traffic emission prevails over the other potential sources of fossil fuel such as oil-fired boilers and industrial and shipping activities. The amplitude of the traffic-related diurnal cycle seemed to be affected by the boundary-layer height since it varied within the year, with a maximum min. to max. amplitude of 0.9 during winter and a minimum min. to max. amplitude of 0.5 during summer.
The BCWB had a distinct diurnal cycle with a typical increase starting at 17:00 UTC and a maximum level of 1.1 µg m−3 at nighttime. The mean to max. amplitude increased steadily from spring, autumn to winter (0.1, 0.2 and 0.4, respectively), following the increased heating demand. Under specific meteorological conditions (no rain, low wind speed, low boundary-layer height), this source is responsible for episodes of high PM1 concentrations in Marseille. This is discussed in detail in Sect. 3.4.1. In winter and autumn, the OA diurnal cycle mainly resulted from the superposition of both traffic-related and wood-burning-related cycles, with maxima of 4.9 and 7.9 µg m−3 for the morning and evening peaks, respectively. This feature is highlighted by the seasonal diurnal profiles of the organic ion fractions f60 and f57. While f60 followed exactly the BCWB diurnal cycles, f57 displayed the same bimodal pattern as BCFF. In spring and summer an additional local maximum appeared for OA during mid-day (3.8 µg m−3). This can be attributed to the enhanced photochemical activity and formation of secondary organic aerosol as suggested by the f44 diurnal cycles. OA mid-day peaks may also be partly related to a distinct cooking source (Bozzetti et al., 2017). This is confirmed upon inspection of the f55 vs. f57 plot (Fig. S12), commonly used to diagnose the presence of this source (Mohr et al., 2012), as it shows a typical V shape in the daytime (05:00–17:00 UTC), with data between 11:00 and 13:00 UTC (green points) and data from the morning (red and yellow points between 05:00 and 08:00 UTC) near the respective fits previously reported for pure cooking organic aerosol and traffic emissions. During nighttime there is no clear separation of cooking and traffic-related organic aerosol as these sources are expected to be co-emitted at the same hours.
The NO3,Inorg diurnal cycles exhibit a morning peak that occurs in general 1–2 h after the morning traffic-related peak, suggesting that formation of ammonium nitrate occurs locally in the presence of the NOx and NH3 possibly co-emitted emissions. Suarez-Bertoa et al. (2015) mentioned that urban traffic emissions of ammonia have increased in Europe (+378 %) over the last decades, leading to possible enhanced ammonium concentrations. In the late afternoon, concentrations increase and remain high because of the boundary-layer height decrease, together with the lower temperature and higher relative humidity that favour condensation to the particle phase. The diurnal variations of NO3,Org are represented for each season in Fig. 6. Concentrations increased after sunset and were higher at night, likely due to the oxidation of VOCs by the nitrate radical (Kiendler-Scharr et al., 2016). The minimum-to-maximum amplitude was more pronounced in summertime, possibly due to enhanced biogenic VOC emissions. Still, these results might be partly influenced by the low level of total nitrate concentration encountered during this period. Slight daily enhancements of NO3,Org were found in the morning (around 08:00 UTC) and are attributed to photooxidation of VOCs in the presence of high nitrogen monoxide NO concentrations (the diurnal profiles are also reported in Fig. 6 and show maxima at 07:00 UTC) as mentioned by Xu et al. (2015).
Sulfate and ammonium exhibit very similar profiles, except for winter and early spring, when ammonium is mainly associated with nitrate. The quite flat diurnal profiles of ammonium sulfate during autumn, winter, and spring might be due to the regional character of this component (regional transport) (Seinfeld and Pandis, 2016).
In summer, however, the ammonium sulfate diurnal profile shows a clear increase during the daylight period, with maxima reached at noon, possibly due to local photochemical production of sulfate from its precursor SO2 emitted by nearby shipping and industrial activities and advected to the city as the sea breeze sets in. Some studies suggest fast SO2 to sulfate conversion in the exhaust plumes (Healy et al., 2009; Lack et al., 2009). This local sulfate fraction will be discussed in detail in Sect. 3.4.2.
Average daily profiles for N1 and N2 are represented in Fig. 6 and show a distinct daily pattern. Particle number concentration N1 exhibits maxima during morning and evening traffic rush hours similarly to NO concentration, when UFPs are mainly associated with vehicle exhaust emissions. In winter, N2 follows the traffic bimodal profile with a 1–2 h shift (morning peak at starting at 06:00 UTC and evening at 17:00 UTC), which can highlight the fast homogeneous dilution/cooling (favoured by the low temperature and high relative humidity conditions) and mixing of the vehicle exhaust in the ambient air (Casati et al., 2007; Charron and Harrison, 2003). In summer, N2 exhibits a daily evolution with a broad maximum during daylight. This trend closely follows the daily evolution of temperature, ozone, f44 and SO concentration, suggesting a photo-oxidative process of gaseous precursors (Woo et al., 2001), as SO2, combined with more dilution of pollutants when the boundary layer increases (Reche et al., 2011). For the transitional seasons (autumn and spring) the patterns reveal some mixing between the car exhaust cooling and photochemistry states, and N2 can be attributed to the two processes. Analysis of the secondary fraction N2 between 10 and 20 nm determined from SMPS summer data reveals that this fraction followed the SO2 diurnal evolution (Fig. 6). Both SO2 and N2 (10–20 nm) concentrations increased from the morning, suggesting the nucleation of sulfuric acid particles (Burtscher, 2005; González et al., 2011). In this size range, the secondary (N2 (10–20 nm)) and fresh primary emissions (N1 (10–20 nm)) fractions corresponded to 90 % and 10 % of the total number concentration (N(10–20 nm)), respectively. Overall the UFP investigation demonstrates that secondary particle formation is an important contributor to particle number in Marseille and, besides road traffic, there is some high influence of industrial/shipping mixed sources.
3.4 Case study of PM1 polluted periods
3.4.1 PM episodes with exceedance days: local vs. long-range transport
Table 2 summarises the number of PM2.5 exceedance days throughout the last decade in MRS-LCP, using as a reference value 25 µg m−3 the 24 h mean from the WHO guideline for particulate matter. Overall, the number of exceedance days has strongly declined over the years (it is 3–4 times lower in 2017 than in the 2009–2011 period). In the present study, 15 exceedance days were observed over the 14-month period (from 1 February 2017 to 13 April 2018). These exceedance periods occurred in spring, late autumn, and winter, in good agreement with seasonal frequency distribution in the last decade, and they could last from 1 to 4 consecutive days as shown in Fig. 3. Among the 15 exceedance days, two pollution episodes have been selected as case studies, as they represent two contrasting pollution regimes: a local event in the Christmas period (23–24 December 2017) and a regional persistent pollution episode (22–25 February 2018).
Table 2Number of days exceeding 25 µg m−3 for PM2.5 concentrations (WHO recommendation) since they are measured in MRS-LCP. Results are presented by season and for the total years.

The average PM2.5 concentrations were 31.2 and 36.7 µg m−3, respectively, for the local and regional pollution episodes, with average PM1 concentrations of 28.7 and 31.1 µg m−3, respectively. This indicates that PM2.5 pollution episodes were driven by PM1 concentrations in both cases. Figure 7 shows the time series of the meteorological parameters (i.e. temperature, relative humidity, wind speed and direction, PBL height and precipitations), with the PM1 components as well as the BC SO ratio during these two events. The sulfate fraction (SO) is considered a good tracer for long-range transport, whereas BC refers to local influence from the city and the surrounding area (Petit et al., 2015). The use of this local/long-range proxy requires the assumption of a minor local source of SO2 and no direct SO formation in plumes at a local scale during the two episodes. Therefore the industrial and shipping contributions to global pollution have to be low for these periods. This is true except for a short period on 23 December around 12:00 UTC when a temporary increase in SO decreases the BC SO ratio. This short event possibly originated from industrial and/or shipping emissions as SO2 and UFPs concentrations also increased. Additionally, aged air masses might contain BC particles (Laborde et al., 2013), and this interference must be considered during the BC SO ratio analysis.
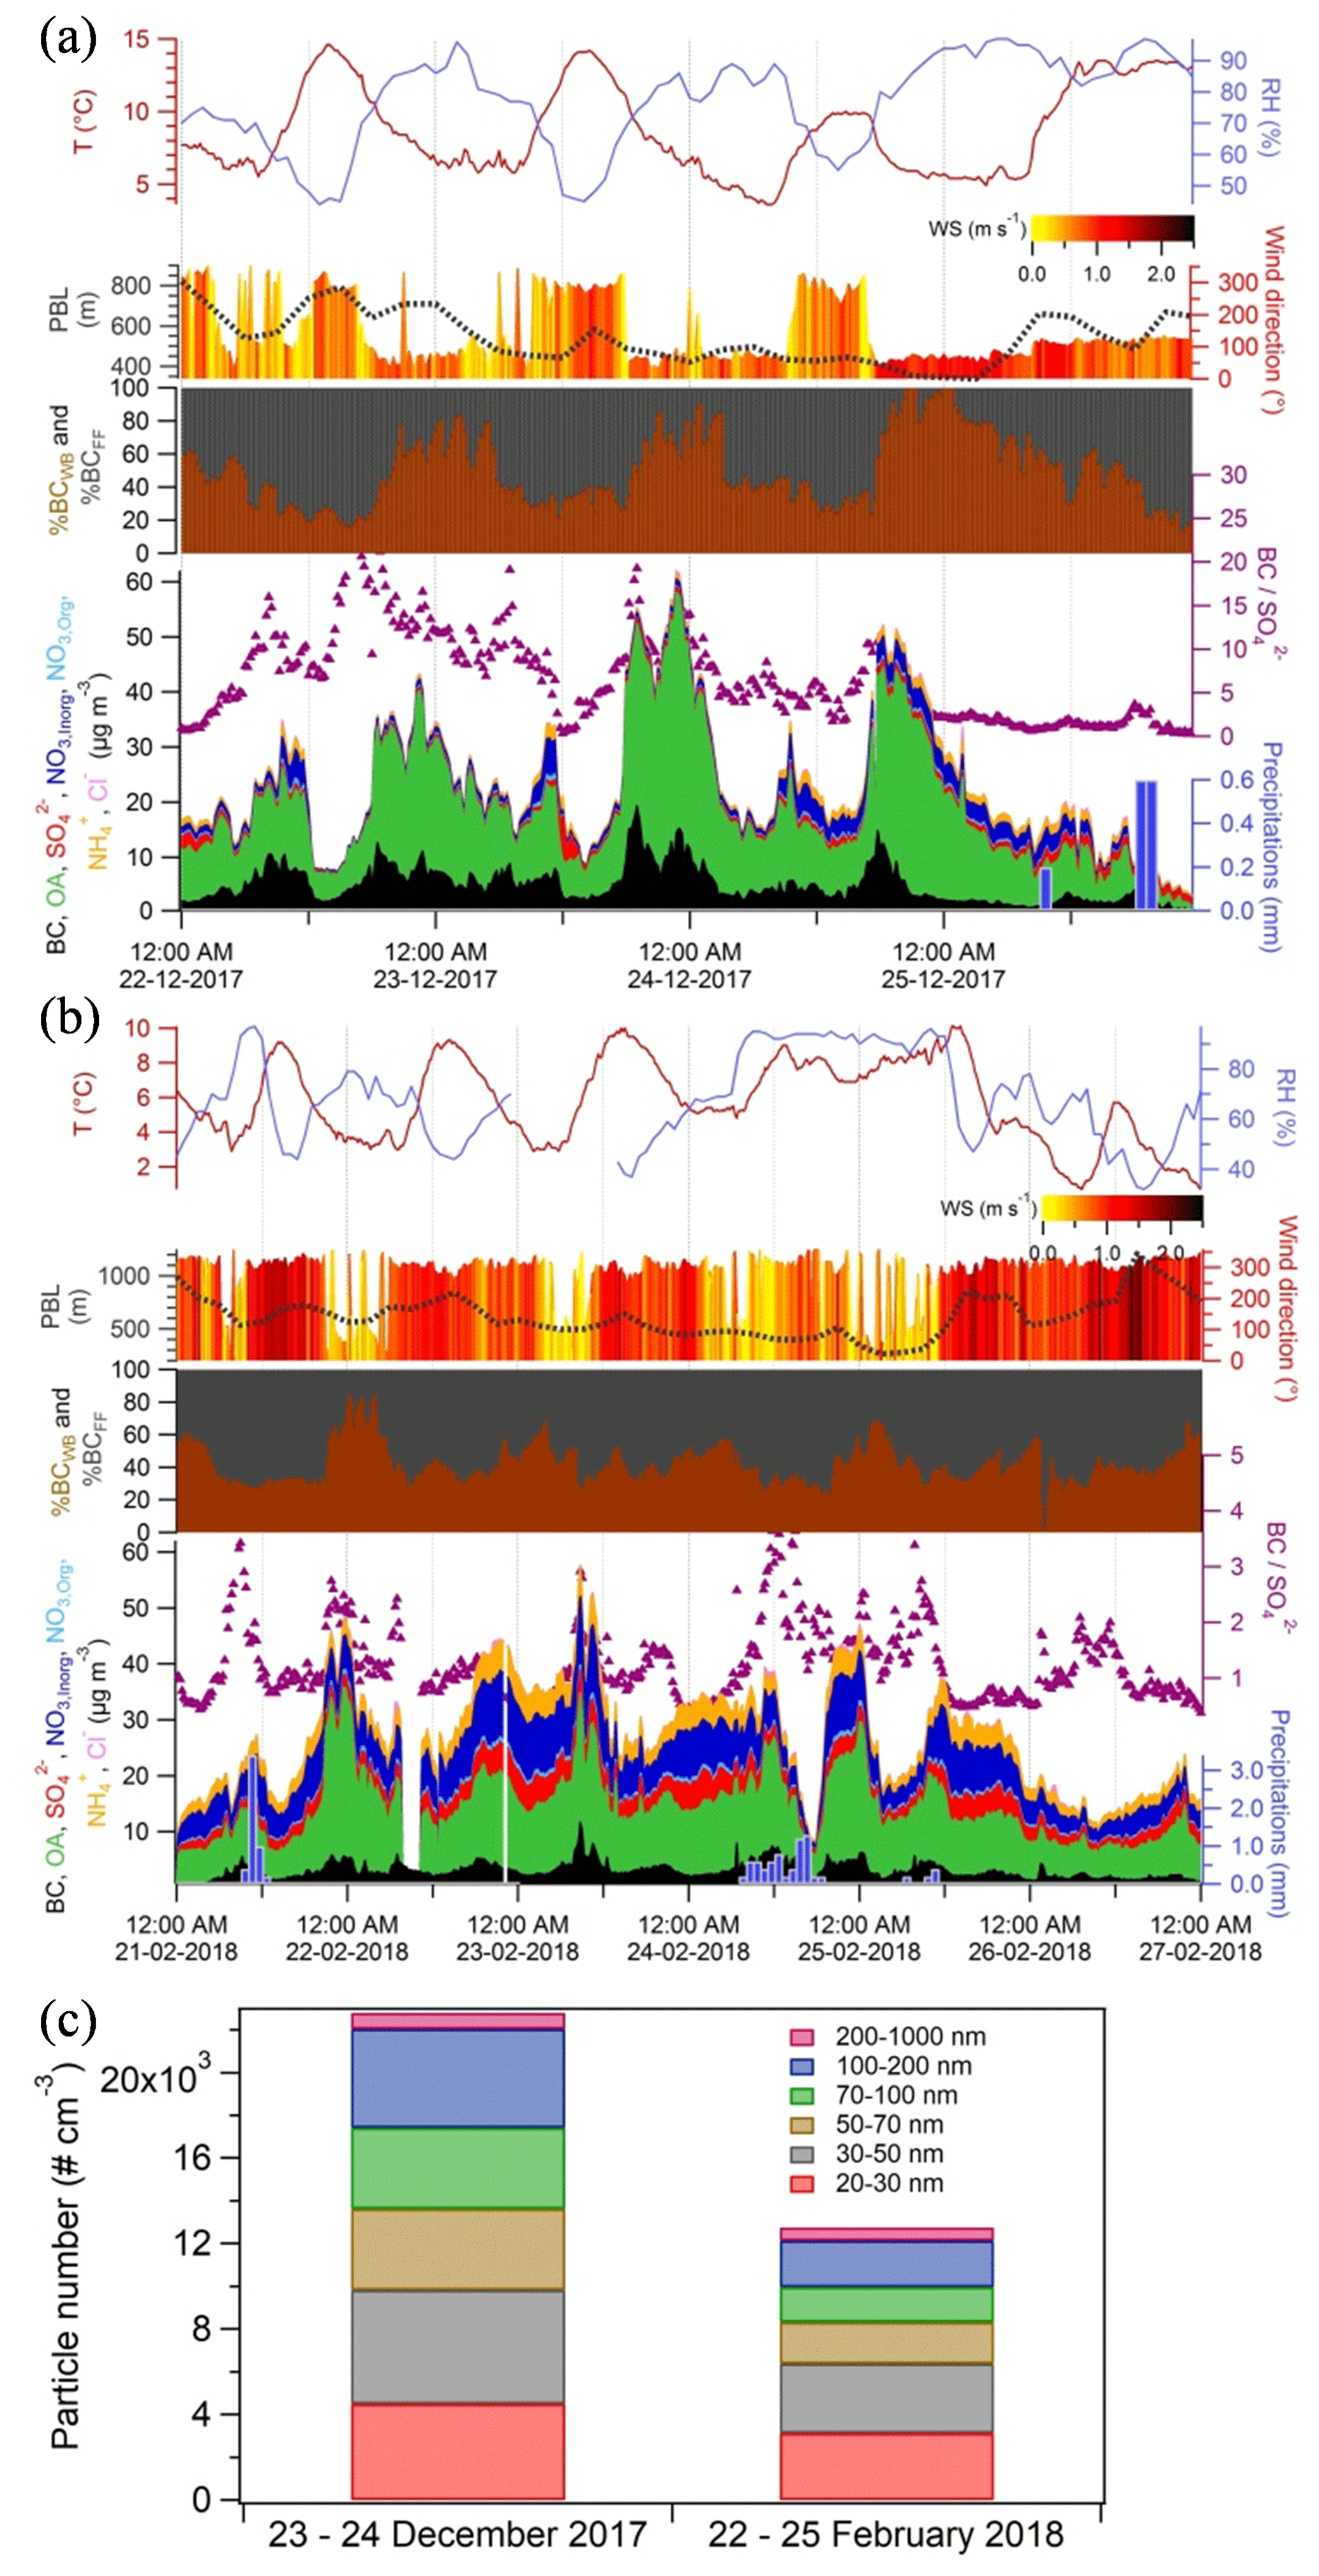
Figure 7Time series of meteorological conditions and chemical composition during the two polluted episodes: the local Christmas event (23–24 December 2017) (a) and the long-range event (22–25 February 2018) (b). The chemical composition of submicron particles (Cl−, NH, NO3,Org, NO3,Inorg, SO, OA and BC), the relative contribution of BCFF and BCWB, the BC SO ratio, and the meteorological data (temperature, relative humidity, wind direction and speed, planetary boundary layer and precipitations) are represented. The size contributions of total particle number during the two events (measured with the TSI 3031) are also shown (c).
The Christmas local episode lasted 2 consecutive days: 23 and 24 December 2017 (Fig. 7a). PM1 (ACSM+BC) concentration was dominated by OA (63 %) and BC (21 %). Carbonaceous concentrations increased mostly in the evening by a factor of 4 to 5 in the space of a few minutes with the onset of the land breeze and remained high overnight. The temporal evolution of BC contributions (Fig. 7a) clearly indicates a predominance of biomass burning with a maximum contribution of BCWB to BC of between 80 % and 100 % at night. At night PM size distribution ranged between 40 and 200 nm (Fig. S13), typical of wood-burning emissions (Coudray et al., 2009). A high BC SO ratio (average of 6.12 with values up to 20) and low wind speed conditions suggest a strong local influence. This is supported by the NWR analysis plots for OA and the biomass markers (BCWB, f60) shown in Fig. 8, indicating that high concentrations are associated with a north-easterly land breeze.
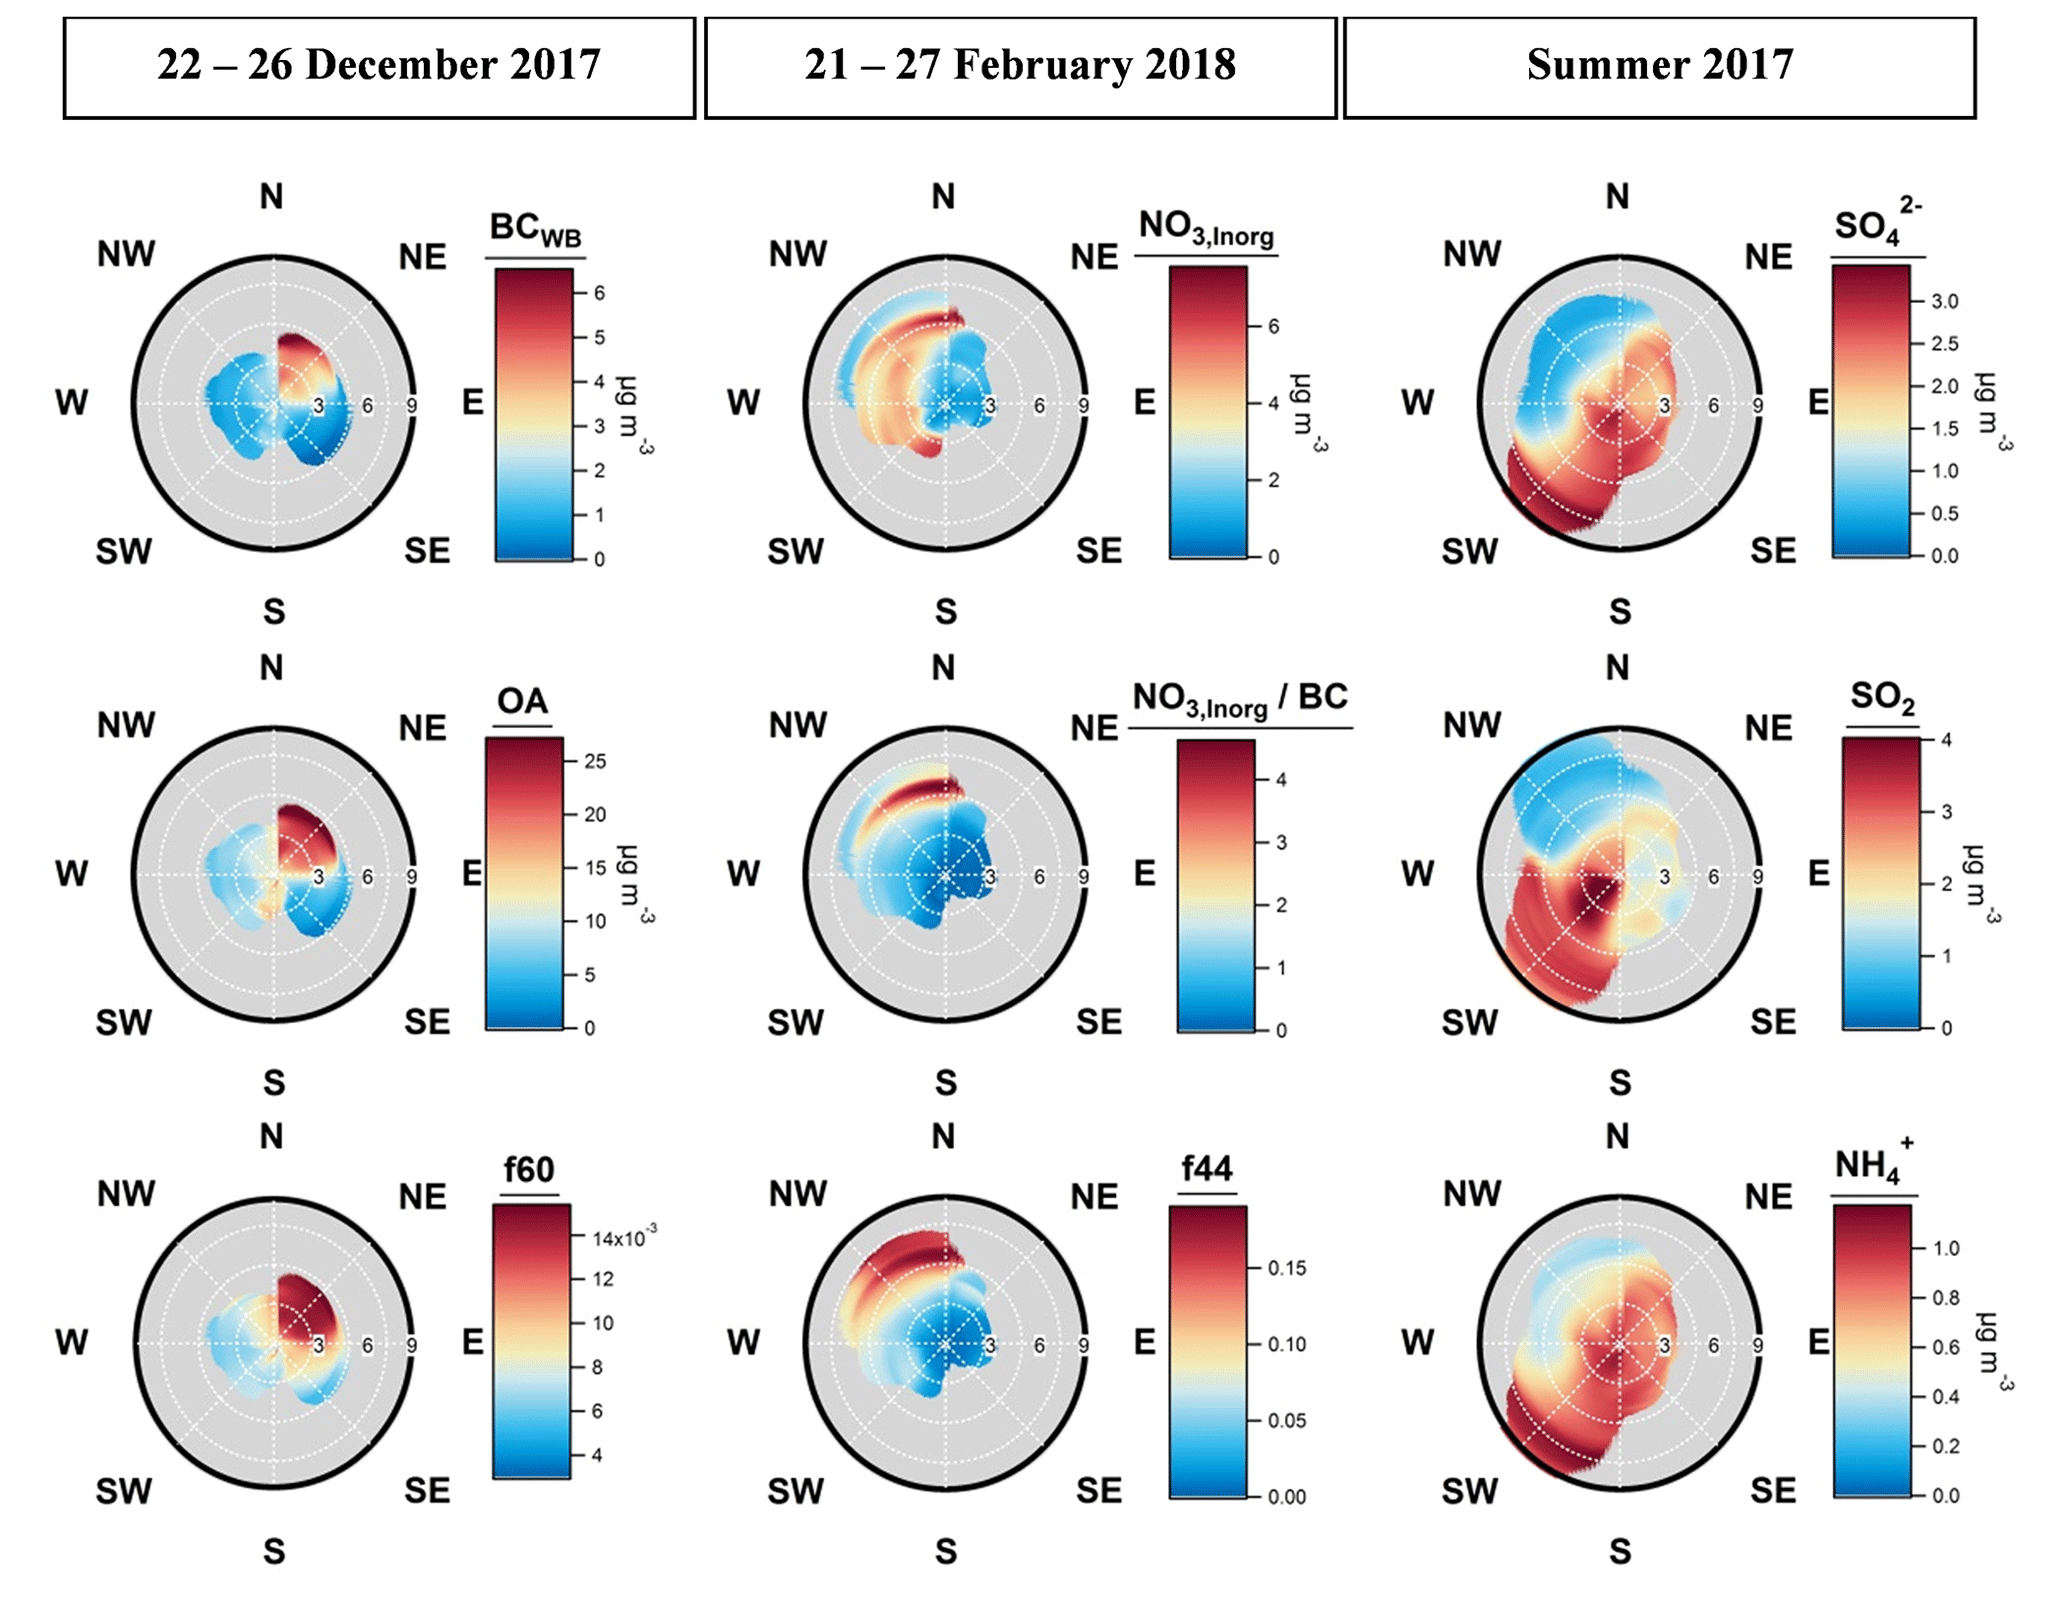
Figure 8NWR plots for the local Christmas event, SWIM-2 plots for the long-range episode and NWR plots for the summer period. BCWB concentrations, OA concentrations and fraction of the 60 ACSM organic signal are represented for the local Christmas event from 22 to 26 December 2017. NO3,Inorg concentrations, NO3,Inorg normalised by BC and fraction of the 44 ACSM organic signal are displayed for the long-range influence from 21 to 27 February 2018. The SWIM-2 analysis was performed using a rolling standard deviation over 2 h of wind measurements. The time periods for the events are extended to better catch the variability. SO, SO2 and NH concentrations are represented for the summer of 2017. Radial and tangential axes show, respectively, the wind speed (km h−1) and the wind direction (∘).
This configuration is very frequent in Marseille, as a land breeze regime prevailed 25 % of the time, as shown by the wind roses, Fig. S14. Under such meteorological conditions, the average annual PM1 concentration was 14.3 µg m−3 instead of 8.49 µg m−3 for the remaining period. These winds transport to the city anthropogenic emissions from the surrounding suburban residential areas of Marseille, in the north-easterly direction. In winter, these areas are a few degrees colder than the city of Marseille, resulting in an increased use of firewood as an auxiliary heating source. After 25 December, the PM1 levels dropped down as the wind direction shifted from north-east to east/south-east. The PM1 decrease was also favoured by the vertical dilution that occurred with increased PBL height combined with precipitations.
The February long-range event took place during a period of 4 consecutive PM2.5 exceedance days from 22 to 25 February 2017 (Fig. 7b) and was ended as a higher PBL height that led to the dilution of atmospheric pollutants. The aerosol chemical composition was relatively stable with an OA contribution of 41 %, followed by NO (25 %), BC (12 %), NH (11 %), and SO (10 %). While this measurement period was not complemented by a SMPS, the comparison between the PM1 mass concentrations found in both periods (31.1 µg .m−3 for the February event and 28.7 µg m−3 for the Christmas event) with their respective total number concentration as determined with the TSI 3031 (12 800 and 22 800 cm−3) indicates that the mass-weighted particle size distributions were shifted to a larger size during this episode (Fig. 7c). This event is characterised by a low BC SO ratio (average of 1.13), suggesting advection of aged and processed air masses. The BC SO ratio can reach values of 4–5 though, when regional background concentrations are enriched by local BC emissions, contributing to an enhanced particle level. The secondary origin of the aerosol is confirmed by the high content of ammonium nitrate. Figure 8 shows a SWIM-2 analysis plot for NO3,Inorg, indicating that the main dominant wind sector for this species is north to south-west, with the highest concentration from north/north-west at high wind speed (≈ 1.8 m s−1) and south/south-west at low wind speed (≈ 1.1 m s−1). This result likely shows a combined local pollution with medium-/long-range transport of secondary species during this time. In order to avoid local influences, wind regression analysis was conducted on NO3,Inorg normalised by BC. The resulting plot shown in Fig. 8 reveals the northerly/north-westerly sector origin, corresponding to mistral wind (wind speed between 1.8 and 2.2 m s−1) conditions. A similar result is obtained with f44, which suggests that a high fraction of processed organic aerosol is also associated with this event.
Analysis of the 72 h back trajectories (n= 32; displayed every 3 h) displayed in Fig. S15 shows that the air masses came essentially from eastern and central Europe, passed over Switzerland and northern Italy and were then channelled along the Rhône Valley corridor toward the Mediterranean Sea under a mistral regime. The CWT analysis for the nitrate supports this hypothesis since it shows a potential source region in the north-eastern part of the Po Valley (Fig. S15). The Po Valley is well known for its high levels of inorganic (Diémoz et al., 2019; Schaap et al., 2004b; Squizzato et al., 2013) and secondary organic aerosol (Saarikoski et al., 2012). The plain is enclosed by the Alpine chain and the Apennines, limiting the dispersion of pollutants and thus leading to frequent pollution events. During the winter/spring period low temperature and high humidity may favour ammonium nitrate particle formation (Schaap et al., 2004b). The hotspot along the Rhône Valley can be connected to the intense nitrogen fertilisation in this period, causing high levels of NH3 emissions in the area (Ramanantenasoa et al., 2018) and leading to enhanced ammonium nitrate formation. Additionally, industrial emissions from areas along the valley, such as the “Chemical Valley” in the south of Lyon, can contribute to this episode.
As similarities can be found within the 15 exceedance days, it was possible to gather them in one of the two categories previously described (local event and regional/long-range event) according to some key criteria listed in Table S5.
The local events were characterised by a high BC SO ratio and an enrichment of PM2.5 concentration under land breeze. Local pollution is expected to be advected by land breeze; therefore, ΔPM should significantly increase during these days. Local events were also heavily impacted by biomass-burning particles, as revealed by the high BCWB contribution to PM2.5 (fBC in Table S5). Investigation of the ratio of f44 to f60 indicates that these are mostly fresh biomass emissions as evidenced by the high f60 (> 0.01) and low f44 (< 0.01) when particle concentrations are at their highest (30 µg m−3) (Fig. 9). For regional/long-range episodes, the variability of f44 and f60 is larger as the aging degree of particles is expected to vary from one air mass to another and as the air masses may be affected by local biomass-burning emissions. It is noteworthy that some observed values within the f60 background (≈ 0.3 % ± 0.06; Cubison et al., 2011) denote no evidence of fresh biomass-burning emissions during these episodes.
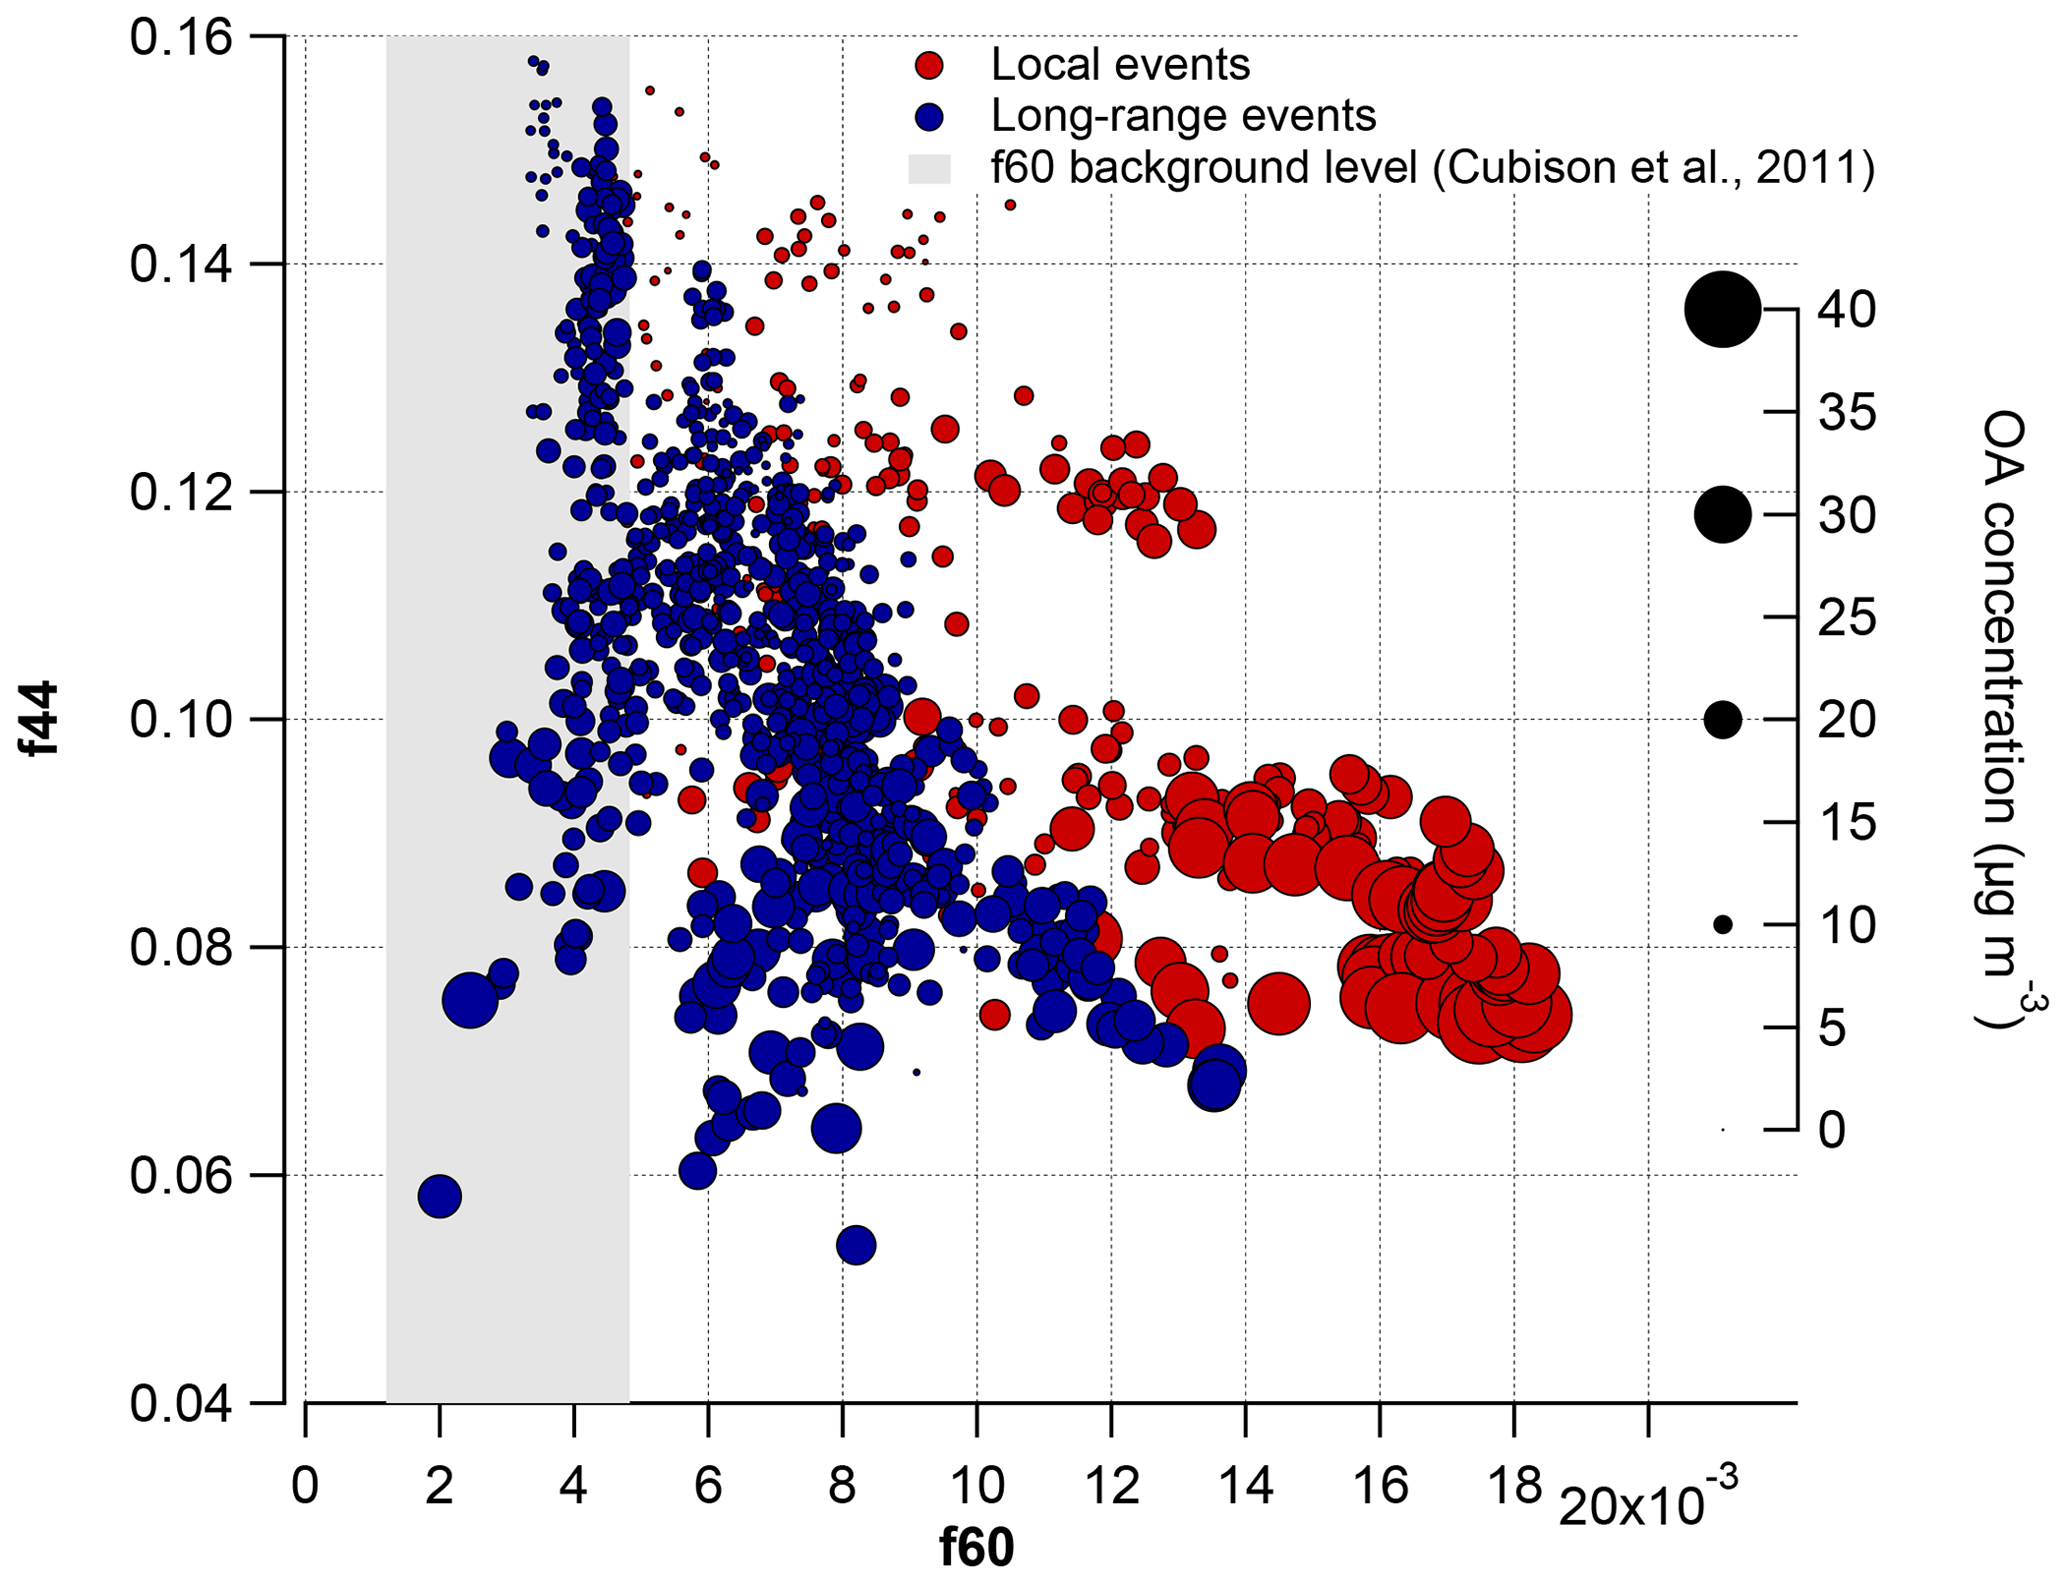
Figure 9f44 vs. f60 ratios during the local events (dark red circles) and the long-range events (dark blue circles). The size of markers is proportional to the OA concentration. The grey area represents the f60 background level defined by Cubison et al. (2011) (0.003 ± 3 times the standard deviation).
The regional/long-range events were associated with an enhanced mass fraction of nitrate (fNO in Table S5) and higher wind speeds occurring during these days. The probability density distributions of these criteria are presented in Fig. 10. As expected, the graphs show larger BC concentrations and f60 contributions during the local events, with a wind frequency dominated by land breeze (5–90∘) driving the pollution and to a lesser extent sea breeze and mistral winds (210–360∘). Regional/long-range events were affected by higher NO concentrations and higher wind speeds. Even if f44 was slightly larger during these events, the distribution is in the same range as the one for local events. As mentioned previously, the local pollution is combined with the long-range transport during these events, reducing the f44 values with the increasing hydrocarbon fragment contribution. This is supported by the wind frequency which, despite the mistral dominance, is still affected by a low land breeze influence. In terms of frequency of occurrence, 40 % of exceedance days account for local origin (6 d) and 60 % for long-range transport influence (9 d).
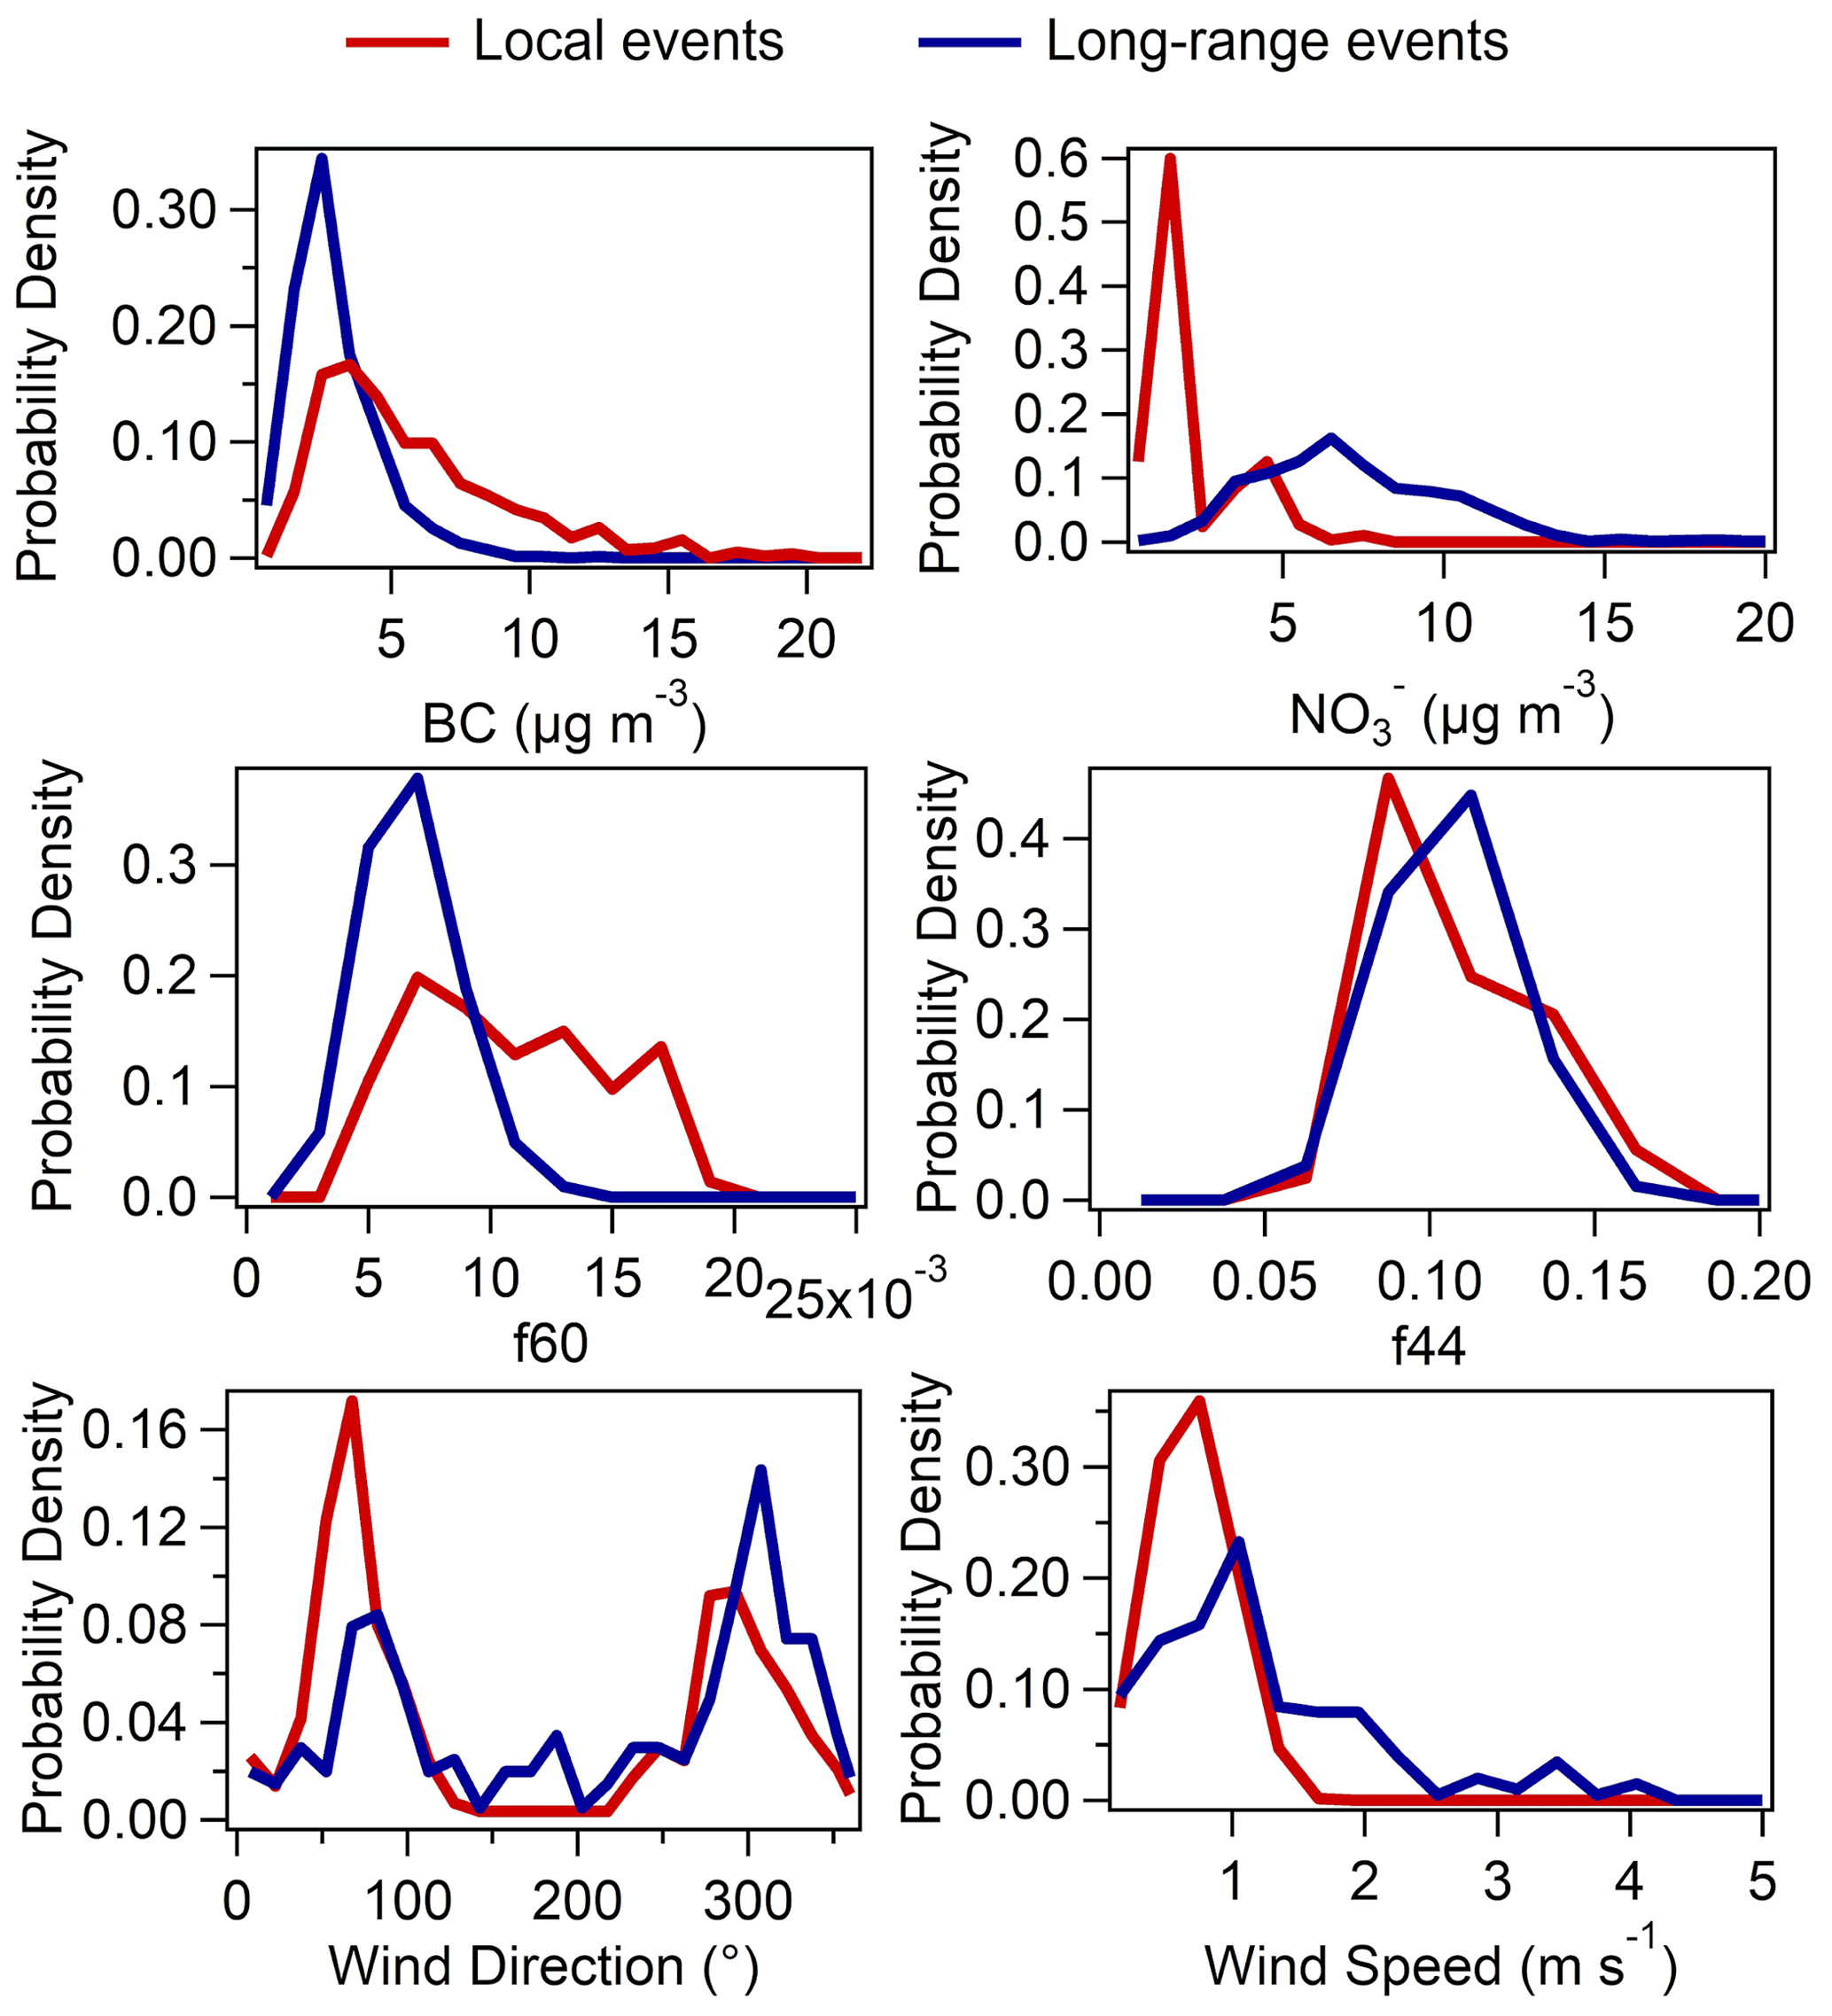
Figure 10Probability density distributions of BC, NO, f60, f44, wind direction and speed during PM2.5 exceedance days belonging to local (dark red) and long-range (dark blue) categories.
Globally, the combined observations of phenomenology, chemical composition and meteorology allow us to accurately analyse events with exceedance mass concentrations for fine particles at the MRS-LCP supersite, highlighting variable situations in an urban area affected by different air mass origins.
3.4.2 Sulfate origin and shipping/industrial plumes in summer
The summertime aerosol contributes little to the exceedance of PM2.5 air quality thresholds (Fig. 1). This season accounts for only 10 % of the exceedance days since 2008, and none of these occurred in 2017–2018. Still, the high solar radiation and temperature combined with the dry condition are expected to enhance the formation of secondary pollutants and their accumulation. High ozone levels often exceeding the WHO threshold are indeed recorded in Marseille (Sect. 3.1). These conditions also affect the aerosol composition as it results in an enhanced secondary sulfate fraction (see Sect. 3.3.2). NWR plots of sulfate and its precursor SO2, shown in Fig. 8, indicate that their occurrence is preferentially associated with the south-westerly sector and covers a broad range of wind speeds. This wind sector is representative of the sea breeze conditions that prevail in summer and that blow inland coastal emission sources. Known local potential emissions sources include the large petrochemical and industrial area of Fos-Berre, located 40 km north-west, the shipping traffic in the Gulf of Fos related to these activities and the Marseille harbour, located 3 km away from the site. During summertime, the ship traffic described as the sum of ship movements (arrivals and departures) increases by 25 % (4319 movements against 3262 movements for the 2017–2018 period), partly because of the enhanced numbers of passenger ferries and travel cruises during the holiday season.

Figure 11Diurnal profile of cumulative number of ship movements for the summer 2017 period, coloured according to the basin location (blue for north, green for east, red for south) and the type of movement (dark-coloured for arrival, light-coloured for departure). Diurnal profiles of SO2 in purple, SO in red and wind direction in grey (the size of dots is proportional to the wind speed intensity) are also represented. The data points linked to low speed conditions (< 0.5 m s−1) were filtered out from the analysis.
Figure 11 shows the diurnal trend of the cumulative number of ship movements for the summer of 2017. This number was differentiated according to the type of movement and the basin location (the exact geographic positions are reported in the Supplement in Fig. S1). As can be seen by the diurnal profile of the ship movements in the harbour, two maxima were observed: the first at 05:00 UTC due to ship arrivals and the second at 17:00 UTC due to ship departures. Once the sea breeze sets in (06:00 UTC), the highest SO2 peak might be related to the ship arrivals' increase; however, El Haddad et al. (2011a, 2013) assigned similar morning SO2 plumes to industrial activity from Fos-sur-mer in summer. Thus, the first SO2 increase could arise from a combination of the contribution from ship arrival and industrial air masses, whereas the second peak could be mostly linked to the late afternoon boat departure. It should be noted that SO2 concentrations slightly increase earlier during the night (00:00–04:00 UTC) and can be linked to scarce wind advections from the sea, also related to the ship traffic and not caught by the average wind diurnal cycle in Fig. 11. SO concentrations increased during the day and could also be partly affiliated with the direct influence of shipping/industrial activity on the monitoring site. In addition to these local sources, long-range transport from the Mediterranean basin of sulfate and its precursor can also contribute to the levels of sulfate observed.
The variability of the summer daily patterns of sulfate was investigated using a k-means clustering algorithm run on the hourly concentrations. The method is further described in the Supplement. From this analysis, three distinct clusters were assessed, accounting for 20, 16 and 27 d for cluster 1, cluster 2 and cluster 3, respectively. The resulting average diurnal patterns of sulfate, O3, SO2 and N2 (10–20 nm) (whose diurnal profiles were found to be closely linked to SO2; see Sect. 3.3.3) and wind profiles are shown in Fig. 12 for each cluster. The three clusters are confirmed to be mainly driven by the diurnal sea breeze cycle that blows towards the city from 06:00–08:00 to 20:00–21:00 UTC. Cluster 1 seems to be related to the regional background of sulfate as it is associated with the lowest concentration (≈ 2 µg m−3) and a flat diurnal profile. Meanwhile, SO2 and N2 (10–20 nm) increase simultaneously as the breeze sets in to the peak at 4 µg m−3 and 8000 cm−3, respectively, at 10:00–12:00. The comparison of the daily profiles indicates that sulfate is fully decoupled from its precursors in this cluster and that no significant conversion of SO2 to sulfate occurs by the time the air mass reaches the site.
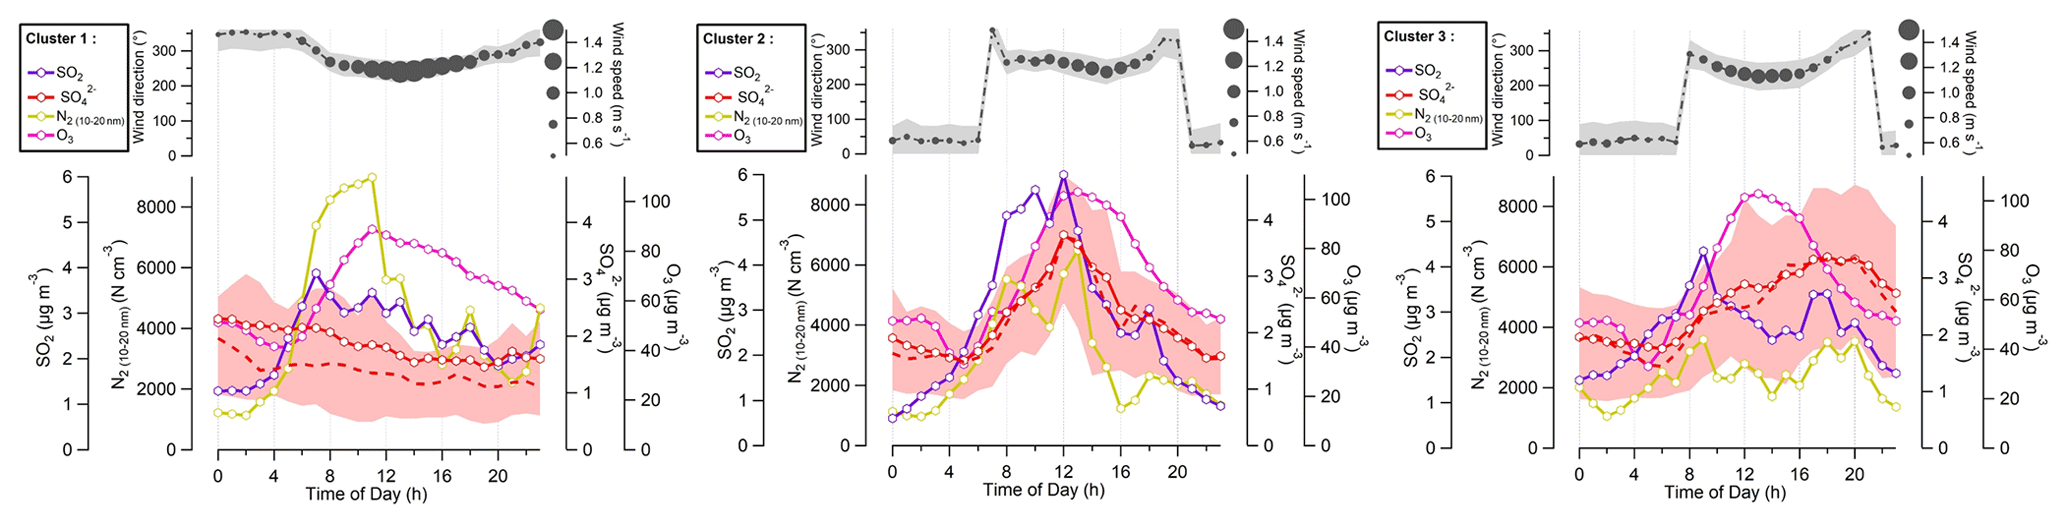
Figure 12Diurnal cycles of SO, SO2, N2 (10–20 nm) and O3 for the three clusters in summer 2017. Solid lines denote mean profiles, red dashed line is the median and red shaded area is the 25th–75th percentile range for SO. The average diurnal cycles for wind direction are also shown in the upper panels, with the size of dots depending on wind speed and the grey shaded area representing ± the standard deviation of wind.
By contrast, cluster 2 gathers days when the sulfate concentrations are well correlated with the N2 (10–20 nm) and SO2 daily profiles that show maximum concentrations of 6 µg m−3 and 6000 cm−3 at 12:00. Sulfate concentration peaks at the same time (≈ 3.5 µg m−3). The cycle may reflect the transport of rather fresh to moderately processed plumes that regularly reach the site. The molar ratio of sulfate to total sulfur, indicative of SO2-to-sulfate conversion, grows when photochemical activity is expected to be at its highest (between 11:00 and 16:00 according to the highest concentrations of the O3 diurnal profile), from 0.3 (10:00) to 0.5 (16:00) (Fig. S18). Based on this observation, it is hypothesised that this cluster is also representative of days when SO2-to-sulfate conversion occurs.
In cluster 3, the sulfate concentration is found to progressively increase during the day and reaches a concentration of 3 µg m−3 at 20:00. SO2 and N(10–20 nm) exhibit similar variations with two peaks at 08:00 (4 µg m−3; 3800 cm−3) and 17:00 (3 µg m−3; 3800 cm−3). It is presumed that cluster 3 is related to the most processed air masses as it exhibits the highest SO-to-SO2 mean ratio (mean 06:00–19:00 value; 0.58 against 0.45 and 0.39 for clusters 2 and 1, respectively).
NWR analyses were carried out to locate potential sources of sulfates nearby the site. In addition, CWT analyses were used to identify potential distant sources. Results from NWR and CWT for the three clusters are shown in Fig. 13.
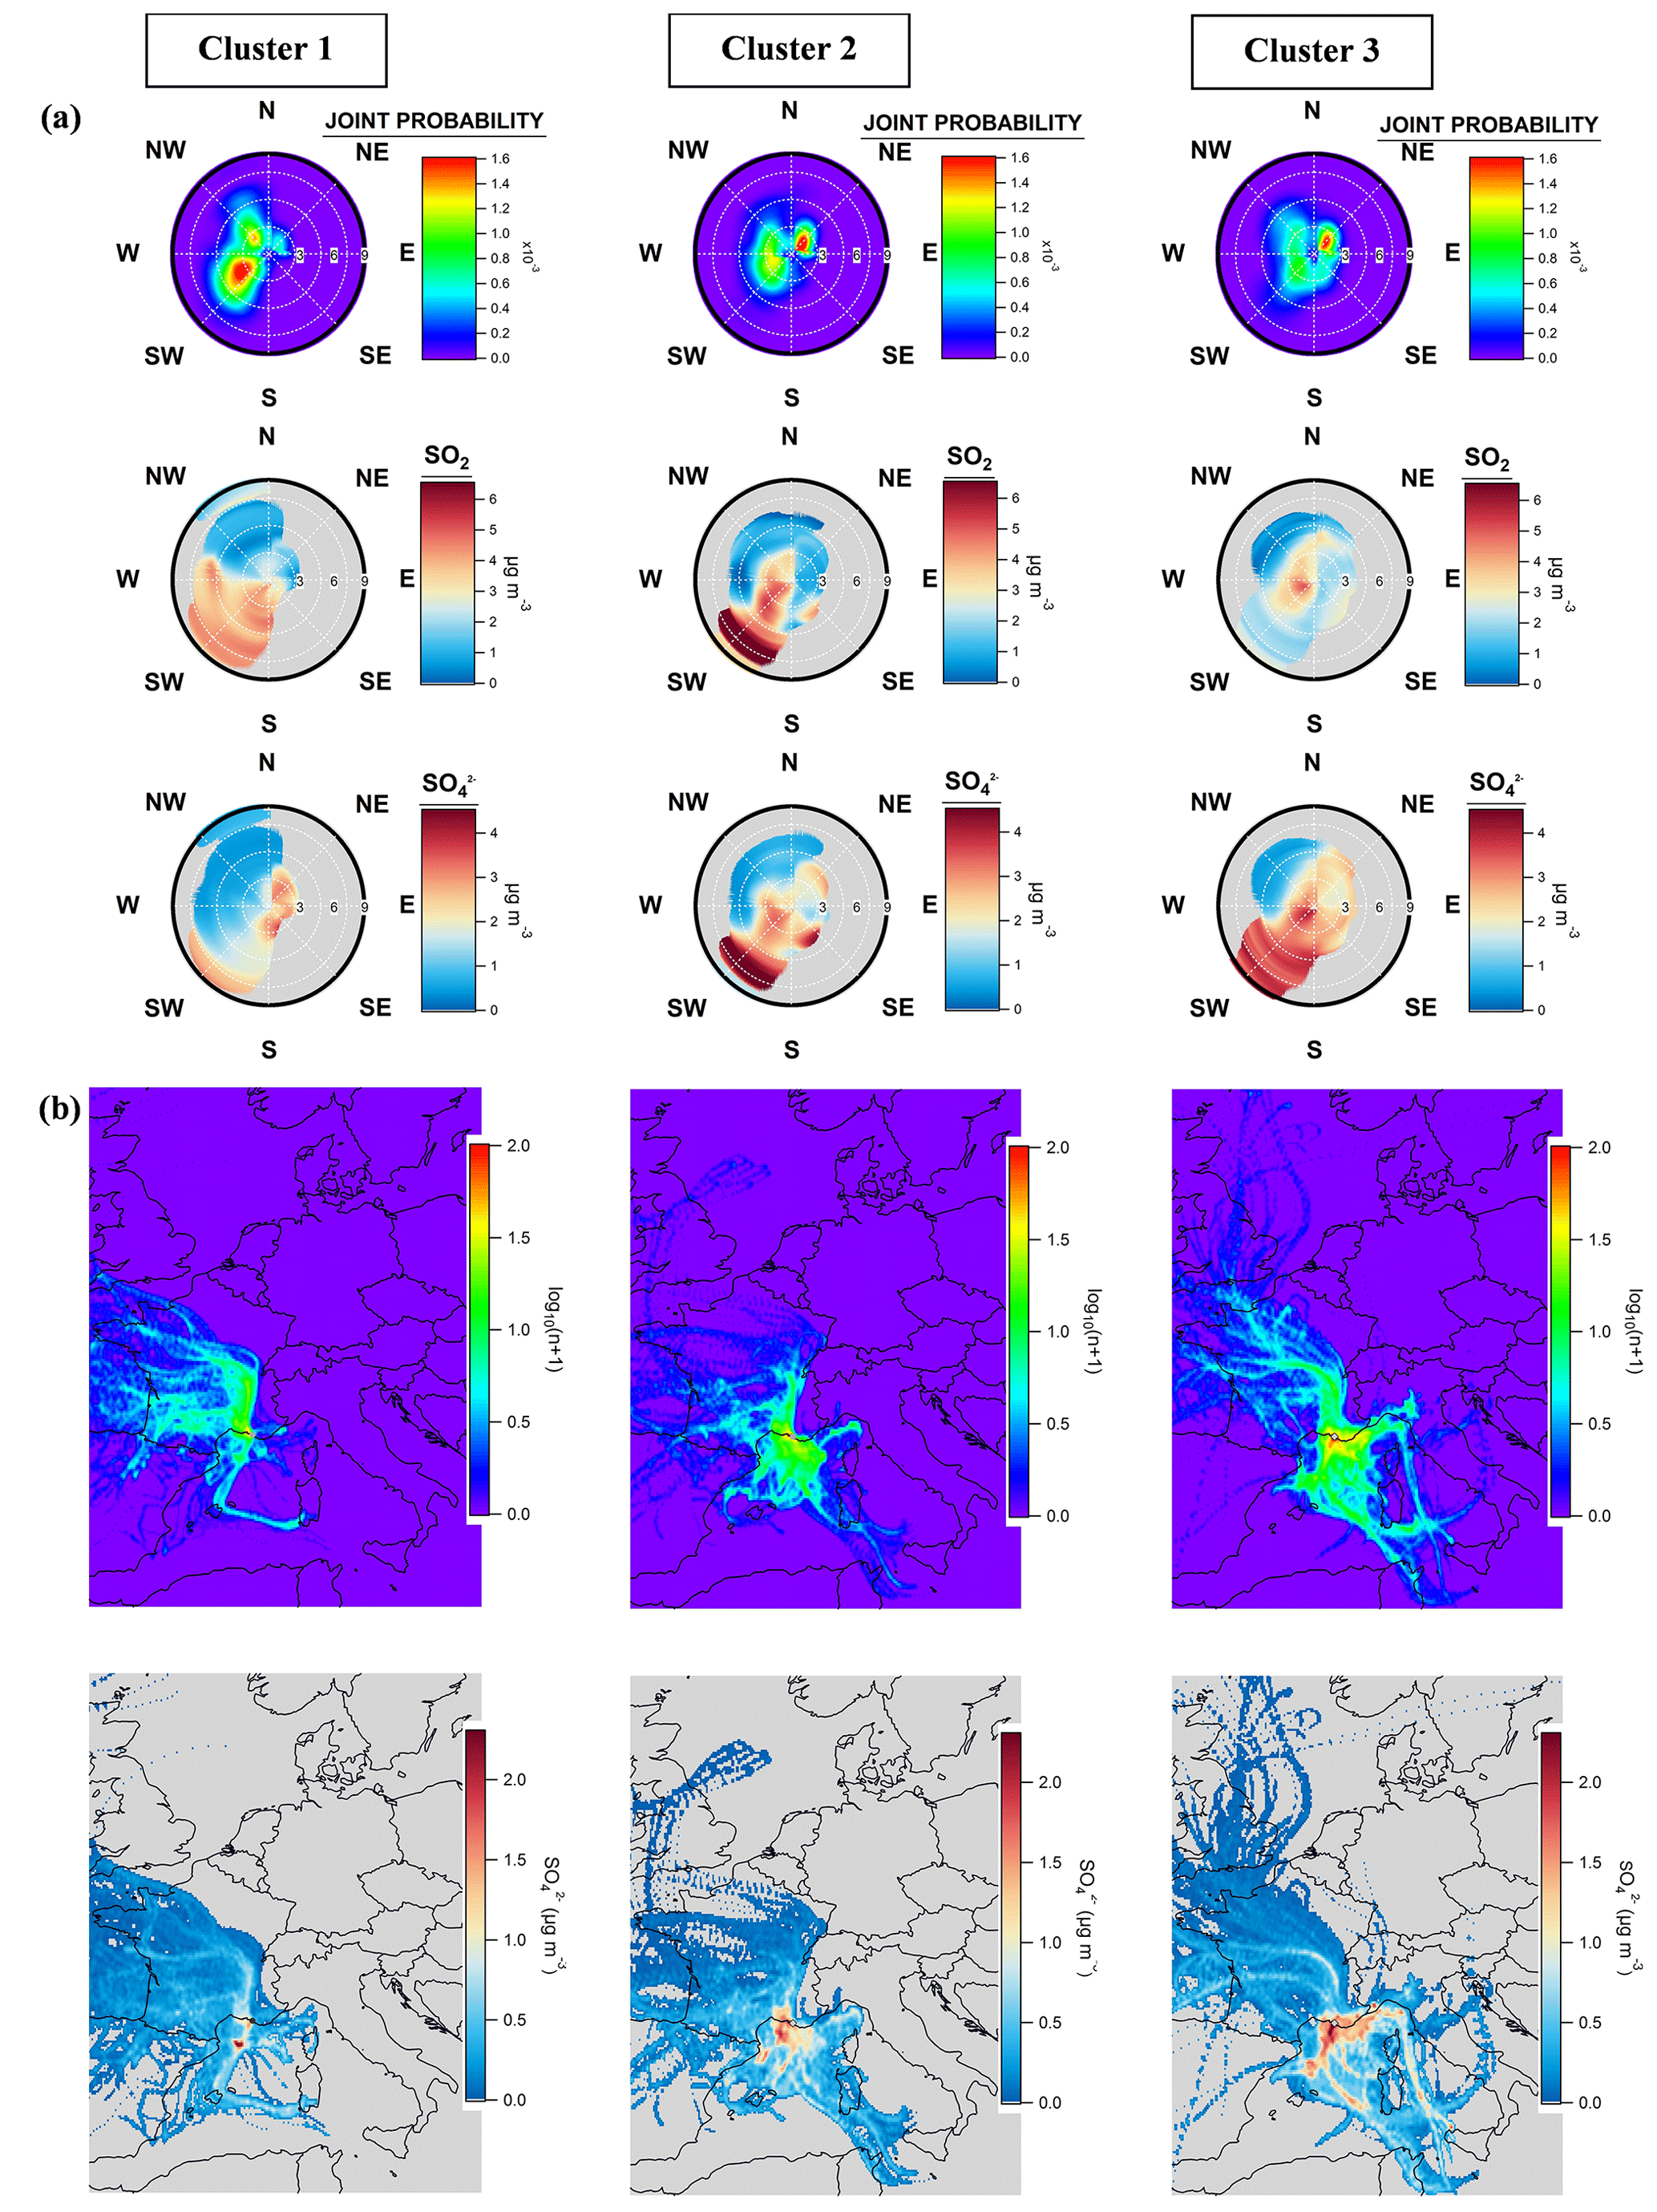
Figure 13Joint probability distributions of winds (a) and NWR plots (b) of SO2 and SO for the three clusters (a). ZeFir trajectory density for 72 h back trajectories (generated every hour at the MRS-LCP station) and CWT maps for SO (in µg m−3) are also displayed for the three clusters (b). The log10(n+1) colour scale corresponds to the occurrence of back-trajectory endpoints which drop into a particular cell. A discrete function based on log10(n+1) was applied to down-weight data with high concentrations but a low number of trajectories passing through a particular cell, as recommended by Waked et al. (2014). The aim was to avoid local sulfate influence from the transport model.
Cluster 1 is preferentially associated with the north-westerly sector (corresponding to the mistral wind) and the area of the sea breeze with the highest speed as indicated by the joint probability polar plot. The average wind speed was 0.9 m s−1 against ≈ 0.7 m s−1 for clusters 2 and 3, respectively. The NWR plots confirm the hypothesis of the potential origin of sulfate and SO2 in the three clusters: in the case of cluster 1, sulfate and SO2 are disconnected from each other, while they have the same south-westerly origin in cluster 2, as indicated by the similar hotspots in the plots (also displayed in Fig. S19b). Cluster 3 exhibits moderate sulfate concentrations in a broader range of wind speed and in a larger south-westerly direction, consistent with a significant regional feature. The increasing sulfate concentrations from the south-westerly direction reach their maxima during early evening, as shown in Fig. S19c. A south-easterly wind circulation can be more pronounced for some days of cluster 3, also contributing to the SO enhancement (Fig. S20). It should be emphasised that some rare land breeze from the north-east brings further background sulfate concentrations back to the city for the three clusters (Fig. 13a).
On a larger scale, the CWT analysis of cluster 1 corresponds to a background level without a distinct origin. A clear hotspot in the south-west (also shown in Fig. S19a) is connected to the night of 23 July corresponding to the end of a sulfate advection from cluster 3. The combination of the k-means clustering and the CWT analysis can suffer from this bias, as the times series that arise from the k-means clustering are essentially segmented 24 h periods. The CWT of sulfate for cluster 2 clearly shows a hotspot along the southern coast of France (“Golfe du Lion”) that encompasses the industrial area of Fos-sur-mer, while sulfate of cluster 3 is associated with air masses that expand over a larger area in the Mediterranean basin. The highest sulfate concentrations are located on the main shipping routes in the Mediterranean, from the north of Spain along the French coast and the western coast of Italy (Nunes et al., 2020). This is not unexpected as the maritime shipping emissions have been estimated to account for more than 50 % of the sulfate in the western Mediterranean (Aksoyoglu et al., 2016). These hotspots are also observed in the SO2 and SO surface mass concentrations in summer 2017 from the MERRA2 model (Fig. S21a and b), which is based on the Goddard Earth Observing System (GEOS) atmospheric data assimilation system (ADAS) (Gelaro et al., 2017).
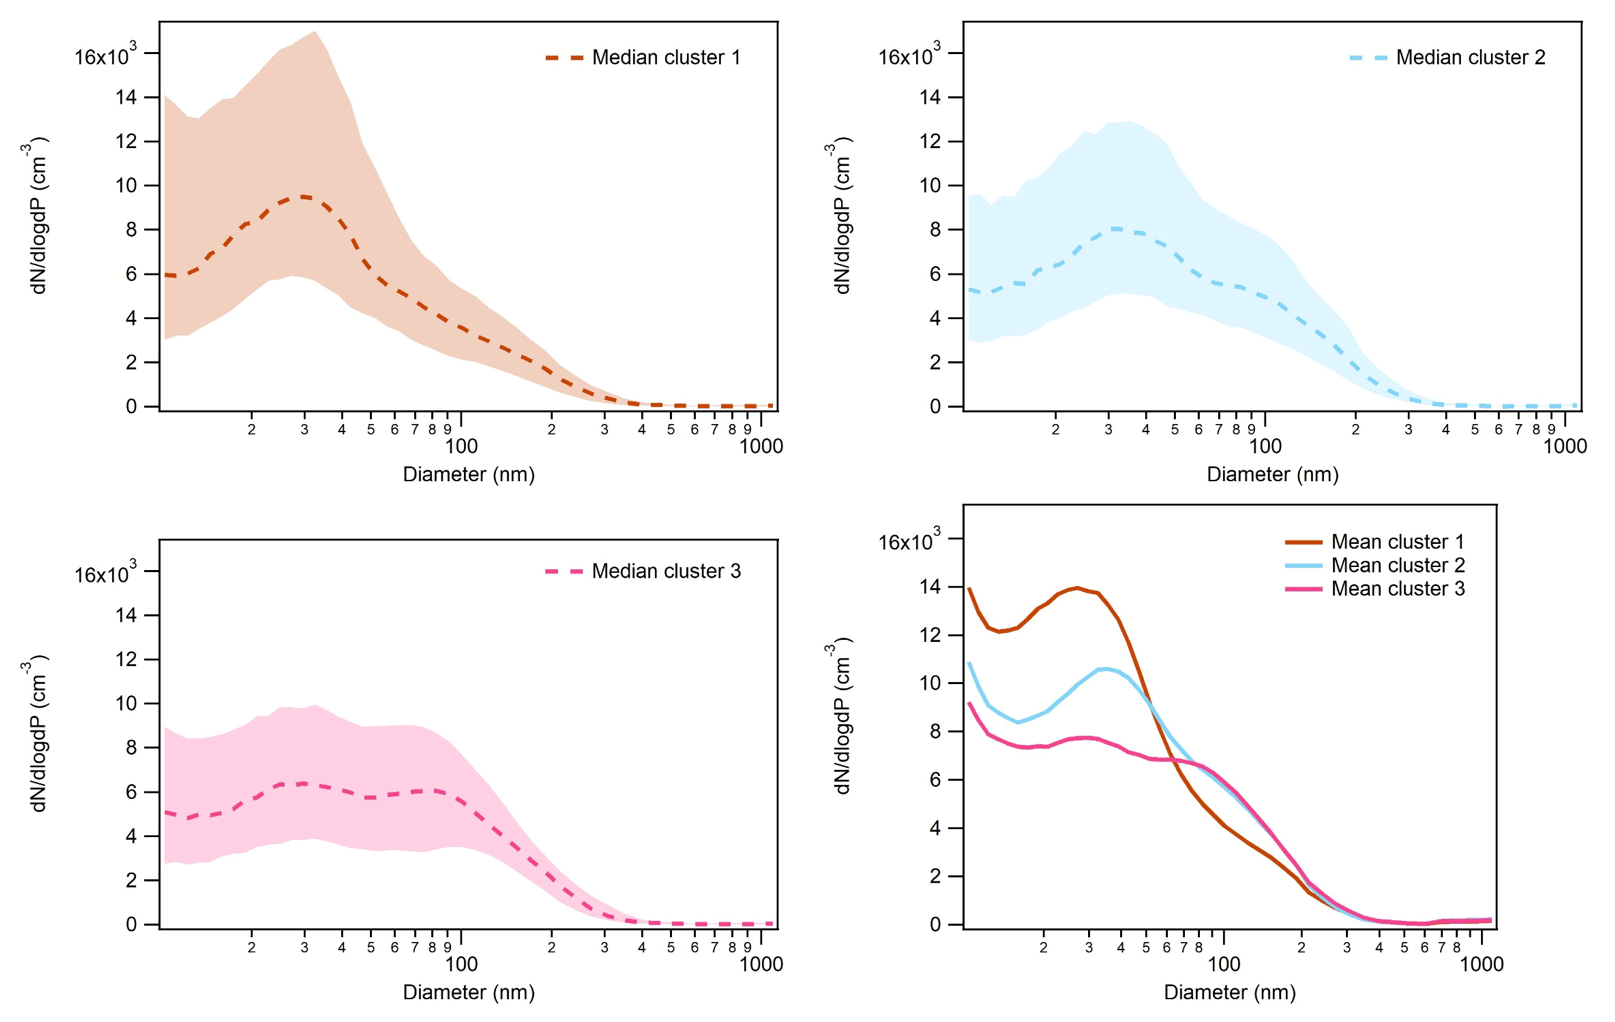
Figure 14Number size distributions of the three clusters in the 10–1000 nm range from SMPS GRIMM measurements. Dashed lines are the medians, shaded areas are the 25th and 75th percentile boundaries and solid lines are the means.
The chemical composition and size distribution tend to support the distinct features identified between the three clusters: cluster 1 has the lowest PM1 concentration level, with 7.7 µg m−3 against 10.3 and 9.9 µg m−3 for clusters 2 and 3, respectively. The greater influence of the local emission on cluster 2 than on cluster 3 is reflected by the higher black carbon content and the lowest sulfate content (Table S6 and Fig. S22). It is also reflected by the higher total number concentration and a more pronounced Aitken mode observed on cluster 2 (Fig. 14). Both clusters 2 and 3 have an additional accumulation mode that has been already observed for aged aerosol passing over the Mediterranean Sea (Mallet et al., 2019).
The chemical composition of submicron aerosols was monitored in real time between 1 February 2017 and 13 April 2018 at an urban background site of the Mediterranean city of Marseille. Measurements were carried out with a ToF-ACSM associated with a suite of collocated instruments including an aethalometer, an ultrafine particle monitor, a SMPS and monitors for regulated pollutants (PM, NOx, O3, SO2).
The reconstituted PM1 mass (ACSM measurements + BC) was cross-validated through several comparisons with external parameters. ACSM+BC concentrations were found to be in good agreement with estimated mass concentrations from SMPS (R2= 0.81 and slope = 1.02) and PM1 concentrations from FIDAS (R2= 0.89 and slope = 0.9).
OA was the most abundant species of submicron aerosol, with an annual average of 49.7 %, and the carbonaceous fraction was dominant for every season (66.8 %) and especially during cold months. BC contributes largely to this fraction (17.1 % of total submicron aerosol) and is mainly dominated by fossil fuel emissions as determined with the AE-33 aethalometer model. BC from wood-burning emissions showed a higher contribution during winter and a very low contribution in summer, as expected.
The organic nitrate contribution was evaluated using the NO NO+ ratio method and gave reasonable results in separating NO3,Org and NO3,Inorg concentrations. Some uncertainties still remain as RON was set to a fixed value and could slightly vary according to the VOC precursors which lead to particle organic nitrate formation. Also, a low nitrate signal provides unstable Robs and could enhance the uncertainty of the estimation. The NO3,Org fraction was 20 ± 7 % for the total nitrate (representing 10.2 % on average for the PM1 concentrations) during the entire period and did not significantly contribute to enhanced polluted events with high PM1 concentrations. However, organic nitrate contribution to total OA could be estimated to significant values, with a maximum during springtime (18 %–28 %).
Particle number concentration was successfully segregated into two components (N1 and N2) by using the minimum slope found in the N vs. BCFF plot, with BCFF accounting for primary particles. N1 was attributed to fresh primary traffic emissions and N2 to secondary particles. The secondary N2 fraction was predominant, with number concentrations 1.02 to 1.7 times higher than N1. While N1 showed clear maxima during morning and evening traffic rush hours, N2 was either attributed to dilution/cooling and mixing of vehicular exhausts in the atmosphere during cold seasons or to photooxidation products of gaseous precursors during hot seasons. These results revealed the importance of secondary particle formation and contrasted seasonal sources of UFP number.
PM1 pollution events were determined according to the daily concentrations exceeding WHO recommendations. To illustrate their differences in chemical composition, meteorological dynamic and geographical origins, two events (23–24 December 2017 and 22–25 February 2018) were carefully examined. BC SO ratio, non-parametric wind regressions and back trajectories provided important information to discriminate local and long-range transport contributions. The local contribution during exceedance days is attributed to an increase in biomass-burning emissions with domestic heating and green waste burning, cumulated with intense traffic. In those situations, the OA and BC concentrations strongly increase at night in the space of a few minutes when the nocturnal land breeze set-up and the boundary-layer height decrease. The long-range pollution case led to a high increase in secondary aerosol, more precisely ammonium nitrate and oxygenated OA transported from central Europe and notably the Po Valley to the city. The investigation of the total PM2.5 exceedance days (based on ratio, BC contribution to PM2.5, nitrate contribution to PM1, wind speed and ΔPM) highlighted that local influences are mainly responsible for continuous background pollution, and its mix with long-range transport events can trigger situations with high exceedance levels of fine particles. This elevated pollution occurred mostly in winter and early spring with favourable wind conditions. Even if no exceedance day was found during the summer season, the chemical composition is slightly different, with higher sulfate contributions and intense UFP plumes (mostly between 10 and 20 nm) associated with SO2 advected on site. A k-means clustering analysis has been performed to inspect sulfate variability from summer days which can be driven by several origins. Over the 63 d including in the analysis, 20 d were attributed to background sulfate concentrations and 16 d to enhanced concentrations under the direct influence of the harbour and industrial areas. The remaining days (27) were attributed to mixed sulfate sources with a regional influence. In addition to local industrial and shipping activity, regional Mediterranean air masses can bring higher sulfate concentrations from aged shipping plumes, probably mixed with other sources such as marine biogenic or crustal ones.
In conclusion, the supersite MRS-LCP successfully recorded up to 1 year of observations and seasonality of fine particles. The long-term real-time monitoring in MRS-LCP showed a great potential and will supply direct information to public authorities and citizens. It may provide better understanding of pollution episodes and more effective control of local mitigation within the context of the French Atmosphere Protection Plan.
Raw data from the study are available at https://doi.org/10.7910/DVN/VBDW2C (Chazeau, 2021). More details on the analyses are available upon request to the contact author Benjamin Chazeau (benjamin.chazeau@univ-amu.fr).
The supplement related to this article is available online at: https://doi.org/10.5194/acp-21-7293-2021-supplement.
NM designed the research. BC, GG and BM contributed to the measurements. BC performed the analysis and wrote the paper. NM, BD'A, BTR and HW reviewed and all the authors commented on the paper.
The authors declare they have no conflict of interest.
Benjamin Chazeau also thanks Vincent Crenn and ADDAIR for the ToF-ACSM support, Damien Piga and Julien Poulidor for the supply of shipping and road traffic data and Jean-Eudes Petit for developing the Zefir tool. Some visualisations used in this paper were produced with the Giovanni online data system, developed and maintained by the NASA GES DISC.
This research has been supported by AtmoSud, ANRT, the PACA region and the French Ministry of the Environment (grant no. 2016/0939).
This paper was edited by James Allan and reviewed by two anonymous referees.
ADEME: La maîtrise de l’énergie dans les logements en Paca, Préfecture de la Région Provence-Alpes-Côte d'azur, 88 pp., 2009.
ADEME: Le bois énergie et la qualité de l'air, available at: https://www.ademe.fr/expertises/energies-renouvelables-enr-production-reseaux-stockage/passer-a-laction/produire-chaleur/dossier/bois-biomasse/bois-energie-qualite-lair, last access: 31 March 2020.
del Águila, A., Sorribas, M., Lyamani, H., Titos, G., Olmo, F. J., Arruda-Moreira, G., Yela, M., and Alados-Arboledas, L.: Sources and physicochemical characteristics of submicron aerosols during three intensive campaigns in Granada (Spain), Atmos. Res., 213, 398–410, https://doi.org/10.1016/j.atmosres.2018.06.004, 2018.
Aiken, A. C., DeCarlo, P. F., Kroll, J. H., Worsnop, D. R., Huffman, J. A., Docherty, K. S., Ulbrich, I. M., Mohr, C., Kimmel, J. R., Sueper, D., Sun, Y., Zhang, Q., Trimborn, A., Northway, M., Ziemann, P. J., Canagaratna, M. R., Onasch, T. B., Alfarra, M. R., Prévôt, A. S. H., Dommen, J., Duplissy, J., Metzger, A., Baltensperger, U., and Jimenez, J. L.: O C and OM OC Ratios of Primary, Secondary, and Ambient Organic Aerosols with High-Resolution Time-of-Flight Aerosol Mass Spectrometry, Environ. Sci. Technol., 42, 4478–4485, https://doi.org/10.1021/es703009q, 2008.
Aksoyoglu, S., Baltensperger, U., and Prévôt, A. S. H.: Contribution of ship emissions to the concentration and deposition of air pollutants in Europe, Atmos. Chem. Phys., 16, 1895–1906, https://doi.org/10.5194/acp-16-1895-2016, 2016.
Alfarra, M. R., Prévôt, A. S. H., Szidat, S., Sandradewi, J., Weimer, S., Lanz, V. A., Schreiber, D., Mohr, M., and Baltensperger, U.: Identification of the Mass Spectral Signature of Organic Aerosols from Wood Burning Emissions, Environ. Sci. Technol., 41, 5770–5777, https://doi.org/10.1021/es062289b, 2007.
Arnold, F., Pirjola, L., Aufmhoff, H., Schuck, T., Lahde, T., and Hameri, K.: First gaseous sulfuric acid measurements in automobile exhaust: Implications for volatile nanoparticle formation, Atmos. Environ., 40, 7097–7105, https://doi.org/10.1016/j.atmosenv.2006.06.038, 2006.
Ashbaugh, L. L., Malm, W. C., and Sadeh, W. Z.: A residence time probability analysis of sulfur concentrations at grand Canyon National Park, Atmos. Environ., 19, 1263–1270, https://doi.org/10.1016/0004-6981(85)90256-2, 1985.
Aurela, M., Saarikoski, S., Niemi, J. V., Canonaco, F., Prévôt, A. S. H., Frey, A., Carbone, S., Kousa, A., and Hillamo, R.: Chemical and Source Characterization of Submicron Particles at Residential and Traffic Sites in the Helsinki Metropolitan Area, Finland, Aerosol Air Qual. Res., 15, 1213–1226, https://doi.org/10.4209/aaqr.2014.11.0279, 2015.
Bahreini, R., Ervens, B., Middlebrook, A. M., Warneke, C., de Gouw, J. A., DeCarlo, P. F., Jimenez, J. L., Brock, C. A., Neuman, J. A., Ryerson, T. B., Stark, H., Atlas, E., Brioude, J., Fried, A., Holloway, J. S., Peischl, J., Richter, D., Walega, J., Weibring, P., Wollny, A. G., and Fehsenfeld, F. C.: Organic aerosol formation in urban and industrial plumes near Houston and Dallas, Texas, J. Geophys. Res., 114, D00F16, https://doi.org/10.1029/2008JD011493, 2009.
Bozzetti, C., El Haddad, I., Salameh, D., Daellenbach, K. R., Fermo, P., Gonzalez, R., Minguillón, M. C., Iinuma, Y., Poulain, L., Elser, M., Müller, E., Slowik, J. G., Jaffrezo, J.-L., Baltensperger, U., Marchand, N., and Prévôt, A. S. H.: Organic aerosol source apportionment by offline-AMS over a full year in Marseille, Atmos. Chem. Phys., 17, 8247–8268, https://doi.org/10.5194/acp-17-8247-2017, 2017.
Bressi, M., Cavalli, F., Belis, C. A., Putaud, J.-P., Fröhlich, R., Martins dos Santos, S., Petralia, E., Prévôt, A. S. H., Berico, M., Malaguti, A., and Canonaco, F.: Variations in the chemical composition of the submicron aerosol and in the sources of the organic fraction at a regional background site of the Po Valley (Italy), Atmos. Chem. Phys., 16, 12875–12896, https://doi.org/10.5194/acp-16-12875-2016, 2016.
Brines, M., Dall'Osto, M., Beddows, D. C. S., Harrison, R. M., Gómez-Moreno, F., Núñez, L., Artíñano, B., Costabile, F., Gobbi, G. P., Salimi, F., Morawska, L., Sioutas, C., and Querol, X.: Traffic and nucleation events as main sources of ultrafine particles in high-insolation developed world cities, Atmos. Chem. Phys., 15, 5929–5945, https://doi.org/10.5194/acp-15-5929-2015, 2015.
Burtscher, H.: Physical characterization of particulate emissions from diesel engines: a review, J. Aerosol Sci., 36, 896–932, https://doi.org/10.1016/j.jaerosci.2004.12.001, 2005.
Cachier, H., Aulagnier, F., Sarda, R., Gautier, F., Masclet, P., Besombes, J.-L., Marchand, N., Despiau, S., Croci, D., Mallet, M., Laj, P., Marinoni, A., Deveau, P.-A., Roger, J.-C., Putaud, J.-P., Van Dingenen, R., Dell'Acqua, A., Viidanoja, J., Martins-Dos Santos, S., Liousse, C., Cousin, F., Rosset, R., Gardrat, E., and Galy-Lacaux, C.: Aerosol studies during the ESCOMPTE experiment: an overview, Atmos. Res., 74, 547–563, https://doi.org/10.1016/j.atmosres.2004.06.013, 2005.
Canagaratna, M. R., Jayne, J. T., Jimenez, J. L., Allan, J. D., Alfarra, M. R., Zhang, Q., Onasch, T. B., Drewnick, F., Coe, H., Middlebrook, A., Delia, A., Williams, L. R., Trimborn, A. M., Northway, M. J., DeCarlo, P. F., Kolb, C. E., Davidovits, P., and Worsnop, D. R.: Chemical and microphysical characterization of ambient aerosols with the aerodyne aerosol mass spectrometer, Mass Spectrom. Rev., 26, 185–222, https://doi.org/10.1002/mas.20115, 2007.
Canagaratna, M. R., Jimenez, J. L., Kroll, J. H., Chen, Q., Kessler, S. H., Massoli, P., Hildebrandt Ruiz, L., Fortner, E., Williams, L. R., Wilson, K. R., Surratt, J. D., Donahue, N. M., Jayne, J. T., and Worsnop, D. R.: Elemental ratio measurements of organic compounds using aerosol mass spectrometry: characterization, improved calibration, and implications, Atmos. Chem. Phys., 15, 253–272, https://doi.org/10.5194/acp-15-253-2015, 2015.
Canonaco, F., Slowik, J. G., Baltensperger, U., and Prévôt, A. S. H.: Seasonal differences in oxygenated organic aerosol composition: implications for emissions sources and factor analysis, Atmos. Chem. Phys., 15, 6993–7002, https://doi.org/10.5194/acp-15-6993-2015, 2015.
Casati, R., Scheer, V., Vogt, R., and Benter, T.: Measurement of nucleation and soot mode particle emission from a diesel passenger car in real world and laboratory in situ dilution, Atmos. Res., 41, 2125–2135, https://doi.org/10.1016/j.atmosenv.2006.10.078, 2007.
Cavalli, F., Viana, M., Yttri, K. E., Genberg, J., and Putaud, J.-P.: Toward a standardised thermal-optical protocol for measuring atmospheric organic and elemental carbon: the EUSAAR protocol, Atmos. Meas. Tech., 3, 79–89, https://doi.org/10.5194/amt-3-79-2010, 2010.
Charron, A. and Harrison, R. M.: Primary particle formation from vehicle emissions during exhaust dilution in the roadside atmosphere, Atmos. Environ., 37, 4109–4119, https://doi.org/10.1016/S1352-2310(03)00510-7, 2003.
Chazeau, B.: Measurement report: Fourteen months of real-time characterisation of the submicronic aerosol and its atmospheric dynamic at the Marseille-Longchamp supersite, Harvard Dataverse, V1, https://doi.org/10.7910/DVN/VBDW2C, 2021
Coudray, N., Dieterlen, A., Roth, E., and Trouvé, G.: Density measurement of fine aerosol fractions from wood combustion sources using ELPI distributions and image processing techniques, Fuel, 88, 947–954, https://doi.org/10.1016/j.fuel.2008.12.013, 2009.
Cross, E. S., Slowik, J. G., Davidovits, P., Allan, J. D., Worsnop, D. R., Jayne, J. T., Lewis, D. K., Canagaratna, M., and Onasch, T. B.: Laboratory and Ambient Particle Density Determinations using Light Scattering in Conjunction with Aerosol Mass Spectrometry, Aerosol Sci. Tech., 41, 343–359, https://doi.org/10.1080/02786820701199736, 2007.
Cubison, M. J., Ortega, A. M., Hayes, P. L., Farmer, D. K., Day, D., Lechner, M. J., Brune, W. H., Apel, E., Diskin, G. S., Fisher, J. A., Fuelberg, H. E., Hecobian, A., Knapp, D. J., Mikoviny, T., Riemer, D., Sachse, G. W., Sessions, W., Weber, R. J., Weinheimer, A. J., Wisthaler, A., and Jimenez, J. L.: Effects of aging on organic aerosol from open biomass burning smoke in aircraft and laboratory studies, Atmos. Chem. Phys., 11, 12049–12064, https://doi.org/10.5194/acp-11-12049-2011, 2011.
Department for Transport: Road traffic statistics, available at: https://roadtraffic.dft.gov.uk/regions/6 (last access: 31 January 2021), 2020.
Diapouli, E., Kalogridis, A.-C., Markantonaki, C., Vratolis, S., Fetfatzis, P., Colombi, C., and Eleftheriadis, K.: Annual Variability of Black Carbon Concentrations Originating from Biomass and Fossil Fuel Combustion for the Suburban Aerosol in Athens, Greece, Atmosphere, 8, 234, https://doi.org/10.3390/atmos8120234, 2017.
Diémoz, H., Barnaba, F., Magri, T., Pession, G., Dionisi, D., Pittavino, S., Tombolato, I. K. F., Campanelli, M., Della Ceca, L. S., Hervo, M., Di Liberto, L., Ferrero, L., and Gobbi, G. P.: Transport of Po Valley aerosol pollution to the northwestern Alps – Part 1: Phenomenology, Atmos. Chem. Phys., 19, 3065–3095, https://doi.org/10.5194/acp-19-3065-2019, 2019.
Draxler, R., Stunder, B., Rolph, G., Stein, A., and Taylor, A.: HYSPLIT4 User's Guide, National Oceanic and Atmospheric Administration, US, 254, 1999.
Drinovec, L., Močnik, G., Zotter, P., Prévôt, A. S. H., Ruckstuhl, C., Coz, E., Rupakheti, M., Sciare, J., Müller, T., Wiedensohler, A., and Hansen, A. D. A.: The ”dual-spot” Aethalometer: an improved measurement of aerosol black carbon with real-time loading compensation, Atmos. Meas. Tech., 8, 1965–1979, https://doi.org/10.5194/amt-8-1965-2015, 2015.
Drobinski, P., Saïd, F., Ancellet, G., Arteta, J., Augustin, P., Bastin, S., Brut, A., Caccia, J. L., Campistron, B., Cautenet, S., Colette, A., Coll, I., Corsmeier, U., Cros, B., Dabas, A., Delbarre, H., Dufour, A., Durand, P., Guénard, V., Hasel, M., Kalthoff, N., Kottmeier, C., Lasry, F., Lemonsu, A., Lohou, F., Masson, V., Menut, L., Moppert, C., Peuch, V. H., Puygrenier, V., Reitebuch, O., and Vautard, R.: Regional transport and dilution during high-pollution episodes in southern France: Summary of findings from the Field Experiment to Constraint Models of Atmospheric Pollution and Emissions Transport (ESCOMPTE): POLLUTION TRANSPORT AND DILUTION IN SOUTHERN FRANCE, J. Geophys. Res.-Atmos., 112, D13105, https://doi.org/10.1029/2006JD007494, 2007.
El Haddad, I., Marchand, N., Temime-Roussel, B., Wortham, H., Piot, C., Besombes, J.-L., Baduel, C., Voisin, D., Armengaud, A., and Jaffrezo, J.-L.: Insights into the secondary fraction of the organic aerosol in a Mediterranean urban area: Marseille, Atmos. Chem. Phys., 11, 2059–2079, https://doi.org/10.5194/acp-11-2059-2011, 2011a.
El Haddad, I., Marchand, N., Wortham, H., Piot, C., Besombes, J.-L., Cozic, J., Chauvel, C., Armengaud, A., Robin, D., and Jaffrezo, J.-L.: Primary sources of PM2.5 organic aerosol in an industrial Mediterranean city, Marseille, Atmos. Chem. Phys., 11, 2039–2058, https://doi.org/10.5194/acp-11-2039-2011, 2011b.
El Haddad, I., D'Anna, B., Temime-Roussel, B., Nicolas, M., Boreave, A., Favez, O., Voisin, D., Sciare, J., George, C., Jaffrezo, J.-L., Wortham, H., and Marchand, N.: Towards a better understanding of the origins, chemical composition and aging of oxygenated organic aerosols: case study of a Mediterranean industrialized environment, Marseille, Atmos. Chem. Phys., 13, 7875–7894, https://doi.org/10.5194/acp-13-7875-2013, 2013.
Escudero, M., Lozano, A., Hierro, J., Valle, J. del, and Mantilla, E.: Urban influence on increasing ozone concentrations in a characteristic Mediterranean agglomeration, Atmos. Environ., 99, 322–332, https://doi.org/10.1016/j.atmosenv.2014.09.061, 2014.
European Environment Agency (EEA): Air quality in Europe: 2019 report, Publications Office of the European Union, LU, 104 pp., 2019.
European Environment Agency (EEA): Air quality in Europe: 2020 report, Publications Office of the European Union, LU, 164 pp., 2020.
Farmer, D. K., Matsunaga, A., Docherty, K. S., Surratt, J. D., Seinfeld, J. H., Ziemann, P. J., and Jimenez, J. L.: Response of an aerosol mass spectrometer to organonitrates and organosulfates and implications for atmospheric chemistry, P. Natl. Acad. Sci. USA, 107, 6670–6675, https://doi.org/10.1073/pnas.0912340107, 2010.
Flaounas, E., Coll, I., Armengaud, A., and Schmechtig, C.: The representation of dust transport and missing urban sources as major issues for the simulation of PM episodes in a Mediterranean area, Atmos. Chem. Phys., 9, 8091–8101, https://doi.org/10.5194/acp-9-8091-2009, 2009.
Freney, E. J., Sellegri, K., Canonaco, F., Boulon, J., Hervo, M., Weigel, R., Pichon, J. M., Colomb, A., Prévôt, A. S. H., and Laj, P.: Seasonal variations in aerosol particle composition at the puy-de-Dôme research station in France, Atmos. Chem. Phys., 11, 13047–13059, https://doi.org/10.5194/acp-11-13047-2011, 2011.
Fröhlich, R., Cubison, M. J., Slowik, J. G., Bukowiecki, N., Prévôt, A. S. H., Baltensperger, U., Schneider, J., Kimmel, J. R., Gonin, M., Rohner, U., Worsnop, D. R., and Jayne, J. T.: The ToF-ACSM: a portable aerosol chemical speciation monitor with TOFMS detection, Atmos. Meas. Tech., 6, 3225–3241, https://doi.org/10.5194/amt-6-3225-2013, 2013.
Fröhlich, R., Cubison, M. J., Slowik, J. G., Bukowiecki, N., Canonaco, F., Croteau, P. L., Gysel, M., Henne, S., Herrmann, E., Jayne, J. T., Steinbacher, M., Worsnop, D. R., Baltensperger, U., and Prévôt, A. S. H.: Fourteen months of on-line measurements of the non-refractory submicron aerosol at the Jungfraujoch (3580 m a.s.l.) – chemical composition, origins and organic aerosol sources, Atmos. Chem. Phys., 15, 11373–11398, https://doi.org/10.5194/acp-15-11373-2015, 2015.
Fry, J. L., Brown, S. S., Middlebrook, A. M., Edwards, P. M., Campuzano-Jost, P., Day, D. A., Jimenez, J. L., Allen, H. M., Ryerson, T. B., Pollack, I., Graus, M., Warneke, C., de Gouw, J. A., Brock, C. A., Gilman, J., Lerner, B. M., Dubé, W. P., Liao, J., and Welti, A.: Secondary organic aerosol (SOA) yields from NO3 radical + isoprene based on nighttime aircraft power plant plume transects, Atmos. Chem. Phys., 18, 11663–11682, https://doi.org/10.5194/acp-18-11663-2018, 2018.
Gelaro, R., McCarty, W., Suárez, M. J., Todling, R., Molod, A., Takacs, L., Randles, C. A., Darmenov, A., Bosilovich, M. G., Reichle, R., Wargan, K., Coy, L., Cullather, R., Draper, C., Akella, S., Buchard, V., Conaty, A., da Silva, A. M., Gu, W., Kim, G.-K., Koster, R., Lucchesi, R., Merkova, D., Nielsen, J. E., Partyka, G., Pawson, S., Putman, W., Rienecker, M., Schubert, S. D., Sienkiewicz, M., and Zhao, B.: The Modern-Era Retrospective Analysis for Research and Applications, Version 2 (MERRA-2), J. Climate, 30, 5419–5454, https://doi.org/10.1175/JCLI-D-16-0758.1, 2017.
González, Y., Rodríguez, S., Guerra García, J. C., Trujillo, J. L., and García, R.: Ultrafine particles pollution in urban coastal air due to ship emissions, Atmos. Environ., 45, 4907–4914, https://doi.org/10.1016/j.atmosenv.2011.06.002, 2011.
Hama, S. M. L., Cordell, R. L., and Monks, P. S.: Quantifying primary and secondary source contributions to ultrafine particles in the UK urban background, Atmos. Environ., 166, 62–78, https://doi.org/10.1016/j.atmosenv.2017.07.013, 2017a.
Hama, S. M. L., Cordell, R. L., Kos, G. P. A., Weijers, E. P., and Monks, P. S.: Sub-micron particle number size distribution characteristics at two urban locations in Leicester, Atmos. Res., 194, 1–16, https://doi.org/10.1016/j.atmosres.2017.04.021, 2017b.
Healy, R. M., O'Connor, I. P., Hellebust, S., Allanic, A., Sodeau, J. R., and Wenger, J. C.: Characterisation of single particles from in-port ship emissions, Atmos. Environ., 43, 6408–6414, https://doi.org/10.1016/j.atmosenv.2009.07.039, 2009.
Henry, R., Norris, G. A., Vedantham, R., and Turner, J. R.: Source Region Identification Using Kernel Smoothing, Environ. Sci. Technol., 43, 4090–4097, https://doi.org/10.1021/es8011723, 2009.
Huffman, J. A., Docherty, K. S., Aiken, A. C., Cubison, M. J., Ulbrich, I. M., DeCarlo, P. F., Sueper, D., Jayne, J. T., Worsnop, D. R., Ziemann, P. J., and Jimenez, J. L.: Chemically-resolved aerosol volatility measurements from two megacity field studies, Atmos. Chem. Phys., 9, 7161–7182, https://doi.org/10.5194/acp-9-7161-2009, 2009.
Jayne, J. T., Leard, D. C., Zhang, X., Davidovits, P., Smith, K. A., Kolb, C. E., and Worsnop, D. R.: Development of an Aerosol Mass Spectrometer for Size and Composition Analysis of Submicron Particles, Aerosol Sci. Tech., 33, 49–70, https://doi.org/10.1080/027868200410840, 2000.
Kerminen, V.-M., Chen, X., Vakkari, V., Petäjä, T., Kulmala, M., and Bianchi, F.: Atmospheric new particle formation and growth: review of field observations, Environ. Res. Lett., 13, 103003, https://doi.org/10.1088/1748-9326/aadf3c, 2018.
Kiendler-Scharr, A., Mensah, A. A., Friese, E., Topping, D., Nemitz, E., Prévôt, A. S. H., Äijälä, M., Allan, J., Canonaco, F., Canagaratna, M., Carbone, S., Crippa, M., Dall Osto, M., Day, D. A., De Carlo, P., Di Marco, C. F., Elbern, H., Eriksson, A., Freney, E., Hao, L., Herrmann, H., Hildebrandt, L., Hillamo, R., Jimenez, J. L., Laaksonen, A., McFiggans, G., Mohr, C., O'Dowd, C., Otjes, R., Ovadnevaite, J., Pandis, S. N., Poulain, L., Schlag, P., Sellegri, K., Swietlicki, E., Tiitta, P., Vermeulen, A., Wahner, A., Worsnop, D., and Wu, H.-C.: Ubiquity of organic nitrates from nighttime chemistry in the European submicron aerosol: Organic Nitrates in European PM1, Geophys. Res. Lett., 43, 7735–7744, https://doi.org/10.1002/2016GL069239, 2016.
Kittelson, D. B.: ENGINES AND NANOPARTICLES: A REVIEW, J. Aerosol Sci., 29, 575–588, https://doi.org/10.1016/S0021-8502(97)10037-4, 1998.
Kreyling, W. G., Semmler-Behnke, M., and Möller, W.: Ultrafine Particle–Lung Interactions: Does Size Matter?, J. Aerosol Med., 19, 74–83, https://doi.org/10.1089/jam.2006.19.74, 2006.
Kulmala, M., Luoma, K., Virkkula, A., Petäjä, T., Paasonen, P., Kerminen, V.-M., Nie, W., Qi, X., Shen, Y., Chi, X., and Ding, A.: On the mode-segregated aerosol particle number concentration load: contributions of primary and secondary particles in Hyytiälä and Nanjing, Boreal Environ. Res., 21, 319–331, 2016.
Laborde, M., Crippa, M., Tritscher, T., Jurányi, Z., Decarlo, P. F., Temime-Roussel, B., Marchand, N., Eckhardt, S., Stohl, A., Baltensperger, U., Prévôt, A. S. H., Weingartner, E., and Gysel, M.: Black carbon physical properties and mixing state in the European megacity Paris, Atmos. Chem. Phys., 13, 5831–5856, https://doi.org/10.5194/acp-13-5831-2013, 2013.
Lack, D. A., Corbett, J. J., Onasch, T., Lerner, B., Massoli, P., Quinn, P. K., Bates, T. S., Covert, D. S., Coffman, D., Sierau, B., Herndon, S., Allan, J., Baynard, T., Lovejoy, E., Ravishankara, A. R., and Williams, E.: Particulate emissions from commercial shipping: Chemical, physical, and optical properties, J. Geophys. Res., 114, D00F04, https://doi.org/10.1029/2008JD011300, 2009.
Larssen, S., Sluyter, R., and Helmis, C.: Criteria for EUROAIRNET – The EEA Air Quality Monitoring and Information Network, EEA, Copenhagen, Technical report, 56 pp., 1999.
Lelieveld, J., Evans, J. S., Fnais, M., Giannadaki, D., and Pozzer, A.: The contribution of outdoor air pollution sources to premature mortality on a global scale, 525, Nature, 367–371, https://doi.org/10.1038/nature15371, 2015.
Liakakou, E., Stavroulas, I., Kaskaoutis, D. G., Grivas, G., Paraskevopoulou, D., Dumka, U. C., Tsagkaraki, M., Bougiatioti, A., Oikonomou, K., Sciare, J., Gerasopoulos, E., and Mihalopoulos, N.: Long-term variability, source apportionment and spectral properties of black carbon at an urban background site in Athens, Greece, Atmos. Environ., 222, 117137, https://doi.org/10.1016/j.atmosenv.2019.117137, 2020.
Lianou, M., Chalbot, M.-C., Kavouras, I. G., Kotronarou, A., Karakatsani, A., Analytis, A., Katsouyanni, K., Puustinen, A., Hameri, K., Vallius, M., Pekkanen, J., Meddings, C., Harrison, R. M., Ayres, J. G., ten Brick, H., Kos, G., Meliefste, K., de Hartog, J., and Hoek, G.: Temporal variations of atmospheric aerosol in four European urban areas, Environ. Sci. Pollut. Res., 18, 1202–1212, https://doi.org/10.1007/s11356-011-0471-y, 2011.
Mallet, M. D., D'Anna, B., Même, A., Bove, M. C., Cassola, F., Pace, G., Desboeufs, K., Di Biagio, C., Doussin, J.-F., Maille, M., Massabò, D., Sciare, J., Zapf, P., di Sarra, A. G., and Formenti, P.: Summertime surface PM1 aerosol composition and size by source region at the Lampedusa island in the central Mediterranean Sea, Atmos. Chem. Phys., 19, 11123–11142, https://doi.org/10.5194/acp-19-11123-2019, 2019.
MedCruise: Statistics Cruise Activities in MedCruise Ports, MedCruise Association, Puerto de Santa Cruz de Tenerife, statistics report, 89 pp., 2018.
Meng, W., Zhong, Q., Yun, X., Zhu, X., Huang, T., Shen, H., Chen, Y., Chen, H., Zhou, F., Liu, J., Wang, X., Zeng, E. Y., and Tao, S.: Improvement of a Global High-Resolution Ammonia Emission Inventory for Combustion and Industrial Sources with New Data from the Residential and Transportation Sectors, Environ. Sci. Technol., 51, 2821–2829, https://doi.org/10.1021/acs.est.6b03694, 2017.
Merico, E., Cesari, D., Dinoi, A., Gambaro, A., Barbaro, E., Guascito, M. R., Giannossa, L. C., Mangone, A., and Contini, D.: Inter-comparison of carbon content in PM10 and PM2.5 measured with two thermo-optical protocols on samples collected in a Mediterranean site, Environ. Sci. Pollut. Res., 26, 29334–29350, https://doi.org/10.1007/s11356-019-06117-7, 2019.
Mestayer, P. G., Durand, P., Augustin, P., Bastin, S., Bonnefond, J.-M., Bénech, B., Campistron, B., Coppalle, A., Delbarre, H., Dousset, B., Drobinski, P., Druilhet, A., Fréjafon, E., Grimmond, C. S. B., Groleau, D., Irvine, M., Kergomard, C., Kermadi, S., Lagouarde, J.-P., Lemonsu, A., Lohou, F., Long, N., Masson, V., Moppert, C., Noilhan, J., Offerle, B., Oke, T. R., Pigeon, G., Puygrenier, V., Roberts, S., Rosant, J.-M., Saïd, F., Salmond, J., Talbaut, M., and Voogt, J.: The urban boundary-layer field campaign in marseille (ubl/clu-escompte): set-up and first results, Bound.-Lay. Meteorol., 114, 315–365, https://doi.org/10.1007/s10546-004-9241-4, 2005.
Middlebrook, A. M., Bahreini, R., Jimenez, J. L., and Canagaratna, M. R.: Evaluation of Composition-Dependent Collection Efficiencies for the Aerodyne Aerosol Mass Spectrometer using Field Data, Aerosol Sci. Tech., 46, 258–271, https://doi.org/10.1080/02786826.2011.620041, 2012.
Minguillón, M. C., Perron, N., Querol, X., Szidat, S., Fahrni, S. M., Alastuey, A., Jimenez, J. L., Mohr, C., Ortega, A. M., Day, D. A., Lanz, V. A., Wacker, L., Reche, C., Cusack, M., Amato, F., Kiss, G., Hoffer, A., Decesari, S., Moretti, F., Hillamo, R., Teinilä, K., Seco, R., Peñuelas, J., Metzger, A., Schallhart, S., Müller, M., Hansel, A., Burkhart, J. F., Baltensperger, U., and Prévôt, A. S. H.: Fossil versus contemporary sources of fine elemental and organic carbonaceous particulate matter during the DAURE campaign in Northeast Spain, Atmos. Chem. Phys., 11, 12067–12084, https://doi.org/10.5194/acp-11-12067-2011, 2011.
Minguillón, M. C., Ripoll, A., Pérez, N., Prévôt, A. S. H., Canonaco, F., Querol, X., and Alastuey, A.: Chemical characterization of submicron regional background aerosols in the western Mediterranean using an Aerosol Chemical Speciation Monitor, Atmos. Chem. Phys., 15, 6379–6391, https://doi.org/10.5194/acp-15-6379-2015, 2015.
Mohr, C., DeCarlo, P. F., Heringa, M. F., Chirico, R., Slowik, J. G., Richter, R., Reche, C., Alastuey, A., Querol, X., Seco, R., Peñuelas, J., Jiménez, J. L., Crippa, M., Zimmermann, R., Baltensperger, U., and Prévôt, A. S. H.: Identification and quantification of organic aerosol from cooking and other sources in Barcelona using aerosol mass spectrometer data, Atmos. Chem. Phys., 12, 1649–1665, https://doi.org/10.5194/acp-12-1649-2012, 2012.
Mousavi, A., Sowlat, M. H., Lovett, C., Rauber, M., Szidat, S., Boffi, R., Borgini, A., De Marco, C., Ruprecht, A. A., and Sioutas, C.: Source apportionment of black carbon (BC) from fossil fuel and biomass burning in metropolitan Milan, Italy, Atmos. Environ., 203, 252–261, https://doi.org/10.1016/j.atmosenv.2019.02.009, 2019.
Ng, N. L., Herndon, S. C., Trimborn, A., Canagaratna, M. R., Croteau, P. L., Onasch, T. B., Sueper, D., Worsnop, D. R., Zhang, Q., Sun, Y. L., and Jayne, J. T.: An Aerosol Chemical Speciation Monitor (ACSM) for Routine Monitoring of the Composition and Mass Concentrations of Ambient Aerosol, Aerosol Sci. Tech., 45, 780–794, https://doi.org/10.1080/02786826.2011.560211, 2011.
Nunes, R. A. O., Alvim-Ferraz, M. C. M., Martins, F. G., Calderay-Cayetano, F., Durán-Grados, V., Moreno-Gutiérrez, J., Jalkanen, J.-P., Hannuniemi, H., and Sousa, S. I. V.: Shipping emissions in the Iberian Peninsula and the impacts on air quality, Atmos. Chem. Phys., 20, 9473–9489, https://doi.org/10.5194/acp-20-9473-2020, 2020.
Olson, D. A., Vedantham, R., Norris, G. A., Brown, S. G., and Roberts, P.: Determining source impacts near roadways using wind regression and organic source markers, Atmos. Environ., 47, 261–268, https://doi.org/10.1016/j.atmosenv.2011.11.003, 2012.
Ovadnevaite, J., Ceburnis, D., Leinert, S., Dall'Osto, M., Canagaratna, M., O'Doherty, S., Berresheim, H., and O'Dowd, C.: Submicron NE Atlantic marine aerosol chemical composition and abundance: Seasonal trends and air mass categorization: Seasonal Trends of Marine Aerosol, J. Geophys. Res.-Atmos., 119, 11850–11863, https://doi.org/10.1002/2013JD021330, 2014.
Pandolfi, M., Mooibroek, D., Hopke, P., van Pinxteren, D., Querol, X., Herrmann, H., Alastuey, A., Favez, O., Hüglin, C., Perdrix, E., Riffault, V., Sauvage, S., van der Swaluw, E., Tarasova, O., and Colette, A.: Long-range and local air pollution: what can we learn from chemical speciation of particulate matter at paired sites?, Atmos. Chem. Phys., 20, 409–429, https://doi.org/10.5194/acp-20-409-2020, 2020.
Park, K., Chow, J. C., Watson, J. G., Trimble, D. L., Doraiswamy, P., Park, K., Arnott, W. P., Stroud, K. R., Bowers, K., Bode, R., Petzold, A., and Hansen, A. D. A.: Comparison of Continuous and Filter-Based Carbon Measurements at the Fresno Supersite, J. Air Waste Manage., 56, 474–491, https://doi.org/10.1080/10473289.2006.10464521, 2006.
Pascal, M., Corso, M., Chanel, O., Declercq, C., Badaloni, C., Cesaroni, G., Henschel, S., Meister, K., Haluza, D., Martin-Olmedo, P., and Medina, S.: Assessing the public health impacts of urban air pollution in 25 European cities: Results of the Aphekom project, Sci. Total Environ., 449, 390–400, https://doi.org/10.1016/j.scitotenv.2013.01.077, 2013.
Pascal, M., Chanel, P. de C., Corso, M., Medina, S., Wagner, V., Goria, S., Beaudeau, P., Bentayeb, M., Tertre, A. L., Ung, A., Chatignoux, E., and Quénel, P.: Impacts de l'exposition chronique aux particules fines sur la mortalité en France continentale et analyse des gains en santé de plusieurs scénarios de réduction de la pollution atmosphérique, Santé Publique France, Saint-Maurice, Rapport d'étude, 158 pp., 2016.
Pauraite, J., Pivoras, A., Plauškaitė, K., Byčenkienė, S., Mordas, G., Augustaitis, A., Marozas, V., Mozgeris, G., Baumgarten, M., Matyssek, R., and Ulevicius, V.: Characterization of aerosol mass spectra responses to temperature over a forest site in Lithuania, J. Aerosol Sci., 133, 56–65, https://doi.org/10.1016/j.jaerosci.2019.03.010, 2019.
Petit, J.-E., Favez, O., Sciare, J., Crenn, V., Sarda-Estève, R., Bonnaire, N., Močnik, G., Dupont, J.-C., Haeffelin, M., and Leoz-Garziandia, E.: Two years of near real-time chemical composition of submicron aerosols in the region of Paris using an Aerosol Chemical Speciation Monitor (ACSM) and a multi-wavelength Aethalometer, Atmos. Chem. Phys., 15, 2985–3005, https://doi.org/10.5194/acp-15-2985-2015, 2015.
Petit, J.-E., Favez, O., Albinet, A., and Canonaco, F.: A user-friendly tool for comprehensive evaluation of the geographical origins of atmospheric pollution: Wind and trajectory analyses, Environ. Modell. Softw., 88, 183–187, https://doi.org/10.1016/j.envsoft.2016.11.022, 2017a.
Petit, J.-E., Amodeo, T., Meleux, F., Bessagnet, B., Menut, L., Grenier, D., Pellan, Y., Ockler, A., Rocq, B., Gros, V., Sciare, J., and Favez, O.: Characterising an intense PM pollution episode in March 2015 in France from multi-site approach and near real time data: Climatology, variabilities, geographical origins and model evaluation, Atmos. Environ., 155, 68–84, https://doi.org/10.1016/j.atmosenv.2017.02.012, 2017b.
Pieber, S. M., El Haddad, I., Slowik, J. G., Canagaratna, M. R., Jayne, J. T., Platt, S. M., Bozzetti, C., Daellenbach, K. R., Fröhlich, R., Vlachou, A., Klein, F., Dommen, J., Miljevic, B., Jiménez, J. L., Worsnop, D. R., Baltensperger, U., and Prévôt, A. S. H.: Inorganic Salt Interference on CO in Aerodyne AMS and ACSM Organic Aerosol Composition Studies, Environ. Sci. Technol., 50, 10494–10503, https://doi.org/10.1021/acs.est.6b01035, 2016.
Poulain, L., Spindler, G., Birmili, W., Plass-Dülmer, C., Wiedensohler, A., and Herrmann, H.: Seasonal and diurnal variations of particulate nitrate and organic matter at the IfT research station Melpitz, Atmos. Chem. Phys., 11, 12579–12599, https://doi.org/10.5194/acp-11-12579-2011, 2011.
Poulain, L., Birmili, W., Canonaco, F., Crippa, M., Wu, Z. J., Nordmann, S., Spindler, G., Prévôt, A. S. H., Wiedensohler, A., and Herrmann, H.: Chemical mass balance of 300 ∘C non-volatile particles at the tropospheric research site Melpitz, Germany, Atmos. Chem. Phys., 14, 10145–10162, https://doi.org/10.5194/acp-14-10145-2014, 2014.
Puygrenier, V., Lohou, F., Campistron, B., Saïd, F., Pigeon, G., Bénech, B., and Serça, D.: Investigation on the fine structure of sea-breeze during ESCOMPTE experiment, Atmos. Res., 74, 329–353, https://doi.org/10.1016/j.atmosres.2004.06.011, 2005.
Ramanantenasoa, M. M. J., Gilliot, J.-M., Mignolet, C., Bedos, C., Mathias, E., Eglin, T., Makowski, D., and Génermont, S.: A new framework to estimate spatio-temporal ammonia emissions due to nitrogen fertilization in France, Sci. Total Environ., 645, 205–219, https://doi.org/10.1016/j.scitotenv.2018.06.202, 2018.
Reche, C., Querol, X., Alastuey, A., Viana, M., Pey, J., Moreno, T., Rodríguez, S., González, Y., Fernández-Camacho, R., de la Rosa, J., Dall'Osto, M., Prévôt, A. S. H., Hueglin, C., Harrison, R. M., and Quincey, P.: New considerations for PM, Black Carbon and particle number concentration for air quality monitoring across different European cities, Atmos. Chem. Phys., 11, 6207–6227, https://doi.org/10.5194/acp-11-6207-2011, 2011.
Reyes-Villegas, E., Green, D. C., Priestman, M., Canonaco, F., Coe, H., Prévôt, A. S. H., and Allan, J. D.: Organic aerosol source apportionment in London 2013 with ME-2: exploring the solution space with annual and seasonal analysis, Atmos. Chem. Phys., 16, 15545–15559, https://doi.org/10.5194/acp-16-15545-2016, 2016.
Ripoll, A., Minguillón, M. C., Pey, J., Jimenez, J. L., Day, D. A., Sosedova, Y., Canonaco, F., Prévôt, A. S. H., Querol, X., and Alastuey, A.: Long-term real-time chemical characterization of submicron aerosols at Montsec (southern Pyrenees, 1570 m a.s.l.), Atmos. Chem. Phys., 15, 2935–2951, https://doi.org/10.5194/acp-15-2935-2015, 2015.
Rodríguez, S. and Cuevas, E.: The contributions of “minimum primary emissions” and “new particle formation enhancements” to the particle number concentration in urban air, J. Aerosol. Sci., 38, 1207–1219, https://doi.org/10.1016/j.jaerosci.2007.09.001, 2007.
Rouaud, P. and Channac, Y.: Pollution de l’air par les PM10 En 2017, le seuil de l'OMS dépassé pour la moitié des résidents de la région, Rapport d'analyses, INSEE, Marseille, 4 pp., 2019.
Saarikoski, S., Carbone, S., Decesari, S., Giulianelli, L., Angelini, F., Canagaratna, M., Ng, N. L., Trimborn, A., Facchini, M. C., Fuzzi, S., Hillamo, R., and Worsnop, D.: Chemical characterization of springtime submicrometer aerosol in Po Valley, Italy, Atmos. Chem. Phys., 12, 8401–8421, https://doi.org/10.5194/acp-12-8401-2012, 2012.
Salameh, D., Detournay, A., Pey, J., Pérez, N., Liguori, F., Saraga, D., Bove, M. C., Brotto, P., Cassola, F., Massabò, D., Latella, A., Pillon, S., Formenton, G., Patti, S., Armengaud, A., Piga, D., Jaffrezo, J. L., Bartzis, J., Tolis, E., Prati, P., Querol, X., Wortham, H., and Marchand, N.: PM2.5 chemical composition in five European Mediterranean cities: A 1-year study, Atmos. Environ., 155, 102–117, https://doi.org/10.1016/j.atmosres.2014.12.001, 2015.
Salameh, D., Pey, J., Bozzetti, C., El Haddad, I., Detournay, A., Sylvestre, A., Canonaco, F., Armengaud, A., Piga, D., Robin, D., Prévôt, A. S. H., Jaffrezo, J.-L., Wortham, H., and Marchand, N.: Sources of PM2.5 at an urban-industrial Mediterranean city, Marseille (France): Application of the ME-2 solver to inorganic and organic markers, Atmos. Res., 214, 263–274, https://doi.org/10.1016/j.atmosres.2018.08.005, 2018.
Salcedo, D., Onasch, T. B., Dzepina, K., Canagaratna, M. R., Zhang, Q., Huffman, J. A., DeCarlo, P. F., Jayne, J. T., Mortimer, P., Worsnop, D. R., Kolb, C. E., Johnson, K. S., Zuberi, B., Marr, L. C., Volkamer, R., Molina, L. T., Molina, M. J., Cardenas, B., Bernabé, R. M., Márquez, C., Gaffney, J. S., Marley, N. A., Laskin, A., Shutthanandan, V., Xie, Y., Brune, W., Lesher, R., Shirley, T., and Jimenez, J. L.: Characterization of ambient aerosols in Mexico City during the MCMA-2003 campaign with Aerosol Mass Spectrometry: results from the CENICA Supersite, Atmos. Chem. Phys., 6, 925–946, https://doi.org/10.5194/acp-6-925-2006, 2006.
Sandradewi, J., Prévôt, A. S. H., Szidat, S., Perron, N., Alfarra, M. R., Lanz, V. A., Weingartner, E., and Baltensperger, U.: Using Aerosol Light Absorption Measurements for the Quantitative Determination of Wood Burning and Traffic Emission Contributions to Particulate Matter, Environ. Sci. Technol., 42, 3316–3323, https://doi.org/10.1021/es702253m, 2008.
Schaap, M., Spindler, G., Schulz, M., Acker, K., Maenhaut, W., Berner, A., Wieprecht, W., Streit, N., Müller, K., Brüggemann, E., Chi, X., Putaud, J.-P., Hitzenberger, R., Puxbaum, H., Baltensperger, U., and ten Brink, H.: Artefacts in the sampling of nitrate studied in the “INTERCOMP” campaigns of EUROTRAC-AEROSOL, 38, 6487–6496, https://doi.org/10.1016/j.atmosenv.2004.08.026, 2004a.
Schaap, M., van Loon, M., ten Brink, H. M., Dentener, F. J., and Builtjes, P. J. H.: Secondary inorganic aerosol simulations for Europe with special attention to nitrate, Atmos. Chem. Phys., 4, 857–874, https://doi.org/10.5194/acp-4-857-2004, 2004b.
Sciare, J., Sarda-Estève, R., Favez, O., Cachier, H., Aymoz, G., and Laj, P.: Nighttime residential wood burning evidenced from an indirect method for estimating real-time concentration of particulate organic matter (POM), Atmos. Environ., 42, 2158–2172, https://doi.org/10.1016/j.atmosenv.2007.11.053, 2008.
Seinfeld, J. H. and Pandis, J. H., and Spyros N.: Atmospheric Chemistry and Physics, John Wiley & Sons, New Jersey, 1120 pp., 2016.
Squizzato, S., Masiol, M., Brunelli, A., Pistollato, S., Tarabotti, E., Rampazzo, G., and Pavoni, B.: Factors determining the formation of secondary inorganic aerosol: a case study in the Po Valley (Italy), Atmos. Chem. Phys., 13, 1927–1939, https://doi.org/10.5194/acp-13-1927-2013, 2013.
Stavroulas, I., Bougiatioti, A., Grivas, G., Paraskevopoulou, D., Tsagkaraki, M., Zarmpas, P., Liakakou, E., Gerasopoulos, E., and Mihalopoulos, N.: Sources and processes that control the submicron organic aerosol composition in an urban Mediterranean environment (Athens): a high temporal-resolution chemical composition measurement study, Atmos. Chem. Phys., 19, 901–919, https://doi.org/10.5194/acp-19-901-2019, 2019.
Stelson, A. W. and Seinfeld, J. H.: Relative humidity and temperature dependence of the ammonium nitrate dissociation constant, Atmos. Environ., 16, 983–992, 1982.
Suarez-Bertoa, R., Zardini, A. A., Lilova, V., Meyer, D., Nakatani, S., Hibel, F., Ewers, J., Clairotte, M., Hill, L., and Astorga, C.: Intercomparison of real-time tailpipe ammonia measurements from vehicles tested over the new world-harmonized light-duty vehicle test cycle (WLTC), Environ. Sci. Pollut. Res., 22, 7450–7460, https://doi.org/10.1007/s11356-015-4267-3, 2015.
Sun, K., Tao, L., Miller, D. J., Pan, D., Golston, L. M., Zondlo, M. A., Griffin, R. J., Wallace, H. W., Leong, Y. J., Yang, M. M., Zhang, Y., Mauzerall, D. L., and Zhu, T.: Vehicle Emissions as an Important Urban Ammonia Source in the United States and China, Environ. Sci. Technol., 51, 2472–2481, https://doi.org/10.1021/acs.est.6b02805, 2017.
Sutton, M. A., Reis, S., Riddick, S. N., Dragosits, U., Nemitz, E., Theobald, M. R., Tang, Y. S., Braban, C. F., Vieno, M., Dore, A. J., Mitchell, R. F., Wanless, S., Daunt, F., Fowler, D., Blackall, T. D., Milford, C., Flechard, C. R., Loubet, B., Massad, R., Cellier, P., Personne, E., Coheur, P. F., Clarisse, L., Van Damme, M., Ngadi, Y., Clerbaux, C., Skjøth, C. A., Geels, C., Hertel, O., Wichink Kruit, R. J., Pinder, R. W., Bash, J. O., Walker, J. T., Simpson, D., Horváth, L., Misselbrook, T. H., Bleeker, A., Dentener, F., and de Vries, W.: Towards a climate-dependent paradigm of ammonia emission and deposition, Philos. T. R. Soc. B, 368, 20130166, https://doi.org/10.1098/rstb.2013.0166, 2013.
Timonen, H., Cubison, M., Aurela, M., Brus, D., Lihavainen, H., Hillamo, R., Canagaratna, M., Nekat, B., Weller, R., Worsnop, D., and Saarikoski, S.: Applications and limitations of constrained high-resolution peak fitting on low resolving power mass spectra from the ToF-ACSM, Atmos. Meas. Tech., 9, 3263–3281, https://doi.org/10.5194/amt-9-3263-2016, 2016.
Tobías, A., Rivas, I., Reche, C., Alastuey, A., Rodríguez, S., Fernández-Camacho, R., Sánchez de la Campa, A. M., de la Rosa, J., Sunyer, J., and Querol, X.: Short-term effects of ultrafine particles on daily mortality by primary vehicle exhaust versus secondary origin in three Spanish cities, Environ. Int., 111, 144–151, https://doi.org/10.1016/j.envint.2017.11.015, 2018.
TOMTOM: Traffic Index for urban congestion worldwide, available at: https://www.tomtom.com/en_gb/traffic-index/ranking/ (last access: 31 January 2021), 2020.
Turpin, B. J. and Lim, H.-J.: Species Contributions to PM2.5 Mass Concentrations: Revisiting Common Assumptions for Estimating Organic Mass, Aerosol Sci. Tech., 35, 602–610, https://doi.org/10.1080/02786820119445, 2001.
Via, M., Minguillón, M. C., Reche, C., Querol, X., and Alastuey, A.: Increase of secondary organic aerosol over four years in an urban environment, Atmos. Chem. Phys. Discuss. [preprint], https://doi.org/10.5194/acp-2020-1244, in review, 2020.
Waked, A., Favez, O., Alleman, L. Y., Piot, C., Petit, J.-E., Delaunay, T., Verlinden, E., Golly, B., Besombes, J.-L., Jaffrezo, J.-L., and Leoz-Garziandia, E.: Source apportionment of PM10 in a north-western Europe regional urban background site (Lens, France) using positive matrix factorization and including primary biogenic emissions, Atmos. Chem. Phys., 14, 3325–3346, https://doi.org/10.5194/acp-14-3325-2014, 2014.
Wehner, B. and Wiedensohler, A.: Long term measurements of submicrometer urban aerosols: statistical analysis for correlations with meteorological conditions and trace gases, Atmos. Chem. Phys., 3, 867–879, https://doi.org/10.5194/acp-3-867-2003, 2003.
WHO: WHO Air quality guidelinesfor particulate matter, ozone, nitrogen dioxide and sulfur dioxide, Summary of risk assessment, World Health Organization, Switzerland, 22 pp., 2006.
Woo, K. S., Chen, D. R., Pui, D. Y. H., and McMurry, P. H.: Measurement of Atlanta Aerosol Size Distributions: Observations of Ultrafine Particle Events, Aerosol Sci. Tech., 34, 75–87, https://doi.org/10.1080/02786820120056, 2001.
Xu, L., Suresh, S., Guo, H., Weber, R. J., and Ng, N. L.: Aerosol characterization over the southeastern United States using high-resolution aerosol mass spectrometry: spatial and seasonal variation of aerosol composition and sources with a focus on organic nitrates, Atmos. Chem. Phys., 15, 7307–7336, https://doi.org/10.5194/acp-15-7307-2015, 2015.
Xu, W., Lambe, A., Silva, P., Hu, W., Onasch, T., Williams, L., Croteau, P., Zhang, X., Renbaum-Wolff, L., Fortner, E., Jimenez, J. L., Jayne, J., Worsnop, D., and Canagaratna, M.: Laboratory evaluation of species-dependent relative ionization efficiencies in the Aerodyne Aerosol Mass Spectrometer, Aerosol Sci. Tech., 52, 626–641, https://doi.org/10.1080/02786826.2018.1439570, 2018.
Young, D. E., Allan, J. D., Williams, P. I., Green, D. C., Flynn, M. J., Harrison, R. M., Yin, J., Gallagher, M. W., and Coe, H.: Investigating the annual behaviour of submicron secondary inorganic and organic aerosols in London, Atmos. Chem. Phys., 15, 6351–6366, https://doi.org/10.5194/acp-15-6351-2015, 2015.
Zhang, Q., Alfarra, M. R., Worsnop, D. R., Allan, J. D., Coe, H., Canagaratna, M. R., and Jimenez, J. L.: Deconvolution and Quantification of Hydrocarbon-like and Oxygenated Organic Aerosols Based on Aerosol Mass Spectrometry, Environ. Sci. Technol., 39, 4938–4952, https://doi.org/10.1021/es048568l, 2005.
Zhang, Q., Jimenez, J. L., Worsnop, D. R., and Canagaratna, M.: A Case Study of Urban Particle Acidity and Its Influence on Secondary Organic Aerosol, Environ. Sci. Technol., 41, 3213–3219, https://doi.org/10.1021/es061812j, 2007.