the Creative Commons Attribution 4.0 License.
the Creative Commons Attribution 4.0 License.
 | 11 May 2021
Trends, composition, and sources of carbonaceous aerosol at the Birkenes Observatory, northern Europe, 2001–2018
Francesco Canonaco
Sabine Eckhardt
Nikolaos Evangeliou
Markus Fiebig
Hans Gundersen
Anne-Gunn Hjellbrekke
Cathrine Lund Myhre
Stephen Matthew Platt
André S. H. Prévôt
David Simpson
Sverre Solberg
Jason Surratt
Kjetil Tørseth
Hilde Uggerud
Marit Vadset
Wenche Aas
We present 18 years (2001–2018) of aerosol measurements, including organic and elemental carbon (OC and EC), organic tracers (levoglucosan, arabitol, mannitol, trehalose, glucose, and 2-methyltetrols), trace elements, and ions, at the Birkenes Observatory (southern Norway) – a site representative of the northern European region. The (2001–2018) and the levoglucosan (2008–2018) time series are the longest in Europe, with available for the PM10, PM2.5 (fine), and PM10–2.5 (coarse) size fractions, providing the opportunity for a nearly 2-decade-long assessment. Using positive matrix factorization (PMF), we identify seven carbonaceous aerosol sources at Birkenes: mineral-dust-dominated aerosol (MIN), traffic/industry-like aerosol (TRA/IND), short-range-transported biogenic secondary organic aerosol (BSOASRT), primary biological aerosol particles (PBAP), biomass burning aerosol (BB), ammonium-nitrate-dominated aerosol (NH4NO3), and (one low carbon fraction) sea salt aerosol (SS).
We observed significant (p<0.05), large decreases in EC in PM10 (−3.9 % yr−1) and PM2.5 (−4.2 % yr−1) and a smaller decline in levoglucosan (−2.8 % yr−1), suggesting that from traffic and industry is decreasing, whereas the abatement of from biomass burning has been slightly less successful. EC abatement with respect to anthropogenic sources is further supported by decreasing EC fractions in PM2.5 (−3.9 % yr−1) and PM10 (−4.5 % yr−1). PMF apportioned 72 % of EC to fossil fuel sources; this was further supported by PMF applied to absorption photometer data, which yielded a two-factor solution with a low aerosol Ångstrøm exponent (AAE = 0.93) fraction, assumed to be equivalent black carbon from fossil fuel combustion (eBCFF), contributing 78 % to eBC mass. The higher AAE fraction (AAE = 2.04) is likely eBC from BB (eBCBB). Source–receptor model calculations (FLEXPART) showed that continental Europe and western Russia were the main source regions of both elevated eBCBB and eBCFF.
Dominating biogenic sources explain why there was no downward trend for OC. A relative increase in the OC fraction in PM2.5 (+3.2 % yr−1) and PM10 (+2.4 % yr−1) underscores the importance of biogenic sources at Birkenes (BSOA and PBAP), which were higher in the vegetative season and dominated both fine (53 %) and coarse (78 %) OC. Furthermore, 77 %–91 % of OC in PM2.5, PM10–2.5, and PM10 was attributed to biogenic sources in summer vs. 22 %–37 % in winter. The coarse fraction had the highest share of biogenic sources regardless of season and was dominated by PBAP, except in winter.
Our results show a shift in the aerosol composition at Birkenes and, thus, also in the relative source contributions. The need for diverse offline and online carbonaceous aerosol speciation to understand carbonaceous aerosol sources, including their seasonal, annual, and long-term variability, has been demonstrated.
- Article
(9341 KB) - Full-text XML
-
Supplement
(1128 KB) - BibTeX
- EndNote


Carbonaceous aerosol has been studied intensively over the last 20 years due to its influence on radiative forcing (Bond et al., 2013; Myhre and Samset, 2015; Lund et al., 2018), both directly by scattering and absorption of sunlight, and semi-directly and indirectly by influencing cloud properties (Boucher et al., 2013; Hodnebrog et al., 2014; Myhre et al., 2013). It also contributes to the burden of respiratory and cardiovascular disease (Janssen et al., 2012; WHO, 2013). Consequently, carbonaceous aerosol (here elemental carbon, EC, and organic carbon, OC) is measured regularly in major air monitoring networks such as the European Monitoring and Evaluation Programme (EMEP) and Interagency Monitoring of Protected Visual Environments (IMPROVE) (e.g. Malm et al., 1994; Tørseth and Hov, 2003; Tørseth et al., 2012; UNECE, 2019; Hjellbrekke, 2020). Carbonaceous aerosol has an atmospheric lifetime of days to a few weeks and is therefore relevant for atmospheric long-range transport. Accordingly, EMEP included measurements in 2004 after a pioneering measurement campaign at 12 European sites from 2002 to 2003 (Yttri et al., 2007a; Tørseth et al., 2012), showing that carbonaceous aerosol was a major constituent of the ambient aerosol in the European rural background environment, accounting for 9 %–37 % (OM, organic matter) and 1 %–5 % (EC) of PM10, and that OM was more abundant than sulfate (SO) at sites reporting both variables (Yttri et al., 2007a). Similar conclusions were reached by another long-term campaign, CARBOSOL (Gelencsér et al., 2007; Pio et al., 2007), which monitored atmospheric aerosol and its components for 2 years at six sites along a west–east transect extending from the Azores, in the mid-Atlantic Ocean, to K-Puszta (Hungary), in central Europe.
There are numerous carbonaceous aerosol sources, both anthropogenic (e.g. emissions from the combustion of fossil fuel and biomass) and biogenic (e.g. vegetation-emitted terpene/isoprene oxidation and primary biological aerosol particles, PBAP, from sources such as plants and fungi) (Bauer et al., 2002; Donahue et al., 2009; Hallquist et al., 2009; Fröhlich-Nowoisky et al., 2016).
Detailed source apportionment and quantification of carbonaceous aerosol is challenging due to it numerous sources, the complexity of atmospheric formation, and the vast number of organic compounds associated with carbonaceous aerosols. A few studies have addressed carbonaceous aerosol sources in the European rural background environment using source-specific organic tracers (Gelencsér et al., 2007; Szidat et al., 2009; Genberg et al., 2011; Gilardoni et al., 2011; Yttri et al., 2011a, b). These consistently show that residential wood burning dominates OC in winter, whereas biogenic secondary organic aerosol (BSOA) is the major source in summer. PBAP makes a significant contribution to PM10 in the vegetative season in the Nordic countries, second only to BSOA (Yttri et al., 2011a, b). Fossil fuel sources typically dominate EC regardless of season, but residential wood burning emissions can be equally important and occasionally dominate in the heating season (Zotter et al., 2014; Yttri et al., 2019). Online high-time-resolution measurements by aerosol mass spectrometer (AMS) and aerosol chemical speciation monitors (ACMS) have become available in recent years, complementing offline analysis of organic tracers. In the comprehensive study by Crippa et al. (2014), including 15 European rural background sites and 2 urban sites, covering winter, spring, and autumn, hydrocarbon-like organic aerosol (OA; 11 ± 5 %) and biomass burning OA (12 ± 5 %) contributed almost equally to the total OA concentration. The vast majority was, however, attributed to secondary sources such as semi-volatile oxygenated OA (34 ± 11 %) and low-volatility oxygenated OA (50 ± 16 %). Secondary oxygenated OA (OOA) can be both anthropogenic and biogenic; however, Crippa et al. (2014) did not draw any conclusions on this. Results presented by Bougiatioti et al. (2014) show how freshly emitted biomass burning OA can be transformed to more oxidized OOA after just a short time in the atmosphere when subject to high temperatures and high solar radiation.
Over the last decades, European anthropogenic emissions of secondary inorganic aerosol precursors, such as ammonia (NH3) and nitrogen oxides (NOx), and non-methane volatile organic compounds (NMVOC) have stabilized, and those of sulfur dioxide (SO2) have significantly decreased, following implementation of the Gothenburg Protocol (Reis et al., 2012; UNECE, 2013; Matthews et al., 2020). Anthropogenic carbonaceous aerosol is not regulated by any binding international protocol, although a related benefit is expected from the regulation of NOx and NMVOC, which act as precursors of secondary organic aerosol (Hallquist et al., 2009). In 2012, PM2.5 was included in the revised version of the Gothenburg Protocol (UNECE, 2013); specifically, the protocol states that effort should be directed towards sources that also emit black carbon (BC), which will inevitably also influence OC.
Residential wood burning is a major source of carbonaceous aerosol in circumpolar countries (e.g. Yttri et al., 2014) and is even considered the most important source in Norway, accounting for 48 % (2017) of PM2.5 (Grythe et al., 2019). This region also regularly experiences major wild and agricultural fires (e.g. Stohl et al., 2006, 2007). A growing number of studies show that residential wood burning is more widespread in continental Europe than previously assumed and that its contribution to the ambient carbonaceous aerosol can be substantial (Sillanpää et al., 2005; Gelencsér et al., 2007; Puxbaum et al., 2007; Lanz et al., 2010; Maenhaut et al., 2012; Genberg et al., 2011; Fuller et al., 2014; Yttri et al., 2019) and even dominating (Szidat et al., 2007; Herich et al., 2014). Residential wood burning is a decentralized source in Europe, and combustion typically takes place in small units where the emissions are emitted without after-treatment. An economic downturn in Greece compelled households to burn firewood and waste material as fuel costs rose, increasing residential wood burning emissions in urban areas by 30 % (Saffari et al., 2013). Future increases in European wood burning emissions might occur due to climate change mitigation policies supporting the use of renewable and biofuels (van der Gon et al., 2015). Denier van der Gon et al. (2015) conclude that European emissions from residential wood burning are significantly underestimated; thus, it appears timely to address how ambient carbonaceous aerosol – particularly from biomass burning – has developed over the last 2 decades.
Kahnert et al. (2004) and Tørseth et al. (2012) highlight the importance of long-term measurements (>10 years) of carbonaceous aerosol. The Birkenes Observatory in southern Norway holds the longest time series of OC and EC in Europe, dating back to 2001, including measurements in both the PM10 and PM2.5 fractions. Influenced by major anthropogenic emission regions in Europe, the Birkenes Observatory is well-suited to monitor air pollution from continental Europe.
Here, we apply positive matrix factorization (PMF) to identify sources of carbonaceous aerosol at the Birkenes Observatory. Measurements of complementary species accompany monitoring, allowing us to understand these sources, their contribution, and their variability at timescales from minutes to decades: organic tracers for biomass burning (levoglucosan), PBAP (arabitol, mannitol, trehalose, and glucose), and BSOA (2-methyltetrols), as well as high-time-resolution equivalent black carbon resulting from biomass (eBCBB) and fossil (eBCFF) fuel combustion, derived from multi-wavelength Aethalometer measurements.
2.1 Sampling site
The Birkenes Observatory (58∘23′ N, 8∘15′ E; 219 m a.s.l., above sea level) is an EMEP/GAW (Global Atmospheric Watch) supersite in southern Norway (Fig. 1), situated 100 m south-east of the old Birkenes site, that initiated measurements in 2009. The observatory is in the Boreo-nemoral zone with mixed coniferous and deciduous trees (65 % of the land use near the site); the remainder of the land use in the region is meadows (10 %), low-intensity agricultural areas (10 %), and freshwater lakes (15 %). Close to the Skagerrak coast (∼20 km) and at low altitude, the observatory experiences a maritime climate with relatively mild winters and moderately warm summers. The prevailing wind is westerly/south-westerly. Figure S1 in the Supplement shows the ambient temperature and precipitation (2001–2018) at Birkenes. The nearest city is Kristiansand (population ∼ 61 000), which is 25 km to the south-south-west.
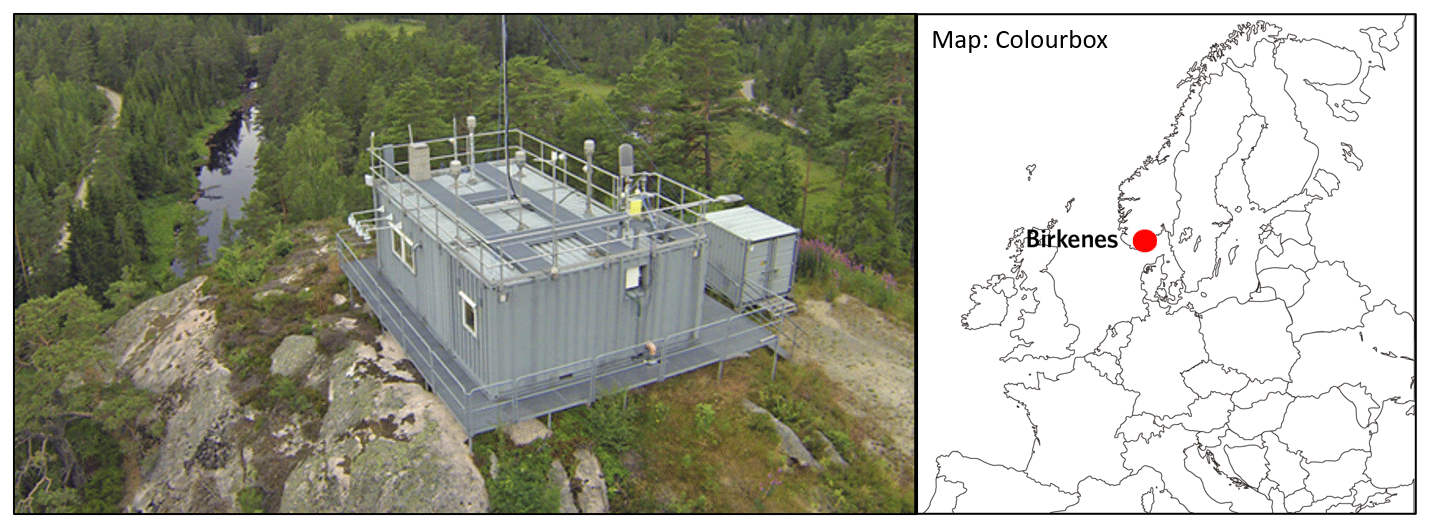
Figure 1The Birkenes Observatory (58∘23′ N, 8∘15′ E; 219 m a.s.l.) lies in the Boreo-nemoral zone, 20 km from the Skagerrak coastline in southern Norway.
2.2 Measurements and procedures
2.2.1 Offline filter measurements
We collected , organic tracers, and PM mass filter samples using two low-volume samplers with a PM10 and a PM2.5 inlet. Quartz fibre filters (Whatman QM-A; 47 mm in diameter) were pre-fired (850 ∘C for 3 h). We conditioned the filters (20 ± 1 ∘C at 50 ± 5 % RH, relative humidity) for 48 h before and after exposure and weighed them to obtain PM mass. We kept filters in PetriSlides and stored them at 4 ∘C after weighing and before analysis. After analysis and prior to organic tracer analysis, the samples were stored at −18 ∘C. Two field blanks were assigned to each month of sampling and were treated in exactly the same manner regarding preparation, handling, transport, and storage as the exposed filters, except that they were not inserted in the samplers. We collected one sample per sampler per week (168 h) except for the period from 14 August 2002 to 17 September 2008 during which two samples were collected per sampler per week at 24 and 144 h intervals. The sampling inlets are 2 m above the observatory roof, 5 m above ground level (∼226 m a.s.l.). The and PM mass time series date back to February 2001, and the organic tracers date back to January 2008 (monosaccharide anhydrides) and January 2016 (sugars, sugar-alcohols, and 2-methyltetrols).
We performed thermal–optical analysis (TOA, Sunset Laboratory instrument), using transmission for charring correction. We used the Quartz temperature programme in 2001–2008 and EUSAAR-2 (Cavalli et al., 2010) from 2008 onward. We compare the two temperature programmes for PM2.5 samples collected in 2014 in Sect. S1 in the Supplement. instrument performance is regularly inter-compared under the joint EMEP/ACTRIS quality assurance and quality control effort (e.g. Cavalli et al., 2013).
Until 2014, we determined monosaccharide anhydrides (levoglucosan, mannosan, and galactosan) in PM10 using high-performance liquid chromatography high-resolution time-of-flight mass spectrometry (HPLC-HR-TOFMS) in negative electrospray ionization mode according to the method of Dye and Yttri (2005). After 2014, we use ultra-performance liquid chromatography (UPLC), with two Waters columns (2 mm × 2.1 mm × 150 mm HSS T3, 1.8 µm, Waters Inc.). Changing the column improved the chromatographic resolution, allowing for the analysis of sugars, sugar-alcohols, and 2-methyltetrols. We identified the monosaccharide anhydrides based on retention time and mass spectra (accurate mass and isotope pattern) of authentic standards (Table S1 in the Supplement). Isotope-labelled standards of levoglucosan, galactosan, arabitol, mannitol, trehalose, and glucose were used as internal recovery standard (Table S1).
Weekly , PM10, and PM2.5 are publicly available on EBAS (http://ebas.nilu.no, last access: 1 December 2020). The mean values (daily/weekly/seasonal/annual) used below, the merging of data from the old and new Birkenes sites, and the quality assurance of the filter data are detailed in Sect. S1. We used the Mann–Kendall test (Mann, 1945; Kendall, 1975; Gilbert, 1987) to identify significant trends in the filter-based measurements, and we implemented the Theil–Sen slope (Theil, 1950; Sen, 1968; Gilbert, 1987) to quantify the trends (Sect. S2).
2.2.2 Online measurement and source apportionment of absorption coefficients
We determined absorption coefficients (BAbs) using a multi-wavelength absorption photometer (AE33 Aethalometer, Magee Scientific). Here, we performed source apportionment using the Aethalometer model (Sandradewi et al., 2008) to determine eBCBB/eBCFF. However, the Aethalometer model requires a priori knowledge of the aerosol Ångstrøm exponents (AAEs). As the output of the aethalometer model is highly sensitive to the input AAEs, uncertainty in the input AAEs leads to large uncertainty in the output time series. Furthermore, the high sensitivity of the model to the AAEs typically leads to negative concentrations as outputs during time periods where the input AAE does not match the true AAE, whether due to an incorrect choice of input AAE or variability of the true AAE. Therefore, we also used a novel PMF application (Platt et al., 2021) and find two factors: a low AAE factor (0.9) and a higher AAE factor (2.04), identified as eBCFF and eBCBB respectively. Uncertainties were assessed using bootstrapping (n=2000). The advantages of the PMF are that no a priori knowledge of the factor AAEs is required, no periods of negative concentration result, deviations from a the strict power-law dependence of BAbs on wavelength (e.g. due to the degradation of light-absorbing components in the atmosphere or instrument errors/bias) are permitted, and poorly fitting data are assigned to a residual. Meanwhile, bootstrapping allows for the estimation of uncertainties; the methodology of the PMF analysis and Aethalometer data post-processing are detailed in Sect. S3 (Table S2).
2.3 FLEXPART model simulations
We investigated the origin of the observed eBC with a Lagrangian transport model (FLEXPART v10.4, Pisso et al., 2019). The model, powered by the European Centre for Medium-Range Weather Forecasts with 137 vertical layers and a horizontal resolution of 0.1∘ × 0.1∘, tracks simulated particles arriving at the receptor 30 d backwards in time (retro-plume mode) and accounts for gravitational settling, dry and wet deposition (Grythe et al., 2017), turbulence (Cassiani et al., 2015), unresolved mesoscale motions (Stohl et al., 2005), and includes a deep convection scheme (Forster et al., 2007). Output consists of an emission sensitivity (0.5∘ × 0.5∘ resolution), which is a quantitative measure of the particle mass concentration at the receptor resulting from a unit emission flux at the Earth's surface. The emission sensitivity can also be interpreted as a probability distribution field of the particle's origin, which is used in the present study to identify possible source regions of eBC.
2.4 Positive matrix factorization analysis on filter data
We performed PMF ME-2 (positive matrix factorization generalized multilinear engine; Canonaco et al., 2013; see Sect. S3 of this paper for a description of the analysis principle and Sect. S4 for its application to filter data) for samples collected in 2016–2018 (151 samples) using the following input data: OC (in PM2.5 and PM10–2.5); EC (in PM10); levoglucosan mannosan, galactosan, arabitol, mannitol, trehalose, glucose, 2-methylerythritol, 2-methylthreitol, V, Mn, Ti, Fe, Co, Ni, Cu, Zn, As, Cd, and Pb (all in PM10); and SO, NO, NH, Ca2+, Mg2+, K+, Na+, and Cl− (from open filter face). Table S3 shows the miscellaneous settings of the PMF analysis of these data, including missing data treatment and an assessment of the PMF performance. The input data and error estimates were prepared using the procedure suggested by Polissar et al. (1998) and Norris et al. (2014); see Sect. S3.
Source apportionment by PMF is based on the temporal variability of the components. It is expected that significant contributions to carbonaceous aerosol at Birkenes are via long-range atmospheric transport (LRT), in addition to more local sources. Local and LRT sources will have different temporal variability, and significant mixing of air masses and chemical transformation is expected for the latter, i.e. factor profiles at Birkenes are expected to differ somewhat from emission profiles at the source, even though the profile is distinctive enough for source attribution. Therefore, we did not attempt to constrain factor profiles via methods such as ME-2 (Canonaco et al., 2013) because Birkenes, as a relatively clean rural background site, is unlikely to receive unprocessed emissions. Furthermore, in some cases, mixed contributions to a factor can be resolved a posteriori for source quantification (i.e. if it is clear where mass should be reassigned), without potentially perturbing the output factor time series.
Two previous studies have used factor analysis to study PM sources at Birkenes (Aamundsen et al., 1992; Maenhaut, 2018). The present study focuses on carbonaceous aerosol, using OC, EC, and highly source-specific organic tracers as input in addition to inorganic species and elements used by Aamundsen et al. (1992) and Maenhaut (2018). This provides a different set of factors, based on different input, hampering any reliable comparison of these studies.
Identification of PMF factors
The biomass burning (BB) factor appears well confined in the PMF solution (Fig. 2, Table S4), explaining all of the monosaccharide anhydrides (95 %–98 %). OCBB was almost exclusively (87 %) in the fine fraction of PM10. Other key qualifiers derived from the BB factor are the ratios listed in Table 1, which are highly comparable to the results obtained by 14C analysis reported in the comprehensive study by Zotter et al. (2014). The BB factor is elevated in the heating season and peaks in winter, pointing to residential heating as the major source.
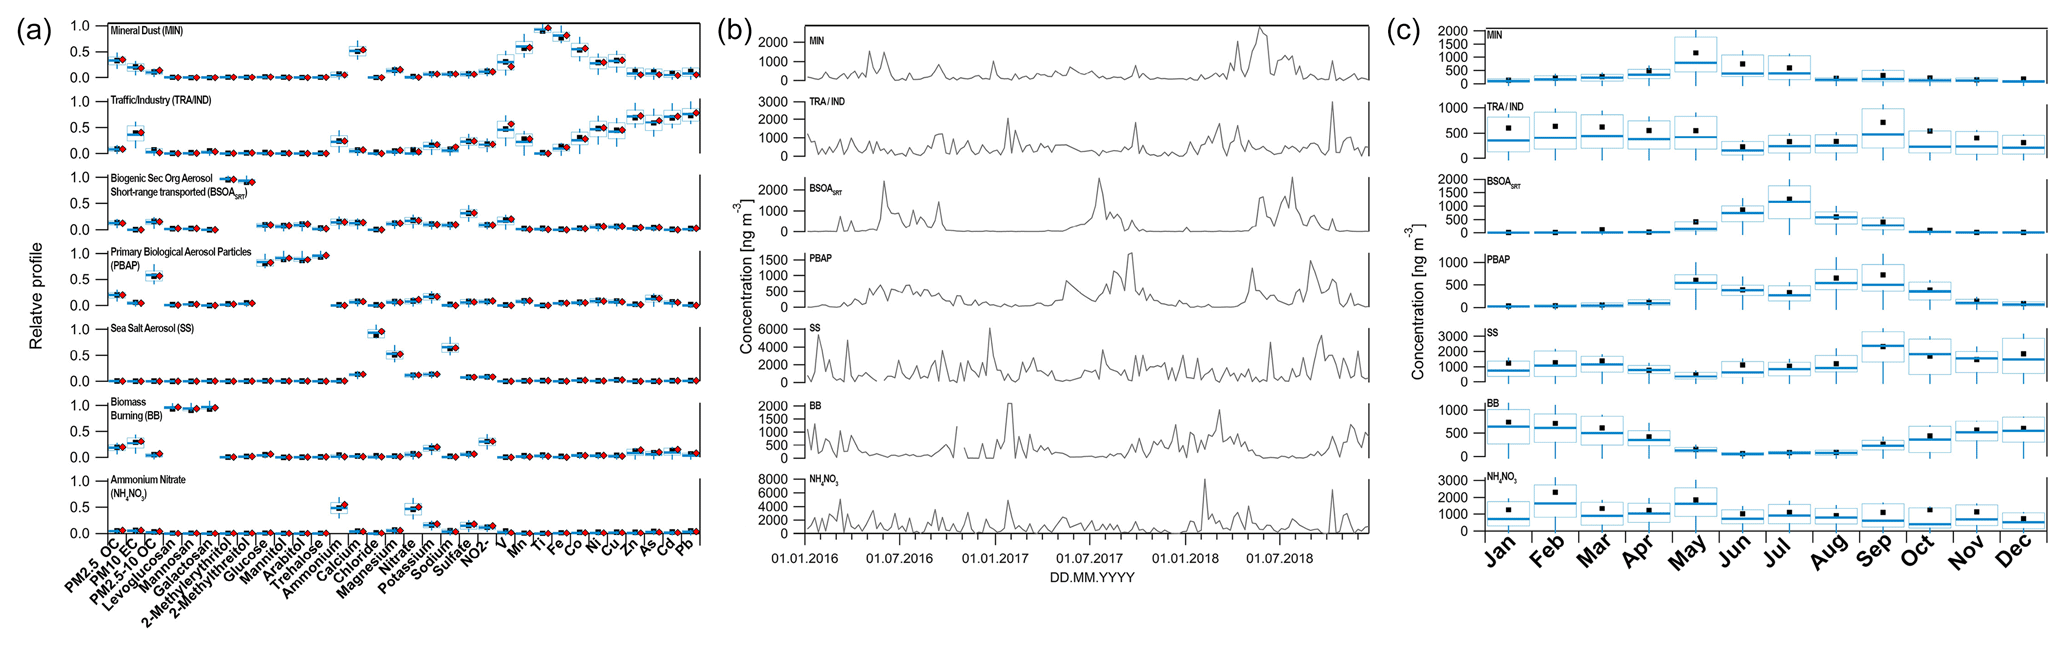
Figure 2Results from PMF for Birkenes for 2016–2018, showing the (a) factor profiles, (b) factor time series, and (c) aggregated monthly data. The box plots in panels (a) and (c) show statistics from bootstrapped solutions (n=5000), including the 25th and 75th percentiles (boxes), the median (horizontal lines), and the 10th and 90th percentiles (whiskers). Black markers are the means. The red markers in panel (a) show the base factor profiles.
Table 1Variables describing the biomass burning source derived from the PMF BB factor in the present study, and the comparable variables obtained by 14C analysis reported by Zotter et al. (2014).
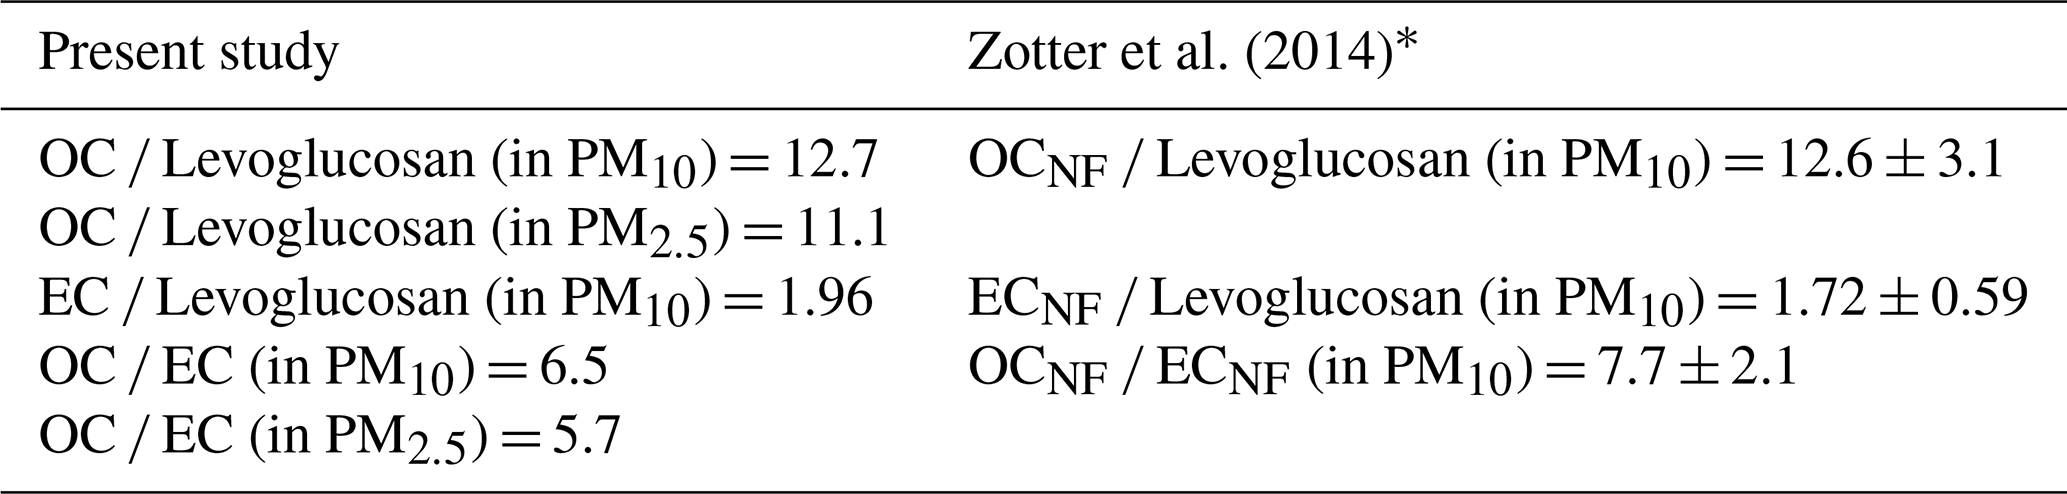
* North of the Alps. OCNF denotes non-fossil OC, and ECNF denotes non-fossil EC.
The TRA/IND factor explained most EC (50 %); the majority of the trace elements Pb (84 %), Zn (82 %), Cd (81 %), As (78 %), V (70 %), Ni (69 %), Cu (62 %), and Co (42 %); and a noticeable fraction of SO (20 %), which suggests the influence of various anthropogenic emissions. TRA/IND explained a small fraction of fine OC (10 %) and a negligible fraction of coarse OC (4 %). The majority of OC (88 %) resides in the fine fraction, which is in line with its combustion-derived origin. The high EC fraction unambiguously points to combustion processes, and the low ratio (1.4 for PM2.5) points towards a substantial, although not exclusive, influence from vehicular traffic. Cu and Zn result from brake wear (Fomba et al., 2018), whereas tyre wear is an additional source of Zn (Pacyna et al., 1986), corroborating the influence of vehicular traffic to the TRA/IND factor. Ni and V are commonly associated with the combustion of heavy oil (Viana et al., 2008); As, Cd, and Pb are associated with the combustion of coal and, to a lesser extent, oil as well as with metallurgic activity (Pacyna et al., 1986). The TRA/IND factor has a minimum in summer and shows minor variability for the rest of the year. A similar drop in the vehicular traffic factor in summer for Helsinki was shown by Saarikoski et al. (2008).
The PMF analysis confined the majority of coarse OC (53 %) and essentially all (82 %–93 %) of the PBAP tracers (arabitol, mannitol, trehalose, and glucose) to one factor (PBAP). The PBAP factor has a pronounced seasonal variability, showing increased levels in the vegetative season and being almost absent outside of this season, as previously described for coarse OC (Yttri et al., 2007a) and PBAP tracers (Yttri et al., 2007b) at Birkenes.
The 2-methyltetrols (92 %–96 %) are oxidation products of isoprene (Claeys et al., 2004) and are almost exclusively attributed to the BSOASRT (SRT denotes short-range transport) factor, which explains 9 % of fine OC and 13 % of coarse OC. The complete absence of EC and the presence of SO (17 %) underpins the secondary nature of this factor, which is present in summer with tail ends in late spring and early autumn. The BSOASRT time series increases abruptly in the May–June transition, as leaves unfold, and subsides equally rapid at the beginning of October when trees shed their leaves. The near absence of 2-methyltetrols prior to May–June suggests that the 0.5- to 1.5-month earlier onset of the vegetative season in continental Europe (Rötzer and Chmielewski, 2001) is not reflected by the 2-methyltetrols observations at Birkenes, indicating a short atmospheric lifetime for 2-methyltetrols. Consequently, local isoprene emissions likely explain the observed concentrations of 2-methyltetrols at Birkenes, which calls the extent to which the BSOASRT factor includes a continental BSOA contribution into question. Similar sources (deciduous and coniferous trees), temperature-dependent emissions, and formation rates suggest that particulate-phase oxidation products of mono- and sesquiterpenes are accounted for by the isoprene-derived BSOASRT factor as well, although with a similar issue concerning local vs. LRT contribution as those proposed for the 2-methyltetrols.
The MIN factor is defined by its content of Ti (93 % of total), Fe (75 %), Mn (52 %), and Ca2+ (39 %) (Fig. 2, Table S4), which are well-known constituents of mineral dust (e.g. Alastuey et al., 2016). It also contains some of the elements that dominate the TRA/IND factor, including Co (43 %), Cu (20 %), Ni (17 %), and V (14 %), indicating an anthropogenic influence. Notably, 31 % of fine OC is attributed to the MIN factor, whereas it explains 13 % of coarse OC. This corresponds to the findings reported by Kyllönen et al. (2020) for the subarctic Pallas (Finland) site, where 29 % of the fine OC was apportioned to the mineral dust factor. Waked et al. (2014) found a similar result for Lens (France), where the mineral dust factor explained 15 % of OC. No information on the size distribution was available in Kyllönen et al. (2020) and Waked et al. (2014); however, in the present study, 86 % of OC in the MIN factor resides in the fine fraction of PM10. As mineral dust typically resides in the coarse fraction of PM10 (Ripoll et al., 2015), one would expect the same for its carbon content (e.g. as CaCO3). More efficient deposition of coarse-mode mineral dust during LRT is one possible explanation, but the mixing of air masses is more likely, as 13 % of the EC also resides in this factor. The high ratio in the unweighted MIN factor profile (18 for PM2.5) indicates a minor primary combustion particle influence, and the absence of levoglucosan shows that the EC content originates from fossil fuel combustion (consistent with some TRA/IND influence). Using Eq. (1), 8 % of the MIN factor's fine OC content is attributed to the combustion of fossil fuel OC (OCPrimFF), whereas the corresponding percentage for PM10 OC is 7 %. If all Ca2+ and Mg2+ in the MIN factor were present as either calcite (CaCO3) or dolomite CaMg(CO3)2, the CO-carbon would account for no more than 3 % of the factor's PM10 OC content – or 22 % if it all resided in the coarse fraction. This shows that the OC content of the MIN factor mostly originates from sources other than mineral dust and the combustion of fossil fuel. The MIN factor is most abundant in spring and early summer, as seen by Waked et al. (2014), and is associated with southern air masses, as seen for the dry and warm period in the May–June transition in 2018 (Fig. 3) when there was a pronounced peak in the MIN factor time series (Fig. 2). Indeed, the mean ambient temperature was 4 ∘C higher for May 2018 than for May 2001–2018, whereas it was 2.4 ∘C higher for June 2018 than for June 2001–2018. Thus, we suggest that the climatological conditions that activate mineral dust sources also favour BSOA formation and that the majority of both the fine (92 %) and coarse fraction (78 %) of OC in the MIN factor is LRT BSOA (OCBSOA,LRT).
The majority of NH (77 %) and NO (68 %) resides in the NH4NO3 factor, which points to secondary inorganic aerosol (SIA) formation during LRT. This is also supported by a noticeable contribution of SO (35 %) to the NH4NO3 factor. The factor's NO2 (30 %) content points towards a combustion-derived origin of NO3, as does EC (13 %). The factor's OC content is comparable to that seen for the BB factor. The factor is most pronounced in winter and spring.
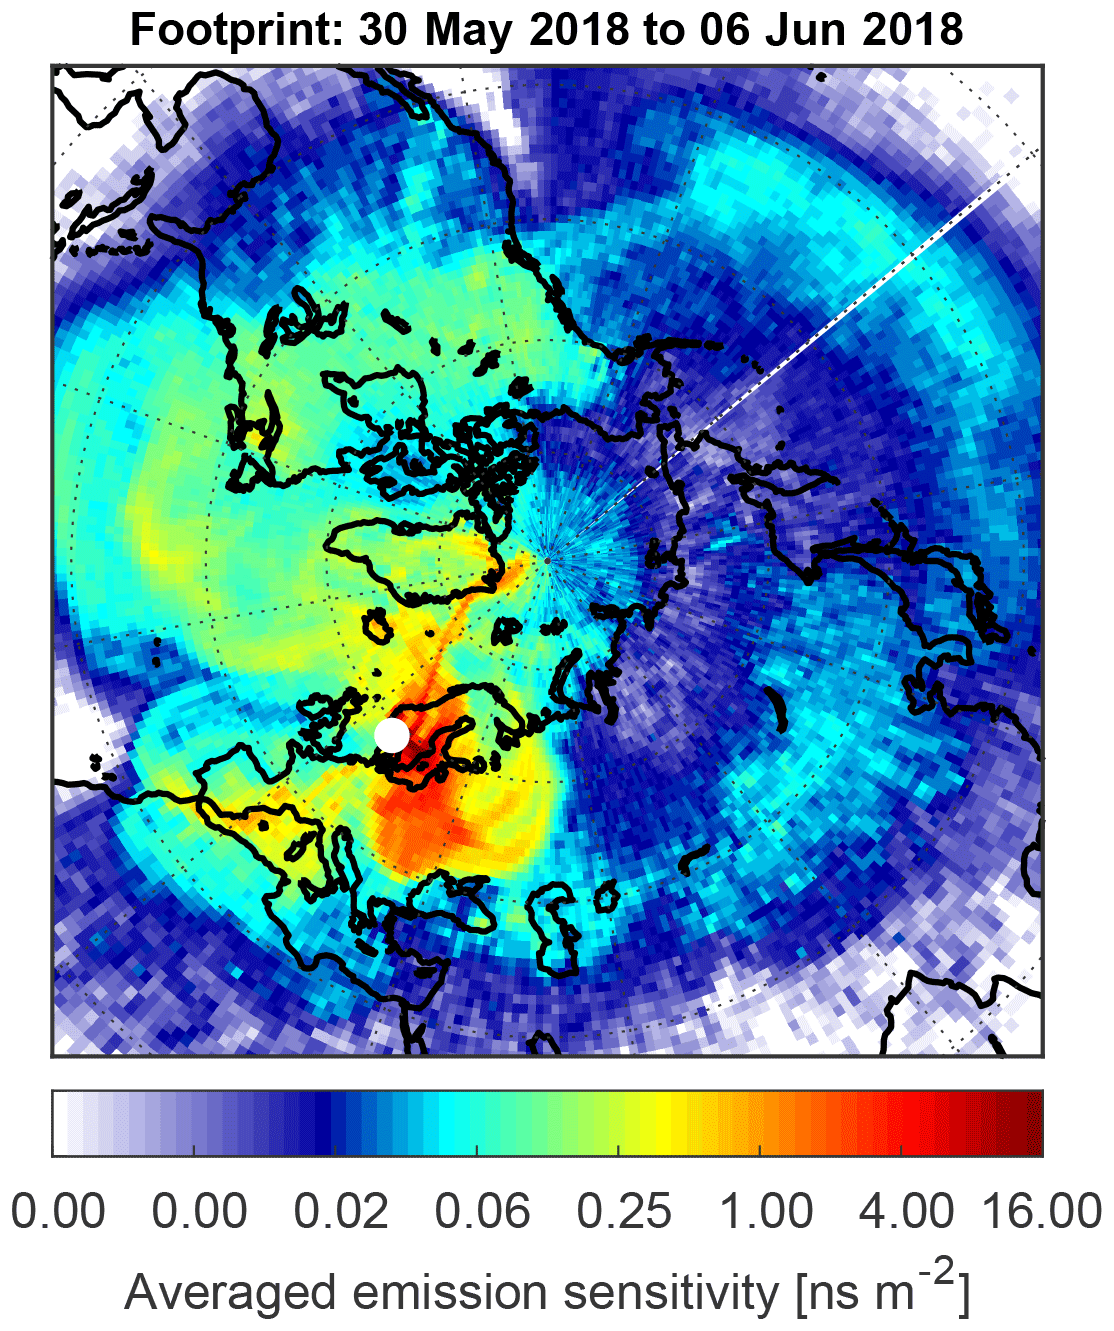
Figure 3Footprint emission sensitivities calculated using the FLEXPART model for the 30 May–6 June 2018 period at the Birkenes Observatory.
The sea salt (SS) aerosol factor was recognized by its high Cl− (96 %), Na+ (87 %), and Mg2+ (79 %) fractions. The (0.036), (0.034), and (0.282) ratios derived from the SS factor closely resemble these ratios in sea water (0.037, 0.038, and 0.252) (Stumm and Morgan, 1996), further demonstrating the successful separation of this factor.
3.1 Levels and trends of carbonaceous aerosol and organic tracers
Annual mean carbonaceous aerosol concentrations at Birkenes (2001–2018) are among the lowest in Europe (Yttri et al., 2007a, 2019), with OC from 0.56 to 1.07 µg C m−3 for PM10 and from 0.50 to 0.93 µg C m−3 for PM2.5, and EC from 0.05 to 0.15 µg C m−3 (Fig. 4; Table S4). As it stems from combustion that generates fine PM, EC was almost exclusively associated with PM2.5, whereas OC was also abundant in the coarse fraction (PM10–2.5), particularly in summer and autumn (Fig. 4). The correlation between OC and EC varied by season (Table S6) and was highest in the heating season, reflecting the contribution of biogenic, non-EC sources, such as BSOA and PBAP in the vegetative season. The higher R2 values for PM2.5 compared with PM10 can partly be attributed to PBAP, which mainly resides in PM10–2.5.
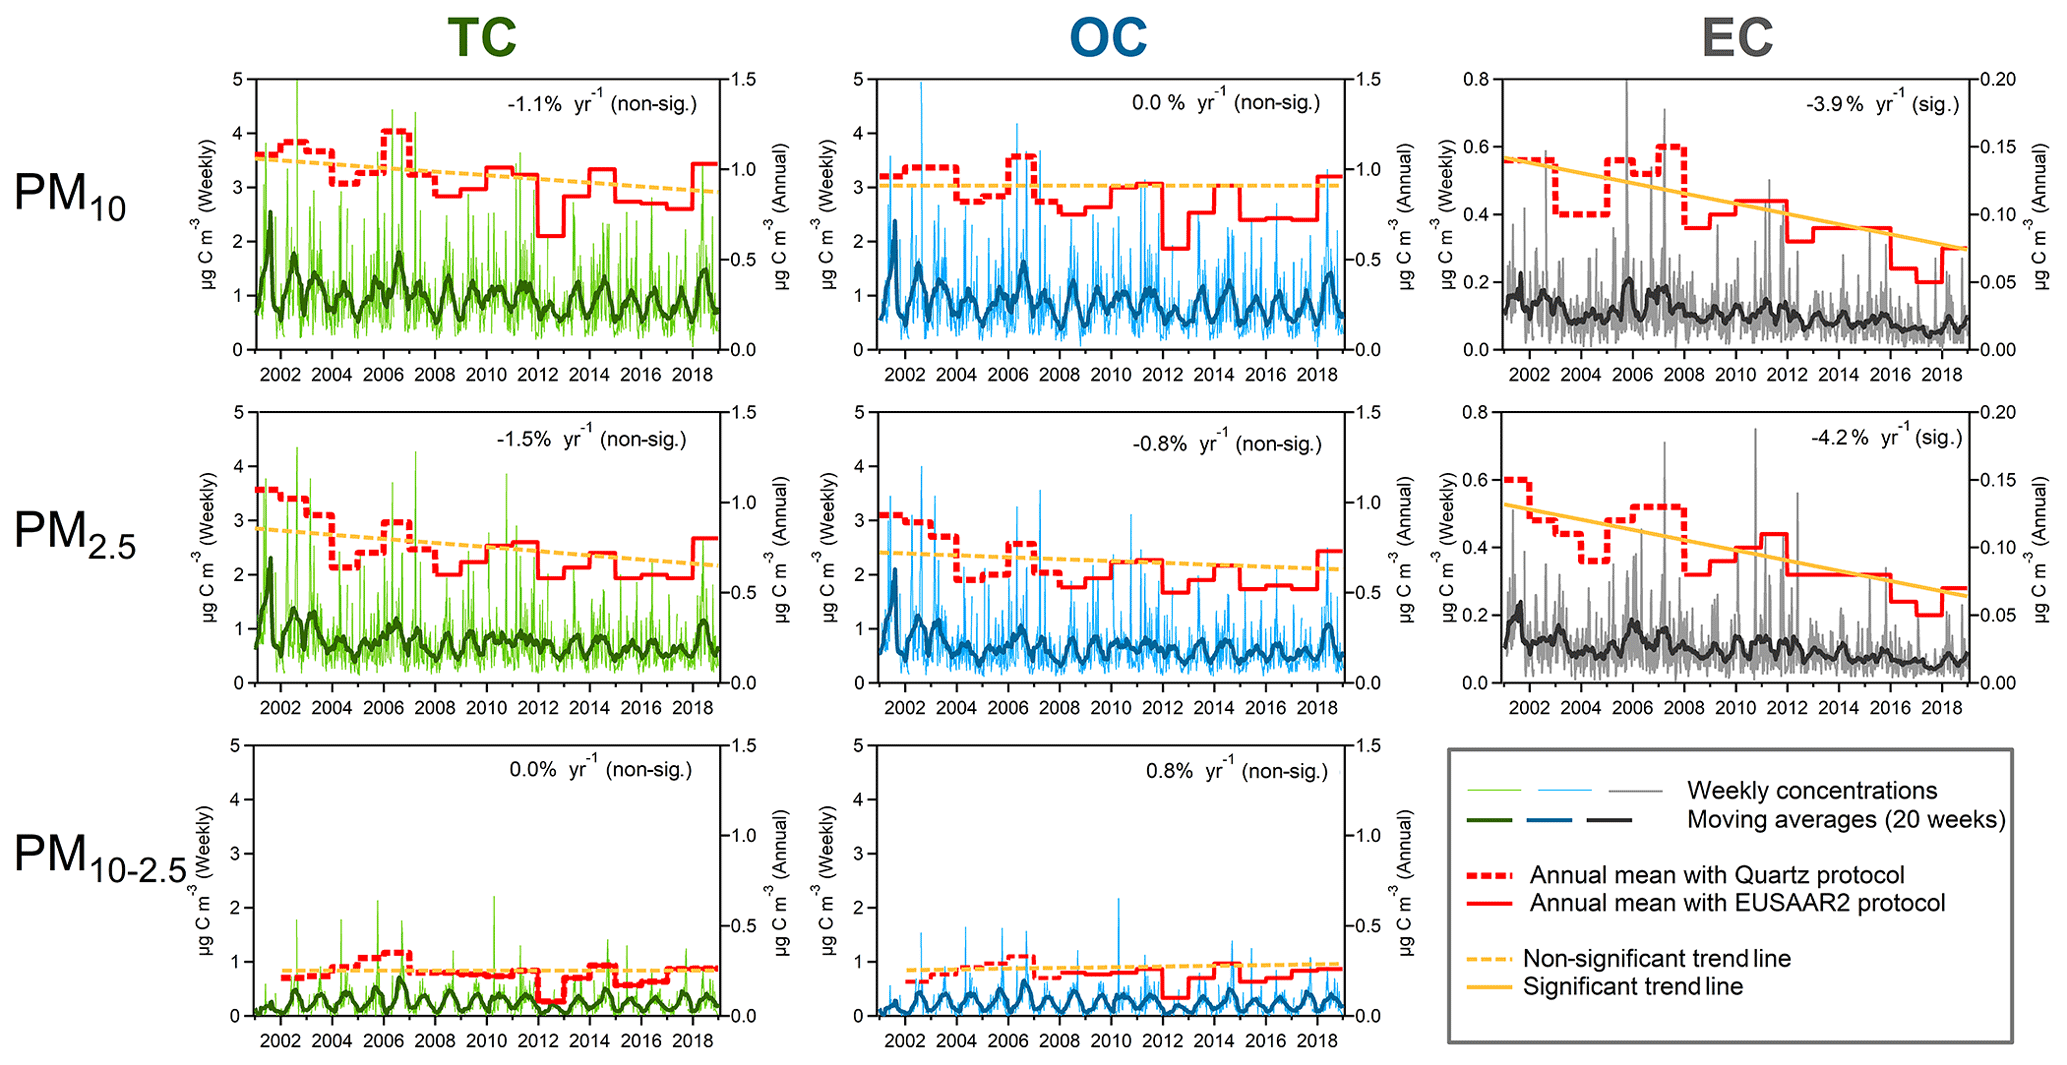
Figure 4Ambient aerosol concentrations of TC, OC, and EC in PM10 (upper panels); TC, OC, and EC in PM2.5 (middle panels); and TC and OC in PM10–2.5 (lower panels), presented as weekly (168 h) and annual mean concentrations for the Birkenes Observatory for the 2001–2018 period. The trend lines account for the protocol shift.
The variability of the annual mean OC (15 %–22 %) and EC (27 %) concentrations was comparable to the major secondary inorganic aerosol (SIA; SO, NO, and NH and sea salt (SS; Na+, Mg2+, and Cl−) aerosol species (25 %–31 %). A difference of >60 % between consecutive years was observed for OC and EC in PM10 and PM2.5, whereas 160 % was seen for OC in PM10–2.5. It is important to note that, despite decades of SO2, NH3, and NOx mitigation efforts, SIA dominates PM10 mass (29 %–52 %) most years, followed by carbonaceous aerosol (24 %–40 %) and SS aerosol (10 %–28 %) (Fig. 5; Table S7). SIA constituents were also the largest PM10 fraction during air pollution episodes (Table S8), reflecting the fact that Birkenes is affected by major SIA precursor emission regions in continental Europe.
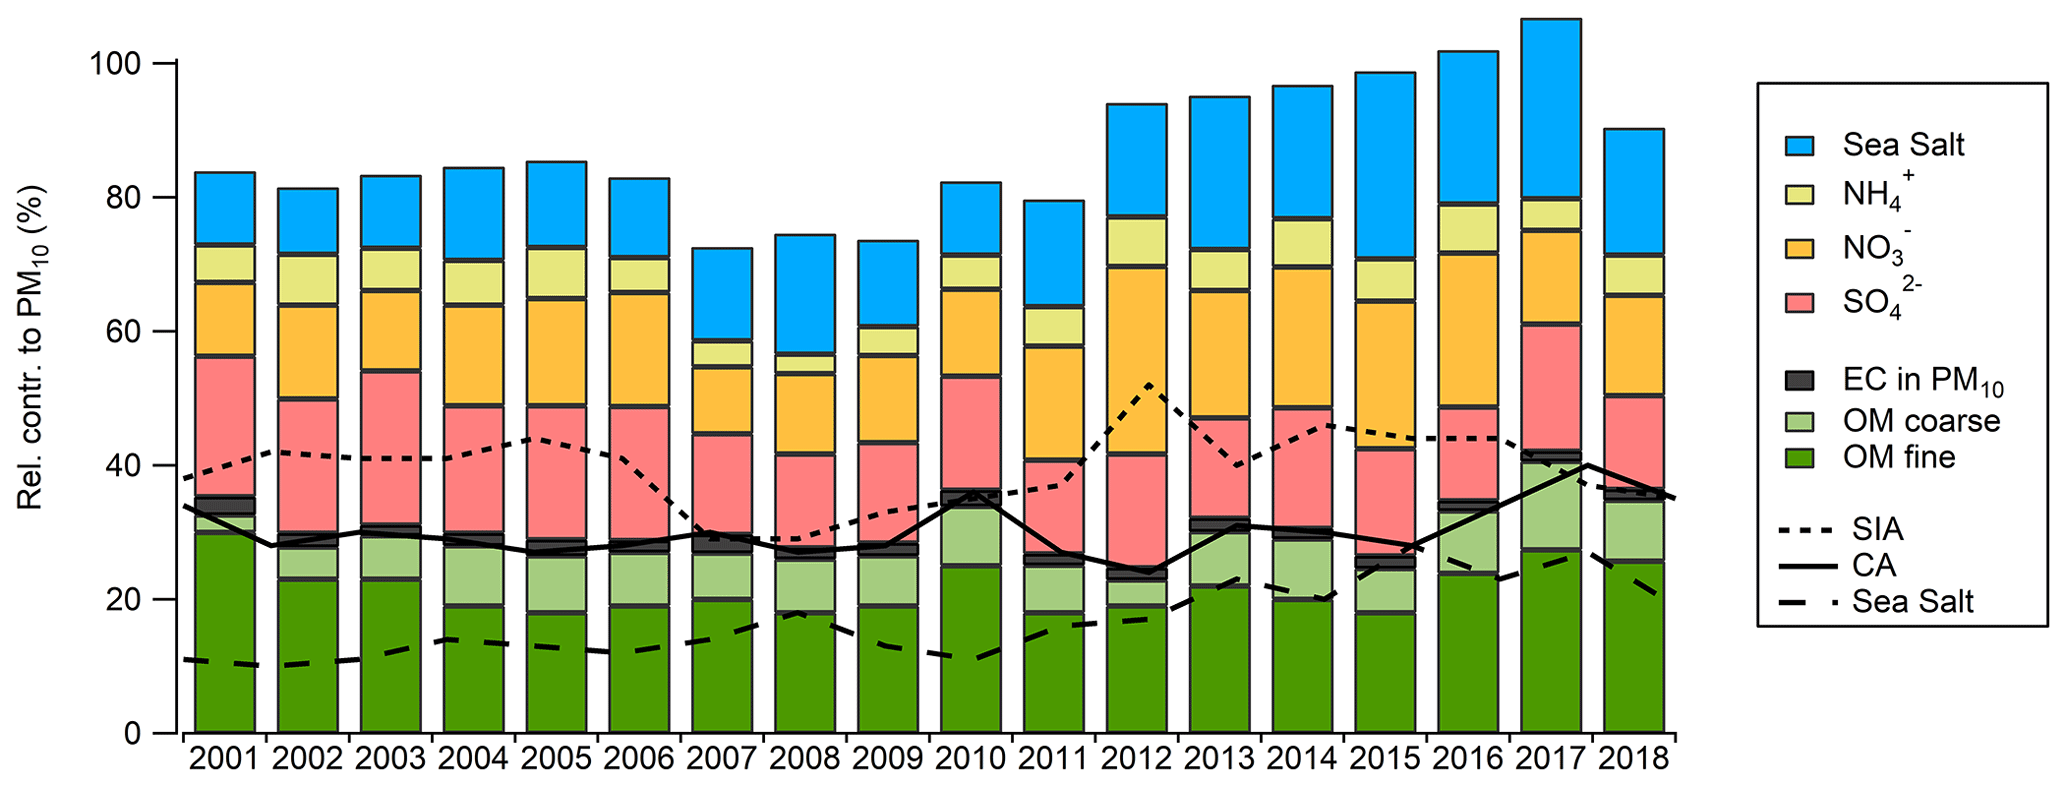
Figure 5Mass closure of PM10 for Birkenes for the 2001–2018 period (unit: %). Sea salt is the sum of Na+, Mg2+, and Cl−; secondary inorganic aerosol (SIA) is the sum of SO, NO, and NH; CA is carbonaceous aerosol; and OM is organic matter. OM is calculated using OC : OM = 1.9 (Yttri et al., 2011a).
Levels of total carbon (TC) and PM fractions are shown in Tables S9 and S10 respectively for completeness. In the following sections, we discuss the respective OC and EC fractions in detail.
3.1.1 Organic carbon
We found no significant trend for OC in PM10 (OC). There was a minor decrease (−0.8 % yr−1) for fine OC in PM2.5 (OC), whereas there was a minor increase (0.8 % yr−1) for coarse OC (OC) (Table S11). The anthropogenic fraction of OC observed at Birkenes likely has a downward trend as found for EC (Sect. 3.1.2), but the substantial influence of natural sources demonstrated in the present, as well as in previous, work (Yttri et al., 2011b) explains the general lack of trends for OC.
The OC time series are characterized by 2 years where the annual mean was substantially higher (2006) and lower (2012) than the proceeding and the following year (Fig. 4). The increased level in 2006 was most pronounced in the fine fraction and in all seasons except spring, whereas the drop in 2012 mainly was attributed to the coarse fraction and was observed in all seasons. The OC annual mean time series is characterized by a stepwise increase from 2001 up to, and including, 2006, after which the concentration dropped and showed minor annual variability, except for the very low annual mean of 2012. After 2015, there are indications of a similar stepwise increase as seen for 2001–2006.
The OC contribution to OC ranged from 18 % to 35 % on an annual basis (2001 excluded due to data capture <50 %), and levels were highest in summer and autumn. Previous studies (Simpson et al., 2007; Yttri et al., 2011a, b) showed that BSOA largely dominates the fine carbonaceous aerosol in summer at Birkenes, whereas the present study shows that Birkenes regularly experiences major air pollution events in spring, as a result of LRT (Tables S4, S7 and S8). Hence, both biogenic sources and LRT explain the observed seasonality of fine OC.
We attribute elevated OC in winter 2010 to residential wood burning emissions, as discussed in Sect. 3.2.1. Only on five occasions did the seasonal mean of OC exceed 1 µg C m−3, four of those in the first 3 years of the time series. The highest mean was observed in summer 2002 (1.4 µg C m−3) when wildfires in eastern Europe influenced Birkenes (Yttri et al., 2007a). The four other occasions, in spring 2001, 2002, 2003, and 2018, also saw prolonged episodes of PM air pollution with the hallmark of LRT (i.e. elevated SO, NO, and NH). According to our PMF analysis (see Sect. 3.2), there are several anthropogenic and biogenic sources likely to contribute to fine OC at Birkenes, whereas the coarse fraction of OC is dominated by a single source, PBAP (Yttri et al., 2007a, b, 2011a, b; Glasius et al., 2018). Hence, it is not surprising that OC was the dominant OC fraction, accounting for 70 %–89 % OC on an annual basis.
3.1.2 Elemental carbon
Notably, EC levels dropped from 2007 to 2008, contrasting with the annual mean OC time series, (Fig. 4 and Table S5). This major downward trend of EC clearly points to changing source contributions to EC at Birkenes. We rarely observed seasonal means exceeding 0.15 µg C m−3: only in winter 2006, 2007, and 2010; spring 2001, 2003, and 2007; and autumn 2005 and 2011. Weekly samples exceeded 0.5 µg C m−3 for three samples only, which were all associated with LRT.
A statistically significant reduction was calculated for EC in PM10 (−3.9 % yr−1) and PM2.5 (−4.2 % yr−1) (Table S11), corresponding well with SO (−3.8 % yr−1) and PM2.5 (−4.0 % yr−1). The trend for EC was most pronounced in spring and summer (−4.0 % yr−1 to −5.9 % yr−1) (Table S12), as seen for SO (−4.2 % yr−1 to −6.4 % yr−1) and PM2.5 (−3.0 % yr−1 to −4.4 % yr−1) (Table S12). The EMEP model finds a somewhat lower reduction for EC (−3.0 % yr−1) for 2001–2017 (Colette et al., 2021) with the largest emission reductions for the road transport (83 kt; −3.6 % yr−1) and off-road categories (44 kt; −3.7 % yr−1) (https://www.ceip.at, last access: 2020), which are sectors with minor seasonal variability. We suggest that these sectors explain the downward trend observed for EC at Birkenes and that the seasonality of the EC trend is due to the substantial contribution from less abated sources, such as domestic heating in winter and autumn. Notably, modelled EC emissions are unchanged for the other stationary combustion category for 2001–2016 (−1 kt; −0.08 % yr−1) (https://www.ceip.at), which includes residential heating and wood burning in particular.
Effective abatement of SIA precursors and fossil EC, along with a high natural source contribution to OC, largely explains why the OC fraction increased significantly for PM2.5 (+3.2 % yr−1) and PM10 (+2.4 % yr−1), whereas it decreased for the EC fraction (−3.9 % yr−1 to −4.5 % yr−1) (Table S13). The largest increase (OC) and decrease (EC) were seen in the vegetative season (Table S14) during which BSOA and PBAP increase and the influence of poorly abated sources such as domestic heating is low. Consequently, these results demonstrate a long-term change in the aerosol chemical composition at Birkenes and, thus, also in the relative source composition of PM.
3.1.3 Levoglucosan
Levels of levoglucosan and other organic tracers are given in Table S15, and other organic tracers (arabitol, mannitol, trehalose, glucose, and 2-methyltetrols) are discussed in Sect. S6.
The statistically significant decrease in levoglucosan (−2.8 % yr−1) at Birkenes for 2008–2018 (Fig. 6; Table S11) and the fact that biomass burning levels observed at Birkenes are largely explained by continental emissions (Fig. 7) might indicate that wood burning emissions in continental Europe are declining. However, surprisingly, we find no significant trend for levoglucosan on a seasonal basis (Table S12). Furthermore, although one should be careful drawing conclusions from non-significant outcomes, it is worth noting that the levoglucosan to EC ratio most likely increased (+2.8 % yr−1 for PM10, with a confidence interval (CI) from −3.5 % yr−1 to +6.5 % yr−1, and +2.3 % yr−1 for PM2.5, with a CI from −2.2 % yr−1 to 5.0 % yr−1) for the 2008–2018 period, whereas it most likely decreased for the levoglucosan to OC ratio (−1.8 % yr−1 for PM10, with a CI from −10.6 % yr−1 to +1.8 % yr−1, and −3.6 % yr−1 for PM2.5, with a CI from −9.8 % yr−1 to +1.3 % yr−1) (Table S13). A more efficient abatement of fossil sources than biomass burning would explain the levoglucosan to EC increase, whereas we fail to see a similar trend for the levoglucosan to OC ratio, as prevailing natural sources mask the assumed reduction in fossil OC of anthropogenic origin.
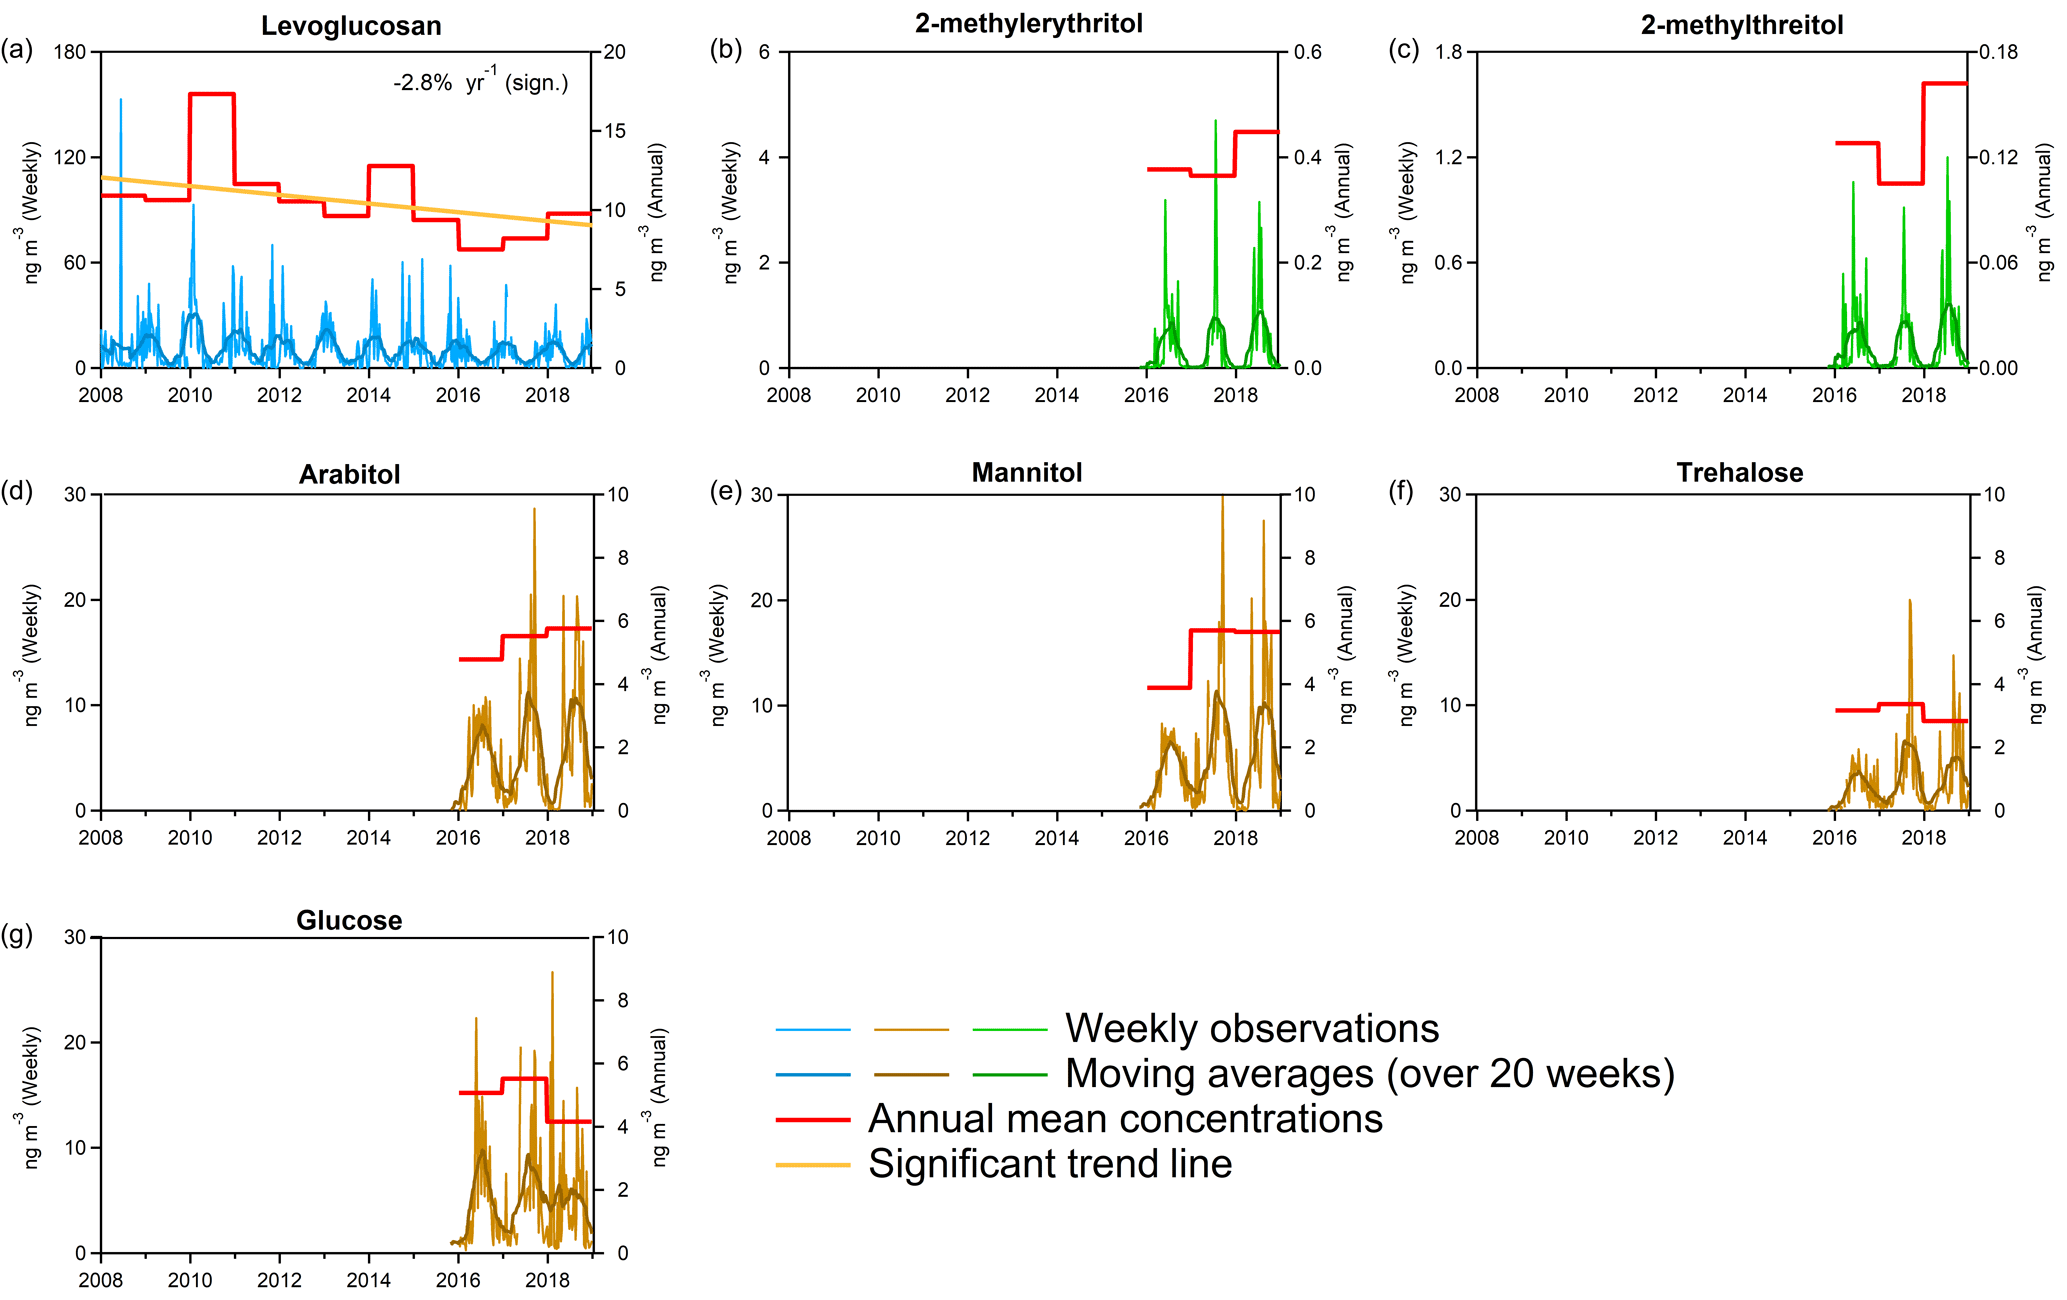
Figure 6Ambient aerosol concentrations of organic tracers in PM10, showing levoglucosan, 2-methylerythritol, and 2-methylthreitol (upper panels); arabitol, mannitol, and trehalose (middle panels); and glucose (bottom panel), presented as weekly (168 h) and annual mean concentrations for the Birkenes Observatory for the 2008–2018 period.
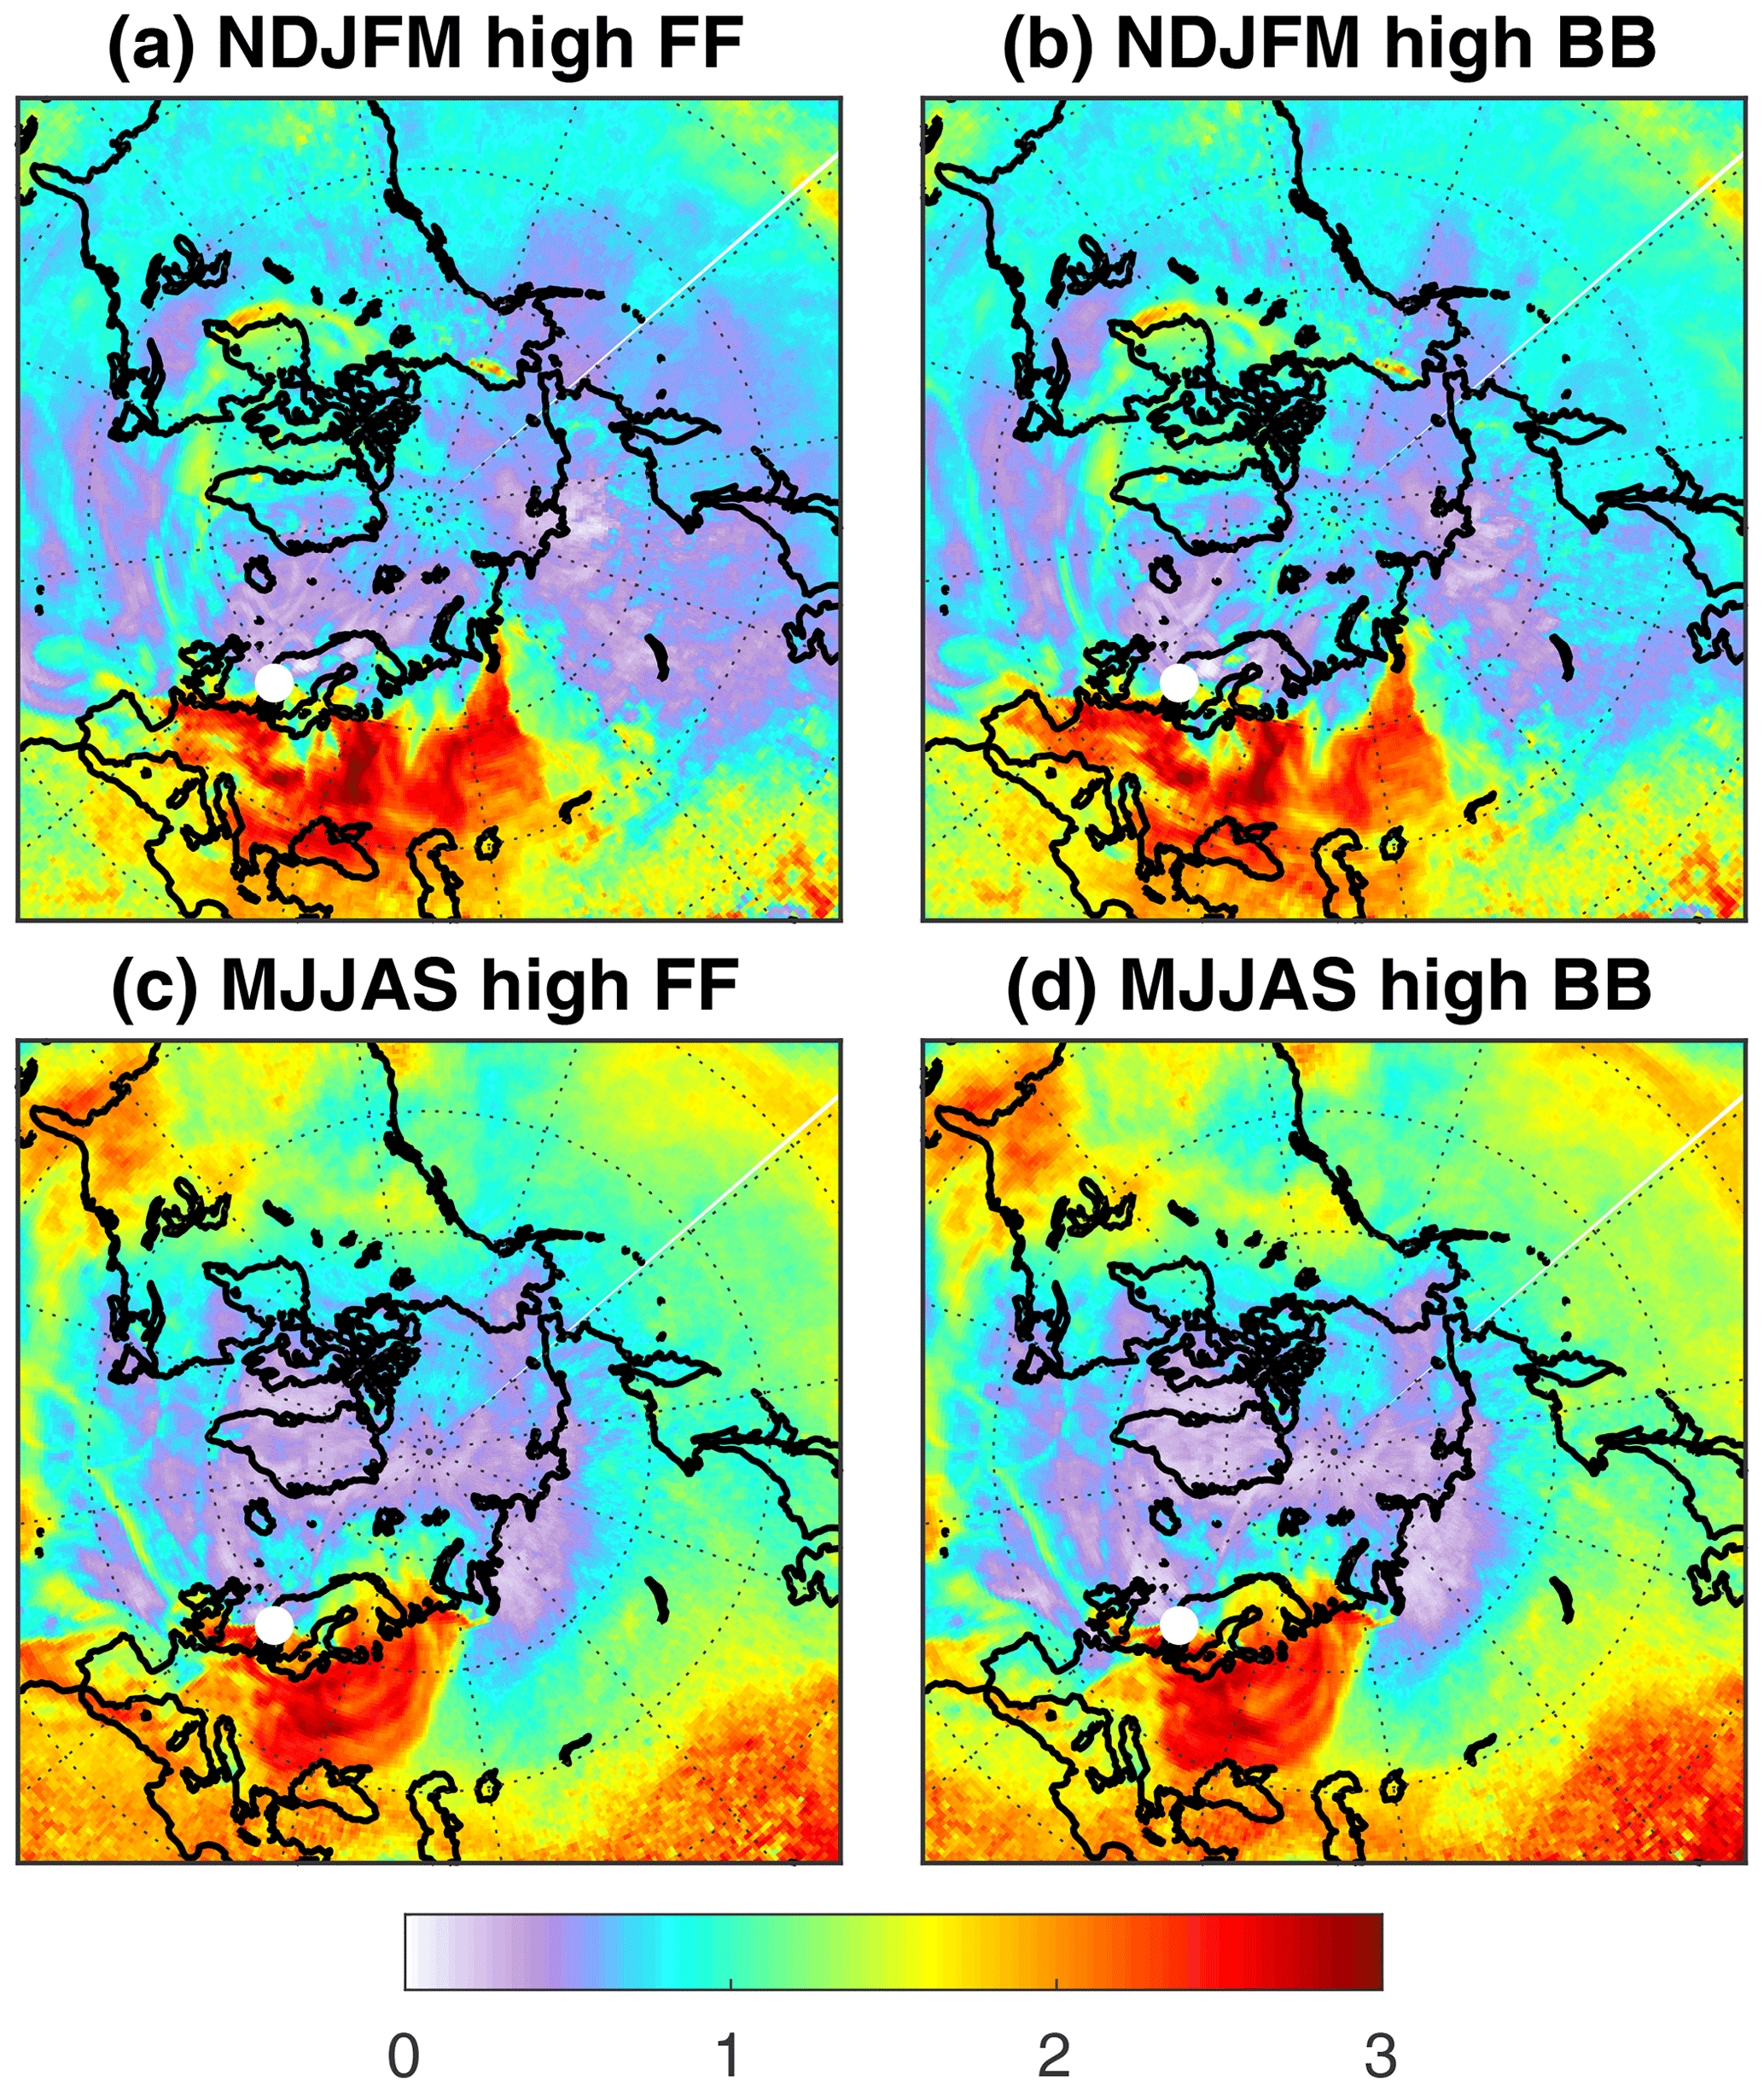
Figure 7The 70th percentiles of eBCFF (a, c) and eBCBB (b, d) for winter (NDJFM) and summer (MJJAS). The colour code shows the ratio of residence times for footprint sensitivities during measurements exceeding the 70th percentile and the average footprint sensitivity.
The levoglucosan time series provides a hitherto unprecedented opportunity to validate European residential wood burning emission inventories on a decadal timescale. Unfortunately, the inventories suffer from non-harmonized emission reporting and a lack of condensable organics (van der Gon et al., 2015; Simpson et al., 2019), which hampers any reliable attempt for such validation. Given the uncertainties in the trend calculations (i.e. annual vs. seasonal trends), more work is needed to investigate trends in levoglucosan and biomass burning, foremost by continuation of the actual time series. Such efforts should be initiated immediately given the numerous studies that point to residential wood burning as a major source of air pollution in Europe (e.g. Denier van der Gon et al., 2015; Yttri et al., 2019).
3.2 Sources of carbonaceous aerosol at Birkenes
We used PMF to apportion carbonaceous aerosol at Birkenes for 2016–2018. The time period was restricted by organic tracer data availability. Carbonaceous aerosol annual means for 2016–2018 were within the long-term annual mean (± SD) for OC and were only slightly lower for EC in 2016 and 2017; thus, they are representative of the longer time series. Six out of seven factors identified in contribution-weighted relative profiles from PMF (Fig. 2; Table S4) were associated with significant amounts of carbonaceous aerosol. This includes factors for mineral-dust-dominated aerosol (MIN), the OC content of which is mainly associated with LRT BSOA (BSOALRT); traffic/industry-like aerosol (TRA/IND); biogenic secondary organic aerosol (BSOASRT), which undergoes short-range transport; primary biological aerosol particles (PBAP); biomass burning (BB); and ammonium-nitrate-dominated aerosol (NH4NO3). The sea salt aerosol factor (SS) had a negligible (<1 %) carbonaceous aerosol content.
The MIN factor (31 %) explained the largest fraction of fine OC, whereas BB (17 %), NH4NO3 (17 %), and PBAP (16 %) had almost equally large shares, as did TRA/IND (10 %) and BSOASRT (9 %) (Fig. 8). Coarse OC was by far the most abundant in the PBAP factor (53 %), whereas BSOASRT (13 %), MIN (13 %), and NH4NO3 (12 %) explained almost equally large shares. For the other factors, coarse OC was minor. EC was apportioned to only five factors, and TRA/IND (50 %) dominated by far. BB made a 21 % contribution, and MIN and NH4NO3 contributed equally large shares (13 %). The 3 % apportioned to PBAP is an assumed analytical artefact (see Sect. 3.2.2 for details).
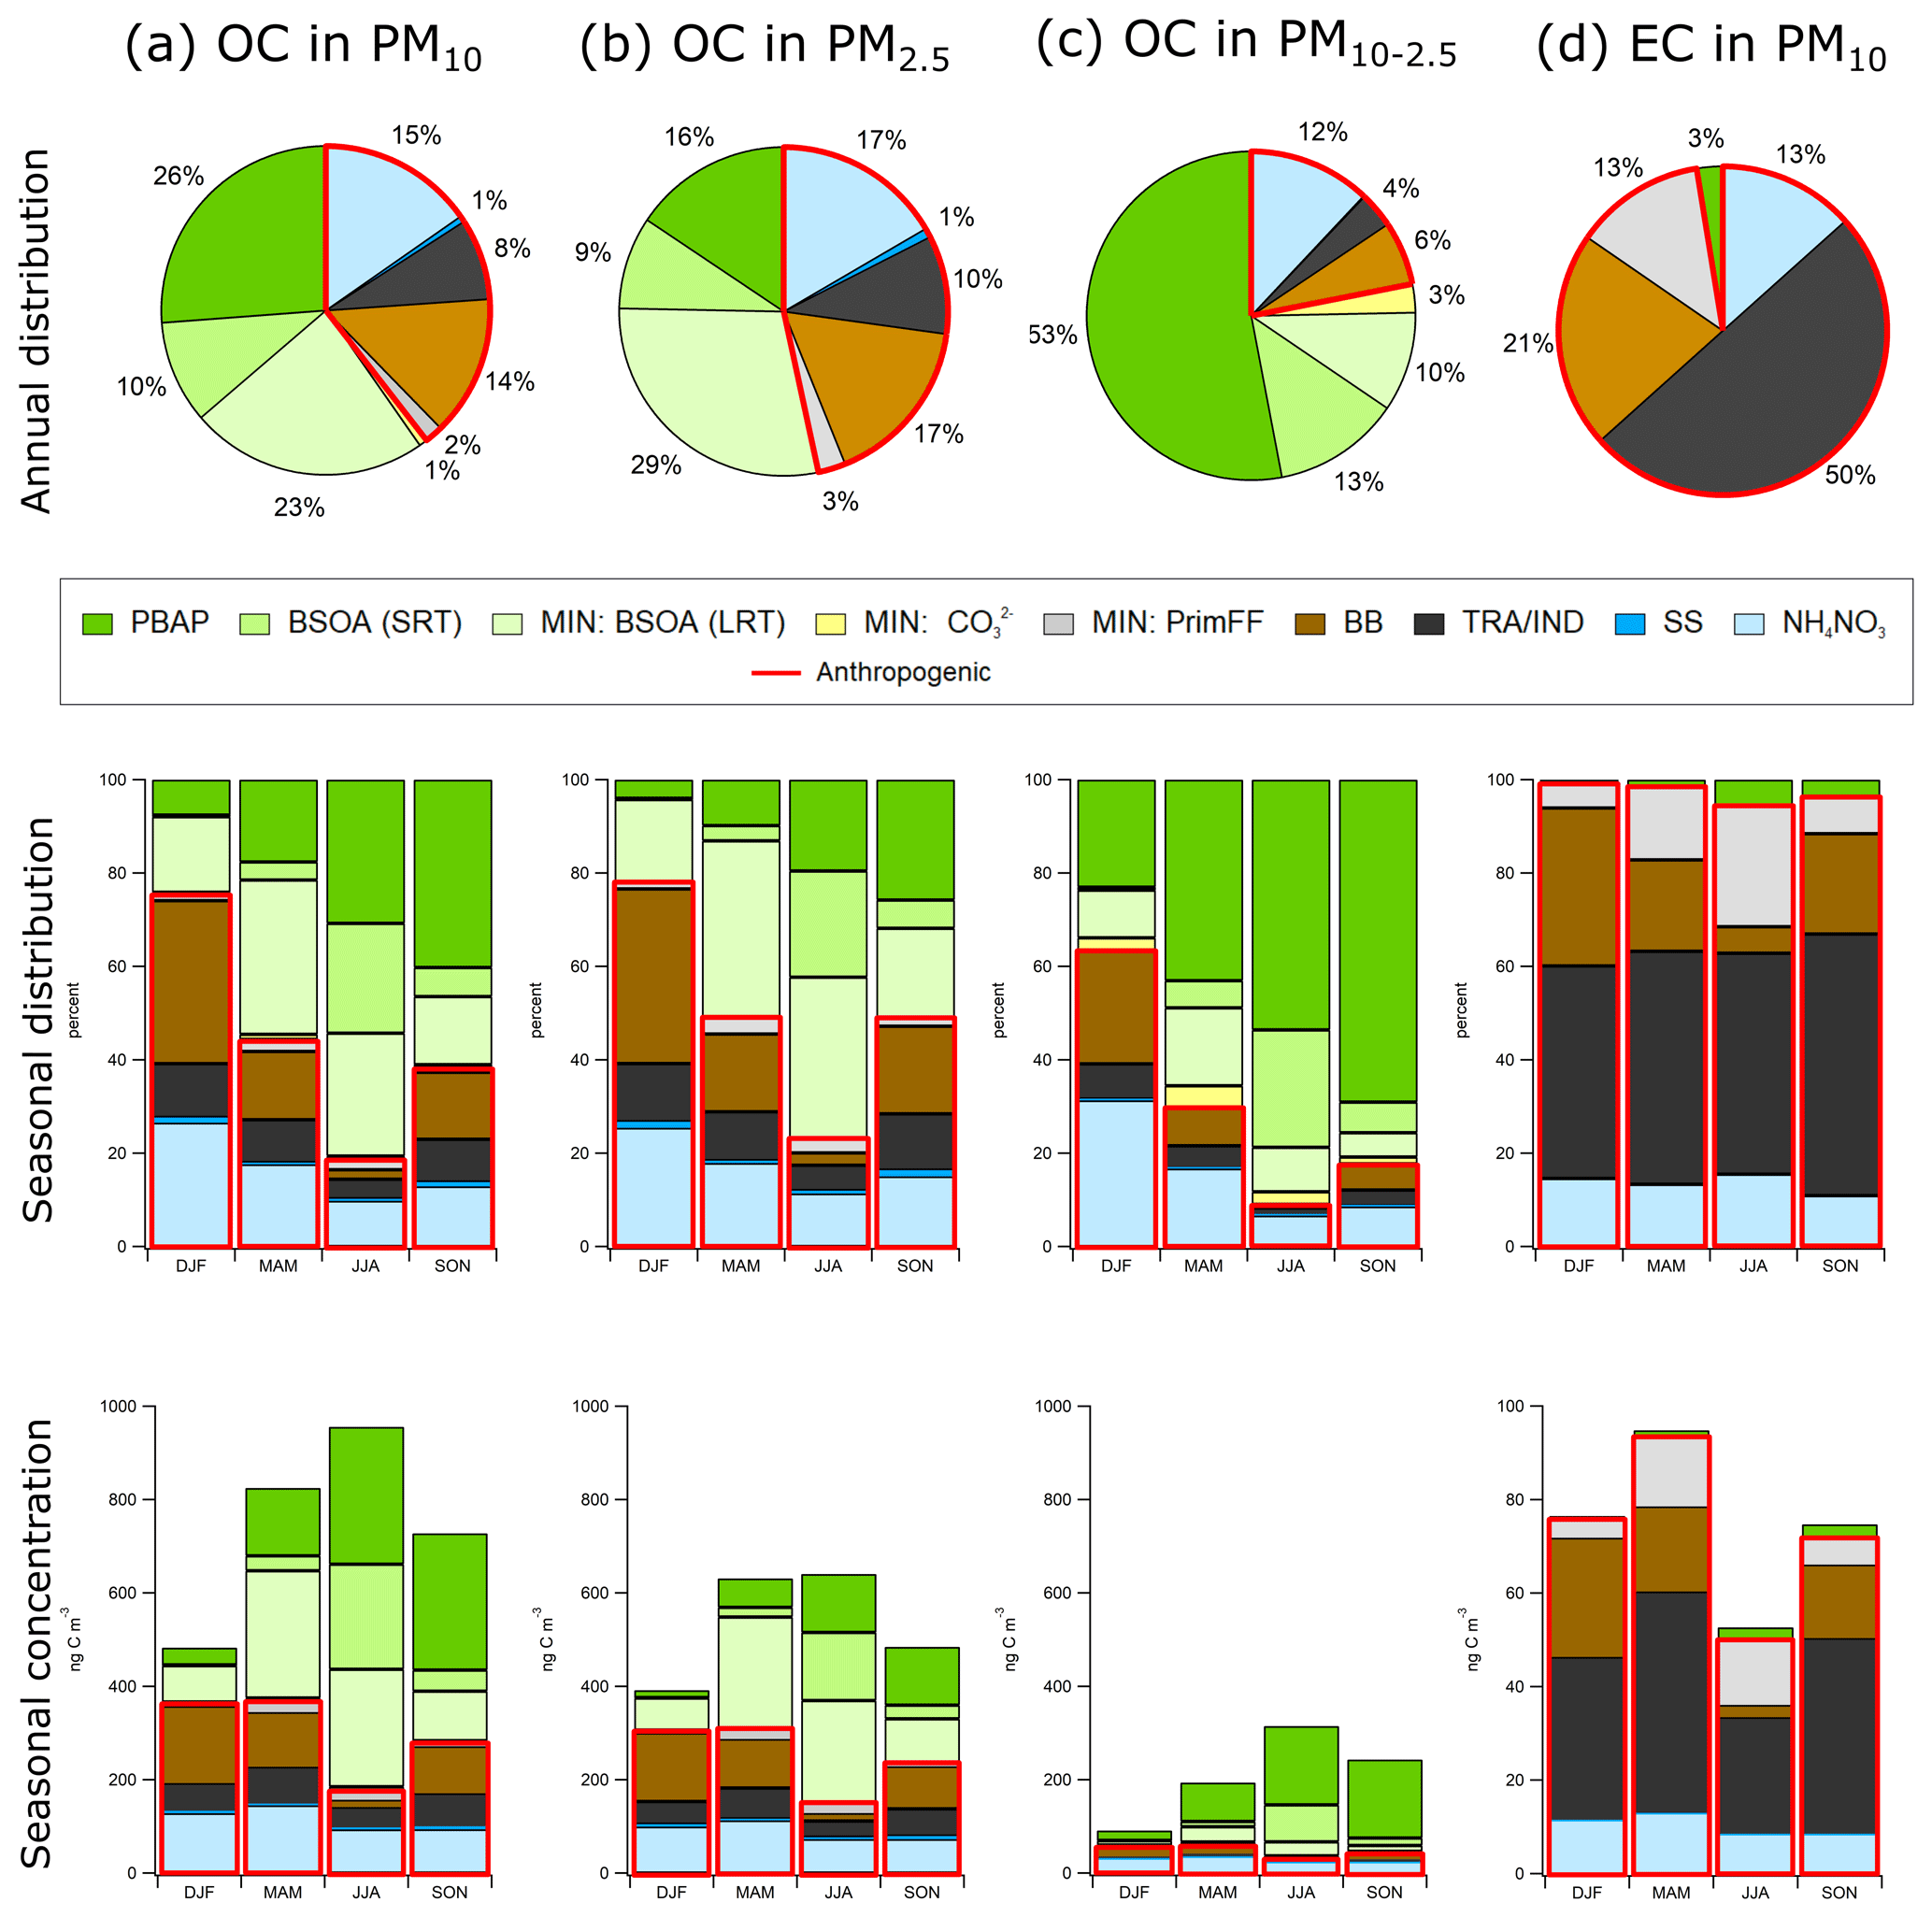
Figure 8Factor contributions to OC in PM10 (a), PM2.5 (b), PM10–2.5 (c), and EC in PM10 (d) at Birkenes (2016–2018) (upper panels), and the factor contributions divided into seasons (middle and lower panels), as determined by positive matrix factorization. The factors enclosed by the full red line represent anthropogenic sources. The OC content of the MIN factor is divided into long-range-transported BSOA (OCBSOA,LRT) and primary OC from fossil fuel combustion (OCPrimFF) following Eq. (1), and carbonate () carbon (see “Identification of PMF factors” in Sect. 2).
The BB, NH4NO3, and TRA/IND factors are considered entirely anthropogenic, BSOASRT and PBAP are considered exclusively natural, and MIN is considered mixed (Fig. 8). Natural (54 %) and anthropogenic (46 %) sources contributed almost equally to fine OC (Fig. 8) annually, as well as in spring and autumn (51 % natural), whereas natural sources prevailed in summer (77 %) and anthropogenic sources prevailed in winter (78 %). Natural sources dominated coarse OC annually (78 %) and in all seasons (70 %–91 %) except winter (37%). We consider the minor fraction of coarse OC attributed to CO-carbon (3 %) to be of natural origin. The findings for OC in PM10 are rather like those for PM2.5, only that the natural contribution is somewhat more pronounced due to the influence of a mostly naturally influenced coarse OC fraction.
3.2.1 Anthropogenic carbonaceous aerosol sources
According to PMF, BB accounted for 14 %–17 % of OC annually, considering both PM2.5 and PM10 vs. only 6 % of coarse OC. BB was by far the major contributor to OC in winter (35 %–37 %) and by far the most minor contributor in summer (2 %–3 %) (not considering SS). Spring and autumn are transition seasons where BB still made a substantial (14 %–19 %) contribution to OC. BB explained 22 % of EC annually (excluding ECPBAP, which we assume is an analytical artefact; see Sect. 3.2.2); hence, fossil fuel combustion (78 %) was the major source. Emissions from residential wood burning increased in the heating season, but fossil fuel sources dominated EC, even in winter (66 %). It cannot be excluded that part of levoglucosan originates from wildfires in summer, spring, and autumn, although this itself may be due to anthropogenic activity. However, the levoglucosan / mannosan (L M) ratio indicates minor variability in the source composition throughout the year (see Sect. S5), suggesting one dominant source.
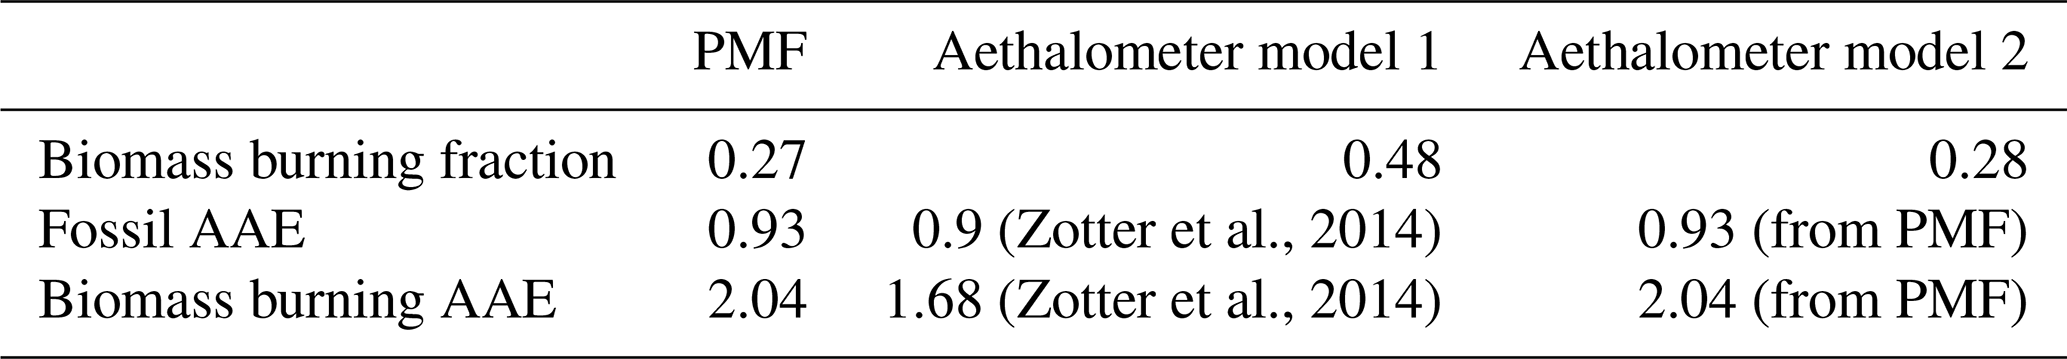
The 78 % : 22 % split of EC into fossil fuel combustion and biomass burning derived from PMF is supported by high-time-resolved concentrations of eBCBB and eBCFF derived from multi-wavelength Aethalometer measurements of the absorption coefficient, following the PMF approach of Platt et al. (2021). With this approach, we find = 28 % (Table 2). Meanwhile, using the Aethalometer model and AAEFF = 0.9 and AAEBB = 1.68 (Zotter et al., 2017) as input, we find = 48 %; however, the Aethalometer model is extremely sensitive to the input AAE, and the AAE values suggested by Zotter et al. (2017) are only recommended when no a priori information on the AAEs is available. A significant advantage of the PMF approach by Platt et al. (2021) is that the AAE is an output.
Table 2Biomass burning fraction derived from PMF and the Aethalometer models. Aethalometer model 1 shows the biomass burning fraction obtained by the default pair of absorption Ångstrøm exponents (AAE) suggested by Zotter et al. (2014), whereas Aethalometer model 2 shows the biomass burning fraction obtained using the pair of AAEs derived from PMF.
Source regions of elevated (70th percentile) and low (30th percentile) winter and summertime eBCBB (and eBCFF) observed at Birkenes for 2018 were studied using the approach of Hirdman et al. (2010). The results show that Birkenes is a receptor of LRT exclusively from continental Europe for elevated eBCBB and eBCFF levels (Fig. 7), both in summer and winter. This is consistent with a lack of diurnal variation in either eBCBB or eBCFF, likely because there are few local sources at Birkenes. The main source regions extend from the Atlantic coast in the west to the Ural Mountains in winter, whereas the source regions are confined to eastern Europe and western Russia (but not as far east as the Urals) in summer. Notably, the Nordic countries do not contribute to elevated levels except for the southern parts of Finland in summer. The footprints are almost identical for eBCBB and eBCFF for both summer and winter. High similarity in winter is not a surprise, as the footprint covers such a wide area and because wood burning for residential heating is common in several European countries. The summertime footprint is a subsection of the wintertime footprint that covers an area well-known for severe wildfires and agricultural fires (Stohl et al., 2007; Yttri et al., 2007a); thus, the summer footprint agrees with previous studies. Further, Sciare et al. (2008) point to the European countries bordering the Black Sea as having high carbonaceous aerosol of fossil origin. Low eBCBB and eBCFF levels at Birkenes are consistent with air masses that have an oceanic or terrestrial origin at high latitudes, mainly from the Arctic. Notably, the highest 30 % of values explain 74 % of eBCBB at Birkenes for the actual period; hence, LRT is decisive not only for episodes of high concentrations but also largely explains the mean concentration. All eBCBB and eBCFF observations included in the 70th percentile were made in winter despite the less pronounced seasonality of eBCFF compared with eBCBB.
To generate a longer BB time series of OCBB and ECBB we combine the levoglucosan time series (2008–2018) with the levoglucosan OC and levoglucosan EC ratios derived from the BB factor of the PMF analysis (Table 1; see Sect. S5 for details). The depletion of levoglucosan by OH oxidation is more likely in summer (Hoffmann et al., 2010; Yttri et al., 2014), although we still assume that levels mostly reflect biomass burning emissions in all seasons.
ECBB levels were elevated in the heating season (Fig. 9; Table S16). A strong temperature influence is illustrated by a 9 ∘C difference in the 25th percentile of wintertime temperatures in 2015 (−0.3 ∘C) and 2010 (−9.3 ∘C) (Fig. S1), which experienced the lowest (19 ng m−3) and the highest (84 ng m−3) wintertime mean concentration of ECBB respectively. Winter 2010 was exceptionally cold due to a negative North Atlantic Oscillation and was the only occasion when ECBB exceeded ECFF, with an annual mean ECBB > 60 % higher than the long-term mean. Pronounced interannual variability was seen for the wood burning contribution in winter (from 21 % to 60 % for EC), with the lowest fractions occasionally matched by those in spring and autumn, typically ranging between 20 % and 30 %. ECBB EC was small in summer (4 %–15 %), considerably less than in other seasons, except in 2008, where we calculate a substantial 30 %–40 % contribution. Levoglucosan cannot be used to differentiate emissions from residential wood burning, wildfires, and agricultural fires; the exceptions are major wildfire and agricultural fire episodes identifiable by unusually high concentrations and traced by source–receptor models/satellite data for plumes/burnt areas (Yttri et al., 2007a; Stohl et al., 2007). The influence from major wildfires in eastern Europe caused a summertime peak in fine OC and EC in 2002 at Birkenes (Yttri et al., 2007a). In June 2008, the largest wildfire in Norway since World War II raged 25 km northeast of the Birkenes Observatory, with an area of 30 km2 burnt. The observatory was downwind of the fire on only 1 d according to FLEXPART (Fig. S2). Despite this, the levoglucosan concentration for the weekly filter sample was 153 ng m−3, which was by far the highest in 1 decade of sampling. Notably, the annual mean concentration of levoglucosan for 2008 increased by nearly 35 %, and ECBB contributed significantly to EC for summer 2008.
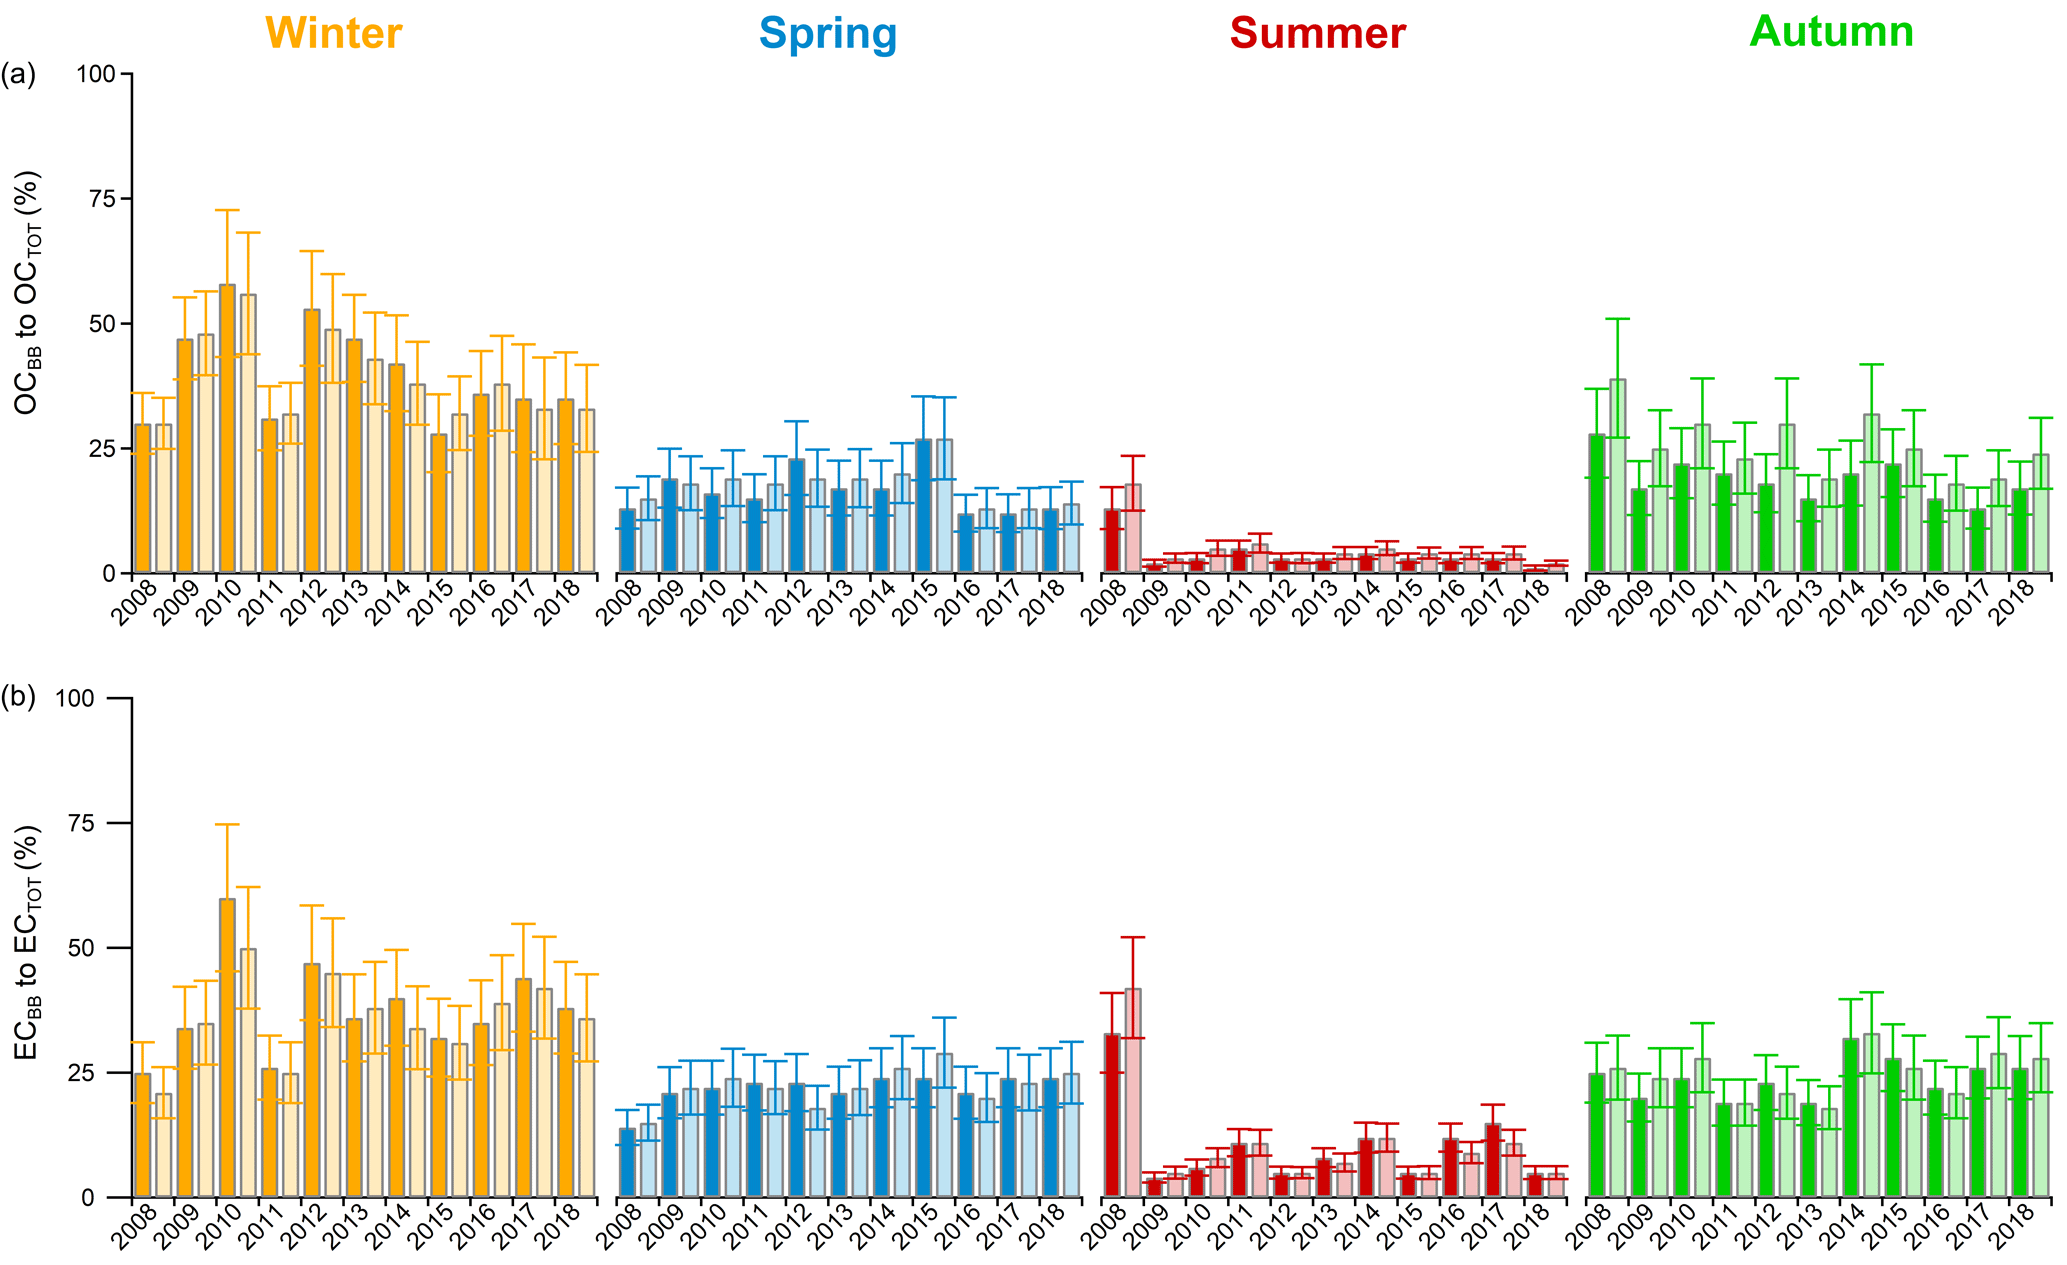
Figure 9Relative contribution of OCBB to OCTOT (a) and ECBB to ECTOT (b) in PM10 (dark colours) and in PM2.5 (light colours), as a function of season at Birkenes for the 2008–2018 period (DJF represents winter, MAM represents spring, JJA represents summer, and SON represents autumn).
The seasonality of OCBB (Fig. 9) was like ECBB. Mean wintertime OCBB OC was 39 %–40 % and >50 % in 2010 and 2012 respectively considering both PM10 and PM2.5. The summertime contribution was typically <5 %, reflecting both low levoglucosan levels and major influences from BSOA and PBAP, which peak in summer. Notably, five of the seven highest weekly OC concentrations for the PM10 time series were attributed to emissions from major wildfires in eastern Europe (i.e. August 2002 and May/September 2006) and, thus, prior to the initiation of the levoglucosan time series. The local wildfire episode in summer 2008 caused a substantial increase in OCBB OC (13 %–18 %), which is within the lower range of that observed for spring (12 %–27 %) and autumn (13 %–39 %).
3.2.2 Biogenic carbonaceous aerosol sources
The general lack of PBAP tracers in the MIN (<1 %) and SS (<2 %) factors and no sea salt and Ti in the PBAP factor implies that soil and sea spray aerosol do not contribute to PBAP at Birkenes, although this has been shown elsewhere (O'Dowd et al., 2004; Jia and Fraser, 2011). PBAP represented by glucose, arabitol, and mannitol appears to be associated with leaves rather than soil material and to be a source of local origin (Samaké et al., 2019). However, even large PBAP, such as birch pollen (mean diameter of 22 µm), has the potential for long-range atmospheric transport of 1000 km due to its low-density, hydrophobic nature; release during favourable dispersion conditions; and (often) emission height >10 m (e.g. Sofiev et al., 2006; Skjøth et al., 2007).
The PBAP factor concentration was nearly 1 order of magnitude higher in summer and autumn than in winter and was the major contributor to coarse OC for all seasons except winter, particularly in summer (54 %) and autumn (69 %) (Fig. 8). These are conservative estimates, as 3 %–9 % of the PBAP tracers reside in the BSOASRT factor, likely due to co-variability, as there is no scientific evidence linking biologically formed sugars and sugar-alcohols to the abiotic formation of BSOA. Notably, the PBAP factor explained 20 %–26 % of fine OC in summer and autumn, being the major contributor in autumn. Consequently, PBAP was the major contributor to OC, even in PM10 in summer (31 %) and autumn (40 %). The PBAP factor even explained 16 % of fine OC (Fig. 8) annually, corresponding to 0.084 µg C m−3, which is marginally lower than the factor's content of coarse OC (0.113 µg C m−3). Combined, this made PBAP the most abundant contributor to OC in PM10 along with the MIN factor (both 26 %). Some PBAP tracers partly reside in the fine mode (Carvalho et al., 2003; Yttri et al., 2007b), but the 43 % OCPBAP found in the fine fraction in the present study is higher than what has previously been reported for the actual PBAP tracers at Birkenes (6 %–7 % for arabitol and mannitol, 20 % for trehalose, and 33 % for glucose; Yttri et al., 2007b). It cannot be excluded that the PBAP factor contains some fine OC from other sources (e.g. due to condensation); however, although there is a seasonal co-variability with the BSOASRT factor, only 2 %–3 % of the 2-methyltetrols were explained by the PBAP factor, and there was a low correlation between the PBAP and the BSOASRT. This calls the above-mentioned hypothesis into question.
Arabitol and mannitol are well-known tracers of fungal spores (Bauer et al., 2008), one of the most abundant sources of PBAP (Elbert et al., 2007). Applying an OC to mannitol ratio of 5.2–10.8 for fungal spores (Bauer et al., 2008; Yttri et al., 2011a), we estimate that 11 %–22 % of OCPBAP (in PM10) comes from this source. Glucose is one of the primary molecular energy sources for plants and animals, a building block of natural dimers and polymers (e.g. sucrose and cellulose), and thus ubiquitous in nature; it is considered a PBAP tracer of general character and is clearly important for the allocation of carbon mass to PBAP. Nevertheless, a wider range of organic tracers ought to be tested in future PMF studies to explore the potential for further separation of the highly heterogenic PBAP source, including cellulose, as well as amino acids. A greater diversity of PBAP tracers may also provide a more correct PBAP estimate. The PMF approach used in the present study gives a somewhat higher, although overlapping, estimate of OCPBAP at Birkenes for August 2016–2018 than Latin hypercube sampling (LHS) for August 2009 (Yttri et al., 2011b) (Table 3). The LHS approach was based on a priori emission ratios, with uncertainty ranges estimated in a similar way to a Monte Carlo analysis (although less computationally extensive), and considered only the sum of fungal spores and plant debris as OCPBAP, based on mannitol (fungal spores) and cellulose (plant debris), whereas the PMF approach may pick other contributing (i.e. co-varying) sources.
Table 3Short-range-transported (SRT) and long-range-transported (LRT) OCBSOA and OCPBAP concentrations and their relative contribution to OC in PM10 at Birkenes in August, as obtained by Latin hypercube sampling (Yttri et al., 2011b) and by PMF (present study).
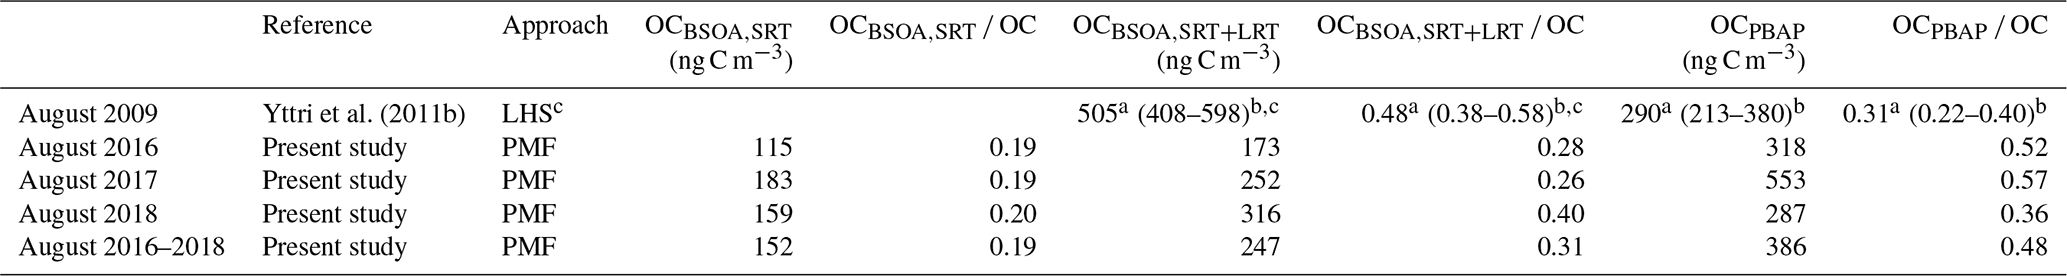
a The 50th percentile. b The 10th–90th percentile. c The LHS approach includes both OCBSOA,SRT and OCBSOA,LRT.
The 3 % EC in the PBAP factor is substantially less than the 16 % reported by Waked et al. (2014), who stated that atmospheric mixing, PMF limitations, and artefacts caused by thermal–optical analysis could be plausible explanations. In the present study, low levels of coarse-fraction EC occasionally appear in summer and autumn (Table S5), following the seasonality of PBAP. This finding does not exclude the three possibilities proposed by Waked et al. (2014), but it supports the suggestion of Dusek et al. (2017) that PBAP (or at least some types of PBAP) chars and evolves as modern carbon EC during thermal–optical analysis. If ECPBAP is indeed an analytical artefact, constraining the PBAP factor to contain no EC, as suggested by Weber et al. (2019), should be done with caution, as it will wrongfully apportion pyrolytic carbon generated from PBAP as EC to another source. Thus, ECPBAP should rather be interpreted as OCPBAP. With no ECSS, no ECBSOA,SRT, and ECPBAP, an assumed analytical artefact, EC can be apportioned into a fossil fuel category (ECFF), consisting of the MIN, TRA/IND, and NH4NO3 factors (explains 0.2 % of levoglucosan), and a non-fossil biomass burning category (ECBB), the BB factor. Some EC has been reported from meat cooking (Rogge et al., 1991), which is a non-fossil source, but its influence is minor at Birkenes, as it has not been observed based on concurrent aerosol chemical speciation monitor (ACSM) measurements and is not accounted for by levoglucosan.
Our PMF results support the use of OC as a proxy for OCPBAP, which has a pronounced seasonality (Fig. 4) with the highest seasonal mean concentration observed in summer for 15 of the studied years and in autumn for the 3 others (Table S5). The seasonal mean exceeded 0.5 µg C m−3 on only two occasions: autumn 2005 and autumn 2006. With a few exceptions, OC contributed more than 30 % to OC in summer and autumn. The highest relative contribution (45 %–50 %) to OC was exclusively observed in autumn (2004, 2005, 2006, 2008, 2014, and 2017), likely reflecting a combination of high OC concentrations and fine-fraction OCBSOA declining at this time of the year. OC made a substantially lower contribution to OC in winter (mean of 13 %) and in spring (mean of 19 %) compared with summer and autumn, although contributions exceeding 25 % were observed in spring for certain years. Notably, however, the PBAP factor explains 16 % of fine OC, which would not be accounted for using coarse OC as a proxy for OCPBAP.
These numbers suggest that PBAP has been a major, continuous contributor to OC in PM10 at Birkenes for a period of nearly 2 decades and that it largely explains the seasonality. Estimates of PBAP levels in the continental European rural background environment are largely lacking and should be undertaken to explore PBAPs potential importance. With a longer vegetative season and a different climate, the PBAP flux might be larger in more southerly countries, although the relative contribution might be lower due to higher overall OC levels. Waked et al. (2014) found that OCPBAP accounted for 17 % of OC in PM10 on an annual basis for an urban background site in Lens (northern France), and it accounted for between 5 % and 6 % in winter/spring and between 27 % and 37 % in summer/autumn using PMF for source apportionment. These fractions are comparable to those observed in the present study, albeit the concentrations calculated by Waked et al. (2014) were higher.
PBAP is a large OC source not included in many models. OC model closure, both for overall levels and seasonality, would thus likely be improved in many cases by its inclusion. This appears to be particularly important for regions with low anthropogenic influence. Birkenes is situated in the Boreo-nemoral zone, a transition zone of the Nemoral and the Boreal zone; hence, findings made for this site likely provide an indication of what can be expected for this scarcely populated, circumpolar region, which is by far the largest terrestrial biome of the Northern Hemisphere. Thus, measurements in unperturbed areas should include PBAP for a better understanding of background conditions. In turn, such measurements may improve analyses, such as climate models, i.e. the aerosol climate effect under relatively clean conditions.
Modelled estimates suggest a 10 %–40 % contribution of BSOA to fine OC annually at Birkenes (Simpson et al., 2007; Bergström et al., 2012). Hence, the 9 % contribution of OCBSOA,SRT to fine OC and the 13 % contribution to coarse OC (10 % to OC in PM10) found in the present study by PMF appear to be in the lower range. Further, 3 %–9 % of the PBAP tracers reside in the BSOASRT factor; hence, some of its OC content may rather be attributed to PBAP, further lowering the OC content of the BSOASRT factor but strengthening coarse OC as a proxy for PBAP. BSOASRT made a negligible contribution to fine, coarse, and PM10 OC in all seasons, except in summer (22 %–25 %), apparently contradicting previous studies that unambiguously point to BSOA as the major carbonaceous aerosol source at Birkenes in the vegetative season (Simpson et al., 2007; Yttri et al., 2011b). Note that a prevailing BSOA source in summer is also considered a normal situation for European rural background environment in general (e.g. Gelencsér et al., 2007), not only for Birkenes. Table 3 shows that OCBSOA,SRT obtained by PMF for August 2016–2018 is substantially lower than that obtained by LHS for August 2009 (Yttri et al., 2011b). Although not obtained for the same year, we argue that methodology rather than climatology explains most of the difference. OCBSOA,LHS provides an upper estimate including all modern carbon, local and from LRT (excluding biomass burning and PBAP fungal spores and plant debris), whereas OCBSOA,SRT gives a lower estimate accounting for locally formed BSOA.
It is less likely that anthropogenic secondary organic aerosol (ASOA) resides in the BSOASRT factor, as ASOA precursors result from combustion processes and evaporative losses. Further, Yttri et al. (2011a) found higher ASOA concentrations in the Norwegian rural background environment in winter compared with summer, which is the opposite of BSOASRT; hence, co-variation and/or apportionment to the same factor do not appear likely. ASOA is less abundant than BSOA at Birkenes, as calculated by Simpson et al. (2007) and Bergström et al. (2012), but the estimates vary substantially and are very uncertain (Spracklen et al., 2011), particularly for ASOA (from 1 % to 10 %–20 %). It is difficult to predict which PMF factor(s) accounted for ASOA; however, for the sake of separating OC into a natural and an anthropogenic fraction, we assume that ASOA is not part of the BSOASRT nor the PBAP factor, which we consider to be exclusively natural factors. To provide an upper estimate of the natural sources (Fig. 8), we do no consider ASOA to be part of the MIN factor.
With 90 % (in PM10) and 92 % (in PM2.5) of the MIN factor's OC content attributed to LRT BSOA (OCBSOA,LRT) (see “Identification of PMF factors” in Sect. 2), the combined contribution of locally formed BSOA (OCBSOA,SRT) and OCBSOA,LRT to OC in PM10 and PM2.5 would be 34 %–38 % on an annual basis, 37 %–41 % in spring, and 50 %–57 % in summer. From this, we can deduct that one-third of BSOA is of local origin, whereas two-thirds are contributed by long-range transport. For August 2016–2018, the joint contribution of OCBSOA,SRT and OCBSOA,LRT to OC in PM10 is 31 %, which is more consistent with the LHS estimate (Table 3), although still noticeably lower. Notably, OCBSOA,SRT, OCBSOA,LRT, and OCPBAP combined contributed 79 % to OC in PM10 in August 2016–2018, which exactly matches the sum of OCBSOA,LHS and OCPBAP,LHS to OC in PM10 in August 2009. This suggests that LHS and PMF apportion an equally large amount of OC to natural sources but that the split between BSOA and PBAP likely differs. It is evident that the LHS approach provides an upper estimate of BSOA (Gelencsér et al., 2007; Yttri et al., 2011a), whereas the great diversity of PBAP is likely underestimated by just accounting for plant debris and fungal spores. The lower estimate of OCBSOA and the higher estimate of OCPBAP provided by PMF in the present study are in line with this and encourage further effort to apportion these major carbonaceous aerosol sources correctly. The inclusion of monoterpene and sesquiterpene oxidation products (Kleindienst et al., 2007) to PMF would possibly improve our understanding of the SOA apportionment, as would knowledge about their atmospheric lifetime.
The carbonaceous aerosol time series at the Birkenes Observatory which was initiated in 2001 is unique due to its unprecedented length in Europe and because measurements are performed for both PM10 and PM2.5. Such long time series are of the utmost importance for undertakings such as the evaluation of projections, air quality models, and climate models. The need for concurrent and diverse offline and online carbonaceous aerosol speciation measurements to develop an understanding of carbonaceous aerosol sources' seasonal, annual, and long-term variability has been utterly demonstrated.
Statistically significant and comparably large reductions (∼ −4 % yr−1) were calculated for EC and PM2.5 at the Birkenes Observatory for 2001–2018, with EC reductions largely attributed to road transportation. No significant declining trend was calculated for OC, likely because prevailing natural sources masked any reduction in anthropogenic sources. Further reduction of carbonaceous aerosol may be hampered by poorly abated sources such as domestic heating, although more work is needed to assess this. We emphasize the importance of establishing long-lasting, high-quality carbonaceous aerosol and organic tracer time series at several sites across Europe for this purpose. The OC fraction of PM10 (+2.4 % yr−1) and PM2.5 (+3.2 % yr−1) increased significantly from 2001 to 2018, whereas the EC fraction decreased (from −4.0 % yr−1 to −4.7 % yr−1), causing a successive change in the aerosol chemical composition and in the relative source composition.
Source apportionment using PMF identified seven factors, six of which were dominated by carbonaceous aerosol: mineral-dust-dominated aerosol (MIN), traffic/industry-like aerosol (TRA/IND), biogenic secondary organic aerosol (BSOA), primary biological aerosol particles (PBAP), biomass burning aerosol (BB), and ammonium-nitrate-dominated aerosol (NH4NO3). Carbonaceous material was negligible in the sea salt (SS) factor. The combustion of fossil fuel (78 %) was the major source of EC, and TRA/IND (50 %) was the key factor. Emissions from residential wood burning increased in the heating season, but fossil fuel sources dominated EC, even in winter (66 %). Continental Europe and the western parts of Russia were the main source regions of elevated levels of eBC, for both biomass burning and the combustion of fossil fuels. Natural sources dominated both the fine (53 %) and coarse (78 %) fraction of OC and, thus, also OC in PM10 (60 %). The natural fraction increased substantially in the vegetative season due to biogenic secondary organic aerosol and primary biological aerosol particles, which were confined to the BSOA, PBAP, and MIN factors. A total of 77 %–91 % of OC was attributed to natural sources in summer, and 22 %–37 % of OC was attributed to natural sources in winter. The coarse fraction showed the highest share of natural sources regardless of season and was dominated by PBAP, except in winter. Notably, PBAP (26 %) made a larger contribution to OC in PM10 than BB (14 %), and it made a contribution that was equally as large as BB (17 %) in PM2.5.
All data used in the present paper are open access and are available at http://ebas.nilu.no/ (NILU, 2020).
The supplement related to this article is available online at: https://doi.org/10.5194/acp-21-7149-2021-supplement.
WA, SMP, XW, and KEY were responsible for conceptualizing the study, developing the methodology, writing the original draft of the paper, and producing the figures. MF, HG, AGH, HU, MV, and KEY carried out data curation. SMP, SS, XW, and KEY undertook the formal analysis. WA and KT acquired funding. JS acquired resources. FC, SE, NE, SMP, and ASHP were responsible for software development. WA, FC, SE, NE, MF, HG, AGH, CLM, SMP, ASHP, DS, SS, JS, KT, HU, MV, XW, and KEY contributed to writing, reviewing, and editing the final article.
Francesco Canonaco is employed by Datalystica Ltd., the official distributor of the SoFi Pro package. Otherwise, the authors declare that they have no conflict of interest.
Time series used in the present study, except for the organic tracers, were obtained as part of the Norwegian national monitoring programme (Aas et al., 2020). The monosaccharide anhydrides, the sugar-alcohols, and the 2-methyltetrols (organic tracers) time series were funded by the Norwegian Research Council through the “Observation and Modelling Capacities for Northern and Polar Climate and Pollution” and “Studying sources, formation and transport of short-lived climate forcers by advanced high-time resolution measurements” strategic institute projects. All data are reported to the EMEP monitoring programme (Tørseth et al., 2012) and are available from the EBAS database infrastructure (http://ebas.nilu.no/) hosted at NILU.
The research leading to these results has benefited from the Aerosols, Clouds, and Trace gases Research InfraStructure (ACTRIS) network, funding from the European Union Seventh Framework Programme (FP7/2007–2013) under ACTRIS-2 and grant agreement no. 262254, and the COST Action CA16109 “Chemical On-Line cOmpoSition and Source Apportionment of fine aerosol-COLOSSAL” (i.e. participation in inter-laboratory comparison for thermal–optical analysis and QA/QC of measurements).
and mass concentration were measured as part of the Norwegian national monitoring programme (Aas et al., 2020), whereas monosaccharide anhydrides were analysed as part of the SACC (Strategic Aerosol Observation and Modelling Capacities for Northern and Polar Climate and Pollution) and SLCF (Describing sources, formation, and transport of short lived climate forcers using advanced, novel measurement techniques) projects.
This research has been supported by the Miljødirektoratet (grant no. 17078061).
This paper was edited by Ivan Kourtchev and reviewed by two anonymous referees.
Aas, W., Eckhardt, S., Fiebig, M., Solberg, S., and Yttri, K. E.: Monitoring of long-range transported air pollutants in Norway, annual report 2019, Miljødirektoratet rapport, NILU, Kjeller, Norway, M-1710/2020 NILU OR 4/2020, 2020.
Alastuey, A., Querol, X., Aas, W., Lucarelli, F., Pérez, N., Moreno, T., Cavalli, F., Areskoug, H., Balan, V., Catrambone, M., Ceburnis, D., Cerro, J. C., Conil, S., Gevorgyan, L., Hueglin, C., Imre, K., Jaffrezo, J.-L., Leeson, S. R., Mihalopoulos, N., Mitosinkova, M., O'Dowd, C. D., Pey, J., Putaud, J.-P., Riffault, V., Ripoll, A., Sciare, J., Sellegri, K., Spindler, G., and Yttri, K. E.: Geochemistry of PM10 over Europe during the EMEP intensive measurement periods in summer 2012 and winter 2013, Atmos. Chem. Phys., 16, 6107–6129, https://doi.org/10.5194/acp-16-6107-2016, 2016.
Amundsen, C. E., Hanssen, J. E., Semb, A., and Steinnes, E.: Long-range atmospheric transport of trace elements to Southern Norway, Atmos. Environ. A-Gen., 26, 1309–1324, https://doi.org/10.1016/0960-1686(92)90391-w, 1992.
Bauer, H., Kasper-Giebl, A., Loflund, M., Giebl, H., Hitzenberger, R., Zibuschka, F., and Puxbaum, H.: The contribution of bacteria and fungal spores to the organic carbon content of cloud water, precipitation and aerosols, Atmos. Res., 64, 109–119, https://doi.org/10.1016/s0169-8095(02)00084-4, 2002.
Bauer, H., Claeys, M., Vermeylen, R., Schueller, E., Weinke, G., Berger, A., and Puxbaum, H.: Arabitol and mannitol as tracers for the quantification of airborne fungal spores, Atmos. Environ., 42, 588–593, https://doi.org/10.1016/j.atmosenv.2007.10.013, 2008.
Bergström, R., Denier van der Gon, H. A. C., Prévôt, A. S. H., Yttri, K. E., and Simpson, D.: Modelling of organic aerosols over Europe (2002–2007) using a volatility basis set (VBS) framework: application of different assumptions regarding the formation of secondary organic aerosol, Atmos. Chem. Phys., 12, 8499–8527, https://doi.org/10.5194/acp-12-8499-2012, 2012.
Bond, T. C., Doherty, S. J., Fahey, D. W., Forster, P. M., Berntsen, T., DeAngelo, B. J., Flanner, M. G., Ghan, S., Karcher, B., Koch, D., Kinne, S., Kondo, Y., Quinn, P. K., Sarofim, M. C., Schultz, M. G., Schulz, M., Venkataraman, C., Zhang, H., Zhang, S., Bellouin, N., Guttikunda, S. K., Hopke, P. K., Jacobson, M. Z., Kaiser, J. W., Klimont, Z., Lohmann, U., Schwarz, J. P., Shindell, D., Storelvmo, T., Warren, S. G., and Zender, C. S.: Bounding the role of black carbon in the climate system: A scientific assessment, J. Geophys. Res.-Atmos., 118, 5380–5552, https://doi.org/10.1002/jgrd.50171, 2013.
Boucher, O., Randall, D., Artaxo, P., Bretherton, C., Feingold, G., Forster, P., Kerminen, V.-M., Kondo, Y., Liao, H., Lohmann, U., Rasch, P., Satheesh, S. K., Sherwood, S., Stevens, B., and Zhang, X. Y.: Clouds and Aerosols, in: Climate Change 2013: The Physical Science Basis, Contribution of Working Group I to the Fifth Assessment Report of the Intergovernmental Panel on Climate Change, edited by: Stocker, T. F., Qin, D., Plattner, G. K., Tignor, M., Allen, S. K., Boschung, J., Nauels, A., Xia, Y., Bex, V., and Midgley, P. M., Cambridge University Press, Cambridge, United Kingdom and New York, USA, 2013.
Bougiatioti, A., Stavroulas, I., Kostenidou, E., Zarmpas, P., Theodosi, C., Kouvarakis, G., Canonaco, F., Prévôt, A. S. H., Nenes, A., Pandis, S. N., and Mihalopoulos, N.: Processing of biomass-burning aerosol in the eastern Mediterranean during summertime, Atmos. Chem. Phys., 14, 4793–4807, https://doi.org/10.5194/acp-14-4793-2014, 2014.
Canonaco, F., Crippa, M., Slowik, J. G., Baltensperger, U., and Prévôt, A. S. H.: SoFi, an IGOR-based interface for the efficient use of the generalized multilinear engine (ME-2) for the source apportionment: ME-2 application to aerosol mass spectrometer data, Atmos. Meas. Tech., 6, 3649–3661, https://doi.org/10.5194/amt-6-3649-2013, 2013.
Carvalho, A., Pio, C., and Santos, C.: Water-soluble hydroxylated organic compounds in German and Finnish aerosols, Atmos. Environ., 37, 1775–1783, https://doi.org/10.1016/s1352-2310(03)00066-9, 2003.
Cassiani, M., Stohl, A., and Brioude, J.: Lagrangian Stochastic Modelling of Dispersion in the Convective Boundary Layer with Skewed Turbulence Conditions and a Vertical Density Gradient: Formulation and Implementation in the FLEXPART Model, Bound.-Lay. Meteorol., 154, 367–390, https://doi.org/10.1007/s10546-014-9976-5, 2015.
Cavalli, F., Viana, M., Yttri, K. E., Genberg, J., and Putaud, J.-P.: Toward a standardised thermal-optical protocol for measuring atmospheric organic and elemental carbon: the EUSAAR protocol, Atmos. Meas. Tech., 3, 79–89, https://doi.org/10.5194/amt-3-79-2010, 2010.
Cavalli, C., Putaud, J. P., and Yttri, K. E.: Availability and quality of the EC and OC measurements within EMEP, including results of the fourth interlaboratory comparison of analytical methods for carbonaceous particulate matter within EMEP (2011), NILU, Kjeller, EMEP/CCC-Report 1/2013, 2013.
Claeys, M., Graham, B., Vas, G., Wang, W., Vermeylen, R., Pashynska, V., Cafmeyer, J., Guyon, P., Andreae, M. O., Artaxo, P., and Maenhaut, W.: Formation of secondary organic aerosols through photooxidation of isoprene, Science, 303, 1173–1176, https://doi.org/10.1126/science.1092805, 2004.
Colette, A., Solberg, S., Aas, W., and Walker, S.-E.: Understanding Air Quality Trends in Europe, Focus on the relative contribution of changes in emission of activity sectors, natural fraction and meteorological variability, European Topic Centre on Air pollution, transport, noise and industrial pollution, Kjeller, Norway, EIONET Report – ETC/ATNI 2020/8, in press, 2021.
Crippa, M., Canonaco, F., Lanz, V. A., Äijälä, M., Allan, J. D., Carbone, S., Capes, G., Ceburnis, D., Dall'Osto, M., Day, D. A., DeCarlo, P. F., Ehn, M., Eriksson, A., Freney, E., Hildebrandt Ruiz, L., Hillamo, R., Jimenez, J. L., Junninen, H., Kiendler-Scharr, A., Kortelainen, A.-M., Kulmala, M., Laaksonen, A., Mensah, A. A., Mohr, C., Nemitz, E., O'Dowd, C., Ovadnevaite, J., Pandis, S. N., Petäjä, T., Poulain, L., Saarikoski, S., Sellegri, K., Swietlicki, E., Tiitta, P., Worsnop, D. R., Baltensperger, U., and Prévôt, A. S. H.: Organic aerosol components derived from 25 AMS data sets across Europe using a consistent ME-2 based source apportionment approach, Atmos. Chem. Phys., 14, 6159–6176, https://doi.org/10.5194/acp-14-6159-2014, 2014.
Denier van der Gon, H. A. C., Bergström, R., Fountoukis, C., Johansson, C., Pandis, S. N., Simpson, D., and Visschedijk, A. J. H.: Particulate emissions from residential wood combustion in Europe – revised estimates and an evaluation, Atmos. Chem. Phys., 15, 6503–6519, https://doi.org/10.5194/acp-15-6503-2015, 2015.
Donahue, N. M., Robinson, A. L., and Pandis, S. N.: Atmospheric organic particulate matter: From smoke to secondary organic aerosol, Atmos. Environ., 43, 94–106, https://doi.org/10.1016/j.atmosenv.2008.09.055, 2009.
Dusek, U., Hitzenberger, R., Kasper-Giebl, A., Kistler, M., Meijer, H. A. J., Szidat, S., Wacker, L., Holzinger, R., and Röckmann, T.: Sources and formation mechanisms of carbonaceous aerosol at a regional background site in the Netherlands: insights from a year-long radiocarbon study, Atmos. Chem. Phys., 17, 3233–3251, https://doi.org/10.5194/acp-17-3233-2017, 2017.
Dye, C. and Yttri, K.: Determination of monosaccharide anhydrides in atmospheric aerosols by use of high-performance liquid chromatography combined with high-resolution mass spectrometry, Anal. Chem., 77, 1853–1858, https://doi.org/10.1021/ac049461j, 2005.
Elbert, W., Taylor, P. E., Andreae, M. O., and Pöschl, U.: Contribution of fungi to primary biogenic aerosols in the atmosphere: wet and dry discharged spores, carbohydrates, and inorganic ions, Atmos. Chem. Phys., 7, 4569–4588, https://doi.org/10.5194/acp-7-4569-2007, 2007.
Fomba, K. W., van Pinxteren, D., Müller, K., Spindler, G., and Herrmann, H.: Assessment of trace metal levels in size-resolved particulate matter in the area of Leipzig, Atmos. Environ., 176, 60–70, https://doi.org/10.1016/j.atmosenv.2017.12.024, 2018.
Forster, C., Stohl, A., and Seibert, P.: Parameterization of convective transport in a Lagrangian particle dispersion model and its evaluation, J. Appl. Meteorol. Clim., 46, 403–422, https://doi.org/10.1175/jam2470.1, 2007.
Fröhlich-Nowoisky, J., Kampf, C. J., Weber, B., Huffman, J. A., Pohlker, C., Andreae, M. O., Lang-Yona, N., Burrows, S. M., Gunthe, S. S., Elbert, W., Su, H., Hoor, P., Thines, E., Hoffmann, T., Despres, V. R., and Poschl, U.: Bioaerosols in the Earth system: Climate, health, and ecosystem interactions, Atmos. Res., 182, 346–376, https://doi.org/10.1016/j.atmosres.2016.07.018, 2016.
Fuller, G. W., Tremper, A. H., Baker, T. D., Yttri, K. E., and Butterfield, D.: Contribution of wood burning to PM10 in London, Atmos. Environ., 87, 87–94, https://doi.org/10.1016/j.atmosenv.2013.12.037, 2014.
Gelencsér, A., May, B., Simpson, D., Sanchez-Ochoa, A., Kasper-Giebl, A., Puxbaum, H., Caseiro, A., Pio, C., and Legrand, M.: Source apportionment of PM2.5 organic aerosol over Europe: Primary/secondary, natural/anthropogenic, and fossil/biogenic origin, J. Geophys. Res.-Atmos., 112, D23S04, https://doi.org/10.1029/2006jd008094, 2007.
Genberg, J., Hyder, M., Stenström, K., Bergström, R., Simpson, D., Fors, E. O., Jönsson, J. Å., and Swietlicki, E.: Source apportionment of carbonaceous aerosol in southern Sweden, Atmos. Chem. Phys., 11, 11387–11400, https://doi.org/10.5194/acp-11-11387-2011, 2011.
Gilardoni, S., Vignati, E., Cavalli, F., Putaud, J. P., Larsen, B. R., Karl, M., Stenström, K., Genberg, J., Henne, S., and Dentener, F.: Better constraints on sources of carbonaceous aerosols using a combined 14C – macro tracer analysis in a European rural background site, Atmos. Chem. Phys., 11, 5685–5700, https://doi.org/10.5194/acp-11-5685-2011, 2011.
Gilbert, R. O.: Statistical Methods for Environmental Pollution Monitoring, Wiley, New York, United States, 336 pp., 1987.
Glasius, M., Hansen, A. M. K., Claeys, M., Henzing, J. S., Jedynska, A. D., Kasper-Giebl, A., Kistler, M., Kristensen, K., Martinsson, J., Maenhaut, W., Nojgaard, J. K., Spindler, G., Stenstrom, K. E., Swietlicki, E., Szidat, S., Simpson, D., and Yttri, K. E.: Composition and sources of carbonaceous aerosols in Northern Europe during winter, Atmos. Environ., 173, 127–141, https://doi.org/10.1016/j.atmosenv.2017.11.005, 2018.
Grythe, H., Kristiansen, N. I., Groot Zwaaftink, C. D., Eckhardt, S., Ström, J., Tunved, P., Krejci, R., and Stohl, A.: A new aerosol wet removal scheme for the Lagrangian particle model FLEXPART v10, Geosci. Model Dev., 10, 1447–1466, https://doi.org/10.5194/gmd-10-1447-2017, 2017.
Grythe, H., Lopez-Aparicio, S., Vogt, M., Vo Thanh, D., Hak, C., Halse, A. K., Hamer, P., and Sousa Santos, G.: The MetVed model: development and evaluation of emissions from residential wood combustion at high spatio-temporal resolution in Norway, Atmos. Chem. Phys., 19, 10217–10237, https://doi.org/10.5194/acp-19-10217-2019, 2019.
Hallquist, M., Wenger, J. C., Baltensperger, U., Rudich, Y., Simpson, D., Claeys, M., Dommen, J., Donahue, N. M., George, C., Goldstein, A. H., Hamilton, J. F., Herrmann, H., Hoffmann, T., Iinuma, Y., Jang, M., Jenkin, M. E., Jimenez, J. L., Kiendler-Scharr, A., Maenhaut, W., McFiggans, G., Mentel, Th. F., Monod, A., Prévôt, A. S. H., Seinfeld, J. H., Surratt, J. D., Szmigielski, R., and Wildt, J.: The formation, properties and impact of secondary organic aerosol: current and emerging issues, Atmos. Chem. Phys., 9, 5155–5236, https://doi.org/10.5194/acp-9-5155-2009, 2009.
Herich, H., Gianini, M. F. D., Piot, C., Mocnik, G., Jaffrezo, J. L., Besombes, J. L., Prevot, A. S. H., and Hueglin, C.: Overview of the impact of wood burning emissions on carbonaceous aerosols and PM in large parts of the Alpine region, Atmos. Environ., 89, 64–75, https://doi.org/10.1016/j.atmosenv.2014.02.008, 2014.
Hirdman, D., Sodemann, H., Eckhardt, S., Burkhart, J. F., Jefferson, A., Mefford, T., Quinn, P. K., Sharma, S., Ström, J., and Stohl, A.: Source identification of short-lived air pollutants in the Arctic using statistical analysis of measurement data and particle dispersion model output, Atmos. Chem. Phys., 10, 669–693, https://doi.org/10.5194/acp-10-669-2010, 2010.
Hjellbrekke, A.-G.: Data Report 2018: Particulate matter, carbonaceous and inorganic compounds, NILU, Kjeller, Norway, EMEP/CCC-Report 1/2020, 2020.
Hodnebrog, Ø., Myhre, G., and Samset, B. H.: How shorter black carbon lifetime alters its climate effect, Nat. Commun., 5, 5065, https://doi.org/10.1038/ncomms6065, 2014.
Hoffmann, D., Tilgner, A., Iinuma, Y., and Herrmann, H.: Atmospheric Stability of Levoglucosan: A Detailed Laboratory and Modeling Study, Environ. Sci. Technol., 44, 694–699, https://doi.org/10.1021/es902476f, 2010.
Janssen, N. A. H., Gerlofs-Nijland, M. E., Lanki, T., Salonen, R. O., Cassee, F., Hoek, G., Fischer, P., Brunekreef, B., and Krzyzanowski, M.: Health effects of black carbon, WHO Regional Office for Europe, Copenhagen, Denmark, 96 pp., 2012.
Jia, Y. L. and Fraser, M.: Characterization of Saccharides in Size-fractionated Ambient Particulate Matter and Aerosol Sources: The Contribution of Primary Biological Aerosol Particles (PBAPs) and Soil to Ambient Particulate Matter, Environ. Sci. Technol., 45, 930–936, https://doi.org/10.1021/es103104e, 2011.
Kahnert, M., Lazaridis, M., Tsyro, S., and Torseth, K.: Requirements for developing a regional monitoring capacity for aerosols in Europe within EMEP, J. Environ. Monitor., 6, 646–655, https://doi.org/10.1039/b315136k, 2004.
Kendall, M. G.: Rank correlation methods, 4th edn., Charles Griffin, London, UK, 1975.
Kleindienst, T. E., Jaoui, M., Lewandowski, M., Offenberg, J. H., Lewis, C. W., Bhave, P. V., and Edney, E. O.: Estimates of the contributions of biogenic and anthropogenic hydrocarbons to secondary organic aerosol at a southeastern US location, Atmos. Environ., 41, 8288–8300, https://doi.org/10.1016/j.atmosenv.2007.06.045, 2007.
Kyllonen, K., Vestenius, M., Anttila, P., Makkonen, U., Aurela, M., Wangberg, I., Mastromonaco, M. N., and Hakola, H.: Trends and source apportionment of atmospheric heavy metals at a subarctic site during 1996–2018, Atmos. Environ., 236, 117644, https://doi.org/10.1016/j.atmosenv.2020.117644, 2020.
Lanz, V. A., Prévôt, A. S. H., Alfarra, M. R., Weimer, S., Mohr, C., DeCarlo, P. F., Gianini, M. F. D., Hueglin, C., Schneider, J., Favez, O., D'Anna, B., George, C., and Baltensperger, U.: Characterization of aerosol chemical composition with aerosol mass spectrometry in Central Europe: an overview, Atmos. Chem. Phys., 10, 10453–10471, https://doi.org/10.5194/acp-10-10453-2010, 2010.
Lund, M. T., Myhre, G., Haslerud, A. S., Skeie, R. B., Griesfeller, J., Platt, S. M., Kumar, R., Myhre, C. L., and Schulz, M.: Concentrations and radiative forcing of anthropogenic aerosols from 1750 to 2014 simulated with the Oslo CTM3 and CEDS emission inventory, Geosci. Model Dev., 11, 4909–4931, https://doi.org/10.5194/gmd-11-4909-2018, 2018.
Maenhaut, W.: Source apportionment revisited for long-term measurements of fine aerosol trace elements at two locations in southern Norway, Nucl. Instrum. Meth. B., 417, 133–138, https://doi.org/10.1016/j.nimb.2017.07.006, 2018.
Maenhaut, W., Vermeylen, R., Claeys, M., Vercauteren, J., Matheeussen, C., and Roekens, E.: Assessment of the contribution from wood burning to the PM10 aerosol in Flanders, Belgium, Sci. Total Environ., 437, 226–236, https://doi.org/10.1016/j.scitotenv.2012.08.015, 2012.
Malm, W. C., Sisler, J. F., Huffmann, D., Eldred, R. A., and Cahill, T. A.: Spatial and seasonal trends in particles concentrations and optical extinction in the United-States, J. Geophys. Res., 99, 1347–1370, 1994.
Mann, H. B.: Non-parametric tests against trend, Econometrica, 13, 163–171, 1945.
Matthews, B., Mareckova, K., Schindlbacher, S., Ullrich, B., and Wankmwüller, R.: Emissions for 2018, in: Transboundary particulate matter, photo-oxidants, acidifying and eutrophying components, EMEP Status Report 1/2020, The Norwegian Meteorological Institute, Oslo, Norway, 37–57, 2020.
Myhre, G. and Samset, B. H.: Standard climate models radiation codes underestimate black carbon radiative forcing, Atmos. Chem. Phys., 15, 2883–2888, https://doi.org/10.5194/acp-15-2883-2015, 2015.
Myhre, G., Shindell, D., Bréon, F.-M., Collins, W., Fuglestvedt, J., Huang, J., Koch, D., Lamarque, J.-F., Lee, D., Mendoza, B., Nakajima, T., Robock, A., Stephens, G., Takemura, T., and Zhang, H.: Anthropogenic and Natural Radiative Forcing, in: Climate Change 2013: The Physical Science Basis, Contribution of Working Group I to the Fifth Assessment Report of the Intergovernmental Panel on Climate Change, edited by: Stocker, T. F., Qin, D., Plattner, G.-K., Tignor, M., Allen, S. K., Boschung, J., Nauels, A., Xia, Y., Bex, V., and Midgley, P. M., Cambridge University Press, Cambridge, United Kingdom and New York, USA, 2013.
NILU (Norwegian Institute for Air Research): EBAS, available at: http://ebas.nilu.no/, last access: 1 December 2020.
Norris, G., Duvall, R., Brown, S., and Bai, S.: EPA Positive Matrix Factorization (PMF) 5.0 Fundamentals and User Guide, U.S. Environmental Protection Agency, Washington, D.C., USA, 20460 (i-124, EPA/600/R-14/108, April), 2014.
O'Dowd, C. D., Facchini, M. C., Cavalli, F., Ceburnis, D., Mircea, M., Decesari, S., Fuzzi, S., Yoon, Y. J., and Putaud, J. P.: Biogenically driven organic contribution to marine aerosol, Nature, 431, 676–680, https://doi.org/10.1038/nature02959, 2004.
Pacyna, J. M., Nriagu, J. O., and Davidson, C. I. (Eds.): Toxic Metals in the Atmosphere, Wiley, New York, USA, 1986.
Pio, C. A., Legrand, M., Oliveira, T., Afonso, J., Santos, C., Caseiro, A., Fialho, P., Barata, F., Puxbaum, H., Sanchez-Ochoa, A., Kasper-Giebl, A., Gelencser, A., Preunkert, S., and Schock, M.: Climatology of aerosol composition (organic versus inorganic) at nonurban sites on a west-east transect across Europe, J. Geophys. Res.-Atmos., 112, D23S02, https://doi.org/10.1029/2006jd008038, 2007.
Pisso, I., Sollum, E., Grythe, H., Kristiansen, N. I., Cassiani, M., Eckhardt, S., Arnold, D., Morton, D., Thompson, R. L., Groot Zwaaftink, C. D., Evangeliou, N., Sodemann, H., Haimberger, L., Henne, S., Brunner, D., Burkhart, J. F., Fouilloux, A., Brioude, J., Philipp, A., Seibert, P., and Stohl, A.: The Lagrangian particle dispersion model FLEXPART version 10.4, Geosci. Model Dev., 12, 4955–4997, https://doi.org/10.5194/gmd-12-4955-2019, 2019.
Platt, S. M., et al.: Source apportionment of equivalent black carbon from the winter 2017–2018 EMEP intensive measurement campaign using PMF, in preparation, 2021.
Polissar, A. V., Hopke, P. K., and Paatero, P.: Atmospheric aerosol over Alaska – 2. Elemental composition and sources, J. Geophys. Res.-Atmos., 103, 19045–19057, https://doi.org/10.1029/98jd01212, 1998.
Puxbaum, H., Caseiro, A., Sanchez-Ochoa, A., Kasper-Giebl, A., Claeys, M., Gelencser, A., Legrand, M., Preunkert, S., and Pio, C.: Levoglucosan levels at background sites in Europe for assessing the impact of biomass combustion on the European aerosol background, J. Geophys. Res.-Atmos., 112, D23S05, https://doi.org/10.1029/2006jd008114, 2007.
Reis, S., Grennfelt, P., Klimont, Z., Amann, M., ApSimon, H., Hettelingh, J. P., Holland, M., LeGall, A. C., Maas, R., Posch, M., Spranger, T., Sutton, M. A., and Williams, M.: From Acid Rain to Climate Change, Science, 338, 1153–1154, https://doi.org/10.1126/science.1226514, 2012.
Ripoll, A., Minguillón, M. C., Pey, J., Pérez, N., Querol, X., and Alastuey, A.: Joint analysis of continental and regional background environments in the western Mediterranean: PM1 and PM10 concentrations and composition, Atmos. Chem. Phys., 15, 1129–1145, https://doi.org/10.5194/acp-15-1129-2015, 2015.
Rogge, W. F., Hildemann, L. M., Mazurek, M. A., Cass, G. R., and Simonelt, B. R. T.: Sources of fine organic aerosol, 1. Charbroilers and meat cooking operations, Environ. Sci. Technol., 25, 1112–1125, https://doi.org/10.1021/es00018a015, 1991.
Rotzer, T. and Chmielewski, F. M.: Phenological maps of Europe, Clim. Res., 18, 249–257, https://doi.org/10.3354/cr018249, 2001.
Saarikoski, S., Timonen, H., Saarnio, K., Aurela, M., Järvi, L., Keronen, P., Kerminen, V.-M., and Hillamo, R.: Sources of organic carbon in fine particulate matter in northern European urban air, Atmos. Chem. Phys., 8, 6281–6295, https://doi.org/10.5194/acp-8-6281-2008, 2008.
Saffari, A., Daher, N., Samara, C., Voutsa, D., Kouras, A., Manoli, E., Karagkiozidou, O., Vlachokostas, C., Moussiopoulos, N., Shafer, M. M., Schauer, J. J., and Sioutas, C.: Increased Biomass Burning Due to the Economic Crisis in Greece and Its Adverse Impact on Wintertime Air Quality in Thessaloniki, Environ. Sci. Technol., 47, 13313–13320, https://doi.org/10.1021/es403847h, 2013.
Samaké, A., Jaffrezo, J.-L., Favez, O., Weber, S., Jacob, V., Canete, T., Albinet, A., Charron, A., Riffault, V., Perdrix, E., Waked, A., Golly, B., Salameh, D., Chevrier, F., Oliveira, D. M., Besombes, J.-L., Martins, J. M. F., Bonnaire, N., Conil, S., Guillaud, G., Mesbah, B., Rocq, B., Robic, P.-Y., Hulin, A., Le Meur, S., Descheemaecker, M., Chretien, E., Marchand, N., and Uzu, G.: Arabitol, mannitol, and glucose as tracers of primary biogenic organic aerosol: the influence of environmental factors on ambient air concentrations and spatial distribution over France, Atmos. Chem. Phys., 19, 11013–11030, https://doi.org/10.5194/acp-19-11013-2019, 2019.
Sandradewi, J., Prevot, A. S. H., Szidat, S., Perron, N., Alfarra, M. R., Lanz, V. A., Weingartner, E., and Baltensperger, U.: Using aerosol light absorption measurements for the quantitative determination of wood burning and traffic emission contributions to particulate matter, Environ. Sci. Technol., 42, 3316–3323, https://doi.org/10.1021/es702253m, 2008.
Sciare, J., Oikonomou, K., Favez, O., Liakakou, E., Markaki, Z., Cachier, H., and Mihalopoulos, N.: Long-term measurements of carbonaceous aerosols in the Eastern Mediterranean: evidence of long-range transport of biomass burning, Atmos. Chem. Phys., 8, 5551–5563, https://doi.org/10.5194/acp-8-5551-2008, 2008.
Sen, P. K.: Estimates of the regression coefficient based on Kendall's Tau, J. Am. Stat. Assoc., 63, 1379–1389, https://doi.org/10.2307/2285891, 1968.
Sillanpää, M., Frey, A., Hillamo, R., Pennanen, A. S., and Salonen, R. O.: Organic, elemental and inorganic carbon in particulate matter of six urban environments in Europe, Atmos. Chem. Phys., 5, 2869–2879, https://doi.org/10.5194/acp-5-2869-2005, 2005.
Simpson, D., Yttri, K. E., Klimont, Z., Kupiainen, K., Caseiro, A., Gelencser, A., Pio, C., Puxbaum, H., and Legrand, M.: Modeling carbonaceous aerosol over Europe: Analysis of the CARBOSOL and EMEP EC/OC campaigns, J. Geophys. Res.-Atmos., 112, D23S14, https://doi.org/10.1029/2006JD008158, 2007.
Simpson, D., Bergström, R., Denier van der Gon, H., Kuenen, J., Schindlbacher, S., and Visschedijk, A.: Condensable organics, issues and implications for EMEP calculations and source-receptor matrices, in: Transboundary particulate matter, photo-oxidants, acidifying and eutrophying components, EMEP Status Report 1/2019, The Norwegian Meteorological Institute, Oslo, Norway, 71–88, 2019.
Skjoth, C. A., Sommer, J., Stach, A., Smith, M., and Brandt, J.: The long-range transport of birch (Betula) pollen from Poland and Germany causes significant pre-season concentrations in Denmark, Clin. Exp. Allergy, 37, 1204–1212, https://doi.org/10.1111/j.1365-2222.2007.02771.x, 2007.
Sofiev, M., Siljamo, P., Ranta, H., and Rantio-Lehtimaki, A.: Towards numerical forecasting of long-range air transport of birch pollen: theoretical considerations and a feasibility study, Int. J. Biometeorol., 50, 392–402, https://doi.org/10.1007/s00484-006-0027-x, 2006.
Spracklen, D. V., Jimenez, J. L., Carslaw, K. S., Worsnop, D. R., Evans, M. J., Mann, G. W., Zhang, Q., Canagaratna, M. R., Allan, J., Coe, H., McFiggans, G., Rap, A., and Forster, P.: Aerosol mass spectrometer constraint on the global secondary organic aerosol budget, Atmos. Chem. Phys., 11, 12109–12136, https://doi.org/10.5194/acp-11-12109-2011, 2011.
Stohl, A., Forster, C., Frank, A., Seibert, P., and Wotawa, G.: Technical note: The Lagrangian particle dispersion model FLEXPART version 6.2, Atmos. Chem. Phys., 5, 2461–2474, https://doi.org/10.5194/acp-5-2461-2005, 2005.
Stohl, A., Andrews, E., Burkhart, J. F., Forster, C., Herber, A., Hoch, S. W., Kowal, D., Lunder, C., Mefford, T., Ogren, J. A., Sharma, S., Spichtinger, N., Stebel, K., Stone, R., Strom, J., Torseth, K., Wehrli, C., and Yttri, K. E.: Pan-Arctic enhancements of light absorbing aerosol concentrations due to North American boreal forest fires during summer 2004, J. Geophys. Res.-Atmos., 111, D22214, https://doi.org/10.1029/2006JD007216, 2006.
Stohl, A., Berg, T., Burkhart, J. F., Fjǽraa, A. M., Forster, C., Herber, A., Hov, Ø., Lunder, C., McMillan, W. W., Oltmans, S., Shiobara, M., Simpson, D., Solberg, S., Stebel, K., Ström, J., Tørseth, K., Treffeisen, R., Virkkunen, K., and Yttri, K. E.: Arctic smoke – record high air pollution levels in the European Arctic due to agricultural fires in Eastern Europe in spring 2006, Atmos. Chem. Phys., 7, 511–534, https://doi.org/10.5194/acp-7-511-2007, 2007.
Stumm, W. and Morgan, J. J. (eds.): Aquatic Chemistry: Chemical Equilibria and Rates in Natural Waters, 3rd edn., Wiley-Interscience Series of Texts and Monographs, Wiley, New York, USA, 1996.
Szidat, S., Prevot, A. S. H., Sandradewi, J., Alfarra, M. R., Synal, H. A., Wacker, L., and Baltensperger, U.: Dominant impact of residential wood burning on particulate matter in Alpine valleys during winter, Geophys. Res. Lett., 34, L05820, https://doi.org/10.1029/2006gl028325, 2007.
Szidat, S., Ruff, M., Perron, N., Wacker, L., Synal, H.-A., Hallquist, M., Shannigrahi, A. S., Yttri, K. E., Dye, C., and Simpson, D.: Fossil and non-fossil sources of organic carbon (OC) and elemental carbon (EC) in Göteborg, Sweden, Atmos. Chem. Phys., 9, 1521–1535, https://doi.org/10.5194/acp-9-1521-2009, 2009.
Theil, H.: A rank-invariant method of linear and polynomial regression analysis, Proceedings of the Royal Netherlands Academy of Sciences, 53, 386–392, https://doi.org/10.1007/978-94-011-2546-8_20, 1950.
Tørseth, K. and Hov, Ø. (eds.): The EMEP monitoring strategy 2004–2009, Background document with justification and specification of the EMEP monitoring programme 2004–2009, NILU, Kjeller, Norway, EMEP/CCC, 09/2003, 2003.
Tørseth, K., Aas, W., Breivik, K., Fjæraa, A. M., Fiebig, M., Hjellbrekke, A. G., Lund Myhre, C., Solberg, S., and Yttri, K. E.: Introduction to the European Monitoring and Evaluation Programme (EMEP) and observed atmospheric composition change during 1972–2009, Atmos. Chem. Phys., 12, 5447–5481, https://doi.org/10.5194/acp-12-5447-2012, 2012.
UNECE: 1999 Protocol to Abate Acidification, Eutrophication and Ground-level Ozone to the Convention on Long-range Transboundary Air Pollution, as amended on 4 May 2012, UNECE, Geneva, Switzerland, 2013.
UNECE: Monitoring strategy for the Cooperative Programme for Monitoring and Evaluation of the Long-range Transmission of Air Pollutants in Europe for the period 2020–2029, UNECE, Geneva, Switzerland, Decision 2019/1, ECE/EB.AIR/144/Add.1, 2019.
Viana, M., Kuhlbusch, T. A. J., Querol, X., Alastuey, A., Harrison, R. M., Hopke, P. K., Winiwarter, W., Vallius, A., Szidat, S., Prevot, A. S. H., Hueglin, C., Bloemen, H., Wahlin, P., Vecchi, R., Miranda, A. I., Kasper-Giebl, A., Maenhaut, W., and Hitzenberger, R.: Source apportionment of particulate matter in Europe: A review of methods and results, J. Aerosol Sci., 39, 827–849, https://doi.org/10.1016/j.jaerosci.2008.05.007, 2008.
Waked, A., Favez, O., Alleman, L. Y., Piot, C., Petit, J.-E., Delaunay, T., Verlinden, E., Golly, B., Besombes, J.-L., Jaffrezo, J.-L., and Leoz-Garziandia, E.: Source apportionment of PM10 in a north-western Europe regional urban background site (Lens, France) using positive matrix factorization and including primary biogenic emissions, Atmos. Chem. Phys., 14, 3325–3346, https://doi.org/10.5194/acp-14-3325-2014, 2014.
Weber, S., Salameh, D., Albinet, A., Alleman, L. Y., Waked, A., Besombes, J. L., Jacob, V., Guillaud, G., Meshbah, B., Rocq, B., Hulin, A., Dominik-Segue, M., Chretien, E., Jaffrezo, J. L., and Favez, O.: Comparison of PM10 Sources Profiles at 15 French Sites Using a Harmonized Constrained Positive Matrix Factorization Approach, Atmosphere, 10, 310, https://doi.org/10.3390/atmos10060310, 2019.
WHO: Review of evidence on health aspects of air pollution – REVIHAAP Project, Technical Report, WHO Regional Office for Europe, Copenhagen, Denmark, 2013.
Yttri, K. E., Aas, W., Bjerke, A., Cape, J. N., Cavalli, F., Ceburnis, D., Dye, C., Emblico, L., Facchini, M. C., Forster, C., Hanssen, J. E., Hansson, H. C., Jennings, S. G., Maenhaut, W., Putaud, J. P., and Tørseth, K.: Elemental and organic carbon in PM10: a one year measurement campaign within the European Monitoring and Evaluation Programme EMEP, Atmos. Chem. Phys., 7, 5711–5725, https://doi.org/10.5194/acp-7-5711-2007, 2007a.
Yttri, K. E., Dye, C., and Kiss, G.: Ambient aerosol concentrations of sugars and sugar-alcohols at four different sites in Norway, Atmos. Chem. Phys., 7, 4267–4279, https://doi.org/10.5194/acp-7-4267-2007, 2007b.
Yttri, K. E., Simpson, D., Stenström, K., Puxbaum, H., and Svendby, T.: Source apportionment of the carbonaceous aerosol in Norway – quantitative estimates based on 14C, thermal-optical and organic tracer analysis, Atmos. Chem. Phys., 11, 9375–9394, https://doi.org/10.5194/acp-11-9375-2011, 2011a.
Yttri, K. E., Simpson, D., Nøjgaard, J. K., Kristensen, K., Genberg, J., Stenström, K., Swietlicki, E., Hillamo, R., Aurela, M., Bauer, H., Offenberg, J. H., Jaoui, M., Dye, C., Eckhardt, S., Burkhart, J. F., Stohl, A., and Glasius, M.: Source apportionment of the summer time carbonaceous aerosol at Nordic rural background sites, Atmos. Chem. Phys., 11, 13339–13357, https://doi.org/10.5194/acp-11-13339-2011, 2011b.
Yttri, K. E., Lund Myhre, C., Eckhardt, S., Fiebig, M., Dye, C., Hirdman, D., Ström, J., Klimont, Z., and Stohl, A.: Quantifying black carbon from biomass burning by means of levoglucosan – a one-year time series at the Arctic observatory Zeppelin, Atmos. Chem. Phys., 14, 6427–6442, https://doi.org/10.5194/acp-14-6427-2014, 2014.
Yttri, K. E., Simpson, D., Bergström, R., Kiss, G., Szidat, S., Ceburnis, D., Eckhardt, S., Hueglin, C., Nøjgaard, J. K., Perrino, C., Pisso, I., Prevot, A. S. H., Putaud, J.-P., Spindler, G., Vana, M., Zhang, Y.-L., and Aas, W.: The EMEP Intensive Measurement Period campaign, 2008–2009: characterizing carbonaceous aerosol at nine rural sites in Europe, Atmos. Chem. Phys., 19, 4211–4233, https://doi.org/10.5194/acp-19-4211-2019, 2019.
Zotter, P., Ciobanu, V. G., Zhang, Y. L., El-Haddad, I., Macchia, M., Daellenbach, K. R., Salazar, G. A., Huang, R.-J., Wacker, L., Hueglin, C., Piazzalunga, A., Fermo, P., Schwikowski, M., Baltensperger, U., Szidat, S., and Prévôt, A. S. H.: Radiocarbon analysis of elemental and organic carbon in Switzerland during winter-smog episodes from 2008 to 2012 – Part 1: Source apportionment and spatial variability, Atmos. Chem. Phys., 14, 13551–13570, https://doi.org/10.5194/acp-14-13551-2014, 2014.
Zotter, P., Herich, H., Gysel, M., El-Haddad, I., Zhang, Y., Močnik, G., Hüglin, C., Baltensperger, U., Szidat, S., and Prévôt, A. S. H.: Evaluation of the absorption Ångström exponents for traffic and wood burning in the Aethalometer-based source apportionment using radiocarbon measurements of ambient aerosol, Atmos. Chem. Phys., 17, 4229–4249, https://doi.org/10.5194/acp-17-4229-2017, 2017.