the Creative Commons Attribution 4.0 License.
the Creative Commons Attribution 4.0 License.
Lidar depolarization ratio of atmospheric pollen at multiple wavelengths
Stephanie Bohlmann
Xiaoxia Shang
Ville Vakkari
Elina Giannakaki
Ari Leskinen
Kari E. J. Lehtinen
Sanna Pätsi
Mika Komppula
Lidar observations during the pollen season 2019 at the European Aerosol Research Lidar Network (EARLINET) station in Kuopio, Finland, were analyzed in order to optically characterize atmospheric pollen. Pollen concentration and type information were obtained by a Hirst-type volumetric air sampler. Previous studies showed the detectability of non-spherical pollen using depolarization ratio measurements. We present lidar depolarization ratio measurements at three wavelengths of atmospheric pollen in ambient conditions. In addition to the depolarization ratio detected with the multiwavelength Raman polarization lidar PollyXT at 355 and 532 nm, depolarization measurements of a co-located Halo Doppler lidar at 1565 nm were utilized. During a 4 d period of high birch (Betula) and spruce (Picea abies) pollen concentrations, unusually high depolarization ratios were observed within the boundary layer. Detected layers were investigated regarding the share of spruce pollen to the total pollen number concentration. Daily mean linear particle depolarization ratios of the pollen layers on the day with the highest spruce pollen share are 0.10 ± 0.02, 0.38 ± 0.23 and 0.29 ± 0.10 at 355, 532 and 1565 nm, respectively, whereas on days with lower spruce pollen share, depolarization ratios are lower with less wavelength dependence. This spectral dependence of the depolarization ratios could be indicative of big, non-spherical spruce pollen. The depolarization ratio of pollen particles was investigated by applying a newly developed method and assuming a backscatter-related Ångström exponent of zero. Depolarization ratios of 0.44 and 0.16 at 532 and 355 nm for the birch and spruce pollen mixture were determined.
- Article
(10738 KB) - Full-text XML
- BibTeX
- EndNote
Pollen is an essential part of plant reproduction as it stores and transports genetic information of the plant. Because of the immobility of plants, pollen grains need to be transferred by other means, for example, wind or animals. Most grasses (Poaceae), conifers and around 10 %–20 % of flowering plants are wind pollinated (Ackerman, 2000). Typical sizes of anemophilous pollen grains range from 20 to 60 µm (Shukla et al., 1998), but also large pollen grains like pine (Pinus) or spruce (Picea) pollen with diameters around 100 µm are transported by wind. Because anemophilous plants produce pollen in very large numbers, they are almost omnipresent in the environment. Thus, it is not surprising that pollen has various effects on climate and human health. Millions of people suffer from pollen-triggered allergies and the number is expected to rise due to the changing climate (Schmidt, 2016). Increasing temperatures and higher CO2 concentrations favor plant growth and pollen production. In regions with sufficient water resources, the growing seasons are therefore expected to become longer and the spatial distribution of allergenic species can be expected to change (Ziska and Beggs, 2012).
Pollen can be lifted up to several kilometers by turbulent mixing within the boundary layer. Airborne measurements such as during the Cooperative Convective Precipitation Experiment (CCOPE) near Miles City, Montana (USA), revealed the presence of pollen up to 4 km above ground with a considerable amount of pollen still observed at 2 km (Mandrioli et al., 1984). Once reached the top of the boundary layer, pollen can be transported by wind over thousands of kilometers (Rousseau et al., 2008; Skjøth et al., 2007; Szczepanek et al., 2017). Dispersed in the atmosphere, it can affect the climate. By acting as ice-nucleating particles, pollen promotes the formation of clouds (von Blohn et al., 2005; Diehl et al., 2001, 2002). Furthermore, pollen grains can rupture and lead to a high number of smaller particles. Those pollen fragments are efficient cloud condensation nuclei (Steiner et al., 2015; Wozniak et al., 2018).
Considering the relevance of pollen for climate and environment and the increasing importance as health hazard, it is of high importance to study the pollen distribution and transport mechanism in the atmosphere. To further improve pollen transport and forecast models, validation measurements are needed. Previously, we have shown that in the absence of other non-spherical particles, light detection and ranging (lidar) measurements and especially the particle depolarization ratio can be used to track pollen grains in the atmosphere (Bohlmann et al., 2019). We also estimated the depolarization ratio at 532 nm for pure birch (Betula) and pine pollen under certain assumptions as 0.24 ± 0.01 and 0.36 ± 0.01, respectively (Shang et al., 2020). However, due to the measurement setup in our earlier studies, the lowest layers of the atmosphere (below 800 m), which naturally contain most of the airborne pollen, could not be investigated. In this study, we extend our dataset by operating an upgraded version of our multiwavelength Raman lidar (PollyXT) with four near-range channels at the same measurement site in Kuopio (Vehmasmäki), Finland. The improved lidar setup allowed measurements down to around 350 m above ground level. Furthermore, the new system measures the depolarization ratio also at 355 nm, while depolarization measurements were limited to 532 nm in the previous campaign. To further improve the investigation of pollen depolarization properties, we assessed the depolarization measurements of a co-located Halo Doppler lidar, which provides information at 1565 nm (Vakkari et al., 2021). The measurement of the depolarization ratio at multiple wavelengths allows us to investigate its wavelength dependence. This could enable the distinction of pollen from other depolarizing aerosols, as the depolarization ratio at single wavelengths can be similar for different aerosol types.
Instrumentation and methods are presented in Sect. 2. The observation period is introduced in Sect. 3. Therein, we present a case study and comparison of different pollen conditions during the period under study. Supporting measurement data, a statistical analysis, the discussion of the wavelength dependence and an estimation of pollen depolarization values are also given in same section.
Our measurement campaign was performed from 23 April to 28 August 2019 at the rural forest site in Vehmasmäki (Kuopio), Finland (62∘44′ N, 27∘33′ E; 190 m above sea level). Vehmasmäki is surrounded by broadleaved and coniferous forest. Dominant tree species include Silver birch (Betula pendula), Norway spruce (Picea abies) and Scots pine (Pinus sylvestris). The measurement site is permanently equipped with a Raman polarization lidar, a Halo Doppler lidar, multiple in situ instruments as well as standard meteorological instruments located on top of a measurement container. Furthermore, a 318 m tall mast provides measurements of temperature, relative humidity and wind at various levels from ground up to 300 m. During our measurement campaign, a Hirst-type spore trap was deployed on top of the container to measure the pollen concentration. In the following subsections, the instruments and pollen detection are introduced, and the layer detection method is explained.
2.1 PollyXT and processing of lidar observations
The multiwavelength Raman polarization lidar PollyXT-FMI (Engelmann et al., 2016) is a fully automated lidar instrument, which emits at three wavelengths (355, 532 and 1064 nm), and is able to detect at two rotational–vibrational Raman channels (387 and 607 nm) and one water vapor detection channel at 407 nm in addition to the elastic backscatter channels at the emission wavelengths. The cross-polarized signal can be detected at 355 and 532 nm, which allows the determination of the linear volume depolarization ratio (VDR) and linear particle depolarization ratio (PDR) at those two wavelengths. In addition to the far-field channels, PollyXT includes a near-field unit with detection channels at 355, 387, 532 and 607 nm. The combination of near- and far-field channels allows the observation of continuous profiles down to about 120 m, the height of complete overlap of the near-field receiver. The initial vertical resolution of the acquired data is 7.5 m and the temporal resolution is 30 s. Further details on the instrument setup, principle and error propagation can be found in Engelmann et al. (2016). Near-real-time quicklooks are publicly accessible at the PollyNET website (http://picasso.tropos.de/, last access: 17 December 2020), which visualizes the measurements of all lidars belonging to PollyNET network (Baars et al., 2016).
The lidar data were analyzed using the Klett–Fernald method (Fernald, 1984; Klett, 1981) whenever the weather conditions were adequate (i.e., no low clouds or rain) and the signal quality was sufficient for deriving high-quality profiles. A constant lidar ratio of 60 sr was used to derive profiles of backscatter and extinction coefficients. The lidar ratio is based on measurements retrieved during nighttime using the Raman method (Ansmann et al., 1990) and the results for birch–spruce mixtures of our previous study (Bohlmann et al., 2019). Optical products retrieved from far- and near-field channels were merged to obtain the best possible profiles throughout the whole troposphere, enabling us to determine reliable profiles close to the ground. However, this is not the case for the 355 nm channel. Due to an overlap issue on the 355 nm far-range channel, reliable profiles at this wavelength were limited to 900 m above ground. The problem also affected the calculation of the depolarization ratio at 355 nm, which therefore could not be retrieved close to ground. To obtain high-quality depolarization measurements, calibration measurements are automatically performed three times a day using the Δ90∘ method (Freudenthaler, 2016; Freudenthaler et al., 2009). A calibration constant (Vλ*) determined from two subsequent measurements with a difference of exactly 90∘ is used to calibrate the volume depolarization ratio. During the presented time period, quite stable calibration constants V* of 1.85 ± 4.01 at 355 nm and 6.90 ± 6.29 at 532 nm were determined and applied to calibrate depolarization measurements. The profiles were temporally averaged in 2 h intervals to match with the time resolution of the pollen samples. Aerosol layers within the lowest 4 km of the atmosphere were detected using an automatic layer detection algorithm. The layer detection is based on the gradient of the backscattered signal at 1064 nm. The local maximum of the first derivative is considered to be the layer bottom, while the height of the local minimum of the first derivative corresponds to the layer top (Belegante et al., 2014). Less smoothed profiles with a vertical smoothing range of 127 m were used to determine the correct geometrical layer boundaries without losing layer depth. Higher smoothing with a vertical range of 367 m, in turn, was applied to calculate reasonable optical properties within the layer. Intensive optical properties (lidar ratios, linear particle depolarization ratios and Ångström exponents), commonly used for lidar-based aerosol characterization, were calculated for the automatically detected layers. Especially, the linear depolarization ratio and backscatter-related Ångström exponents (BÅE) are considered in this study. The linear depolarization ratio describes the change of the polarization state of the backscattered light. The strength of depolarization depends on the non-sphericity of the backscattering particles and the particle size relative to the wavelength (Sassen, 2005). The depolarization ratio increases with non-sphericity and can therefore be used to characterize the particle shape. The Ångström exponents describe the wavelength dependence of the scattering/extinction and relate to the particle size.
2.2 Halo Doppler lidar
In addition to the PollyXT lidar, a Halo Photonics StreamLine Pro Doppler lidar (Pearson et al., 2009) is operated permanently at our measurement site. This lidar operates at a wavelength of 1565 nm with a pulse repetition rate of 15 kHz and a pulse energy of 20 µJ. The minimum range of the instrument is 90 m and the range resolution is 30 m; other operating specifications can be found in Vakkari et al. (2021). This Halo Doppler lidar is equipped with a cross-polar receiver channel, which enables consecutive measurement of co- and cross-polar signals in vertically pointing mode and thus the retrieval of the depolarization ratio at 1565 nm. In this study, an integration time of 7 s was used; i.e., the co-polar signal is collected for 7 s followed by the cross-polar signal collected during the next 7 s. In addition to vertically pointing measurement, a conical scan lasting 2.5 min was scheduled every 15 min to retrieve the horizontal wind profile.
The Halo Doppler lidar signal-to-noise ratio was post-processed according to Vakkari et al. (2019) and the depolarization ratio was processed according to Vakkari et al. (2021). The design of Halo Doppler lidars does not include a depolarization calibration unit nor does it allow us to add one. Therefore, depolarization measurements can only be calibrated using the depolarization ratio at liquid cloud base. As liquid cloud droplets do not polarize the backscattered light, non-zero depolarization ratios at cloud base indicate incomplete extinction, called bleed-through, in the internal polarizer (Vakkari et al., 2021). The bleed-through in the Halo internal polarizer was estimated from liquid cloud base observed at 1200–1400 m a.g.l. on 14 June at 00:30–03:30 UTC as 0.013 ± 0.006. This estimate is very close to the estimate of 0.016 ± 0.009 from measurements with same instrument in 2016 (Vakkari et al., 2021). The depolarization ratio was corrected for the bleed-through according to Vakkari et al. (2021). The retrieved depolarization ratio can be considered as the linear particle depolarization ratio, since the contribution of molecular scattering at this long wavelength and low pulse energy is neglectable (Vakkari et al., 2021).
Vertical wind speed from the co-polar vertically pointing measurements and horizontal wind profile from the conical scans were used to calculate the turbulent kinetic energy (TKE) dissipation rate following O'Connor et al. (2010).
2.3 Pollen observations
The pollen information was obtained using a Hirst-type volumetric air sampler located on top of the measurement container, 4 m above ground. The sampler collects particles down to a size of 3.7 µm (Muilenberg, 2003) onto an adhesive-coated tape which is manually analyzed afterwards. With this type of sampler, it is possible to determine pollen types and concentrations with 2 h time resolution. A more detailed description of the sampling principle can be found in Bohlmann et al. (2019) and Hirst (1952).
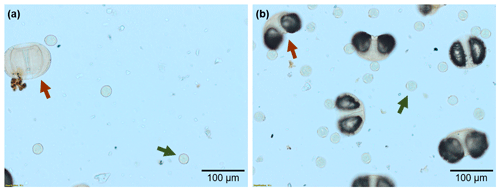
During our campaign, 18 different pollen types have been identified with the Hirst-type air sampler. The most abundant pollen types are birch (Betula), pine (Pinus) and spruce (Picea), which make up 93 % of the total annual pollen count in 2019. Birch pollen grains are almost spherical, around 20–30 µm in diameter and have three pores on their surface. The surface pattern is rather smooth (Blackmore et al., 2003). Pine and spruce pollen belong to the Pinaceae family. Their pollen grains are large and non-spherical. They possess two air bladders which assist those pollen grains to be dispersed by wind despite their large size. The diameter of pine pollen grains on their longest axis is around 65–80 µm, while spruce pollen is considered very large for anemophilous pollen, with a diameter around 90–110 µm on the longest axis (Nilsson et al., 1977). The surface of the pollen corpus of spruce pollen is wrinkled and wavy (Grímsson and Zetter, 2011; Shen et al., 2020). Figure 1 shows examples of micrographs during our measurement period. Examples of birch and spruce pollen grains are marked with green and red arrows, respectively. The different size dimension of birch and spruce pollen is clearly visible.
2.4 In situ measurements
Various in situ aerosol instruments were exploited for characterizing the overall aerosol load in the air at the site. An optical particle sizer (OPS; TSI Inc., model 3330) provided particle number concentration and size distribution in the size range of 0.3–10 µm, which were used to calculate the volume size distribution (by assuming spherical shape for the particles). A Synchronized Hybrid Ambient Real-time Particulate Monitor (SHARP; Thermo Fisher Scientific Inc., model 5030) and an aethalometer (Magee Scientific, model AE-31) provided continuous total particle mass and black carbon (BC) concentration, respectively. The instruments resided in the container and sampled through vertical stainless-steel lines with total air inlets. Meteorological conditions, such as temperature, relative humidity and wind speed and direction, may have effects on pollen concentration and distribution in the atmosphere. At Vehmasmäki, these meteorological parameters are measured at several heights between 2 and 300 m on the co-located mast. The lowest height for wind speed and direction is 26 m, which is around the average canopy height at this site.
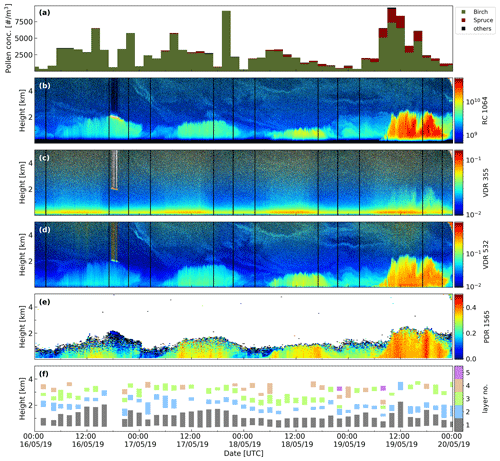
Figure 2Overview of the 16–20 May 2019 period. Pollen concentration detect by Hirst-type spore trap at 4 m height (a), range-corrected signal at 1064 nm (b), linear volume depolarization ratio at 355 (c) and 532 nm (d) by PollyXT Raman polarization lidar, Halo Doppler lidar depolarization ratio at 1565 nm (e) and automatic layer detection (f).
During our 4-month campaign in 2019, several periods of high pollen concentrations have been observed. One particular intense event with unusually high depolarization ratios and high pollen concentration will act as an example period for this study. An overview of this intense period is given in Fig. 2. From 16 to 19 May 2019, high bi-hourly concentrations of birch pollen, reaching up to 9000 grains m−3, were detected. The share of spruce pollen to the total pollen number concentration increased from 0.2 % on 16 May to 22 % on 19 May. Other pollen types only accounted for 0.8 % of the total pollen concentration during the period (Fig. 2a) and thus can be neglected.
The time–height display of PollyXT and Halo Doppler lidar observations is shown in Fig. 2b–d and e, respectively. During daytime, a high aerosol load was observed within the first 2 km considering the strong range-corrected signal at 1064 nm (Fig. 2b). Also the VDR at 532 nm and the Halo particle depolarization ratio at 1565 nm show strongly enhanced values and are increasing towards 19 May (Fig. 2d, e). At 355 nm, however, the VDR does not show significant features except a faint increase up to 2 km on 19 May. This can be explained by the strong influence of molecular scattering on the VDR at 355 nm and the consequently smaller effect of particles compared to larger wavelengths. Faint elevated layers between 3 and 5 km were observed on all 4 d especially during night. Those layers seem to be weakly depolarizing. Backward trajectories (not shown here) indicate that during all 4 d, the air masses arriving at different heights from 500 m to 5 km were advected from northwest and passed over northern Scandinavia and the Norwegian Sea; i.e., they did not pass over dust-influenced or highly polluted areas. Thus, it can be assumed that the studied air masses were not influenced by depolarizing dust. The depolarizing elevated aerosol layers between 3 and 5 km are likely pollen lifted by turbulence or long-range-transported pollen as other sources of depolarizing aerosols are missing along the trajectory.
3.1 Case study with highly depolarizing aerosol
Here, 19 May is of special interest. Lidar measurements show a strongly increased backscatter coefficient at 1064 nm and increased volume depolarization ratios especially at 532 and 1565 nm (Fig. 2). The depolarization ratios at these wavelengths are exceptionally high compared to commonly observed depolarization ratios for non-spherical particles. However, measurements with the same measurement settings prior to the intense pollen period show usual values. We therefore consider our depolarization ratio measurements trustworthy.
In Fig. 3, 19 May is presented separately, showing the range-corrected signal at 1064 nm (Fig. 3a) and the volume depolarization ratio at 532 nm (Fig. 3b). The period from 11:00 to 13:00 UTC (shown within white bars) was selected to present time-averaged lidar profiles (Fig. 3c–e). For processing the lidar measurements, a lidar ratio of 60 sr was applied as it was determined for birch and spruce mixtures in our previous study (Bohlmann et al., 2019). Relative humidity and temperature profiles according to GDAS1 (Global Data Assimilation System) data are shown in Fig. 3f. According to profiles of the backscatter signal and relative humidity, the top of the boundary layer is at around 2.5 km. Above 8 km, cirrus clouds have been detected, which show typical depolarization values for cirrus clouds of around 0.4 at 355 and 532 nm (Chen et al., 2002; Sassen and Zhu, 2009; Voudouri et al., 2020). Within the boundary layer, the backscatter coefficient at 532 nm is larger than at 355 nm, resulting in a negative backscatter-related Ångström exponent (BÅE) at 355/532 nm of −0.64 ± 0.45. Cases of negative Ångström exponents have previously been observed for dust particles (Bohlmann et al., 2018; Rittmeister et al., 2017; Tsekeri et al., 2017; Veselovskii et al., 2016) and are likely caused by specific chemical compositions causing a spectral variation of the imaginary part of the refractive index (Veselovskii et al., 2016). The BÅE at 532/1064 nm, however, is positive (0.97 ± 0.41) and comparable with values of dust smoke mixtures (Kanitz et al., 2014; Tesche et al., 2011). The negative BÅE at 355/532 nm, while having a positive BÅE at 532/1064 nm, could be characteristic of pollen.
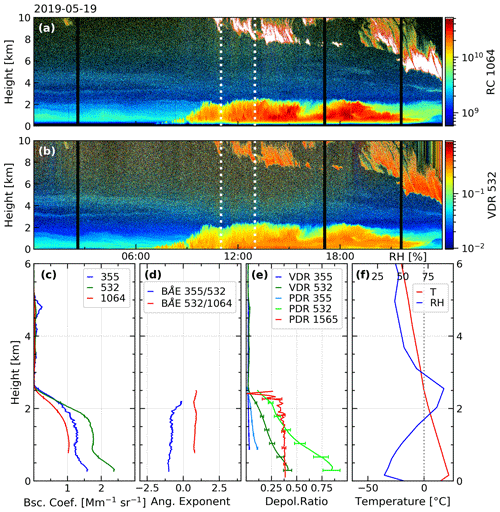
Figure 3Case study on 19 May 2019. Range-corrected lidar signal at 1064 nm (a) and volume depolarization ratio at 532 nm (b). Time-averaged profiles of backscatter coefficients (c), backscatter-related Ångström exponents (d) and depolarization ratios (e) of the selected time period, 11:00–13:00 UTC (white lines), are given. Profiles of temperature and relative humidity from GDAS1 data at 12:00 UTC (f).
VDR and PDR values within the boundary layer are high. Mean PDRs are 0.06 ± 0.02, 0.46 ± 0.22 and 0.35 ± 0.07 at 355, 532 and 1565 nm, respectively. Very high depolarization ratios of aerosol particles have been detected with lidar before. Ansmann et al. (2009) measured depolarization ratios of 0.5–1 at 710 nm during the Saharan Mineral Dust Experiment (SAMUM). Those high depolarization ratios were caused by large dust, silt-sized and sand particles (> 10 µm) which were lifted by convective plumes and dust devils. In our observations, the depolarization ratios at 355 and 532 nm show a decline with height, while the Halo PDR at 1565 nm is almost constant throughout the whole boundary layer. Values of PDR, as well as BÅE, always represent a mixture of pollen and background aerosol. We assume that the concentration of pollen decreases with height, i.e., increasing distance to the pollen source, and the influence of background aerosol increases. The longer Halo wavelength is more sensitive to larger particles (pollen) and less sensitive to smaller particles (background aerosol), and thus the depolarization ratio does not decrease with height in contrast to the PDR at 355 and 532 nm. The different sensitivity to background aerosol could also explain the difference of the PDR at 355 and 532 nm. Later in this study, in Sect. 3.6, we will use a method described by Shang et al. (2020) to separate the influence of background and the pollen on measured optical properties.
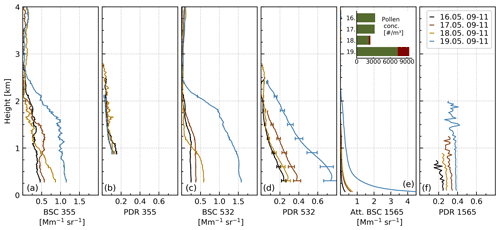
Figure 4Case studies from each day between 09:00 and 11:00 UTC. Backscatter coefficient and particle depolarization ratio at 355 and 532 nm by PollyXT (a–d) and the attenuated backscatter and particle depolarization ratio at 1565 nm by Halo (e–f). The bar chart shows the pollen concentration during the 2 h period each day, with green representing birch and red representing spruce pollen.
3.2 Case studies with different pollen concentrations
Figure 4 shows profiles of the PollyXT backscatter coefficients and linear particle depolarization ratio at 355 and 532 nm as well as the attenuated backscatter and PDR at 1565 nm by the Halo Doppler lidar for a selected 2 h time period on each day representing different pollen conditions. The bar chart illustrates the pollen concentration obtained from the Hirst-type pollen trap during the time period each day. Green color represents the birch pollen concentration, while red represents the spruce pollen concentration. On 19 May, the total pollen concentration and the share of spruce pollen were the highest. On 16 and 17 May, however, no spruce pollen was detected. A strong backscattering signal was detected up to 2.5 km on 19 May, whereas on the other days the signal was weaker, and according to the strong decrease of the backscatter signal, the boundary layer height was lower. Most noticeable is the increase of the PDR at 532 and 1565 nm on the day with the highest spruce pollen share and total pollen concentration, while the PDR at 355 nm is around the same on all days and clearly lower than at the longer wavelengths.
The increased depolarization on 19 May is likely related to the large amount of highly non-spherical and large spruce pollen on this day compared to the other days. In Fig. 1, micrographs of the pollen observations on 18 and 19 May from 09:00 to 11:00 UTC are shown. Birch and spruce pollen was observed on both days, but the amount of both birch and spruce pollen was clearly higher on 19 May. This may have resulted in the higher depolarization observed on this day. Certainly, other factors, such as ambient weather conditions or the fragmentation of pollen grains, could have contributed to this observation as well. Those effects will be investigated in the following section.
3.3 Findings from supporting data
Pollen release and distribution is heavily influenced by the ambient weather conditions. Higher temperature and wind speed positively affect the pollen concentration, while the relative humidity and pollen concentration are negative related (Bartková-Ščevková, 2003; Noh et al., 2013). Under certain meteorological conditions, e.g., humidity changes and turbulent disturbances, pollen grains can rupture to smaller fragments (Hughes et al., 2020; Miguel et al., 2006; Taylor et al., 2002, 2004). The pollen fragments are not recorded as pollen or counted and therefore do not contribute to the pollen count using microscopic analysis. However, the fragments can persist much longer in the atmosphere than intact pollen due to their smaller size and lower falling velocity. The small pollen fragments can act efficiently as ice-nucleating particles (von Blohn et al., 2005; Diehl et al., 2001, 2002) and penetrate deeper into the respiratory system than intact pollen where they can trigger severe allergenic reactions and asthma. Furthermore, small, non-spherical pollen fragments could cause a higher depolarization ratio.
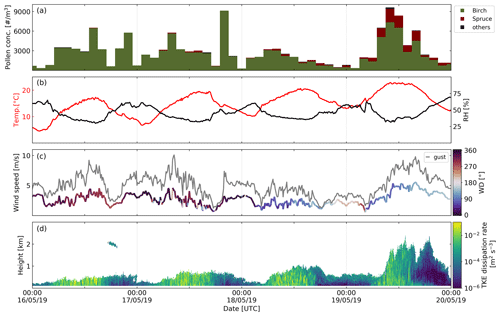
Figure 5Overview of pollen concentration by Hirst-type spore trap (a), air temperature and relative humidity at 2 m mast height (b), wind speed, wind direction and wind gust at 26 m mast height including wind direction shown by color (c) and turbulent kinetic energy (TKE) dissipation rate (d) by Halo Doppler lidar.
Figure 5 gives an overview of the meteorological conditions during the studied period. The temperature and relative humidity at 2 m (Fig. 5b) and wind speed, wind direction and gust wind at 26 m (Fig. 5c) above ground are shown in addition to the pollen concentration (Fig. 5a). The diurnal cycles of temperature and relative humidity are clearly visible with a maximal relative humidity during the night and maximal temperature shortly after noon. Wind measurements show only a weak diurnal change with a slightly lower wind speed in the evening hours. On 19 May, the wind speed increased rapidly before noon, and a more distinct diurnal cycle compared to the other days is apparent. At the same time, the temperature was higher and the relative humidity slightly lower than on the preceding days, which could explain the higher pollen concentration on this day. The local wind direction changed from northwest on 16 May to southeast on 19 May. Gust winds predominately follow the trend of the mean wind speed, although on 17 May, the stronger gust winds at around 19:00 UTC could explain the high amount of birch pollen at this time.
Turbulent movements within the boundary layer can affect the dispersal of airborne pollen, and pollen grains can be lifted vertically to heights where they are detectable with lidar. Moreover, turbulent conditions could cause pollen grains to rupture upon impact with solid surfaces or other aerosols (Visez et al., 2015). The TKE dissipation rate obtained from the Halo Doppler lidar is shown in Fig. 5d. However, no significant difference between the 4 d was found to indicate a higher occurrence of pollen fragments and further explain the higher depolarization ratio on the last day. The higher detection height on 19 May is caused by a higher aerosol load and therefore higher signal-to-noise ratio on that day.
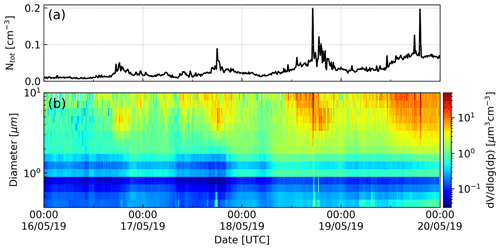
Figure 6Time series of particle number concentration (a) and volume size distribution in the range 0.3–10 µm (b) by optical particle sizer (OPS) using a 10 min time average.
In situ measurements have been checked to characterize the ground-level aerosol conditions at our measurement site. The particle number concentration at ground level was higher on 18 and 19 May than on 16 and 17 May (Fig. 6a). The evolution of the volume size distribution (Fig. 6b) shows an increase in the concentration of 3–10 µm particles, which could be fragments of birch or spruce pollen. The increase in the coarse particle fraction was verified with the total mass concentration (data not shown). The BC concentration (not shown) was low (around 0.1–0.2 µg m−3) throughout the period, except for a short peak on 18 May at 18:00 UTC (also visible in the OPS data; Fig. 6a); thus, no smoke contribution in the boundary layer is expected.
Our results indicate that the influence of pollen fragments is uncertain as the amount of pollen fragments is not recorded by the Hirst-type pollen sampler, and in situ, meteorological and Halo turbulence measurements do not suggest apparent reasons for a pronounced fragmentation of pollen grains in the atmosphere. However, pollen fragments could cause depolarization in the lidar signal and also partly explain the wavelength dependence of the PDR. Therefore, the impact of pollen fragments needs to be explored in future studies.
3.4 Lidar-derived optical parameters
To investigate the relationship between lidar-derived optical parameters and the pollen observations and to define characteristic values for specific pollen conditions, we determined mean values in the detected layers shown in Fig. 2f. We here focus on the lowest detected layer as it can be assumed to contain most of the local pollen concentration. A total of 47 pollen layers has been detected in the 2 h averaged dataset of the 4 d period. Mean values of the lidar-derived optical properties are presented in Figs. 7 and 8. Color represents the share of spruce pollen of the total pollen number concentration detected by the Hirst-type spore trap. Size of the markers represents the total 2 h pollen concentration. Daily mean values are shown with black markers; error bars represent the standard deviation. The lower limit for reliable profiles was about 350 m after combining near- and far-field channels and vertical smoothing, whereas a higher layer bottom limit of 900 m was applied on the profiles of PDR at 355 nm (Fig. 7a) and the Ångström exponent at 532/1064 nm (Fig. 8b) due to the overlap problems at 355 nm and the higher full overlap height at 1064 nm, respectively.
In Fig. 7, the particle depolarization ratios at all three wavelengths are compared. Two groups depending on the spruce pollen share are apparent in the comparison of PDR at 532 against 355 nm (Fig. 7a) and PDR at 532 against 1565 nm (Fig. 7b). Cases with a high share of spruce pollen and high total pollen concentration tend to show the highest PDR values ranging between 0.4 and 0.9 at 532 nm, while the PDR for cases with a lower share of spruce pollen is below 0.4. The PDR at 355 nm is below 0.17 for all cases, and no correlation with the spruce pollen share is apparent. The relationship between the PDR at 1565 and 532 nm is nearly linear when the spruce share is low (Fig. 7b). With increasing spruce pollen share, the PDR at 532 nm exceeds the PDR at 1565 nm. This wavelength dependency of the PDR with increasing spruce pollen share could be characteristic of this large and non-spherical pollen type and provide a means for classifying conifer pollen.
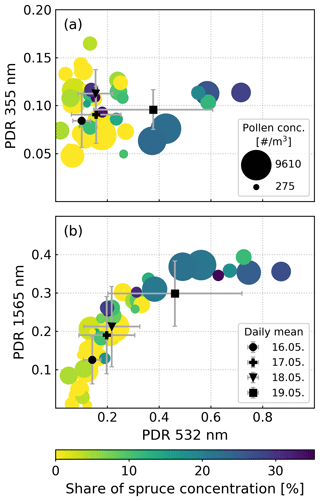
Figure 7Particle depolarization ratio (PDR) as measured with PollyXT at 355 vs. the PDR at 532 nm (a) and Halo PDR at 1565 nm vs. Polly PDR at 532 nm (b). Color represents the share of the spruce pollen concentration to the total pollen count; size denotes the total pollen concentration. Black markers present daily mean values and their standard deviation.
Figure 8 shows the backscatter-related Ångström exponents at 355/532 nm and 532/1064 nm against the PDR at 532 nm. The tendency towards smaller Ångström exponents with increasing depolarization ratio indicates the increasing impact of larger and non-spherical particles such as spruce pollen. Similar behavior has already been reported in Bohlmann et al. (2019) and Shang et al. (2020). For cases with a high amount of large, non-spherical spruce pollen, e.g., with > 15 % share of the total pollen number concentration, the BÅE at 355/532 nm is negative. Previously, negative Ångström exponents have only been reported for dust close to the dust source region where very large dust particles are present (Hofer et al., 2020; Rittmeister et al., 2017; Veselovskii et al., 2016). This feature, however, could also be characteristic of aerosol conditions with the presence of very large pollen grains.
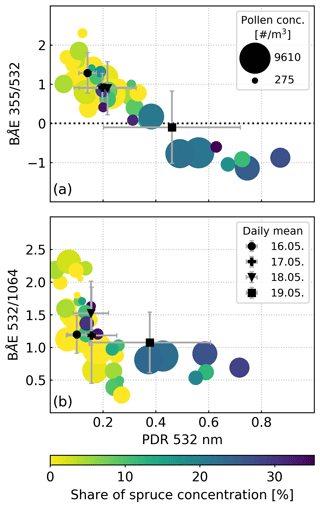
Figure 8Backscatter-related Ångström exponent (BÅE) at 355/532 nm (a) and 532/1064 nm (b) vs. the PDR at 532 nm. Color represents the share of the spruce pollen concentration to the total pollen count; size denotes the total pollen concentration. Black markers present daily mean values and their standard deviation.
Table 1Daily mean values of pollen concentrations and lidar-derived optical parameters of the pollen layers. The total pollen (spruce pollen) concentrations are measured by the Hirst-type volumetric air sampler. Layer heights are determined using the gradient method. Daily mean values and standard deviation of lidar-derived optical parameters in the pollen layers using a layer bottom height of 900 m (a) and 350 m (b).
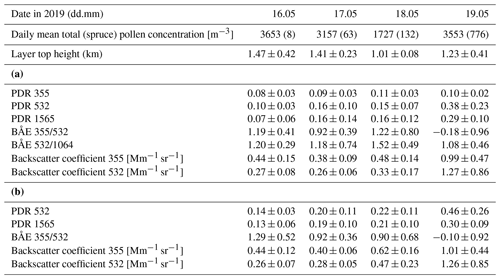
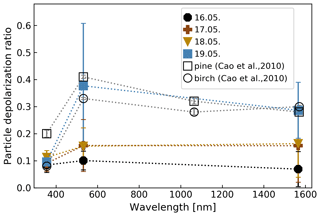
Table 1 summarizes the daily mean values shown in Figs. 7 and 8 with black markers. Mean values are given for different layer bottom heights as profiles could only be retrieved down to 900 m at 355 and 1064 nm. Noteworthy is the spectral dependence of the depolarization ratio, which is also illustrated in Fig. 9.
The daily mean backscatter-related Ångström exponent is clearly different on the spruce-dominated day. While it is around 0.9–1.3 at 355/532 nm and 1.18–1.52 at 532/1064 nm on the days with low spruce pollen share, BÅEs are clearly smaller at both wavelength pairs on the spruce-dominated day, suggesting the presence of larger particles. The negative BÅE at 355/532 nm might be characteristic of large, non-spherical spruce pollen grains since it has only been observed on days with a high spruce pollen concentration. It must be noted that the Ångström exponent also depends on the background aerosols and its use to characterize pollen needs to be considered carefully. However, under the same background conditions, the Ångström exponent can be an indicator for the pollen type. As the considered time period is rather short and no far-range transported aerosol sources were observed, the background conditions can be assumed stable during the period. The change of the Ångström exponent can therefore be attributed to the presence of pollen.
3.5 Spectral dependence of the linear depolarization ratio
Figure 9 shows the daily mean linear particle depolarization ratios detected with PollyXT (at 355 and 532 nm) and the Halo Doppler lidar (at 1565 nm). The PDR at 355 nm is around 0.1 on all 4 d. Of special interest is the strong spectral dependency of the PDR observed on 19 May. A higher depolarization ratio was observed at 532 than at 1565 nm. On the preceding days, however, the depolarization ratios at 532 and 1565 nm are only slightly higher than at 355 nm and almost equal. As shown in Table 1, the amount of observed spruce pollen was increasing each day and contributed to almost 22 % of the total number concentration on 19 May. Longer wavelengths are more sensitive to larger particles and less influenced by Rayleigh scattering (Ansmann et al., 2009). The strong spectral dependency on 19 May can therefore be explained by the high amount of non-spherical spruce pollen on that day. Another explanation for the observed wavelength dependence could be the surface structure of pollen. Patterns on the outer wall of the pollen, the exine, can vary enormously in their appearance, but within the same species patterns are usually similar (Wang and Dobritsa, 2018). The non-smooth pattern on spruce pollen grains could additionally cause a depolarization of the backscattered light.
A spectral dependence of the linear depolarization ratio of pollen has already been reported by Cao et al. (2010), who measured the depolarization ratio for different pollen types, such as birch and pine, in controlled laboratory experiments. For birch pollen, Cao et al. (2010) reported a PDR of 0.08 ± 0.01, 0.33 ± 0.00 and 0.30 ± 0.01 at 355, 532 and 1570 nm, respectively. No measurements have been conducted for spruce pollen. However, the authors state values for pine which belong to the same family as spruce and have smaller but in shape comparable pollen grains. According to Cao et al. (2010), depolarization ratios for pine pollen are 0.20 ± 0.01, 0.41 ± 0.01 and 0.28 ± 0.01 at 355, 532 and 1570 nm, respectively. The laboratory-derived depolarization ratios by Cao et al. (2010) are shown for comparison in Fig. 9. Empty markers represent the lidar depolarization ratios for paper birch (Betula papyrifera) and Virginia pine (Pinus virginiana). Especially the spectral dependence for pine pollen is very similar to our observations on the spruce-dominated day, having the peak at 532 nm. It should be kept in mind that the laboratory measurements were performed in an aerosol chamber and that they represent the depolarization ratio of the pure and dry pollen. Furthermore, pollen from different species was used compared to what we detected at our measurement site. Different values were therefore expected. However, the fact that we detected similar wavelength dependence in ambient conditions to that in the laboratory measurements suggests that the wavelength dependence with maxima at 532 nm might be characteristic of pollen especially for large and non-spherical conifer pollen types.
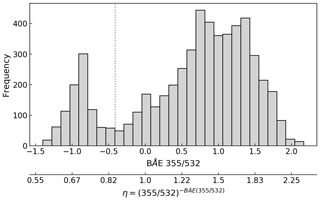
Figure 10Frequency distribution of backscatter-related Ångström exponent at 355/532 nm of the pollen layers detected during the studied period. The related η value, as used in Shang et al. (2020), is given on the second x axis. The BÅE threshold of −0.4 to remove “extreme cases” is marked by the dashed vertical line.
The spectral dependence of the PDR has previously been reported for different aerosol types. Haarig et al. (2018) and Hu et al. (2019) observed a completely different spectral dependence of the PDR for stratospheric smoke. The PDR is strongly decreasing with increasing wavelength caused by the dominance of small particles (< 0.5 µm). A similar spectral dependence of the PDR with the peak PDR at 532 nm and decreasing towards 355 and 1064 nm, however, was reported by Haarig et al. (2017) and Burton et al. (2015) for transported Saharan dust. As for pollen, the optical properties of dust are dominated by large particles (> 1 µm) as well. However, depolarization ratios at 355 nm are clearly smaller for pollen than for dust, while the PDR at longer wavelengths is higher, which allows the distinction of pollen and aged dust.
3.6 Estimation of the pollen depolarization ratio values
To estimate the depolarization ratio values for pure pollen, a newly developed method by Shang et al. (2020) was applied to the lidar measurements. Mathematically, there is a power-law relationship between the total backscatter-related Ångström exponent and the pollen backscatter contribution (the ratio of pollen backscatter coefficient and the total particle backscatter coefficient). The depolarization ratio at 532 nm of pure pollen was investigated using the BÅE at 355/532 nm. Our results of this intense pollen event show two groups of data depending on the spruce pollen share: (i) a quite good power-law relationship is found for cases with a low share of spruce pollen; (ii) the BÅE at 355/532 nm is almost constant with increasing PDR for cases with a higher share of spruce pollen. These two groups can also be identified as the two modes in the frequency distribution of BÅE values at 355/532 nm presented in Fig. 10. The first mode of values around −0.9, denoted as “extreme cases”, is related to PDR larger than 0.25, mostly for the data on the last day (high spruce share). For these cases, the BÅE is almost constant throughout the boundary layer, whereas the depolarization ratio is decreasing with height. This reveals the limitation of Ångström exponent at lidar wavelengths of 355 and 532 nm for the detection of big pollen particles since the BÅE normally decreases with increasing share of pollen particles, i.e., increasing PDR.
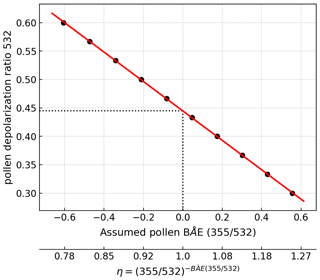
Figure 11Assumed pollen backscatter-related Ångström exponent at 355/532 nm against the related pollen depolarization ratio at 532 nm for the studied period after removing cases below the BÅE threshold of −0.4. The pollen depolarization ratio is the calculated depolarization ratio value for a pollen backscatter contribution of 1 at assumed pollen BÅE.
A threshold of −0.4 was applied to remove those “extreme cases” before applying the algorithm of Shang et al. (2020). A depolarization ratio of 0.03 at both 355 and 532 nm was used for non-pollen particles, which is a mean value for pollen-free periods at our measurement site. After the iteration, we found the relationship between the pollen BÅE at 355/532 nm and the pollen depolarization ratio at 532 nm presented in Fig. 11. This relationship is representing the mixture of birch and spruce pollen, with low spruce pollen share after the selection of the threshold. Our previous studies (Bohlmann et al., 2019; Shang et al., 2020) indicate that pollen consists of medium- to high-absorbing particles with lidar ratio values from 55 to 70 sr at both 355 and 532 nm for birch and spruce pollen, without significant wavelength dependence. The pollen grains are quite big and thus can be assumed to be wavelength independent on the backscatter at wavelengths of 355 and 532 nm. Under the assumption that the backscatter-related Ångström exponent at 355/532 nm should be zero for pollen, the pollen depolarization ratio was found to be 0.44 for the mixture of birch and spruce pollen observed during this intensive period of high pollen concentrations. The spruce pollen share to the total pollen number concentration of the birch–spruce pollen mixture ranges between 0 % and 35 % for the estimated pollen depolarization value. The depolarization at 355 nm was calculated using the pollen backscatter contribution at 355 nm and the BÅE at 355/532 nm. Assuming a BÅE of zero, a pollen depolarization ratio of 0.16 at 355 nm was found for the birch and spruce mixture. In order to retrieve the pollen depolarization ratio of the “extreme cases”, we used the BÅE at 532/1064 nm, as longer lidar wavelengths might be beneficial for cases with a high share of very large particles. However, our dataset of corresponding cases is too limited to lead to a meaningful conclusion. More cases with high spruce concentration are needed.
During the pollen campaign in 2019 at the European Aerosol Research Lidar Network (EARLINET) station in Vehmasmäki (Kuopio), Finland, we were able to expand the dataset of birch and spruce pollen observations with improved lidar-based measurements down to around 350 m. In previous studies, measurements were restricted by a high overlap height which limited usable profiles to data above 800 m. The majority of strongly depolarizing spruce pollen, however, is assumed to be close to the pollen source near ground level. Thus, when conducting pollen measurements with lidar, the lower limit of usable lidar data should be as low as possible. In our study, we utilized depolarization measurements of a co-located Halo Doppler lidar to add a third depolarization wavelength. Very high depolarization ratios have been detected during a 4 d period of birch and spruce pollen with an increasing amount of spruce pollen towards the end. In situ aerosol measurements and meteorological data have been considered to characterize the overall aerosol load in the air and the air masses at the site. Ruptured pollen could affect the observed depolarization ratio, as the smaller fragments of ruptured pollen are highly non-spherical. We detected a slightly higher number of particles in the diameter range from 3–10 µm on the day with high depolarization, which could be partly caused by pollen fragments. However, more research on the impact of pollen fragments is needed and the amount of pollen fragments should be recorded in future studies. Also the possible impact of the pollen surface structure on the measured depolarization ratios needs to be investigated, as the rough surface of certain pollen types can cause higher depolarization ratios.
The investigation of lidar-retrieved optical properties in detected pollen layers revealed a wavelength dependence of the depolarization ratio especially in the presence of spruce pollen. On a day with a spruce pollen share of the total pollen number concentration of about 22 %, high PDR values of 0.46 ± 0.26 and 0.30 ± 0.09 were detected at 532 and 1565 nm, respectively, in pollen layers down to around 350 m. The PDR at 355 nm could only be detected down to 900 m. In those layers, mean PDR values were 0.10 ± 0.02, 0.38 ± 0.23 and 0.29 ± 0.10 at 355, 532 and 1565 nm, respectively. The wavelength dependency could be explained with the higher sensitivity of the longer lidar wavelengths to big pollen particles (∼ 100 µm) and characteristic surface pattern of such pollen. This wavelength dependence could be characteristic of large, non-spherical spruce pollen. Furthermore, negative backscatter-related Ångström exponents have been detected when the spruce pollen share was high. Negative Ångström exponents have previously been detected for dust but could also be a characteristic feature of spruce pollen. A novel method introduced by Shang et al. (2020) was applied to the measurement data, and pollen depolarization ratio values of 0.44 at 532 nm and 0.16 at 355 nm were determined for the birch–spruce pollen mixture. Furthermore, a limitation of the Ångström exponent at the lidar wavelengths of 355/532 nm for the characterization of very large pollen particles like spruce was found.
To determine values of pure pollen, more cases with high concentrations of only one pollen type are necessary. We found characteristic values for atmospheric conditions in the presence of spruce pollen, but at our measurement site spruce pollen almost always occurred simultaneously with other pollen types. This complicates the investigation of pollen type characteristics, as optical properties vary depending on different mixtures of backscattering aerosol. Furthermore, pollen fragments and the pollen surface structure need to be considered when investigating pollen properties with lidar because non-spherical fragments and pollen-type-specific surface structures possibly affect the detected depolarization ratio as well. Nevertheless, our study shows the spectral dependence of the depolarization ratio for pollen, especially spruce, in the atmosphere.
Lidar data are available upon request from the authors and data “quicklooks” are available on the PollyNET website (http://picasso.tropos.de/, last access: 17 December 2020, PollyNET, 2020).
SB analyzed the data and wrote the manuscript in close cooperation with XS. VV provided the Halo Doppler lidar data. AL provided and assured the quality of the in situ measurements. SP analyzed the pollen samples. MK and EG initiated the project. All authors contributed to the scientific discussion and the article preparation.
The authors declare that they have no conflict of interest.
We acknowledge the Biodiversity Unit of University of Turku for the analysis of the pollen samples.
This work was supported by the Academy of Finland (project no. 310312).
This paper was edited by Matthias Tesche and reviewed by two anonymous referees.
Ackerman, J. D.: Abiotic pollen and pollination: ecological, functional, and evolutionary perspectives, in: Plant Systematics and Evolution, edited by: Dafni, A., Hesse, M., and Pacini, E., Springer Vienna, Vienna, 167–185, 2000.
Ansmann, A., Riebesell, M., and Weitkamp, C.: Measurement of atmospheric aerosol extinction profiles with a Raman lidar, Opt. Lett., 15, 746–748, 1990.
Ansmann, A., Tesche, M., Knippertz, P., Bierwirth, E., Althausen, D., Müller, D., and Schulz, O.: Vertical profiling of convective dust plumes in southern Morocco during SAMUM, Tellus B, 61, 340–353, https://doi.org/10.1111/j.1600-0889.2008.00384.x, 2009.
Baars, H., Kanitz, T., Engelmann, R., Althausen, D., Heese, B., Komppula, M., Preißler, J., Tesche, M., Ansmann, A., Wandinger, U., Lim, J.-H., Ahn, J. Y., Stachlewska, I. S., Amiridis, V., Marinou, E., Seifert, P., Hofer, J., Skupin, A., Schneider, F., Bohlmann, S., Foth, A., Bley, S., Pfüller, A., Giannakaki, E., Lihavainen, H., Viisanen, Y., Hooda, R. K., Pereira, S. N., Bortoli, D., Wagner, F., Mattis, I., Janicka, L., Markowicz, K. M., Achtert, P., Artaxo, P., Pauliquevis, T., Souza, R. A. F., Sharma, V. P., van Zyl, P. G., Beukes, J. P., Sun, J., Rohwer, E. G., Deng, R., Mamouri, R.-E., and Zamorano, F.: An overview of the first decade of PollyNET: an emerging network of automated Raman-polarization lidars for continuous aerosol profiling, Atmos. Chem. Phys., 16, 5111–5137, https://doi.org/10.5194/acp-16-5111-2016, 2016.
Bartková-Ščevková, J.: The influence of temperature, relative humidity and rainfall on the occurrence of pollen allergens (Betula, Poaceae, Ambrosia artemisiifolia) in the atmosphere of Bratislava (Slovakia), Int. J. Biometeorol., 48, 1–5, https://doi.org/10.1007/s00484-003-0166-2, 2003.
Belegante, L., Nicolae, D., Nemuc, A., Talianu, C., and Derognat, C.: Retrieval of the boundary layer height from active and passive remote sensors. Comparison with a NWP model, Acta Geophys., 62, 276–289, https://doi.org/10.2478/s11600-013-0167-4, 2014.
Blackmore, S., Steinmann, J. A. J., Hoen, P. P., and Punt, W.: BETULACEAE and CORYLACEAE, Revi. Palaeobot. Palyno., 123, 71–98, https://doi.org/10.1016/S0034-6667(02)00156-2, 2003.
von Blohn, N., Mitra, S. K., Diehl, K., and Borrmann, S.: The ice nucleating ability of pollen: Part III: New laboratory studies in immersion and contact freezing modes including more pollen types, Atmos. Res., 78, 182–189, https://doi.org/10.1016/j.atmosres.2005.03.008, 2005.
Bohlmann, S., Baars, H., Radenz, M., Engelmann, R., and Macke, A.: Ship-borne aerosol profiling with lidar over the Atlantic Ocean: from pure marine conditions to complex dust–smoke mixtures, Atmos. Chem. Phys., 18, 9661–9679, https://doi.org/10.5194/acp-18-9661-2018, 2018.
Bohlmann, S., Shang, X., Giannakaki, E., Filioglou, M., Saarto, A., Romakkaniemi, S., and Komppula, M.: Detection and characterization of birch pollen in the atmosphere using a multiwavelength Raman polarization lidar and Hirst-type pollen sampler in Finland, Atmos. Chem. Phys., 19, 14559–14569, https://doi.org/10.5194/acp-19-14559-2019, 2019.
Burton, S. P., Hair, J. W., Kahnert, M., Ferrare, R. A., Hostetler, C. A., Cook, A. L., Harper, D. B., Berkoff, T. A., Seaman, S. T., Collins, J. E., Fenn, M. A., and Rogers, R. R.: Observations of the spectral dependence of linear particle depolarization ratio of aerosols using NASA Langley airborne High Spectral Resolution Lidar, Atmos. Chem. Phys., 15, 13453–13473, https://doi.org/10.5194/acp-15-13453-2015, 2015.
Cao, X., Roy, G., and Bernier, R.: Lidar polarization discrimination of bioaerosols, Opt. Eng., 49, 116201, https://doi.org/10.1117/1.3505877, 2010.
Chen, W.-N., Chiang, C.-W., and Nee, J.-B.: Lidar ratio and depolarization ratio for cirrus clouds, Appl. Opt., 41, 6470–6476, https://doi.org/10.1364/AO.41.006470, 2002.
Diehl, K., Quick, C., Matthias-Maser, S., Mitra, S. K., and Jaenicke, R.: The ice nucleating ability of pollen Part I: Laboratory studies in deposition and condensation freezing modes, Atmos. Res., 58, 75–87, https://doi.org/10.1016/S0169-8095(01)00091-6, 2001.
Diehl, K., Matthias-Maser, S., Jaenicke, R., and Mitra, S. K.: The ice nucleating ability of pollen: Part II. Laboratory studies in immersion and contact freezing modes, Atmos. Res., 61, 125–133, https://doi.org/10.1016/S0169-8095(01)00132-6, 2002.
Engelmann, R., Kanitz, T., Baars, H., Heese, B., Althausen, D., Skupin, A., Wandinger, U., Komppula, M., Stachlewska, I. S., Amiridis, V., Marinou, E., Mattis, I., Linné, H., and Ansmann, A.: The automated multiwavelength Raman polarization and water-vapor lidar PollyXT: the neXT generation, Atmos. Meas. Tech., 9, 1767–1784, https://doi.org/10.5194/amt-9-1767-2016, 2016.
Fernald, F. G.: Analysis of atmospheric lidar observations: some comments, Appl. Opt., 23, 652–653, 1984.
Freudenthaler, V.: About the effects of polarising optics on lidar signals and the Δ90 calibration, Atmos. Meas. Tech., 9, 4181–4255, https://doi.org/10.5194/amt-9-4181-2016, 2016.
Freudenthaler, V., Esselborn, M., Wiegner, M., Heese, B., Tesche, M., Ansmann, A., Müller, D., Althausen, D., Wirth, M., Fix, A., Ehret, G., Knippertz, P., Toledano, C., Gasteiger, J., Garhammer, M., and Seefeldner, M.: Depolarization ratio profiling at several wavelengths in pure Saharan dust during SAMUM 2006, Tellus B, 61, 165–179, 2009.
Grímsson, F. and Zetter, R.: Combined LM and SEM study of the Middle Miocene (Sarmatian) palynoflora from the Lavanttal Basin, Austria: Part II. Pinophyta (Cupressaceae, Pinaceae and Sciadopityaceae), Grana, 50, 262–310, https://doi.org/10.1080/00173134.2011.641450, 2011.
Haarig, M., Ansmann, A., Althausen, D., Klepel, A., Groß, S., Freudenthaler, V., Toledano, C., Mamouri, R.-E., Farrell, D. A., Prescod, D. A., Marinou, E., Burton, S. P., Gasteiger, J., Engelmann, R., and Baars, H.: Triple-wavelength depolarization-ratio profiling of Saharan dust over Barbados during SALTRACE in 2013 and 2014, Atmos. Chem. Phys., 17, 10767–10794, https://doi.org/10.5194/acp-17-10767-2017, 2017.
Haarig, M., Ansmann, A., Baars, H., Jimenez, C., Veselovskii, I., Engelmann, R., and Althausen, D.: Depolarization and lidar ratios at 355, 532, and 1064 nm and microphysical properties of aged tropospheric and stratospheric Canadian wildfire smoke, Atmos. Chem. Phys., 18, 11847–11861, https://doi.org/10.5194/acp-18-11847-2018, 2018.
Hirst, J. M.: An automatic volumetric spore trap, Ann. Appl. Biol., 39, 257–265, https://doi.org/10.1111/j.1744-7348.1952.tb00904.x, 1952.
Hofer, J., Ansmann, A., Althausen, D., Engelmann, R., Baars, H., Fomba, K. W., Wandinger, U., Abdullaev, S. F., and Makhmudov, A. N.: Optical properties of Central Asian aerosol relevant for spaceborne lidar applications and aerosol typing at 355 and 532 nm, Atmos. Chem. Phys., 20, 9265–9280, https://doi.org/10.5194/acp-20-9265-2020, 2020.
Hu, Q., Goloub, P., Veselovskii, I., Bravo-Aranda, J.-A., Popovici, I. E., Podvin, T., Haeffelin, M., Lopatin, A., Dubovik, O., Pietras, C., Huang, X., Torres, B., and Chen, C.: Long-range-transported Canadian smoke plumes in the lower stratosphere over northern France, Atmos. Chem. Phys., 19, 1173–1193, https://doi.org/10.5194/acp-19-1173-2019, 2019.
Hughes, D. D., Mampage, C. B. A., Jones, L. M., Liu, Z., and Stone, E. A.: Characterization of Atmospheric Pollen Fragments during Springtime Thunderstorms, Environ. Sci. Technol. Let., 7, 409–414, https://doi.org/10.1021/acs.estlett.0c00213, 2020.
Kanitz, T., Engelmann, R., Heinold, B., Baars, H., Skupin, A., and Ansmann, A.: Tracking the Saharan Air Layer with shipborne lidar across the tropical Atlantic, Geophys. Res. Lett., 41, 1044–1050, https://doi.org/10.1002/2013GL058780, 2014.
Klett, J. D.: Stable analytical solution for processing lidar returns, Appl. Opt., 20, 211–220, 1981.
Mandrioli, P., Negrini, M. G., Cesari, G., and Morgan, G.: Evidence for long range transport of biological and anthropogenic aerosol particles in the atmosphere, Grana, 23, 43–53, https://doi.org/10.1080/00173138409428876, 1984.
Miguel, A. G., Taylor, P. E., House, J., Glovsky, M. M., and Flagan, R. C.: Meteorological Influences on Respirable Fragment Release from Chinese Elm Pollen, Aerosol Sci. Technol., 40, 690–696, https://doi.org/10.1080/02786820600798869, 2006.
Muilenberg, M. L.: Sampling devices, Immunol. Allergy Clin. North Am., 23, 337–355, https://doi.org/10.1016/S0889-8561(03)00030-4, 2003.
Nilsson, S. T., Praglowski, J., and Nilsson, L.: Atlas of airborne pollen grains and spores in northern Europe, Natur och Kultur, Stockholm, 1977.
Noh, M. Y., Müller, D., Lee, H., and Choi, T.: Influence of biogenic pollen on optical properties of atmospheric aerosols observed by lidar over Gwangju, South Korea, Atmos. Environ., 69, 139–147, doi:https://doi.org/10.1016/j.atmosenv.2012.12.018, 2013.
O'Connor, E. J., Illingworth, A. J., Brooks, I. M., Westbrook, C. D., Hogan, R. J., Davies, F., and Brooks, B. J.: A Method for Estimating the Turbulent Kinetic Energy Dissipation Rate from a Vertically Pointing Doppler Lidar, and Independent Evaluation from Balloon-Borne In Situ Measurements, J. Atmos. Ocean. Tech., 27, 1652–1664, https://doi.org/10.1175/2010JTECHA1455.1, 2010.
Pearson, G., Davies, F., and Collier, C.: An Analysis of the Performance of the UFAM Pulsed Doppler Lidar for Observing the Boundary Layer, J. Atmos. Ocean. Tech., 26, 240–250, https://doi.org/10.1175/2008JTECHA1128.1, 2009.
PollyNET: Worldwide observations with the portable Raman lidar systems (Polly), available at: http://picasso.tropos.de/, last access: 17 December 2020.
Rittmeister, F., Ansmann, A., Engelmann, R., Skupin, A., Baars, H., Kanitz, T., and Kinne, S.: Profiling of Saharan dust from the Caribbean to western Africa – Part 1: Layering structures and optical properties from shipborne polarization/Raman lidar observations, Atmos. Chem. Phys., 17, 12963–12983, https://doi.org/10.5194/acp-17-12963-2017, 2017.
Rousseau, D.-D., Schevin, P., Ferrier, J., Jolly, D., Andreasen, T., Ascanius, S. E., Hendriksen, S.-E., and Poulsen, U.: Long-distance pollen transport from North America to Greenland in spring, J. Geophys. Res.-Biogeo., 113, G02013, https://doi.org/10.1029/2007JG000456, 2008.
Sassen, K.: Polarization in lidar, in: Lidar: Range-Resolved Optical Remote Sensing of the Atmosphere, edited by: Weitkamp, C., Springer, 19–42, 2005.
Sassen, K. and Zhu, J.: A global survey of CALIPSO linear depolarization ratios in ice clouds: Initial findings, J. Geophys. Res.-Atmos., 114, D00H07, https://doi.org/10.1029/2009JD012279, 2009.
Schmidt, C. W.: Pollen Overload: Seasonal Allergies in a Changing Climate, Environ. Health Perspect., 124, A70–A75, https://doi.org/10.1289/ehp.124-A70, 2016.
Shang, X., Giannakaki, E., Bohlmann, S., Filioglou, M., Saarto, A., Ruuskanen, A., Leskinen, A., Romakkaniemi, S., and Komppula, M.: Optical characterization of pure pollen types using a multi-wavelength Raman polarization lidar, Atmos. Chem. Phys., 20, 15323–15339, https://doi.org/10.5194/acp-20-15323-2020, 2020.
Shen, W., Ma, L., Zhang, X., Li, X., Zhao, Y., Jing, Y., Feng, Y., Tan, X., Sun, F., and Lin, J.: Three-dimensional reconstruction of Picea wilsonii Mast. pollen grains using automated electron microscopy, Sci. China Life Sci., 63, 171–179, https://doi.org/10.1007/s11427-019-9820-4, 2020.
Shukla, A. K., Vijayaraghavan, M. R., and Chaudhry, B.: Biology of Pollen, APH Publishing Corporation, 133 pp., ISBN 9788170249245, 1998.
Skjøth, C. A., Sommer, J., Stach, A., Smith, M., and Brandt, J.: The long-range transport of birch (Betula) pollen from Poland and Germany causes significant pre-season concentrations in Denmark, Clin. Exp. Allergy, 37, 1204–1212, https://doi.org/10.1111/j.1365-2222.2007.02771.x, 2007.
Steiner, A. L., Brooks, S. D., Deng, C., Thornton, D. C. O., Pendleton, M. W., and Bryant, V.: Pollen as atmospheric cloud condensation nuclei, Geophys. Res. Lett., 42, 3596–3602, https://doi.org/10.1002/2015GL064060, 2015.
Szczepanek, K., Myszkowska, D., Worobiec, E., Piotrowicz, K., Ziemianin, M., and Bielec-Bąkowska, Z.: The long-range transport of Pinaceae pollen: an example in Kraków (southern Poland), Aerobiologia, 33, 109–125, https://doi.org/10.1007/s10453-016-9454-2, 2017.
Taylor, P. E., Flagan, R. C., Valenta, R., and Glovsky, M. M.: Release of allergens as respirable aerosols: A link between grass pollen and asthma, J. Allergy Clin. Immunol., 109, 51–56, https://doi.org/10.1067/mai.2002.120759, 2002.
Taylor, P. E., Flagan, R. C., Miguel, A. G., Valenta, R., and Glovsky, M. M.: Birch pollen rupture and the release of aerosols of respirable allergens, Clin. Exp. Allergy, 34, 1591–1596, https://doi.org/10.1111/j.1365-2222.2004.02078.x, 2004.
Tesche, M., Groß, S., Ansmann, A., Müller, D., Althausen, D., Freudenthaler, V., and Esselborn, M.: Profiling of Saharan dust and biomass-burning smoke with multiwavelength polarization Raman lidar at Cape Verde, Tellus B, 63, 649–676, 2011.
Tsekeri, A., Lopatin, A., Amiridis, V., Marinou, E., Igloffstein, J., Siomos, N., Solomos, S., Kokkalis, P., Engelmann, R., Baars, H., Gratsea, M., Raptis, P. I., Binietoglou, I., Mihalopoulos, N., Kalivitis, N., Kouvarakis, G., Bartsotas, N., Kallos, G., Basart, S., Schuettemeyer, D., Wandinger, U., Ansmann, A., Chaikovsky, A. P., and Dubovik, O.: GARRLiC and LIRIC: strengths and limitations for the characterization of dust and marine particles along with their mixtures, Atmos. Meas. Tech., 10, 4995–5016, https://doi.org/10.5194/amt-10-4995-2017, 2017.
Vakkari, V., Manninen, A. J., O'Connor, E. J., Schween, J. H., van Zyl, P. G., and Marinou, E.: A novel post-processing algorithm for Halo Doppler lidars, Atmos. Meas. Tech., 12, 839–852, https://doi.org/10.5194/amt-12-839-2019, 2019.
Vakkari, V., Baars, H., Bohlmann, S., Bühl, J., Komppula, M., Mamouri, R.-E., and O'Connor, E. J.: Aerosol particle depolarization ratio at 1565 nm measured with a Halo Doppler lidar, Atmos. Chem. Phys., 21, 5807–5820, https://doi.org/10.5194/acp-21-5807-2021, 2021.
Veselovskii, I., Goloub, P., Podvin, T., Bovchaliuk, V., Derimian, Y., Augustin, P., Fourmentin, M., Tanre, D., Korenskiy, M., Whiteman, D. N., Diallo, A., Ndiaye, T., Kolgotin, A., and Dubovik, O.: Retrieval of optical and physical properties of African dust from multiwavelength Raman lidar measurements during the SHADOW campaign in Senegal, Atmos. Chem. Phys., 16, 7013–7028, https://doi.org/10.5194/acp-16-7013-2016, 2016.
Visez, N., Chassard, G., Azarkan, N., Naas, O., Sénéchal, H., Sutra, J.-P., Poncet, P., and Choël, M.: Wind-induced mechanical rupture of birch pollen: Potential implications for allergen dispersal, J. Aerosol Sci., 89, 77–84, https://doi.org/10.1016/j.jaerosci.2015.07.005, 2015.
Voudouri, K. A., Giannakaki, E., Komppula, M., and Balis, D.: Variability in cirrus cloud properties using a PollyXT Raman lidar over high and tropical latitudes, Atmos. Chem. Phys., 20, 4427–4444, https://doi.org/10.5194/acp-20-4427-2020, 2020.
Wang, R. and Dobritsa, A. A.: Exine and Aperture Patterns on the Pollen Surface: Their Formation and Roles in Plant Reproduction, in: Annual Plant Reviews online, edited by: Roberts, J. A., 589–628, https://doi.org/10.1002/9781119312994.apr0625, 2018.
Wozniak, M. C., Solmon, F., and Steiner, A. L.: Pollen Rupture and Its Impact on Precipitation in Clean Continental Conditions, Geophys. Res. Lett., 45, 7156–7164, https://doi.org/10.1029/2018GL077692, 2018.
Ziska, L. H. and Beggs, P. J.: Anthropogenic climate change and allergen exposure: The role of plant biology, J. Allergy Clin. Immunol., 129, 27–32, doi:https://doi.org/10.1016/j.jaci.2011.10.032, 2012.


