the Creative Commons Attribution 4.0 License.
the Creative Commons Attribution 4.0 License.
 | 07 May 2021
Enhancement of nanoparticle formation and growth during the COVID-19 lockdown period in urban Beijing
Xiaojing Shen
Junying Sun
Fangqun Yu
Ying Wang
Junting Zhong
Yangmei Zhang
Xinyao Hu
Can Xia
Sinan Zhang
Xiaoye Zhang
Influenced by the spread of the global 2019 novel coronavirus (COVID-19) pandemic, primary emissions of particles and precursors associated with anthropogenic activities decreased significantly in China during the Chinese New Year of 2020 and the lockdown period (24 January–16 February 2020). The 2-month measurements of the number size distribution of neutral particles and charged ions showed that during the lockdown (LCD) period, the number concentration of particles smaller than 100 nm decreased by approximately 40 % compared to the pre-LCD period in January. However, the accumulation mode particles increased by approximately 20 % as several polluted episodes contributed to secondary aerosol formation. In this study, new particle formation (NPF) events were found to be enhanced in the nucleation and growth processes during the LCD period, as indicated by the higher formation rate of 2 nm particles (J2) and the subsequent growth rate (GR). The relevant precursors, e.g., SO2 and NO2, showed a clear reduction, and O3 increased by 80 % during LCD period, as compared with pre-LCD. The volatile organic vapors showed different trends due to their sources. The proxy sulfuric acid during the LCD period increased by approximately 26 %, as compared with pre-LCD. The major oxidants (O3, OH, and NO3) of VOCs were also found to be elevated during LCD. That indicated higher J2 and GR (especially below 5 nm) during the LCD period were favored by the increased concentration level of condensing vapors and decreased condensation sink. Several heavy haze episodes have been reported by other studies during the LCD period; however, the increase in nanoparticle number concentration should also be considered. Some typical NPF events produced a high number concentration of nanoparticles that intensified in the following days to create severe aerosol pollution under unfavorable meteorological conditions. Our study confirms a significant enhancement of the nucleation and growth process of nanoparticles during the COVID-19 LCD in Beijing and highlights the necessity of controlling nanoparticles in current and future air quality management.
- Article
(5377 KB) - Full-text XML
-
Supplement
(344 KB) - BibTeX
- EndNote


As a response to the outbreak of the 2019 novel coronavirus (COVID-19), the Chinese government implemented restrictions on population movement in February 2020; the period during which the restrictions were enforced was also called the lockdown (LCD) period. During the LCD period, the NOx emission was reduced by approximately 50 % in China, as retrieved by the satellite (Zhang et al., 2021) and ground-based measurements (Huang et al., 2021). The number concentration of Aitken mode particles (∼ 25–100 nm), which is related to the traffic emissions (Deventer et al., 2018), is also expected to decrease. The significant decrease in aerosol and precursor emissions during LCD is associated with reduced human and economic activities. However, several heavy haze pollution periods occurred in the Yangtze River Delta (YRD) and the Beijing–Tianjin–Hebei (BTH) region. Secondary particles contributed significantly to air pollution, and NOx reduction favored increased ozone and atmospheric oxidizing capacity (Huang et al., 2021). The aerosol heterogeneous reaction process was also enhanced by the anomalously high humidity in northern China (Le et al., 2020). Furthermore, particle accumulation could also be favored by stagnant airflow and vertical meteorological conditions during LCD (Zhong et al., 2018).
New particle formation (NPF) has been an active global research topic for the last two decades because of its potential climatic implications (Kulmala et al., 2004). Nucleated particles can reach number concentrations of 104–106 cm−3. Subsequent growth contributes significantly to cloud condensation nuclei (CCN) (Kerminen et al., 2012) and can cause air pollution (Guo et al., 2014). Primary emissions of particulate matter (PM), CO, SO2, and NO2 decreased significantly after the strict clear-air action plans were implemented in the last decade by the Beijing government (Zhang et al., 2019). Changes in SO2 and background aerosols, the key factors influencing NPF events, are also linked to the formation (J) and growth rate (GR) of secondary particles (Kyrö et al., 2014). Nanoparticles (diameter ≤ 100 nm) make minor particle mass contributions but pose a serious risk to human health because of high number concentrations and deep respiratory and cardiovascular system penetration (Kawanaka et al., 2009). However, the size-resolved, chemical, and toxicological properties of nanoparticles are unclear (Jin et al., 2017). Under unfavorable meteorological conditions, the growth of the nanoparticles for several consecutive days would even probably lead to particle mass enhancement as found in Beijing, China (Guo et al., 2014).
In a previous study, the influence of NPF event occurrence by emission reduction in Beijing was analyzed for China's Victory Day parade in August 2015 and for the summer Olympics in 2008; during this period, higher NPF occurrence frequency but lower J and GR was reported as a result of low precursor concentrations (Shen et al., 2016). In the present study, we focus on changes in particle number size distribution and NPF events during LCD in Beijing and the influencing factors. The link between NPF events and regional aerosol pollution is also explored. Our study will facilitate the optimization of regulatory measures to control particle and gas pollution in China, especially with regard to the variation of NPF-associated condensing vapors caused by reduced precursor emissions and elevated atmospheric oxidizing level.
2.1 Measurements
The particle and ion number size distribution measurements were conducted on the roof of the Chinese Academy of Meteorological Sciences (CAMS) building on the Chinese Meteorological Administration campus between January and February 2020. The site is approximately 53 m above ground level and located in the western Beijing urban area between the second and third ring roads. A major road with heavy traffic to the west of the site indicated that the sample air could be influenced by traffic emissions. More information about the site can be found in X. Wang et al. (2018).
2.2 Instrumentation
The number of particles of sizes 10–850 nm was measured using a scanning mobility particle sizer (SMPS, TROPOS, Germany). The system is a combination of a differential mobility analyzer (DMA) and a condensation particle counter (CPC, Model 3772, TSI Inc., USA). The mobility distribution of naturally charged and neutral nanoparticles is measured by a neutral cluster and air ion spectrometer (NAIS) with a 10 min time resolution (Mirme et al., 2007; Mirme and Mirme, 2013). The measured mobility was in the range 3.3–0.0013 cm2 V−1 s−1, corresponding to mobility diameters of 0.8–42 nm. Positive and negative ions were simultaneously classified by two cylindrical DMAs and detected with 21 electrometers on the outer cylinder. A high sample flow rate of 60 L min−1 was used to minimize diffusion losses. In ion mode, the detected signal is inverted to a mobility distribution consisting of 28 bins, taking into account the measured background and experimentally determined diffusion losses. In neutral particle mode, the sample aerosol is charged using corona chargers, and the charged fraction is calculated (Fuchs, 1963). However, the lowest detection limit for the NAIS in the neutral particle mode (approximately 2 nm) was affected by the corona-generated ions (Asmi et al., 2009; Manninen et al., 2011). The lowest detection limit of the NAIS in ion mode was determined by the charging probability, nanoparticle concentration, and charger ion mobility (Kulmala et al., 2013).
Volatile organic compounds (VOCs) were measured using a proton-transfer-reaction time-of-flight mass spectrometer (PTR-ToF-MS 8000, IONICON) with a hydronium ion (H3O+) source at CAMS site. About 30 kinds of compounds could be detected by the PTR-ToF-MS, by using the linear regression multipoint calibrations (Yuan et al., 2017). In this study, the mixing ratio of isoprene and major C6–C9 VOCs were derived with 1 h time resolution, as they are good indicators of anthropogenic VOC plumes (Dai et al., 2017).
The mass concentrations of PM2.5, precursor gases of O3, SO2, NO2, and CO at the GuanYuan air quality monitoring site were derived from the China National Environmental Monitoring Center (CNEMC, http://www.cnemc.cn, last access: 5 May 2021), which is 3 km from the CAMS site. The global radiation at the observatory (54 511) in the southern Beijing urban area was used to estimate the sulfuric acid in this work. The solar radiation datasets were provided by the National Meteorological Information Center of the China Meteorological Administration. The meteorological factors used in this study – wind speed (WS), wind direction (WD), and relative humidity (RH) – were derived from the Haidian National Basic Meteorological Station (54399). The data can represent meteorological conditions at the CAMS site, which is located ∼ 5 km northwest of the urban area site.
2.3 NPF parameter calculation
The total particle and ion formation rate at 2 nm (J2,tot and J2,ion) can be calculated from the particle and ion number concentrations in the size range 2–3 nm (Hirsikko et al., 2011; Manninen et al., 2010). J2,tot and J2,ion included time changes in the concentration of 2–3 nm particles or ions (first term on the right side of Eqs. 1 and 2), coagulation loss of 2–3 nm particles or ions with the pre-existing particles derived by SMPS (second term), and growth of 2–3 nm particles or ions into larger sizes by the GR (third term). In Eq. (2), the fourth and fifth terms represent loss due to ion–ion recombination and formation from ion-neutral attachment. The equations are given by the following formulas:
N2–3,tot and are the number concentration of particles and ions of positive and negative charges, respectively. CoagS2 is the 2 nm coagulation coefficient. α and β (the ion–ion recombination and ion-neutral attachment coefficients, respectively) are assumed to be 1.6 × 10⁻⁶ and 10−8 cm3 s−1, respectively (Hoppel, 1985).
GR is defined as the rate of change of diameter with time, GR = (, given in nm h−1, where Dp,1 and Dp,2 are the geometric mean diameters (GMDs) when the nucleated particles start and stop growing, respectively. GMDs are derived by the log-normal modal fitting of the particle and ion number size distributions (Hussein et al., 2009).
Sulfuric acid (H2SO4) is a key component in the nucleation process (Kulmala et al., 2013). The concentration of H2SO4 was not measured directly in this study, and different proxy methods were used to derive the proxy sulfuric acid. One of these methods (Eq. 3) depends on the global radiation (Glob_R), SO2, and condensation sink (CS) and is developed according to the previous study conducted in a forest site, Hyytiälä, Finland (Petäjä et al., 2009).
where k is the empirically derived factor and well correlated with Glob_R (k = 1.4 × 10⁻⁷ × Glob_R−0.7, unit: m2 W−1 s−1). The proxy equation is site-specific due to the different atmospheric conditions. In a polluted atmosphere, such as in Beijing, several proxy methods were also constructed based on a number of available atmospheric parameters (Lu et al., 2019). In this study, the simplest proxy (Eq. 4) with the best performance (Eq. 5) recommended by Lu et al. (2019) is adopted to derive the proxy sulfuric acid.
[H2SO4] is the gaseous sulfuric acid with the unit of molecules cm−3. [SO2], [O3], and [NOx] are the concentrations of sulfur dioxide, ozone, and nitrogen oxides, with the unit of molecules cm−3. UVB is the intensity of ultraviolet radiation b in W m−2. CS is the condensation sink, which describes how fast the vapor molecules condense on the existing particles (Dal Maso et al., 2002), with the unit of s−1. The proxy method has been validated by comparing the measured sulfuric acid with a high correlation coefficient of 0.86 (Lu et al., 2019), based on the field campaign conducted approximately 2 km away from the CAMS site. Although the direct measurement of UVB was not available, it had been reported by Hu et al. (2013) that the monthly average of the ratio of UVB to global radiation (Glob_R) ranged from 0.007 % to 0.017 % in Beijing. And in this study, the average ratio of January and February (0.008 %) was applied to derive UVB by 0.008 % × Glob_R. The covariance of CS and SO2 was found (correlation coefficient R=0.83) that offset the dependence of sulfuric acid on CS by Lu et al. (2019). However, the anthropogenic emission sharply decreased during LCD in this study, and R was 0.45 for SO2 and CS. To minimize the uncertainty of H2SO4 proxy, the average value of three calculation methods was applied for the further analysis.
2.4 Typical NPF event identification
NPF events are identified and different nucleation types are characterized based on the daily evolution of particle number size distribution (PNSD). The burst of nucleation mode particles with diameter ≤ 25 nm appeared in the PNSD, and the burst should prevail over a few hours with clear growth process (Dal Maso et al., 2005). Regional NPF events can occur over a geographically large area and extend over several hundred kilometers (Shen et al., 2018). Such events indicate regional cases in which freshly nucleated particles can reach the size of CCN (Shen et al., 2011).
2.5 Back trajectory analysis
In order to reveal the meteorological condition during the pollution case formation, the 48 h backward trajectories arriving at CAMS site were calculated at 12:00 LT during 4–14 February for the case study, terminating at the height of 500 m above ground level by applying the Trajstat Software, combined with the HYSPLIT 4 model (Hybrid Single-Particle Lagrangian Integrated Trajectory) and using the NCEP GDAS (Global Data Assimilation System) data with 1∘ × 1∘ resolution (Draxler and Hess, 1998; Wang et al., 2009).
3.1 The meteorological conditions
The meteorological parameters during the LCD period, January and February 2020, as well as the average conditions of January and February 2016–2020 were analyzed and the diurnal pattern was given (Fig. 1). It showed much higher RH, lower WS, slightly higher T, and lower pressure during LCD (January and February 2020) than that of 5-year climatology average condition (January and February 2016–2020). The anomaly of monthly mean sea level pressure in January and February between 2020 and 2016–2020 was analyzed based on the ECMWF reanalysis dataset (ERA5, https://cds.climate.copernicus.eu/, last access: 6 May 2021), as given in the Supplement (Fig. S1). It showed a negative anomaly in the BTH region, indicating the air pressure decreased in January and February 2020, as compared with the corresponding period of the 5-year climatology. The local air convergence resulted in high RH and low WS, which favored the air pollutants accumulating (Zhong et al., 2018). The unfavorable meteorological trapped moisture and pollutants near the ground could thus offset substantial emissions reductions during COVID-19 LCD to some extent.
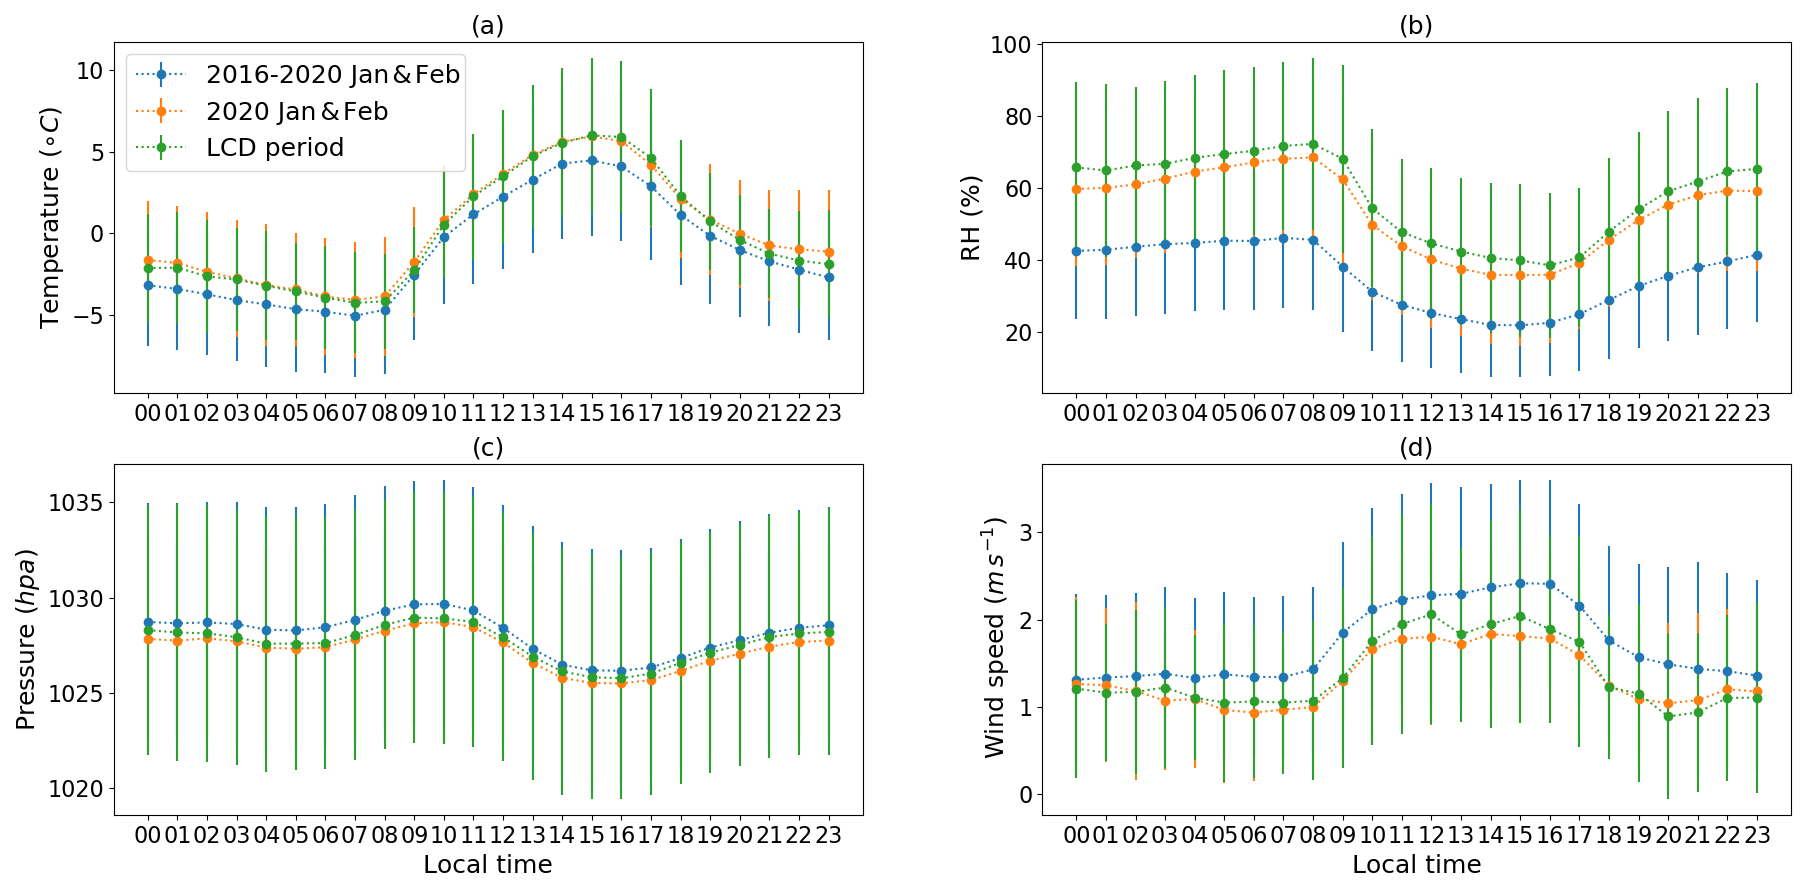
Figure 1The mean diurnal pattern of meteorological parameters, including temperature (a), RH (b), sea level pressure (c), and wind speed (d) during the LCD period (24 January–16 February 2020), January and February 2020, and January and February 2016–2020. The solid circles and bars represent the mean value and the standard deviation, respectively.
3.2 Overview of the NSD of particles and charged ions
Figure 2 shows the time evolution of the number size distribution (NSD) of particles in the 10–850 nm range, neutral particles (2–42 nm), and charged ions (0.8–42 nm) in January and February 2020. The dataset was classified into the COVID-19 LCD (24 January–16 February 2020), pre-LCD period (3–23 January 2020), and post-LCD (17–29 February 2020) periods to reveal the influence of emission reductions. The NPF event occurred on 10 out of 23 d during pre-LCD, 10 out of 24 d in LCD, and 5 out of 13 d in post-LCD, respectively. Poisson statistics was conducted for NPF event occurrence probability for pre-LCD, LCD, and post-LCD periods as given in Fig. S2 in the Supplement. It showed slight variation of NPF event occurrence probability, as compared with pre-LCD and LCD periods. Despite the large primary emissions reduction, several cases of heavy aerosol pollution events occurred in the BTH region during LCD. Particle matter below 2.5 µm (PM2.5) mass concentration at air monitoring sites in Beijing at the Ministry of Ecology and Environment of China exceeded 75 µg m−3 (the second grade of the Ambient Air Quality Standard of China) on 12 of the 28 d, which were identified as polluted conditions. The elevated PM mass concentration was attributed to the secondary aerosol formation process; this process was aided by the enhanced oxidizing capacity caused by increased ozone levels (Huang et al., 2021).
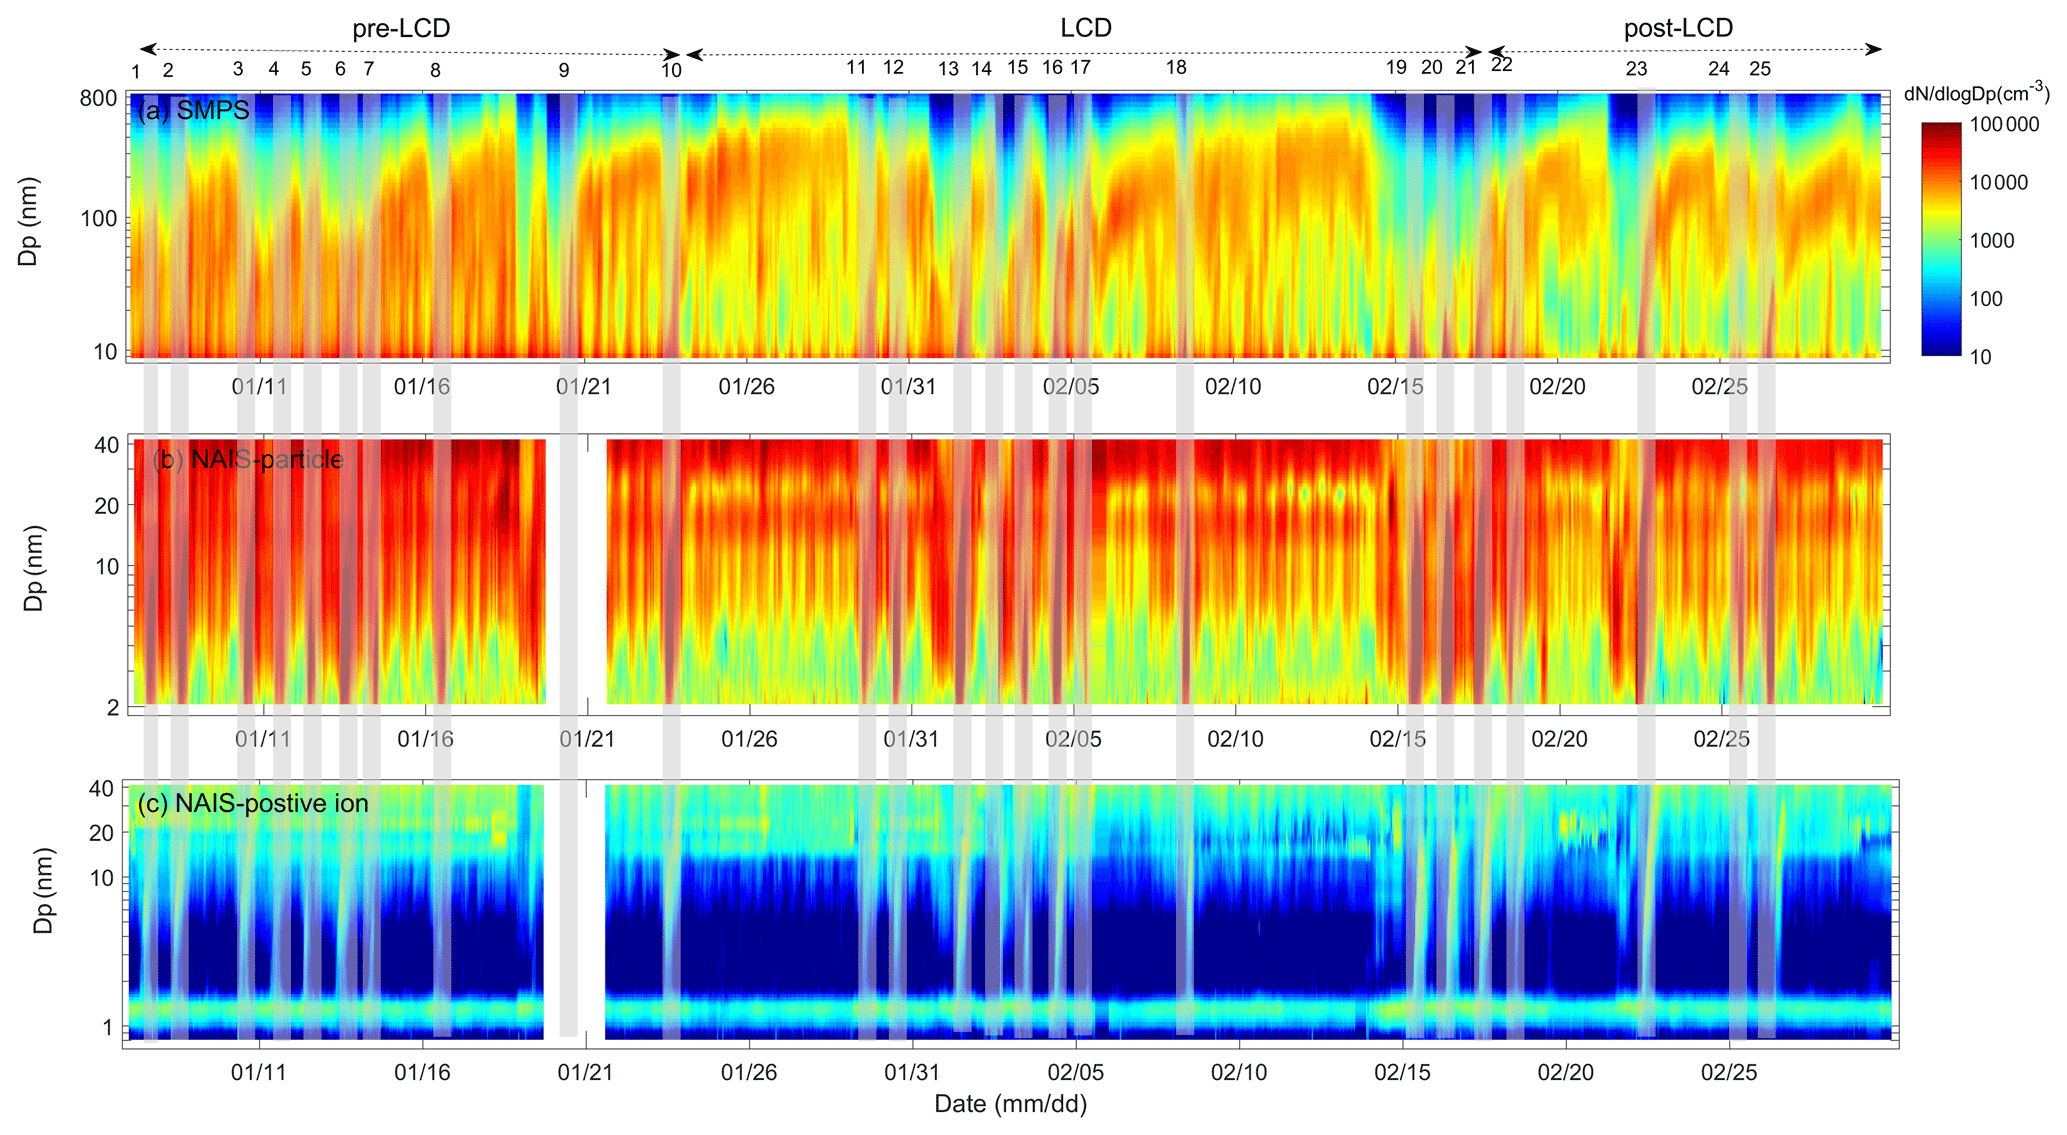
Figure 2Time evolution of number size distribution of 10–850 nm particles by SMPS (a), neutral 2–42 nm particles by NAIS in positive particle mode (b), and positive 0.8–42 nm ions by NAIS (c). NPF events were marked by numbers from 1–25.

Figure 3Time series of hourly mean of the number concentrations for different size ranges, including 25–100 and 100–850 nm from SMPS data (a), 2–10 nm particles from NAIS and 10–25 nm particles from both NAIS and SMPS (b), and 1–10 nm and 10–25 nm positive ions from NAIS (c).
The particle number concentrations of the Aitken mode (25–100 nm, N25–100 nm) and the accumulation mode (100–850 nm, N100–850 nm) derived by SMPS and the nucleation mode (≤ 25 nm) of neutral particles and charged ions by NAIS were given in Fig. 3 and discussed in detail in the following. The Aitken mode showed a significant reduction since the Chinese New Year (24 January) and normal fluctuations below 3000 cm−3 during LCD and post-LCD. Mean N25–100 concentrations were 4040±1590, 2400±1170, and 2170±994 cm−3 during pre-LCD, LCD, and post-LCD, respectively. Aitken mode particles were closely related to the anthropogenic emissions and reduced by approximately 40 %. During post-LCD, the Aitken mode concentration remained low because people were encouraged to work at home and services were almost shut down. Accumulation mode particles usually undergo coagulation, condensation, heterogeneous reactions, and long-range transport processes that can reflect regional polluted conditions. N100–850 nm concentrations were 1820±1190, 2200±1320, and 1850±840 cm−3 during pre-LCD, LCD, and post-LCD, respectively; the 20 % increase during LCD (compared with pre-LCD) occurred despite large emissions reductions and was related to specific pollution episodes that occurred from 24–26 January and 12–14 February. The particle number concentration derived from SMPS is probably lower than that from NAIS in the overlap size range of 20–40 nm, because the overestimation of natural particle concentration as a multiple charge effect above 20 nm is beyond the instrumental detection limit (Gagné et al., 2011). In this study, the number concentration of 20–40 nm was integrated by the SMPS and NAIS particle mode (N20–40 nm,smps and N20–40 nm,nais) with an enhancement factor () of 1.65±0.06, and the number concentration of particles larger than 20 nm derived by SMPS was more accurate.
The nucleation mode () derived from NAIS was separated into ≤ 10 and 10–25 nm for neutral particles (Npar,nais,2–10 nm, Npar,nais,10–25 nm) and positively charged ions (Nion,nais,1–10 nm, Nion,nais,10–25 nm), respectively. Npar,nais,2–10 nm was the primary contributor to the nucleation mode, which was determined by NPF events, during which average peak concentrations were 104, 104, and 104 cm−3, during pre-LCD, LCD, and post-LCD, respectively (Fig. 3b). The number concentration of 10–25 nm particles could also be derived from SMPS (Npar,smps,10–25 nm), which was also given in Fig. 3b and approximately 30 % lower than the value of Npar,nais,10–25 nm. showed large variation because of significant differences between NPF and non-NPF days. However, several cases during LCD showed a significantly high peak Npar,2–10 nm value (Fig. 3c), indicating the probability of the stronger nucleation process during LCD. The positive and negative ion number concentrations of 0.8–42 nm were 457±245 and 496±265 cm−3, respectively. The mean values of Nion,nais,1–10 nm and Nion,nais,10–25 nm ranged from 100–200 cm−3, indicating a minor contribution to the total particle count.
3.3 NPF event variation
Table 1 provides the key parameters describing NPF events, including NPF days and available measurement days, CS, J2, and GR for total particles and charged ions. Higher J2 and GR values for particles and ions were also found during LCD and post-LCD than during pre-LCD. However, the emissions control period during the China Victory Day Parade in Beijing in 2015 (20 August–3 September) featured higher frequency and decreasing J3 and GR trends compared with the corresponding month in 2010–2013 (Shen et al., 2016). J3 represented the formation rate at 3 nm calculated from the particle number concentration of 3–4 nm particles by Eq. (1), as the lowest detection limit of SMPS applied in 2015 and the 2010–2013 campaign was 3 nm. That indicated the factors influencing the NPF event, including precursors, pre-existing particles, and meteorological conditions, were complex and should be evaluated further. The daily mean value of NO2 decreased by ∼ 35 % and SO2 decreased by ∼ 13 %, whereas O3 increased by 80 % during LCD as compared to pre-LCD in this work (Fig. 4). The probability density function (PDF) was analyzed for hourly SO2, NO2, and O3 during pre-LCD, LCD, and post-LCD, respectively, and the result was given in the Supplement (Fig. S3). It also showed a significant decreasing trend of NO2 but an increasing trend of O3 as compared with pre-LCD and LCD post-LCD. However, the variation of SO2 among different periods was not clear, as the SO2 concentration remained low due to the emission control in these years. Previous studies had indicated that NOx suppressed NPF events by influencing the formation of highly oxidized VOCs, which participated in nucleation and initial particle growth (Lehtipalo et al., 2018; Yan et al., 2016, 2020), suggesting that the reduction of NO2 during LCD provided favorable conditions for particle growth.
Table 1Parameters characterizing NPF events during pre-LCD, LCD, and post-LCD, including NPF frequency, formation rate (J2,par, J2,pos_ion, J2,neg_ion), and growth rate (GR2,par, GRpos_ion, GRneg_ion) of the total particles and charge ions, as well as condensation sink (CS).
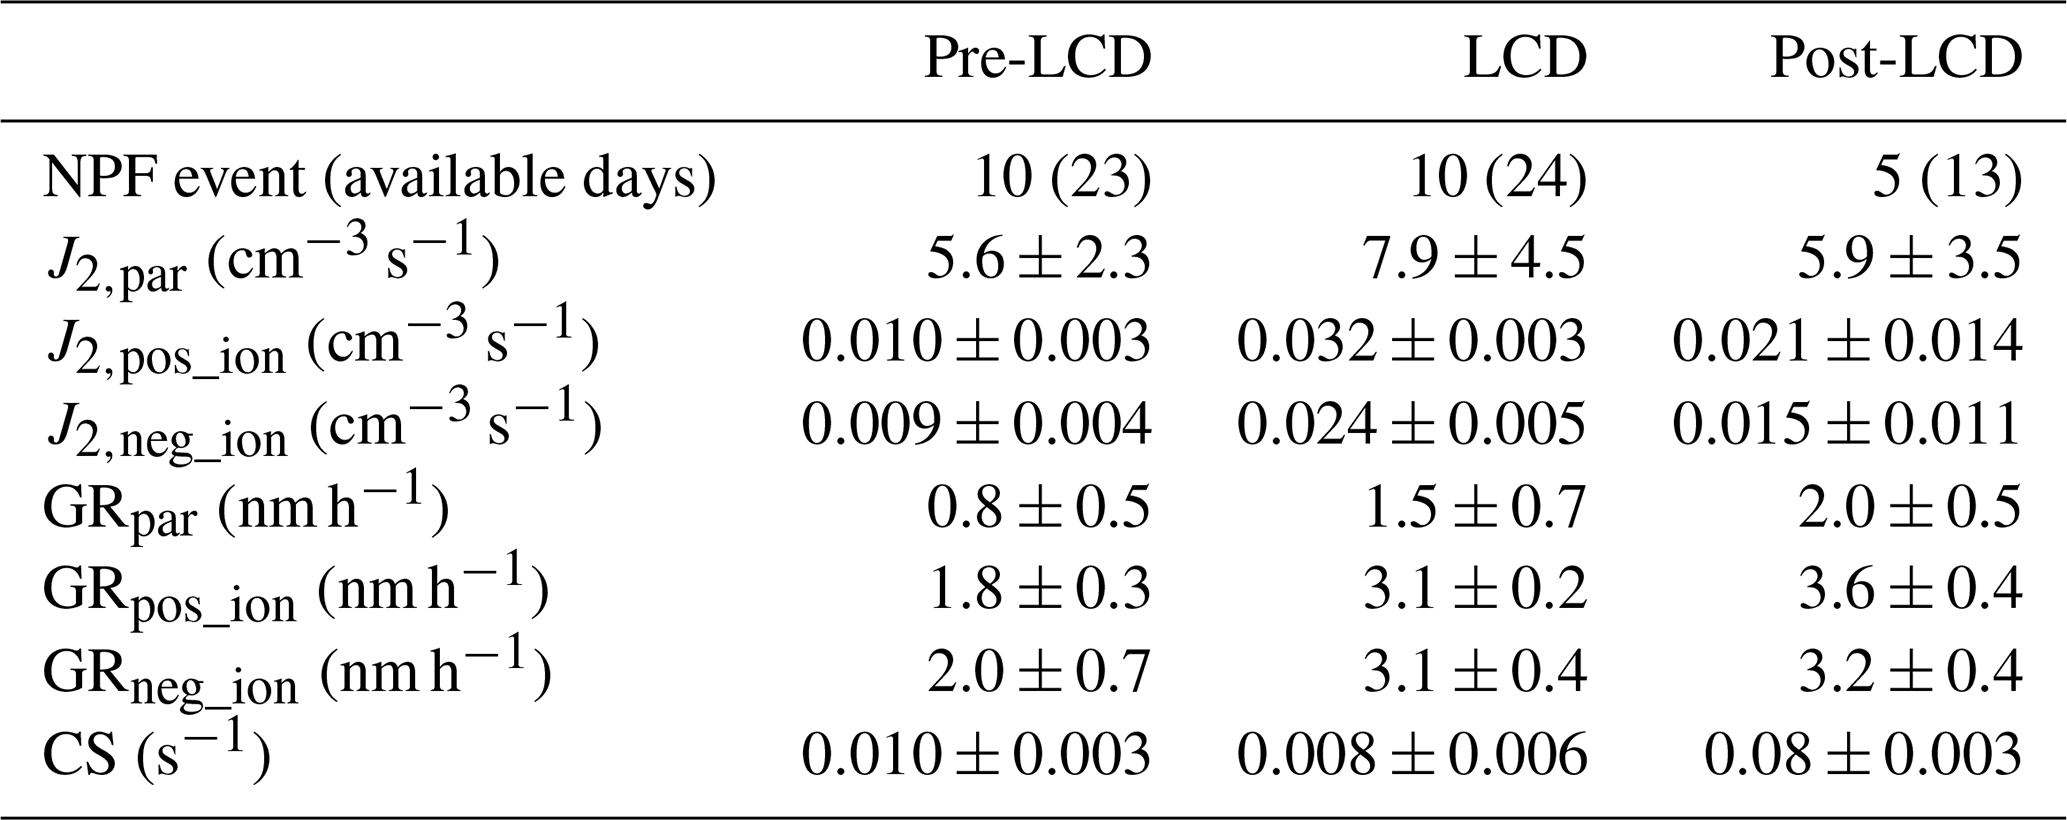

Figure 4Concentration level of PM2.5 mass concentration (a) and precursors (b), including NO2, SO2, and O3 during the measurement period. The circle and bar indicate the mean and standard deviation, respectively; NPF days are marked with continuous numbers 1–25.

Figure 5Time series of isoprene, benzene, toluene, and C8 and C9 aromatics (a–e) during 5 January to 15 February, and the probability distribution function of mixing ration of each VOC component (f–j), respectively.
In this work, five kinds of VOCs (isoprene, benzene, toluene, and C8 and C9 aromatics) are discussed, which are the indicators of anthropogenic VOC and also could be oxidized to contribute to the growth process (Dai et al., 2017). The result (Fig. 5) showed C8 and C9 aromatics decreased by approximately 20 % and 8 % during the LCD as compared with pre-LCD; however, isoprene and toluene slightly changed, benzene increased by approximately 21 % during LCD period. It also suggested the VOCs we focused on did not show the reduction rate as 45 % as Huang et al. (2021) reported in the BTH region. The major oxidized VOCs formation pathways are the oxidation by O3, OH, and NO3 radicals (Ehn et al., 2012). As mentioned above, O3 increased by 80 % during the LCD period. We used Glob_R as a simple proxy of OH, and Glob_R increased by ∼ 24 % during LCD as compared with pre-LCD, as given in the Supplement (Fig. S4). NO3 oxidation of nocturnal biogenic VOCs is also an important pathway of secondary organic aerosol formation in Beijing (H. Wang et al., 2018). NO3 is predominantly formed by the reaction of NO2 with O3 (), and we applied [NO2] × [O3] to estimate the NO3 production. It showed the [NO2] × [O3] term increased by ∼ 40 % during LCD period. Based on the above discussion, it showed the variations of precursors, solar radiation, and CS could finally influence NPF by photochemical reactions with VOCs and sulfuric acid production, promoting the nucleation and growth process.
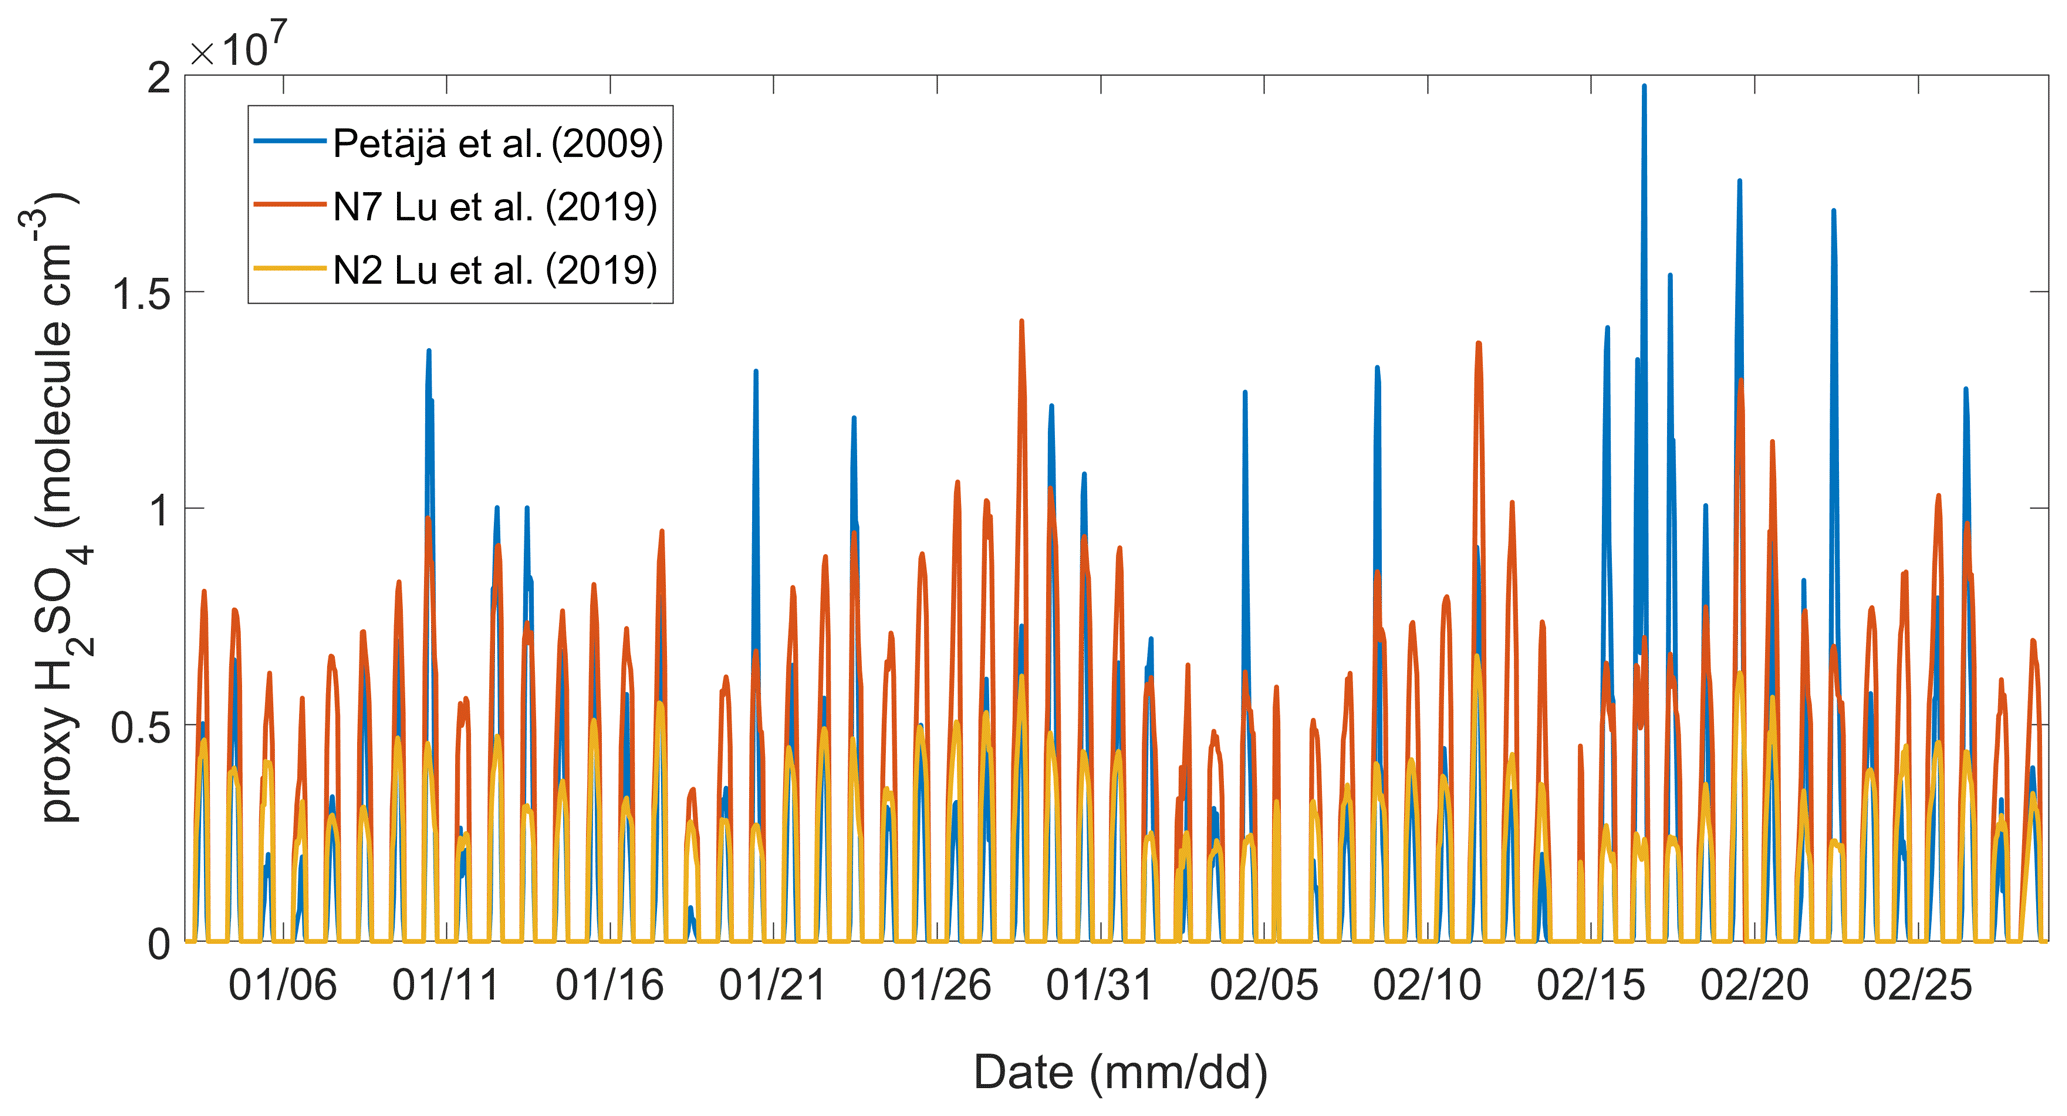
Figure 6The sulfuric acid concentrations derived by different proxy equations. The red and orange lines indicate the result of the N2 and N7 methods by Lu et al. (2019), and the blue line indicates the calculation result based on the method recommended by Petäjä et al. (2009).
The H2SO4 proxy were derived according to Eqs. (3)–(5) as given in Fig. 6, and the mean value of the three methods was discussed. For LCD and pre-LCD during the NPF event occurrence (09:00–16:00 LT), CS decreased by ∼ 25 % and Glob_R increased by ∼ 40 %, whereas SO2 decreased by ∼ 28 %. The variations of these variables finally lead to a H2SO4 increase of ∼ 26 %. The formation of sulfuric acid was aided by the enhanced atmospheric oxidizing capacity because of elevated O3 concentration during LCD, which had also been validated in the previous study in Nanjing, YRD, China (Huang et al., 2021). The H2SO4 proxy was correlated with J2,tot and GR, with the R value of 0.62 for J2,tot and the H2SO4, and 0.45 for GR and the H2SO4, respectively. Based on the NAIS data of the neutral particle mode, the hourly mean geometric mean diameter of the nucleation mode (Dp,nuc) was fitted to show the growth process and its relationship with proxy H2SO4 (Fig. 7). It also revealed that in the initial growth process ( nm), Dp,nuc increased positively with the H2SO4 proxy. Furthermore, GR in the size range of 3–5 nm was slightly higher during LCD and post-LCD, as compared with pre-LCD, indicating the enhanced effect of sulfuric acid on the initial growth of the nucleated particles. However, when the nucleated particles grew into the larger sizes (> 5 nm), the H2SO4 proxy decreased, which is probably related to the weak solar radiation in late afternoon and could not explain the continuous growth, and the oxidized VOCs could be the main contributor. The non-linear dependence of J2,tot and GR on the condensing vapors indicates a complex mechanism in the multi-component nucleation and growth system. Stolzenburg et al. (2020) revealed that sulfuric acid played an important role in smaller growth processes from 2–10 nm; however, they could not explain condensational growth when the nucleated particles overcame 10 nm. For particles larger than 10 nm, low volatile organic vapors should contribute to growth (Kontkanen et al., 2018; Yan et al., 2020).
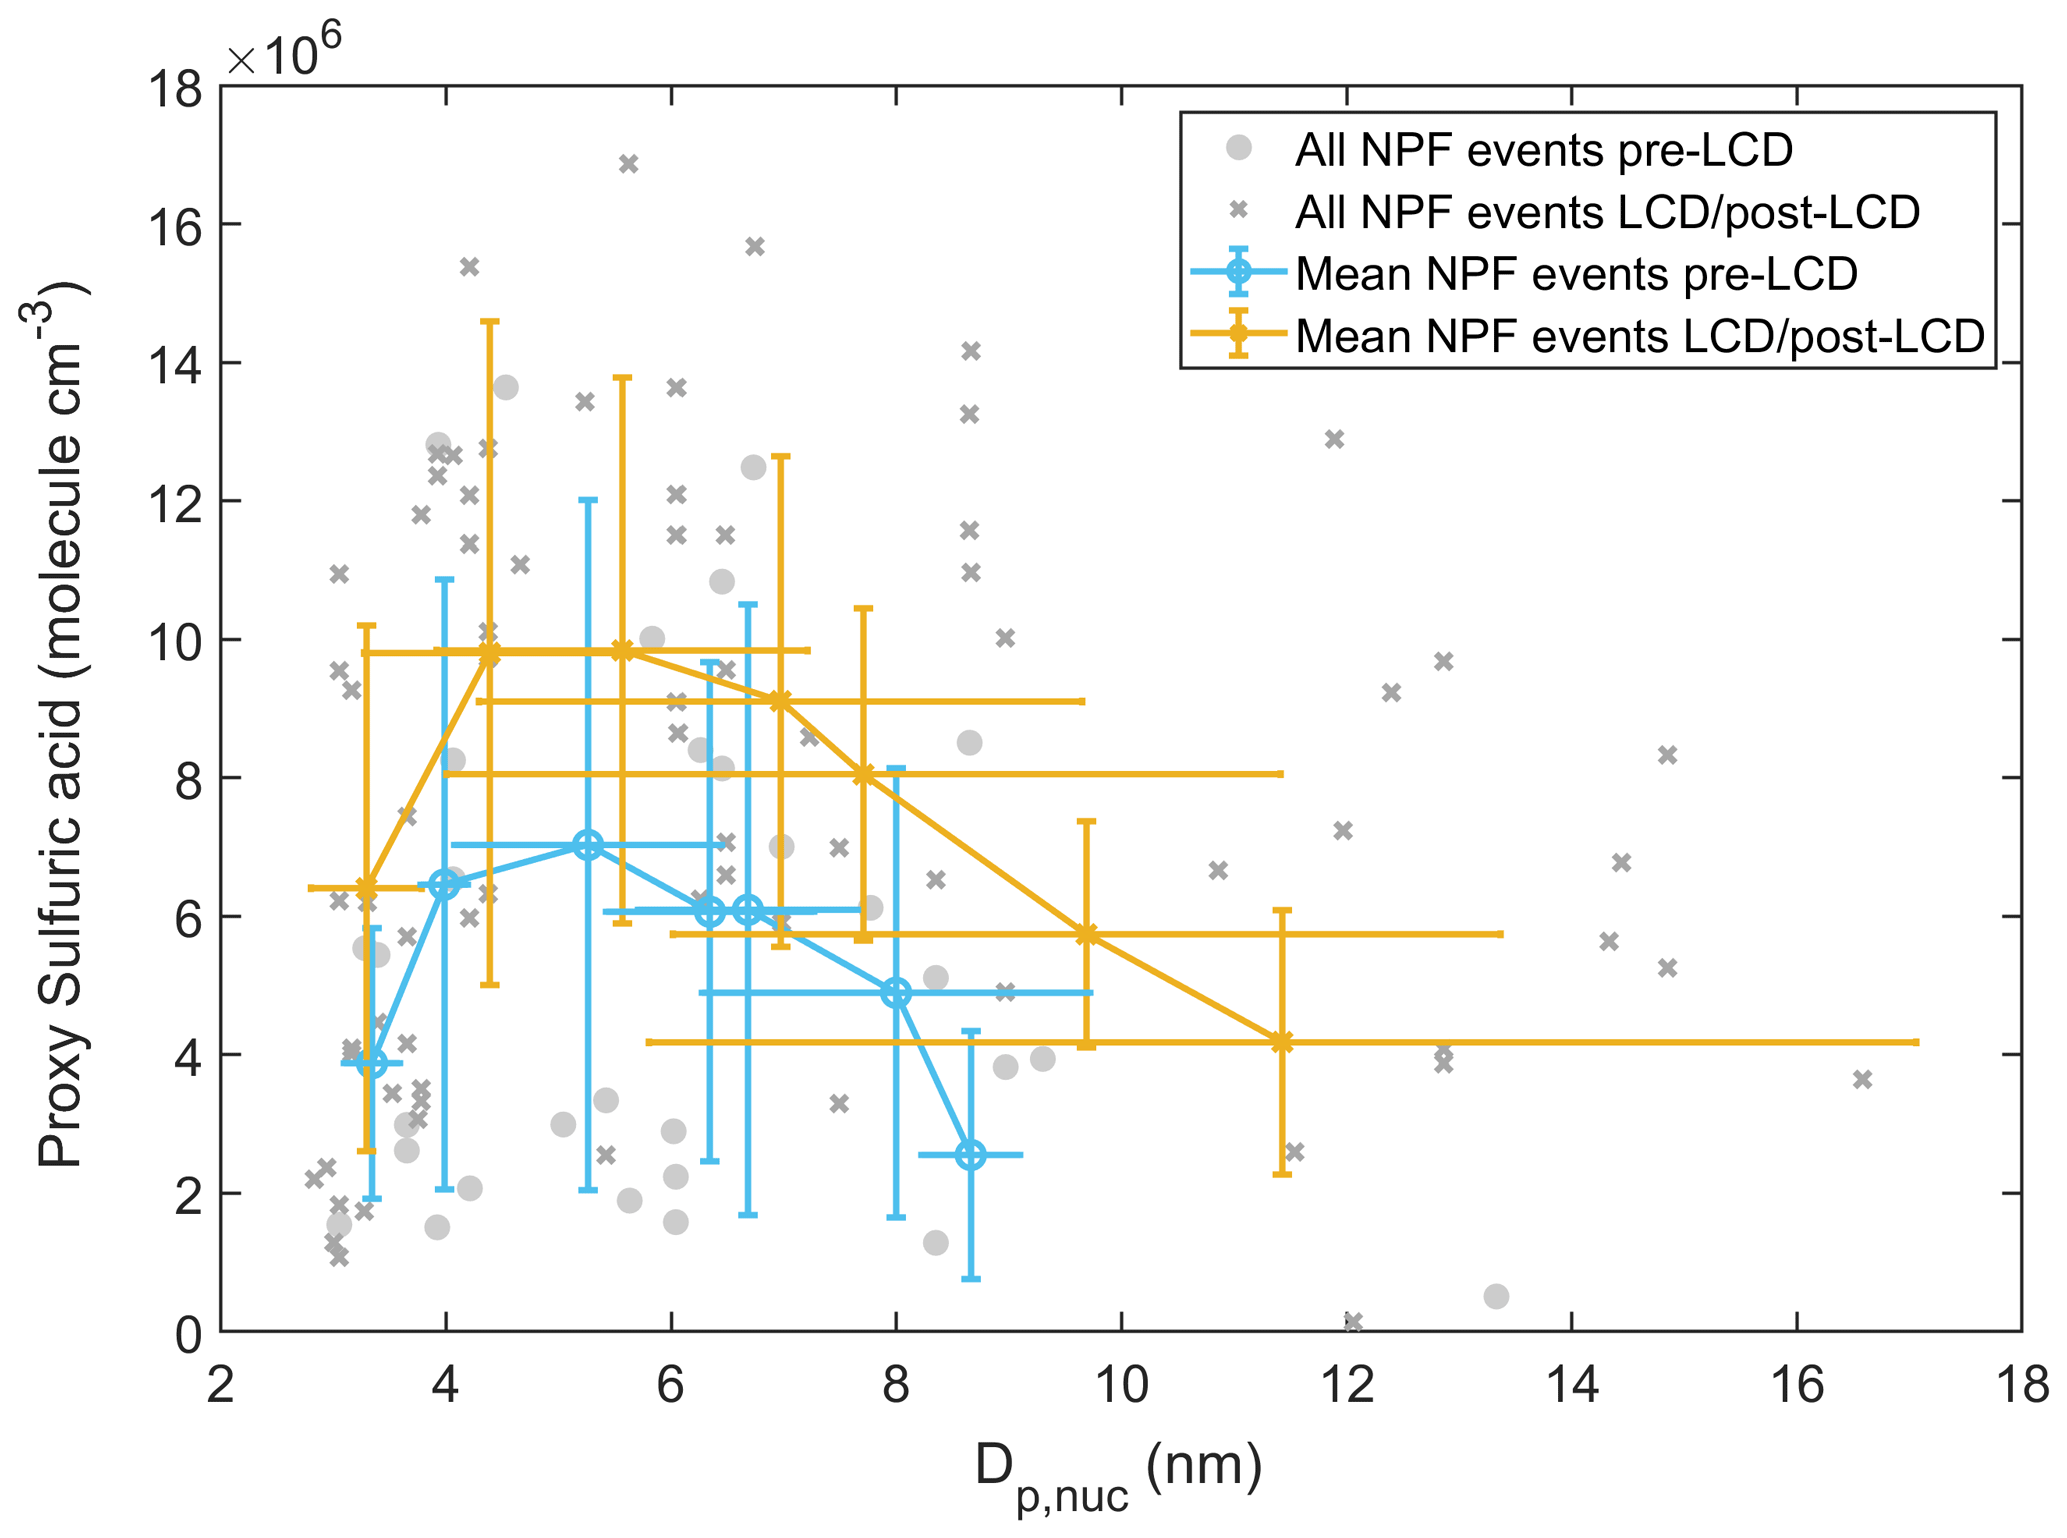
Figure 7Scatter plot between geometric mean diameter of nucleation mode (Dp,nuc) and the proxy sulfuric acid. The grey dots and crosses represent the NPF events during pre-LCD and LCD post-LCD, respectively. The purple and blue lines represent the mean conditions during pre-LCD, LCD post-LCD. The vertical and horizontal bars represents the standard deviations of sulfuric acid and Dp,nuc.
3.4 Effect of charged ions
Table 1 provided the parameters describing the nucleation and growth process for neutral particles and positive and negative ions, which showed that the GR of ions was larger than that of neutral particles. Growth enhancement from charge–dipole interactions between condensable gases and charged ions lead to higher growth rates than with neutral particles (Nadykto and Yu, 2003; Yu and Turco, 2000). The growth process of Dp,nuc of neutral particles and positive ions were given in Fig. 8. It showed grow faster than , especially for the sizes below 5 nm, depending on the growth rate in each time interval (, Δt=1 h). The enhanced growth rate factor (GR) ranged from 1.1 to 1.7, with the average of 1.38±0.34 during the entire particle growth process and higher (∼ 2.0) for the initial size of 2–5 nm. The growth of the nano-sized particles was not linear (especially at the initial size); therefore, the GR calculation was split into different size ranges (Fig. 9). The GR of charged ions was higher than that of neutral particles for all size ranges, which is consistent with previous studies (Hirsikko et al., 2005; Suni et al., 2008), and the difference was much larger at initial sizes below 5 nm as indicated above. In addition to condensational growth, the difference in the loss rates of smaller particles (neutral, positive, negative) due to the coagulation process and ion–ion recombination also affects particle size and calculated GRs (Yu and Turco, 2008, 2011). The effect of the charge decreases as particle size increases, and more species condense as particles grow. However, the number concentration of charged ions plays a minor role in the total particle count, and their contribution to the total growth process and nucleation can be ignored in urban Beijing, where the nucleation mechanism is dominated by neutral pathways with abundant condensing vapors.
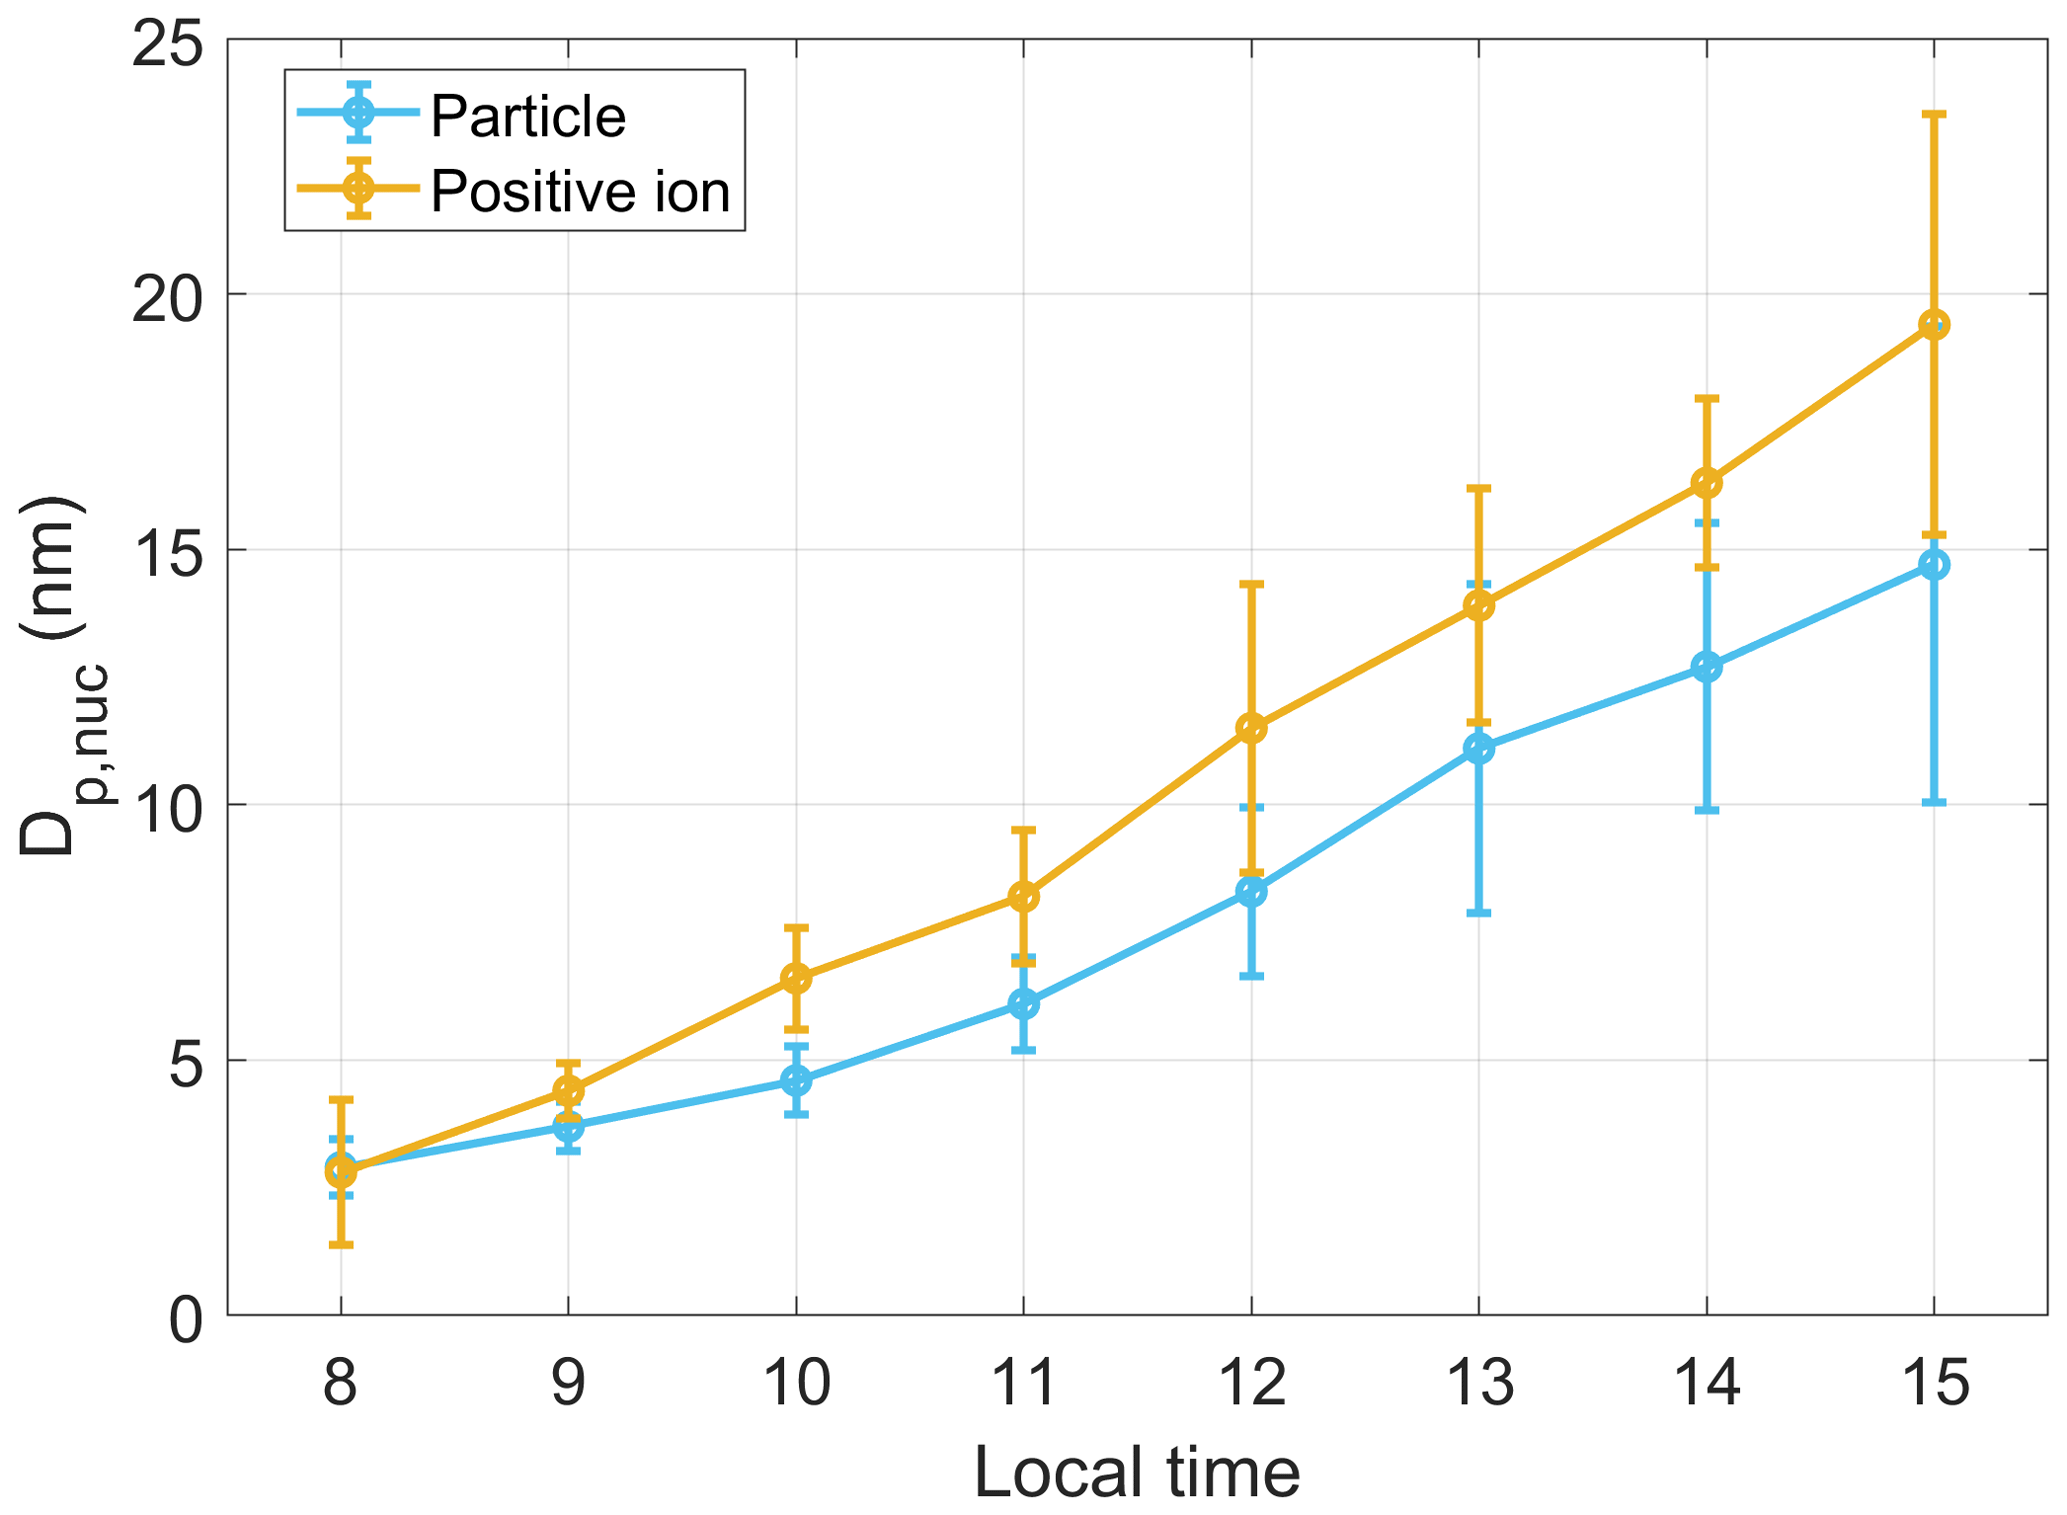
Figure 8The time evolution of geometric mean diameter of nucleation mode (Dp,nuc) of neutral particle and positive charged ions during the NPF events. The circle and bar present the mean value and the standard deviation.
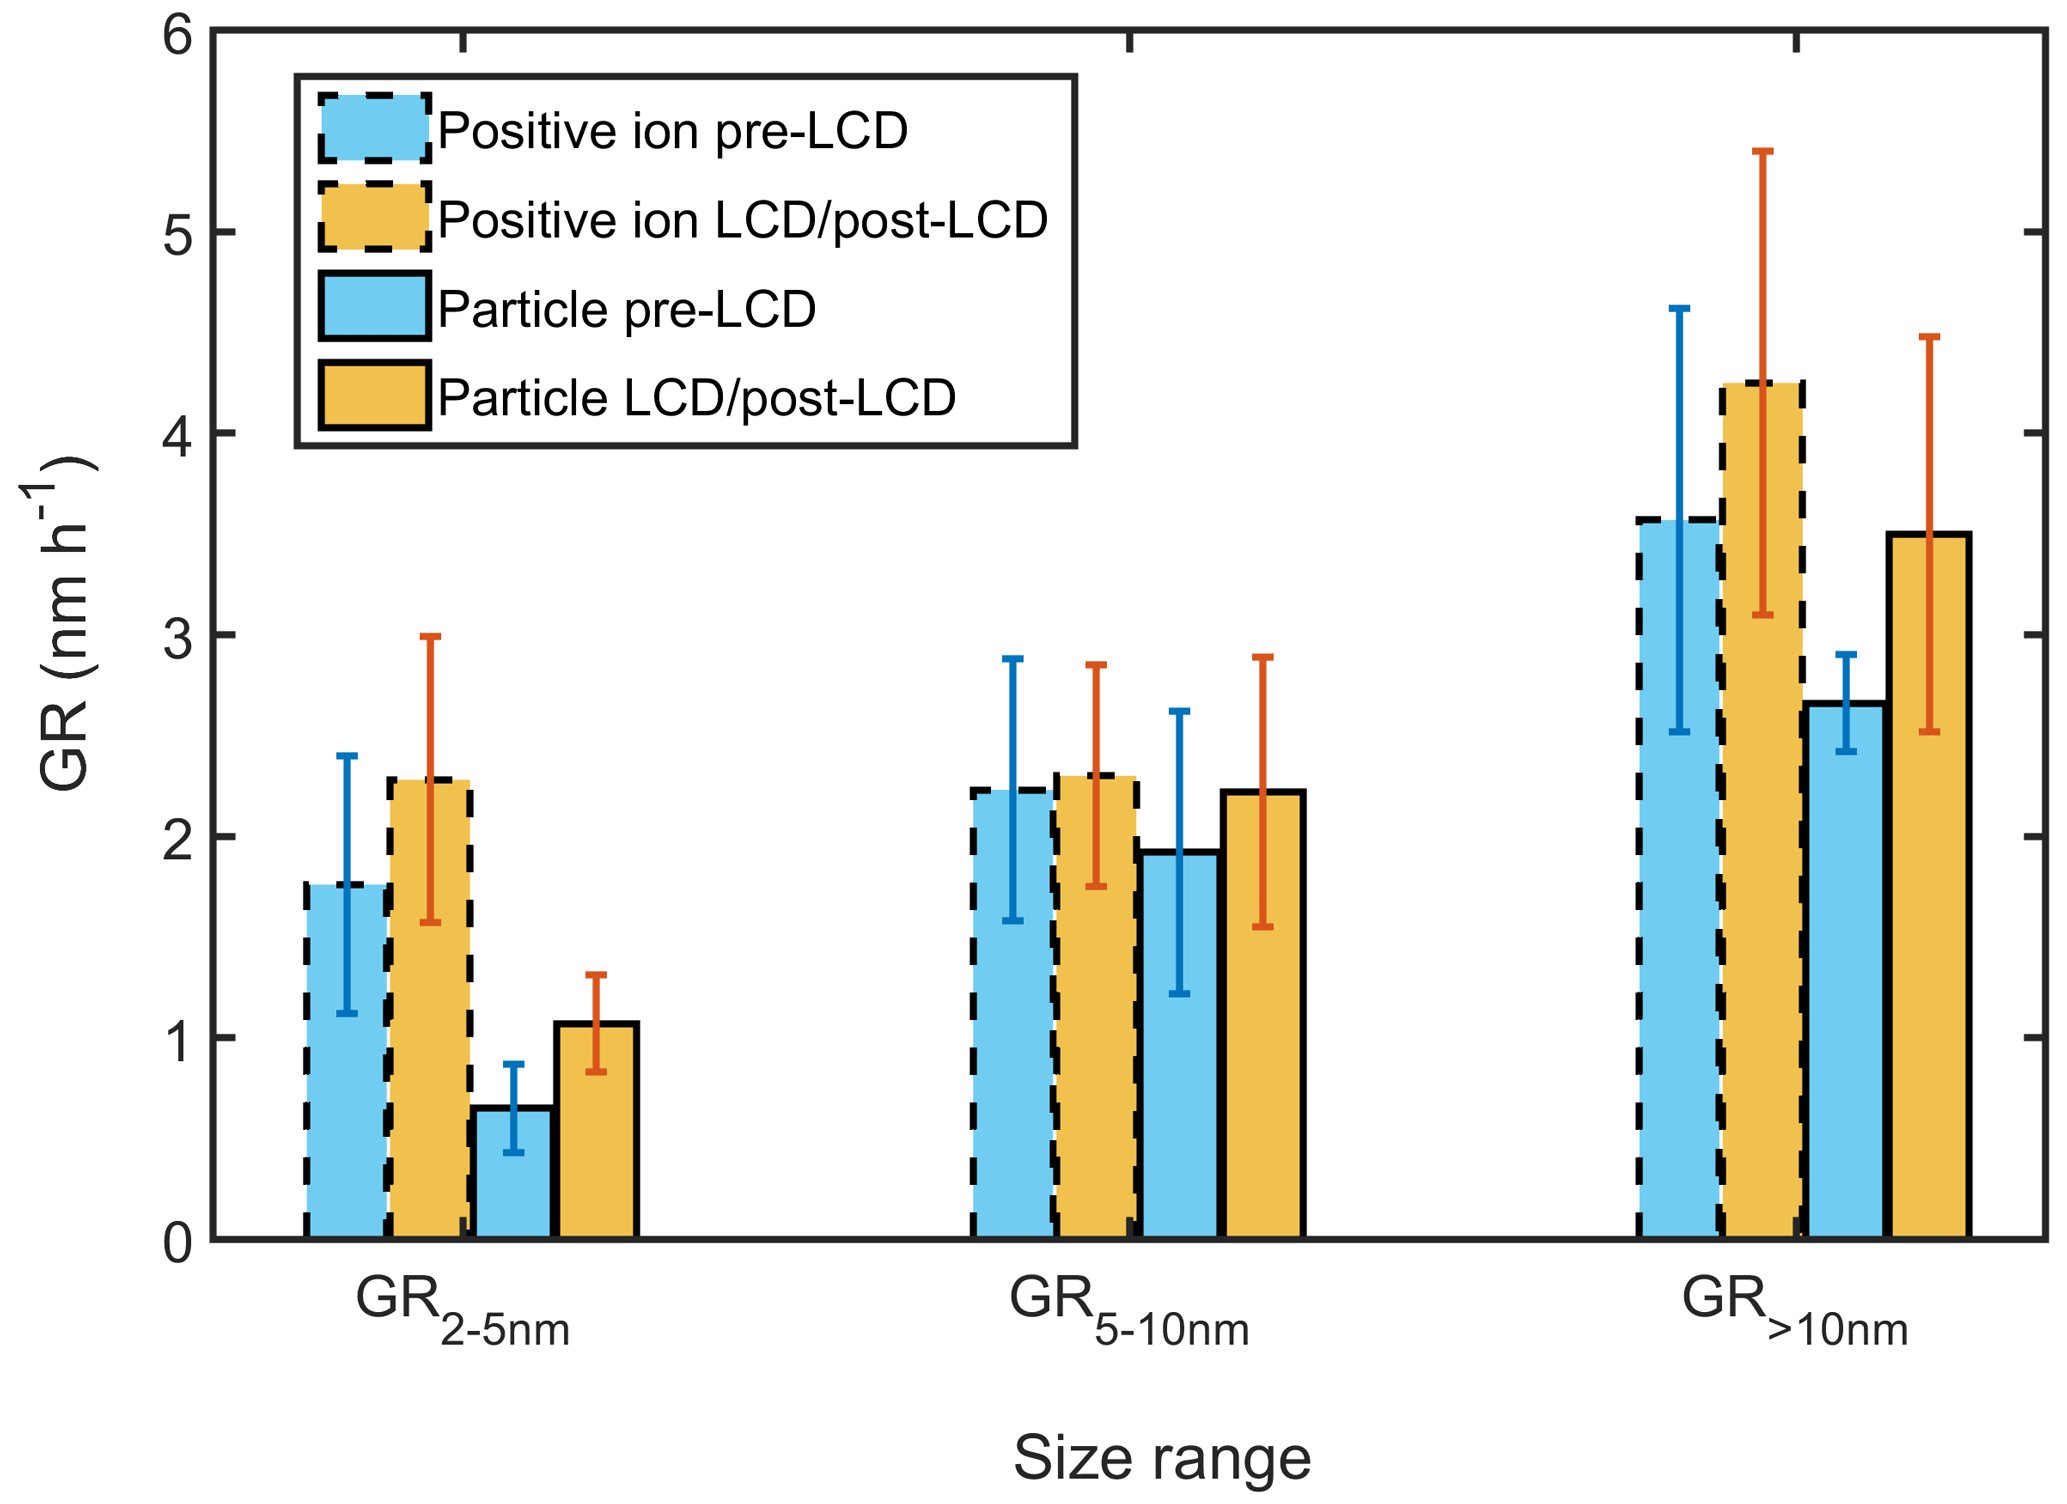
Figure 9The mean values of growth rates of particles and ions in different size ranges, including 2–5 nm (GR2–5 nm), 5–10 nm (GR5–10 nm), and > 10 nm (GR>10 nm), during pre-LCD and LCD + post-LCD, respectively. The histogram and error bars represent the mean value and standard deviation, respectively.
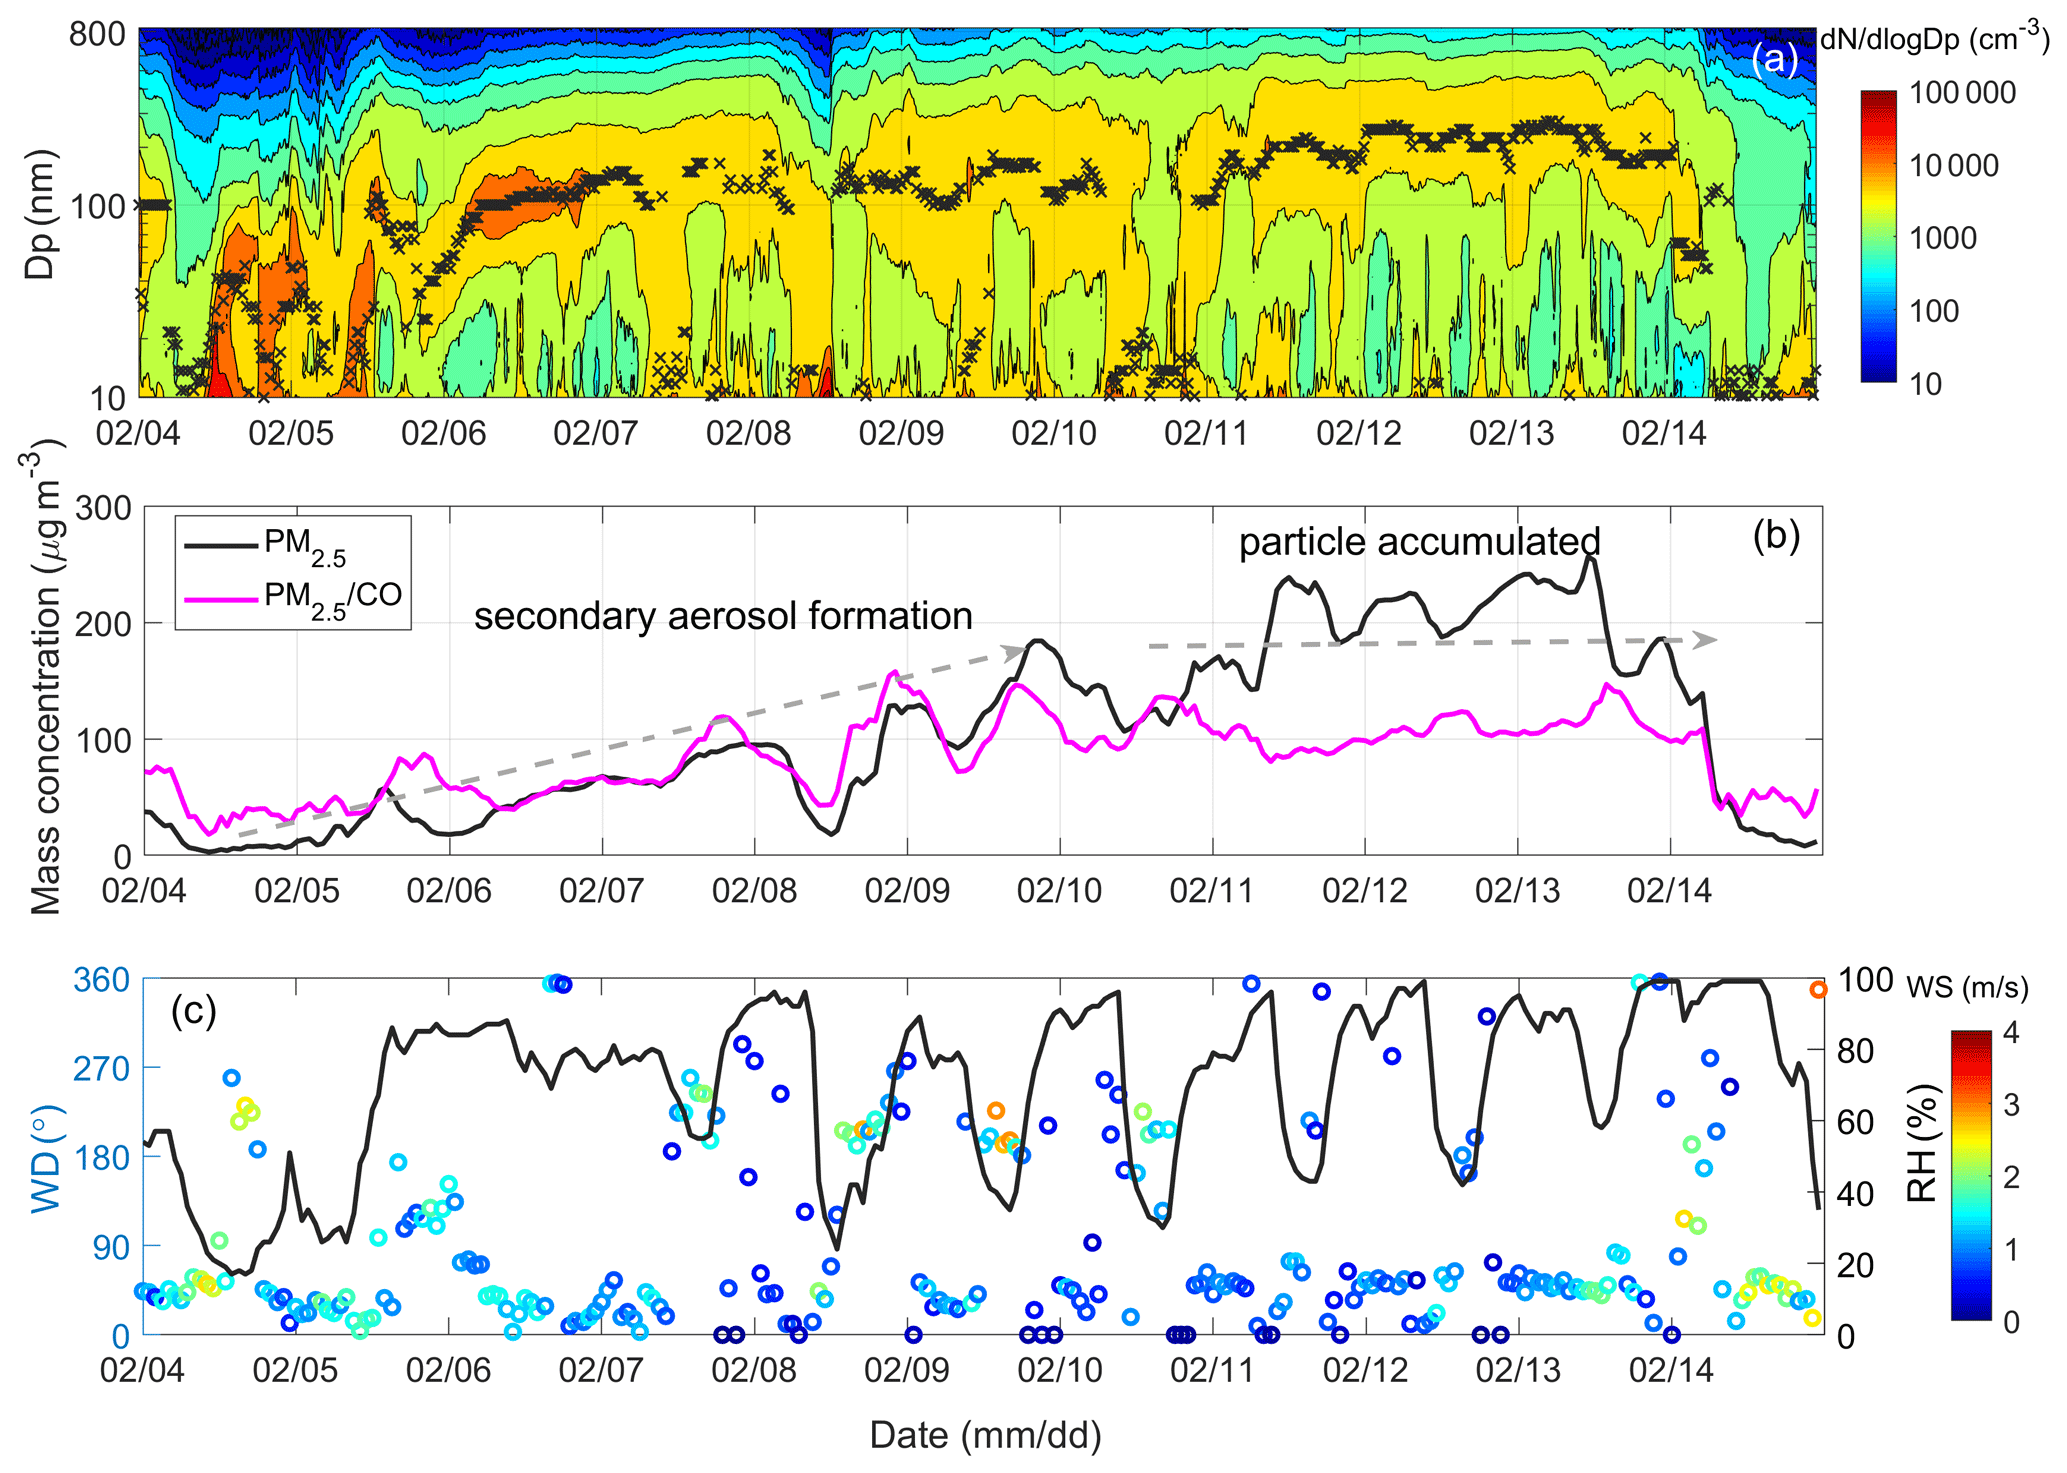
Figure 10Time evolution of PNSD and the dominant geometric mean diameters (black cross) derived by the log-modal fitting (a) and hourly mean PM2.5 (black line), normalized PM2.5 by CO (pink line) in (b) and the meteorological factors: wind direction (WD), wind speed (WS), and relative humidity (RH, black line) in (c) on 4–14 February.
3.5 Air pollution episode followed by NPF event
In this study, two severe pollution episodes occurred during LCD from 24–29 January and 7–14 February, with daily average PM2.5 mass concentrations in the range 75–210 µg m−3. Both episodes occurred after NPF days on 23 January (no. 10) and 4 February (no. 16), respectively. Other pollution episodes on 16–18 January, 19–21 February, and 28–29 February were preceded by NPF event nos. 8, 21, and 25, respectively. The most long-lasting pollution episode on 7–14 February is discussed further to reveal the relationship between NPF events and aerosol pollution formation (Fig. 10). The NPF events on 4–5 February produced high concentrations of nucleation mode particles, which grew to 150–200 nm in a few days. Two principal pollution episode formation stages were identified according to variations in the PM2.5 mass concentration divided by CO (PM2.5 CO), as indicated in Fig. 10b. The normalized PM2.5 by CO represents the secondary aerosol formation effect, which segregates the possible influence of physical effects, such as air mass change and planetary boundary layer (PBL) development (Wiedensohler et al., 2009). The back trajectories arriving at CAMS station at 12:00 LT from 4 to 14 February with the terminal height of 500 m a.g.l. were calculated (Fig. 11). The result showed back trajectories originating from the northwest from 4 to 10 February, corresponding to the dry and clean air masses. However, from 11 to 13 February, the southwesterly air masses were dominant and favored the accumulating of the particles, resulting in the high concentration level of PM2.5. In the first stage (5–10 February), the secondary aerosol formation was the key process contributing to increasing PM2.5 mass. The continuous growth of nucleated particles was sometimes interrupted by the development of PBL and local wind. As in the second stage (11–13 February), PM2.5 reached a peak value of 250 µg m−3, and PM2.5 CO slightly decreased with small fluctuations. Because primary emission should not change during this period, the unfavorable meteorological conditions could be responsible for the event. Low WS and high RH (from 80 % to > 90 %) was found from 5–14 February, with a few hours of RH < 60 % during the daytime. Particle hygroscopic growth under high-ambient-RH conditions and heterogeneous reactions on particle surfaces could also contribute to the elevated particle mass concentration (X. Wang et al., 2018). Consequently, nucleated particles accumulated because of enhanced oxidizing capacity and unfavorable meteorological conditions, causing the severe aerosol pollution.
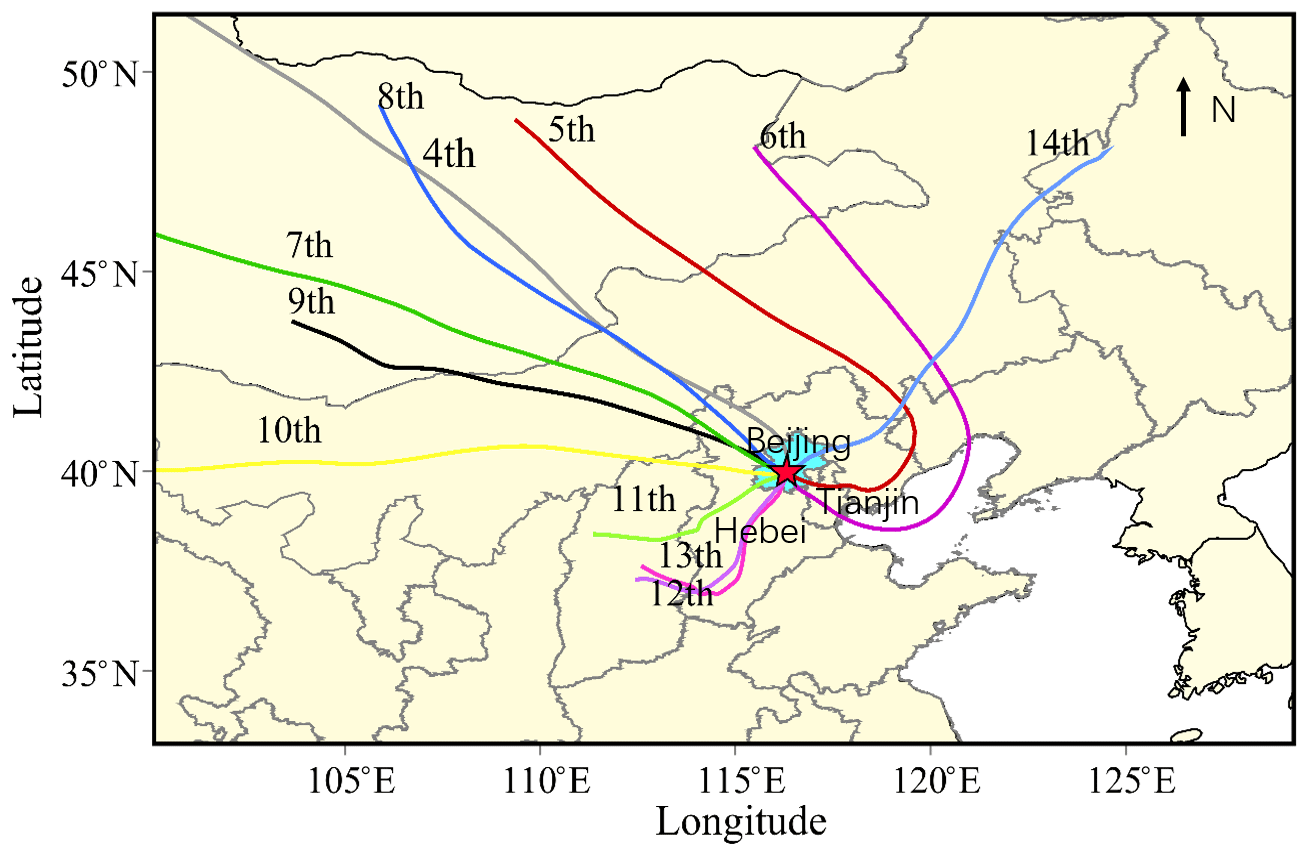
Figure 11The back trajectories arriving at CAMS station at 12:00 LT form 4 to 14 February with the terminal height of 500 m a.g.l.
In this study we presented changes in the NSD of particles and charged ions measured between January and February 2020. These observations reveal the influence of emission reduction on NPF events. Particles smaller than 100 nm were effectively reduced by ∼ 40 % because of suspended human activities during the Chinese New Year and the COVID-19 LCD. The accumulation mode particles were slightly higher during LCD, as several hazy days were associated with secondary aerosol formation. The frequency of NPF days slightly varied; however, J2 and GR were significantly higher. During LCD, NOx, and SO2 concentrations decreased as anthropogenic emissions decreased. Higher O3 and a lower condensation sink raised sulfuric acid concentration levels by ∼ 26 %, which were responsible for the higher nucleation rate and larger nanoparticle quantity. Sulfuric acid was also responsible for the nucleated particle growth at the initial sizes (below 5 nm). In the late afternoon, sulfuric acid decreased as the weakened solar radiation and low-volatility oxidation products of VOCs could have larger contribution to the particle growth. For the major VOCs, isoprene and toluene were slightly changed, benzene increased, and aromatics (C8 and C9 compounds) decreased during the LCD period. Although the oxidation products of VOCs were not measured in this study, the major oxidants of VOCs (O3, OH, and NO3) all increased during LCD period, indicating the possibility of enhanced oxidized VOCs promoting the particle growth process. The effect of charged ions on the particle growth was also studied and it showed an enhanced growth rate factor of 1.38±0.34. The nucleated particles entered accumulation mode by secondary aerosol formation and underwent hygroscopic growth under high RH and calm wind conditions, which facilitated the occurrence of severe pollution episodes during LCD. This work highlights the potential influence of strict emission control strategies on NPF events and provides insights into the positive and negative effects of precursors and atmospheric oxidizing capacity on the nucleation and growth process of the nanoparticles.
All the data related to this paper may be requested from the corresponding author: shenxj@cma.gov.cn.
The supplement related to this article is available online at: https://doi.org/10.5194/acp-21-7039-2021-supplement.
XS and JS designed the research and led the overall scientific questions. XS, JZ, YZ, YW, CX, XH, and SZ carried out the field experiment, data processing, and analysis. XS wrote the first draft of the paper, and FY and XZ revised the paper. All authors read and approved the final version.
The authors declare that they have no conflict of interest.
This research was supported by the Innovation Team for Haze-fog Observation and Forecasts of MOST and CMA. The authors are grateful to the editor and two anonymous reviewers who helped to improve the quality of the initial manuscript.
This research has been supported by the National Key R&D Program of China (grant no. 2018YFC0213204), the National Natural Science Foundation of China (grant nos. 41875147 and 42075082) and the Chinese Academy of Meteorological Sciences (grant no. 2020KJ001).
This paper was edited by Thomas Karl and reviewed by two anonymous referees.
Asmi, E., Sipilä, M., Manninen, H. E., Vanhanen, J., Lehtipalo, K., Gagné, S., Neitola, K., Mirme, A., Mirme, S., Tamm, E., Uin, J., Komsaare, K., Attoui, M., and Kulmala, M.: Results of the first air ion spectrometer calibration and intercomparison workshop, Atmos. Chem. Phys., 9, 141–154, https://doi.org/10.5194/acp-9-141-2009, 2009.
Dai, L., Wang, H., Zhou, L., An, J., Tang, L., Lu, C., Yan, W., Liu, R., Kong, S., Chen, M., Lee, S., and Yu, H.: Regional and local new particle formation events observed in the Yangtze River Delta region, China, J. Geophys. Res., 122, 2389–2402, https://doi.org/10.1002/2016jd026030, 2017.
Dal Maso, M., Kulmala, M., Lehtinen, K. E. J., Mäkelä, J. M., Aalto, P., and O'Dowd, C. D.: Condensation and coagulation sinks and formation of nucleation mode particles in coastal and boreal forest boundary layers, J. Geophys. Res., 107, 8097, https://doi.org/10.1029/2001JD001053, 2002.
Dal Maso, M., Kulmala, M., Riipinen, I., Wagner, R., Hussein, T., Aalto, P. P., and Lehtinen, K. E. J.: Formation and growth of fresh atmospheric aerosols: eight years of aerosol size distribution data from SMEAR II, Boreal Environ. Res., 10, 323–336, 2005.
Deventer, M. J., von der Heyden, L., Lamprecht, C., Graus, M., Karl, T., and Held, A.: Aerosol particles during the Innsbruck Air Quality Study (INNAQS): Fluxes of nucleation to accumulation mode particles in relation to selective urban tracers, Atmos. Environ., 190, 376–388, https://doi.org/10.1016/j.atmosenv.2018.04.043, 2018.
Draxler, R. R. and Hess, G. D.: An overview of the HYSPLIT_4 modelling system of trajectories, dispersion, and deposition, Aust. Meteor. Mag., 47, 295–308, 1998.
Ehn, M., Kleist, E., Junninen, H., Petäjä, T., Lönn, G., Schobesberger, S., Dal Maso, M., Trimborn, A., Kulmala, M., Worsnop, D. R., Wahner, A., Wildt, J., and Mentel, Th. F.: Gas phase formation of extremely oxidized pinene reaction products in chamber and ambient air, Atmos. Chem. Phys., 12, 5113–5127, https://doi.org/10.5194/acp-12-5113-2012, 2012.
Fuchs, N. A.: On the stationary charge distribution on aerosol particles in bipolar ionic atmosphere, Geofis. Pura Appl., 56. 185–193, 1963.
Gagné, S., Lehtipalo, K., Manninen, H. E., Nieminen, T., Schobesberger, S., Franchin, A., Yli-Juuti, T., Boulon, J., Sonntag, A., Mirme, S., Mirme, A., Hõrrak, U., Petäjä, T., Asmi, E., and Kulmala, M.: Intercomparison of air ion spectrometers: an evaluation of results in varying conditions, Atmos. Meas. Tech., 4, 805–822, https://doi.org/10.5194/amt-4-805-2011, 2011.
Guo, S., Hu, M., Zamora, M. L., Peng, J., Shang, D., Zheng, J., Du, Z., Wu, Z., Shao, M., Zeng, L., Molina, M. J., and Zhang, R.: Elucidating severe urban haze formation in China, P. Natl. Acad. Sci. USA, 111, 17373–17378, https://doi.org/10.1073/pnas.1419604111, 2014.
Hirsikko, A., Laakso, L., Aalto, P. P., Kerminen, V.-M., Hõrrak, U., and Kulmala, M.: Annual and size dependent variation of growth rates and ion concentrations in boreal forest, Boreal Envrion. Res., 10, 357–369, 2005.
Hirsikko, A., Nieminen, T., Gagné, S., Lehtipalo, K., Manninen, H. E., Ehn, M., Hõrrak, U., Kerminen, V.-M., Laakso, L., McMurry, P. H., Mirme, A., Mirme, S., Petäjä, T., Tammet, H., Vakkari, V., Vana, M., and Kulmala, M.: Atmospheric ions and nucleation: a review of observations, Atmos. Chem. Phys., 11, 767–798, https://doi.org/10.5194/acp-11-767-2011, 2011.
Hoppel, W. A.: Ion-Aerosol Attachement Coefficients, Ion Depletion, and the Charge Distribution on Aerosols, J. Geophys. Res., 90, 5917–5923, 1985.
Hu, B., Zhang, X. H., and Wang, Y. S.: Variability in UVB radiation in Beijing, China, Photochem Photobiol, 89, 745–750, https://doi.org/10.1111/php.12051, 2013.
Huang, X., Ding, A., Gao, J., Zheng, B., Zhou, D., Qi, X., Tang, R., Wang, J., Ren, C., Nie, W., Chi, X., Xu, Z., Chen, L., Li, Y., Che, F., Pang, N., Wang, H., Tong, D., Qin, W., Cheng, W., Liu, W., Fu, Q., Liu, B., Chai, F., Davis, S. J., Zhang, Q., and He, K.: Enhanced secondary pollution offset reduction of primary emissions during COVID-19 lockdown in China, National Sci. Rev., 8, nwaa137, https://doi.org/10.1093/nsr/nwaa137, 2021.
Hussein, T., Junninen, H., Tunved, P., Kristensson, A., Dal Maso, M., Riipinen, I., Aalto, P. P., Hansson, H.-C., Swietlicki, E., and Kulmala, M.: Time span and spatial scale of regional new particle formation events over Finland and Southern Sweden, Atmos. Chem. Phys., 9, 4699–4716, https://doi.org/10.5194/acp-9-4699-2009, 2009.
Jin, L., Luo, X., Fu, P., and Li, X.: Airborne particulate matter pollution in urban China: a chemical mixture perspective from sources to impacts, National Sci. Rev., 4, 593–610, https://doi.org/10.1093/nsr/nww079, 2017.
Kawanaka, Y., Tsuchiya, Y., Yun, S. J., and Sakamoto, K.: Size distributions of polycyclic aromatic hydrocarbons in the atmosphere and estimation of the contribution of ultrafine particles to their lung deposition, Environ. Sci. Technol., 43, 6851–6856, 2009.
Kerminen, V.-M., Paramonov, M., Anttila, T., Riipinen, I., Fountoukis, C., Korhonen, H., Asmi, E., Laakso, L., Lihavainen, H., Swietlicki, E., Svenningsson, B., Asmi, A., Pandis, S. N., Kulmala, M., and Petäjä, T.: Cloud condensation nuclei production associated with atmospheric nucleation: a synthesis based on existing literature and new results, Atmos. Chem. Phys., 12, 12037–12059, https://doi.org/10.5194/acp-12-12037-2012, 2012.
Kontkanen, J., Olenius, T., Kulmala, M., and Riipinen, I.: Exploring the potential of nano-Köhler theory to describe the growth of atmospheric molecular clusters by organic vapors using cluster kinetics simulations, Atmos. Chem. Phys., 18, 13733–13754, https://doi.org/10.5194/acp-18-13733-2018, 2018.
Kulmala, M., Vehkamäki, H., Petäjä, T., Dal Maso, M., Lauri, A., Kerminen, V. M., Birmili, W., and McMurry, P. H.: Formation and growth rates of ultrafine atmospheric particles: a review of observations, J. Aerosol Sci., 35, 143–176, https://doi.org/10.1016/j.jaerosci.2003.10.003, 2004.
Kulmala, M., Kontkanen, J., Junninen, H., Lehtipalo, K., Manninen, H. E., Nieminen, T., Petaja, T., Sipila, M., Schobesberger, S., Rantala, P., Franchin, A., Jokinen, T., Jarvinen, E., Aijala, M., Kangasluoma, J., Hakala, J., Aalto, P. P., Paasonen, P., Mikkila, J., Vanhanen, J., Aalto, J., Hakola, H., Makkonen, U., Ruuskanen, T., Mauldin, R. L., Duplissy, J., Vehkamaki, H., Back, J., Kortelainen, A., Riipinen, I., Kurten, T., Johnston, M. V., Smith, J. N., Ehn, M., Mentel, T. F., Lehtinen, K. E. J., Laaksonen, A., Kerminen, V. M., and Worsnop, D. R.: Direct Observations of Atmospheric Aerosol Nucleation, Science, 339, 943–946, https://doi.org/10.1126/science.1227385, 2013.
Kyrö, E.-M., Väänänen, R., Kerminen, V.-M., Virkkula, A., Petäjä, T., Asmi, A., Dal Maso, M., Nieminen, T., Juhola, S., Shcherbinin, A., Riipinen, I., Lehtipalo, K., Keronen, P., Aalto, P. P., Hari, P., and Kulmala, M.: Trends in new particle formation in eastern Lapland, Finland: effect of decreasing sulfur emissions from Kola Peninsula, Atmos. Chem. Phys., 14, 4383–4396, https://doi.org/10.5194/acp-14-4383-2014, 2014.
Le, T., Wang, Y., Liu, L., Yang, J., Yung, Y. L., Li, G., and Seinfeld, J. H.: Unexpected air pollution with marked emission reductions during the COVID-19 outbreak in China, Science, 369, 702–706, https://doi.org/10.1126/science.abb7431, 2020.
Lehtipalo, K., Yan, C., Dada, L., Bianchi, F., Xiao, M., Wagner, R., Stolzenburg, D., Ahonen, L. R., Amorim, A., Baccarini, A., Bauer, P. S., Baumgartner, B., and Bergen, A.: Multicomponent new particle formation from sulfuric acid, ammonia, and biogenic vapors, Sci. Adv., 4, eaau5363, https://doi.org/10.1126/sciadv.aau5363, 2018.
Lu, Y., Yan, C., Fu, Y., Chen, Y., Liu, Y., Yang, G., Wang, Y., Bianchi, F., Chu, B., Zhou, Y., Yin, R., Baalbaki, R., Garmash, O., Deng, C., Wang, W., Liu, Y., Petäjä, T., Kerminen, V.-M., Jiang, J., Kulmala, M., and Wang, L.: A proxy for atmospheric daytime gaseous sulfuric acid concentration in urban Beijing, Atmos. Chem. Phys., 19, 1971–1983, https://doi.org/10.5194/acp-19-1971-2019, 2019.
Manninen, H. E., Nieminen, T., Asmi, E., Gagné, S., Häkkinen, S., Lehtipalo, K., Aalto, P., Vana, M., Mirme, A., Mirme, S., Hõrrak, U., Plass-Dülmer, C., Stange, G., Kiss, G., Hoffer, A., Törő, N., Moerman, M., Henzing, B., de Leeuw, G., Brinkenberg, M., Kouvarakis, G. N., Bougiatioti, A., Mihalopoulos, N., O'Dowd, C., Ceburnis, D., Arneth, A., Svenningsson, B., Swietlicki, E., Tarozzi, L., Decesari, S., Facchini, M. C., Birmili, W., Sonntag, A., Wiedensohler, A., Boulon, J., Sellegri, K., Laj, P., Gysel, M., Bukowiecki, N., Weingartner, E., Wehrle, G., Laaksonen, A., Hamed, A., Joutsensaari, J., Petäjä, T., Kerminen, V.-M., and Kulmala, M.: EUCAARI ion spectrometer measurements at 12 European sites – analysis of new particle formation events, Atmos. Chem. Phys., 10, 7907–7927, https://doi.org/10.5194/acp-10-7907-2010, 2010.
Manninen, H. E., Franchin, A., Schobesberger, S., Hirsikko, A., Hakala, J., Skromulis, A., Kangasluoma, J., Ehn, M., Junninen, H., Mirme, A., Mirme, S., Sipilä, M., Petäjä, T., Worsnop, D. R., and Kulmala, M.: Characterisation of corona-generated ions used in a Neutral cluster and Air Ion Spectrometer (NAIS), Atmos. Meas. Tech., 4, 2767–2776, https://doi.org/10.5194/amt-4-2767-2011, 2011.
Mirme, A., Tamm, E., Mordas, G., Vana, M., Uin, J., Mirme, S., Bernotas, T., Laakso, L., Hirsikko, A., and Kulmala, M.: A wide-range multi-channel Air Ion Spectrometer, Boreal Environ. Res., 12, 247–264, 2007.
Mirme, S. and Mirme, A.: The mathematical principles and design of the NAIS – a spectrometer for the measurement of cluster ion and nanometer aerosol size distributions, Atmos. Meas. Tech., 6, 1061–1071, https://doi.org/10.5194/amt-6-1061-2013, 2013.
Nadykto, A. B. and Yu, F.: Uptake of neutral polar vapor molecules by charged clusters/particles: Enhancement due to dipole-charge interaction, J. Geophys. Res., 108, 4717, https://doi.org/10.1029/2003jd003664, 2003.
Petäjä, T., Mauldin, III, R. L., Kosciuch, E., McGrath, J., Nieminen, T., Paasonen, P., Boy, M., Adamov, A., Kotiaho, T., and Kulmala, M.: Sulfuric acid and OH concentrations in a boreal forest site, Atmos. Chem. Phys., 9, 7435–7448, https://doi.org/10.5194/acp-9-7435-2009, 2009.
Shen, X. J., Sun, J. Y., Zhang, Y. M., Wehner, B., Nowak, A., Tuch, T., Zhang, X. C., Wang, T. T., Zhou, H. G., Zhang, X. L., Dong, F., Birmili, W., and Wiedensohler, A.: First long-term study of particle number size distributions and new particle formation events of regional aerosol in the North China Plain, Atmos. Chem. Phys., 11, 1565–1580, https://doi.org/10.5194/acp-11-1565-2011, 2011.
Shen, X. J., Sun, J. Y., Zhang, X. Y., Zhang, Y. M., Zhang, L., Fan, R. X., Zhang, Z. X., Zhang, X. L., Zhou, H. G., Zhou, L. Y., Dong, F., and Shi, Q. F.: The influence of emission control on particle number size distribution and new particle formation during China's V-Day parade in 2015, Sci. Total Environ., 573, 409–419, https://doi.org/10.1016/j.scitotenv.2016.08.085, 2016.
Shen, X., Sun, J., Kivekäs, N., Kristensson, A., Zhang, X., Zhang, Y., Zhang, L., Fan, R., Qi, X., Ma, Q., and Zhou, H.: Spatial distribution and occurrence probability of regional new particle formation events in eastern China, Atmos. Chem. Phys., 18, 587–599, https://doi.org/10.5194/acp-18-587-2018, 2018.
Stolzenburg, D., Simon, M., Ranjithkumar, A., Kürten, A., Lehtipalo, K., Gordon, H., Ehrhart, S., Finkenzeller, H., Pichelstorfer, L., Nieminen, T., He, X.-C., Brilke, S., Xiao, M., Amorim, A., Baalbaki, R., Baccarini, A., Beck, L., Bräkling, S., Caudillo Murillo, L., Chen, D., Chu, B., Dada, L., Dias, A., Dommen, J., Duplissy, J., El Haddad, I., Fischer, L., Gonzalez Carracedo, L., Heinritzi, M., Kim, C., Koenig, T. K., Kong, W., Lamkaddam, H., Lee, C. P., Leiminger, M., Li, Z., Makhmutov, V., Manninen, H. E., Marie, G., Marten, R., Müller, T., Nie, W., Partoll, E., Petäjä, T., Pfeifer, J., Philippov, M., Rissanen, M. P., Rörup, B., Schobesberger, S., Schuchmann, S., Shen, J., Sipilä, M., Steiner, G., Stozhkov, Y., Tauber, C., Tham, Y. J., Tomé, A., Vazquez-Pufleau, M., Wagner, A. C., Wang, M., Wang, Y., Weber, S. K., Wimmer, D., Wlasits, P. J., Wu, Y., Ye, Q., Zauner-Wieczorek, M., Baltensperger, U., Carslaw, K. S., Curtius, J., Donahue, N. M., Flagan, R. C., Hansel, A., Kulmala, M., Lelieveld, J., Volkamer, R., Kirkby, J., and Winkler, P. M.: Enhanced growth rate of atmospheric particles from sulfuric acid, Atmos. Chem. Phys., 20, 7359–7372, https://doi.org/10.5194/acp-20-7359-2020, 2020.
Suni, T., Kulmala, M., Hirsikko, A., Bergman, T., Laakso, L., Aalto, P. P., Leuning, R., Cleugh, H., Zegelin, S., Hughes, D., van Gorsel, E., Kitchen, M., Vana, M., Hõrrak, U., Mirme, S., Mirme, A., Sevanto, S., Twining, J., and Tadros, C.: Formation and characteristics of ions and charged aerosol particles in a native Australian Eucalypt forest, Atmos. Chem. Phys., 8, 129–139, https://doi.org/10.5194/acp-8-129-2008, 2008.
Wang, H., Lu, K., Guo, S., Wu, Z., Shang, D., Tan, Z., Wang, Y., Le Breton, M., Lou, S., Tang, M., Wu, Y., Zhu, W., Zheng, J., Zeng, L., Hallquist, M., Hu, M., and Zhang, Y.: Efficient N2O5 uptake and NO3 oxidation in the outflow of urban Beijing, Atmos. Chem. Phys., 18, 9705–9721, https://doi.org/10.5194/acp-18-9705-2018, 2018.
Wang, X., Shen, X. J., Sun, J. Y., Zhang, X. Y., Wang, Y. Q., Zhang, Y. M., Wang, P., Xia, C., Qi, X. F., and Zhong, J. T.: Size-resolved hygroscopic behavior of atmospheric aerosols during heavy aerosol pollution episodes in Beijing in December 2016, Atmos. Environ., 194, 188–197, https://doi.org/10.1016/j.atmosenv.2018.09.041, 2018.
Wang, Y. Q., Zhang, X. Y., and Draxler, R. R.: TrajStat: GIS-based software that uses various trajectory statistical analysis methods to identify potential sources from long-term air pollution measurement data, Environ. Model. Softw., 24, 938–939, https://doi.org/10.1016/j.envsoft.2009.01.004, 2009.
Wiedensohler, A., Cheng, Y. F., Nowak, A., Wehner, B., Achtert, P., Berghof, M., Birmili, W., Wu, Z. J., Hu, M., Zhu, T., Takegawa, N., Kita, K., Kondo, Y., Lou, S. R., Hofzumahaus, A., Holland, F., Wahner, A., Gunthe, S. S., Rose, D., Su, H., and Pöschl, U.: Rapid aerosol particle growth and increase of cloud condensation nucleus activity by secondary aerosol formation and condensation: A case study for regional air pollution in northeastern China, J. Geophys. Res., 114, D00G08, https://doi.org/10.1029/2008jd010884, 2009.
Yan, C., Nie, W., Äijälä, M., Rissanen, M. P., Canagaratna, M. R., Massoli, P., Junninen, H., Jokinen, T., Sarnela, N., Häme, S. A. K., Schobesberger, S., Canonaco, F., Yao, L., Prévôt, A. S. H., Petäjä, T., Kulmala, M., Sipilä, M., Worsnop, D. R., and Ehn, M.: Source characterization of highly oxidized multifunctional compounds in a boreal forest environment using positive matrix factorization, Atmos. Chem. Phys., 16, 12715–12731, https://doi.org/10.5194/acp-16-12715-2016, 2016.
Yan, C., Nie, W., Vogel, A. L., Dada, L., Lehtipalo, K., Stolzenburg, D., Wagner, R., Rissanen, M. P., Xiao, M., Ahonen, L., Fischer, L., Rose, C., Bianchi, F., Gordon, H., Simon, M., and Heinritzi, M.: Size-dependent influence of NOx on the growth rates of organic aerosol particles, Sci. Adv., 6, eaay4945, https://doi.org/10.1126/sciadv.aay4945, 2020.
Yu, F. Q. and Turco, R. P.: Ultrafine aerosol formation via ion-mediated nucleation, Geophys. Res. Lett., 27, 883–886, https://doi.org/10.1029/1999gl011151, 2000.
Yu, F. and Turco, R.: Case studies of particle formation events observed in boreal forests: implications for nucleation mechanisms, Atmos. Chem. Phys., 8, 6085–6102, https://doi.org/10.5194/acp-8-6085-2008, 2008.
Yu, F. and Turco, R. P.: The size-dependent charge fraction of sub-3-nm particles as a key diagnostic of competitive nucleation mechanisms under atmospheric conditions, Atmos. Chem. Phys., 11, 9451–9463, https://doi.org/10.5194/acp-11-9451-2011, 2011.
Yuan, B., Koss, A. R., Warneke, C., Coggon, M., Sekimoto, K., and de Gouw, J. A.: Proton-Transfer-Reaction Mass Spectrometry: Applications in Atmospheric Sciences, Chemical Reviews, 117, 13187–13229, https://doi.org/10.1021/acs.chemrev.7b00325, 2017.
Zhang, Q., Pan, Y., He, Y., Walters, W. W., Ni, Q., Liu, X., Xu, G., Shao, J., and Jiang, C.: Substantial nitrogen oxides emission reduction from China due to COVID-19 and its impact on surface ozone and aerosol pollution, Sci. Total Environ., 753, 142238, https://doi.org/10.1016/j.scitotenv.2020.142238, 2021.
Zhang, X. Y., Xu, X. D., Ding, Y. H., Liu, Y. J., Zhang, H. D., Wang, Y. Q., and Zhong, J. T.: The impact of meteorological changes from 2013 to 2017 on PM2.5 mass reduction in key regions in China, Science China Earth Sciences, 62, 1885–1902, 2019.
Zhong, J., Zhang, X., Dong, Y., Wang, Y., Liu, C., Wang, J., Zhang, Y., and Che, H.: Feedback effects of boundary-layer meteorological factors on cumulative explosive growth of PM2.5 during winter heavy pollution episodes in Beijing from 2013 to 2016, Atmos. Chem. Phys., 18, 247–258, https://doi.org/10.5194/acp-18-247-2018, 2018.