the Creative Commons Attribution 4.0 License.
the Creative Commons Attribution 4.0 License.
 | 19 Jan 2021
Long-term measurement of sub-3 nm particles and their precursor gases in the boreal forest
Nina Sarnela
Jenni Kontkanen
Lauri Ahonen
Pauli Paasonen
Tiia Laurila
Tuija Jokinen
Juha Kangasluoma
Heikki Junninen
Mikko Sipilä
Tuukka Petäjä
Markku Kulmala
Katrianne Lehtipalo
The knowledge of the dynamics of sub-3 nm particles in the atmosphere is crucial for our understanding of the first steps of atmospheric new particle formation. Therefore, accurate and stable long-term measurements of the smallest atmospheric particles are needed. In this study, we analyzed over 5 years of particle concentrations in size classes 1.1–1.7 and 1.7–2.5 nm obtained with the particle size magnifier (PSM) and 3 years of precursor vapor concentrations measured with the chemical ionization atmospheric pressure interface time-of-flight mass spectrometer (CI-APi-ToF) at the SMEAR II station in Hyytiälä, Finland. The results show that there are significant seasonal differences in median concentrations of sub-3 nm particles, but the two size classes behave partly differently. The 1.1–1.7 nm particle concentrations are highest in summer, while the 1.7–2.5 nm particle concentrations are highest in springtime. The 1.7–2.5 nm particles exhibit a daytime maximum in all seasons, while the 1.1–1.7 nm particles have an additional evening maximum during spring and summer. Aerosol precursor vapors have notable diurnal and seasonal differences as well. Sulfuric acid and highly oxygenated organic molecule (HOM) monomer concentrations have clear daytime maxima, while HOM dimers have their maxima during the night. HOM concentrations for both monomers and dimers are the highest during summer and the lowest during winter following the biogenic activity in the surrounding forest. Sulfuric acid concentrations are the highest during spring and summer, with autumn and winter concentrations being 2 to 3 times lower. A correlation analysis between the sub-3 nm concentrations and aerosol precursor vapor concentrations indicates that both HOMs (particularly their dimers) and sulfuric acid play a significant role in new particle formation in the boreal forest. Our analysis also suggests that there might be seasonal differences in new particle formation pathways that need to be investigated further.
- Article
(3727 KB) - Full-text XML
- BibTeX
- EndNote


Atmospheric aerosols are one of the largest sources of uncertainty in climate models. To diminish these uncertainties, it is vital to understand the sources and formation pathways of aerosol particles. New particle formation (NPF) in the atmosphere has been observed to occur in various environments (Kulmala et al., 2004; Kerminen et al., 2018, and references therein) from megacities (Hofman et al., 2016; Wu et al., 2007; Qi et al., 2015) rainforests (Wimmer et al., 2018; Andreae et al., 2018), rural areas (Mäkelä et al., 1997; Vakkari et al., 2011; Heintzenberg et al., 2017; Nieminen et al., 2014), and even polar areas (Weller et al., 2015; Kyrö et al., 2013; Järvinen et al., 2013; Sipilä et al., 2016). In the laboratory, aerosol particles have been observed to form through various pathways involving different chemical compounds and ions (e.g., Kirkby et al., 2016; Lehtipalo et al., 2018). Based on various estimates (Merikanto et al., 2009; Dunne et al., 2016; Kulmala et al., 2016), 40 %–80 % of aerosol particles in the atmosphere are formed from condensing vapors, and thus NPF contributes significantly to global aerosol number concentrations.
It is widely understood that sulfuric acid (SA) plays a significant role in atmospheric NPF (Kulmala et al., 2006; Riipinen et al., 2007; Paasonen et al., 2010). However, SA and water alone are not enough to explain atmospheric observations in the boundary layer (Chen et al., 2012; Paasonen et al., 2012). Studies indicate that at least one more vapor, for example a base like amine or ammonia, is needed for stabilizing the growing clusters (Almeida et al., 2013; Kirkby et al., 2016; Kürten et al., 2018). Highly oxygenated organic molecules (HOMs), formed in the atmosphere through auto-oxidation from volatile organic compounds, likely partake in particle growth everywhere in the boundary layer (Ehn et al., 2014; Mohr et al., 2019). Some HOMs can form charged clusters on their own, but it is unclear how important these pure biogenic clusters are for atmospheric NPF (Kirkby et al., 2016; Rose et al., 2018; Bianchi et al., 2017).
Freshly formed particles have typical sizes of 1–2 nm in diameter and grow to larger sizes by condensation of low-volatility vapors (Kulmala et al., 2014). Measuring these sub-3 nm particles is critical to a proper understanding of NPF and the early steps of particle growth in the atmosphere. One method of measuring sub-3 nm particles is the particle size magnifier (PSM) (Vanhanen et al., 2011). The PSM is a two-stage condensation particle counter (CPC) used to grow and count sub-3 nm particles. Sub-3 nm particles have been measured with the PSM in various environments (Kontkanen et al., 2017), from polluted Chinese megacities (Xiao et al., 2015) to rural areas (Kulmala et al., 2013) and mountain tops (Rose et al., 2015). Measurement devices are prone to errors, particularly in the field, and understanding the factors that affect the performance of the PSM and validating data from PSM measurements is an ongoing challenge (Kangasluoma et al., 2013, 2014, 2016b).
The long-term measurements at the SMEAR II station in Hyytiälä, Finland, have enabled studying atmospheric new particle formation and its prerequisites. Prior research has investigated the frequency of NPF in the boreal forest (Dal Maso et al., 2005; Nieminen et al., 2014) and how it is affected by condensation sink and cloudiness (Dada et al., 2017) and other meteorological conditions (Sogacheva et al., 2008). These studies have concluded that NPF is most common in Hyytiälä during spring and that NPF occurs most often during days with fewer clouds and a low condensation sink. Shorter campaign measurements have been used to investigate the connection between NPF and its precursors vapors (e.g., Riipinen et al., 2007; Kulmala et al., 2013; Yan et al., 2018). They indicate that both sulfuric acid and some organic vapors participate in NPF in Hyytiälä, but the possible seasonality of the mechanism and exact identity of the organic compounds are still unclear.
In this study, we analyze a 5-year data set from the SMEAR II station in Hyytiälä, southern Finland, in order to investigate the diurnal and seasonal variation of sub-3 nm particle concentrations in boreal forest and their connection to atmospheric NPF. Additionally, the sub-3 nm particle concentrations are compared with some of their precursor vapor concentrations in order to determine which vapors participate in atmospheric NPF and their relative roles in different size ranges. A secondary goal is to find the optimal settings to operate the PSM in order to detect sub-3 nm particles in field conditions.
2.1 Measurement location
All measurements were conducted at the SMEAR II (Station for Measuring Forest Ecosystem Atmosphere Relations) station in Hyytiälä, southern Finland (61∘5′0′′ N, 24∘170′ E; 181 ) (Hari and Kulmala, 2005) between April 2014 and April 2020. Hyytiälä is roughly 200 km from Helsinki, with the closest urban center Tampere about 60 km to the southwest. Tampere has a population of roughly 230 000 people. The SMEAR II station is considered a rural background station for atmospheric measurements and is surrounded by a Scots pine (Pinus sylvestris) forest. The emissions of volatile organic compounds at the station are dominated by biogenic vapors from the surrounding forest, monoterpenes in particular (Rantala et al., 2015). NPF events including particle growth have been observed only during daytime (Buenrostro Mazon et al., 2016), while biogenic cluster formation is also common during evening and night (Rose et al., 2018).
2.2 Particle size magnifier
We used the particle size magnifier (PSM) to measure the concentrations of sub-3 nm particles. The A11 nCNC-system (nano-Condensation Nucleus Counter) is a particle counter system developed for measuring the concentration of particles larger than 1 nm in size and size distributions in the sub-3 nm particle size region (Vanhanen et al., 2011). In this system, the PSM operates as a pre-conditioner, in which the small particles are first grown before they are funneled into a CPC for further growth and optical detection. The PSMs used in this study were manufactured by Airmodus (model A10) and used together with an Airmodus A20 CPC. In the PSM, the sample flow is turbulently mixed in the mixing region with a saturated heated flow to achieve supersaturation in the growth tube. Diethylene glycol (DEG) starts to condense on the sample particles, and they are grown up to the size of circa 100 nm in the cooled growth tube. From the growth tube, the flow is directed to a CPC where the particles are grown with butanol to optically detectable sizes.
Particle activation within the PSM depends on the supersaturation level in the PSM, which in turn depends on the temperature difference between the heated saturated flow, the sample flow, and the growth tube, as well as the saturator flow rate (Kangasluoma et al.. 2016b; Vanhanen et al., 2011; Okuyama et al., 1984). Because of this, the supersaturation can be adjusted by changing the saturator flow rate or the temperature difference between these components. A larger temperature difference between the heated saturated flow and the growth tube or a higher saturator flow rate leads to a higher supersaturation level, which means that smaller particles are activated and thus the cutoff size of the instrument, i.e., the diameter at which 50 % of the particles are activated, is lower. However, too high a supersaturation level will lead to formation of droplets via homogeneous nucleation causing a background signal. Studies have also shown that the cutoff size for particles depends not only on the supersaturation but also on the chemical composition of the sample particles, particle charge, and the condensing fluid (see Sect 2.2.3.) (Kangasluoma et al., 2016b; Winkler et al., 2012).
The PSM can be run in several measurement modes, but in this study we only used the scanning mode. The scanning mode makes it possible to determine the particle size distribution of sub-3 nm particles. In the scanning mode, the PSM scans through saturator flow rates to obtain the particle size distribution. In our study, the PSM scanned from 0.1 to 1.3 L min−1 and back to 0.1 L min−1 in 4 min. During the scan, particle counts are saved at a 1 s interval to the raw data file. Each measurement corresponds to the total concentration of particles above a certain size determined by the saturator flow rate, and therefore the changes in the measured concentration during a scan can be used to acquire information about the size distribution (Lehtipalo et al., 2014).
The PSM measurements were conducted at the SMEAR II station in a container at ground level. Due to maintenance, the instrument was changed on 23 February 2017 and 1 October 2018. In 2014, the sampling was done with a 40 cm long stainless-steel tube with 2.5 L min−1 flow rate. The diffusion losses were corrected for in the data inversion. From 2015 onward, the sampling was done with the core sampling method, where the air was taken from the outside at 7.5 L min−1 through a 40 cm stainless steel tube and the sample was taken from the middle of the flow into the PSM at 2.5 L min−1 to minimize sampling losses. The inlet also included a mechanism that allowed the bypass flow to be briefly reversed in order to provide particle-free air in ambient relative humidity for PSM background measurements (Kangasluoma et al., 2016a).
2.2.1 PSM data analysis
Before the PSM raw data were inverted, the data were run through a quality control algorithm in which we assumed that the measured total concentration during each scan should have a positive and statistically significant (p<0.05) correlation with the PSM saturator flow rate (Chan et al., 2020). Increasing the flow rate should always result in increased total concentration because we are activating a larger size range of particles. We omitted scans not fulfilling this requirement from further analysis, as they would lead to a negative concentration of sub-3 nm particles. These so-called “bad scans” could result from air mass changes or other variations in aerosol concentrations that are faster than the scan time or when the concentration of sub-3 nm particles is so low that it cannot be detected with this method.
We inverted the raw PSM data with the kernel method described in (Lehtipalo et. al., 2014) to obtain the size distribution of sub-3 nm particles. The kernel method uses a non-negative matrix inversion routine to calculate the size distribution based on activation curves measured during the calibration of the instrument. The data were inverted to a 16 min resolution (four scans) and two size bins (1.1–1.7 and 1.7–2.5 nm) to minimize the effect of noise on the analysis but still retain a high enough time resolution for the analysis. The size bin 1.7 nm was chosen as the divider because it is commonly used for nucleation rate calculations (Lehtipalo et al., 2018; Kirkby et al., 2016) and because cluster ions are typically smaller than this size (Hirsikko et al., 2011). Therefore, the smaller size bin probably consists of neutral and ion clusters, as well as small recently formed particles, while the larger size bin consists mainly of growing clusters and recently formed particles.
Recently, Cai et al. (2019) recommended another inversion routine for PSM data, the expectation-maximization algorithm (EM). However, as our data were already inverted with the kernel method and the EM method is computationally expensive, we decided to stick with the kernel method. The two inversion methods produce similar concentrations and size distributions when both are optimized for the data set in question (Cai et al., 2019). It remains as future work to test the applicability of the EM algorithm for SMEAR II data and optimize it to conditions with rather low particle concentrations.
2.3 Effect of supersaturation and background counts
At optimal temperature settings the PSM should activate a large fraction of even the smallest particles around 1 nm, while still minimizing the effect of homogenous nucleation within the PSM. In practice, a small background from homogeneous nucleation needs to be tolerated at higher saturator flow rates in order to activate the smallest particles, especially organic clusters. The amount of homogeneously nucleated droplets can be taken as an indicator of the supersaturation level (activation efficiency) (Jiang et al., 2011). Here we investigate how the background level affects the measured concentrations.
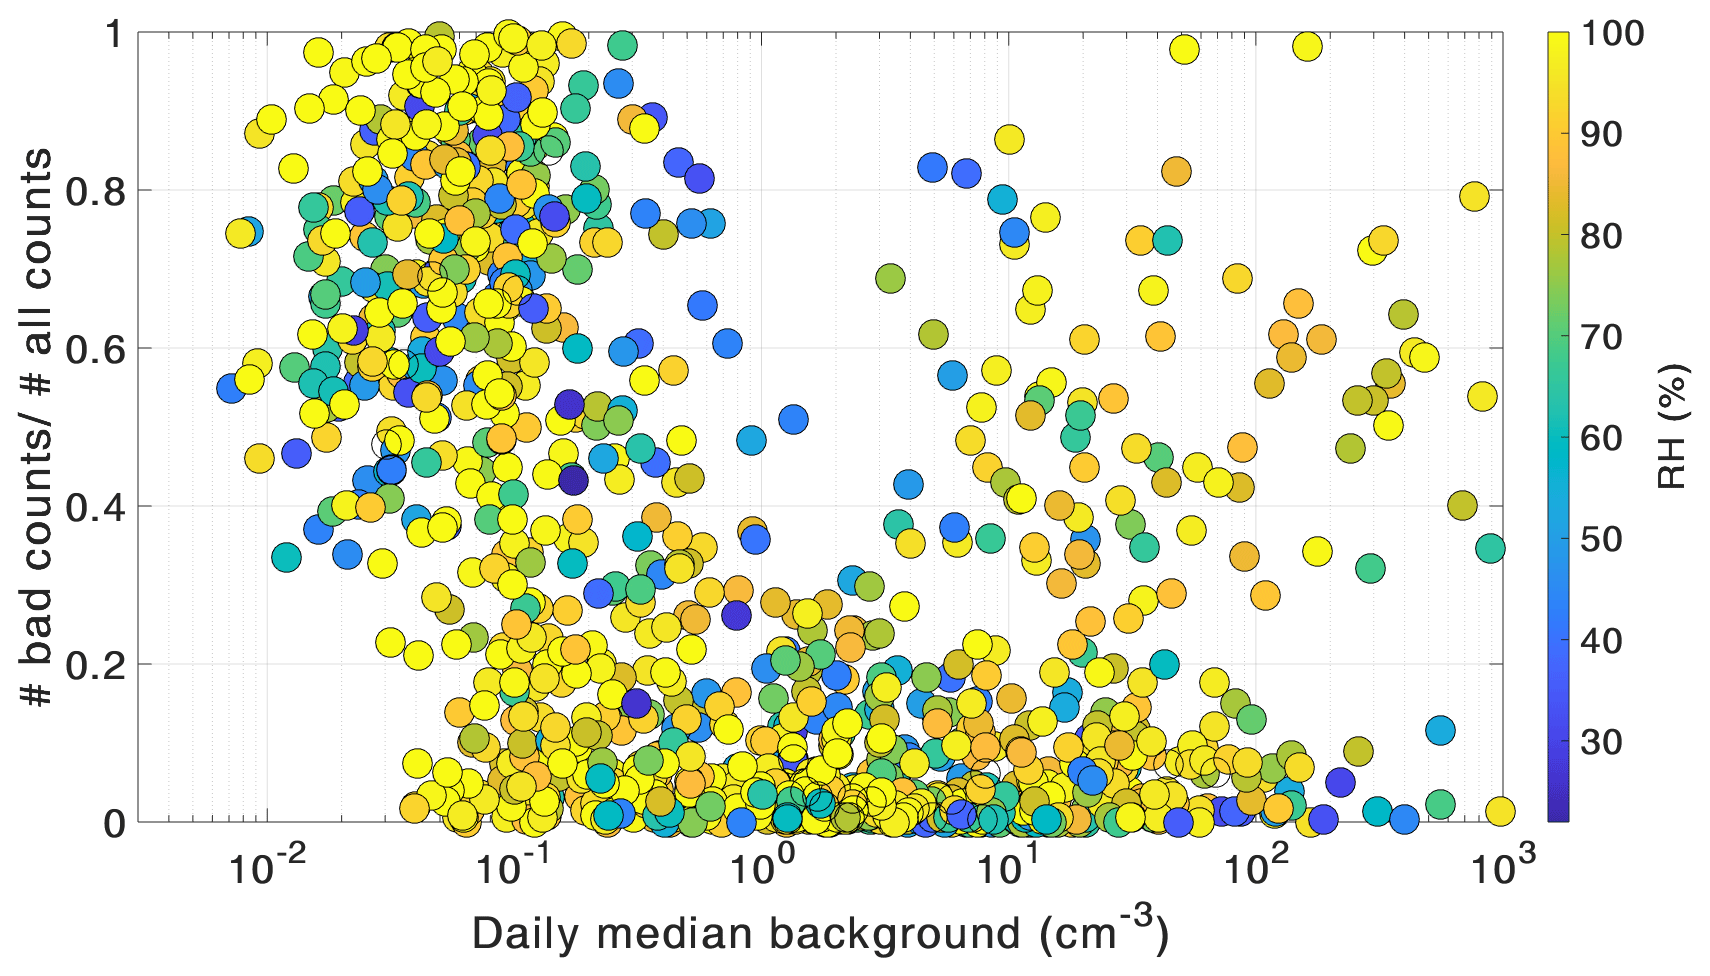
Figure 1The fraction of scans discarded during data quality check plotted against the daily medians of PSM background concentration. The color of the circles shows the ambient relative humidity (RH).
To monitor the instrument operation and supersaturation level, the background counts were automatically measured three times a day. Due to changes in external conditions and the state of the instrument, the background varies, and if the operator thought it was too high (> ca. 50 cm−3) or too low (< ca. 1 cm−3), the temperature settings were adjusted to keep the cutoff sizes same as before. During the whole measurement period, the daily averaged (over all saturator flow rates) homogenous background varied from less than 1 cm−3 to almost a 1000 cm−3. The background counts were subtracted from the data during data processing.
We investigated the fraction of scans discarded during data quality control as a function of the background concentrations (daily median) (Fig. 1). The u shape of the bad scan percentage clearly shows that the quality of the scans goes down if the PSM background is either too low (<0.1–1) or too high (>10). If the supersaturation level and consequently the background level inside the PSM is too low, the smallest particles cannot be activated and there is no detectable signal, which leads to noisy scans. A high background, on the other hand, can indicate that the PSM is not functioning properly. Thus, based on the quality of the scans alone, the PSM appears to work best when the background signal at the highest saturator flow rate is between 1 and 10 cm−3. However, in our measurements, the devices were never intentionally run at background levels higher than circa 50 cm−3. For this reason, the PSM could be stable at higher background levels as well, but our data does not allow us to draw conclusions on that. Furthermore, this behavior seems to be uncorrelated with the measured relative humidity at the measurement location, although laboratory studies have shown that RH can affect the particle activation efficiency with DEG (Kangasluoma et al., 2013; Jiang et al., 2011).
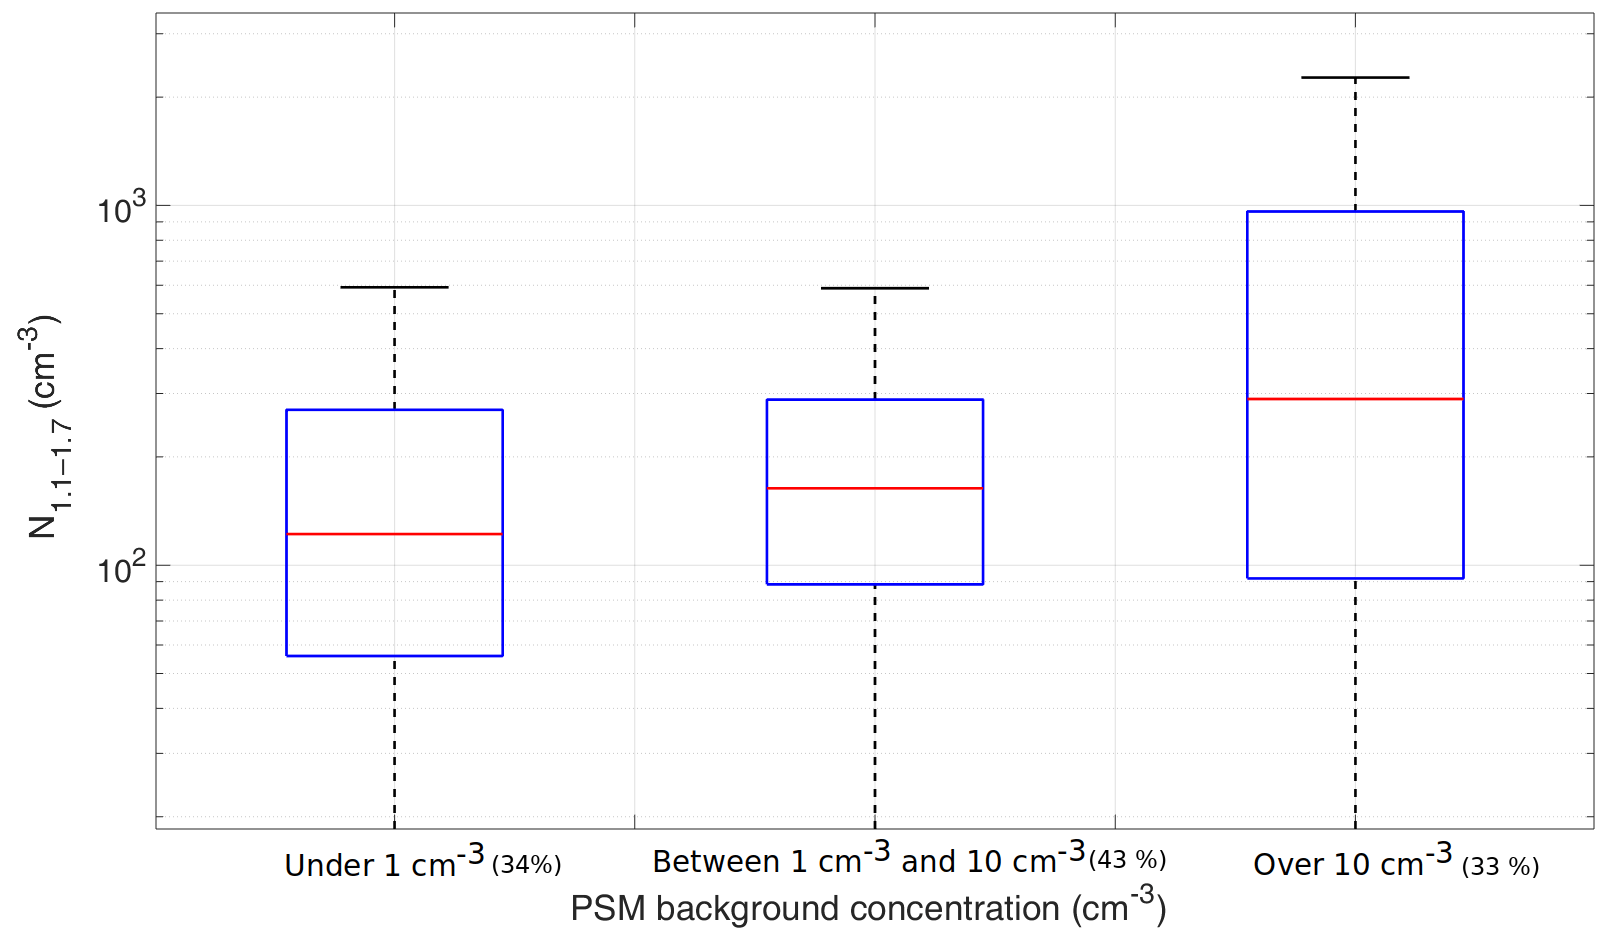
Figure 2Box plots of the measured 1.1–1.7 nm particle concentration at SMEAR II grouped with the PSM background concentration. The red line is the median concentration, and the blue box contains 50 % (25th to 75th percentile) of all data points. The whiskers mark the location of the 95th and 5th percentile data points. The number in parentheses indicates the fraction of all data points in each bin.
To investigate the effect of the background level (supersaturation) on the activation of the smallest particles, we split the data points to groups where the background is below 1 cm−3, above 10 cm−3, or between these two limits. The limits were chosen based on the observed fraction of bad scans in Fig. 1. We then studied 1.1–1.7 nm concentration as a function of the PSM background (Fig. 2). When the background is under 1 cm−3, the measured concentrations are on average lower than when the background level is above 1 cm−3, indicating that we are not activating all of the 1.1–1.7 nm particles at those settings. However, if the background level rises to over 10 cm−3, the variation also becomes notably larger, underlining the various factors affecting the concentration at higher background. At high background levels the PSM likely activates large vapor molecules or clusters whose concentrations are not stable, leading to larger variation in the concentration. When these species dominate the activated particles, the particle size distribution cannot be easily resolved from the scans. Other causes for higher variation at high background include, but are not necessarily limited to, faulty instrumentation, dirty sample lines, and dominant homogeneous nucleation of the working fluid.
The analysis described above leads to the conclusion that in the conditions of the SMEAR II station, the optimal settings for the PSM are found when the measured background is between 1 and 10 cm−3. As mentioned before, the PSM could be run stably at background levels above 10 cm−3 as well, but due to the results discussed above, we selected only PSM data with the instrument background between 1 and 10 cm−3 for further analysis. The optimal settings determined here can likely be used in measurement sites with similar particle concentrations and composition. However, if a measurement location has much higher particle concentrations or the changes in particle concentration are much more rapid than in a boreal forest, for example in an urban measurement location, they will have to be adjusted. In addition, the composition of the smallest particles might affect the ideal level of supersaturation to activate most of them without too much disturbance from homogenous nucleation.
2.3.1 Measurement uncertainties
Measuring sub-3 nm particles involves notable uncertainties, as small particles are very difficult to detect. Both PSM calibration and measurement are sensitive to the chemical composition of the particles being measured. The activation probability with DEG seems to be lower for organic particles than for inorganic particles. The cutoff size, the diameter at which 50 % of the particles are activated in the PSM, can be over a nanometer larger for organic particles than for inorganic particles (Kangasluoma et al., 2014, 2016b), but there are no systematic studies for different kinds of ambient particles. Because we do not know the exact chemical composition of the particles in the ambient air, the sizing in the measurement contains uncertainties. In addition, the activation probability of particles is also slightly different for charged and non-charged (neutral) particles (Kangasluoma et al., 2016b). Due to the uncertainties, we chose to compare two rather wide size ranges, 1.1–1.7 and 1.7–2.5 nm, although the PSM data would allow also more detailed sizing.
The PSM is calibrated by measuring particles from a known source. A certain particle size is selected with a differential mobility analyzer (DMA), and an electrometer is used as a reference instrument. This gives us the PSM detection efficiency for each selected size. The PSMs in this study were calibrated using charged tungsten oxide particles in the size range between 1.0 and 3.2 nm in mobility diameter, as there is no good calibration method and reference instrument readily available for neutral particles. Therefore, the diameters given should be taken as activation-equivalent sizes (we assume that the particles would activate as charged tungsten oxide particles do). The PSM may also be sensitive to ambient conditions, mainly relative humidity (Kangasluoma et al. 2013; Jiang et al., 2011). More discussion on the uncertainties can be found in Kangasluoma et al. (2020) and references therein.

Figure 3Comparison of 1.1–2.5 nm ambient ions measured by PSM and NAIS at SMEAR II. The orange line is the 1:1 line, the blue data points are hourly medians, and the red points are log-normally binned y directional medians, with the red whiskers showing the 75th and 25th percentile.
When dealing with long time series, an additional complication arises from changing and maintaining equipment. While the different PSMs used in the study over the years are essentially similar devices, they have slightly varying cutoff limits and detection efficiency curves, which has been taken into account during data processing but which could still affect the final inverted concentrations. The data preprocessing and inversion method can also produce additional uncertainties that are difficult to quantify (Lehtipalo et al., 2014; Cai et al., 2019).
To estimate the magnitude of error in the concentrations caused by the uncertainties related to PSM measurement, we compared the ion concentrations detected by the PSM to those from a Neutral Cluster and Air Ion Spectrometer (NAIS, described briefly in Sect. 2.4), which is the only other instrument measuring in the same size range at SMEAR II. The ion concentrations were acquired from a PSM with an ion trap inlet (Wagner et al., 2017, Kangasluoma et al., 2016a) measuring in the same container as the long-term measurement PSM. The neutral PSM data were measured between April 2017 and April 2019. The setup is otherwise similar to the PSM used in the rest of this study, but the ion trap is switched on every 8 min and then off again after 8 min. This allows us to differentiate between neutral particle and total particle concentrations and acquire the ambient ion concentration from the PSM.
The comparison shows that the PSM detects small ions and charged particles fairly well and that the overall concentrations measured with the PSM and the NAIS are of the same magnitude in the size range used in this study (Fig. 3). The relative concentration (from binned y directional medians) measured by the PSM is between 29 % and 100 %, with the median relative concentration being 65 %. This suggests that most but not all of the ambient ions are activated by the PSM and that we are more likely underestimating than overestimating the ambient concentrations of small particles. It should be noted that the ions are a mixture of different chemical compounds, and the ion composition varies diurnally and seasonally in boreal forest (Ehn et al., 2010), so we expect that their activation fraction (relative to tungsten oxide ions used for calibrating the PSM), varies as well. Detailed analysis of the activation of different types of ambient ions in the PSM is subject to future studies. Based on laboratory experiment, which conclude that the effect of charge on the cutoff size is between 0 and 0.50 nm (Kangasluoma et al., 2016b), the above results mean that we likely activate neutral particles as well, but their activation efficiency is difficult to quantify.
2.4 CI-APi-ToF
We used a chemical ionization atmospheric pressure interface time-of-flight mass spectrometer (CI-APi-ToF, Jokinen et al., 2012) with a nitrate ion as a reagent ion to measure low-volatility vapors at the SMEAR II station. The detection of CI-APi-TOF is based on proton transfer reactions or clustering with the nitrate ion through collisions with nitrate ions (NO), nitrate ion–nitric acid dimers (HNO3NO), and nitrate ion–nitric acid trimers ((HNO3)2NO). The nitrate ion chemical ionization is a very selective method as nitrate ions react only with strong acids, such as malonic acid, sulfuric acid, and methane sulfonic acid (Eisele and Tanner, 1993, and oxidized organic compounds that have at least two hydroperoxy (OOH) groups or other H-bond-donating groups (Hyttinen et al., 2015).
In the chemical ionization inlet ∼20 L min−1 of sheath flow is mixed with ∼5 milliliters per minute flow of air saturated with nitric acid (HNO3) and then guided to the ionization source. In the ionization source, nitric acid is ionized with a soft x-ray source (Hamamatsu). The sheath flow with nitrate ions is guided to the drift tube where it gets mixed with the sample flow (10 L min−1). The nitrate ions (or ion clusters) and the molecules of the sample have around 200 ms to react with each other in the drift tube before they enter the APi of the mass spectrometer through a 0.3 mm critical orifice with flow of ∼0.8 L min−1. In the APi the molecules of the sample are gradually pumped out while the ions are kept in the middle of the stream by quadrupoles and ion lenses (Junninen et al., 2010). In the ToF chamber the ions are accelerated with an energy pulse, and they are separated by their time of flight to reach the detector in the chamber.
The CI-APi-TOF measurements were conducted at a 35 m altitude in a tower right next to the ground-level particle measurements. The measurement height is above the forest canopy. Zha et al. (2018) found that the HOM concentrations above and inside the canopy are similar when the boundary layer is well-mixed. The concentrations between these altitudes may differ during a strong temperature inversion or a shallow surface layer in nighttime.
All the low-volatility vapor measurements were performed with the same instrument that was calibrated twice during this measurement period with a sulfuric acid calibrator (Kürten et al., 2012). In the calibrations we achieved calibration coefficients 2.4×109 cm−3 for 2014–2018 and 4.6×109 cm−3 for 2019 onwards and used the same coefficient for all detected compounds. This assumption is valid for compounds that cluster with nitrate ions at the collision limit and have equal collision rates. The collision rates of nitrate ions with SA and with HOMs are approximated to be very similar (Ehn et al., 2014). Mass spectra obtained from the instrument were analyzed using the “tofTools” program described in Junninen et al. (2010) and unit mass resolution was used in peak integration. The uncertainty of the concentrations is estimated to be .
2.5 Complementary data
The NAIS measures the mobility distribution of ions in the atmosphere between 0.8 and 40 nm, and it can be used to measure either naturally charged ions or the particles can be charged with a corona discharge to measure total particle concentration (Kulmala et al., 2007). We used an automatic atmospheric NPF event classification algorithm developed by Dada et al. (2018) to determine NPF event times during the investigated time span. The event classification algorithm provided the start, peak, and end times of NPF events using data from the NAIS. Relative humidity data are from the Rotronic MP102H RH sensor in the measurement mast at the SMEAR II station, measured at 16 (before February 2017) and 35 m heights. The global radiation data were measured at the same measurement mast, with the Middleton SK08 pyranometer at 18 m height (before September 2019) and the EQ09 pyranometer at 35 m height.
2.6 Analysis methods for comparing PSM and CI-APi-TOF data
We used the time series of quality-controlled and inverted sub-3 nm particle concentrations to study the diurnal and seasonal patterns of sub-3 nm aerosol particles. The same seasonal analysis was performed on the available CI-APi-ToF data.
Measured sub-3 nm particle concentrations were then compared to the vapor concentrations to determine correlations between observed particle and vapor concentrations during NPF events. In order to ignore the effect of the diurnal cycles on the analysis, only events that occurred between 10:00 and 14:00 LT were included in the correlation analysis. Correlations were also separately investigated for spring, summer, and autumn NPF events. There were not enough data points for events during winter for separate analysis.
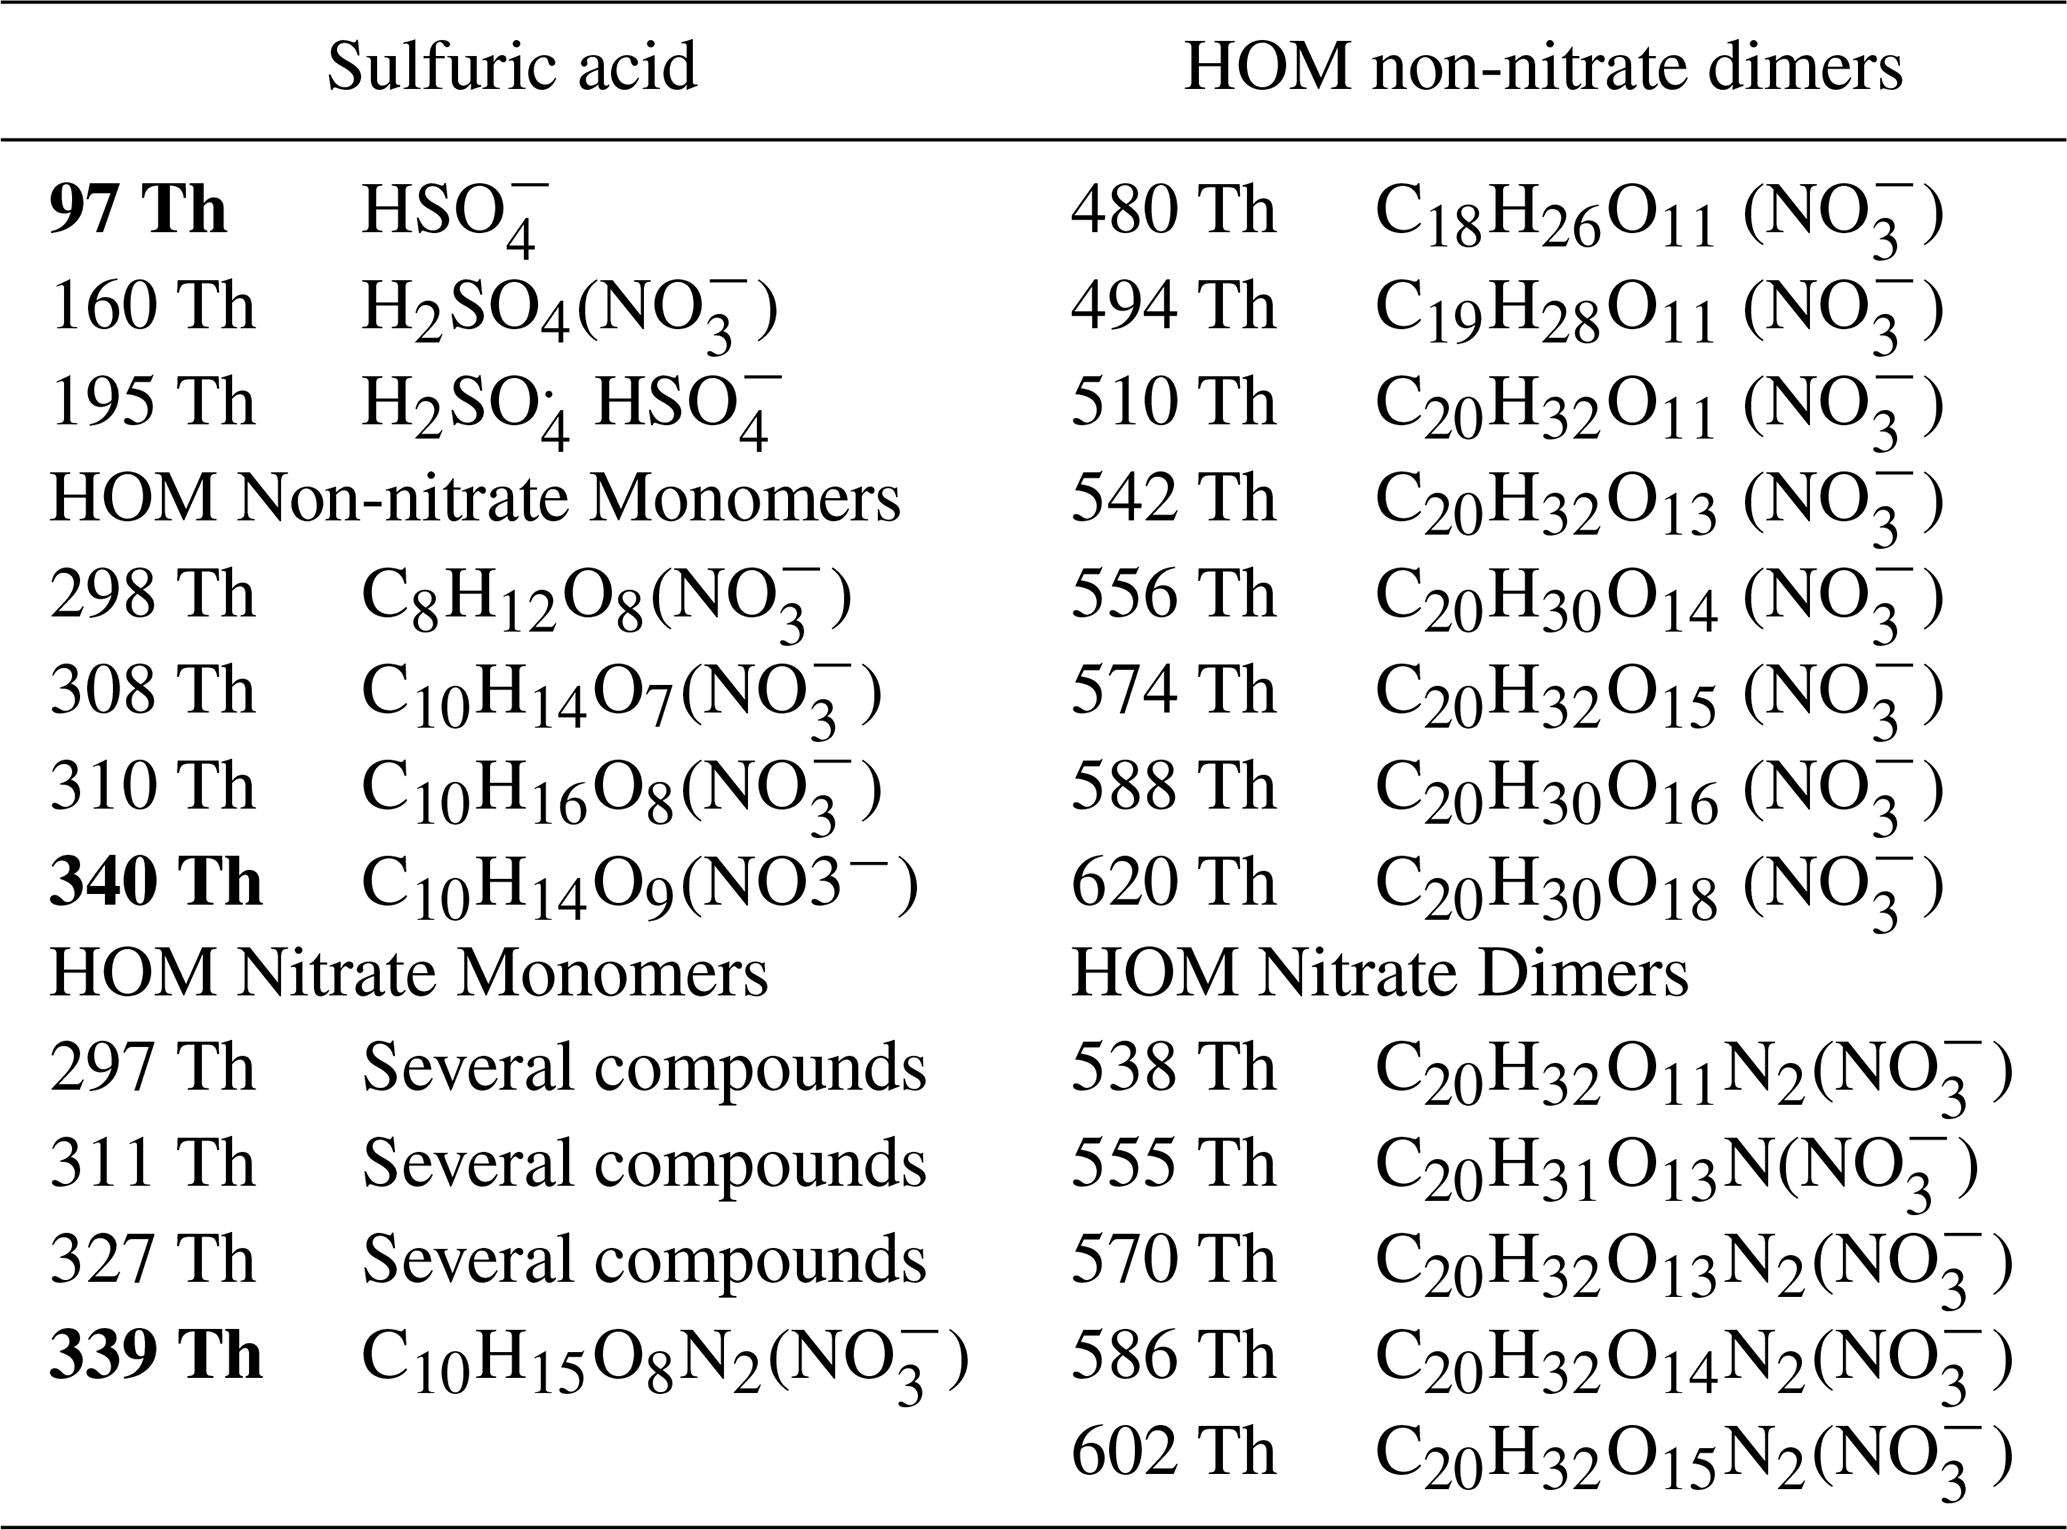
Table 1The mass peaks selected for analysis and their molecular formulas. Sulfuric acid and HOM monomer peaks were selected based on correlation with the bolded mass peaks and summed together in order to increase the signal-to-noise ratio. HOM nitrate monomer peaks listed as “several compounds” contain HOM nitrate monomers and radicals, but a single peak cannot necessarily be identified as the main compound.
We compared the particle concentrations with measured SA and HOM concentrations since they have been identified to directly participate in NPF in laboratory studies (Sipilä et al., 2010; Kirkby et al., 2016). The HOM molecules were further divided to monomers and dimers, as well as nitrates and non-nitrates, according to their elemental composition. The molecules were divided into nitrates and non-nitrates because nitrate HOMs typically have a higher volatility than non-nitrate molecules (Yan et al., 2020), and it is possible that their contribution to NPF is different (Lehtipalo et al., 2018). For each category, we summed up the concentrations of the selected peaks. For our purposes, it is not necessary to identify all possible peaks in each category but instead to obtain the temporal variation of different types of particle precursors.
For SA, HOM non-nitrate monomers, and HOM nitrate monomers, we chose mass peaks 97 Th (HSO, 340 Th (C10H14O9()), and 339 Th (C10H15O8N2(NO), respectively (Sarnela et al., 2018; Kulmala et al., 2013). In order to increase the signal-to-noise ratio, we also chose extra mass peaks based on correlation and added up their signal. For SA, we chose all mass peaks for which the logarithmic correlation coefficient with the SA monomer was higher than 0.95, and for the organic molecules we chose mass peaks for which the logarithmic correlation with the original peak was higher than 0.85. Some of the selected peaks can contain several compounds, including HOM nitrate monomers and radicals. For HOM dimers, we chose known peaks from previous studies because there was not one dominant peak to choose. For HOM non-nitrate dimers we selected 480 (C18H26O11 (NO, 494 (C19H28O11 ()), 510 (C20H32O11 (NO, 542 (C20H32O13 (NO, 556 (C20H30O14 (NO, 574 (C20H32O15 (NO, 588 (C20H30O16 (NO, and 620 Th (C20H30O18 (NO based on Sarnela et al. (2018). For HOM nitrate dimers we selected 538 (C20H32O11N2(NO, 555 (C20H31O13N(NO, 570 (C20H32O13N2(NO, 586 (C20H32O14N2()), and 602 Th (C20H32O15N2(NO)) from known peaks (Zha et al., 2018). The complete list of peaks used in our analysis and their molecular formulas is listed in Table 1.
Sub-3 nm particle concentrations were also compared to combinations of different precursor molecule concentrations since particle formation might involve several different vapor species. Laboratory experiments replicating boundary-layer NPF in forested regions (Riccobono et al., 2014; Lehtipalo et al., 2018) and previous analysis of field data sets (Paasonen et al., 2010) have shown that particle formation rates can be parameterized using a product of sulfuric acid concentration and organics concentrations. Therefore, we expect that sulfuric acid and HOMs or some combination of them should correlate well with new particle formation in a boreal forest and the correlations in different size ranges might reveal which precursors are most important at different stages of the process.
In the following section we present the 74 month time series of sub-3 nm particle concentrations and the 31 month time series of aerosol precursor vapors measured at the SMEAR II station in Hyytiälä, southern Finland, and their comparison for the overlapping time period. The descriptive statistics for both particle and precursor vapor concentrations are presented in Table 2.
Table 2The descriptive statistics of both particle and vapor concentrations used in the data both for the entire data set and for each season separately. The median values are bolded with the 25th and 75th percentiles included in parentheses.

3.1 Time series of particle concentrations
The entire time series of the particle concentrations are shown in Fig. 4, and their annual variations are shown in Fig. 5. The concentrations show a clear seasonal pattern for both size bins: 1.1–1.7 and 1.7–2.5 nm. We observe the highest concentrations of 1.1–1.7 nm particles in late spring and summer (maxima in May and July), while 1.7–2.5 nm particles have a clear annual maximum during early spring (March). We also observe the lowest concentrations for both size classes during the winter months, consistent with earlier observations at the same site (Kontkanen et al., 2017). The end of year 2016 and early 2017 show lower total concentrations than the rest of the time series. This could be due to atypical environmental conditions, but we cannot exclude technical reasons leading to diminished detection efficiency (the instrument was thereafter exchanged in spring 2017).
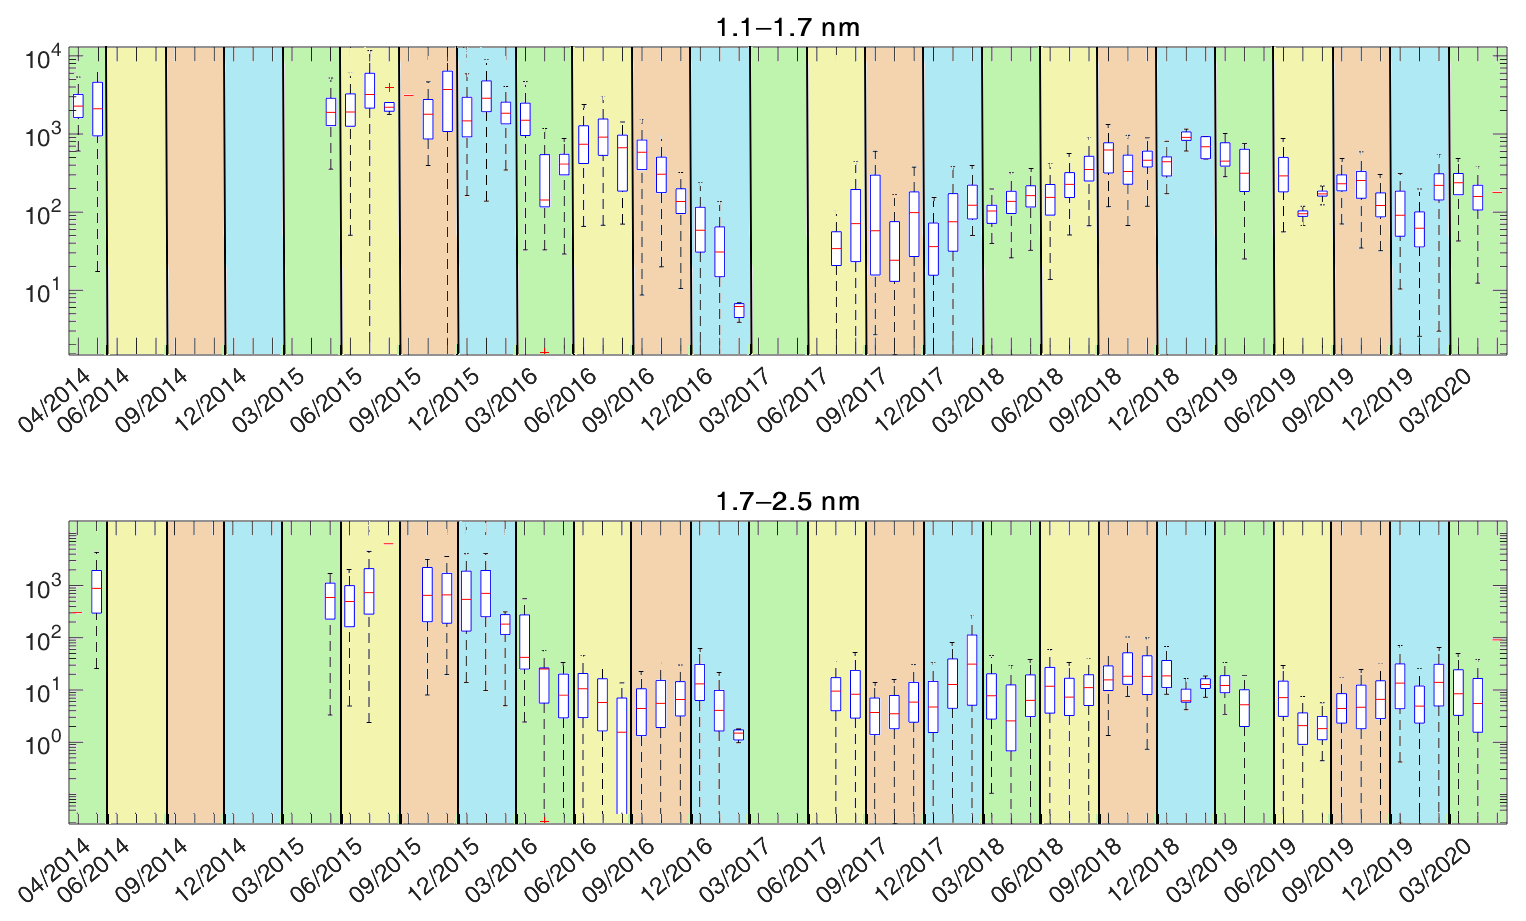
Figure 4The monthly variation of the particle concentration in the two PSM size bins. The red line shows the median concentration for each month and the blue box contains 50 % (25th to 75th percentile) of all data points. The whiskers mark the location of the 95th and 5th percentile data points. The areas with the green background are spring months, the yellow background represents summer months, the brown background represents autumn months, and the blue background represents winter months. The tick marks visible are in the middle of each month.

Figure 5The annual variation of the particle concentration in the two PSM size bins. The red line shows the median concentration for each month and the blue box contains 50 % (25th to 75th percentile) of all data points. The whiskers mark the location of the 95th and 5th percentile data points.
The median sub-3 nm concentration of the entire data set from 2014 to 2020 was , with the spring and summertime concentration being and the autumn and wintertime concentration being . Kontkanen et al. (2017) ended up with somewhat higher concentrations (median ), although the variation in concentrations is similar. That is likely because of the slightly wider size range in that study (up to 3 nm, where the largest size bin was obtained from the difference between PSM and a differential mobility particle sizer) and because their data were not filtered to remove scans with too high background. Additionally, the background was measured and subtracted manually from the signal in data before 2015. This may have resulted in an underestimation of the background. The 2 months of measurements from 2014 at the beginning of the time series indeed show a higher median concentration than the rest of the data. However, the exact reason for the difference is not clear and might be a combination of true variability between years and technical reasons.
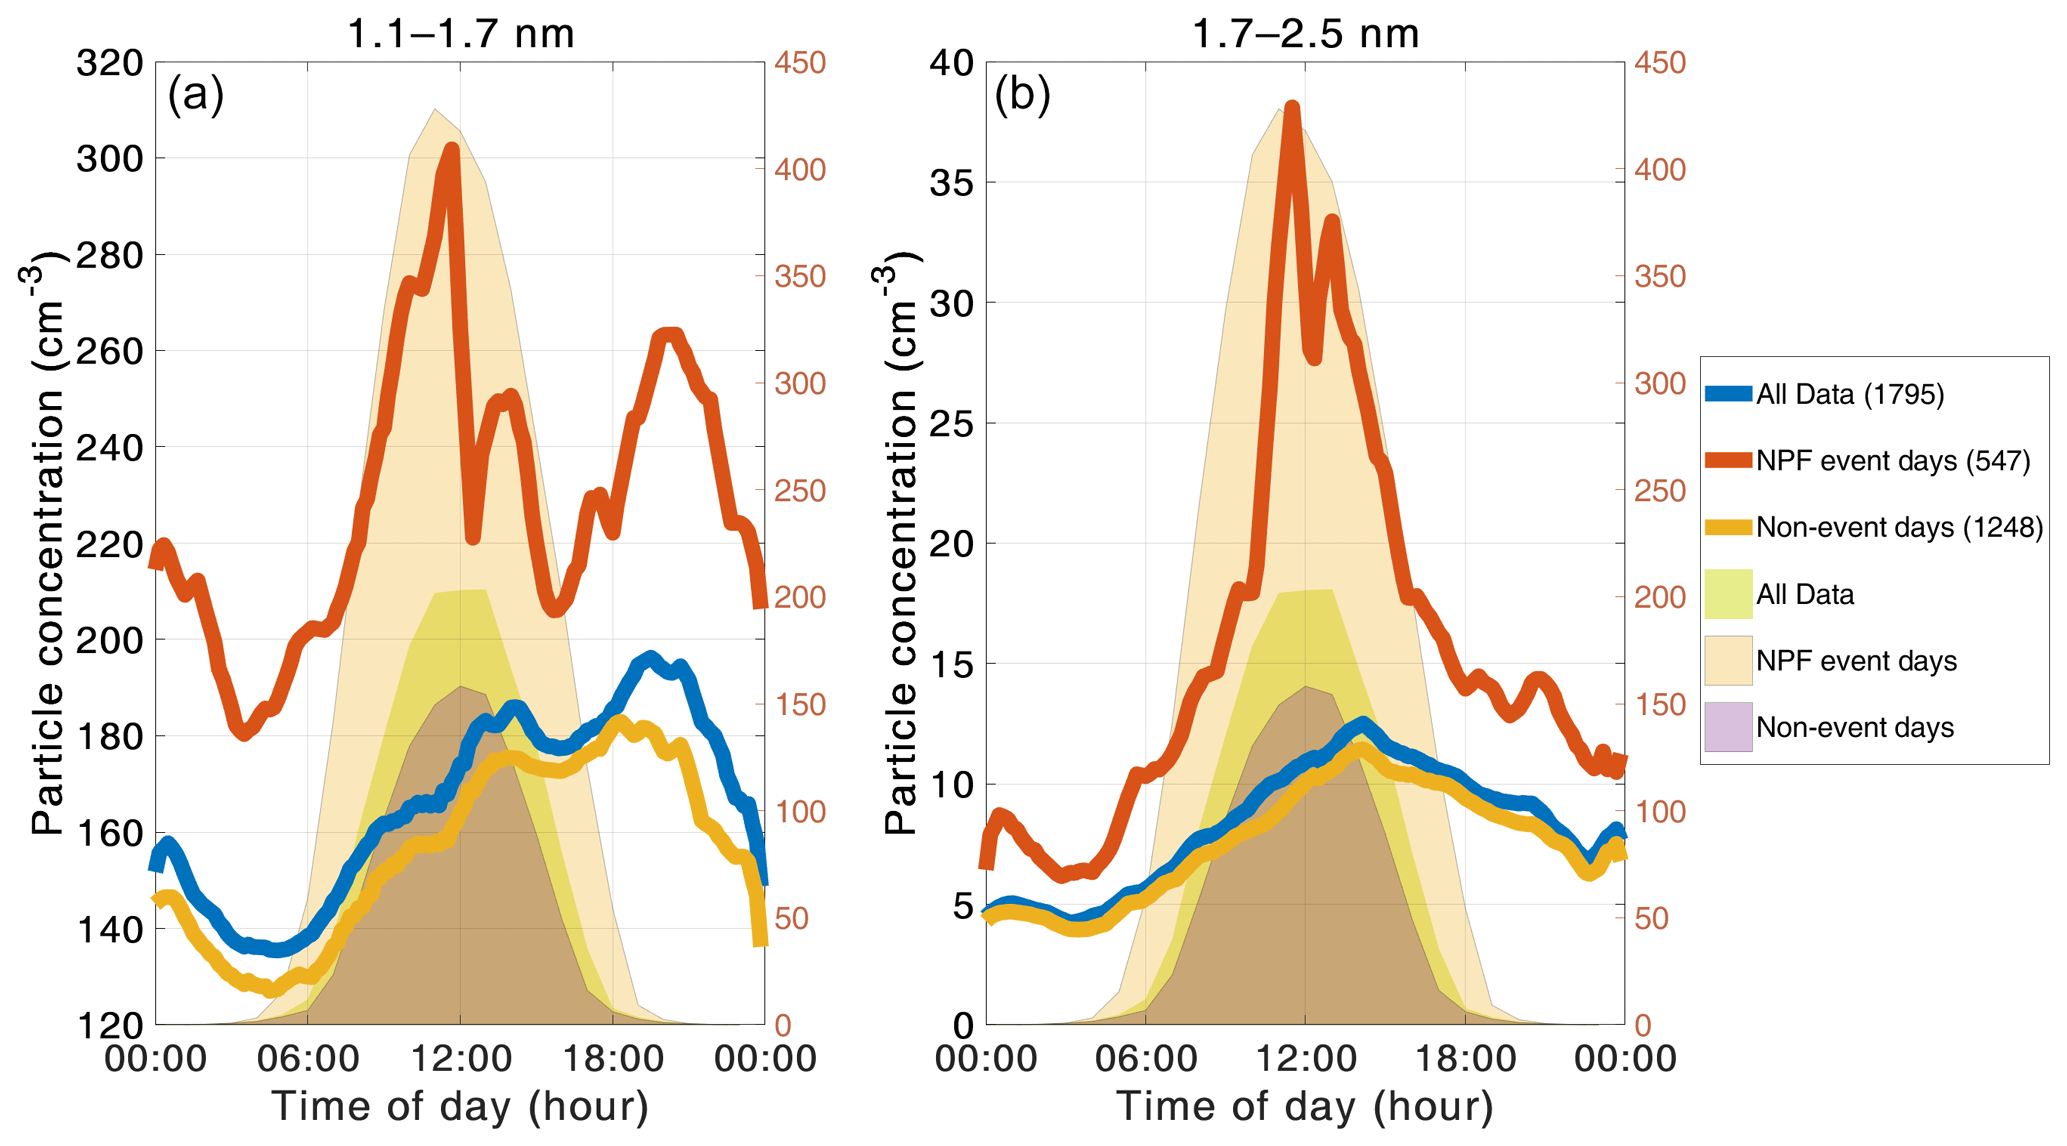
Figure 6The median diurnal cycles of the particle concentrations for the 1.1–1.7 nm (a) and 1.7–2.5 nm (b) size ranges. The blue, red, and yellow lines show the concentrations for the entire data set, new particle formation events, and non-event days, respectively. The light green, light red, and lilac shading are the diurnal cycles of global radiation for all data, NPF event days, and non-event days, respectively (right y axis). The number of days included in the median day is presented by the number in parentheses in the legend.
The diurnal patterns of particle concentrations are shown in Fig. 6. For the entire data set, we observe a maximum for the 1.1–1.7 nm concentration in the evening and a second smaller peak in the afternoon. In this size bin, the measured concentrations can consist of both very small particles, large gas molecules, and/or molecular clusters (Ehn et al., 2014); the distinction between them cannot be made based on the measurement. Consequently, the maximum can result from a combined effect of the diurnal behaviors of large organic molecules and newly formed molecular clusters. The diurnal variation of organic compounds is discussed below. The evening maximum can be due to organic molecules or molecular clusters, which have been observed to form during the evening via a biogenic ion-induced mechanism (Rose et al., 2018). The 1.7–2.5 nm particle concentration exhibits a daytime maximum in the afternoon around the same time as the smaller size range, but the evening maximum is missing in this size range.
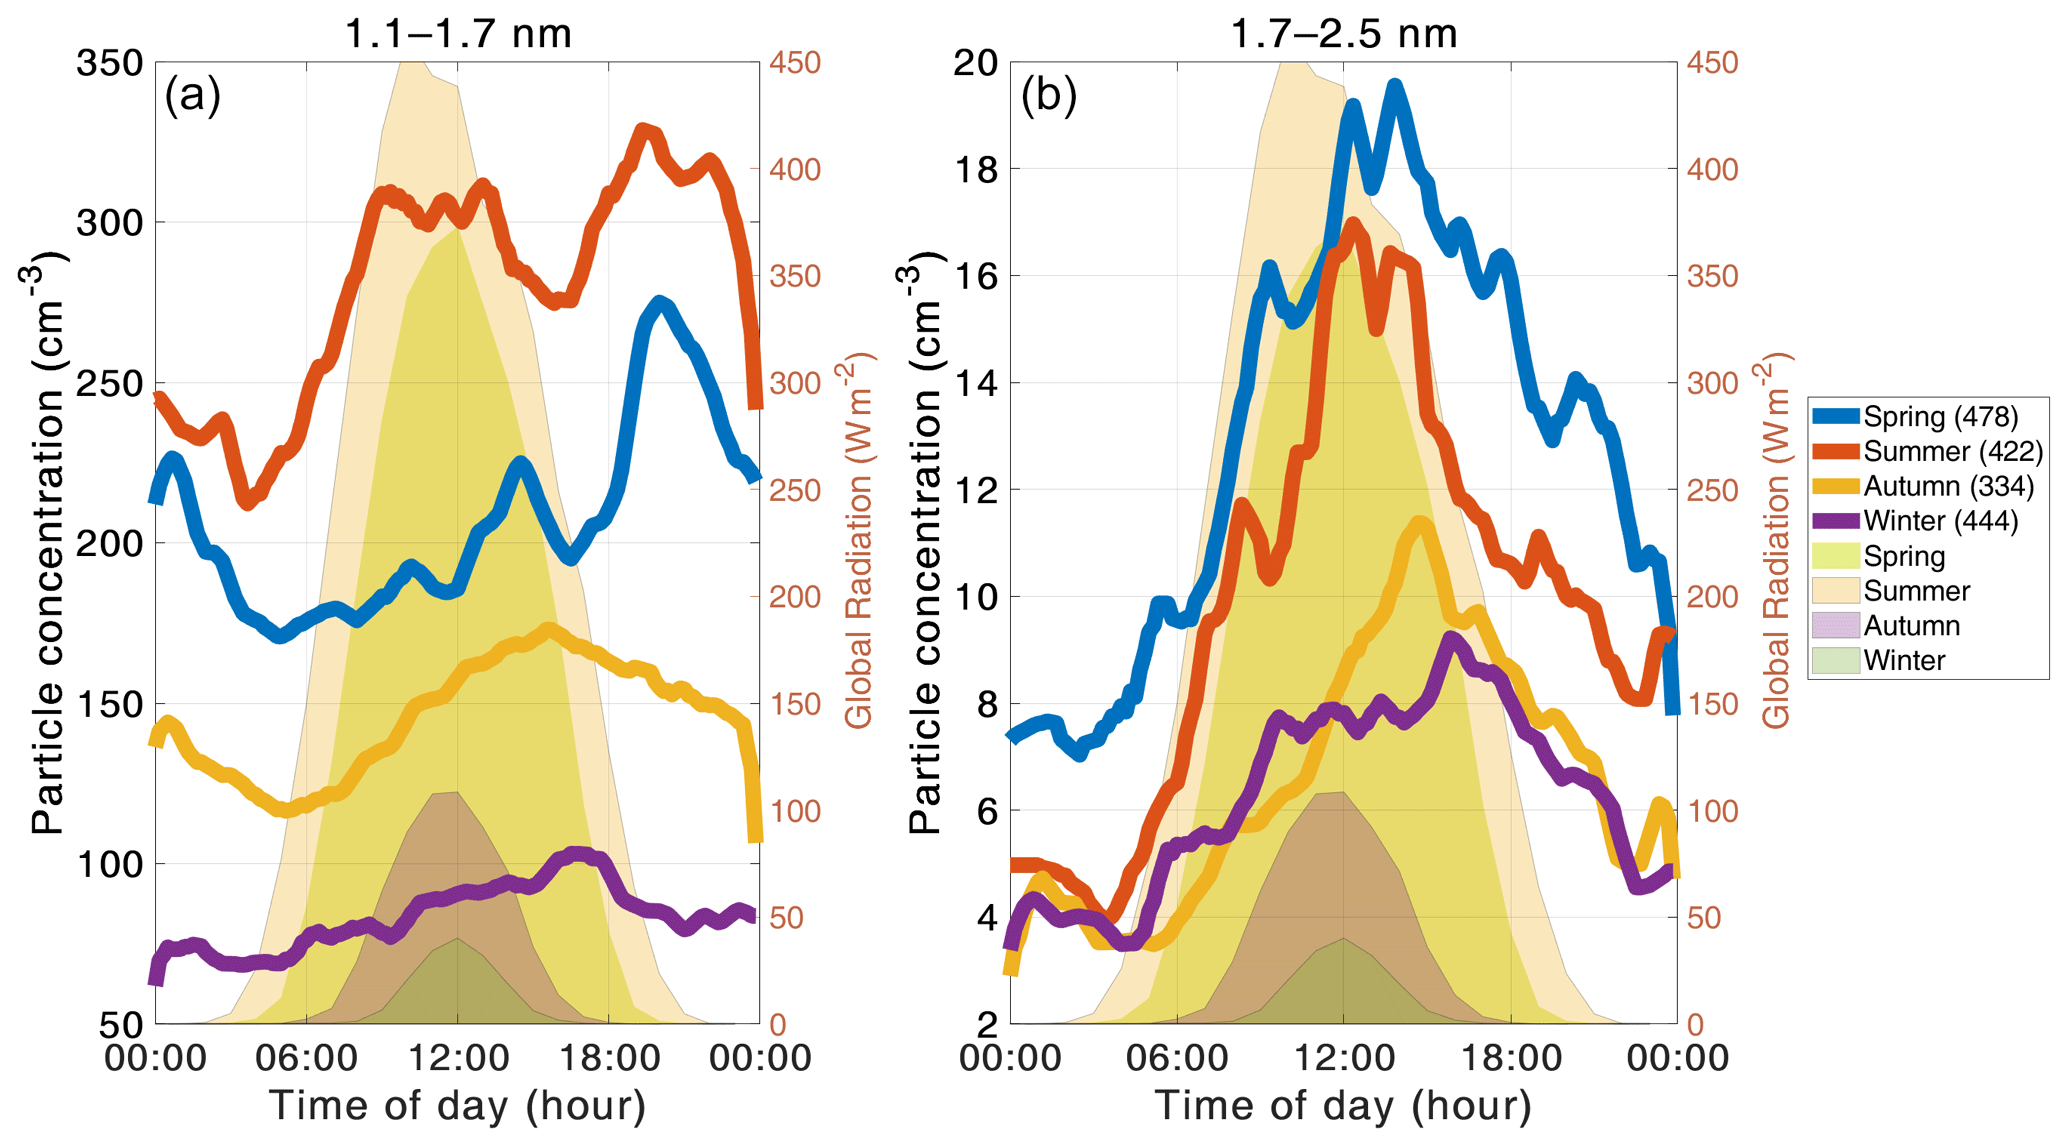
Figure 7The median diurnal cycles of the particle concentrations in different seasons. Panel (a) shows the 1.1–1.7 nm particle concentration seasonal diurnal cycles and (b) shows the 1.7–2.5 nm particle concentration seasonal cycles. The blue, red, yellow, and purple lines show the seasonal diurnal cycles spring, summer, autumn, and winter, respectively. The area plots in the background present the seasonal diurnal cycle for each season. The light green, light yellow, lilac, and dark green shading represent spring, summer, autumn, and winter, respectively. The number of days included in the median day is presented by the number in parentheses in the legend.
During regional NPF events, we expect the sub-3 nm size distribution to behave differently than when there is no event, in the case that the formation of small particles takes place at our measurement location. In Fig. 6, we also present diurnal cycles for NPF event and non-event days separately. Even though the event classification algorithm gives us exact event times, we used entire event days in this part of the analysis. The most noticeable difference between NPF event and non-event days is the strong midday maximum for both 1.1–1.7 and 1.7–2.5 nm particle concentrations on NPF event days. This maximum does not appear during non-event days, leading to the conclusion that the increase in midday concentrations can be attributed to regional NPF. This is also supported by the 1.7–2.5 nm concentrations starting to rise later than the 1.1–1.7 nm concentration, consistent with the fact that it takes a while to grow the particles into the larger size range. The concentrations are also generally higher during NPF than non-NPF days, indicating that conditions are favorable for cluster/particle formation. However, the 1.1–1.7 nm particle concentration only shows a 40 % relative increase during NPF in comparison to non-NPF days, while the 1.7–2.5 nm particle concentration increases by over 250 %. This suggests that the 1.7–2.5 nm particle concentration is more directly related to new particle formation. It may also mean that the production and sinks of 1.1–1.7 nm particles are large enough that the enhanced growth into the 1.7–2.5 nm particle size range during event times is not the largest contributing factor in the concentration. It also confirms that there is a constant concentration of small particles and clusters present in the atmosphere, much like ion clusters (Kulmala et al., 2007; 2013; Kontkanen et al., 2017).
Because the formation mechanism and thus particle concentrations can vary depending on the season, we studied the diurnal cycles separately for each season (Fig. 7). We observe the largest concentrations of 1.1–1.7 nm particles during summer and the lowest during winter, which is likely connected to the biogenic activity in the surrounding forest. During spring and summer, the concentrations of 1.1–1.7 nm particles have distinct maxima in the early afternoon and also in the evening. These evening peaks have been linked to the formation of large organic clusters (Rose et al., 2018). Thus, it is not surprising that they are absent in the autumn and winter data. However, autumn and winter concentrations have a single maximum in the late afternoon. These late afternoon and evening peaks all occur several hours after global radiation has gone down to essentially zero, indicating that the formation mechanism does not require sunlight. However, it should be kept in mind that the boundary layer dynamics can also affect the measured concentrations.
The size bin of 1.7–2.5 nm particles exhibits the largest median concentrations during spring and summer, but the diurnal variation is rather similar in all seasons. The higher concentration during spring can be at least partially attributed to an increased frequency of regional NPF (Nieminen et al., 2014). Additionally, we observe clear early afternoon maxima during spring, summer, and autumn that can likely be linked to new particle formation, while the concentrations during nighttime are very low. Concentrations during winter have a weaker diurnal cycle and lower median concentration, consistent with observations that NPF is rare during wintertime.
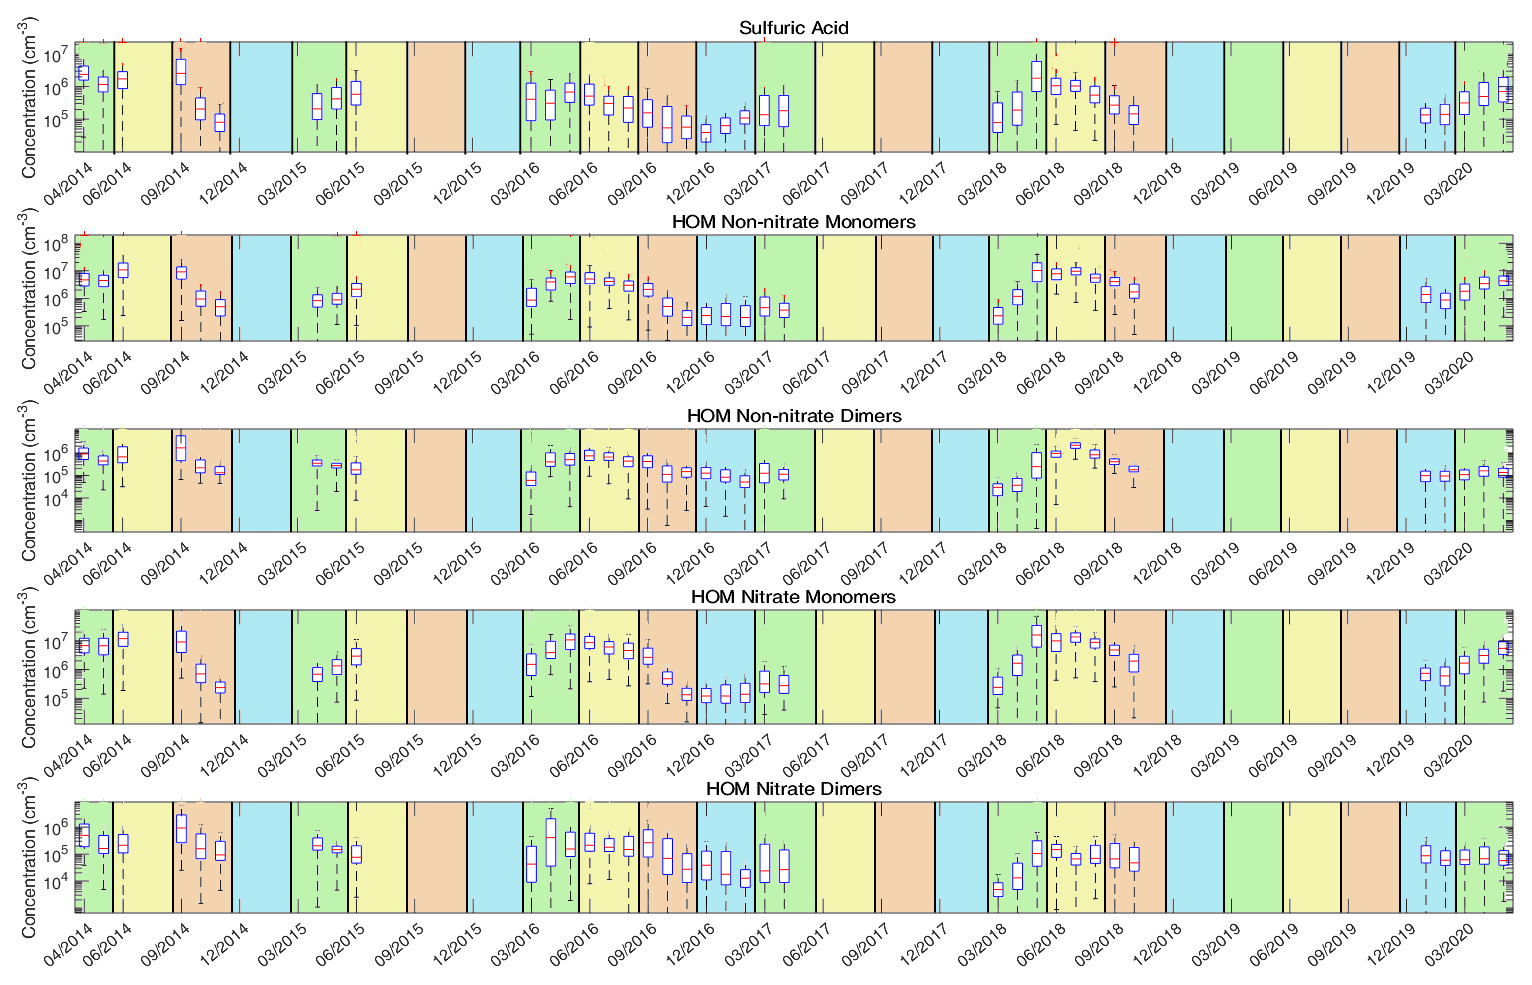
Figure 8The time series of the selected atmospheric aerosol precursor vapors. From the top down, the time series are shown for sulfuric acid, HOM non-nitrate monomer, HOM non-nitrate dimer, HOM nitrate monomer, and HOM nitrate dimer concentrations, respectively. The time series are from April 2014 to April 2020. The red line is the median concentration for each month, and the blue box contains 75 % of all data points. The whiskers mark the location of the 95th and 5th percentile data points. The areas with the green background are spring months, the yellow background represents summer months, the brown background represents autumn months, and the blue background represents winter months.
3.2 Time series of vapor concentrations
The time series of the precursor vapors are shown in Fig. 8, and their annual variation is presented in Fig. 9. We observe the highest concentrations of all studied vapors between late spring and early autumn and the lowest concentrations in either late autumn, winter, or early spring. This can be explained by the annual behavior of the precursors of the studied vapors. The main pathway for sulfuric acid formation is oxidation of SO2 by OH, and formation of OH is dependent on radiation, whereas the monoterpene emissions are strongly dependent on the temperature (Guenther et al., 1995) and thus are highest from late spring and to early autumn (Rantala et al., 2015; Hakola et al., 2003). There are no visible differences in concentrations between different years.

Figure 9The annual variation of the analyzed precursor vapors. The red line shows the median concentration for each month, and the blue box contains 50 % (25th to 75th percentile) of all data points. The whiskers mark the location of the 95th and 5th percentile data points.
We also analyzed the diurnal behavior of the measured aerosol precursor vapors in the same fashion as the particle concentrations discussed above. The diurnal patterns of SA, HOM monomer (nitrate and non-nitrate), and HOM dimer (nitrate and non-nitrate) concentrations for the entire data set are shown in Fig. 10. SA concentration has a similar diurnal pattern to that of global radiation, which is expected as sulfuric acid is formed in the atmosphere mainly through photochemical oxidation (Lucas and Prinn, 2005; Petäjä et al., 2009). HOM non-nitrate monomer concentration has a minimum in the early morning, with the concentration rising throughout the day until the maximum is reached after 18:00 LT. In contrast, HOM nitrate monomer concentration exhibits a single daytime peak around midday, similar to the sulfuric acid concentration, but a slower decrease towards the night following the diurnal behavior of NO in the atmosphere (Yan et al., 2016, ACP). HOM dimer (both nitrate and non-nitrate) concentrations have different diurnal cycles than the other vapors, exhibiting minima during daytime and an increased concentration at night. During nighttime the termination reactions of RO2 radicals with NO and HO2 are less likely, and thus a termination reaction with another RO2 radical, resulting in dimer formation, is more plausible. Similar patterns have been found by Bianchi et al. (2017) using CI-APi-ToF data from spring 2013 in Hyytiälä and Jokinen et al. (2017) during a solar eclipse.

Figure 10The diurnal cycle for each selected atmospheric precursor vapor for the entire data set (blue), for new particle formation event days (red), and for non-event days (orange). The number of days included in the median day is presented by the number in parentheses in the legend. The light green, light red, and lilac shading are the diurnal cycles of global radiation for all data, NPF event days, and non-event days, respectively (right y axis).
During regional NPF event days, the concentrations of all analyzed aerosol precursor vapors are higher than during non-event days (Fig. 10). However, the diurnal patterns of the precursor vapors are otherwise rather similar on event and non-event days. The non-nitrate monomers and dimers show a small increase during daytime on NPF days that is absent on non-event days. Additionally, we observe that the aerosol precursor vapor concentrations rise earlier and the difference in concentrations between the nighttime and the daytime is larger on NPF event days. These observations, together with the diurnal patterns of global radiation in Figs. 6 and 9, suggest that during event days there is more photochemical production and potentially also higher emissions of biogenic vapors. However, it is not possible to point out a single vapor explaining the difference between NPF events and non-events from the diurnal variations.
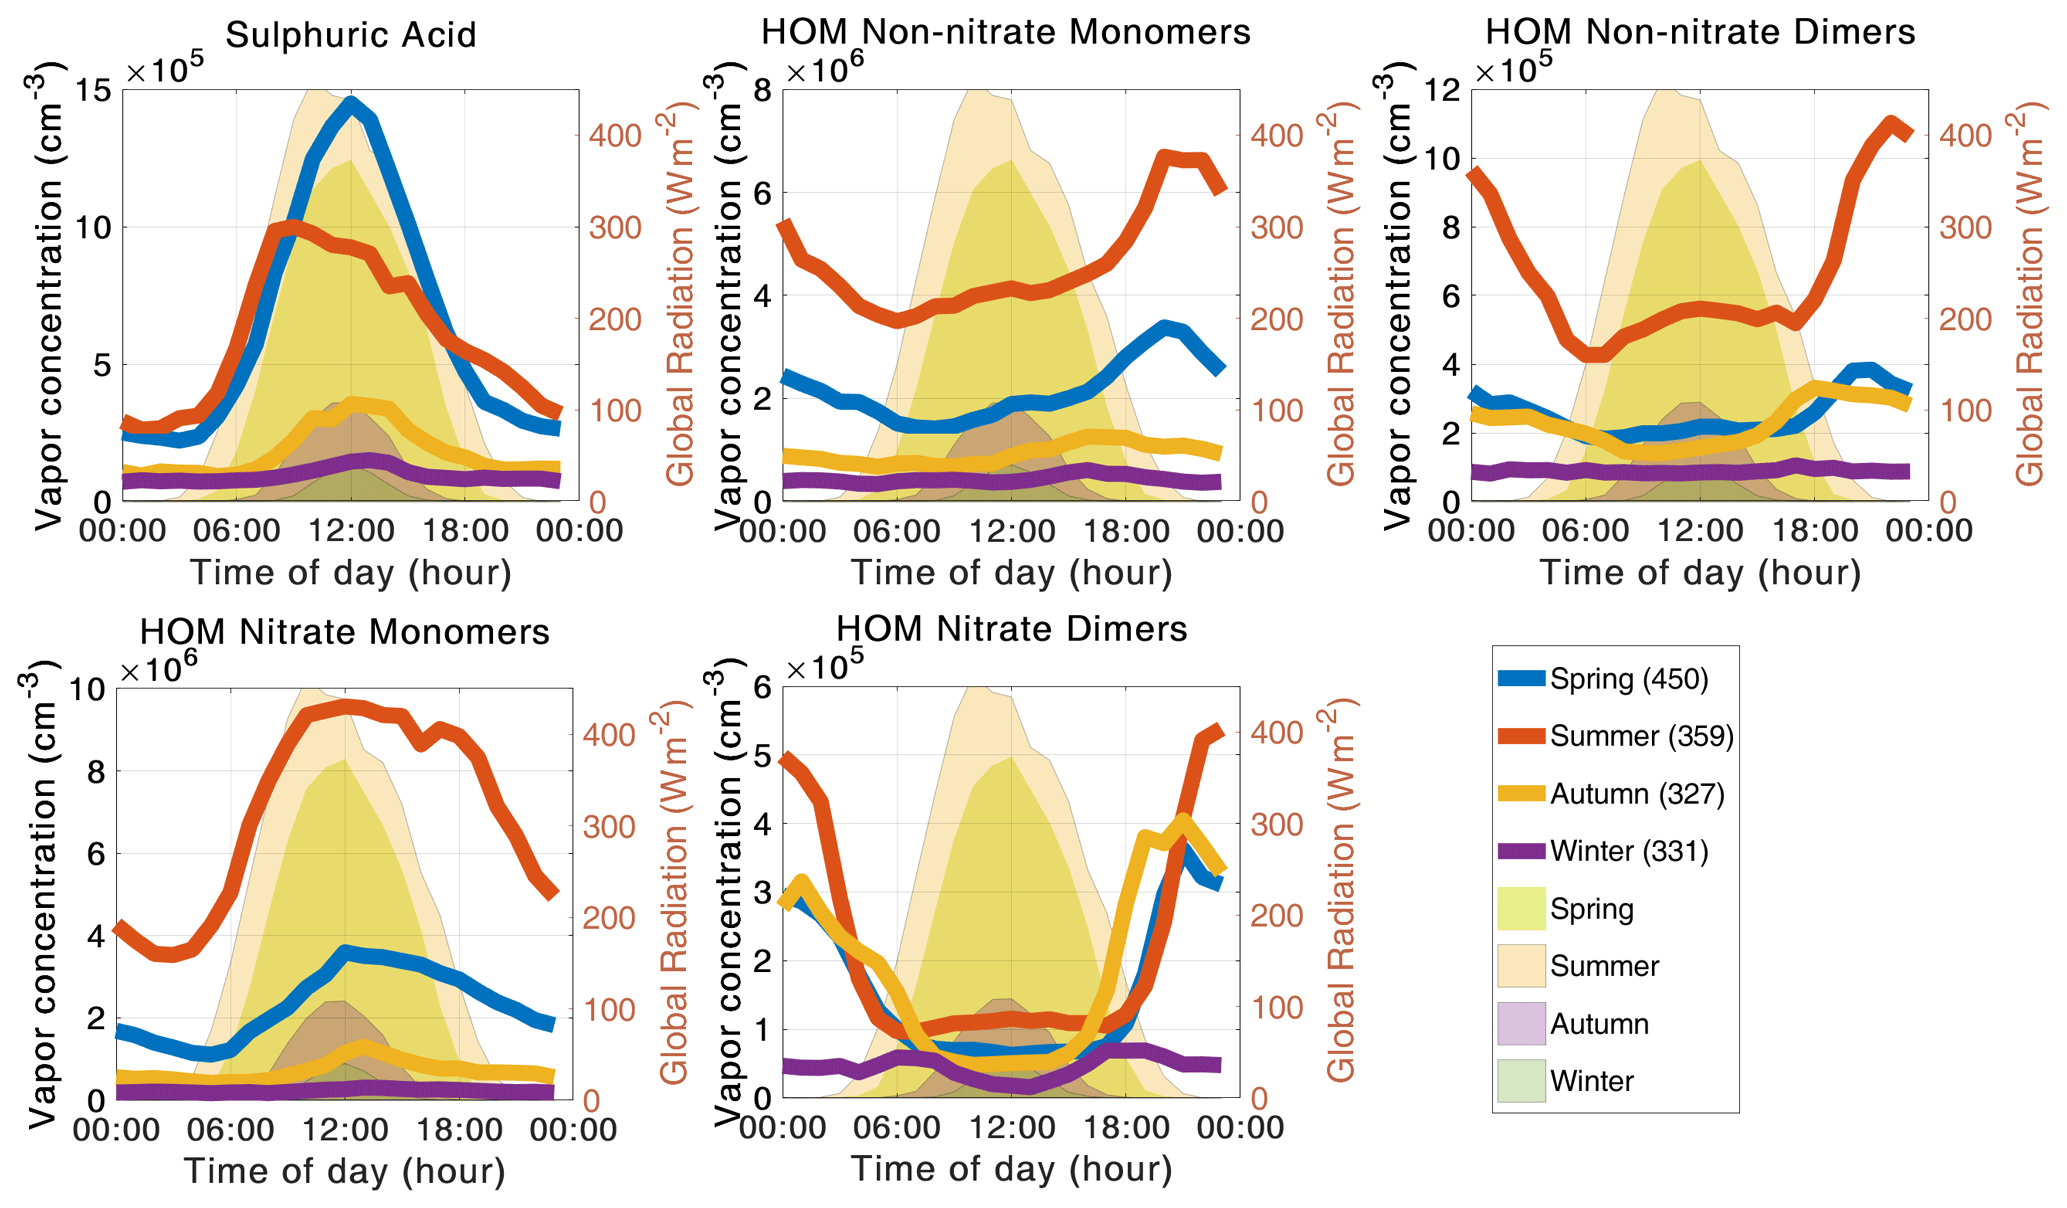
Figure 11The diurnal cycles of precursor vapors in different seasons. The number of days included in the median day is presented by the number in parentheses in the legend. The light green, light yellow, lilac, and dark green shading represent spring, summer, autumn, and winter, respectively.
In Fig. 11, we show the diurnal patterns of precursor vapor concentrations separately for each season. Sulfuric acid exhibits the largest overall peak concentrations during spring, when we have the highest frequency of NPF events (Nieminen et al., 2014). All organic vapors we analyzed exhibited the highest median concentrations during summer and the lowest median concentrations during winter, which can be explained by the seasonality of solar radiation and volatile organic compound emissions (Hellén et al., 2018).
Sulfuric acid follows the diurnal behavior of solar radiation in each season, as expected. HOM non-nitrate monomers and dimers both have an evening peak, and the time of the maximum shifts seasonally. HOM nitrate monomers have a daytime maximum, while HOM nitrate dimers have a daytime minimum during all seasons but summer. During summer, both HOM nitrate and non-nitrate dimers have a small midday maximum with two minima: one in the morning and one in the evening. The seasonal changes in the HOM diurnal cycles result from the seasonality in solar radiation, emissions, and boundary layer dynamics.
3.3 The connection between precursor vapors and the formation of sub-3 nm particles
We used correlation analysis to investigate the relationship between atmospheric sub 3 nm-particle concentrations and the selected atmospheric vapors. Here, the NPF data are from event times as specified by the NPF event algorithm and only from events occurring between 10:00 and 14:00 LT as to diminish the effect of the diurnal cycles on the correlations. Limiting our data selection to this time range diminishes the effect of meteorological variables on our analysis. Because absolute vapor concentrations are not needed for this analysis, we used the aerosol precursor vapor data without the calculated calibration coefficients to eliminate this source of uncertainty. The results are shown in Table 3.
Particle concentrations show positive correlation with all the measured precursor vapors, but we can see slight differences between the two size ranges and between NPF event times and the whole data set. The smallest particles correlate better with HOMs than SA when looking at the whole data set, confirming that this size range is influenced by organic molecules or clusters. In the larger size range the correlations are quite similar for all vapors when looking at the whole data set, but during NPF events the correlation with SA is higher than with the organic precursors. This could indicate that SA is crucial in determining when the particles grow over the 1.7 nm threshold.
Table 3Logarithmic Pearson correlations between particle concentrations in different size bins measured with the PSM and known precursor vapors or combinations of precursor vapors. The data from NPF events occurring between 10:00 and 14:00 LT are used. Statistically significant values (p<0.05) are bolded, and values higher than 0.5 are highlighted in italics.
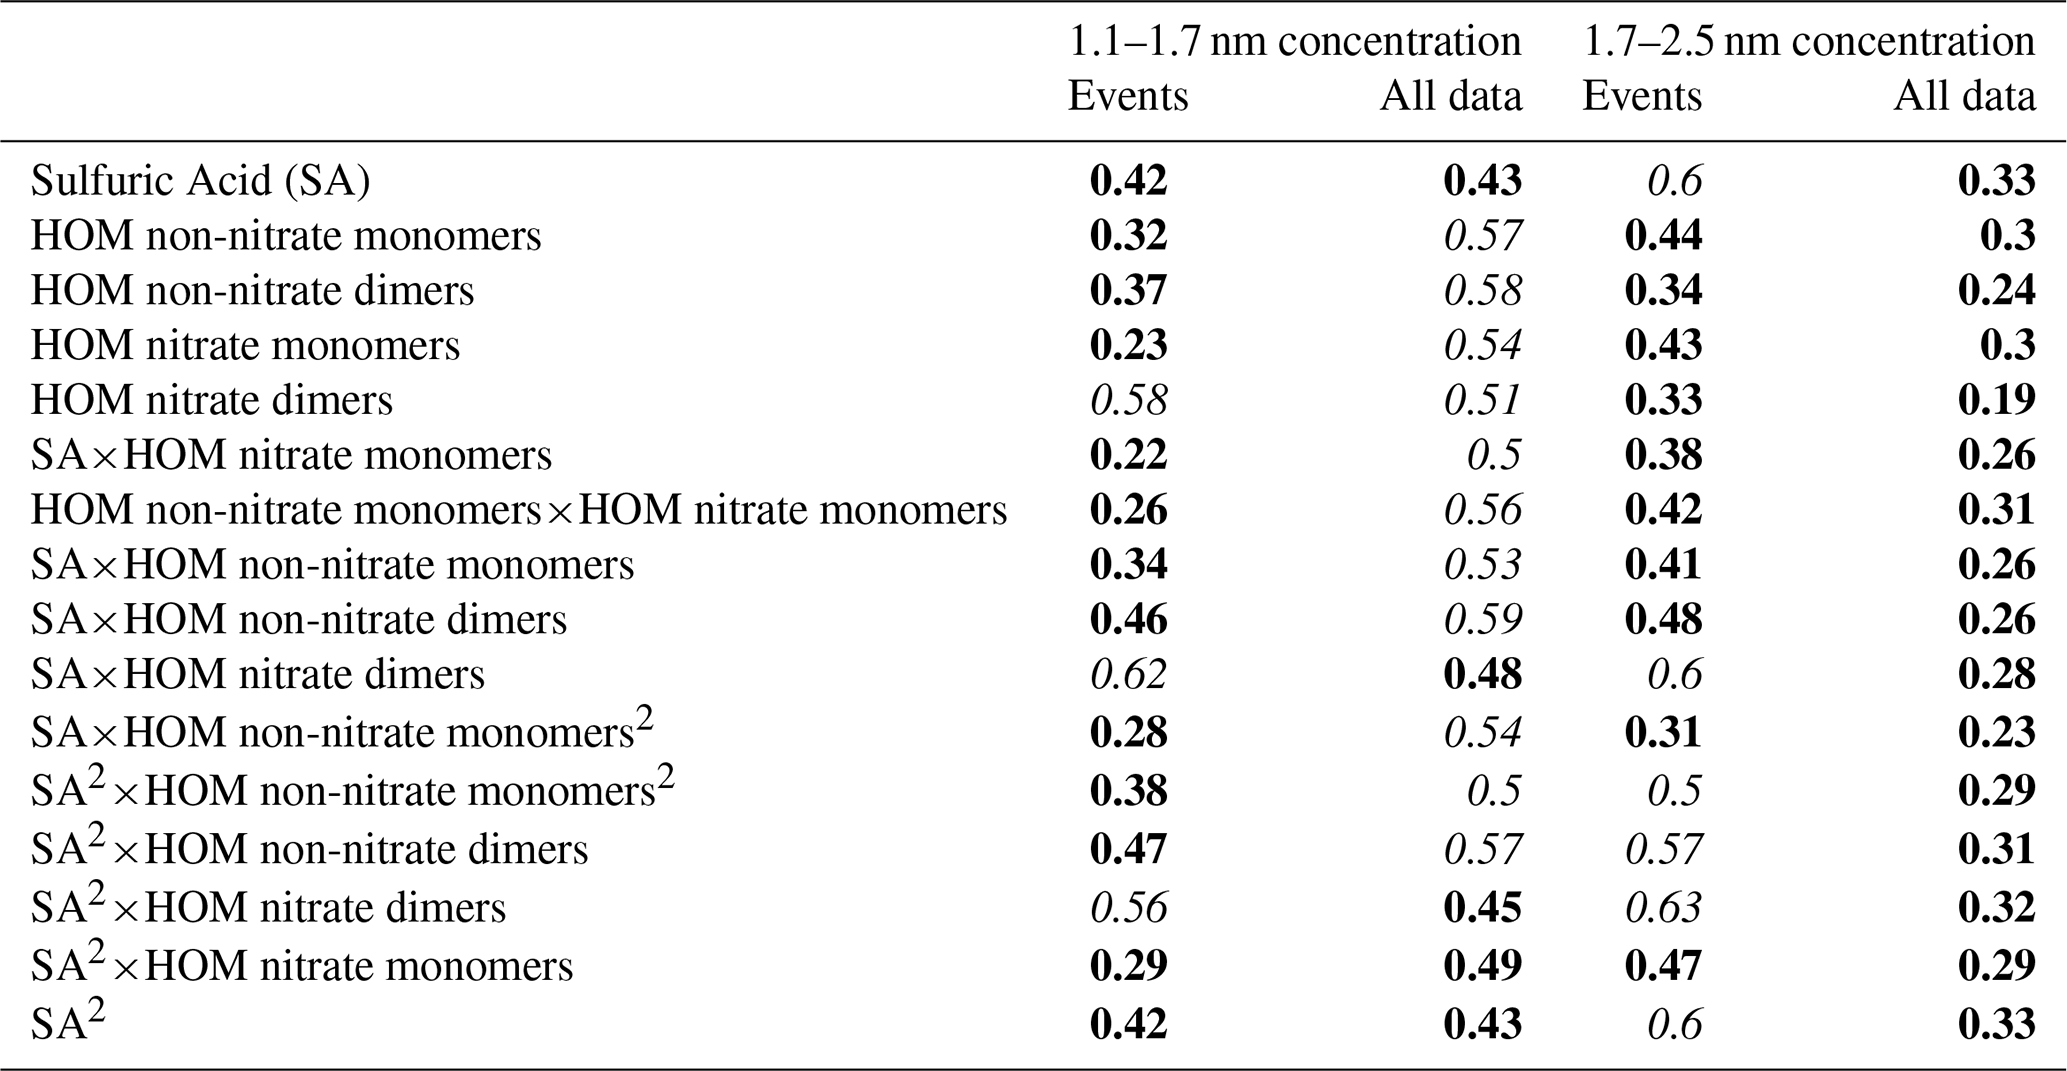

Figure 12The best logarithmic correlations between particle concentrations measured by PSM and precursor vapors during NPF events occurring between 10 and 14. The correlations of sub-3 nm particle concentrations and sulfuric acid are in (a, d), the correlations of sub-3 nm particle concentrations and HOM nitrate dimers are in (b, e), and the correlations of sub-3 nm particle concentrations and the product of sulfuric acid and HOM nitrate dimers are in (c, f).
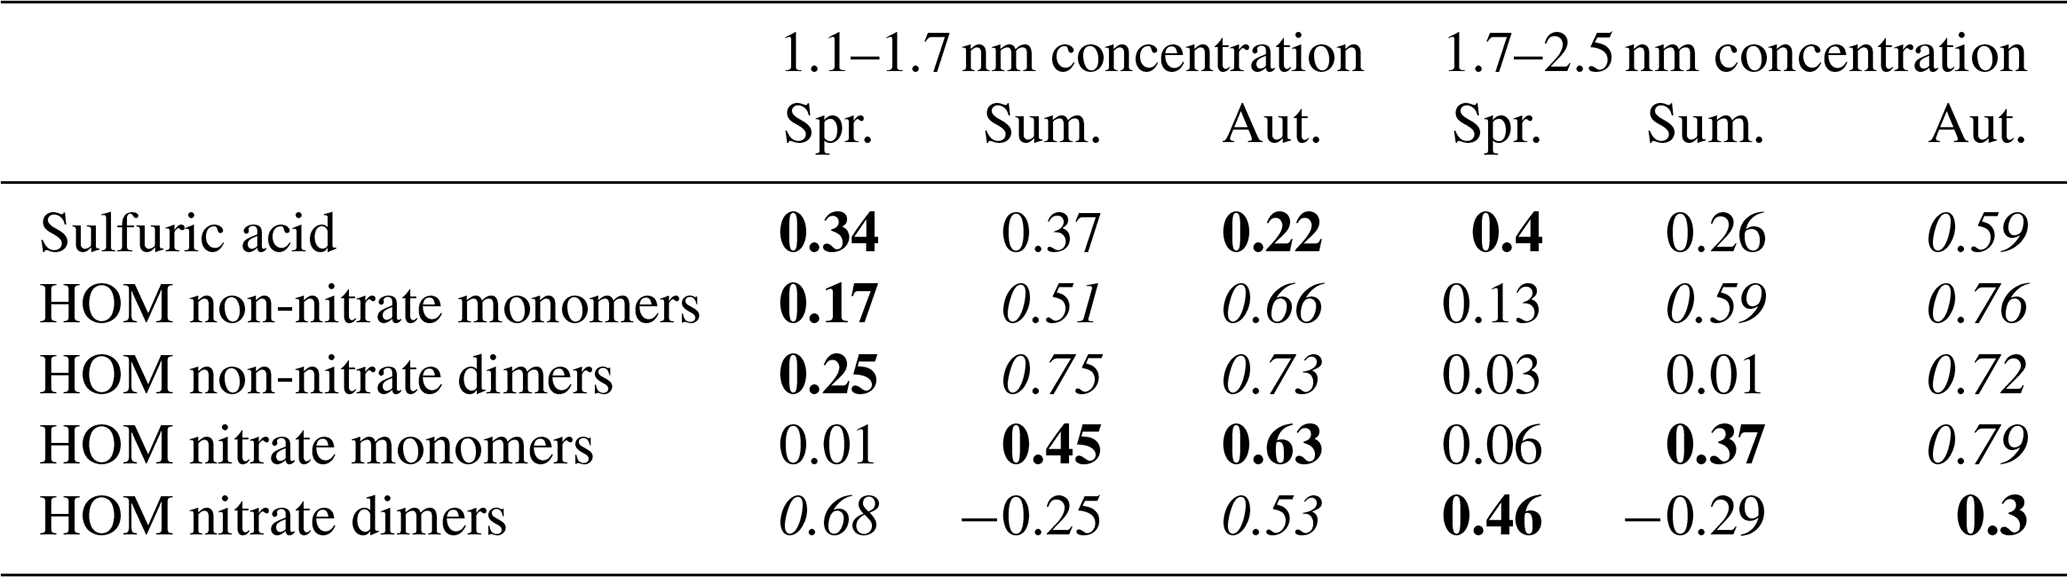
Table 4Logarithmic Pearson correlations of known precursor vapors with particle concentrations for spring (Spr.), summer (Sum.), and autumn (Aut.) seasons during event times between 10:00 and 14:00 LT. Winter did not have enough available event points for correlation analysis. Statistically significant values (p<0.05) are bolded and values higher than 0.5 are highlighted in italics.
The best correlations during NPF events were found between the particle concentrations and the product of SA and HOM nitrate dimers in both size classes. The scatterplots for the best correlations between atmospheric vapors and sub-3 nm concentrations are shown in Fig. 12. It is quite interesting that including HOM nitrate dimers improves the correlation slightly compared to just SA, even though they have a completely different diurnal variation. It is possible that both sulfuric acid and large organic molecules are required for the formation and growth of new particles, which would explain the observed correlations. However, the correlation can also point to two separate formation pathways, organic and inorganic (Yan et al., 2018). Laboratory experiments in the CLOUD chamber have shown that particle formation rates at 1.7 nm correlate with the product of sulfuric acid, ammonia, and non-nitrate HOM dimers (Lehtipalo et al., 2018). However, we observe that HOM nitrate dimers have a better correlation with the particle concentrations than the HOM non-nitrate dimers. We would expect the opposite, as non-nitrate HOMs have lower volatility than nitrate HOMs (Yan et al., 2020). This discrepancy with the laboratory results could be explained by the nitrate HOMs being better correlated with global radiation (Fig. 10), as NPF most frequently occurs at the SMEAR II station during the global radiation maximum. However, the difference in correlation coefficients is not very large considering the uncertainties involved, so it could also mean that at least some of the nitrate dimers already have low enough volatility to participate in NPF, especially together with SA.
Due to the differences observed in the diurnal cycles of both sub-3 nm particle concentrations and vapor concentrations between different seasons, we investigated the correlation between sub-3 nm particle concentrations and atmospheric vapors separately in different seasons. Because of the lack of data for both vapor and particle concentrations during winter NPF events, we were only able to analyze spring, summer, and autumn events. The results of the seasonal NPF analysis are shown in Table 4.
The analysis reveals clear seasonal differences between correlations of precursor vapors and sub-3 nm particle concentrations. During springtime NPF events, HOM nitrate dimers correlate with both size bins of measured sub-3 nm particle concentrations. Additionally, sulfuric acid correlates fairly well with 1.7–2.5 nm particle concentrations. The springtime correlations are qualitatively similar than in the whole data set, probably because majority of NPF events happen in spring. During summertime events, HOM monomers correlate with the particle concentrations while HOM nitrate dimers anticorrelate slightly. The non-nitrate dimers correlate especially well with 1.1–1.7 nm particle concentrations, which reinforces the earlier observation that we likely measure some organic clusters in the smallest size bin. It is possible that HOM nitrate dimer anticorrelation this is caused by the higher evaporation rate of HOM dimers with the increased temperature (Donahue et al., 2011). However, due to the lack of vapor concentration data from summer months, the amount of data available for analysis here is limited and thus correlations may not be representative.
Also during autumn, the HOM monomers and the non-nitrate dimer correlate better with the particle concentrations than the nitrate dimer or sulfuric acid, a notable difference from spring. The correlation coefficients are rather high in both size ranges, perhaps the diminishing concentrations of organics make them a limiting factor for particle formation in autumn. All in all, although the correlation analysis alone cannot resolve the relative contributions of the different precursors, these differences in correlations between particle and vapor concentrations point to an annual variation in the formation mechanisms of sub-3 nm particles.
It should be noted that SA do not form particles by itself at concentrations relevant to the atmospheric boundary layer (Kirkby et al., 2011). Rather, it needs ammonia (NH3) or amines to stabilize the forming clusters. It is yet unclear if SA can form stable clusters with HOMs, although SA organics nucleation has been proposed (e.g., Riccobono et al., 2014). Lehtipalo et al. (2018) showed that SA and HOMs do not to interact unless NH3 is present. As there are no continuous ammonia and amine measurements available at SMEAR II, we could not include those in the correlation analysis, although variations in these vapors can affect the NPF mechanism and thus our results, especially the seasonal variation. Hemmilä et al. (2018) showed that there is a weak positive correlation between 1–2 nm particles measured with the PSM and ammonia and dimethylamine concentrations.
In this study, we analyzed 5 years of sub-3 nm particle concentration and aerosol precursor vapor concentration data from the SMEAR II station in Hyytiälä, southern Finland. The sub-3 nm particle concentrations were measured with the PSM ,and the aerosol precursor molecule concentration data were measured with the CI-APi-ToF.
The analysis of the PSM background counts and stability shows that to operate the PSM at the SMEAR II station in such a way that it reliably activates sub-3 nm atmospheric particles, the measured background in the PSM should be within 1 and 10 cm−3. Too low a background, and consequently too low a supersaturation level in the PSM, results in poor activation of atmospheric sub-3 nm particles. When the supersaturation is too high, the measurement becomes unstable and the observed concentrations are affected by homogenous nucleation of the working fluid. The settings of the PSM indicated by this analysis are valid for the SMEAR II station and other similar boreal background stations, but when measuring in other environments, the optimal background level may be different.
Sub-3 nm particle concentrations exhibit clear differences between NPF event and non-event days. Overall, the concentrations of both 1.1–1.7 and 1.7–2.5 nm particles are higher during NPF events and 1.7–2.5 nm particle concentrations exhibit a strong midday maximum during NPF event days that is not observed during non-event days. The size distribution of sub-3 nm particles also shows a clear seasonal cycle. The 1.1–1.7 nm particle concentrations have the highest concentrations during the summer, which coincides with increased summertime photochemical and biogenic activity in the surrounding forest. The 1.7–2.5 nm particle concentration, on the other hand, exhibits the largest median concentration during springtime, coinciding with increased regional NPF frequency. The daytime maximum in concentrations is clear during spring, summer and autumn, during which regional NPF events are also more common. A second maximum in the evening is observed for the 1.1–1.7 nm particles during spring and summer, but not for the concentrations in bigger size ranges or during wintertime. This maximum may be linked to large organic clusters that form but do not grow to larger particles in the atmosphere.
The precursor vapors also show seasonal variability. The concentrations of all selected precursor vapors are the highest during summer and the lowest during winter. This is attributed to increased biogenic activity in the surrounding forest during the warmer periods of the year, as well as increased photochemical production. Additionally, the concentrations of sulfuric acid and HOM monomers have seasonally changing diurnal behavior because of solar radiation. All of the precursor vapor concentrations are clearly higher on NPF event days compared to non-event days and their diurnal cycle is more pronounced.
When comparing sub-3 nm particle concentrations with aerosol precursor vapors, we found that the smallest particles (1.1–1.7 nm) correlate with HOMs when looking at the whole time series, indicating their presence in this size range. The 1.7–2.5 nm particles, which are more directly connected to NPF events, correlate with sulfuric acid and HOM dimers (and the product of these) during NPF events. During springtime, nitrate dimers seemed to correlate better than other HOMs, but the other seasons showed opposite behavior, so our conclusions regarding the role different types of HOMs remain inconclusive. The seasonal analysis of the correlations reveals some differences between the seasons, which could be due to changes in the mechanism forming clusters. However, understanding the seasonal differences in the formation mechanisms of HOMs and sub-3 nm particles in detail requires further studies.
The meteorological data from the SMEAR II station can be accessed from the smartSMEAR website: http://avaa.tdata.fi/web/smart/ (last access: 3 July 2020) (Junninen et al., 2009). The data are licensed under a Creative Commons 4.0 Attribution (CC BY) license. The particle concentration data measured with PSM is available at https://doi.org/10.5281/zenodo.4153280 (Sulo et al., 2020). The vapor concentration data measured by CI-APi-ToF and the NAIS data are available from the authors upon request.
JS, NS, LA, TL, JKa TJ, MS, and HJ conducted the measurements, JS and NS handled the data inversion, and JS performed the analysis and wrote the paper. JKo, MK, and KL designed the study and provided supervision. All of the authors contributed to the discussions of the results and commenting on the paper.
The authors declare that they have no conflict of interest.
This work was supported by the Academy of Finland (grant nos. 316114, 307331, 311932, 1325656, 272041), the University of Helsinki (grant no. 75284132), and the European Union's Horizon 2020 research and innovation programme under grant agreement nos. 654109 and 739530 (ACTRIS). Olga Garmash, Lisa Beck, the SMEAR II staff, and everyone else participating in operating the PSM and CI-APi-ToF measurement are gratefully acknowledged.
This research has been supported by the Academy of Finland (grant nos. 316114, 307331, 311932, 1325656, and 272041), the Helsingin Yliopisto (grant no. 75294132), and Horizon 2020 (grant nos. 654109 and 739530).
Open-access funding was provided by the Helsinki University Library.
This paper was edited by Hang Su and reviewed by two anonymous referees.
Almeida, J., Schobesberger, S., Kürten, A., Ortega, I., Kupiainen-Määttä, O., Praplan, A., Adamov, A., Amorim, A., Bianchi, F., Breitenlechner, M., David, A., Dommen, J., Donahue, N., Downard, A., Dunne, E., Duplissy, J., Ehrhart, S., Flagan, R., Franchin, A., Guida, R., Hakala, J., Hansel, A., Heinritzi, M., Henschel, H., Jokinen, T., Junninen, H., Kajos, M., Kangasluoma, J., Keskinen, H., Kupc, A., Kurtén, T., Kvashin, A., Laaksonen, A., Lehtipalo, K., Leiminger, M., Leppä, J., Loukonen, V., Makhmutov, V., Mathot, S., McGrath, M., Nieminen, T., Olenius, T., Onnela, A., Petäjä, T., Riccobono, F., Riipinen, I., Rissanen, M., Rondo, L., Ruuskanen, T., Santos, F., Sarnela, N., Schallhart, S., Schnitzhofer, R., Seinfeld, J., Simon, M., Sipilä, M., Stozhkov, Y., Stratmann, F., Tomé, A., Tröstl, J., Tsagkogeorgas, G., Vaattovaara, P., Viisanen, Y., Virtanen, A., Vrtala, A., Wagner, P., Weingartner, E., Wex, H., Williamson, C., Wimmer, D., Ye, P., Yli-Juuti, T., Carslaw, K., Kulmala, M., Curtius, J., Baltensperger, U., Worsnop, D., Vehkamäki, H., and Kirkby, J.: Molecular understanding of sulphuric acid–amine particle nucleation in the atmosphere, Nature, 502, 359–363, https://doi.org/10.1038/nature12663, 2013.
Andreae, M. O., Afchine, A., Albrecht, R., Holanda, B. A., Artaxo, P., Barbosa, H. M. J., Borrmann, S., Cecchini, M. A., Costa, A., Dollner, M., Fütterer, D., Järvinen, E., Jurkat, T., Klimach, T., Konemann, T., Knote, C., Krämer, M., Krisna, T., Machado, L. A. T., Mertes, S., Minikin, A., Pöhlker, C., Pöhlker, M. L., Pöschl, U., Rosenfeld, D., Sauer, D., Schlager, H., Schnaiter, M., Schneider, J., Schulz, C., Spanu, A., Sperling, V. B., Voigt, C., Walser, A., Wang, J., Weinzierl, B., Wendisch, M., and Ziereis, H.: Aerosol characteristics and particle production in the upper troposphere over the Amazon Basin, Atmos. Chem. Phys., 18, 921–961, https://doi.org/10.5194/acp-18-921-2018, 2018.
Bianchi, F., Garmash, O., He, X., Yan, C., Iyer, S., Rosendahl, I., Xu, Z., Rissanen, M. P., Riva, M., Taipale, R., Sarnela, N., Petäjä, T., Worsnop, D. R., Kulmala, M., Ehn, M., and Junninen, H.: The role of highly oxygenated molecules (HOMs) in determining the composition of ambient ions in the boreal forest, Atmos. Chem. Phys., 17, 13819–13831, https://doi.org/10.5194/acp-17-13819-2017, 2017.
Buenrostro Mazon, S., Kontkanen, J., Manninen, H. E., Nieminen, T., Kerminen, V.-M., and Kulmala, M.: A long-term comparison of nighttime cluster events and daytime ion formation in a boreal forest, Boreal Environ. Res., 21, 242–261, 2016.
Cai, R., Jiang, J., Mirme, S., and Kangasluoma, J.: Parameters governing the performance of electrical mobility spectrometers for measuring sub-3 nm particles, J. Aerosol Sci., 127, 102–115, https://doi.org/10.1016/j.jaerosci.2018.11.002, 2019.
Chan, T., Cai, R., Ahonen, L. R., Liu, Y., Zhou, Y., Vanhanen, J., Dada, L., Chao, Y., Liu, Y., Wang, L., Kulmala, M., and Kangasluoma, J.: Assessment of particle size magnifier inversion methods to obtain the particle size distribution from atmospheric measurements, Atmos. Meas. Tech., 13, 4885–4898, https://doi.org/10.5194/amt-13-4885-2020, 2020.
Chen, M., Titcombe, M., Jiang, J., Jen, C., Kuang, C., Fischer, M. L., and Eisele, F. L.: Acid-base chemical reaction model for nucleation rates in the polluted atmospheric boundary layer, P. Natl. Acad. Sci. USA, 109, 18713–18718, https://doi.org/10.1073/pnas.1210285109, 2012.
Dada, L., Paasonen, P., Nieminen, T., Buenrostro Mazon, S., Kontkanen, J., Peräkylä, O., Lehtipalo, K., Hussein, T., Petäjä, T., Kerminen, V.-M., Bäck, J., and Kulmala, M.: Long-term analysis of clear-sky new particle formation events and nonevents in Hyytiälä, Atmos. Chem. Phys., 17, 6227–6241, https://doi.org/10.5194/acp-17-6227-2017, 2017.
Dada, L., Chellapermal, R., Buenrostro Mazon, S., Paasonen, P., Lampilahti, J., Manninen, H. E., Junninen, H., Petäjä, T., Kerminen, V.-M., and Kulmala, M.: Refined classification and characterization of atmospheric new-particle formation events using air ions, Atmos. Chem. Phys., 18, 17883–17893, https://doi.org/10.5194/acp-18-17883-2018, 2018.
Dal Maso, M., Kulmala, M., Riipinen, I., Wagner, R., Hussein, T., Aalto, P. P., and Lehtinen, K. E. J.: Formation and growth of fresh atmospheric aerosols: eight years of aerosol size distribution data from SMEAR II, Hyytiala, Finland, Boreal Environ. Res., 10, 323–336, 2005.
Donahue, N. M., Epstein, S. A., Pandis, S. N., and Robinson, A. L.: A two-dimensional volatility basis set: 1. organic-aerosol mixing thermodynamics, Atmos. Chem. Phys., 11, 3303–3318, https://doi.org/10.5194/acp-11-3303-2011, 2011.
Dunne, E., Gordon, H., Kurten, A., Almeida, J., Duplissy, J., Williamson, C., Ortega, I., Pringle, K., Adamov, A., Baltensperger, U., Barmet, P., Benduhn, F., Bianchi, F., Breitenlechner, M., Clarke, A., Curtius, J., Dommen, J., Donahue, N., Ehrhart, S., Flagan, R., Franchin, A., Guida, R., Hakala, J., Hansel, A., Heinritzi, M., Jokinen, T., Kangasluoma, J., Kirkby, J., Kulmala, M., Kupc, A., Lawler, M., Lehtipalo, K., Makhmutov, V., Mann, G., Mathot, S., Merikanto, J., Miettinen, P., Nenes, A., Onnela, A., Rap, A., Reddington, C., Riccobono, F., Richards, N., Rissanen, M., Rondo, L., Sarnela, N., Schobesberger, S., Sengupta, K., Simon, M., Sipila, M., Smith, J., Stozkhov, Y., Tome, A., Trostl, J., Wagner, P., Wimmer, D., Winkler, P., Worsnop, D., and Carslaw, K.: Global atmospheric particle formation from CERN CLOUD measurements, Science, 354, 1119–1124, https://doi.org/10.1126/science.aaf2649, 2016.
Ehn, M., Junninen, H., Petäjä, T., Kurtén, T., Kerminen, V.-M., Schobesberger, S., Manninen, H. E., Ortega, I. K., Vehkamäki, H., Kulmala, M., and Worsnop, D. R.: Composition and temporal behavior of ambient ions in the boreal forest, Atmos. Chem. Phys., 10, 8513–8530, https://doi.org/10.5194/acp-10-8513-2010, 2010.
Ehn, M., Thornton, J., Kleist, E., Sipilä, M., Junninen, H., Pullinen, I., Springer, M., Rubach, F., Tillmann, R., Lee, B., Lopez-Hilfiker, F., Andres, S., Acir, I., Rissanen, M., Jokinen, T., Schobesberger, S., Kangasluoma, J., Kontkanen, J., Nieminen, T., Kurtén, T., Nielsen, L., Jørgensen, S., Kjaergaard, H., Canagaratna, M., Maso, M., Berndt, T., Petäjä, T., Wahner, A., Kerminen, V., Kulmala, M., Worsnop, D., Wildt, J., and Mentel, T.: A large source of low-volatility secondary organic aerosol, Nature, 506, 476–479, https://doi.org/10.1038/nature13032, 2014.
Eisele, F. L. and Tanner, D. J.: Measurement of the gas phase concentration of H2SO4 and methane sulfonic acid and estimates of H2SO4 production and loss in the atmosphere, J. Geophys. Res., 98, 9001–9010, https://doi.org/10.1029/93JD00031, 1993.
Guenther, A., Hewitt, C., Erickson, D., Fall, R., Geron, C., Graedel, T., Harley, P., Klinger, L., Lerdau, M., Mckay, W., Pierce, T., Scholes, B., Steinbrecher, R., Tallamraju, R., Taylor, J., and Zimmerman, P.: A global model of natural volatile organic compound emissions, J. Geophys. Res., 100, 8873, https://doi.org/10.1029/94jd02950, 1995.
Hakola, H., Tarvainen, V., Laurila, T., Hiltunen, V., Hellén, H., and Keronen, P.: Seasonal variation of VOC concentrations above a boreal coniferous forest, Atmos. Environ., 37, 1623–1634, https://doi.org/10.1016/s1352-2310(03)00014-1, 2003.
Hari, P. and Kulmala, M.: Station for measuring ecosystem-atmosphere relations (SMEAR II), Boreal Environ. Res., 10, 315–322, 2005.
Heintzenberg, J., Tunved, P., Galí, M., and Leck, C.: New particle formation in the Svalbard region 2006–2015, Atmos. Chem. Phys., 17, 6153–6175, https://doi.org/10.5194/acp-17-6153-2017, 2017.
Hellén, H., Praplan, A. P., Tykkä, T., Ylivinkka, I., Vakkari, V., Bäck, J., Petäjä, T., Kulmala, M., and Hakola, H.: Long-term measurements of volatile organic compounds highlight the importance of sesquiterpenes for the atmospheric chemistry of a boreal forest, Atmos. Chem. Phys., 18, 13839–13863, https://doi.org/10.5194/acp-18-13839-2018, 2018.
Hemmilä, M., Hellén, H., Virkkula, A., Makkonen, U., Praplan, A. P., Kontkanen, J., Ahonen, L., Kulmala, M., and Hakola, H.: Amines in boreal forest air at SMEAR II station in Finland, Atmos. Chem. Phys., 18, 6367–6380, https://doi.org/10.5194/acp-18-6367-2018, 2018.
Hirsikko, A., Nieminen, T., Gagné, S., Lehtipalo, K., Manninen, H. E., Ehn, M., Hõrrak, U., Kerminen, V.-M., Laakso, L., McMurry, P. H., Mirme, A., Mirme, S., Petäjä, T., Tammet, H., Vakkari, V., Vana, M., and Kulmala, M.: Atmospheric ions and nucleation: a review of observations, Atmos. Chem. Phys., 11, 767–798, https://doi.org/10.5194/acp-11-767-2011, 2011.
Hofman, J., Staelens, J., Cordell, R., Stroobants, C., Zikova, N., Hama, S., Wyche, K., Kos, G., Van Der Zee, S., Smallbone, K., Weijers, E., Monks, P., and Roekens, E.: Ultrafine particles in four European urban environments: Results from a new continuous long-term monitoring network, Atmos. Environ., 136, 68–81, https://doi.org/10.1016/j.atmosenv.2016.04.010, 2016.
Hyttinen, N., Kupiainen-Määttä, O., Rissanen, M., Muuronen, M., Ehn, M., and Kurtén, T.: Modeling the Charging of Highly Oxidized Cyclohexene Ozonolysis Products Using Nitrate-Based Chemical Ionization, The J. Phys. Chem. A, 119, 6339–6345, https://doi.org/10.1021/acs.jpca.5b01818, 2015.
Järvinen, E., Virkkula, A., Nieminen, T., Aalto, P. P., Asmi, E., Lanconelli, C., Busetto, M., Lupi, A., Schioppo, R., Vitale, V., Mazzola, M., Petäjä, T., Kerminen, V.-M., and Kulmala, M.: Seasonal cycle and modal structure of particle number size distribution at Dome C, Antarctica, Atmos. Chem. Phys., 13, 7473–7487, https://doi.org/10.5194/acp-13-7473-2013, 2013.
Jiang, J., Chen, M., Kuang, C., Attoui, M., and McMurry, P.: Electrical Mobility Spectrometer Using a Diethylene Glycol Condensation Particle Counter for Measurement of Aerosol Size Distributions Down to 1 nm, Aerosol Sci. Tech., 45, 510–521, https://doi.org/10.1080/02786826.2010.547538, 2011.
Jokinen, T., Sipilä, M., Junninen, H., Ehn, M., Lönn, G., Hakala, J., Petäjä, T., Mauldin III, R. L., Kulmala, M., and Worsnop, D. R.: Atmospheric sulphuric acid and neutral cluster measurements using CI-APi-TOF, Atmos. Chem. Phys., 12, 4117–4125, https://doi.org/10.5194/acp-12-4117-2012, 2012.
Jokinen, T., Kontkanen, J., Lehtipalo, K., Manninen, H., Aalto, J., Porcar-Castell, A., Garmash, O., Nieminen, T., Ehn, M., Kangasluoma, J., Junninen, H., Levula, J., Duplissy, J., Ahonen, L., Rantala, P., Heikkinen, L., Yan, C., Sipilä, M., Worsnop, D., Bäck, J., Petäjä, T., Kerminen, V., and Kulmala, M.: Solar eclipse demonstrating the importance of photochemistry in new particle formation, Sci. Rep.-UK, 7, 45707, https://doi.org/10.1038/srep45707, 2017.
Junninen, H., Lauri, A., Keronen, P., Aalto, P., Hiltunen, V., Hari, P., and Kulmala, M.: Smart-SMEAR: on-line data exploration and visualization tool for SMEAR stations, Boreal Environ. Res., 14, 447–457, 2009.
Junninen, H., Ehn, M., Petäjä, T., Luosujärvi, L., Kotiaho, T., Kostiainen, R., Rohner, U., Gonin, M., Fuhrer, K., Kulmala, M., and Worsnop, D. R.: A high-resolution mass spectrometer to measure atmospheric ion composition, Atmos. Meas. Tech., 3, 1039–1053, https://doi.org/10.5194/amt-3-1039-2010, 2010.
Kangasluoma, J., Junninen, H., Lehtipalo, K., Mikkilä, J., Vanhanen, J., Attoui, M., Sipilä, M., Worsnop, D., Kulmala, M., and Petäjä, T.: Remarks on Ion Generation for CPC Detection Efficiency Studies in Sub-3-nm Size Range, Aerosol Sci. Tech., 47, 556–563, https://doi.org/10.1080/02786826.2013.773393, 2013.
Kangasluoma, J., Kuang, C., Wimmer, D., Rissanen, M. P., Lehtipalo, K., Ehn, M., Worsnop, D. R., Wang, J., Kulmala, M., and Petäjä, T.: Sub-3 nm particle size and composition dependent response of a nano-CPC battery, Atmos. Meas. Tech., 7, 689–700, https://doi.org/10.5194/amt-7-689-2014, 2014.
Kangasluoma, J., Franchin, A., Duplissy, J., Ahonen, L., Korhonen, F., Attoui, M., Mikkilä, J., Lehtipalo, K., Vanhanen, J., Kulmala, M., and Petäjä, T.: Operation of the Airmodus A11 nano Condensation Nucleus Counter at various inlet pressures and various operation temperatures, and design of a new inlet system, Atmos. Meas. Tech., 9, 2977–2988, https://doi.org/10.5194/amt-9-2977-2016, 2016a.
Kangasluoma, J., Samodurov, A., Attoui, M., Franchin, A., Junninen, H., Korhonen, F., Kurtén, T., Vehkamäki, H., Sipilä, M., Lehtipalo, K., Worsnop, D., Petäjä, T., and Kulmala, M.: Heterogeneous Nucleation onto Ions and Neutralized Ions: Insights into Sign-Preference, J. Phys. Chem. C, 120, 7444–7450, https://doi.org/10.1021/acs.jpcc.6b01779, 2016b.
Kerminen, V., Chen, X., Vakkari, V., Petäjä, T., Kulmala, M., and Bianchi, F.: Atmospheric new particle formation and growth: review of field observations, Environ. Res. Lett., 13, 103003, https://doi.org/10.1088/1748-9326/aadf3c, 2018.
Kirkby, J., Curtius, J., Almeida, J., Dunne, E., Duplissy, J., Ehrhart, S., Franchin, A., Gagné, S., Ickes, L., Kürten, A., Kupc, A., Metzger, A., Riccobono, F., Rondo, L., Schobesberger, S., Tsagkogeorgas, G., Wimmer, D., Amorim, A., Bianchi, F., Breitenlechner, M., David, A., Dommen, J., Downard, A., Ehn, M. Flagan, R. C., Haider, S., Hansel, A., Hauser, D., Jud, W., Junninen, H., Kreissl, F., Kvashin, A., Laaksonen, A., Lehtipalo, K., Lima, J., Lovejoy, E. R., Makhmutov, V., Mathot, S., Mikkilä, J., Minginette, P., Mogo, S., Nieminen, T., Onnela, A., Pereira, P., Petäjä, T., Schnitzhofer, R., Seinfeld, J. H., Sipilä, M., Stozhkov, Y., Stratmann, F., Tomé, A., Vanhanen, J., Viisanen, Y., Vrtala, A., Wagner, P. E., Walther, H., Weingartner, E., Wex, H., Winkler, P. M., Carslaw, K. S., Worsnop, D. R., Baltensperger, U., and Kulmala, M.: Role of sulphuric acid, ammonia and galactic cosmic rays in atmospheric aerosol nucleation, Nature, 476, 429–433, https://doi.org/10.1038/nature10343, 2011.
Kirkby, J., Duplissy, J., Sengupta, K., Frege, C., Gordon, H., Williamson, C., Heinritzi, M., Simon, M., Yan, C., Almeida, J., Tröstl, J., Nieminen, T., Ortega, I., Wagner, R., Adamov, A., Amorim, A., Bernhammer, A., Bianchi, F., Breitenlechner, M., Brilke, S., Chen, X., Craven, J., Dias, A., Ehrhart, S., Flagan, R., Franchin, A., Fuchs, C., Guida, R., Hakala, J., Hoyle, C., Jokinen, T., Junninen, H., Kangasluoma, J., Kim, J., Krapf, M., Kürten, A., Laaksonen, A., Lehtipalo, K., Makhmutov, V., Mathot, S., Molteni, U., Onnela, A., Peräkylä, O., Piel, F., Petäjä, T., Praplan, A., Pringle, K., Rap, A., Richards, N., Riipinen, I., Rissanen, M., Rondo, L., Sarnela, N., Schobesberger, S., Scott, C., Seinfeld, J., Sipilä, M., Steiner, G., Stozhkov, Y., Stratmann, F., Tomé, A., Virtanen, A., Vogel, A., Wagner, A., Wagner, P., Weingartner, E., Wimmer, D., Winkler, P., Ye, P., Zhang, X., Hansel, A., Dommen, J., Donahue, N., Worsnop, D., Baltensperger, U., Kulmala, M., Carslaw, K., and Curtius, J.: Ion-induced nucleation of pure biogenic particles, Nature, 533, 521–526, https://doi.org/10.1038/nature17953, 2016.
Kontkanen, J., Lehtipalo, K., Ahonen, L., Kangasluoma, J., Manninen, H. E., Hakala, J., Rose, C., Sellegri, K., Xiao, S., Wang, L., Qi, X., Nie, W., Ding, A., Yu, H., Lee, S., Kerminen, V.-M., Petäjä, T., and Kulmala, M.: Measurements of sub-3 nm particles using a particle size magnifier in different environments: from clean mountain top to polluted megacities, Atmos. Chem. Phys., 17, 2163–2187, https://doi.org/10.5194/acp-17-2163-2017, 2017.
Kulmala, M., Suni, T., Lehtinen, K. E. J., Dal Maso, M., Boy, M., Reissell, A., Rannik, Ü., Aalto, P., Keronen, P., Hakola, H., Bäck, J., Hoffmann, T., Vesala, T., and Hari, P.: A new feedback mechanism linking forests, aerosols, and climate, Atmos. Chem. Phys., 4, 557–562, https://doi.org/10.5194/acp-4-557-2004, 2004.
Kulmala, M., Lehtinen, K. E. J., and Laaksonen, A.: Cluster activation theory as an explanation of the linear dependence between formation rate of 3nm particles and sulphuric acid concentration, Atmos. Chem. Phys., 6, 787–793, https://doi.org/10.5194/acp-6-787-2006, 2006.
Kulmala, M., Riipinen, I., Sipila, M., Manninen, H., Petaja, T., Junninen, H., Maso, M., Mordas, G., Mirme, A., Vana, M., Hirsikko, A., Laakso, L., Harrison, R., Hanson, I., Leung, C., Lehtinen, K., and Kerminen, V.: Toward Direct Measurement of Atmospheric Nucleation, Science, 318, 89–92, https://doi.org/10.1126/science.1144124, 2007.
Kulmala, M., Kontkanen, J., Junninen, H., Lehtipalo, K., Manninen, H., Nieminen, T., Petaja, T., Sipila, M., Schobesberger, S., Rantala, P., Franchin, A., Jokinen, T., Jarvinen, E., Aijala, M., Kangasluoma, J., Hakala, J., Aalto, P., Paasonen, P., Mikkila, J., Vanhanen, J., Aalto, J., Hakola, H., Makkonen, U., Ruuskanen, T., Mauldin, R., Duplissy, J., Vehkamaki, H., Back, J., Kortelainen, A., Riipinen, I., Kurten, T., Johnston, M., Smith, J., Ehn, M., Mentel, T., Lehtinen, K., Laaksonen, A., Kerminen, V., and Worsnop, D.: Direct Observations of Atmospheric Aerosol Nucleation, Science, 339, 943–946, https://doi.org/10.1126/science.1227385, 2013.
Kulmala, M., Petäjä, T., Ehn, M., Thornton, J., Sipilä, M., Worsnop, D., and Kerminen, V.: Chemistry of Atmospheric Nucleation: On the Recent Advances on Precursor Characterization and Atmospheric Cluster Composition in Connection with Atmospheric New Particle Formation, Annu. Rev. Phys. Chem., 65, 21–37, https://doi.org/10.1146/annurev-physchem-040412-110014, 2014.
Kulmala, M., Luoma, K., Virkkula, A., Petäjä, T., Paasonen, P., Kerminen, V.-M., Nie, W., Qi, X., Shen, Y., Chi, X., and Ding, A.: On the mode-segregated aerosol particle number concentration load: contributions of primary and secondary particles in Hyytiälä and Nanjing, Boreal Environ. Res., 21, 319–331, 2016.
Kürten, A., Rondo, L., Ehrhart, S., and Curtius, J.: Calibration of a Chemical Ionization Mass Spectrometer for the Measurement of Gaseous Sulfuric Acid, J. Phys. Chem. A, 116, 6375–6386, https://doi.org/10.1021/jp212123n, 2012.
Kürten, A., Li, C., Bianchi, F., Curtius, J., Dias, A., Donahue, N. M., Duplissy, J., Flagan, R. C., Hakala, J., Jokinen, T., Kirkby, J., Kulmala, M., Laaksonen, A., Lehtipalo, K., Makhmutov, V., Onnela, A., Rissanen, M. P., Simon, M., Sipilä, M., Stozhkov, Y., Tröstl, J., Ye, P., and McMurry, P. H.: New particle formation in the sulfuric aciddimethylaminewater system: reevaluation of CLOUD chamber measurements and comparison to an aerosol nucleation and growth model, Atmos. Chem. Phys., 18, 845–863, https://doi.org/10.5194/acp-18-845-2018, 2018.
Kyrö, E.-M., Kerminen, V.-M., Virkkula, A., Dal Maso, M., Parshintsev, J., Ruíz-Jimenez, J., Forsström, L., Manninen, H. E., Riekkola, M.-L., Heinonen, P., and Kulmala, M.: Antarctic new particle formation from continental biogenic precursors, Atmos. Chem. Phys., 13, 3527–3546, https://doi.org/10.5194/acp-13-3527-2013, 2013.
Lehtipalo, K., Leppä, J., Kontkanen, J., Kangasluoma, J., Franchin, A., Wimmer, D., Schobesberger, S., Junninen, H., Petäjä, T., Sipilä, M., Mikkilä, J., Vanhanen, J., Worsnop, D. R., and Kulmala, M.: Methods for determining particle size distribution and growth rates between 1–3 nm using the Particle Size Magnifier, Boreal Environ. Res., 19, 215–236, 2014.
Lehtipalo, K., Yan, C., Dada, L., Bianchi, F., Xiao, M., Wagner, R., Stolzenburg, D., Ahonen, L., Amorim, A., Baccarini, A., Bauer, P., Baumgartner, B., Bergen, A., Bernhammer, A., Breitenlechner, M., Brilke, S., Buchholz, A., Mazon, S., Chen, D., Chen, X., Dias, A., Dommen, J., Draper, D., Duplissy, J., Ehn, M., Finkenzeller, H., Fischer, L., Frege, C., Fuchs, C., Garmash, O., Gordon, H., Hakala, J., He, X., Heikkinen, L., Heinritzi, M., Helm, J., Hofbauer, V., Hoyle, C., Jokinen, T., Kangasluoma, J., Kerminen, V., Kim, C., Kirkby, J., Kontkanen, J., Kürten, A., Lawler, M., Mai, H., Mathot, S., Mauldin, R., Molteni, U., Nichman, L., Nie, W., Nieminen, T., Ojdanic, A., Onnela, A., Passananti, M., Petäjä, T., Piel, F., Pospisilova, V., Quéléver, L., Rissanen, M., Rose, C., Sarnela, N., Schallhart, S., Schuchmann, S., Sengupta, K., Simon, M., Sipilä, M., Tauber, C., Tomé, A., Tröstl, J., Väisänen, O., Vogel, A., Volkamer, R., Wagner, A., Wang, M., Weitz, L., Wimmer, D., Ye, P., Ylisirniö, A., Zha, Q., Carslaw, K., Curtius, J., Donahue, N., Flagan, R., Hansel, A., Riipinen, I., Virtanen, A., Winkler, P., Baltensperger, U., Kulmala, M., and Worsnop, D.: Multicomponent new particle formation from sulfuric acid, ammonia, and biogenic vapors, Sci. Adv., 4, eaau5363, https://doi.org/10.1126/sciadv.aau5363, 2018.
Lucas, D. D. and Prinn, R. G.: Parametric sensitivity and uncertainty analysis of dimethylsulfide oxidation in the clear-sky remote marine boundary layer, Atmos. Chem. Phys., 5, 1505–1525, https://doi.org/10.5194/acp-5-1505-2005, 2005.
Mäkelä, J., Aalto, P., Jokinen, V., Pohja, T., Nissinen, A., Palmroth, S., Markkanen, T., Seitsonen, K., Lihavainen, H., and Kulmala, M.: Observations of ultrafine aerosol particle formation and growth in boreal forest, Geophys. Res. Lett., 24, 1219–1222, https://doi.org/10.1029/97gl00920, 1997.
Merikanto, J., Spracklen, D. V., Mann, G. W., Pickering, S. J., and Carslaw, K. S.: Impact of nucleation on global CCN, Atmos. Chem. Phys., 9, 8601–8616, https://doi.org/10.5194/acp-9-8601-2009, 2009.
Mohr, C., Thornton, J., Heitto, A., Lopez-Hilfiker, F., Lutz, A., Riipinen, I., Hong, J., Donahue, N., Hallquist, M., Petäjä, T., Kulmala, M., and Yli-Juuti, T.: Molecular identification of organic vapors driving atmospheric nanoparticle growth, Nat. Commun., 10, 4442, https://doi.org/10.1038/s41467-019-12473-2, 2019.
Nieminen, T., Asmi, A., Dal Maso, M., Aalto, P., Keronen, P., Petäjä, T., Kulmala, M., and Kerminen, V.-M.: Trends in atmospheric new-particle formation: 16 years of observations in a boreal-forest environment, Boreal Environ. Res., 19, 191–214, 2014.
Okuyama, K., Kousaka, Y., and Motouchi, T.: Condensational Growth of Ultrafine Aerosol Particles in a New Particle Size Magnifier, Aerosol Sci. Tech., 3, 353–366, https://doi.org/10.1080/02786828408959024, 1984.
Paasonen, P., Nieminen, T., Asmi, E., Manninen, H. E., Petäjä, T., Plass-Dülmer, C., Flentje, H., Birmili, W., Wiedensohler, A., Hõrrak, U., Metzger, A., Hamed, A., Laaksonen, A., Facchini, M. C., Kerminen, V.-M., and Kulmala, M.: On the roles of sulphuric acid and low-volatility organic vapours in the initial steps of atmospheric new particle formation, Atmos. Chem. Phys., 10, 11223–11242, https://doi.org/10.5194/acp-10-11223-2010, 2010.
Paasonen, P., Olenius, T., Kupiainen, O., Kurtén, T., Petäjä, T., Birmili, W., Hamed, A., Hu, M., Huey, L. G., Plass-Duelmer, C., Smith, J. N., Wiedensohler, A., Loukonen, V., McGrath, M. J., Ortega, I. K., Laaksonen, A., Vehkamäki, H., Kerminen, V.-M., and Kulmala, M.: On the formation of sulphuric acid amine clusters in varying atmospheric conditions and its influence on atmospheric new particle formation, Atmos. Chem. Phys., 12, 9113–9133, https://doi.org/10.5194/acp-12-9113-2012, 2012.
Petäjä, T., Mauldin III, R. L., Kosciuch, E., McGrath, J., Nieminen, T., Paasonen, P., Boy, M., Adamov, A., Kotiaho, T., and Kulmala, M.: Sulfuric acid and OH concentrations in a boreal forest site, Atmos. Chem. Phys., 9, 7435–7448, https://doi.org/10.5194/acp-9-7435-2009, 2009.
Qi, X. M., Ding, A. J., Nie, W., Petäjä, T., Kerminen, V.-M., Herrmann, E., Xie, Y. N., Zheng, L. F., Manninen, H., Aalto, P., Sun, J. N., Xu, Z. N., Chi, X. G., Huang, X., Boy, M., Virkkula, A., Yang, X.-Q., Fu, C. B., and Kulmala, M.: Aerosol size distribution and new particle formation in the western Yangtze River Delta of China: 2 years of measurements at the SORPES station, Atmos. Chem. Phys., 15, 12445–12464, https://doi.org/10.5194/acp-15-12445-2015, 2015.
Rantala, P., Aalto, J., Taipale, R., Ruuskanen, T. M., and Rinne, J.: Annual cycle of volatile organic compound exchange between a boreal pine forest and the atmosphere, Biogeosciences, 12, 5753–5770, https://doi.org/10.5194/bg-12-5753-2015, 2015.
Riccobono, F., Schobesberger, S., Scott, C., Dommen, J., Ortega, I., Rondo, L., Almeida, J., Amorim, A., Bianchi, F., Breitenlechner, M., David, A., Downard, A., Dunne, E., Duplissy, J., Ehrhart, S., Flagan, R., Franchin, A., Hansel, A., Junninen, H., Kajos, M., Keskinen, H., Kupc, A., Kurten, A., Kvashin, A., Laaksonen, A., Lehtipalo, K., Makhmutov, V., Mathot, S., Nieminen, T., Onnela, A., Petaja, T., Praplan, A., Santos, F., Schallhart, S., Seinfeld, J., Sipila, M., Spracklen, D., Stozhkov, Y., Stratmann, F., Tome, A., Tsagkogeorgas, G., Vaattovaara, P., Viisanen, Y., Vrtala, A., Wagner, P., Weingartner, E., Wex, H., Wimmer, D., Carslaw, K., Curtius, J., Donahue, N., Kirkby, J., Kulmala, M., Worsnop, D., and Baltensperger, U.: Oxidation Products of Biogenic Emissions Contribute to Nucleation of Atmospheric Particles, Science, 344, 717–721, https://doi.org/10.1126/science.1243527, 2014.
Riipinen, I., Sihto, S.-L., Kulmala, M., Arnold, F., Dal Maso, M., Birmili, W., Saarnio, K., Teinilä, K., Kerminen, V.-M., Laaksonen, A., and Lehtinen, K. E. J.: Connections between atmospheric sulphuric acid and new particle formation during QUEST IIIIV campaigns in Heidelberg and Hyytiälä, Atmos. Chem. Phys., 7, 1899–1914, https://doi.org/10.5194/acp-7-1899-2007, 2007.
Rose, C., Sellegri, K., Asmi, E., Hervo, M., Freney, E., Colomb, A., Junninen, H., Duplissy, J., Sipilä, M., Kontkanen, J., Lehtipalo, K., and Kulmala, M.: Major contribution of neutral clusters to new particle formation at the interface between the boundary layer and the free troposphere, Atmos. Chem. Phys., 15, 3413–3428, https://doi.org/10.5194/acp-15-3413-2015, 2015.
Rose, C., Zha, Q., Dada, L., Yan, C., Lehtipalo, K., Junninen, H., Mazon, S., Jokinen, T., Sarnela, N., Sipilä, M., Petäjä, T., Kerminen, V., Bianchi, F., and Kulmala, M.: Observations of biogenic ion-induced cluster formation in the atmosphere, Sci. Adv., 4, eaar5218, https://doi.org/10.1126/sciadv.aar5218, 2018.
Sarnela, N., Jokinen, T., Duplissy, J., Yan, C., Nieminen, T., Ehn, M., Schobesberger, S., Heinritzi, M., Ehrhart, S., Lehtipalo, K., Tröstl, J., Simon, M., Kürten, A., Leiminger, M., Lawler, M. J., Rissanen, M. P., Bianchi, F., Praplan, A. P., Hakala, J., Amorim, A., Gonin, M., Hansel, A., Kirkby, J., Dommen, J., Curtius, J., Smith, J. N., Petäjä, T., Worsnop, D. R., Kulmala, M., Donahue, N. M., and Sipilä, M.: Measurementmodel comparison of stabilized Criegee intermediate and highly oxygenated molecule production in the CLOUD chamber, Atmos. Chem. Phys., 18, 2363–2380, https://doi.org/10.5194/acp-18-2363-2018, 2018.
Sipilä, M., Berndt, T., Petaja, T., Brus, D., Vanhanen, J., Stratmann, F., Patokoski, J., Mauldin, R., Hyvarinen, A., Lihavainen, H., and Kulmala, M.: The Role of Sulfuric Acid in Atmospheric Nucleation, Science, 327, 1243–1246, https://doi.org/10.1126/science.1180315, 2010.
Sipilä, M., Sarnela, N., Jokinen, T., Henschel, H., Junninen, H., Kontkanen, J., Richters, S., Kangasluoma, J., Franchin, A., Peräkylä, O., Rissanen, M., Ehn, M., Vehkamäki, H., Kurten, T., Berndt, T., Petäjä, T., Worsnop, D., Ceburnis, D., Kerminen, V., Kulmala, M., and O'Dowd, C.: Molecular-scale evidence of aerosol particle formation via sequential addition of HIO3, Nature, 537, 532–534, https://doi.org/10.1038/nature19314, 2016.
Sogacheva, L., Saukkonen, E., Nilsson, D., Dal Maso, M., Schultz, D. M., De Leeuw, G., and Kulmala, M.: New aerosol particle formation in different synoptic situations at Hyytiälä, Southern Finland, Tellus B, 60, 485–494, https://doi.org/10.1111/j.1600-0889.2008.00364.x, 2008.
Sulo, J., Sarnela, N., Kontkanen, J., Ahonen, L., Paasonen, P., Laurila, T., Jokinen, T., Kangasluoma, J., Sipilä, M., Junninen, H., Petäjä, T., Kulmala, M., and Lehtipalo, K.: Particle concentration data from: Long-term measurement of sub-3 nm particles and their precursor gases in the boreal forest, Zenodo, https://doi.org/10.5281/zenodo.4153280, 2020.
Vakkari, V., Laakso, H., Kulmala, M., Laaksonen, A., Mabaso, D., Molefe, M., Kgabi, N., and Laakso, L.: New particle formation events in semi-clean South African savannah, Atmos. Chem. Phys., 11, 3333–3346, https://doi.org/10.5194/acp-11-3333-2011, 2011.
Vanhanen, J., Mikkilä, J., Lehtipalo, K., Sipilä, M., Manninen, H., Siivola, E., Petäjä, T., and Kulmala, M.: Particle Size Magnifier for Nano-CN Detection, Aerosol Sci. Tech., 45, 533–542, https://doi.org/10.1080/02786826.2010.547889, 2011.
Wagner, R., Yan, C., Lehtipalo, K., Duplissy, J., Nieminen, T., Kangasluoma, J., Ahonen, L. R., Dada, L., Kontkanen, J., Manninen, H. E., Dias, A., Amorim, A., Bauer, P. S., Bergen, A., Bernhammer, A.-K., Bianchi, F., Brilke, S., Mazon, S. B., Chen, X., Draper, D. C., Fischer, L., Frege, C., Fuchs, C., Garmash, O., Gordon, H., Hakala, J., Heikkinen, L., Heinritzi, M., Hofbauer, V., Hoyle, C. R., Kirkby, J., Kürten, A., Kvashnin, A. N., Laurila, T., Lawler, M. J., Mai, H., Makhmutov, V., Mauldin III, R. L., Molteni, U., Nichman, L., Nie, W., Ojdanic, A., Onnela, A., Piel, F., Quéléver, L. L. J., Rissanen, M. P., Sarnela, N., Schallhart, S., Sengupta, K., Simon, M., Stolzenburg, D., Stozhkov, Y., Tröstl, J., Viisanen, Y., Vogel, A. L., Wagner, A. C., Xiao, M., Ye, P., Baltensperger, U., Curtius, J., Donahue, N. M., Flagan, R. C., Gallagher, M., Hansel, A., Smith, J. N., Tomé, A., Winkler, P. M., Worsnop, D., Ehn, M., Sipilä, M., Kerminen, V.-M., Petäjä, T., and Kulmala, M.: The role of ions in new particle formation in the CLOUD chamber, Atmos. Chem. Phys., 17, 15181–15197, https://doi.org/10.5194/acp-17-15181-2017, 2017.
Weller, R., Schmidt, K., Teinilä, K., and Hillamo, R.: Natural new particle formation at the coastal Antarctic site Neumayer, Atmos. Chem. Phys., 15, 11399–11410, https://doi.org/10.5194/acp-15-11399-2015, 2015.
Wimmer, D., Buenrostro Mazon, S., Manninen, H. E., Kangasluoma, J., Franchin, A., Nieminen, T., Backman, J., Wang, J., Kuang, C., Krejci, R., Brito, J., Goncalves Morais, F., Martin, S. T., Artaxo, P., Kulmala, M., Kerminen, V.-M., and Petäjä, T.: Ground-based observation of clusters and nucleation-mode particles in the Amazon, Atmos. Chem. Phys., 18, 13245–13264, https://doi.org/10.5194/acp-18-13245-2018, 2018.
Winkler, P., Vrtala, A., Steiner, G., Wimmer, D., Vehkamäki, H., Lehtinen, K., Reischl, G., Kulmala, M., and Wagner, P.: Quantitative Characterization of Critical Nanoclusters Nucleated on Large Single Molecules, Phys. Rev. Lett., 108, 085701, https://doi.org/10.1103/physrevlett.108.085701, 2012.
Wu, Z., Hu, M., Liu, S., Wehner, B., Bauer, S., Ma ßling, A., Wiedensohler, A., Petäjä, T., Dal Maso, M., and Kulmala, M.: New particle formation in Beijing, China: Statistical analysis of a 1-year data set, J. Geophys. Res., 112, D09209, https://doi.org/10.1029/2006jd007406, 2007.
Xiao, S., Wang, M. Y., Yao, L., Kulmala, M., Zhou, B., Yang, X., Chen, J. M., Wang, D. F., Fu, Q. Y., Worsnop, D. R., and Wang, L.: Strong atmospheric new particle formation in winter in urban Shanghai, China, Atmos. Chem. Phys., 15, 1769–1781, https://doi.org/10.5194/acp-15-1769-2015, 2015.
Yan, C., Dada, L., Rose, C., Jokinen, T., Nie, W., Schobesberger, S., Junninen, H., Lehtipalo, K., Sarnela, N., Makkonen, U., Garmash, O., Wang, Y., Zha, Q., Paasonen, P., Bianchi, F., Sipilä, M., Ehn, M., Petäjä, T., Kerminen, V.-M., Worsnop, D. R., and Kulmala, M.: The role of H2SO4-NH3 anion clusters in ion-induced aerosol nucleation mechanisms in the boreal forest, Atmos. Chem. Phys., 18, 13231–13243, https://doi.org/10.5194/acp-18-13231-2018, 2018.
Yan, C., Nie, W., Vogel, A., Dada, L., Lehtipalo, K., Stolzenburg, D., Wagner, R., Rissanen, M., Xiao, M., Ahonen, L., Fischer, L., Rose, C., Bianchi, F., Gordon, H., Simon, M., Heinritzi, M., Garmash, O., Roldin, P., Dias, A., Ye, P., Hofbauer, V., Amorim, A., Bauer, P., Bergen, A., Bernhammer, A., Breitenlechner, M., Brilke, S., Buchholz, A., Mazon, S., Canagaratna, M., Chen, X., Ding, A., Dommen, J., Draper, D., Duplissy, J., Frege, C., Heyn, C., Guida, R., Hakala, J., Heikkinen, L., Hoyle, C., Jokinen, T., Kangasluoma, J., Kirkby, J., Kontkanen, J., Kürten, A., Lawler, M., Mai, H., Mathot, S., Mauldin, R., Molteni, U., Nichman, L., Nieminen, T., Nowak, J., Ojdanic, A., Onnela, A., Pajunoja, A., Petäjä, T., Piel, F., Quéléver, L., Sarnela, N., Schallhart, S., Sengupta, K., Sipilä, M., Tomé, A., Tröstl, J., Väisänen, O., Wagner, A., Ylisirniö, A., Zha, Q., Baltensperger, U., Carslaw, K., Curtius, J., Flagan, R., Hansel, A., Riipinen, I., Smith, J., Virtanen, A., Winkler, P., Donahue, N., Kerminen, V., Kulmala, M., Ehn, M., and Worsnop, D.: Size-dependent influence of NOx on the growth rates of organic aerosol particles, Sci. Adv., 6, eaay4945, https://doi.org/10.1126/sciadv.aay4945, 2020.
Zha, Q., Yan, C., Junninen, H., Riva, M., Sarnela, N., Aalto, J., Quéléver, L., Schallhart, S., Dada, L., Heikkinen, L., Peräkkyläk, O., Zou, J., Rose, C., Wang, Y., Mammarella, I., Katul, G., Vesala, T., Worsnop, D. R., Kulmala, M., Petäkjäk, T., Bianchi, F., and Ehn, M.: Vertical characterization of highly oxygenated molecules (HOMs) below and above a boreal forest canopy, Atmos. Chem. Phys., 18, 17437–17450, https://doi.org/10.5194/acp-18-17437-2018, 2018.