the Creative Commons Attribution 4.0 License.
the Creative Commons Attribution 4.0 License.
 | 05 May 2021
Measurement report: Balloon-borne in situ profiling of Saharan dust over Cyprus with the UCASS optical particle counter
Matthias Tesche
Helen Smith
Alexandra Tsekeri
Holger Baars
Maximilian Dollner
Víctor Estellés
Johannes Bühl
Bernadett Weinzierl
Zbigniew Ulanowski
Detlef Müller
Vassilis Amiridis
This paper presents measurements of mineral dust concentration in the diameter range from 0.4 to 14.0 µm with a novel balloon-borne optical particle counter, the Universal Cloud and Aerosol Sounding System (UCASS). The balloon launches were coordinated with ground-based active and passive remote-sensing observations and airborne in situ measurements with a research aircraft during a Saharan dust outbreak over Cyprus from 20 to 23 April 2017. The aerosol optical depth at 500 nm reached values up to 0.5 during that event over Cyprus, and particle number concentrations were as high as 50 cm−3 for the diameter range between 0.8 and 13.9 µm. Comparisons of the total particle number concentration and the particle size distribution from two cases of balloon-borne measurements with aircraft observations show reasonable agreement in magnitude and shape despite slight mismatches in time and space. While column-integrated size distributions from balloon-borne measurements and ground-based remote sensing show similar coarse-mode peak concentrations and diameters, they illustrate the ambiguity related to the missing vertical information in passive sun photometer observations. Extinction coefficient inferred from the balloon-borne measurements agrees with those derived from coinciding Raman lidar observations at height levels with particle number concentrations smaller than 10 cm−3 for the diameter range from 0.8 to 13.9 µm. An overestimation of the UCASS-derived extinction coefficient of a factor of 2 compared to the lidar measurement was found for layers with particle number concentrations that exceed 25 cm−3, i.e. in the centre of the dust plume where particle concentrations were highest. This is likely the result of a variation in the refractive index and the shape and size dependency of the extinction efficiency of dust particles along the UCASS measurements. In the future, profile measurements of the particle number concentration and particle size distribution with the UCASS could provide a valuable addition to the measurement capabilities generally used in field experiments that are focussed on the observation of coarse aerosols and clouds.
- Article
(4897 KB) - Full-text XML
-
Supplement
(205 KB) - BibTeX
- EndNote


Atmospheric aerosols are of significant importance for the Earth's radiative budget. They have a direct impact on climate by scattering and absorbing solar radiation. They can also act as ice-nucleating particles and cloud condensation nuclei and thus influence not only the formation and evolution of clouds but also the hydrological cycle (Stocker et al., 2013). Aerosols and their precursors originate from natural and anthropogenic sources. Natural sources include emissions from the ocean, soils, volcanoes, and vegetation, whereas anthropogenic sources include emissions from the combustion of fossil fuels or the result of changes in land use (Boucher, 2015). For instance, sulfates and soot can be of both natural and anthropogenic origin, while mineral dust and marine aerosols originate predominantly from natural sources (Rodriguez et al., 2002; Kaufman et al., 2005; Quaas, 2011). The latter two aerosol types are abundant in the atmosphere, and particularly mineral dust can be transported over intercontinental distances from its source regions (Prospero, 1999; Weinzierl et al., 2017).
Over the past 15 years, several measurement campaigns have focused on gaining deeper insight into the role of mineral dust in the Earth's system. An overview of several mineral dust field campaigns is given in Weinzierl et al. (2017). These experiments generally featured comprehensive remote-sensing instrumentation; detailed monitoring of chemical, microphysical, and optical properties of aerosols at the surface; and airborne in situ observations with research aircraft. Such observations have been performed, for instance, during the two Saharan Mineral Dust Experiments (SAMUM; Weinzierl et al., 2009; Ansmann et al., 2011), Fennec (Ryder et al., 2013), the Saharan Aerosol Long-Range Transport and Aerosol–Cloud-Interaction Experiment (SALTRACE; Weinzierl et al., 2017), and the CHemistry and AeRosols Mediterranean EXperiment (CHArMEx; Renard et al., 2018). Recently, the focus of such activities has extended towards the eastern Mediterranean as this region is on the crossroad of aerosol transport of mineral dust from Sahara and Middle East, continental outflow from Europe, and biomass-burning smoke from eastern Europe and central Asia (Georgoulias et al., 2016). The majority of dust storms over the eastern Mediterranean basin occur between December and April with maximum dust load during April (Israelevich et al., 2002). The main zones of cyclogenesis in the Mediterranean Sea determine dust uplift and transport in the region (Alpert et al., 1990; Bou Karam et al., 2010). Heavy dust periods over the eastern Mediterranean are frequently associated with the so-called Cyprus Low (Katsnelson, 1970; Dayan et al., 2008) as well as the Sharav cyclone (Alpert and Ziv, 1989), which transport dust from the Arabian deserts and northern Sahara into the eastern Mediterranean basin where they are frequently observed over Cyprus.
Statistical information on the size distributions of atmospheric aerosols, cloud droplets, and ice crystals is of vital importance for identifying and evaluating the physical processes governing aerosol–cloud interactions and their climate effects which currently contribute considerable uncertainty to our understanding of current and future climate change (Stocker et al., 2013) as well as to the performance of numerical weather prediction models (Baldauf et al., 2011). The majority of the data assimilated into models and used for model verification comes from remote-sensing observations (Lahoz and Schneider, 2014). Meteorological soundings in combination with an optical particle counter (OPC) can provide time series of aerosol size distribution profiles that have the potential to complement the data for assimilation in and verification of atmospheric models. The purpose of this paper is to present results of in situ measurements of mineral dust particles over the eastern Mediterranean with a novel disposable balloon-borne OPC and to assess the quality of the collected data based on independent observations.
OPCs are well-established optical instruments for the measurement of particle size distributions in the size range between 0.060 and 100 µm. However, only few current OPCs have been specifically developed for balloon-borne measurements, which can only be performed with lightweight instruments. The light optical aerosol counter (LOAC) is a balloon-borne OPC that was designed for the detection of irregularly shaped aerosols in the diameter range from 0.2 to 100.0 µm (Renard et al., 2016). It was deployed for aerosol profiling during a dust event in the framework of CHArMEx in 2013 (Renard et al., 2018). The non-disposable LOAC weighs about 1 kg, and the sampled air is drawn through an inlet into the measurement chamber. Hence, the LOAC is not suitable for cloud sampling as cloud droplets might not be able to pass through the inlet without shattering or evaporation losses. The cloud particle sensor (CPS; Fujiwara et al., 2016) is a balloon-borne instrument for measuring cloud particle number concentrations in the diameter range from 2 to 80 µm. It measures the state of polarization of the scattered laser light and provides information on cloud phase. The CPS also employs an inlet sampling system. The CPS was developed specifically for cloud measurements, and the lower detection limit allows us to sample only coarse aerosol particles. In contrast to conventional OPCs (with the exception of airborne wing-mounted probes) that draw air through a narrow channel behind an inlet, the Universal Cloud and Aerosol Sounding System (UCASS) OPC was developed with an open sampling path (Smith et al., 2019). This open-path design reduces cut-off and shattering effects that can lead to counting and sizing uncertainties and makes the instrument suitable for measurements of both aerosols and clouds.
Measurements presented here have been performed in the framework of the European Research Council (ERC) project entitled “Absorbing aerosol layers in a changing climate: ageing, lifetime and dynamics” (A-LIFE, https://www.a-life.at/, last access: 2 February 2021) that was based on Cyprus. The aim of A-LIFE was to investigate the properties of absorbing aerosols, particularly of mixtures of mineral dust and black carbon. The activities incorporated measurements with a research aircraft, advanced aerosol lidars, sun photometers, and ground-based in situ instrumentation. An intense dust outbreak from 20 to 23 April 2017 provided ideal conditions for deploying the UCASS OPC for balloon-borne in situ dust profiling. This is the first paper that is focussed on presenting results of UCASS measurements from field deployment. It is organized as follows. Section 2 presents the instrumentation and methods. Findings are described and discussed in Sect. 3. Conclusions and a summary are given in Sect. 4.
2.1 UCASS
The Universal Cloud and Aerosol Sounding System (UCASS) is a lightweight, disposable OPC that was developed at the University of Hertfordshire (Smith et al., 2019). The UCASS unit weighs 280 g and was designed for use as a balloon-borne instrument, as a dropsonde, or on an unmanned aerial vehicle (UAV; Girdwood et al., 2020). The UCASS OPC features an open-path geometry that prevents particle losses and droplet shattering by the inlet that would need to be corrected for during data analysis (Smith et al., 2019). The instrument operates a 658 nm laser diode and collects light scattered by individual particles in an angular range between 16 and 104∘. Depending on the configuration mode and the laboratory calibration, UCASS can measure either aerosols in the diameter (optical) range between 0.4 and 17.0 µm or cloud droplets in the detection range from 1.0 to 40.0 µm. The uncertainty of the number concentration measured when UCASS is launched with a radiosonde was found to be about 8 % using computational fluid dynamics modelling as presented in Smith et al. (2019). This value results from varying airflow related to the tilt of the instrument. Comparisons to reference instruments during laboratory experiments with a fixated UCASS showed a smaller uncertainty of the measured number concentrations. A detailed description of the instrument and its calibration can be found in Smith et al. (2019).
The UCASS OPC is typically deployed in combination with a Graw DFM-09 radiosonde (https://graw.de/products/radiosondes/dfm-09, last access: 6 March 2021), which is used to measure relative humidity, temperature, and pressure. At every 1 s interval, the dataset is either saved to an on-board micro SD card or transmitted via a serial link (XDATA protocol) to a radiosonde device for radio frequency transmission of the data (Smith et al., 2019). The DFM-09’s XDATA interface is used for transmitting the UCASS data in 10 size bins together with time of flight data for quality assurance. Other sondes employing the XDATA protocol can be used as well. The UCASS-radiosonde payload can be used to obtain aerosol and cloud profiles from the surface up to the tropopause within about 60 min from launch. The flow speed through the UCASS' open detection path is determined by the ascent rate u of the meteorological balloon. Effects of a tilt of the instrument on the flow rate are discussed in Smith et al. (2019). During the launch preparation, the balloon is filled to a size that translates into an ascent rate of about 5 m s−1 to guarantee optimum measurement performance of the UCASS. In the data analysis, the ascent rate is calculated from the change in height h with time t by . The ascent rate is used to calculate the volume v of sampled air by v=Aut with the UCASS sample area of m2, which is specified as a section of the laser beam (Smith et al., 2019). The device electronics can measure up to 104 particles per second and can operate in air flow speeds between 2 and 15 m s−1, with the standard firmware. For a standard operating velocity of 5 m s−1, the corresponding particle concentration is 3.5×103 cm−3 (Smith et al., 2019).
The raw particle counts C per size bin i are used to calculate the particle number concentration per size bin as number of particles per unit volume over the covered size range. Summation of ni over all size bins leads to the total number concentration N. The particle number size distribution is determined by
with the assumption of spherical particles. While mineral dust particles are non-spherical, the shape effect on the scattering phase function with respect to spherical particles is less pronounced within the angular range exploited in the UCASS setup (forward to sideward scattering) compared to scattering in the backward direction. Hence, the use of Mie scattering has a small effect on the calculated size distributions even in the presence of non-spherical particles (Johnson and Osborne, 2011; Lacis and Mishchenko, 1995). More specifically, Johnson and Osborne (2011) estimate a maximum error of 21 % related to the assumption of spherical dust particles which they assess as moderate compared to the other errors inherent in the derivation of the total optical parameters.
The column-integrated volume–size distribution for comparison to the normalized volume–size distributions provided from remote-sensing retrievals is calculated using the sum of the number concentration for each bin over the entire ascent together with the bin centre and width by
The effective diameter is defined by Hansen (1971) as the ratio of the volume to the surface-area concentration by
The effective diameter is calculated over the entire UCASS measured size range.
UCASS measurements can be used to calculate the aerosol extinction coefficient. This can then be compared to the extinction coefficient profile derived from collocated lidar measurements. For a particle with diameter D and known refractive index, the size-dependent extinction efficiency Qext(D) (unitless) can be derived from Mie-scattering calculations. Here, we use a refractive index of 1.52+0.002i. Then, the extinction cross section of the particle (in square metres) is calculated by . Using the measured number concentration for each UCASS bin (10 bins in total), the extinction coefficient (in reciprocal metres) is derived by
2.2 A-LIFE instrumentation
In order to demonstrate the UCASS' capability of profiling aerosol number concentrations and size distributions, the quality of its observations needs to be evaluated with the help of independent data. To meet optimum conditions for comparison, UCASS launches during A-LIFE were coordinated with ground-based remote sensing (also ensuring the temporal collocation of active and passive instruments) and the flight schedule of the DLR Falcon research aircraft.
A PollyXT multiwavelength aerosol Raman lidar (Engelmann et al., 2016) from the Institute for Tropospheric Research (TROPOS), Leipzig, Germany, was operated at Limassol from October 2016 to March 2018 in the framework of the Cyprus Clouds Aerosols and Rain Experiment (CyCARE). PollyXT measures profiles of aerosol backscatter coefficients at 355, 532, and 1064 nm; aerosol extinction coefficients at 355 and 532 nm; and aerosol linear depolarization ratios at 355 and 532 nm. The latter parameter is highly sensitive to particle shape, and the corresponding measurements are calibrated following the methodology outlined in Freudenthaler (2016). Lidar-derived values of aerosol optical depth are inferred by extending the profiles down to the surface using the lowermost trustworthy value above the overlap range. These measurements provide insight into the vertical distribution of aerosol concentration, size, and type (Engelmann et al., 2016). Near-real-time data from the PollyXT website (http://polly.tropos.de, last access: 4 March 2021) were consulted to schedule UCASS launches for dust observations.
Aerosol Robotic Network (AERONET) sun photometer measurements (Holben et al., 1998) during A-LIFE were performed at Paphos and Limassol. These measurements provide information on the optical and microphysical properties of the bulk aerosol in the atmospheric column. AERONET sun photometers perform spectrally resolved measurements of aerosol optical depth (AOD) at 340, 440, 675, 870, 1020, and 1640 nm and of sky radiances at several almucantar angles at 440, 675, 870, and 1020 nm (Holben et al., 1998). In this work, only AERONET version 3 level 2.0 data are considered.
The DLR Falcon research aircraft was equipped with an extensive in situ aerosol payload including total aerosol concentration measurements (0.005–930 µm), highly resolved size distribution measurements in the range between 0.25 and 930 µm particle diameter, a wind lidar, and meteorological sensors. Furthermore, aerosol optical properties were determined, and particles were collected for offline chemical analyses. The setup was similar to earlier campaigns that also focused on mineral dust (Weinzierl et al., 2009, 2011, 2017). Local column closure flights were performed at the sites of Paphos airport and the Limassol lidar station. In this paper, UCASS measurements are compared to data collected with a second-generation Cloud, Aerosol, and Precipitation Spectrometer (CAPS; Spanu et al., 2020) that was mounted at the aircraft wing. The CAPS instrument consists of a cloud and aerosol spectrometer with depolarization detection (CAS) and a cloud imaging probe (CIP). Furthermore, it contains a few minor sensors including a liquid water content (LWC) sensor, a pitot tube measuring the airspeed, and sensors for pressure, temperature, and relative humidity. The CAS uses a 658 nm laser to observe the size distribution of particles between approximately 0.5 and 50.0 µm (optical diameter). The CIP uses a linear array of 64 photodiodes to detect shadow images of particles in the size range between 15 and 930 µm in diameter. For the comparison to UCASS observations, CAPS measurements were opted to fit within the UCASS sampling range spanning from 0.79 to 13.90 µm in diameter. During A-LIFE, a total of 17 research flights were performed over the eastern Mediterranean, i.e. from or to Paphos. Two of those flights could be matched to UCASS measurements in both time and space.
2.3 Remote-sensing retrievals
UCASS in situ measurements of the particle size distribution and the subsequently derived extinction coefficient are also evaluated with the findings from remote-sensing observations. For this purpose, lidar and sun photometer data are used as input to the Generalized Aerosol Retrieval from Radiometer and Lidar Combined data algorithm (GARRLiC; Lopatin et al., 2013) and the AERONET (Dubovik et al., 2006) and ERS/SKYNET-SKYRAD (Campanelli et al., 2007) inversions. The use of in situ data from OPC measurements as a benchmark allows for an assessment of the reliability of the different methods (Tsekeri et al., 2017) in the presence of coarse-mode-dominated aerosols.
2.3.1 AERONET
The AERONET inversion employs measurements of direct and diffuse radiation with sun and sky radiometers to retrieve aerosol optical and microphysical particle properties that are representative of the total atmospheric column (Dubovik et al., 2000, 2006). The AERONET algorithm assumes a vertically homogeneous atmosphere and a mono-component aerosol with a single complex refractive index. AERONET inversion products include the particle size distribution, the complex refractive index, the scattering phase function, the single-scattering albedo, and spectral and broadband fluxes. Size distributions obtained from AERONET measurements of mineral dust, have shown a dominant mode at around 4 to 5 µm in diameter (Müller et al., 2012; Marenco et al., 2018). The AERONET retrieval forces the particle size distribution to zero at 30 µm in diameter. This constraint may therefore lead to an underestimation of the concentration of large particles by AERONET (Ryder et al., 2019). The reported uncertainties for the AERONET size distribution retrievals in the range from 0.1 to 7.0 µm in radius are given as 10 % to 35 %, while for larger sizes, uncertainties rise up to 80 % to 100 % (Dubovik et al., 2000, 2002).
2.3.2 ESR/SKYNET
SKYNET is an international research network of users of the PREDE Co. Ltd POM sky radiometer with a growing number of instruments now exceeding 100 units. Currently, SKYNET uses two versions (4.2 and 5) of the inversion algorithm SKYRAD to analyse the radiance measurements of the PREDE POM sky radiometers, although other versions are being developed and currently tested. In order to benefit the international community of users, a re-organization of the network structure has been initiated (Nakajima et al., 2020).
Although the International SKYNET Data Center (ISDC) has already started data collection and analysis, different regional sub-networks are well established and develop new research products and test new methodologies (Nakajima et al., 2020). In Europe, the regional sub-network is called the European SKYNET Radiometers network (ESR). In ESR, versions of SKYRAD software have been adapted to analyse data from CIMEL sun–sky photometers (Estellés et al., 2012). In this analysis the current SKYRAD version 4.2 is used and the corresponding inversions will be called SKYRAD retrievals.
As for the AERONET inversion, the SKYRAD algorithm estimates the size distribution, phase function, and surface albedo of aerosols from measurements of diffuse sky radiance (Campanelli et al., 2007). A notable difference to AERONET is, however, that the SKYRAD retrieval does not prescribe an upper boundary for particle size (Estellés et al., 2012).
2.3.3 GARRLiC
The GARRLiC retrieval is a synergistic algorithm that combines quasi-simultaneous passive sky-radiance measurements with active lidar measurements during cloud-free conditions. The required input from sun photometer observations includes the total AOD and radiances at 440, 670, 870, and 1020 nm. Concurrently, lidar measurements of the elastic backscatter signals at 355, 532, and 1064 nm are used as input for GARRLiC (Lopatin et al., 2013). The output of the retrieval provides columnar aerosol volume concentration together with a column-mean aerosol volume–size distribution, spectral refractive index, and spherical particle fraction. GARRLiC also retrieves aerosol optical properties such as the single-scattering albedo, backscatter and extinction coefficients, and aerosol lidar ratio.
The lidar input enables GARRLiC to account for variations in aerosol stratification. Due to the wider set of input parameters, the GARRLiC retrieval requires fewer assumptions than other algorithms (Bovchaliuk et al., 2016). Estimation of the different uncertainties of the GARRLiC-derived products is provided in previous works (e.g. Torres et al., 2017), and it has lately been tested for integration in the algorithm (Herrera et al., 2019). In case of a bi-modal aerosol distribution, GARRLiC provides the flexibility to use a bi-component aerosol model that may have different refractive indices in the fine and coarse modes. In the presence of mixtures of aerosol types with multiple contributions to the fine and coarse modes (e.g. mixture of marine and dust particles; Tsekeri et al., 2017), the algorithm provides an average estimation similar to the AERONET retrieval. We constrain the investigation in this study to one dust mode because the UCASS observations at Cyprus show a dominance of coarse-mode dust particles throughout the atmospheric column.
2.4 HYSPLIT backward trajectories
The Hybrid Single-Particle Lagrangian Integrated Trajectory model (HYSPLIT; Stein et al., 2015; Rolph et al., 2017) run with Global Data Assimilation System (GDAS) meteorological reanalysis fields (∼50 km resolution) was used to investigate the origin of the observed air masses over Cyprus. The 5 d backward trajectories starting at the locations of the remote-sensing sites were calculated for arrival heights between 1.0 and 7.0 km.
3.1 Overview of measurements
The A-LIFE field experiment took place between 3 and 29 April 2017 when the DLR Falcon research aircraft was deployed at Paphos airport. The period between 20 and 22 April 2017 was dominated by southwesterly airflow with favourable conditions for the transport of Saharan dust to Cyprus. Persistent periods of clear sky made for ideal conditions for remote-sensing observations. Five UCASS OPCs were launched during an intense dust outbreak that lasted from 20 to 22 April 2017. Figure 1 provides an overview of the temporal evolution of the dust plume over Limassol between 19 and 23 of April 2017 in the form of column-integrated parameters measured with two AERONET sun photometers and height-resolved observations with the PollyXT aerosol lidar. The figure also shows the times and locations of the UCASS launches. Four launches were performed from Paphos airport (34.71∘ N, 32.48∘ E), while one UCASS sonde (01:34 UTC on 21 April 2017) was launched from the lidar site in Limassol (34.7∘ N, 33.0∘ E) (Ansmann et al., 2019). Table 1 provides an overview of the UCASS launch times together with the time periods and locations of the remote-sensing and airborne measurements used for comparison. The first airborne mission over this period was performed on 19 April; the leading edge of the dust plume was found to be over Malta and moved eastwards across the Mediterranean in the following days.
Table 1Dates and times (UTC) of UCASS launches, aircraft profiles (together with location of observation), and measurements with lidar and sun photometer (SPM) used in this study. UCASS units were launched from Paphos except for the launch at 01:34 UTC on 21 April 2017 which was performed next to the lidar site at Limassol. Lidar 1 refers to the time period used for the comparison of AOD and extinction coefficients in Figs. 1 and 8, respectively. Lidar 2 marks the time period used for the combined lidar–SPM retrievals with GARRLiC in Fig. 6.
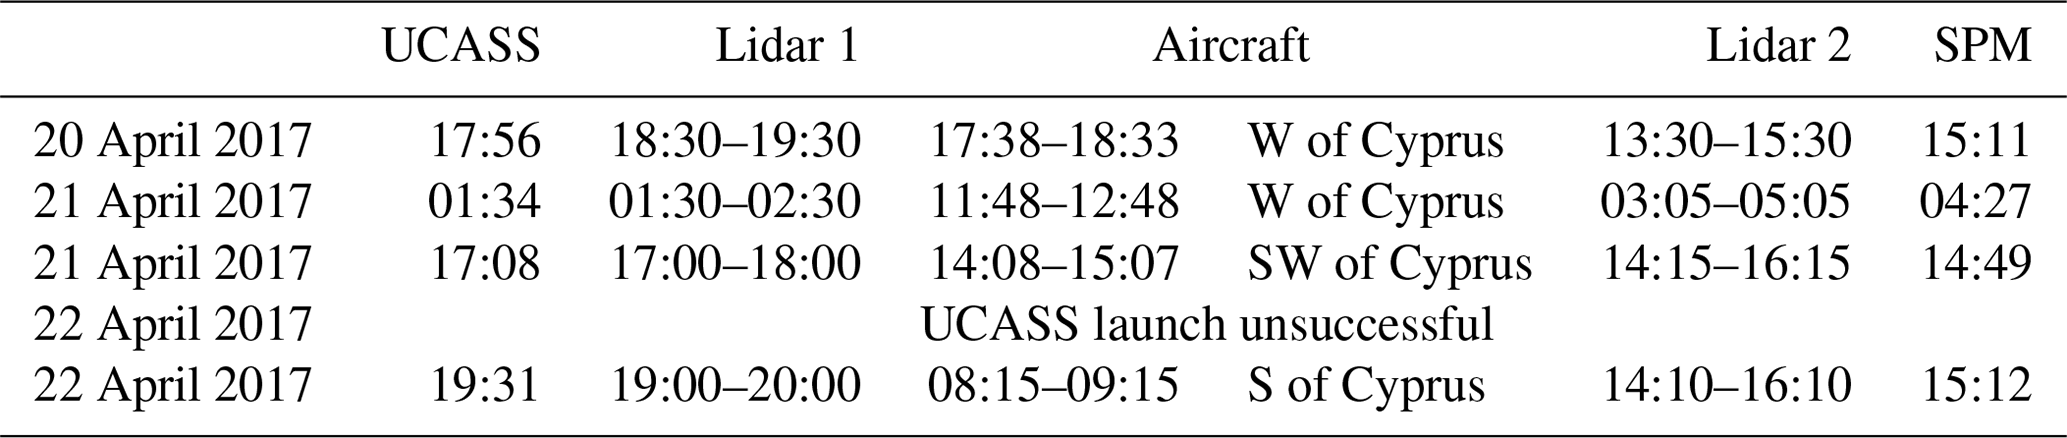
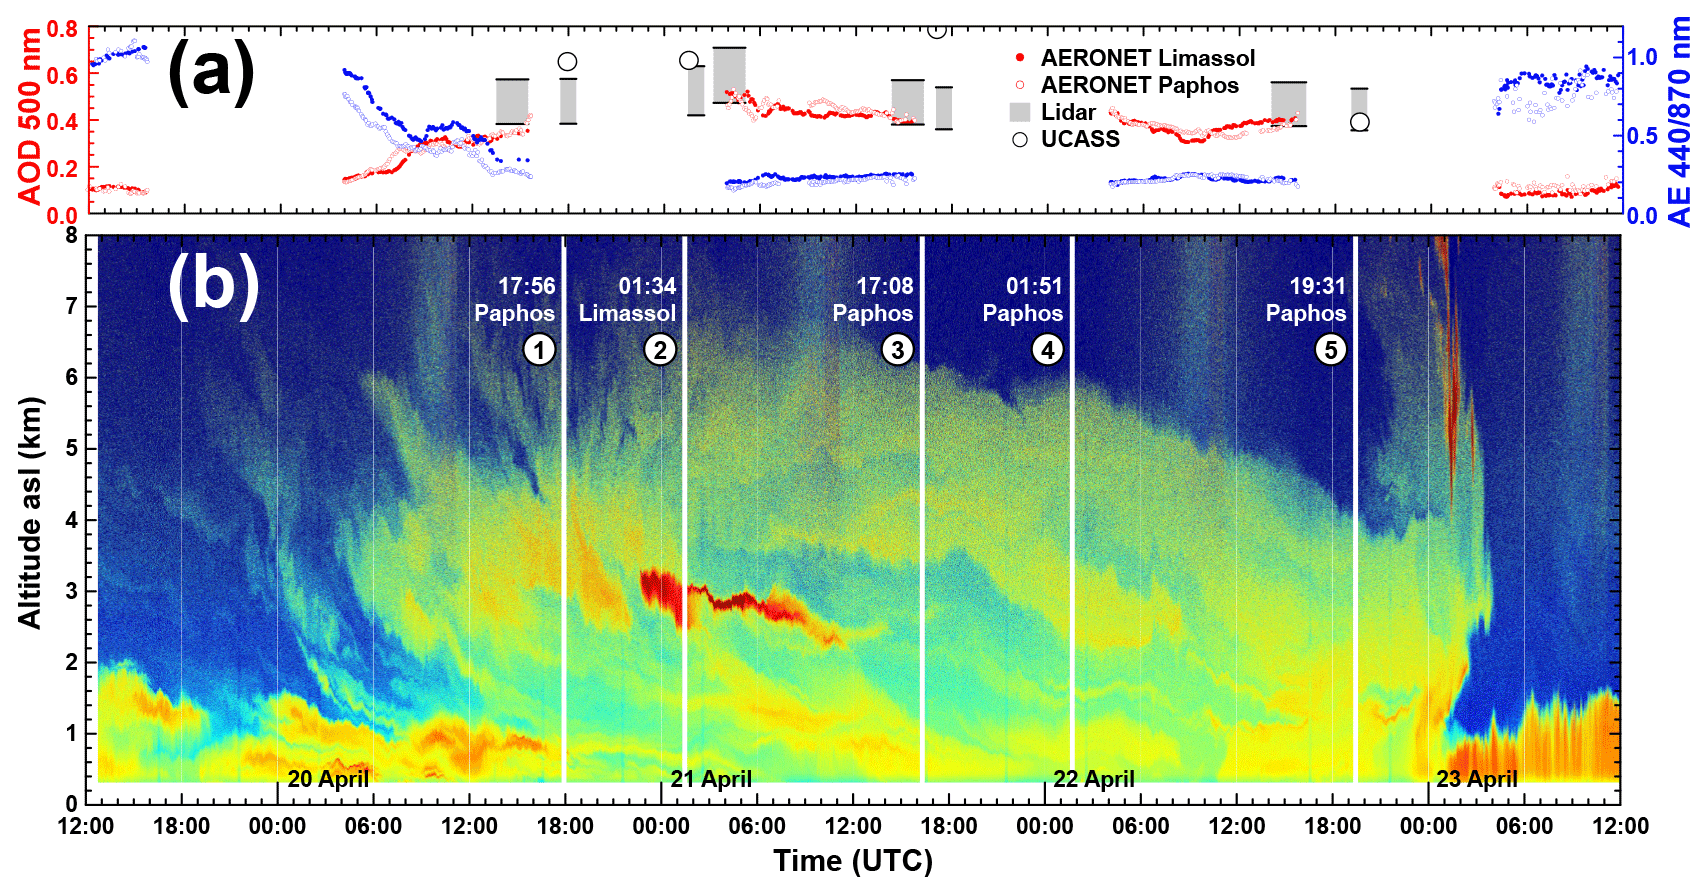
Figure 1Overview of the aerosol conditions at Limassol (34.7∘ N, 33.0∘ E) during the 4 d period from 20 to 23 April 2017 in terms of (a) the aerosol optical depth (AOD) at 500 nm (red) and the Ångström exponent (AE) for the wavelength pair nm (blue) as obtained from AERONET sun photometer observations at Limassol (filled dots) and Paphos (open dots), UCASS (532 nm, black circles), and PollyXT lidar measurements (grey bar spanning the range of values obtained from multiplying the 532 nm backscatter coefficient with 40 and 60 sr). (b) The range-corrected signal at 1064 nm as measured with the Polly lidar. Lines and numbers mark the times and locations of UCASS launches. Low backscatter signal (low aerosol concentrations) is shown in blue while very high backscatter signal (dense aerosol layers) is shown in red.
The AERONET measurements in Fig. 1a show the arrival of the dust plume over Limassol in the morning of 20 April 2017 in the form of an increase in AOD that is accompanied by a decrease in the Ångström exponent. The former refers to an increase in aerosol loading while the latter indicates that large particles are present in the atmosphere. The highest AOD of around 0.5 at 500 nm was observed in the morning of 21 April 2017. The AOD stayed fairly constant at around 0.4 for the rest of the day and decreased slightly to 0.35 on 22 April 2017. During this period, the Ångström exponent stayed very constant at 0.3. The sudden shift in AOD to 0.1 and in Ångström exponent to 0.9 in the morning of 23 April 2017 indicates the departure of the dust event from Limassol and the return to background conditions.
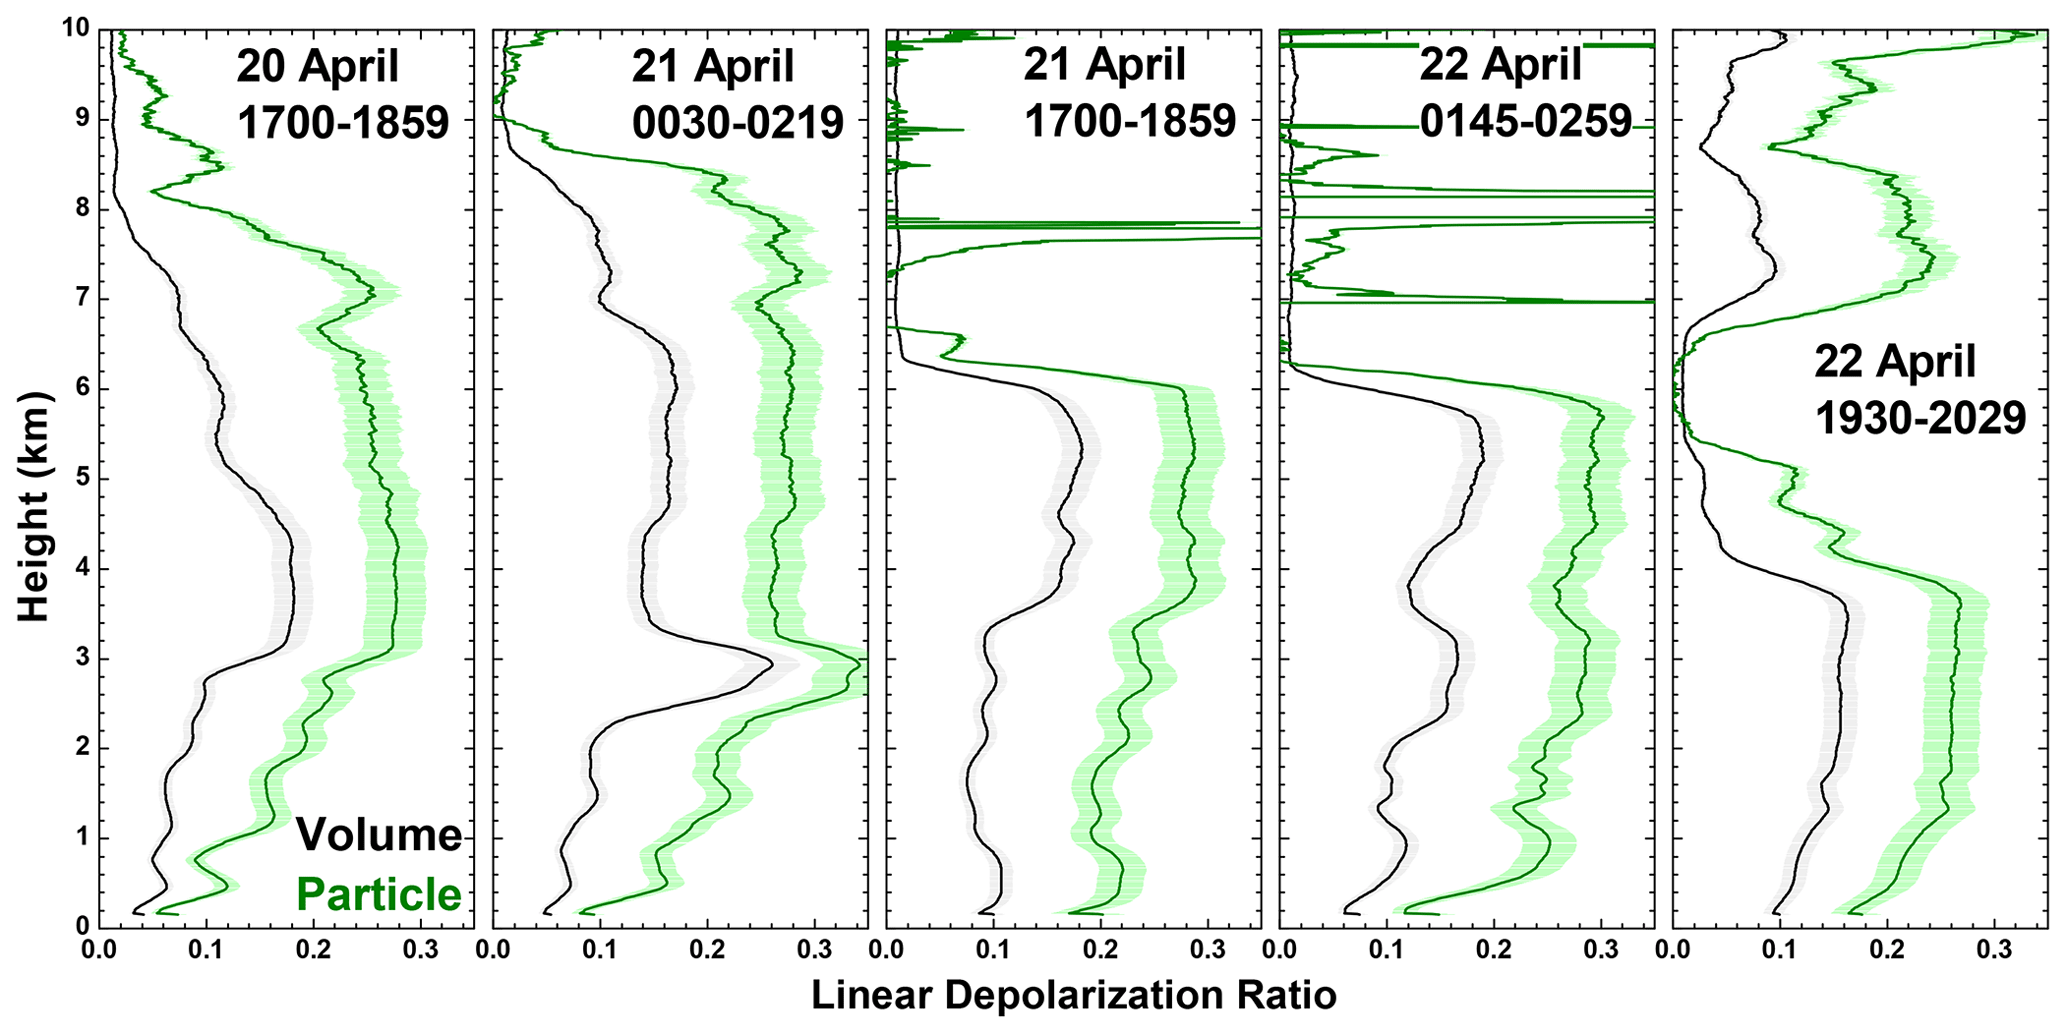
This narrative is corroborated and complemented by the height-resolved lidar observations in Figs. 1b and 2. The first faint traces of the dust plume were detected between 4 and 5 km height in the afternoon of 19 April 2017. The main plume arrived at a height of 3 km at 04:00 UTC on 20 April 2017. The top of the dust plume reached as high as 7 km at 06:00 UTC on 21 April and slowly descended to 4 km until the dust plume departed at 04:00 UTC on 23 April 2017. The lidar signal reveals the structure of the dust plume, most notably a thin filament of strong backscatter signal between 2 and 3 km height from 22:00 UTC on 20 April 2017 to 12:00 UTC on 21 April 2017. The lidar plot shows a homogeneous dust layer in the upper part of the plume and features that correspond to the settling of dust particles over time, i.e. structures that appear at lower heights as the dust plume passed over the lidar station. The profiles of the particle linear depolarization ratio at 532 nm in Fig. 2 provide evidence that mineral dust was present over the measurement site and occurred in well-mixed layers. Values larger than 0.20 and as high as 0.33 are generally observed for this particle type (Freudenthaler et al., 2009) and are detected throughout the better part of the aerosol layer while the influence of local aerosols leads to the lower values close to the surface.
The trajectories of the five UCASS launches up to 10 km height are shown in the right panel of Fig. 3. It generally takes about 40 min for the balloon to reach such an altitude, though it depends on the individual ascent rate. The first and second UCASS launched from Paphos and Limassol, respectively, headed eastwards. The first unit reached closest to the lidar site, which makes this case ideal for a comparison of UCASS measurements with the findings of the remote-sensing retrievals that include the lidar data. UCASS units from later launches headed to the northeast and show that the main wind direction changed during the passage of the dust plume. The left panel in Fig. 3 shows the tracks of the DLR Falcon aircraft during research flights on 20 and 21 April 2017. The close proximity makes these cases most suitable for a comparison of the measurements during the first and third UCASS launches to those of airborne in situ instruments. Details on the distance between the respective observations are provided below.
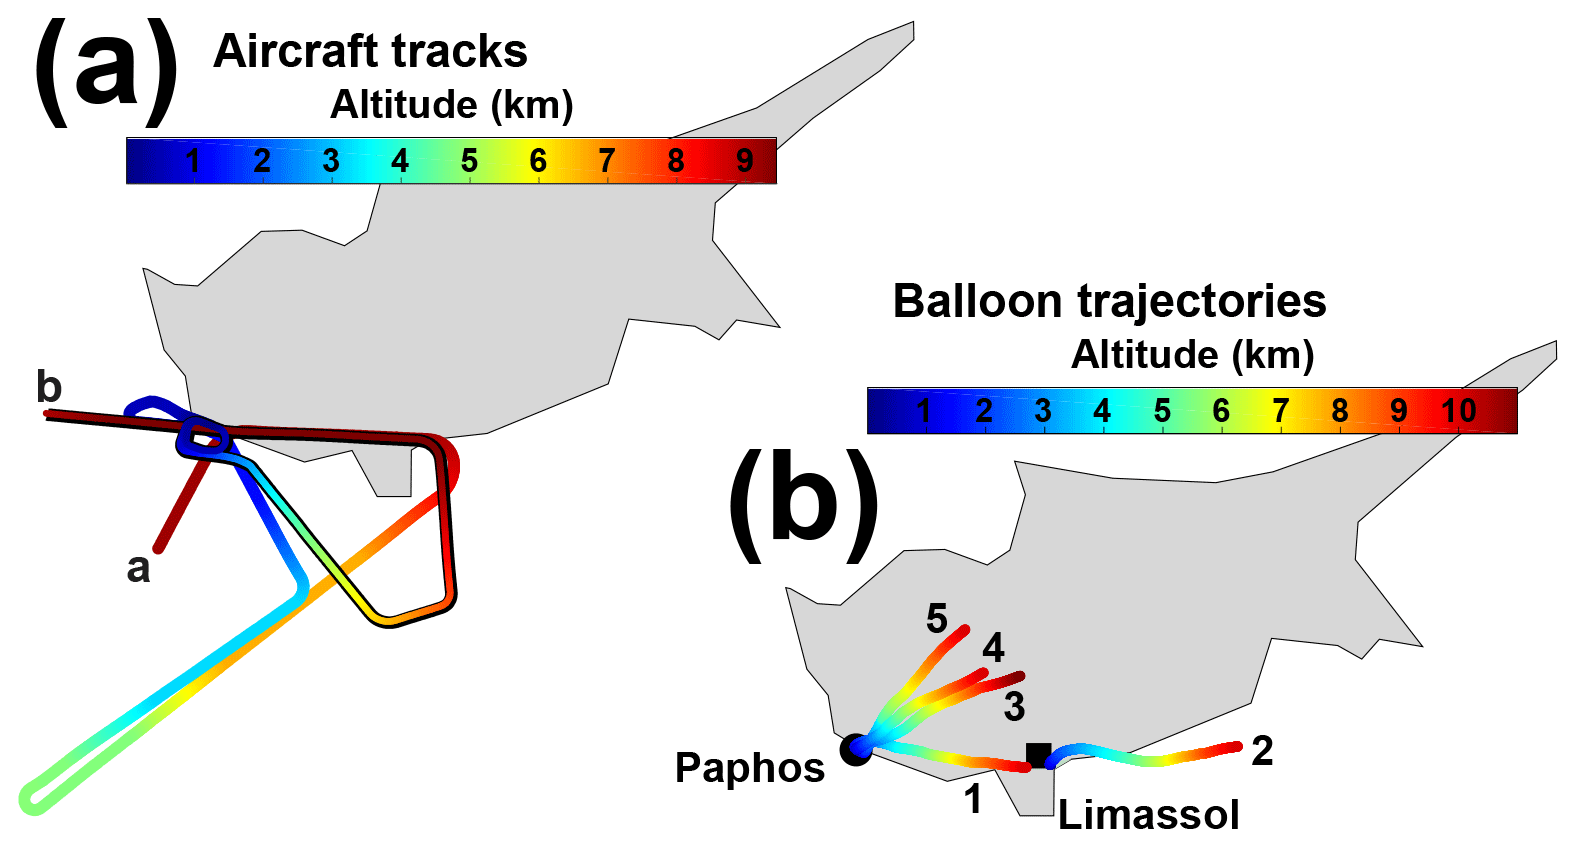
Figure 3Flight tracks of (a) the DLR Falcon aircraft and (b) the UCASS sondes launched from Paphos and Limassol. The Falcon tracks marked a (black border) and b (no border) refer to the research flights on 20 and 21 April 2017, respectively.
Figure 4 shows 120 h backward trajectories of air masses arriving at 2, 3, 5, and 7 km height over Limassol at 01:00 UTC on 21 April 2017, i.e. at the time of the second UCASS launch. Trajectories are shown for this UCASS launch as it coincides with the presence of the unusual filament structure over Limassol in Fig. 1b. The trajectories follow similar pathways for the other launches. They reveal that these air parcels were lifted from dust source regions in North Africa, crossed the Mediterranean, and reached Cyprus within 3 d. The air parcels arriving at 2 and 3 km height originated from northern Libya while those arriving at 5 and 7 km height originated from Algeria, Morocco, and Mauritania. The difference in source region and transport time for air arriving at different altitudes might lead to differences in the observed particle size distributions at those heights (Weinzierl et al., 2009, 2011; Ryder et al., 2013, 2018). The inspection of dust composites derived from measurements with the Spinning Enhanced Visible and Infrared Imager (SEVIRI) on the Meteosat Second Generation satellite (Schepanski et al., 2007, not shown) shows that dust was mobilized in the northern part of Cyrenaica (i.e. northeastern Libya) about 24 h before the observations of the second UCASS launch and transported directly to Cyprus.
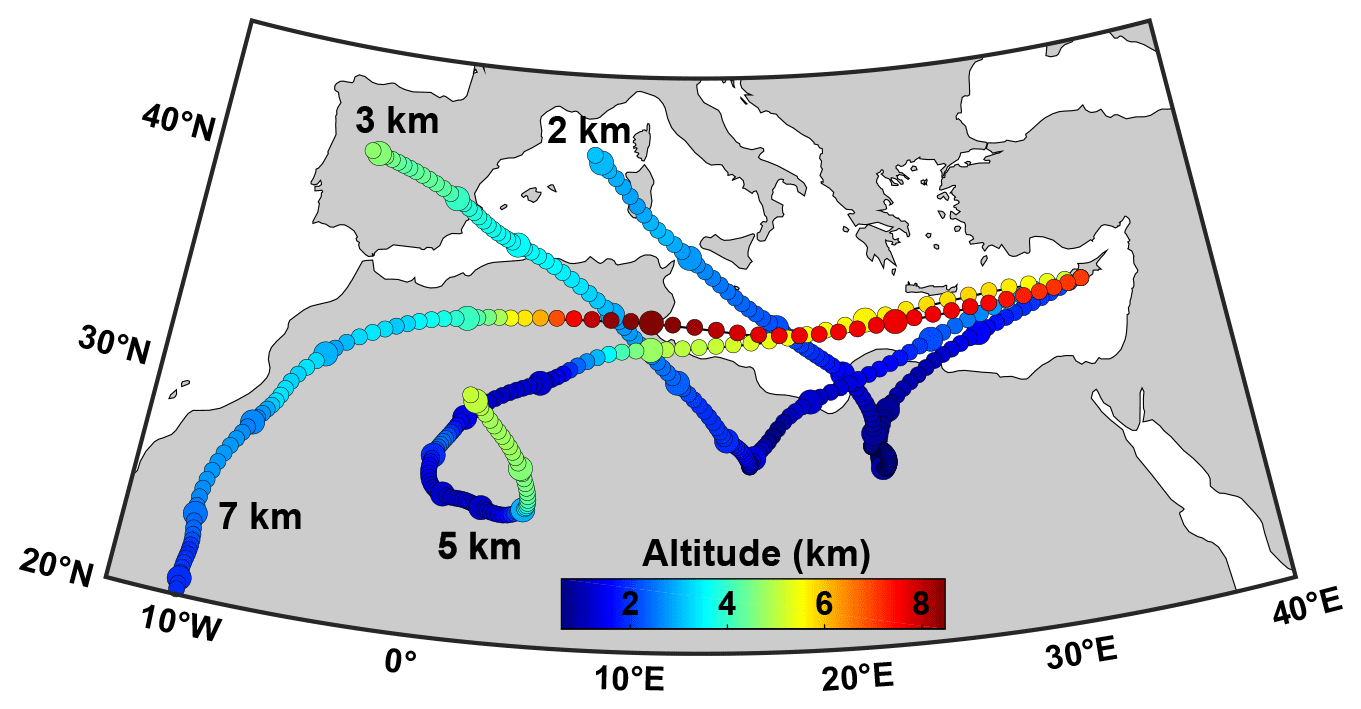
Figure 4The 120 h HYSPLIT backward trajectories starting over Limassol at 01:00 UTC on 21 April 2017. Colour coding refers to the height of the trajectories. Intervals of 12 h are marked by increased circle size. The numbers in the plot refer to the arrival height over Limassol.
3.2 Number concentration profiles
Figure 5 shows the particle number concentration from the first and third UCASS launches and the DLR Falcon measurements together with the distance between the locations of the respective measurements. The distance between the observations is below 40 km up to a height of 2.4 km and around 80 km above. The first UCASS launch in the evening of 20 April 2017 from Paphos shows the highest particle concentrations of more than 35 cm−3 between 3.5 and 4.5 km height. The meteorological profiles (not shown) reveal temperature inversions at the bottom and top of the dust layer. They also show a dry lower and a much more humid upper part of the dust plume with 30 % RH between 1 and 3 km and 80 % RH between 3 and 5 km, respectively. Despite the rather large spatial distance of the observations, there is close resemblance of the number concentrations measured with the UCASS and aboard the aircraft in the lower and upper part of the dust plume with an average ratio of 0.77. The discrepancy increases as the horizontal distance between the observations increases, i.e. beyond 70 km above 2.5 km height. The discrepancy could be attributed to the large number of smaller particles, as the lowest size bin for the UCASS number concentration is 0.6 µm, whereas for the CAPS it is 0.79 µm. Nevertheless, the close resemblance of both profiles is indicative of the spatial and temporal homogeneity of the dust plume and suggests that differences in time and location of the observations do not necessarily inhibit a comparison of the measurements.
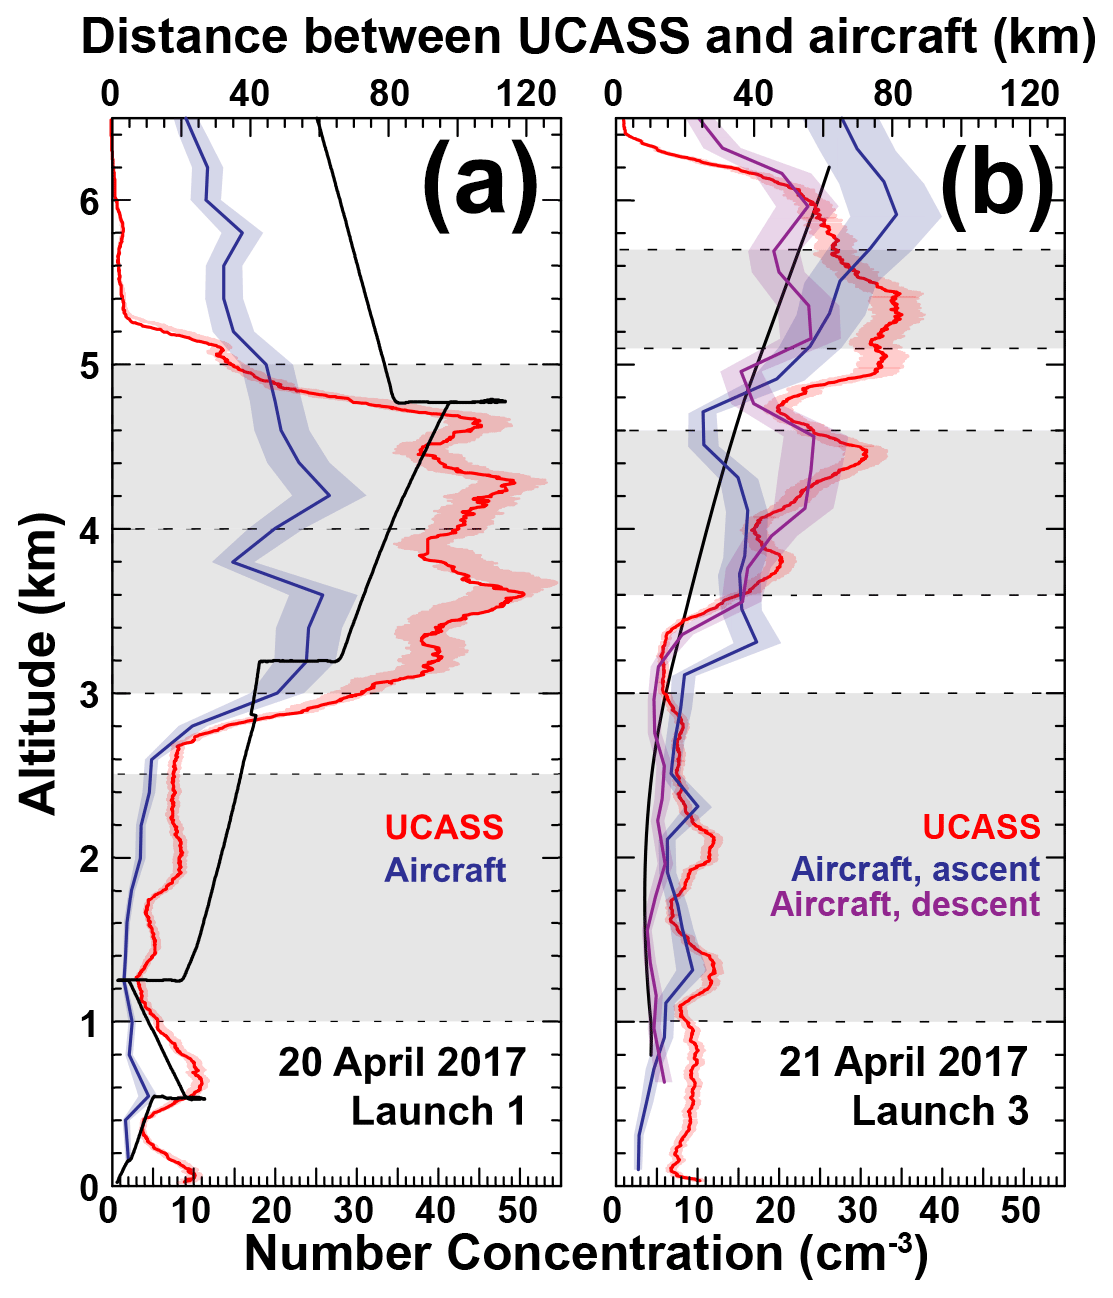
Figure 5Total number of particles in the diameter range from 0.6 to 13.9 µm counted by UCASS (red) and with the CAPS (CAS) instrument aboard the Falcon aircraft (blue and purple, size range from 0.79 to 14.0 µm; shading marks the standard deviation obtained as median minus 25th percentile and 75th percentile minus median) measured (a) during the first UCASS launch on 20 April 2017 and (b) during the third UCASS launch on 21 April 2017. Red shaded areas refer to the effect of a counting uncertainty of 8 % (y error) as stated in Smith et al. (2019). The black lines mark the horizontal distance between the location of the observations from the UCASS and aircraft. Grey areas refer to the height layers considered in Fig. 6.
Figure 5b shows the UCASS measurements during the third launch on 21 April 2017 from Paphos. The highest particle concentrations are still found in the upper part of the dust plume which now extends from about 4 to 6 km. While the number concentration exceeds 20 cm−3 in this layer, the higher concentrations above 30 cm−3 as measured during the first launch were now found only at around 4.5 km and between 5.0 and 5.5 km height. The humidity profile (not shown) reveals drier air throughout the extent of the dust plume compared to the first launch with RH spanning from 20 % to 65 %. The aircraft observations during that day (Table 1 and Fig. 3) took place in close proximity to the UCASS track with a horizontal distance of less than 15 km below 3 km height and 20 to 50 km in the upper layer of higher particle concentrations. Consequently, the number concentrations of the measurements with the UCASS and aboard the DLR Falcon (ascent and descent profiles) agree even on the fine structures of the dust plume during that time. Below 3.2 km height, observations with UCASS and aboard the aircraft show number concentrations in the range from 5 to 10 cm−3, and both profiles resolve a layer of increased particle concentration at around 2.0 km height. In the upper part of the dust plume above 3.2 km height, the lower and upper boundaries of the layer with number concentrations above 10 cm−3 at 3.4 and 6.4 km, respectively, are resolved by UCASS and airborne measurements within 200 m height, despite the increase in the spatial distance of the observations to 60 km. Within this layer, the UCASS and the airborne instruments detect peak concentrations of 35 cm−3 at 4.5 km height and in the range from 5.0 to 5.4 km height. Both also resolve the decrease to number concentrations of around 20 cm−3 at 4.8 km height.
Overall, the particle number concentration and size distributions observed with UCASS over Cyprus are similar in magnitude and shape, respectively, to what has been reported from aircraft measurements in previous studies. Observations during the ICE-D and AER-D (Ryder et al., 2018; Liu et al., 2018) over the west African coast showed particle number concentrations of up to 45 cm−3 in the size range between 1 and 20 µm in diameter. Particle number concentrations within the dust layers observed during SAMUM in Morocco (Weinzierl et al., 2009, 2011) and SALTRACE over the tropical Atlantic (Weinzierl et al., 2017) decrease from nearly 1000 to 0.001 cm−3 in the diameter range from about 0.1 to nearly 40.0 µm. In situ observations of central Saharan dust size distributions during Fennec (Marsham et al., 2013; Ryder et al., 2013) with wing-mounted instruments that measured particle diameters between 0.1 and 100 µm gave number concentrations of up to 1000 cm−3 (Ryder et al., 2018). Looking at the size distribution of SALTRACE, the highest particle number concentrations are found between 0.5 and 1 µm. The particle number concentration decreases towards the larger sizes. A closer look at the size range between 0.4 and 20.0 µm, which is closer to the measurement capability of UCASS, reveals number concentrations spanning from 0.01 to 100 cm−3. Note that most of the observations listed above have been conducted much closer to dust sources compared to the measurements at Cyprus presented here. Hence, it can be concluded that the UCASS observations give values that are in line with data from airborne campaigns.
3.3 Layer-averaged number size distributions
A closer look at layer-mean particle size distributions from the measurements with the UCASS and the research aircraft on 20 and 21 April 2017 is provided in Fig. 6. The extent of the considered height layers is marked in Fig. 5. The particle number concentrations observed by the UCASS and aircraft are similar for both observation days, particularly at sizes below 5 µm, with maximum values between 10 and 100 cm−3. Although the two largest UCASS size bins with bin centres at 8.4 and 12.1 µm tend to detect fewer particles than the instruments aboard the research aircraft, the numbers of around 0.1 cm−3 are well within the respective error bars. The size distributions resemble each other very well in terms of their shape at all height layers on 20 April 2017. The particle number concentrations agree within their error bars for the entire size range. The observations on 21 April 2017 also resemble each other very well in terms of the shape of the size distribution at the lowermost (1.0 to 3.0 km height) and uppermost (5.1 to 5.7 km height) layers on 21 April 2017. Despite the offset between the observations in the height layer from 3.6 to 4.6 km, they still agree within the error bars of the aircraft. Figure 6e shows that there is a consistent difference in the particle number concentration of about 10 cm−3 for the measurements of the two instruments within that layer. This is probably due to a spatial mismatch of the layer at the two locations as indicated by the similar structure of the profiles. Overall, the aircraft and UCASS observations give very similar magnitudes and shapes of the size distributions in all layers on both 20 and 21 April 2017. Please note that small differences in can translate to very large differences in volume–size distribution.

Figure 6Particle number size distribution observed by UCASS (red) and with the CAPS instrument aboard the Falcon aircraft (blue) on 20 (a–c, launch 1) and 21 April 2017 (d–f, launch 3) for the height layers marked in Fig. 4. Error bars refer to the standard deviation of the measurements.
A mean effective diameter of 2.4±0.3 µm was found from the UCASS measurements in the size range from 0.4 to 14 µm. Observations during AER-D and ICE-D at Cabo Verde gave a mean effective diameter of 4.0 µm (Ryder et al., 2018) and 5.0 to 6.0 µm (Liu et al., 2018) for the size ranges from 0.1 to 100.0 µm and from 1.0 to 20.0 µm, respectively. Measurements during SAMUM (Weinzierl et al., 2009) gave effective diameters of about 6.5 µm for measurements that covered particle sizes up to 100 µm in diameter. The values obtained from our UCASS measurements are slightly lower than those reported in the literature. This is likely due to the fact that the UCASS as deployed during A-LIFE measured only up to particle diameters of 14 µm and also due to the different particle size ranges used to calculate effective diameter in some cases. In any case, a comparison of the effective diameters from different measurements may not be comprehensive due to the different source regions and travelled distances of the observed dust particles from the different observations.
3.4 Columnar size distributions
A comparison of the columnar aerosol volume–size distribution from the GARRLiC, AERONET, and SKYRAD retrievals and the first and third UCASS launches is presented in Fig. 7. Figure 7a also includes the airborne in situ observations with the Falcon aircraft. All distributions in Fig. 7a and b show a predominance of coarse-mode particles with comparable volume concentrations of the different coarse-mode peaks. During launch 1, the UCASS, aircraft, and GARRLiC retrievals show a different shape of the volume–size distribution compared to the ones retrieved by the sun photometer inversions. Both AERONET and SKYRAD show a single coarse mode that peaks between 3 and 5 µm, while GARRLiC and UCASS give a coarse mode with two peaks. AERONET observed the highest concentration of 0.12 µm3/µm2 between 3.4 and 4.5 µm diameter, whereas SKYRAD’s size distribution peaks at 3.4 µm with a concentration of 0.13 µm3/µm2. The UCASS observed its highest concentration of about 0.1 µm3/µm2 at 5.5 µm in diameter and a second mode at 2.8 µm. The two coarse modes retrieved by GARRLiC are at 2.0 and 7.7 µm in diameter. It is noteworthy to mention that the first UCASS unit was launched about 2 h 40 min after the considered sun photometer measurement as outlined in Table 1. The first UCASS launch shown in Fig. 7a is also the only case for which a column-integrated volume–size distribution is available from both remote-sensing retrievals and observations aboard the research aircraft. These independent airborne in situ measurements also find a bi-modal coarse mode which supports the results of the UCASS measurements and suggests that the findings of the GARRLiC retrieval are closer to reality than those from AERONET and SKYRAD. The large differences in the volume concentration observed by the aircraft in the size range from 5 to 10 µm compared to the UCASS can be attributed to the higher number concentration of coarse-mode particles observed by CAPS and shown in Fig. 6b.
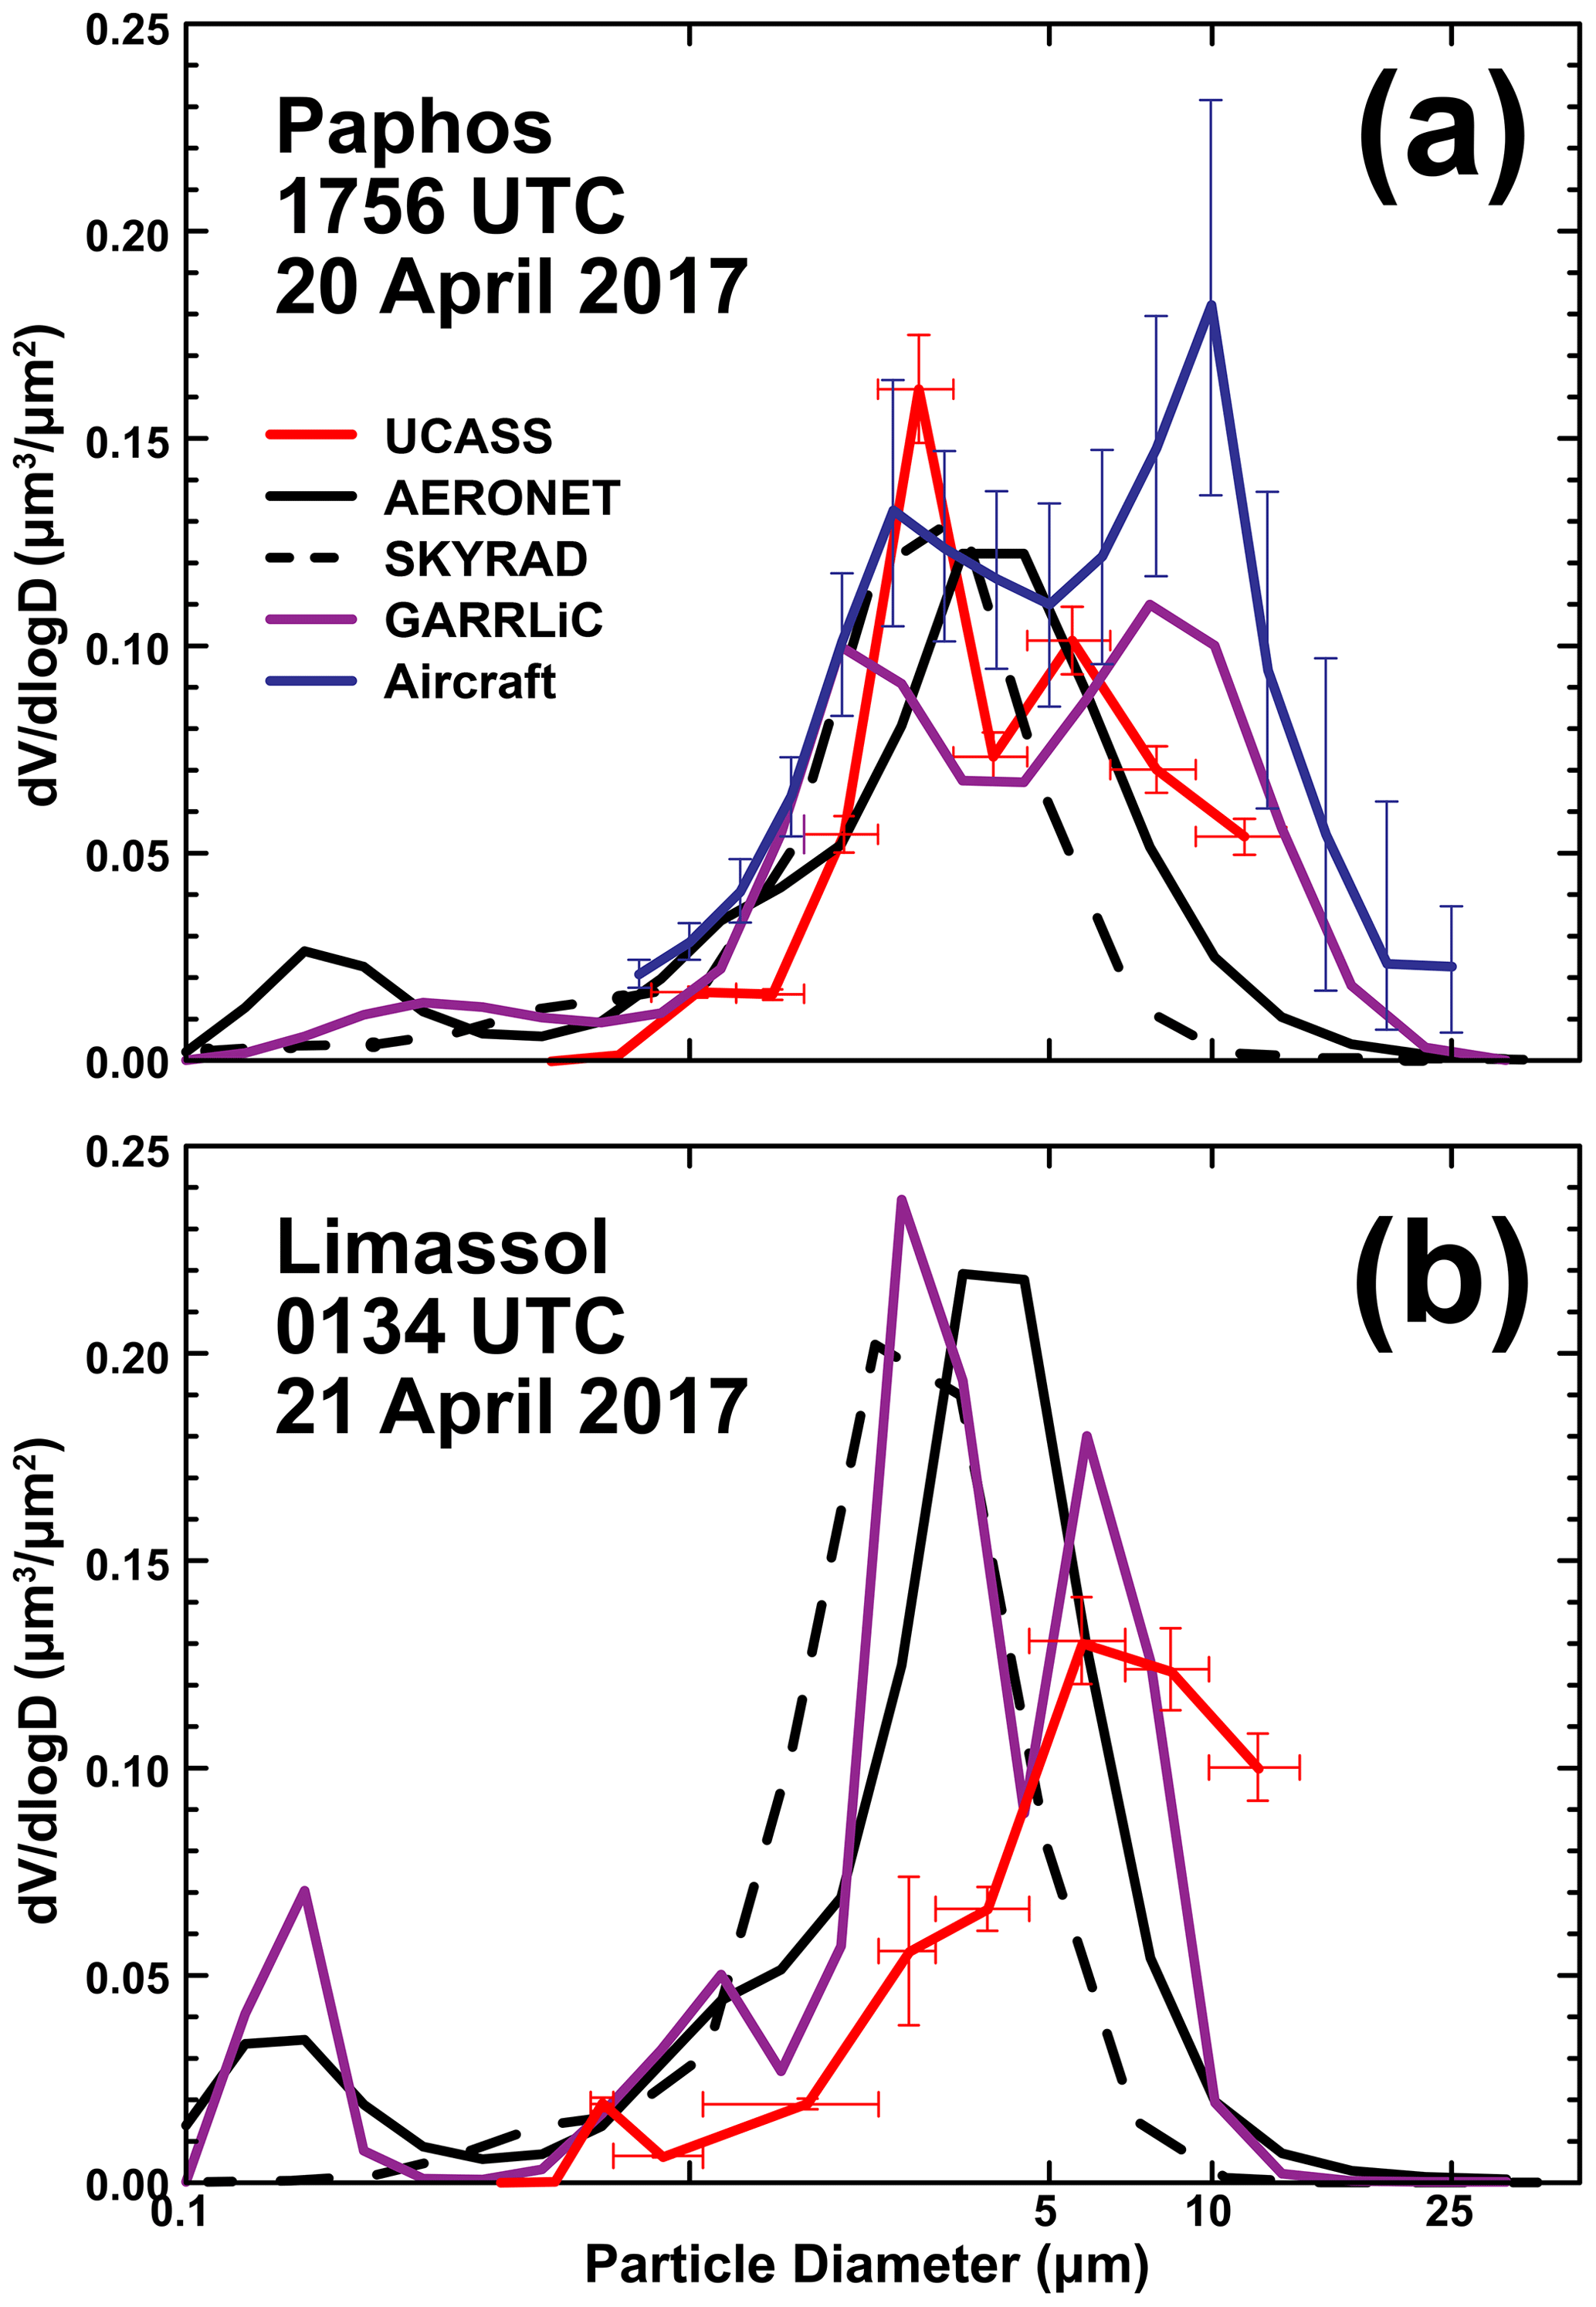
Figure 7Total-column volume–size distribution from the UCASS (red), AERONET (black solid), SKYRAD (black dashed), GARRLiC (purple), and aircraft (blue, only in a) obtained during (a) the first launch on 20 April 2017 and (b) the second launch on 21 April 2017. For clarity, only error bars of the UCASS and CAPS measurements are shown. Details on the locations and measurement times are provided in Table 1.
Post-processing was applied to the UCASS data. In addition, further laboratory measurements with a set-up comparable to the conditions encountered during the launches on Cyprus were performed to examine whether the observed bi-modal size distributions in Fig. 7 could be the result of an instrumental artefact. Mono-modal sample materials were used in these laboratory tests (Smith et al., 2019). The corresponding UCASS measurements also showed only mono-modal size distributions. This led us to reject the idea of a systematic instrumental error. Hence, the bi-modal coarse mode might be a special characteristic of the origin of the observed air masses. The observed bi-modal peak may be caused by the following reasons: (i) the diversity of sources across the African basin whose mineralogy can lead to intrinsic differences in the properties of the emitted particles (e.g. size distributions, chemical composition) (Engelstaedter et al., 2006; Coz et al., 2009); (ii) contributions from different aerosol types; (iii) cloud processing during transport which could cause aggregation of particles that were collected by droplets that evaporated at a later stage or wash-out of larger particles (Matsuki et al., 2010); (iv) gravitational settling of particles for longer transport times compared to freshly emitted dust after about 1 d of transport that might lead to the systematic removal of large particles, particularly in the upper part of dust plumes (Ellis and Merrill, 1995; Maring et al., 2003); or (v) dust electrification that could counteract gravitational settling by creating an electric field within the dust layer (Nicoll, 2012). A similar bi-modal coarse-size distribution was also observed during the Puerto Rico Dust Experiment (PRIDE; Reid et al., 2003) and Fennec SAL (Song et al., 2018). However, neither study provides further discussion of these observations.
The second UCASS launch on 21 April 2017 was performed about 3.0 and 1.5 h before the first sun photometer and lidar measurements, respectively (Table 1). This is likely to have an effect on the UCASS comparison in Fig. 7b as the aerosol conditions varied strongly during that period (Fig. 1). The UCASS size distribution peaks at 5.8 µm with a concentration of 0.13 µm3/µm2. This peak is also resolved by the GARRLiC-derived size distribution, though it is located at 2.6 and 5.9 µm with concentrations of 0.24 and 0.18 µm3/µm2, respectively. The AERONET-derived size distribution shows a peak concentration of 0.22 µm3/µm2 between 3.4 and 4.5 µm particle diameter. The SKYRAD retrieval gives a peak concentration of 0.21 µm3/µm2 at a coarse-mode diameter of 3.4 µm, which is the smallest compared to the other observations. Although the sun photometer inversions rely on the same input datasets, it is found that the SKYRAD size distribution is shifted to smaller sizes compared to AERONET. This is surprising as SKYRAD does not force the size distribution to zero at larger particle diameters (Campanelli et al., 2007) and, in principle, would enable the retrieval of size distributions with larger coarse-mode diameters than AERONET. This particular property of the AERONET retrieval is likely to produce the artificial fine-mode peak at around 0.15 µm that is absent in the SKYRAD size distributions (Dubovik et al., 2006).
The peaks of volume–size distribution from the sun photometer inversions are found to be systematically at smaller particle sizes than the observations from GARRLiC and the UCASS. A similar shift towards larger particle size was also observed from in situ measurements aboard the Falcon compared to AERONET-derived size distributions during SAMUM (Müller et al., 2012). A similar tendency between AERONET size distributions and in situ measurements was observed during DABEX in the Sahelian west Africa basin (Osborne et al., 2008). During the SAVEX-D/AER-D campaign at Cabo Verde, the AERONET retrievals also showed a similar single coarse mode shifted towards a smaller radius compared to in situ measurements from aircraft (Estellés et al., 2018; Kudo et al., 2020). Simultaneous retrievals from SKYRAD (performed on Prede POM radiometers) also determined a slight shift of the coarse mode to a smaller radius, although in this case the coarse mode was broader or even bimodal, depending on the SKYRAD version used (Nakajima et al., 2020). The coarse mode retrieved by GARRLiC shows a consistent shift towards larger sizes when compared to the AERONET output (Benavent-Oltra et al., 2017; Lopatin et al., 2013; Bovchaliuk et al., 2016). This feature is generally attributed to the additional information from the backscatter lidar profiles that provides GARRLiC with extra information on the particle size. In addition, the restriction of the AERONET (and hence also the GARRLiC) data inversion scheme to a particle diameter smaller than 30 µm may lead to an underestimation of the concentration of coarse-mode particles (Müller et al., 2012).
A closer look at the UCASS measurements during the second launch is provided in Fig. 8 in terms of the profile of total number concentration and volume–size distributions averaged over four height layers. Figure 8c shows that the altitude range between 2.8 and 3.1 km is dominated by particles with a mode diameter of 8.4 µm. In contrast, all other layers show a concentration of particles with such large diameters up to an order of magnitude smaller. Hence, the thin filament of dust particles observed in the morning of 21 April 2017 is the major contributor to the coarse mode in the columnar size distribution in Fig. 7b. This structure was confined to a very small height range and only lasted for about 12 h. It had already disappeared from the ground-based remote-sensing sites during the time of the DLR Falcon research flight that day. Longer transport times translate to a longer time period during which large particles are exposed to gravitational settling. This effect is most pronounced at higher altitudes where no particles can settle into the layer from above. Figure 4 indicates that the aerosols observed at 5 and 7 km height have been transported over longer distances than those at lower altitudes. As stated before, MSG-SEVIRI imagery shows active dust sources in northeastern Libya about 24 h before the observations at Limassol. Backward trajectories corroborate that dust emitted from these sources was transported directly to Cyprus. It is likely that this is the origin of the thin filament observed in the morning of 21 April 2017. It is noteworthy to state that the first sun photometer observations (used for AERONET, SKYRAD, and GARRLiC retrievals) took place after sunrise (04:27 UTC), when the dense aerosol filament over Limassol had changed its appearance and extended in depth.
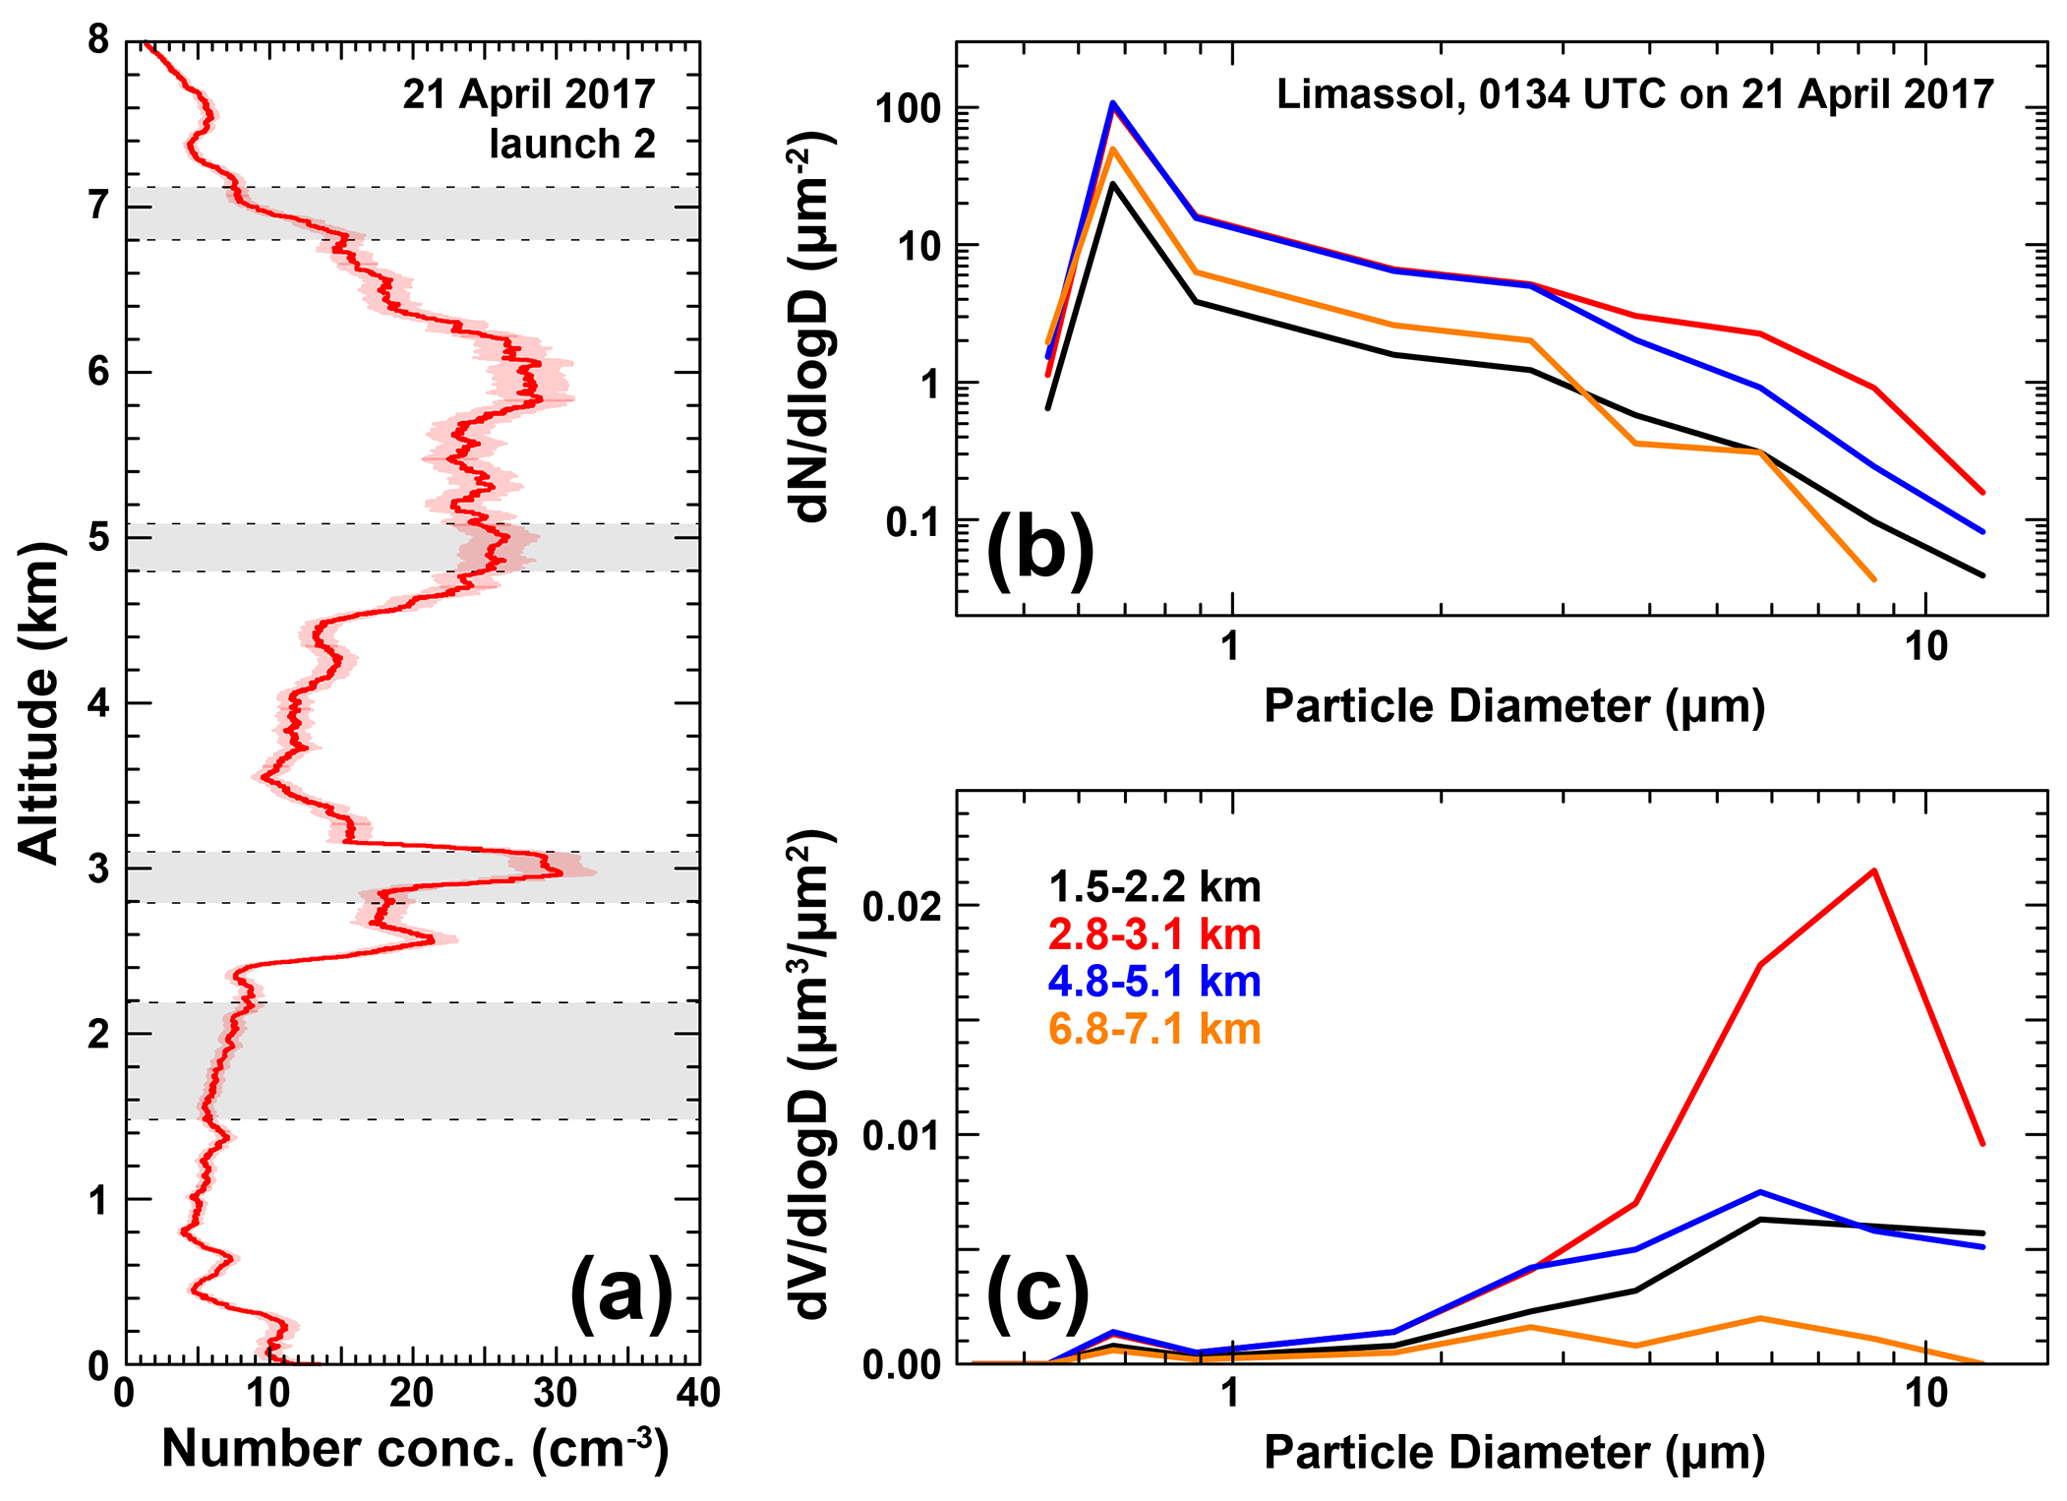
Figure 8UCASS measurements during the second launch at 01:34 UTC on 21 April 2017 from Limassol: (a) height profile of the total particle number concentration as in Fig. 4 and (b) particle number and (c) volume–size distributions averaged over four selected height levels as indicated in (a).
The overarching message of Figs. 7 and 8 is twofold. Firstly, reasonable agreement can be found between the UCASS measurements and data from remote-sensing observations in case of homogeneous dust properties and optimum temporal matching of the observations (Fig. 7a). Under such conditions, the more complex GARRLiC retrieval which is based on a larger set of input data is capable of better resolving the features of the UCASS in situ measurements, i.e. the double peak in the coarse mode. Secondly, the requirement for homogeneous aerosol conditions is vital, if observations at different times are compared or used as combined input to a retrieval. In that context, Fig. 7b provides some insight into the actual spread of findings that can result from extreme variations in the aerosol situation such as changes in total aerosol load or the vertical distribution of the particles. This is particularly important when using passive remote-sensing data for the validation of vertically resolved measurements as they provide no information on aerosol stratification.
3.5 Extinction coefficient profiles
Figure 9 shows the aerosol extinction coefficient profiles as calculated using the UCASS observations during the four launches listed in Table 1. Lidar profiles of the extinction coefficient measured by the PollyXT at Limassol were derived using two methods. Firstly, the extinction coefficient was obtained without assumptions using the Raman method (Ansmann and Müller, 2005). Secondly, the likely range of extinction coefficients was estimated by multiplying the particle backscatter coefficient obtained using Klett's method with the lower and upper limits of reasonable dust lidar ratios for Cyprus of 40 and 60 sr, respectively (Nisantzi et al., 2015). Generally, the profiles of the extinction coefficients from the UCASS and lidar at the lowermost layers are in a reasonable agreement with values below 100 Mm−1. Discrepancies are more pronounced for the observations within the elevated layers.
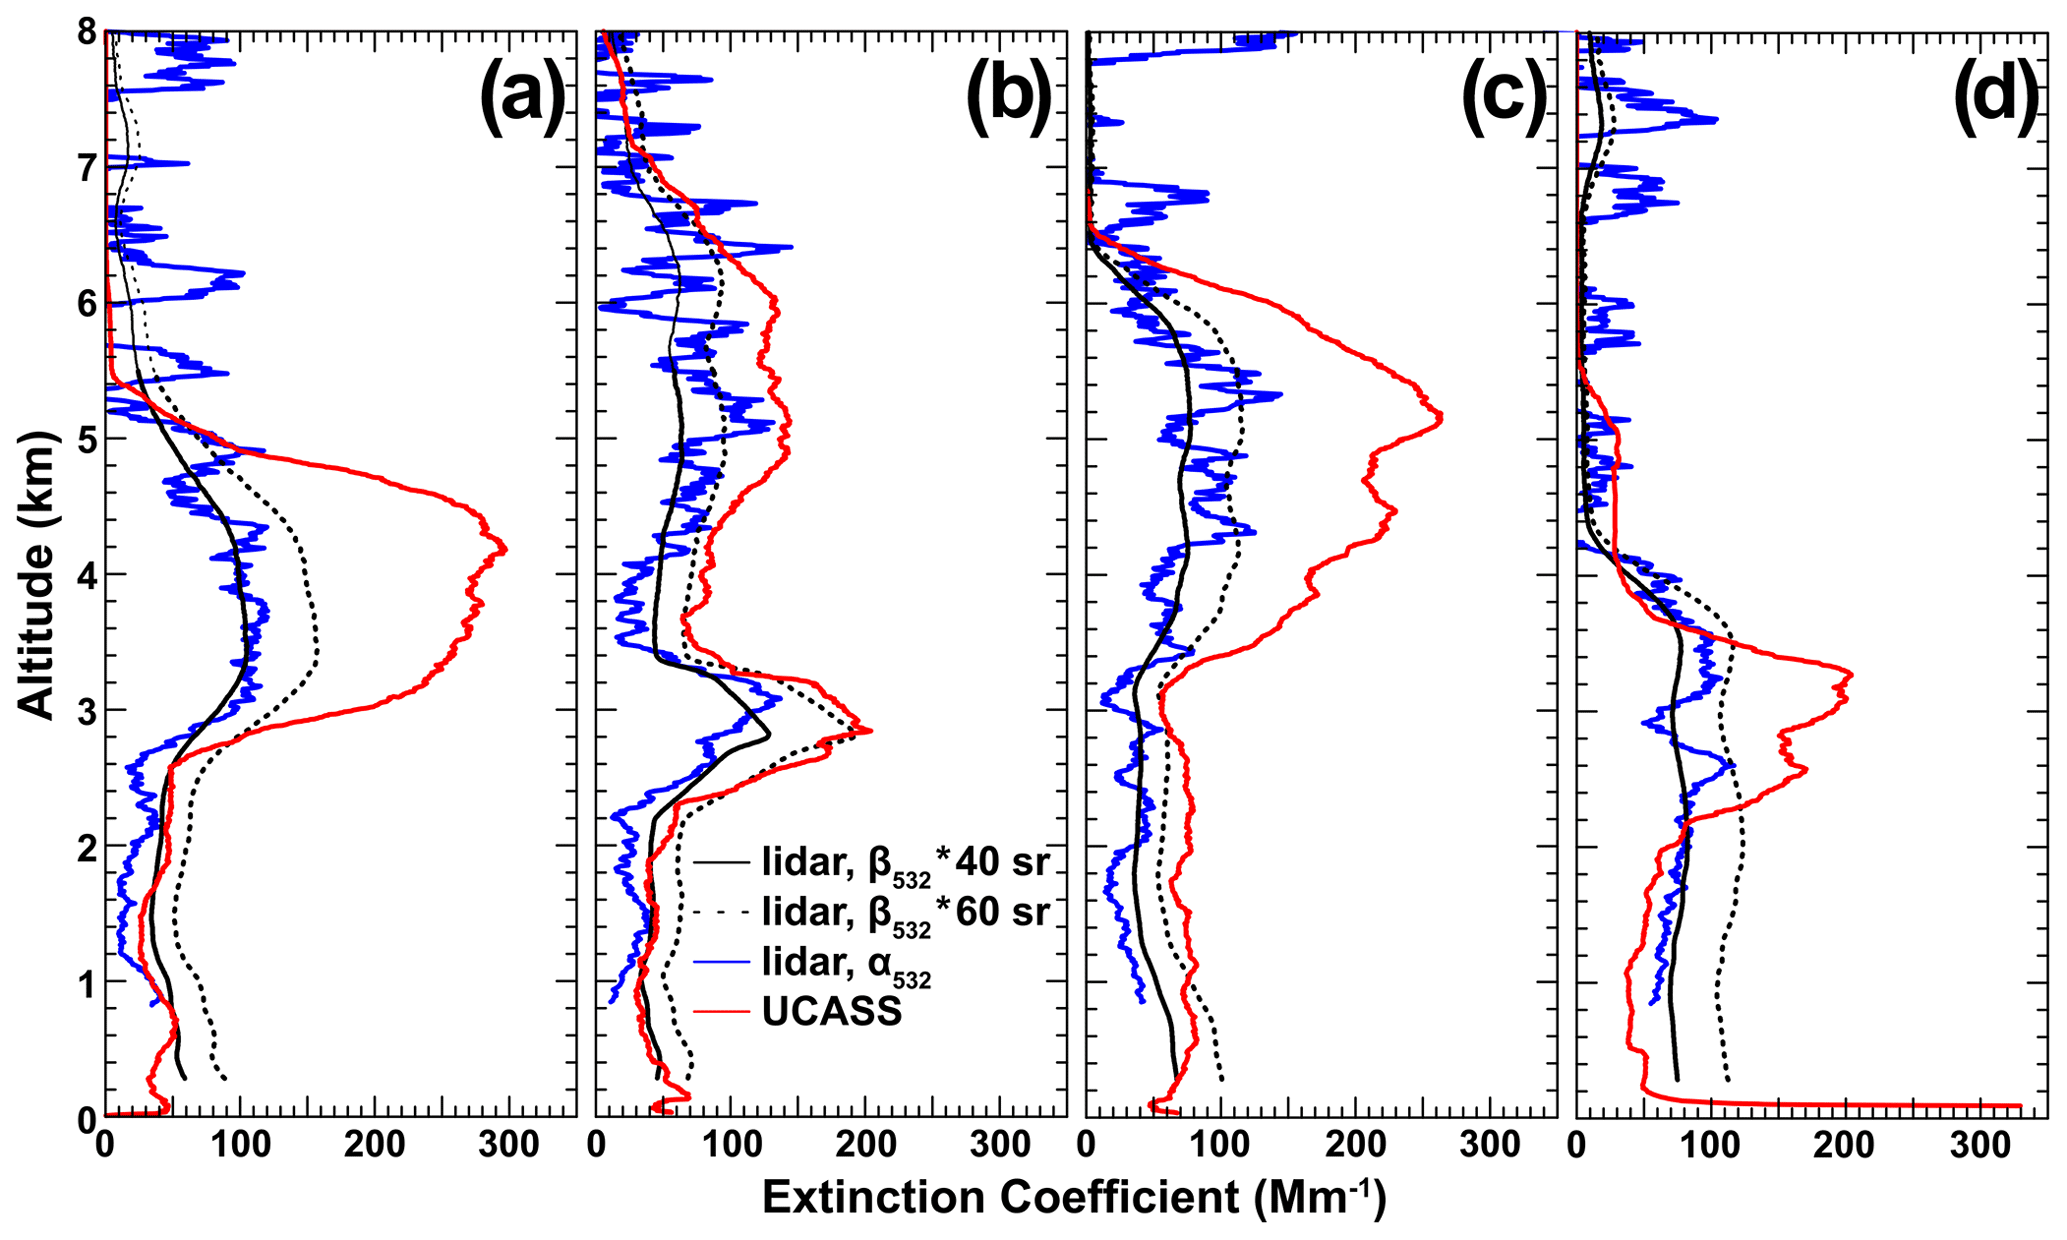
Figure 9Aerosol extinction coefficient profiles from UCASS (red) and the Raman lidar PollyXT at Limassol. Lidar profiles refer to extinction coefficients obtained using the Raman method (blue) or by multiplying the aerosol backscatter coefficient derived without the use of Raman signals with lidar ratios of 40 sr (solid black line) and 60sr (dotted black line). Panels refer to the first (a), second (b), third (c), and fourth (d) UCASS launches (see Fig. 1 and Table 1).
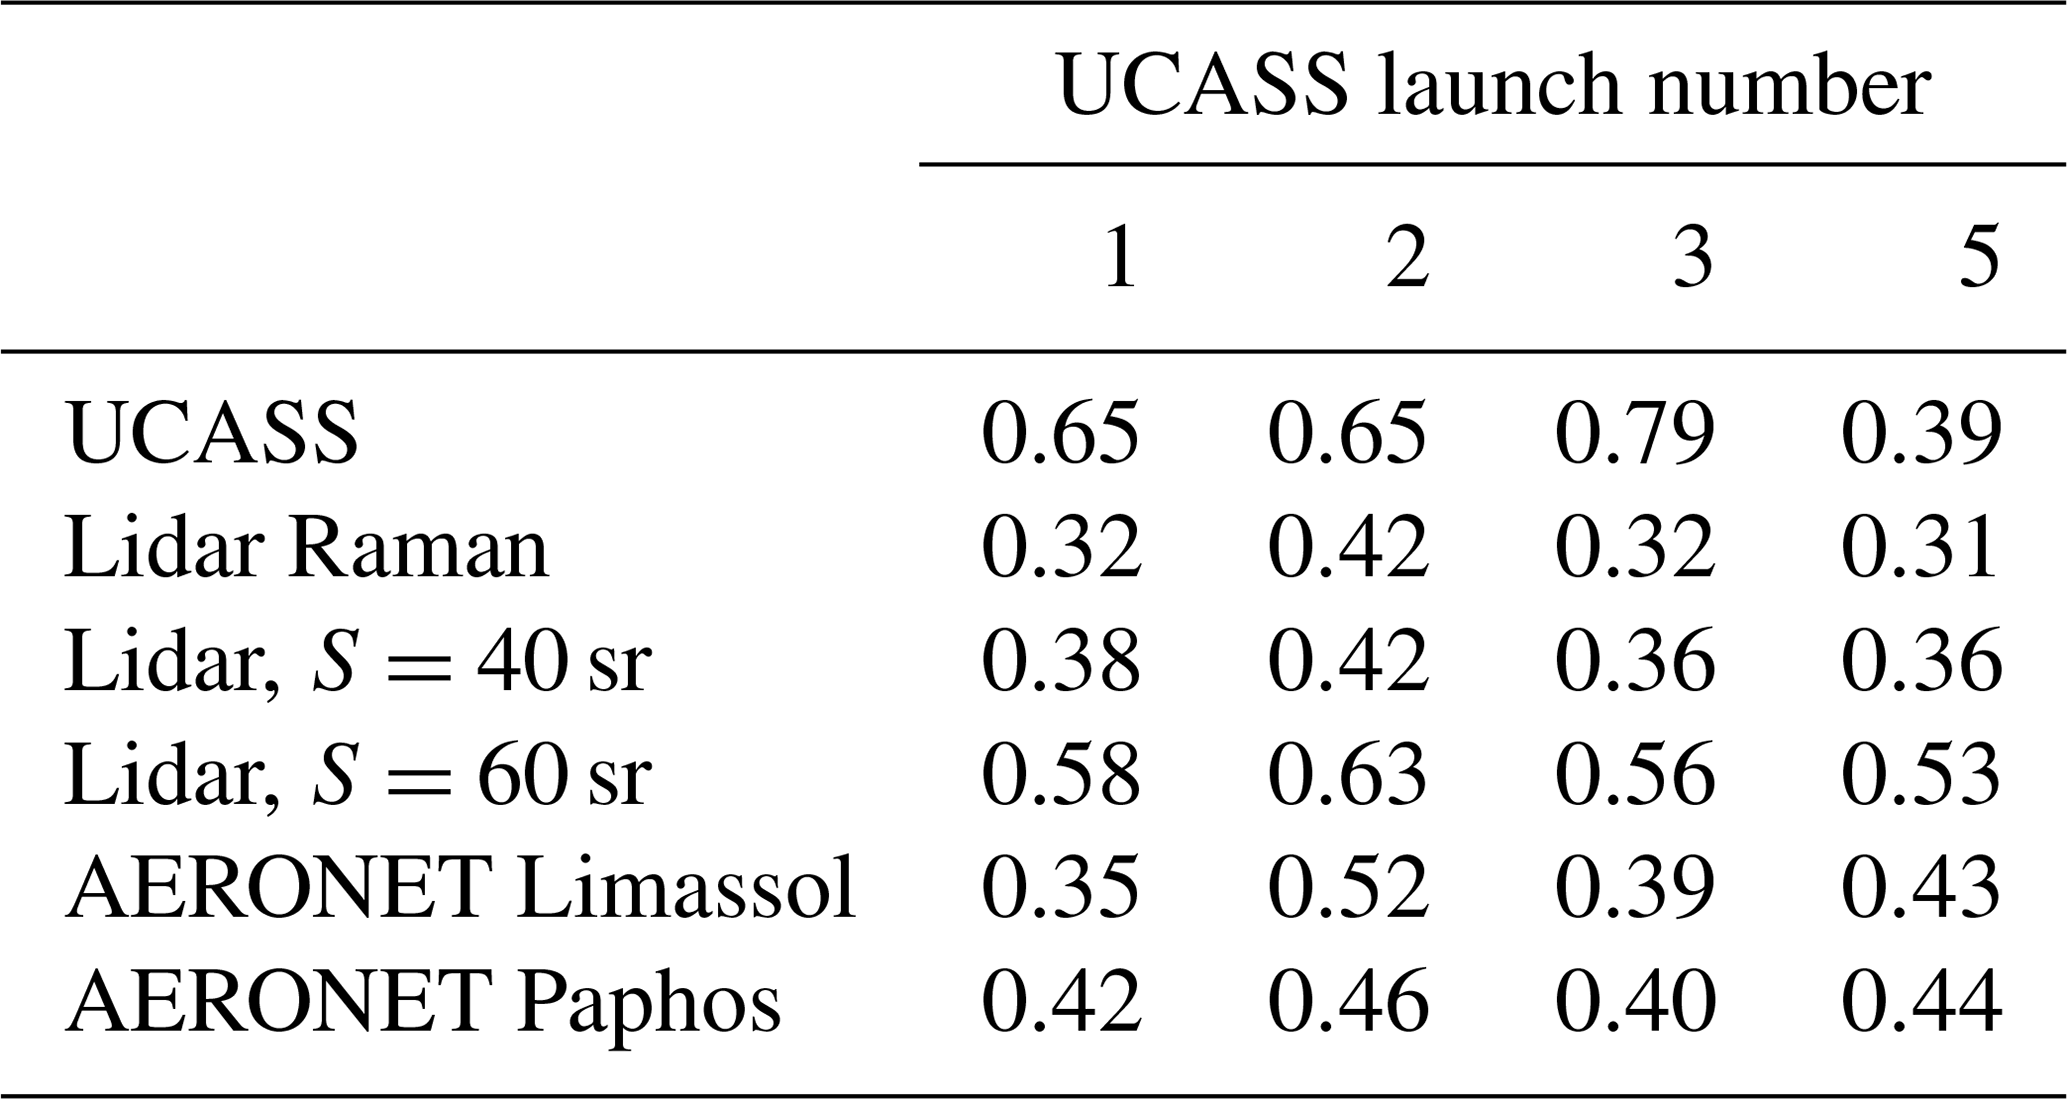
The extinction coefficient profiles were integrated with height to obtain an estimate of aerosol optical thickness (AOT) that can be compared to the sun photometer measurements. This comparison is shown in Fig. 1a and in Table 2. The lower lidar estimate of AOT derived using Klett's method and a lidar ratio of 40 sr show the best agreement with the independent sun photometer observations at both Paphos and Limassol with differences (lidar minus AERONET) ranging from −0.07 to 0.03 for absolute AOT values between 0.35 and 0.52. The UCASS-derived AOTs show no consistent behaviour when compared to the lidar and sun photometer values. The value of 0.39 obtained from launch 5 agrees best with both the lidar (0.36, LR = 40 sr) and sun photometer (0.43 at Limassol and 0.44 at Paphos). Launch 2 with an AOT of 0.65 is at the upper end of the lidar estimate, which is 0.63 when using Klett's method with a lidar ratio of 60 sr. However, launch 1 and launch 3 give AOTs of 0.65 and 0.79, respectively, that are well above the remote-sensing estimates that range from 0.32 to 0.58. Figure 9 confirms that this is due to the elevated layers characterized by peak particle concentrations. In particular, this occurs when UCASS-derived extinction coefficients are as high as 300 Mm−1. Much lower extinction coefficients of 70 to 150 Mm−1 are found from the different analyses of the lidar measurements (Klett, Raman). As these layers are characterized by an increased concentration of larger particles, there is reason to believe that the current UCASS extinction conversion is not universally applicable to different aerosol conditions. The refractive index and the size-dependent extinction efficiency are the main factors in the retrieval of extinction coefficients from the UCASS measurements. The large particles in the elevated layers might therefore be of different chemical composition compared to those at lower layers. This is supported by the backward trajectories in Fig. 4 which indicate different source regions for air arriving at different height levels. Alternatively, the extinction efficiency used in the current conversion might be representative only for situations dominated by smaller particles for which the effect of particle non-sphericity is less pronounced. Comparisons with the extinction coefficient, which is a secondary-order parameter derived from UCASS data, are therefore questionable and require further investigation that is beyond the scope of this study.
Table 2Column AOD derived from the integration of the extinction coefficient profiles in Fig. 8 for the times of the UCASS launches (see Table 1). AODs are also shown in Fig. 1a. UCASS and lidar AODs are at 532 nm. AERONET AOD is at 500 nm. Lidar Raman refers to the Raman solution of the lidar equation while the other two lidar values refer to an analysis following Klett's method with lidar ratios of 40 and 60 sr.
We have presented findings from balloon-borne UCASS optical particle counter measurements of mineral dust conducted over Cyprus in April 2017 during the A-LIFE experiment. The UCASS launches were embedded in research activities that included airborne in situ measurements with the DLR Falcon research aircraft as well as ground-based remote sensing with advanced aerosol lidars and sun photometers. This setup allows for a comprehensive evaluation of the quality of the UCASS measurements as well as an assessment of a variety of remote-sensing retrievals.
The highest particle number concentration observed by the UCASS was found during the first launch, with values of up to 50 cm−3 within a layer from 3 to 5 km height. Aircraft observations gave slightly lower values with a maximum of 40 cm−3. The UCASS profile of number concentration during the third launch resembles the aircraft observations in the vertical structure as well as the dust load.
During the first launch, layer-averaged particle size distribution from the UCASS measurements resembles that measured by the instruments aboard the aircraft in the size range between 2 and 5 µm. Larger differences in the particle number concentration are found for particle sizes larger than 5 µm, though these are still within the error bar of the measurements. During the second launch conducted from Limassol, a thin filament of dust was observed between 2.8 and 3.1 km height. This feature revealed a dominance of very large particles with an average mode diameter of 8.4 µm. In contrast, the layers below 2.2 km and above 4.8 km height were dominated by lower concentration of coarse-mode particles.
Column-integrated particle volume–size distribution was calculated from the UCASS measurements for a comparison to the findings of remote-sensing retrievals. For the first launch, results from the GARRLiC retrieval are the only ones that reproduce the bi-modal coarse mode detected by UCASS while the AERONET and SKYRAD inversions give a single coarse mode. Nevertheless, the AERONET-derived size distribution particle concentrations are similar to the UCASS measurements in the size range from 1 to 6 µm. In contrast, the SKYRAD-derived size distribution shows a coarse-mode peak at 2.0 to 3.0 µm, which is in line with the first coarse-mode peak of the GARRLiC-derived size distribution but smaller than the other inferred coarse-mode peak diameters. During the second launch, the volume–size distributions obtained by the UCASS and GARRLiC peak at a particle diameter of around 6.0 µm. However, GARRLiC also gives a second pronounced peak at around 3.0 µm that is hardly visible in the UCASS measurement. In addition, large discrepancies on the shape and maximum of the volume–size distribution were observed between the UCASS and the retrievals obtained by sun photometer data alone, i.e. the AERONET and SKYRAD inversions. This is attributed to the temporal difference between the observations of 3 h and the strongly heterogeneous dust layering: the sun photometer observations were performed when the thin dust filament observed by the UCASS and lidar had dissipated into the layer below the filament.
Overall, UCASS measurements of particle concentrations and size distributions are found to be reasonably in line with coincident observations with research aircraft and remote-sensing instruments. The low cost and disposable nature of the instrument therefore makes it an attractive tool for the in situ profiling of atmospheric particle concentrations in the framework of field experiments and long-term observations.
The comparison with secondary-order parameters, i.e. extinction coefficient, is yet questionable and requires further investigation beyond the scope of this study. Given the relatively low cost of the disposable UCASS, it provides a promising new opportunity for in situ measurements of particle size distributions within different aerosol layers and for validation studies between remote-sensing and in situ observations (Sawamura et al., 2017), not only for optical data but also microphysical data.
The UCASS measurements used in this study are provided as a digital attachment to this paper. Sun photometer data are accessible through the AERONET portal at https://aeronet.gsfc.nasa.gov/ (NASA, 2021). Data of airborne in situ measurements during A-LIFE are available from Bernadett Weinzierl upon request. Quicklooks of PollyXT lidar measurements can be found at http://polly.tropos.de/ (TROPOS, 2021). For data access, please follow the guidance provided there.
The supplement related to this article is available online at: https://doi.org/10.5194/acp-21-6781-2021-supplement.
MK and MT performed the UCASS launches from Cyprus. MK and HS assembled and calibrated the UCASS units used during A-LIFE and analysed the measurements. ZU and HS developed the concept of UCASS and the associated data analysis techniques. HB analysed the PollyXT data. VE performed the SKYRAD inversions. JB operated and maintained the PollyXT instrument during its deployment at Limassol. MD and BW performed and analysed the airborne measurements. MK and AT performed the GARRLiC inversions. MK and MT prepared the initial version of the manuscript. All authors contributed to the discussion of the findings and the revisions of the manuscript.
The authors declare that they have no conflict of interest.
The authors gratefully acknowledge the NOAA Air Resources Laboratory (ARL) for the provision of the HYSPLIT transport and dispersion model and/or READY website (http://www.ready.noaa.gov, last access: 10 December 2019) used in this publication. AERONET data for the stations Paphos and Limassol have been obtained through the AERONET portal (http://aeronet.gsfc.nasa.gov, last access: 28 November 2019). We thank the PIs Carlos Toledano and Diofantos Hadjimitsis for maintaining the two sites. We also thank Rodanthi-Elisavet Mamouri and Argyro Nisantzi of the Cyprus University of Technology and the ERATOSTHENES Centre of Excellence for their contribution to organizing PollyXT lidar measurements at Limassol during CyCARE. This research has received funding from the Royal Society (Royal Society Research Grant RG160071), the European Research Council (640458, A-LIFE), the European Union's Horizon 2020 research and innovation programme (654109, ACTRIS-2), and the Franco-German Fellowship Programme on Climate, Energy, and Earth System Research (Make Our Planet Great Again – German Research Initiative, MOPGA-GRI 57429422) of the German Academic Exchange Service (DAAD), funded by the German Ministry of Education and Research. Alexandra Tsekeri acknowledges the support from the European Research Council under the European Community's Horizon 2020 research and innovation framework programme/ERC grant agreement 725698 (D-TECT). Víctor Estellés acknowledges the support of the Spanish Ministry of Economy and Competitiveness (MINECO) and the European Regional Development Fund (FEDER) for the ESR/SKYNET activities, through project CGL2017-86966R.
This research has been supported by the Royal Society (Royal Society Research Grant RG160071), the European Research Council (A-LIFE (grant no. 640458)), the European Union's Horizon 2020 research and innovation programme (ACTRIS-2 (grant no. 654109)), the Franco-German Fellowship Programme on Climate, Energy, and Earth System Research (Make Our Planet Great Again – German Research Initiative (MOPGA-GRI (grant no. 57429422)), and the Spanish Ministry of Economy and Competitiveness (MINECO), and the European Regional Development Fund (FEDER) for the ESR/SKYNET activities (CGL2017-86966R project).
This paper was edited by Annele Virtanen and reviewed by two anonymous referees.
Alpert, P. and Ziv, B.: The Sharav Cyclone – Observation and some Theoretical Considerations, J. Geophys. Res., 94, 18495–18514, 1989. a
Alpert, P., Neeman, B. U., and Shay-el, Y.: Climatological analysis of Mediterranean cyclones using ECMWF data, Tellus, 42A, 65–77, 1990. a
Ansmann, A. and Müller, D.: Lidar and atmospheric aerosol particles, in: LIDAR-Range‐Resolved Optical Remote Sensing of the Atmosphere, edited by: Weitkamp, C., Springer, New York, 105–141, 2005. a
Ansmann, A., Petzold, A., Kandler, K., Tegen, I., Wendisch, M., Müller, D., Weinzierl, B., Müller, T., and Heintzenberg, J.: Saharan mineral dust experiments SAMUM-1 and SAMUM-2: What have we learned?, Tellus B, 63, 403–429, https://doi.org/10.1111/j.1600-0889.2011.00555.x, 2011. a
Ansmann, A., Mamouri, R.-E., Bühl, J., Seifert, P., Engelmann, R., Hofer, J., Nisantzi, A., Atkinson, J. D., Kanji, Z. A., Sierau, B., Vrekoussis, M., and Sciare, J.: Ice-nucleating particle versus ice crystal number concentrationin altocumulus and cirrus layers embedded in Saharan dust:a closure study, Atmos. Chem. Phys., 19, 15087–15115, https://doi.org/10.5194/acp-19-15087-2019, 2019. a
Baldauf, M., Seifert, A., Förstner, J., Majewski, D., Raschendorfer, M., and Reinhardt, T.: Operational Convective-Scale Numerical Weather Prediction with the COSMO Model: Description and Sensitivities, Mon. Weather Rev., 139, 3887–3905, https://doi.org/10.1175/MWR-D-10-05013.1, 2011. a
Benavent-Oltra, J. A., Román, R., Granados-Muñoz, M. J., Pérez-Ramírez, D., Ortiz-Amezcua, P., Denjean, C., Lopatin, A., Lyamani, H., Torres, B., Guerrero-Rascado, J. L., Fuertes, D., Dubovik, O., Chaikovsky, A., Olmo, F. J., Mallet, M., and Alados-Arboledas, L.: Comparative assessment of GRASP algorithm for a dust event over Granada (Spain) during ChArMEx-ADRIMED 2013 campaign, Atmos. Meas. Tech., 10, 4439–4457, https://doi.org/10.5194/amt-10-4439-2017, 2017. a
Boucher, O.: Atmospheric Aerosols, Properties and Climate Impacts, Springer Netherlands, 311 pp., https://doi.org/10.1007/978-94-017-9649-1_2, 2015. a
Bou Karam, D., Flamant, C., Cuesta, J., Pelon, J., and Williams, E.: Dust emission and transport associated with a Saharan depression: February 2007 case, J. Geophys. Res.-Atmos., 115, D00H27, https://doi.org/10.1029/2009JD012390, 2010. a
Bovchaliuk, V., Goloub, P., Podvin, T., Veselovskii, I., Tanre, D., Chaikovsky, A., Dubovik, O., Mortier, A., Lopatin, A., Korenskiy, M., and Victori, S.: Comparison of aerosol properties retrieved using GARRLiC, LIRIC, and Raman algorithms applied to multi-wavelength lidar and sun/sky-photometer data, Atmos. Meas. Tech., 9, 3391–3405, https://doi.org/10.5194/amt-9-3391-2016, 2016. a, b
Campanelli, M., Estellés, V., Tomasi, C., Nakajima, T., Malvestuto, V., and Martínez-Lozano, J. A.: Application of the SKYRAD Improved Langley plot method for the in situ calibration of CIMEL Sun-sky photometers, App. Opt., 46, 2688–2702, 2007. a, b, c
Coz, E., Gómez-Moreno, F. J., Pujadas, M., Casuccio, G. S., Lersch, T. L., and Artíñano, B.: Individual particle characteristics of North African dust under different long-range transport scenarios, Atmos. Environ., 43, 1850–1863, https://doi.org/10.1016/j.atmosenv.2008.12.045, 2009. a
Dayan, U., Ziv, B., Shoob, T., and Enzel, Y.: Suspended dust over southeastern Mediterranean and its relation to atmospheric circulations, Int. J. Climatol., 28, 915–924, https://doi.org/10.1002/joc.1587, 2008. a
Dubovik, O., Smirnov, A., Holben, B., King, M. D., Kaufman, Y. J., Eck, T. F., and Slutsker, I.: Accuracy assessments of aerosol optical properties retrieved from Aerosol Robotic Network (AERONET) Sun and sky radiance measurements, J. Geophys. Res.-Atmos., 105, 9791–9806, https://doi.org/10.1029/2000JD900040, 2000. a, b
Dubovik, O., Holben, B., Eck, T. F., Smirnov, A., Kaufman, Y. J., King, M. D., Tanré, D., and Slutsker, I.: Variability of absorption and optical properties of key aerosol types observed in worldwide locations, J. Atmos. Sci., 59, 590–608, https://doi.org/10.1175/1520-0469(2002)059<0590:VOAAOP>2.0.CO;2, 2002. a
Dubovik, O., Sinyuk, A., Lapyonok, T., Holben, B. N., Mishchenko, M., Yang, P., Eck, T. F., Volten, H., Muñoz, O., and Veihelmann, B.: Application of spheroid models to account for aerosol particle nonsphericity in remote sensing of desert dust, J. Geophys. Res.-Atmos., 111, D11208, https://doi.org/10.1029/2005JD006619, 2006. a, b, c
Ellis, W. G. and Merrill, J. T.: Trajectories for Saharan Dust Transported to Barbados Using Stokes's Law to Describe Gravitational Settling, J. Appl. Meteor., 34, 1716–1726, https://doi.org/10.1175/1520-0450-34.7.1716, 1995. a
Engelmann, R., Kanitz, T., Baars, H., Heese, B., Althausen, D., Skupin, A., Wandinger, U., Komppula, M., Stachlewska, I. S., Amiridis, V., Marinou, E., Mattis, I., Linné, H., and Ansmann, A.: The automated multiwavelength Raman polarization and water-vapor lidar PollyXT: the neXT generation, Atmos. Meas. Tech., 9, 1767–1784, https://doi.org/10.5194/amt-9-1767-2016, 2016. a, b
Engelstaedter, S., Tegen, I., and Washington, R.: North African dust emissions and transport, Earth-Sci. Rev., 79, 73–100, https://doi.org/10.1016/j.earscirev.2006.06.004, 2006. a
Estellés, V., Campanelli, M., Utrillas, M. P., Expósito, F., and Martínez-Lozano, J. A.: Comparison of AERONET and SKYRAD4.2 inversion products retrieved from a Cimel CE318 sunphotometer, Atmos. Meas. Tech., 5, 569–579, https://doi.org/10.5194/amt-5-569-2012, 2012. a, b
Estellés, V., Marenco, F., Ryder, C., Segura, S., O’Sullivan, D., Brooke, J., Campanelli, M., Buxmann, J., and Martínez-Lozano, J. A.: Validation of AERONET and ESR/SKYNET size distributions with airborne insitu measurements in dust conditions, 9th Internatıonal Workshop on Sand/Duststorms and Assocıated Dustfall, 22–24 May 2018, Tenerife, Spain, 2018. a
Freudenthaler, V.: About the effects of polarising optics on lidar signals and the Δ90 calibration, Atmos. Meas. Tech., 9, 4181–4255, https://doi.org/10.5194/amt-9-4181-2016, 2016. a
Freudenthaler, V., Esselborn, M., Wiegner, M., Heese, B., Tesche, M., Ansmann, A., Müller, D., Althausen, D., Wirth, M., Fix, A., Ehret, G., Knippertz, P., Toledano, C., Gasteiger, J., Garhammer, M., and Seefeldner, M.: Depolarization ratio profiling at several wavelengths in pure Saharan dust during SAMUM 2006, Tellus B, 61, 165–179, https://doi.org/10.1111/j.1600-0889.2008.00396.x, 2009. a
Fujiwara, M., Sugidachi, T., Arai, T., Shimizu, K., Hayashi, M., Noma, Y., Kawagita, H., Sagara, K., Nakagawa, T., Okumura, S., Inai, Y., Shibata, T., Iwasaki, S., and Shimizu, A.: Development of a cloud particle sensor for radiosonde sounding, Atmos. Meas. Tech., 9, 5911–5931, https://doi.org/10.5194/amt-9-5911-2016, 2016. a
Georgoulias, A. K., Alexandri, G., Kourtidis, K. A., Lelieveld, J., Zanis, P., Pöschl, U., Levy, R., Amiridis, V., Marinou, E., and Tsikerdekis, A.: Spatiotemporal variability and contribution of different aerosol types to the aerosol optical depth over the Eastern Mediterranean, Atmos. Chem. Phys., 16, 13853–13884, https://doi.org/10.5194/acp-16-13853-2016, 2016. a
Hansen, J. E.: Multiple Scattering of Polarized Light in Planetary Atmospheres Part II. Sunlight Reflected by Terrestrial Water Clouds, J. Atmos. Sci., 28, 1400–1426, https://doi.org/10.1175/1520-0469(1971)028<1400:MSOPLI>2.0.CO;2, 1971. a
Herrera, M., Dubovik, O., Lapyonok, T., Lopatin, A., Torres, B., Bali, J. L., and Ristori, P.: Rigorous Estimates of the Errors for the Remote Sensing Retrievals: Implementation and Illustration for Aerosol Properties Inverted from Ground-based Observations, AGU Fall Meeting, available at: https://agu.confex.com/agu/fm19/meetingapp.cgi/Paper/494514 (last access: 22 February 2021), 2019. a
Holben, B. N., Eck, T. F., Slutsker, I., Tanré, D., Buis, J., Setzer, A., Vermote, E., Reagan, J., Kaufman, Y. J., and Nakajima, T.: AERONET – A federated instrument network and data archive for aerosol characterization, Remote Sens. Environ., 66, 1–16, https://doi.org/10.1016/S0034-4257(98)00031-5, 1998. a, b
Girdwood, J., Smith, H., Stanley, W., Ulanowski, Z., Stopford, C., Chemel, C., Doulgeris, K.-M., Brus, D., Campbell, D., and Mackenzie, R.: Design and field campaign validation of a multi-rotor unmanned aerial vehicle and optical particle counter, Atmos. Meas. Tech., 13, 6613–6630, https://doi.org/10.5194/amt-13-6613-2020, 2020. a
Israelevich, P. L., Levin, Z., Joseph, J. H., and Ganor, E.: Desert aerosol transport in the Mediterranean region as inferred from the TOMS aerosol index, J. Geophys. Res., 107, 4572, https://doi.org/10.1029/2001jd002011, 2002. a
Johnson, B. T. and Osborne, S. R.: Physical and optical properties of mineral dust aerosol measured by aircraft during the GERBILS campaign, Q. J. Roy. Meteor. Soc., 137, 1117–1130, https://doi.org/10.1002/qj.777, 2011. a, b
Katsnelson, J.: Frequency of dust stormes at Be'er Shwva, Isr, J. Earth. Sci., 19, 69–76, 1970. a
Kaufman, Y. J., Boucher, O., Tanré, D., Chin, M., Remer, L. A., and Takemura, T.: Aerosol anthropogenic component estimated from satellite data, Geophys. Res. Lett., 32, L17804, https://doi.org/10.1029/2005GL023125, 2005. a
Kudo, R., Diémoz, H., Estellés, V., Campanelli, M., Momoi, M., Marenco, F., Ryder, C. L., Ijima, O., Uchiyama, A., Nakashima, K., Yamazaki, A., Nagasawa, R., Ohkawara, N., and Ishida, H.: Optimal use of Prede POM sky radiometer for aerosol, water vapor, and ozone retrievals, Atmos. Meas. Tech. Discuss. [preprint], https://doi.org/10.5194/amt-2020-486, in review, 2020. a
Lacis, A. A. and Mishchenko, M. I.: Climate forcing, climate sensitivity, and climate response: a radiative modeling perspective on atmospheric aerosols, in: Aerosol Forcing of Climate, edited by: Charlson, R. and Heintzenberg, J., Wiley, New York, 11–42, 1995. a
Lahoz, W. A. and Schneider, P.: Data assimilation: making sense of Earth Observation, Front. Environ. Sci., 2, 16, https://doi.org/10.3389/fenvs.2014.00016, 2014. a
Liu, D., Taylor, J. W., Crosier, J., Marsden, N., Bower, K. N., Lloyd, G., Ryder, C. L., Brooke, J. K., Cotton, R., Marenco, F., Blyth, A., Cui, Z., Estelles, V., Gallagher, M., Coe, H., and Choularton, T. W.: Aircraft and ground measurements of dust aerosols over the west African coast in summer 2015 during ICE-D and AER-D, Atmos. Chem. Phys., 18, 3817–3838, https://doi.org/10.5194/acp-18-3817-2018, 2018. a, b
Lopatin, A., Dubovik, O., Chaikovsky, A., Goloub, P., Lapyonok, T., Tanré, D., and Litvinov, P.: Enhancement of aerosol characterization using synergy of lidar and sun-photometer coincident observations: the GARRLiC algorithm, Atmos. Meas. Tech., 6, 2065–2088, https://doi.org/10.5194/amt-6-2065-2013, 2013. a, b, c
Marenco, F., Ryder, C., Estellés, V., O'Sullivan, D., Brooke, J., Orgill, L., Lloyd, G., and Gallagher, M.: Unexpected vertical structure of the Saharan Air Layer and giant dust particles during AER-D, Atmos. Chem. Phys., 18, 17655–17668, https://doi.org/10.5194/acp-18-17655-2018, 2018. a
Maring, H., Savoie, D. L., Izaguirre, M. A., Custals, L., and Reid, J. S.: Mineral dust aerosol size distribution change during atmospheric transport, J. Geophys. Res., 108, 8592, https://doi.org/10.1029/2002JD002536, 2003. a
Marsham, J. H., Hobby, M., Allen, C. J. T., Banks, J. R., Bart, M., Brooks, B. J., Cavazos-Guerra, C., Engelstaedter, S., Gascoyne, M., Lima, A. R., Martins, J. V., McQuaid, J. B., O'Leary, A., Ouchene, B., Ouladichir, A., Parker, D. J., Saci, A., Salah-Ferroudj, M., Todd, M. C., and Washington, R.: Meteorology and dust in the central Sahara: Observations from Fennec supersite-1 during the June 2011 Intensive Observation Period, J. Geophys. Res.-Atmos., 118, 4069–4089, https://doi.org/10.1002/jgrd.50211, 2013. a
Matsuki, A., Schwarzenboeck, A., Venzac, H., Laj, P., Crumeyrolle, S., and Gomes, L.: Cloud processing of mineral dust: direct comparison of cloud residual and clear sky particles during AMMA aircraft campaign in summer 2006, Atmos. Chem. Phys., 10, 1057–1069, https://doi.org/10.5194/acp-10-1057-2010, 2010. a
Müller, D., Lee, K.-H., Gasteiger, J., Tesche, M., Weinzierl, B., Kandler, K., Müller, T., Toledano, C., Otto, S., Althausen, D., and Ansmann, A.: Comparison of optical and microphysical properties of pure Saharan mineral dust observed with AERONET Sun photometer, Raman lidar, and in situ instruments during SAMUM 2006, J. Geophys. Res.-Atmos., 117, 25, https://doi.org/10.1029/2011JD016825, 2012. a, b, c
Nakajima, T., Campanelli, M., Che, H., Estellés, V., Irie, H., Kim, S.-W., Kim, J., Liu, D., Nishizawa, T., Pandithurai, G., Soni, V. K., Thana, B., Tugjsurn, N.-U., Aoki, K., Go, S., Hashimoto, M., Higurashi, A., Kazadzis, S., Khatri, P., Kouremeti, N., Kudo, R., Marenco, F., Momoi, M., Ningombam, S. S., Ryder, C. L., Uchiyama, A., and Yamazaki, A.: An overview of and issues with sky radiometer technology and SKYNET, Atmos. Meas. Tech., 13, 4195–4218, https://doi.org/10.5194/amt-13-4195-2020, 2020. a, b, c
NASA: AErosol RObotic NETwork (AERONET), available at: https://aeronet.gsfc.nasa.gov/, last access: 4 March 2021. a
Nicoll, K.: Measurements of atmospheric electricity aloft, Surv. Geophys., 33, 991–1057, https://doi.org/10.1007/s10712-012-9188-9, 2012. a
Nisantzi, A., Mamouri, R. E., Ansmann, A., Schuster, G. L., and Hadjimitsis, D. G.: Middle East versus Saharan dust extinction-to-backscatter ratios, Atmos. Chem. Phys., 15, 7071–7084, https://doi.org/10.5194/acp-15-7071-2015, 2015. a
Osborne, S. R., Johnson, B. T., Haywood, J. M., Baran, A. J., Harrison, M. A. J., and McConnell, C. L.: Physical and optical properties of mineral dust aerosol during the Dust and Biomass-burning Experiment, J. Geophys. Res.-Atmos., 113, D00C03, https://doi.org/10.1029/2007jd009551, 2008. a
Prospero, J. M.: Long-range transport of mineral dust in the global atmosphere: Impact of African dust on the environment of the southeastern United States, P. Natl. Acad. Sci., 96, 3396–3403, https://doi.org/10.1073/pnas.96.7.3396, 1999. a
Quaas, J.: The soot factor, Nature, 471, 456–457, https://doi.org/10.1038/471456a, 2011. a
Reid, J. S., Jonsson, H. H., Maring, H. B., Smirnov, A., Savoie, D. L., Cliff, S. S., Reid, E. A., Livingston, J. M., Meier, M. M., Dubovik, O., and Tsay, S.‐C.: Comparison of size and morphological measurements of coarse mode dust particles from Africa, J. Geophys. Res., 108, 8593, https://doi.org/10.1029/2002JD002485, 2003. a
Renard, J.-B., Dulac, F., Berthet, G., Lurton, T., Vignelles, D., Jégou, F., Tonnelier, T., Jeannot, M., Couté, B., Akiki, R., Verdier, N., Mallet, M., Gensdarmes, F., Charpentier, P., Mesmin, S., Duverger, V., Dupont, J.-C., Elias, T., Crenn, V., Sciare, J., Zieger, P., Salter, M., Roberts, T., Giacomoni, J., Gobbi, M., Hamonou, E., Olafsson, H., Dagsson-Waldhauserova, P., Camy-Peyret, C., Mazel, C., Décamps, T., Piringer, M., Surcin, J., and Daugeron, D.: LOAC: a small aerosol optical counter/sizer for ground-based and balloon measurements of the size distribution and nature of atmospheric particles – Part 1: Principle of measurements and instrument evaluation, Atmos. Meas. Tech., 9, 1721–1742, https://doi.org/10.5194/amt-9-1721-2016, 2016. a
Renard, J.-B., Dulac, F., Durand, P., Bourgeois, Q., Denjean, C., Vignelles, D., Couté, B., Jeannot, M., Verdier, N., and Mallet, M.: In situ measurements of desert dust particles above the western Mediterranean Sea with the balloon-borne Light Optical Aerosol Counter/sizer (LOAC) during the ChArMEx campaign of summer 2013, Atmos. Chem. Phys., 18, 3677–3699, https://doi.org/10.5194/acp-18-3677-2018, 2018. a, b
Rodriguez, S., Querol, X., Alastuey, A., and Plana, F., Sources and processes affecting levels and composition of atmospheric aerosol in the western Mediterranean, J. Geophys. Res., 107, 4777, https://doi.org/10.1029/2001JD001488, 2002. a
Rolph, G., Stein, A., and Stunder, B.: Real-time Environmental Applications and Display sYstem: READY, Environ. Mod. Softw., 95, 210–228, https://doi.org/10.1016/j.envsoft.2017.06.025, 2017. a
Ryder, C. L., Highwood, E. J., Rosenberg, P. D., Trembath, J., Brooke, J. K., Bart, M., Dean, A., Crosier, J., Dorsey, J., Brindley, H., Banks, J., Marsham, J. H., McQuaid, J. B., Sodemann, H., and Washington, R.: Optical properties of Saharan dust aerosol and contribution from the coarse mode as measured during the Fennec 2011 aircraft campaign, Atmos. Chem. Phys., 13, 303–325, https://doi.org/10.5194/acp-13-303-2013, 2013. a, b, c
Ryder, C. L., Marenco, F., Brooke, J. K., Estelles, V., Cotton, R., Formenti, P., McQuaid, J. B., Price, H. C., Liu, D., Ausset, P., Rosenberg, P. D., Taylor, J. W., Choularton, T., Bower, K., Coe, H., Gallagher, M., Crosier, J., Lloyd, G., Highwood, E. J., and Murray, B. J.: Coarse-mode mineral dust size distributions, composition and optical properties from AER-D aircraft measurements over the tropical eastern Atlantic, Atmos. Chem. Phys., 18, 17225–17257, https://doi.org/10.5194/acp-18-17225-2018, 2018. a, b, c, d
Ryder, C. L., Highwood, E. J., Walser, A., Seibert, P., Philipp, A., and Weinzierl, B.: Coarse and giant particles are ubiquitous in Saharan dust export regions and are radiatively significant over the Sahara, Atmos. Chem. Phys., 19, 15353–15376, https://doi.org/10.5194/acp-19-15353-2019, 2019. a
Sawamura, P., Moore, R. H., Burton, S. P., Chemyakin, E., Müller, D., Kolgotin, A., Ferrare, R. A., Hostetler, C. A., Ziemba, L. D., Beyersdorf, A. J., and Anderson, B. E.: HSRL-2 aerosol optical measurements and microphysical retrievals vs. airborne in situ measurements during DISCOVER-AQ 2013: an intercomparison study, Atmos. Chem. Phys., 17, 7229–7243, https://doi.org/10.5194/acp-17-7229-2017, 2017. a
Schepanski, K., Tegen, I., Laurent, B., Heinold, B., and Macke, A.: A new Saharan dust source activation frequency map derived from MSG-SEVIRI IR-channels, Geophys. Res. Lett., 34, 5, https://doi.org/10.1029/2007GL030168, 2007. a
Smith, H. R., Ulanowski, Z., Kaye, P. H., Hirst, E., Stanley, W., Kaye, R., Wieser, A., Stopford, C., Kezoudi, M., Girdwood, J., Greenaway, R., and Mackenzie, R.: The Universal Cloud and Aerosol Sounding System (UCASS): a low-cost miniature optical particle counter for use in dropsonde or balloon-borne sounding systems, Atmos. Meas. Tech., 12, 6579–6599, https://doi.org/10.5194/amt-12-6579-2019, 2019. a, b, c, d, e, f, g, h, i, j, k
Song, Q., Zhang, Z., Yu, H., Kato, S., Yang, P., Colarco, P., Remer, L. A., and Ryder, C. L.: Net radiative effects of dust in the tropical North Atlantic based on integrated satellite observations and in situ measurements, Atmos. Chem. Phys., 18, 11303–11322, https://doi.org/10.5194/acp-18-11303-2018, 2018. a
Spanu, A., Dollner, M., Gasteiger, J., Bui, T. P., and Weinzierl, B.: Flow-induced errors in airborne in situ measurements of aerosols and clouds, Atmos. Meas. Tech., 13, 1963–1987, https://doi.org/10.5194/amt-13-1963-2020, 2020. a
Stein, A. F., Draxler, R. R., Rolph, G. D., Stunder, B. J. B., Cohen, M. D., and Ngan, F.: NOAA's HYSPLIT atmospheric transport and dispersion modeling system, B. Am. Meteor. Soc., 96, 2059–2077, https://doi.org/10.1175/BAMS-D-14-00110.1, 2017. a
Stocker, T. F., Qin, D., Plattner, G.-K., Tignor, M., Allen, S. K., Boschung, J., Nauels, A., Xia, Y., Bex, V., and Midgley, P. M.: Climate change 2013: the physical science basis: Working Group I contribution to the Fifth assessment report of the Intergovernmental Panel on Climate Change, Cambridge University Press, 2013. a, b
Torres, B., Dubovik, O., Fuertes, D., Schuster, G., Cachorro, V. E., Lapyonok, T., Goloub, P., Blarel, L., Barreto, A., Mallet, M., Toledano, C., and Tanré, D.: Advanced characterisation of aerosol size properties from measurements of spectral optical depth using the GRASP algorithm, Atmos. Meas. Tech., 10, 3743–3781, https://doi.org/10.5194/amt-10-3743-2017, 2017. a
TROPOS (Leibniz Institute for Tropospheric Research): Worldwide observations with the portable Raman lidar systems (Polly), available at: http://polly.tropos.de/, last access: 3 April 2021. a
Tsekeri, A., Lopatin, A., Amiridis, V., Marinou, E., Igloffstein, J., Siomos, N., Solomos, S., Kokkalis, P., Engelmann, R., Baars, H., Gratsea, M., Raptis, P. I., Binietoglou, I., Mihalopoulos, N., Kalivitis, N., Kouvarakis, G., Bartsotas, N., Kallos, G., Basart, S., Schuettemeyer, D., Wandinger, U., Ansmann, A., Chaikovsky, A. P., and Dubovik, O.: GARRLiC and LIRIC: strengths and limitations for the characterization of dust and marine particles along with their mixtures, Atmos. Meas. Tech., 10, 4995–5016, https://doi.org/10.5194/amt-10-4995-2017, 2017. a, b
Weinzierl, B., Petzold, A.,Esselborn, M., Wirth, M., Rasp, K., Kandler, L., Schütz, L., Koepke, P., and Fiebig, M.: Airborne measurements of dust layer properties, particle size distribution and mixing state of Saharan dust during SAMUM 2006, Tellus, 61B, 96–117, https://doi.org/10.1111/j.1600-0889.2008.00392.x, 2009. a, b, c, d, e
Weinzierl, B., Sauer, D., Esselborn, M., Petzold, A., Mund, S., Veira, A., Tesche, M., Ansmann, A., and Wirth, M.: Airborne observations of microphysical and optical properties of dust and biomass burning aerosol layers in the Cape Verde region during SAMUM 2008, Tellus B, 63, 589–618, https://doi.org/10.1111/j.1600-0889.2011.00566.x, 2011. a, b, c
Weinzierl, B., Ansmann, A, Prospero, J. M., Althausen, D., Benker, N., Chouza, F., Dollner, M., Farrell, D., Fomba, W. K., Freudenthaler, V., Gasteiger, J., Groß, S., Haarig, M., Heinold, B., Kandler, K., Kristensen, T. B., Mayol-Bracero, O.-L., Müller, T., Reitebuch, O., Sauer, D., Schäfler, A., Schepanski, K., Tegen, I., Toledano, C., and Walser, A.: The Saharan Aerosol Longrange TRansport and Aerosol Cloud Interaction Experiment (SALTRACE): overview and selected highlights, B. Am. Meteorol. Soc., 98, 1427–1451, https://doi.org/10.1175/BAMS-D-15-00142.1, 2017. a, b, c, d, e