the Creative Commons Attribution 4.0 License.
the Creative Commons Attribution 4.0 License.
 | 04 May 2021
Microphysical investigation of the seeder and feeder region of an Alpine mixed-phase cloud
Fabiola Ramelli
Jan Henneberger
Robert O. David
Johannes Bühl
Martin Radenz
Patric Seifert
Jörg Wieder
Annika Lauber
Julie T. Pasquier
Ronny Engelmann
Claudia Mignani
Maxime Hervo
Ulrike Lohmann
The seeder–feeder mechanism has been observed to enhance orographic precipitation in previous studies. However, the microphysical processes active in the seeder and feeder region are still being understood. In this paper, we investigate the seeder and feeder region of a mixed-phase cloud passing over the Swiss Alps, focusing on (1) fallstreaks of enhanced radar reflectivity originating from cloud top generating cells (seeder region) and (2) a persistent low-level feeder cloud produced by the boundary layer circulation (feeder region). Observations were obtained from a multi-dimensional set of instruments including ground-based remote sensing instrumentation (Ka-band polarimetric cloud radar, microwave radiometer, wind profiler), in situ instrumentation on a tethered balloon system, and ground-based aerosol and precipitation measurements.
The cloud radar observations suggest that ice formation and growth were enhanced within cloud top generating cells, which is consistent with previous observational studies. However, uncertainties exist regarding the dominant ice formation mechanism within these cells. Here we propose different mechanisms that potentially enhance ice nucleation and growth in cloud top generating cells (convective overshooting, radiative cooling, droplet shattering) and attempt to estimate their potential contribution from an ice nucleating particle perspective. Once ice formation and growth within the seeder region exceeded a threshold value, the mixed-phase cloud became fully glaciated.
Local flow effects on the lee side of the mountain barrier induced the formation of a persistent low-level feeder cloud over a small-scale topographic feature in the inner-Alpine valley. In situ measurements within the low-level feeder cloud observed the production of secondary ice particles likely due to the Hallett–Mossop process and ice particle fragmentation upon ice–ice collisions. Therefore, secondary ice production may have been partly responsible for the elevated ice crystal number concentrations that have been previously observed in feeder clouds at mountaintop observatories. Secondary ice production in feeder clouds can potentially enhance orographic precipitation.
- Article
(10425 KB) - Full-text XML
- BibTeX
- EndNote


Mixed-phase clouds (MPCs), which consist of ice crystals and supercooled cloud droplets, play a crucial role in precipitation formation and are responsible for 30 % to 50 % of the precipitation in the midlatitudes (Mülmenstädt et al., 2015). Furthermore, MPCs have important implications for the Earth's radiation budget. In particular, the phase partitioning between the liquid and ice phases in MPCs is of major importance as the radiative properties of ice crystals and cloud droplets differ significantly (Sun and Shine, 1994). Thus, in order to understand the radiative effects and precipitation initiation in MPCs, it is important to understand the microphysical processes that govern MPCs, as well as to characterize the vertical distribution of the liquid- and ice-phase hydrometeors within them.
The coexistence of the ice and liquid phases in MPCs is thermodynamically unstable due to the lower saturation vapor pressure over ice compared to over liquid. Therefore, ice crystals grow rapidly at the expense of the surrounding water droplets if the saturation vapor pressure lies between ice and water saturation. This process is known as the Wegener–Bergeron–Findeisen (WBF) process (Wegener, 1911; Bergeron, 1935; Findeisen, 1938)) and can lead to rapid glaciation of the cloud, thus limiting the lifetime of MPCs.
In order to sustain mixed-phase regions, two prerequisites need to be fulfilled. Firstly, the environment needs to be supersaturated with respect to liquid water, which can be achieved through sufficiently large updrafts (e.g., Rauber and Tokay, 1991; Harrington et al., 1999). Secondly, the condensate supply rate needs to exceed the diffusional growth rate of the ice crystals. Indeed, persistent MPCs are frequently observed in mountainous regions (e.g., Borys et al., 2003; Lowenthal et al., 2011; Dorsi et al., 2015; Lloyd et al., 2015; Lohmann et al., 2016a; Beck et al., 2017; Lowenthal et al., 2016, 2019) where the local topography produces updrafts capable of providing a continuous source of condensate. In addition, Rauber and Grant (1986) found two further regions where the prerequisites for persistent MPCs are fulfilled: near cloud top and near cloud base. The presence of a supercooled liquid layer at cloud top can increase radiative cooling (e.g., Sun and Shine, 1994; Possner et al., 2017; Eirund et al., 2019). Furthermore, this liquid layer can act as a source region for primary ice nucleation and initial ice growth (i.e., seeder region) and can influence the evolution of the microphysical cloud structure in the lower cloud levels. Meanwhile, the presence of a supercooled liquid layer near cloud base can act as a feeder region on which precipitation particles that formed in the seeder region of the cloud can “feed”, ultimately enhancing precipitation (e.g., Reinking et al., 2000; Borys et al., 2000, 2003; Lowenthal et al., 2011, 2016, 2019).
Seeder regions were often observed in connection with cloud top generating cells (e.g., Hogan et al., 2002; Cronce et al., 2007; Stark et al., 2013; Kumjian et al., 2014; Rosenow et al., 2014; Plummer et al., 2014, 2015; Rauber et al., 2015; Wang et al., 2020). The term “generating cell” describes a small region of enhanced radar reflectivity at cloud top which produces an enhanced reflectivity trail, or fallstreak, characteristic of falling hydrometeors. Generating cells have horizontal extents of 1 to 2 km and updraft velocities in the range of 0.75 to 3 m s−1 (Rosenow et al., 2014; Kumjian et al., 2014). Most studies agree that radiative cooling at cloud top is a major driver for the formation and maintenance of generating cells (e.g., Kumjian et al., 2014; Keeler et al., 2016) and that these cells play an important role in primary ice nucleation and growth (e.g., Houze et al., 1981; Hogan et al., 2002; Stark et al., 2013). Moreover, secondary ice production (SIP) processes might be active in generating cells, which can further increase the ice crystal number concentration (ICNC). Indeed, generating cells were found to only account for 10 % to 20 % of the total ice growth (e.g., Houze et al., 1981; Plummer et al., 2015), while the majority of the ice growth occurred in the feeder region below.
Ice crystals can grow by various ice processes depending on the ambient conditions and the size distribution of cloud droplets and ice crystals (e.g., Marshall and Langleben, 1954; Fukuta and Takahashi, 1999; Bailey and Hallett, 2009; Connolly et al., 2012). For example, small ice crystals grow initially by the diffusion of water vapor, and thus their habit is determined by the ambient temperature and supersaturation (Magono and Lee, 1966; Bailey and Hallett, 2009). When ice crystals reach a critical size, they can grow more efficiently by aggregation and riming. Aggregation involves the collision and coalescence between ice particles and is most efficient at temperatures higher than −10 ∘C due to the presence of a thicker quasi-liquid layer which enhances the stickiness of the ice particles (e.g., Lohmann et al., 2016b). Riming, which involves the collision of an ice particle with a supercooled cloud droplet that freezes upon contact, has often been observed in the feeder regions of clouds (Mitchell et al., 1990; Borys et al., 2000, 2003; Saleeby et al., 2009, 2011; Lowenthal et al., 2011, 2019) and has been found to enhance surface precipitation by up to 20 %– 50 % (e.g., Mitchell et al., 1990; Borys et al., 2003; Lowenthal et al., 2016). For example, Lowenthal et al. (2016) observed that the precipitation at a mountaintop observatory gained the majority of its mass within 1 km above the mountaintop in the so-called feeder cloud. The efficiency of riming strongly depends on the cloud droplet size distribution (e.g., Borys et al., 2003; Saleeby et al., 2013). Additionally, riming can also produce a large number of ice splinters; e.g., when a cloud droplet of an appropriate size (>25 µm in diameter) collides with a rimed ice particle (>0.5 mm in diameter) (Mossop, 1978; Lamb and Verlinde, 2011). This SIP process is called the Hallett–Mossop process (Hallett and Mossop, 1974) and is thought to be active at temperatures between −3 and −8 ∘C. Other SIP mechanisms include the fragmentation of fragile ice crystals upon collisions with large ice particles (Vardiman, 1978) and the release of small secondary ice particles upon the freezing of drizzle-sized droplets (e.g., Langham and Mason, 1958; Mason and Maybank, 1960; Lauber et al., 2018). Indeed, the ICNCs measured in feeder clouds at mountaintop research stations frequently exceed the observed ice nucleating particle (INP) concentrations by several orders of magnitude (e.g., Rogers and Vali, 1987; Lloyd et al., 2015; Beck et al., 2018; Lowenthal et al., 2019). Several studies suggested that this discrepancy between the INP concentration and the ICNC can be explained by the influence of surface processes such as blowing snow (Geerts et al., 2015; Beck et al., 2018), hoar frost (Lloyd et al., 2015) or riming on snow-covered surfaces (Rogers and Vali, 1987), which can significantly increase the local ICNC and thereby influence the further evolution of the cloud. So far, it has been difficult to disentangle the contribution of surface processes and SIP mechanisms to the observed ICNC by means of mountaintop observations. Therefore, innovative measurement strategies are required to reduce the influence of surface processes and to assess the importance of SIP mechanisms in feeder clouds. For example, Mignani et al. (2019) disentangled the surface processes and SIP mechanisms by analyzing single freshly fallen dendritic crystals, which grow between −12 and −17 ∘C, on their INP content. They observed an ice multiplication factor of 8 in winter MPCs at the mountaintop station of Jungfraujoch and suggested secondary ice formation as a probable reason for their findings. To extend the analysis to temperatures outside of the dendritic regime and to investigate the role of SIP mechanisms in feeder clouds, a tethered balloon system was used in the present paper.
In this study, we investigate the microphysics of a cloud system passing over the Swiss Alps by combining a multi-dimensional set of instruments. A particular emphasis is placed on studying the role of cloud top generating cells and a surface-decoupled feeder cloud for ice growth and precipitation initiation. While most of the studies agree that generating cells have important implications for precipitation formation, less research has focused on the mechanisms that are responsible for the enhanced ice formation and growth within these cells. We will approach this problem from an INP-cloud perspective by combining INP and ice crystal measurements. Furthermore, we discuss the role of a low-level feeder cloud for ice growth and SIP processes. While the lowest part of the boundary layer is usually inaccessible for aircraft in complex terrain or is limited to observations at mountaintops or near mountain slopes, we analyze the microstructure of the low-level feeder cloud by using a tethered balloon system. The presented case study was observed during the Role of Aerosols and CLouds Enhanced by Topography on Snow (RACLETS) campaign, which took place in the Swiss Alps during winter 2019. The analysis is based on an extensive set of observations including (1) ground-based remote sensing observations from a cloud radar, microwave radiometer and wind profiler, (2) balloon-borne in situ observations, (3) INP measurements, and (4) surface-based precipitation measurements.
The data presented in this paper were collected during the RACLETS campaign, which took place in the Swiss Alps in the region around Davos from 8 February 2019 to 28 March 2019. The campaign was designed to observe the pathways of orographic precipitation formation covering the entire aerosol–cloud–precipitation process chain (see also Ramelli et al., 2021; Lauber et al., 2021; Mignani et al., 2021; Georgakaki et al., 2020). In the following, we will describe the relevant instruments and methods which have been used for the analysis of the presented case study.
2.1 Remote sensing instruments
2.1.1 Cloud observations
Observations of the cloud microphysics were conducted at Wolfgang (1630 m; see Fig. 1) using remote sensing and in situ instruments.
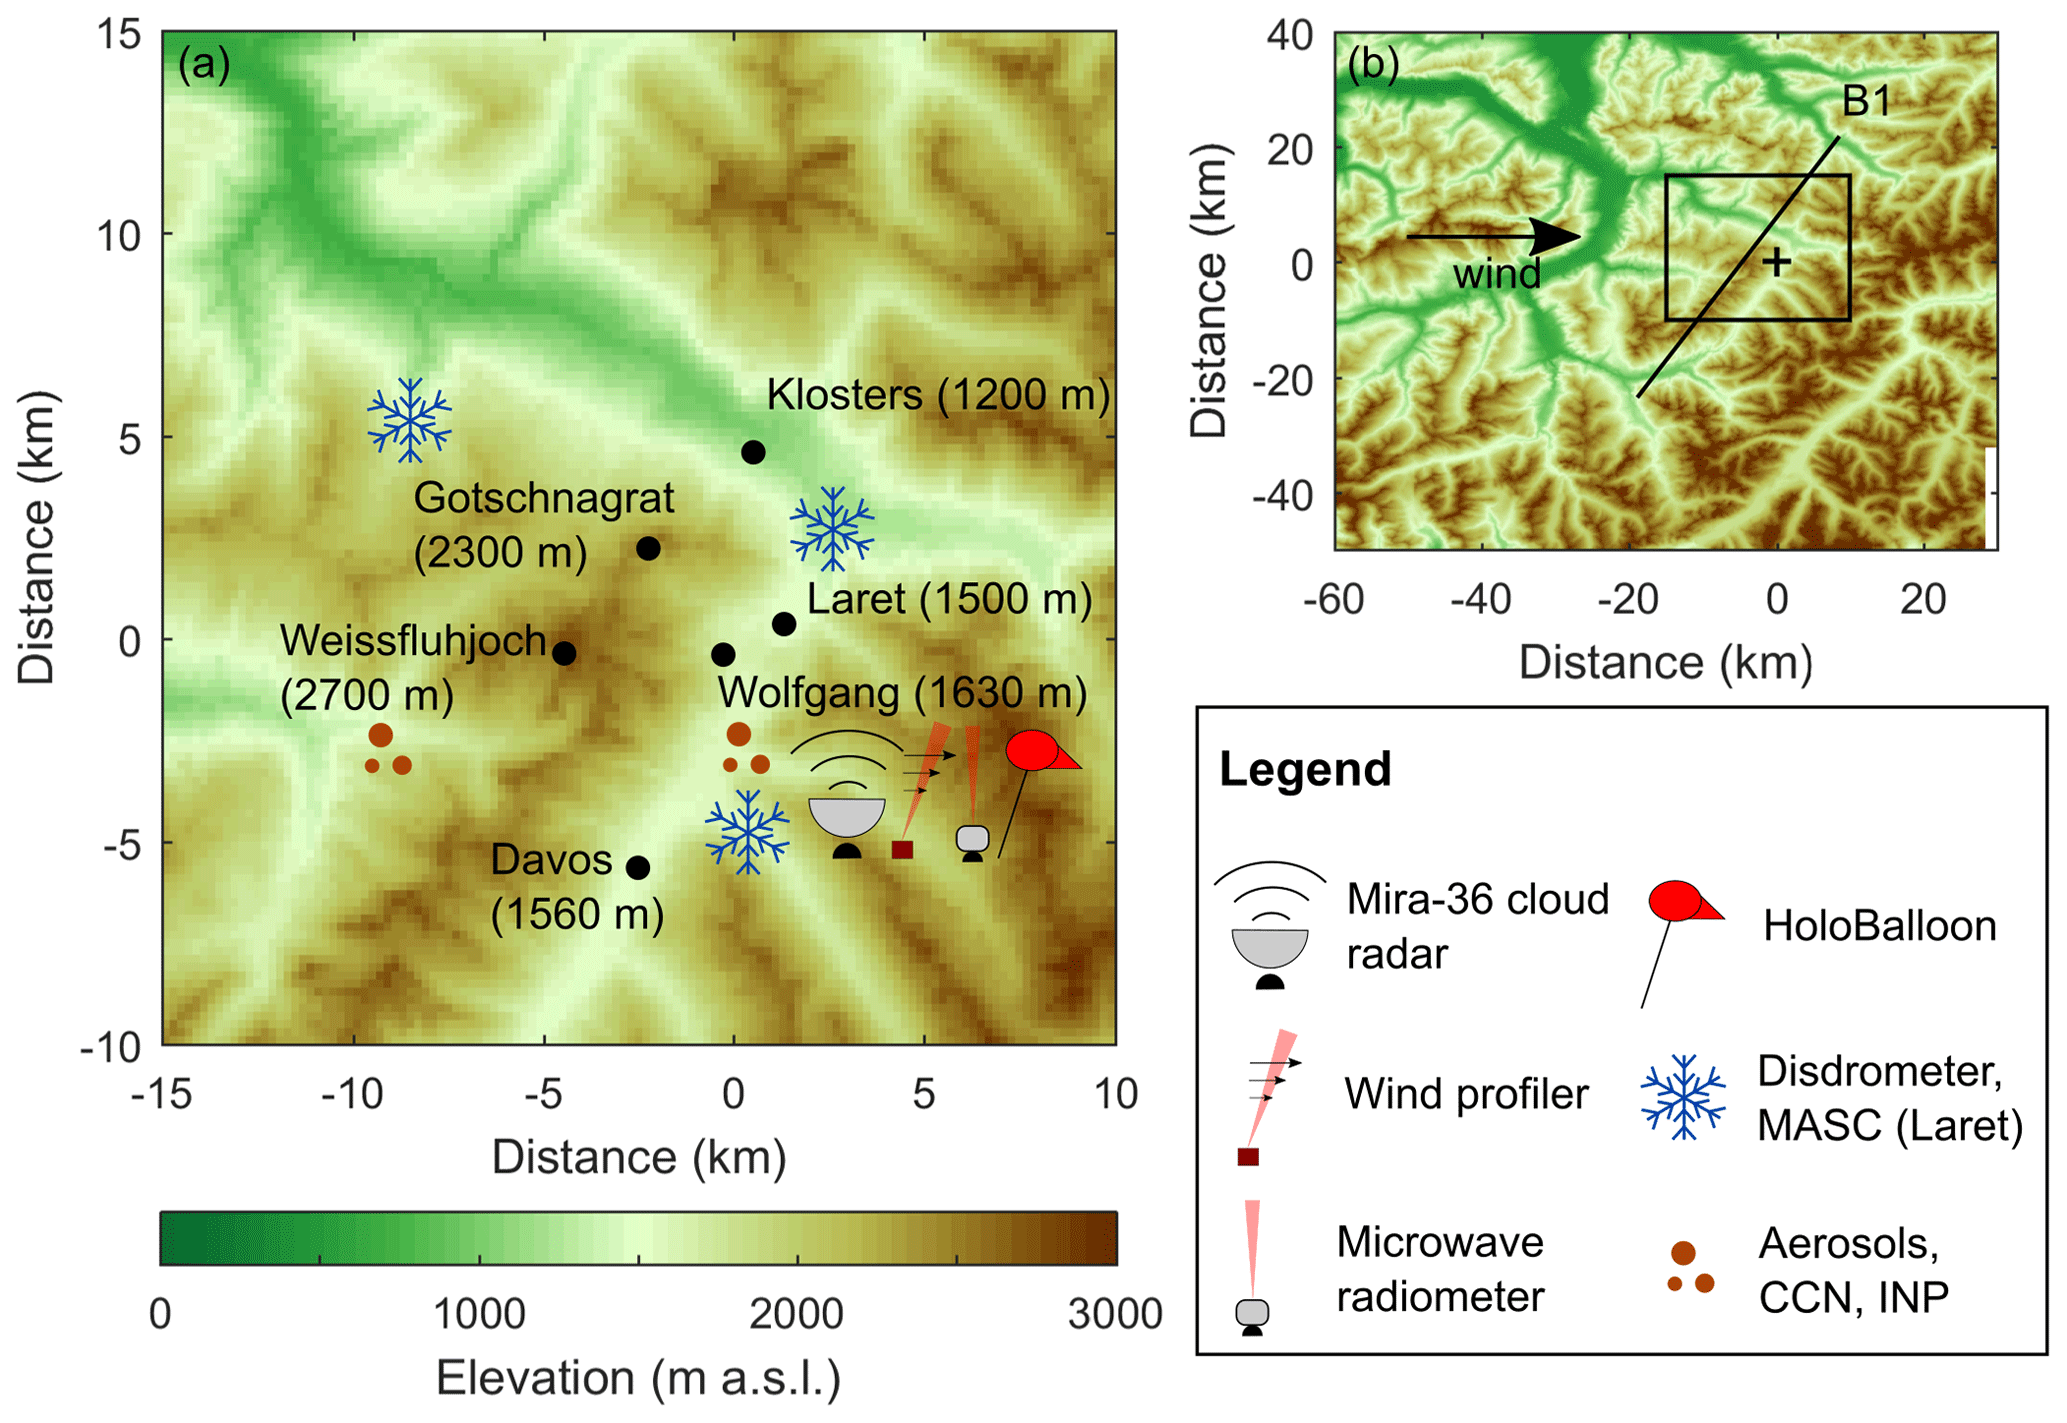
Figure 1Overview of the measurement locations and the experimental setup (a). The geographical location of Wolfgang (black cross) and the surrounding topography is shown in (b). The large-scale wind direction was from the west as indicated by the black arrow. The most relevant mountain barrier is indicated by B1. An enlarged section of the measurement sites (black rectangle in b) and the instrument setup is shown in panel (a). The elevation data were obtained from the digital height model DHM25 of the Federal Office of Topography.
Ground-based remote sensing measurements were obtained with a vertically pointing Ka-band polarimetric cloud radar that operated at 35.5 GHz (Mira-36 METEK GmbH, Germany; Görsdorf et al., 2015). The radar was operated at a pulse-repetition frequency of 6000 Hz and a pulse length of s, resulting in a vertical resolution of 31.17 m and a maximum unambiguous velocity range of 25.6 m s−1, which spans from −12.8 to 12.8 m s−1. The return signals of the emitted linearly polarized pulses were detected separately in the co- and cross-polarized planes. For both channels, Doppler spectra are derived from Fourier transformations of the return signals from a series of 512 consecutive pulses, corresponding to a Doppler-velocity resolution of 0.05 m s−1. The final temporal resolution of the acquired cloud radar dataset of 10 s is obtained from incoherent averaging of 100 consecutive Doppler spectra.
The 10 s averages of Doppler spectra are the prerequisite for the subsequent data analysis. The moments of the Doppler spectrum provide information about mean volume radar reflectivity, Doppler velocity and Doppler spectral width, based on which the abundance and turbulent properties of clouds can be inferred (Görsdorf et al., 2015). From the ratio of the co- and cross-polarized signal components, the linear depolarization ratio (LDR) is obtained. During the RACLETS campaign, the minimum detectable LDR, which is defined by the quality of decoupling of both detection channels (Myagkov et al., 2015), was found to be −27 dB. The individual Doppler spectra contain valuable information about the microphysical structure of the observed clouds. They can be screened for the presence and properties of multiple spectral peaks in order to evaluate the abundance of different hydrometeor types. In here, such a peak separation is realized by means of the newly developed peakTree retrieval (Radenz et al., 2019). The microphysical properties of ICNC and size are retrieved with the method of Bühl et al. (2019). Both retrievals are further elaborated on in Sect. 2.3.
Moreover, a 14-channel microwave radiometer (HATPRO, Radiometer Physics GmbH, Germany; Rose et al., 2005) was used to observe vertical profiles of atmospheric temperature and humidity, as well as the column-integrated water vapor content (IWV) and liquid water path (LWP). The atmospheric parameters are derived from the measured multi-frequency brightness temperatures following a statistical approach based on a least squares linear regression model (Löhnert and Crewell, 2003). Previous studies reported retrieval uncertainties on the order of 0.5 to 0.8 kg m−2 for IWV (Steinke et al., 2015) and 16 g m−2 for the LWP (Crewell and Löhnert, 2003).
2.1.2 Wind observations
Horizontal wind fields were measured at Wolfgang using a radar wind profiler owned by the Federal Office of Meteorology and Climatology MeteoSwiss (LAP-3000 wind profiler, Vaisala, Finland; Ketterer et al., 2014). The wind profiler was operated at a frequency of 1290 MHz. The wind profiler LAP-3000 emitted electromagnetic energy in five beams with one vertical and four oblique beams at an elevation angle of 75∘ from horizontal. Observations of the wind profiler were available at a vertical resolution of 204 m and a temporal resolution of 5 min.
2.2 In situ instruments
2.2.1 Cloud measurements
In situ observations of the low-level cloud structure were measured with the tethered balloon system HoloBalloon (Ramelli et al., 2020). The main component of the measurement platform is the HOLographic cloud Imager for Microscopic Objects (HOLIMO), which can image an ensemble of cloud particles in the size range from small cloud droplets (6 µm) to precipitation-sized particles (2 mm) in a three-dimensional sample volume (Henneberger et al., 2013; Beck et al., 2017; Ramelli et al., 2020). The captured two-dimensional shadowgraphs are classified as cloud droplets, ice crystals and artifacts (e.g., noise in the hologram) based on the particle shape using supervised machine learning (e.g., Beck et al., 2017; Touloupas et al., 2020). Thus, HOLIMO provides information about the phase-resolved cloud properties (size distribution, number concentration, content, habit).
In the present study, a total number of 9000 holograms with a sample volume of 12 cm−3 each (i.e., total sample volume of 105 L) were utilized for the analysis of the cloud properties. The entire sample volume of 35 cm−3 was used for the analysis of the different ice habits (see Sect. 4.3) to obtain significant statistics. As in Henneberger et al. (2013) and Beck et al. (2017), partitioning between cloud droplets and ice crystals was done for particles larger than 25 µm since for particles smaller than 25 µm it is challenging to differentiate between the ice and liquid phases due to resolution limitations. Cloud droplets were classified using a decision tree, whereas ice particles were classified using a neural network (Touloupas et al., 2020). The uncertainty in the cloud droplet number concentration was around ±5 % (Beck, 2017). Additionally, for cloud droplets larger than 40 µm the counting uncertainty (, where N signifies number of particles and V measurement volume) was added due to their relatively small numbers. All predicted ice particles were manually confirmed after the automated classification in order to reduce the number of misclassified ice particles. According to Beck (2017), the uncertainty in the ICNC is in the range of 5 % to 10 % for ice crystals larger than 100 µm in diameter and around 15 % for ice crystals smaller than 100 µm. Again, the counting uncertainty was added to the ICNC<100 µm (i.e., ice crystals smaller than 100 µm) and ICNC>500 µm (i.e., ice crystals larger than 500 µm). Because of the applied size threshold (25 µm) and the visual classification, the reported ice properties (e.g., ICNC, ice water content) can be considered as a lower estimate. Additionally, all ice particles larger than 50 µm in diameter were manually classified into five ice habits based on the particle shape: (1) plate-like, (2) column-like, (3) graupel, (4) irregular and (5) aggregates (see Sect. 4.3).
2.2.2 Precipitation measurements
Precipitation was measured at three locations (Wolfgang 1630 m, Laret 1500 m, Gotschnagrat 2300 m; see Fig. 1) using PARticle SIze VELocity (Parsivel) disdrometers (OTT Parsivel2, OTT HydroMet, Germany; Tokay et al., 2014). Parsivel disdrometers can measure both the size and the fall velocity of hydrometeors that fall through a laser sheet (Löffler-Mang and Joss, 2000). The size of the hydrometeor is estimated from the signal attenuation, whereas the fall velocity of the hydrometeor is obtained from the signal duration. Precipitation particles in the size range between 0.2 and 25 mm are measured. The temporal resolution of the measurements is 30 s.
Additionally, a multi-angle snowflake camera (MASC; Garrett et al., 2012; Praz et al., 2017) was installed at Laret (see Fig. 1) which took photographs of hydrometeors from three different angles and simultaneously measured their fall velocity. All hydrometeors observed by the MASC were manually classified into graupel and aggregates based on their shape (see Sect. 4.3). The MASC is sensitive to hydrometeors in the size range between 30 µm and 3 cm. Furthermore, a snow drift station was installed at Gotschnagrat which provided data about the wind-driven redistribution of snow on the ground (Walter et al., 2020).
2.2.3 INP measurements
Aerosols and INP properties were measured at the valley station of Wolfgang (1630 m) and at the mountaintop station of Weissfluhjoch (2700 m) (Fig. 1; see also Mignani et al., 2021; Georgakaki et al., 2020). Aerosol instruments were connected to heated inlets for measurements of ambient air at each site. Additionally, ambient aerosols were collected approximately every 1.5 h with a high flow rate impinger (Coriolis μ, Bertin Technologies, France; Carvalho et al., 2008) operating at 300 L min−1 for 20 min. The impinger collected aerosol particles larger than 0.5 µm in swirling liquid water, and the aqueous solution was analyzed in drop-freezing instruments in order to obtain INP concentration spectra from 0 ∘C to approximately −20 ∘C. The DRoplet Ice Nuclei Counter Zurich (DRINCZ; David et al., 2019) was operated at Wolfgang, and the LED-based Ice Nucleation Detection Apparatus (LINDA; Stopelli et al., 2014) was run at Weissfluhjoch. Both drop-freezing instruments use a digital camera to detect freezing by a change in the light transmission through the aqueous solution. An intercomparison of an ambient aerosol sample between both instruments showed slightly higher INP concentrations for LINDA compared to DRINCZ for temperatures along the here-relevant freezing spectrum (i.e., a factor of 2 for −15 ∘C ∘C) (Miller et al., 2020), which can be likely attributed to instrumental differences.
The cumulative INP concentration (INPC) was calculated following Eq. (4) in Vali (2019):
where
using the temperature-dependent frozen fraction FF(T) (total number of aliquots: 96 at Wolfgang, 52 at Weissfluhjoch), the volume of an individual aliquot Va (50 µL at Wolfgang, 100 µL at Weissfluhjoch) and the normalization factor C, which converts the concentration to standard liters of ambient air. C was calculated for each sample by considering the flow rate of the impinger Fimpinger (300 L min−1), the sampling time tsample (usually 20 min), the end volume of the liquid Vliquid (approx. 15 mL) and the conversion factor from liters to standard liters CstdL (including the ambient temperature Tambient and pressure pambient at each site and the reference temperature Tref=273.15 K and pressure pref=1013.25 hPa). According to the specifications above, the minimal detectable INP concentration (limit of detection) at Wolfgang was and at Weissfluhjoch .
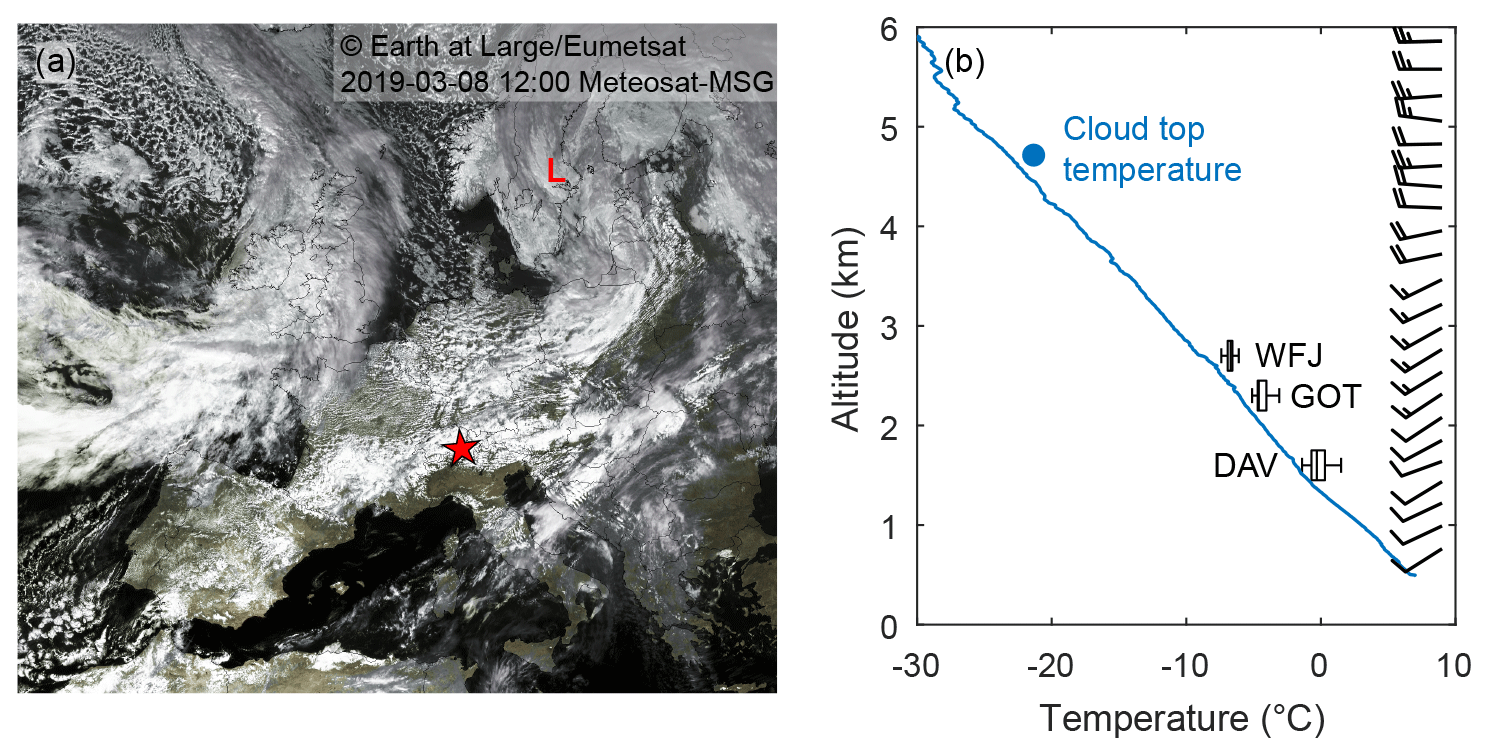
Figure 2Overview of the synoptic weather situation on 8 March 2019, showing a satellite picture taken over Europe at 12:00 UTC (a, EUMETSAT) and the vertical temperature profile measured by a radiosonde (12:00 UTC) launched from Payerne (b, MeteoSwiss). The boxplots in (b) indicate the temperature measured at the weather stations of Davos (DAV, 1600 m), Gotschnagrat (GOT, 2300 m) and Weissfluhjoch (WFJ, 2700 m) during the passage of the cloud system. The blue dot indicates the cloud top temperature (−21 ∘C) and cloud top height (4700 m), which were estimated from the cloud radar observations averaged between 16:00 and 18:00 UTC. The wind barbs are shown on the right side.
2.3 Retrieval of cloud properties and Doppler spectra analysis
2.3.1 ICNC retrieval
ICNCs were retrieved from the cloud radar observations with the method described in Bühl et al. (2019). The ICNC is derived from pre-calculated lookup tables containing the measurement variables (here radar reflectivity, Doppler velocity and spectral width), together with the corresponding microphysical state that would lead to exactly these measurements. The particle diameter was estimated from the particle terminal fall velocity and spectral width measured with the cloud radar. The predominant ice particle shape was obtained from LDR measurements of the cloud radar and the ice crystal images observed by HOLIMO. For this case, the particle shapes from Mitchell (1996) were used, assuming “hexagonal plates” for ice crystals smaller than 600 µm in diameter and “aggregates of planar polycrystals in cirrus clouds” for ice particles larger than 600 µm in diameter. For a particular ice crystal shape, the whole lookup table is searched for matching measurement values within the margins of the corresponding measurement errors. Usually, several results are found that meet these criteria. The standard deviation of the distribution of results is taken as the uncertainty for each derived quantity. The uncertainty in the ICNCs presented in this work is about a factor of 4.
2.3.2 The peakTree analysis
The Doppler spectra were analyzed for multi-peak situations with the peakTree approach (Radenz et al., 2019). The (sub-)peaks in the Doppler spectrum are identified and transformed into nodes of a binary tree. By using such a tree structure, it is possible to drop all a priori assumptions on the number and arrangement of the (sub-)peaks while providing a rigid and unambiguous peak structuring method. The Doppler spectrum from the cloud radar data processing (Sect. 2.1.1) is smoothed in the velocity domain using a five-bin window. Afterwards the boundaries of noise-floor-separated peaks and internal subpeaks are identified. The latter are only considered valid peaks if a local minimum of spectral reflectivity is at least 1 dB below the next maximum (“peak prominence”). Starting from the outermost bounds, which provide the root node, the tree is recursively built by splitting nodes into child nodes for each peak boundary from low to high spectral reflectivities. The moments (reflectivity, mean velocity, spectral width, skewness and LDR) are calculated for each node. The root node (index 0) holds the same moments as obtained by “traditional” spectral processing when assuming only mono-modal peaks. Detailed explanations and examples are given in Radenz et al. (2019).
The synoptic weather situation over Europe on 8 March 2019 was characterized by a large-scale westerly flow with several low-pressure systems (Fig. 2a). This strong westerly flow persisted for several days and brought moist air from the Atlantic towards central Europe. A low-pressure system located over Scandinavia produced a small-scale disturbance on its southern edge which crossed Switzerland during the day and reached Davos in the afternoon. The presented case study was observed during the passage of this small-scale disturbance which arrived in Davos at around 15:00 UTC and lasted until 19:00 UTC.
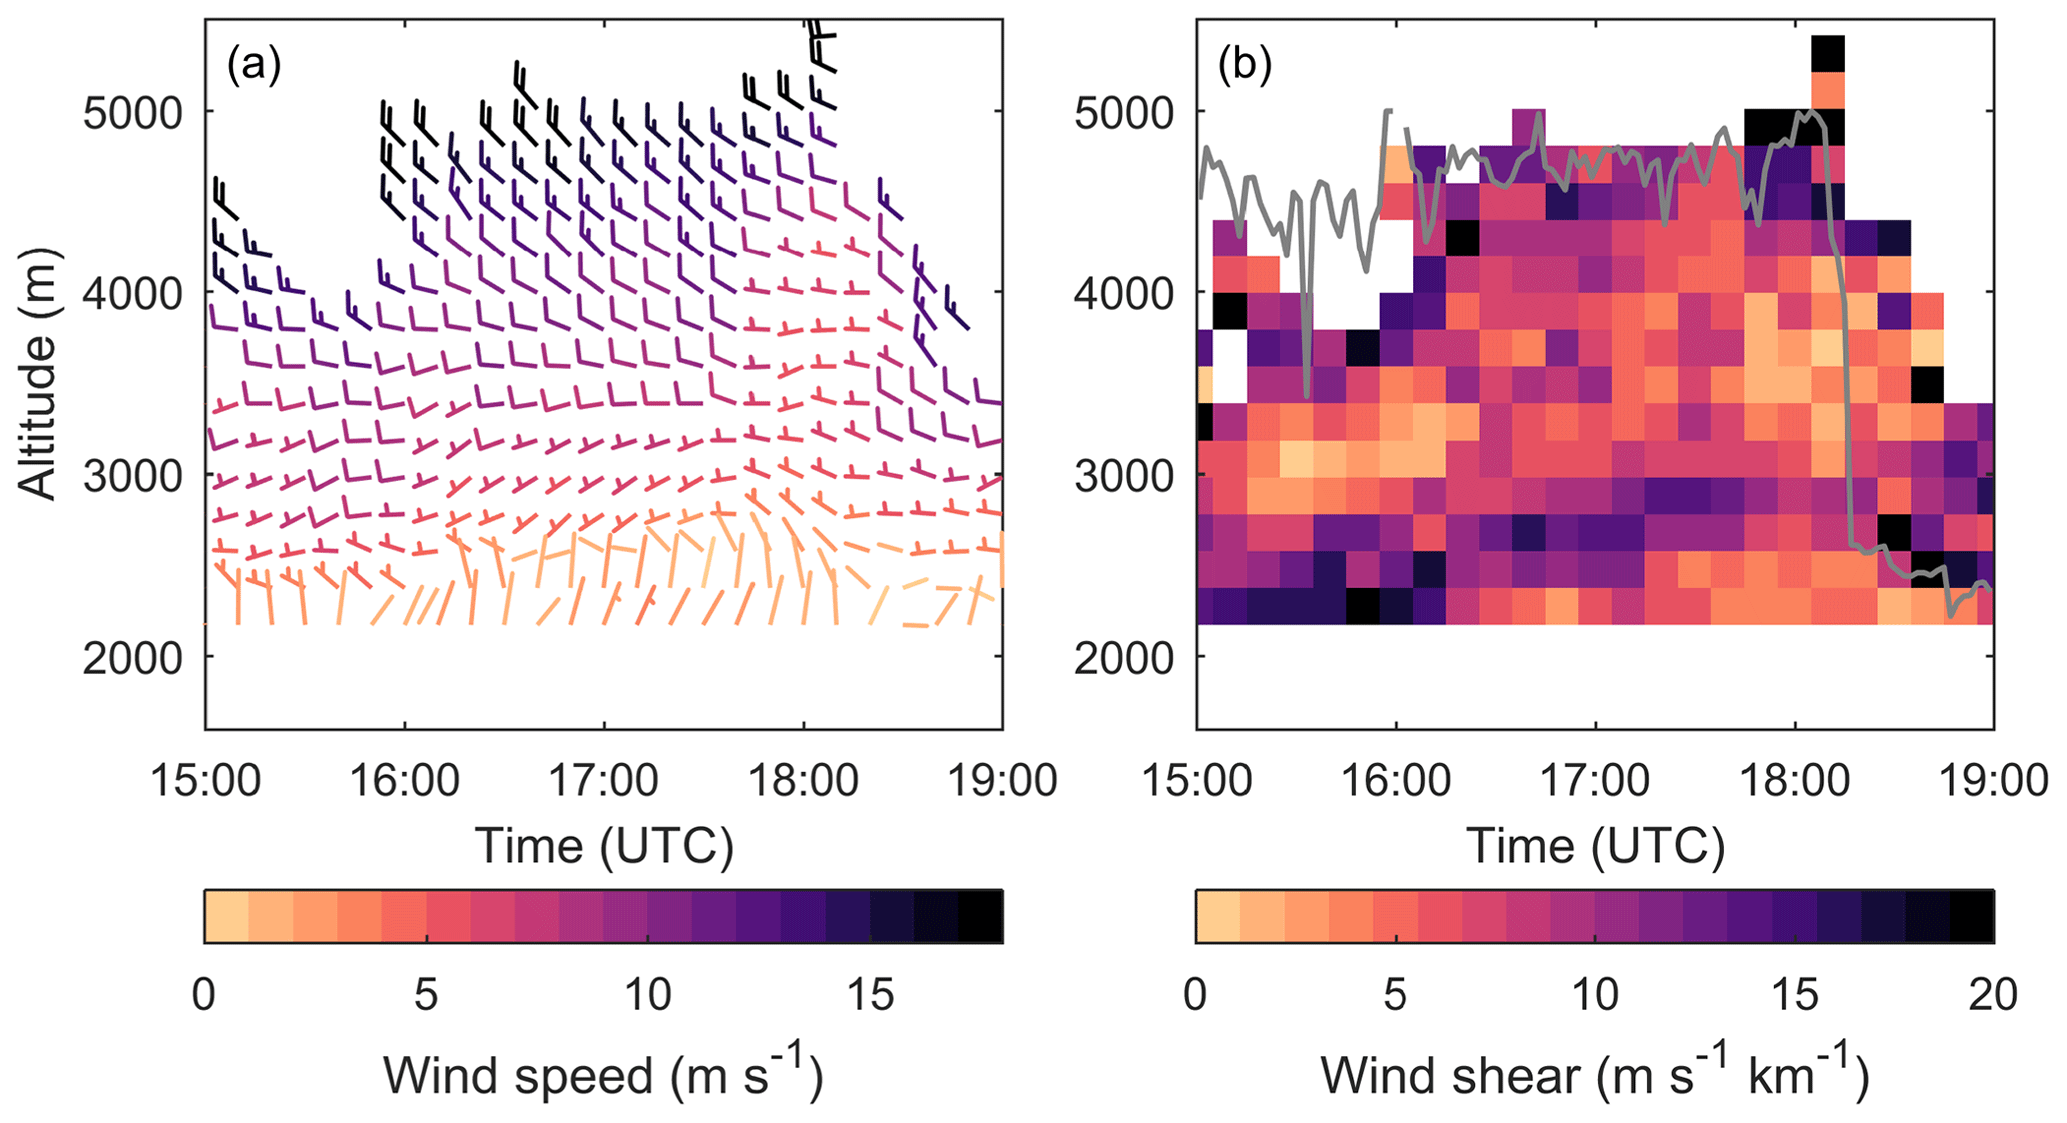
Figure 3Observations of the wind speed and wind direction (a) and of the wind shear (b) measured by the radar wind profiler located at Wolfgang. The vertical wind shear (s) was calculated from the wind profiler observations, considering changes in the scalar wind speed and direction (u) between two adjacent height levels (z) . The gray line in (b) shows the cloud radar reflectivity contour of −30 dBZ, which indicates the cloud top height.
During the passage of the mixed-phase cloud system, the temperature at Davos decreased from 3 to −2 ∘C ( ∘C), and the temperature at Weissfluhjoch decreased from −5 to −7.5 ∘C ( ∘C). The vertical temperature profile of a radiosonde ascent is shown in Fig. 2b. The radiosonde was launched from Payerne, which is located around 200 km upstream of Davos. The temperatures measured at Davos, Gotschnagrat and Weissfluhjoch were slightly higher (1 to 2 ∘C) than the temperature measured by the radiosonde, but the observed lapse rate near Davos was in good agreement with the radiosonde profile measured at Payerne (see boxplots in Fig. 2b). A cloud top temperature of around −21 ∘C was estimated from the observed temperature profile, assuming the same temperature deviation as for the ground-based stations and a cloud top height of 4700 m (derived from the cloud radar observations averaged between 16:00 and 18:00 UTC).
The horizontal wind fields were measured with a radar wind profiler at Wolfgang (Fig. 3a). In agreement with the Payerne sounding, the wind profiler showed a large-scale wind direction from the west with a mean wind speed in the range of 10 to 15 m s−1 above 3000 m. Below 2400 m, the wind speed was lower (<5 m s−1), and the flow was coming from the northeast (confined by the Davos valley). This pattern in the low-level wind field can be explained by shielding effects due to the mountain barrier B1 located upstream of Wolfgang (Fig. 1b), resulting in a decoupled low-level flow in the lee of the mountain barrier.
A strong decrease in wind speed was observed above 2700 m between 17:45 UTC and 18:30 UTC. In addition, the wind direction veered from 250 to 280∘ during this time period. This change in the wind pattern coincides with the period of the strongest precipitation event at Wolfgang (Fig. 4e) and could potentially have contributed to the glaciation of the MPC (Sect. 4.1). Furthermore, enhanced wind shear was observed near cloud top (>10 m s−1 km−1) with a maximum of 20 m s−1 km−1 corresponding to the most intense precipitation peak (compare Fig. 3b with Fig. 4e). Another layer of enhanced wind shear was observed between 2500 and 3000 m due to the interaction of the large-scale flow with the mountain barrier B1 (Fig. 1).
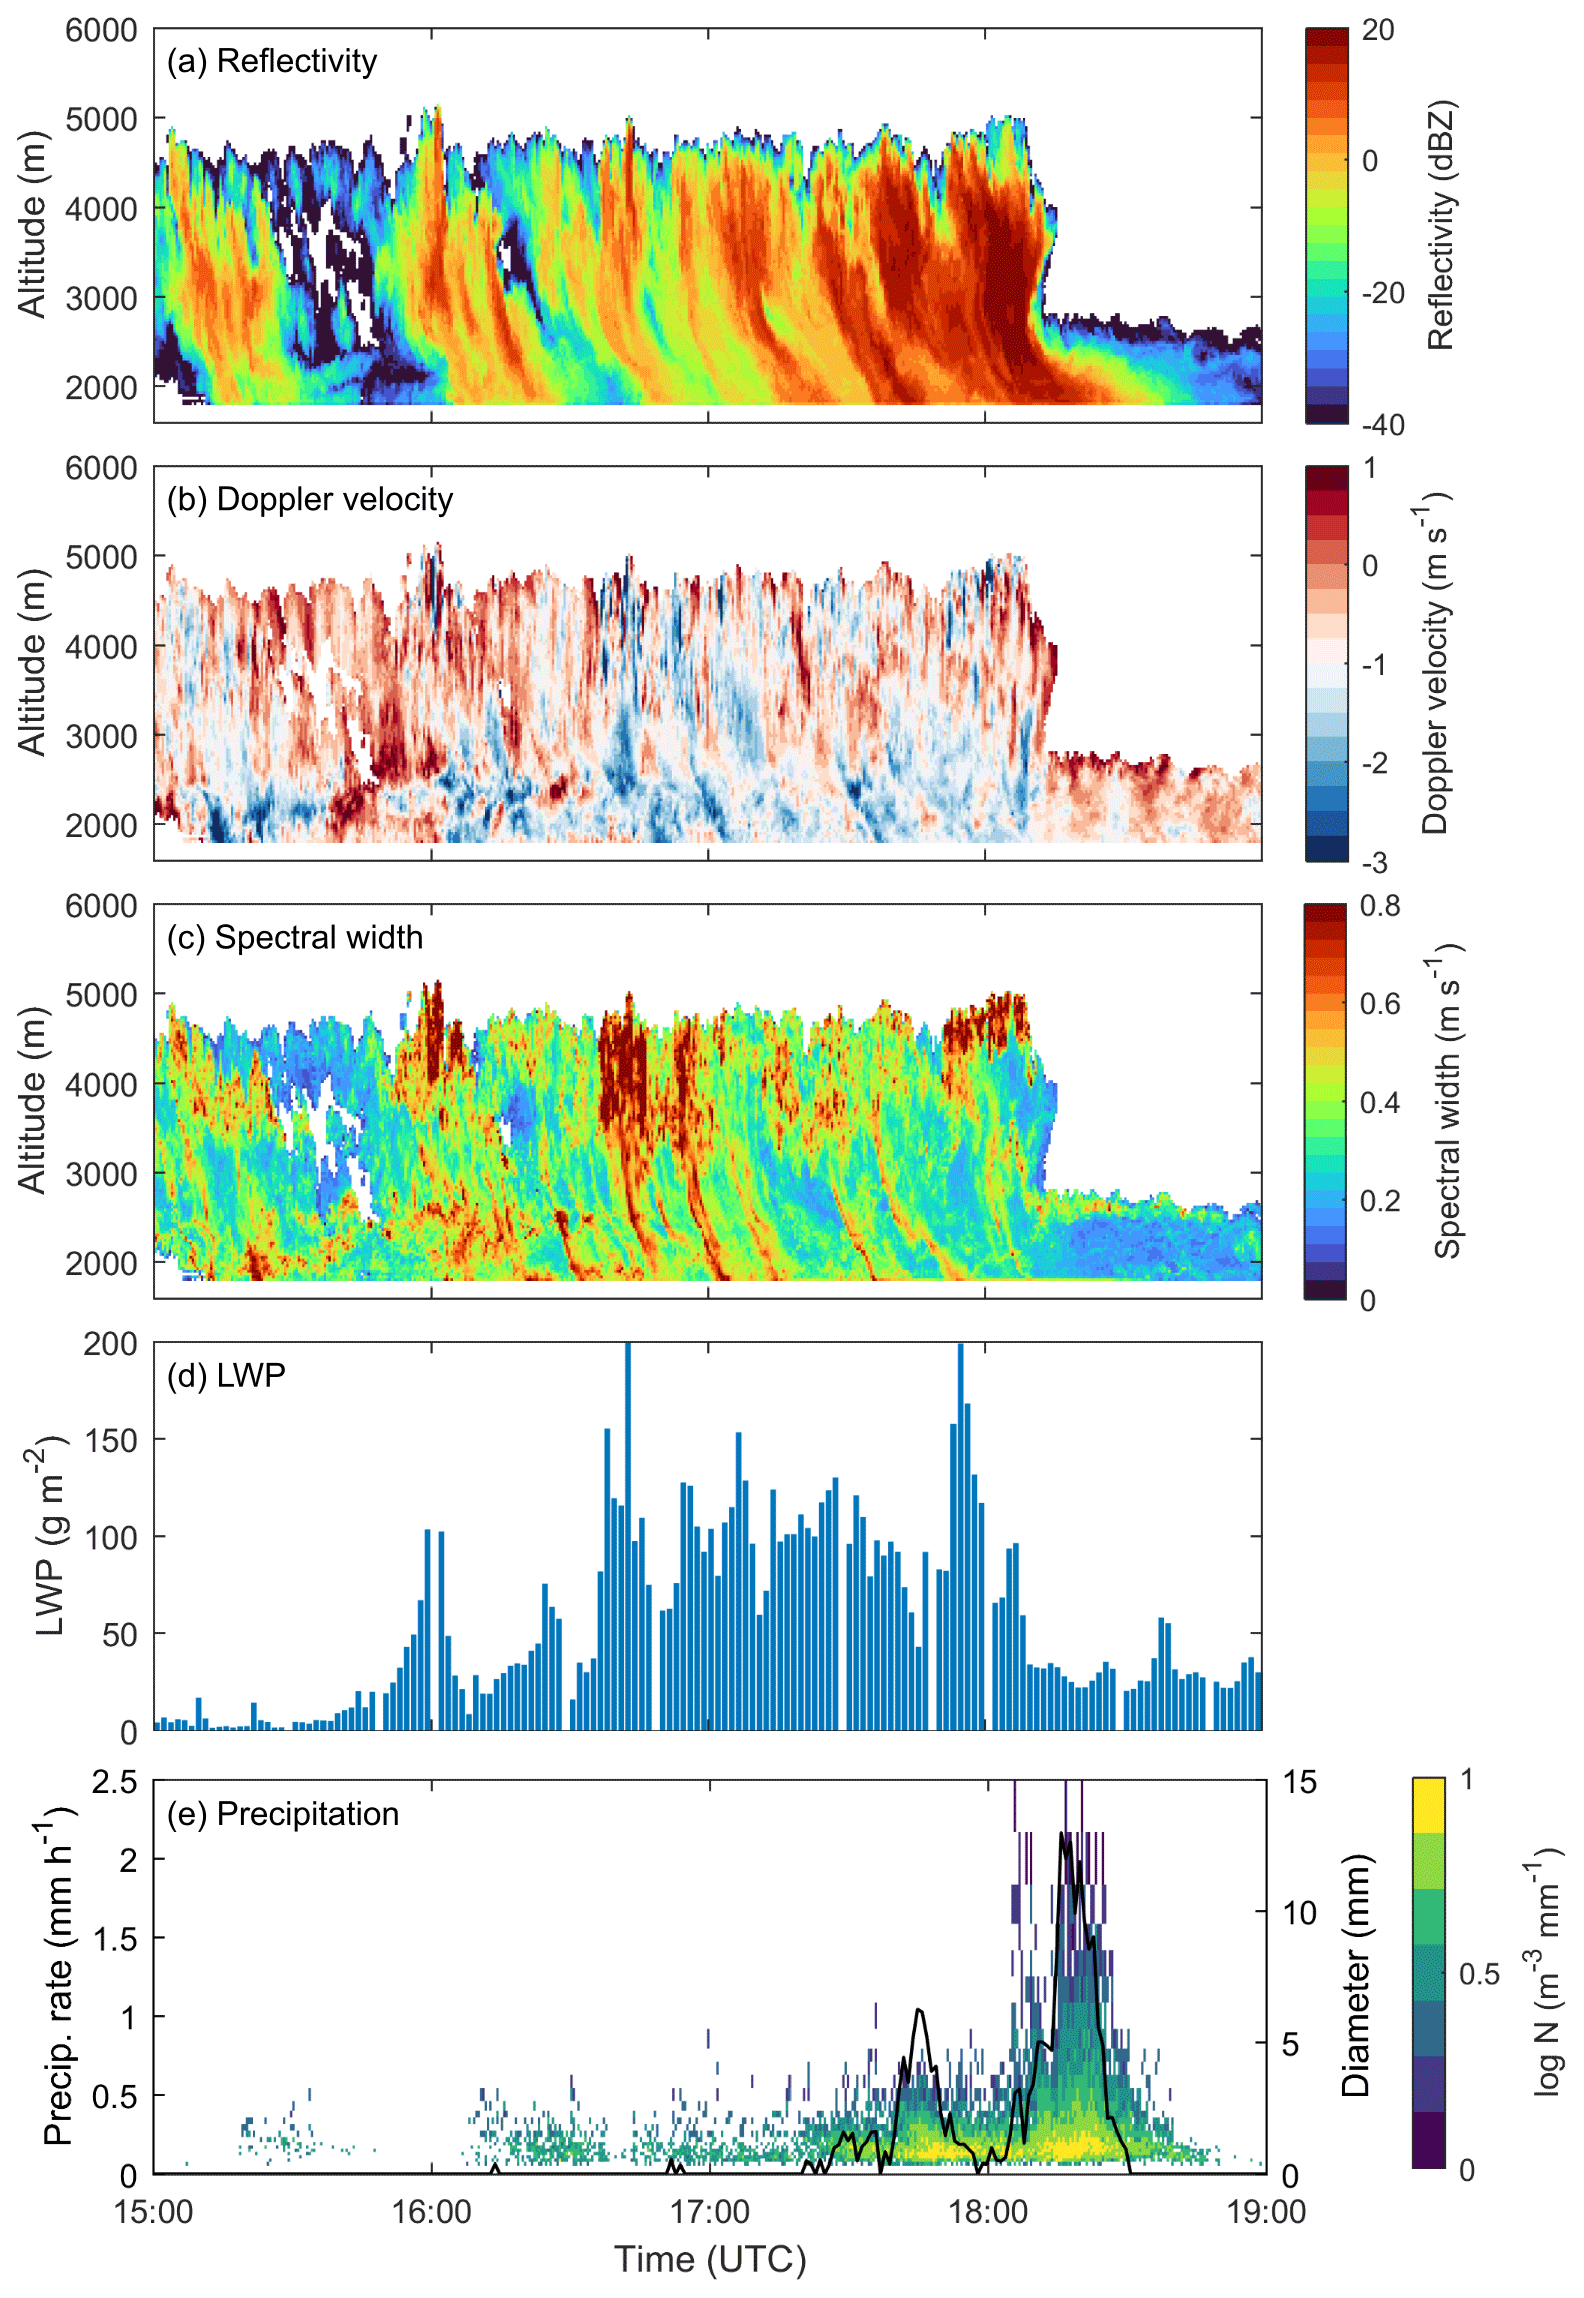
Figure 4Observations of the cloud structure measured by the cloud radar (a–c) and the microwave radiometer (d) at Wolfgang on 8 March 2019. The cloud radar observations show the radar reflectivity (a), Doppler velocity (b) and spectral width (c). Note that the color bar in (b) is centered at −1 m s−1 to approximately account for the hydrometeor fall speed. The column-integrated LWP measured by the microwave radiometer is shown in (d), and the precipitation measured by the disdrometer at Wolfgang (1630 m) is shown in panel (e).
4.1 Overview of the microphysical cloud structure
An overview of the observed microphysical cloud structure is shown in Fig. 4. The radar reflectivity shows that the precipitation began at 15:10 UTC and was convective in nature (Fig. 4a). At around 17:30 UTC, the reflectivity increased at all altitudes, and the highest precipitation rates were observed at the surface (Fig. 4e). The period of high reflectivity (>10 dBZ) lasted for about 1 h. After this period, the cloud top lowered from 5000 to 2800 m, and the precipitation ended shortly after 18:40 UTC. The bulk of the precipitation originated at cloud top, as can be seen from the fallstreak pattern of enhanced radar reflectivity (>10 dBZ; Fig. 4a). The contour frequency by altitude diagram (CFAD; Fig. 5) of the radar reflectivity (Fig. 5a) indicates a rapid increase in the radar reflectivity near cloud top, suggesting that the ice crystals were formed in the layer between 5000 and 4000 m. The ice crystals rapidly grew to large sizes between 4000 and 3000 m before they partly sublimated in the layer between 3000 and 2000 m, as indicated by the decreasing radar reflectivity (Figs. 4a and 5a) below 3000 m (assuming horizontal homogeneity). The majority of upward motion was observed above 3500 m (Figs. 4b and 5b). It is important to note that the measured vertical Doppler velocity is the sum of the particle fall speed and the air motion. Thus, as the ice particles grow to larger sizes while falling towards the ground, their fall speed increases and therefore masks the updrafts. The Doppler velocity CFAD shows large variations between −4 to 2 m s −1 near cloud top (Fig. 5b), indicative of turbulent motions. Indeed, the strong variability in the Doppler velocity was collocated with the enhanced shear layer from the wind profiler (Fig. 3b). Furthermore, the spectral width was also enhanced locally near cloud top (Fig. 4c), which can be attributed to the presence of turbulence (see Fig. 4b) near cloud top.
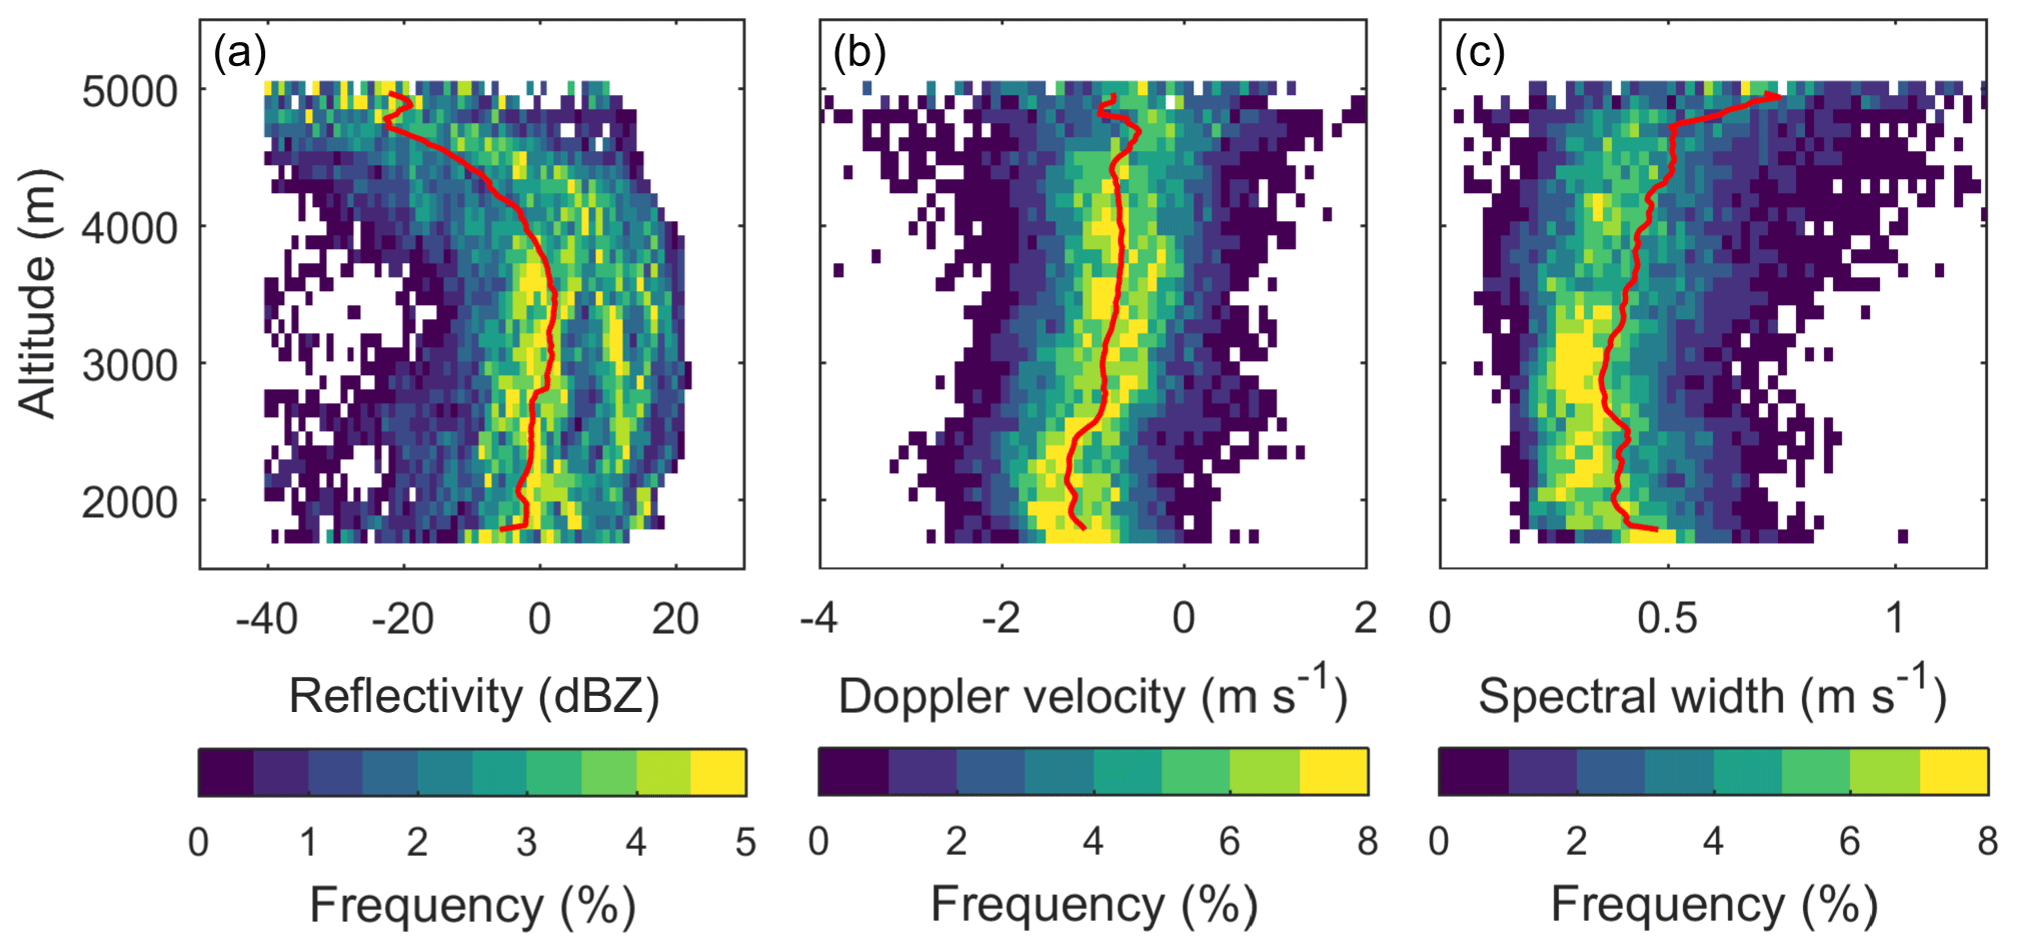
Figure 5CFADs of the radar reflectivity (a), Doppler velocity (b) and spectral width (c) for the time period between 15:50 and 18:20 UTC. The red line shows the mean vertical profile. The following bin sizes were applied: (1) radar reflectivity from −40 to 30 dBZ in 1 dBZ intervals, (2) Doppler velocity from −4 to 3 m s−1 in 0.1 m s−1 intervals and (3) spectral width from 0 to 1.2 m s−1 in 0.02 m s−1 intervals. A height interval of 100 m was used for all radar properties.
The occurrence of (1) high radar reflectivity fallstreaks (Fig. 4a), (2) positive Doppler velocities (Fig. 4b) and (3) increased spectral width (Fig. 4c) near cloud top suggests the presence of cloud top generating cells. Cloud top generating cells can enhance ice nucleation and growth and as such have important implications for precipitation formation (e.g., Houze et al., 1981; Hogan et al., 2002; Evans et al., 2005; Ikeda et al., 2007; Crosier et al., 2014; Kumjian et al., 2014; Plummer et al., 2014; Rosenow et al., 2014; Plummer et al., 2015; Rauber et al., 2015), as will be further discussed in Sect. 4.2.
Ice particles that formed within the seeder region interact with other cloud particles while falling through the cloud and thus influence the microphysics of the feeder region below. The low-level cloud structure was observed with the tethered balloon system HoloBalloon (see Fig. 6). The balloon-borne measurements indicate the presence of a low-level liquid layer that was confined to the lowest 300 m of the cloud (see Fig. 6).
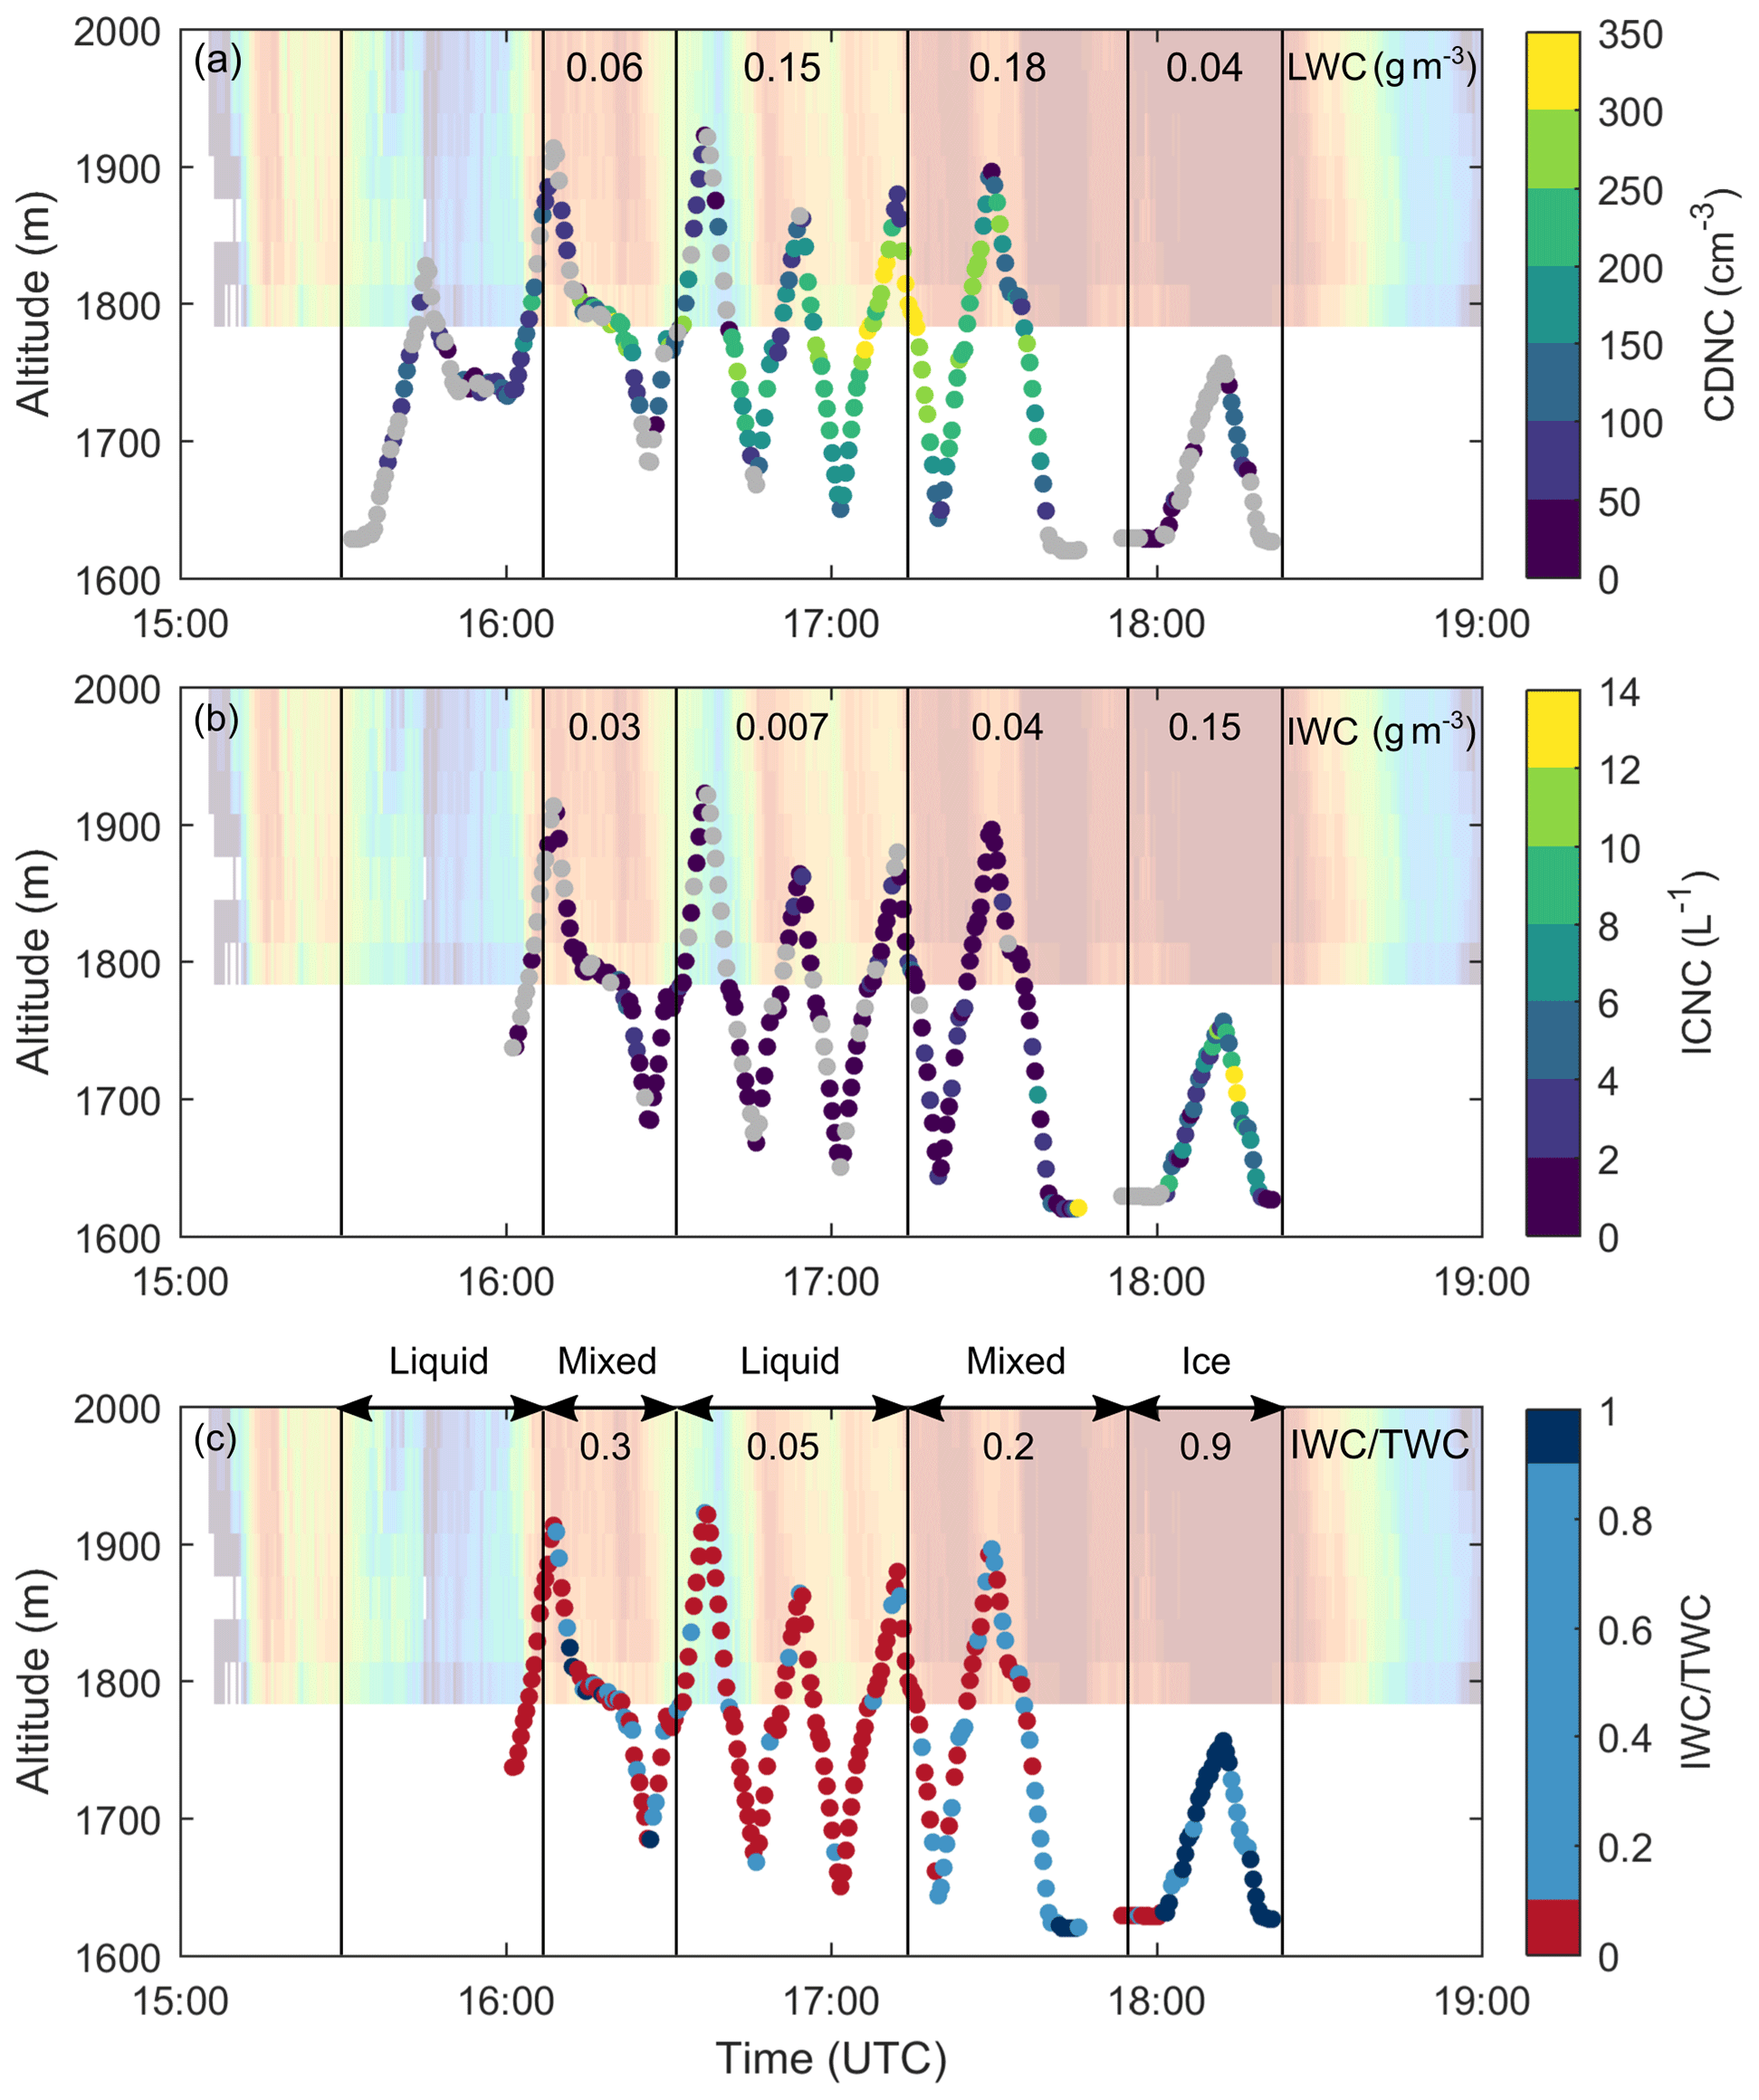
Figure 6Vertical in situ profiles of the CDNC (a), ICNC (b) and the IWC TWC ratio (c). The gray dots in (a) and (b) indicate measurement points which are associated with a liquid water content (LWC) of <0.01 g m−3 (for CDNC) or an IWC of 0 L−1 (for ICNC). In (c), red colors represent liquid cloud regions (IWC TWC < 0.1), light blue mixed-phase cloud regions (0.1 ≤ IWC TWC < 0.9) and dark blue ice cloud regions (IWC TWC ≥ 0.9). The cloud radar reflectivity is shown in the background. The numbers in (a), (b) and (c) indicate the mean LWC, IWC and IWC TWC ratio within the intervals defined by the black vertical lines.
The cloud droplet number concentration (CDNC) increased from 100 to 350 cm−3 between 16:00 and 17:45 UTC (Fig. 6a) before the CDNC decreased after 18:00 UTC. The mean cloud droplet diameter ranged between 8 and 12 µm, as shown by the size distribution in Fig. 7a.
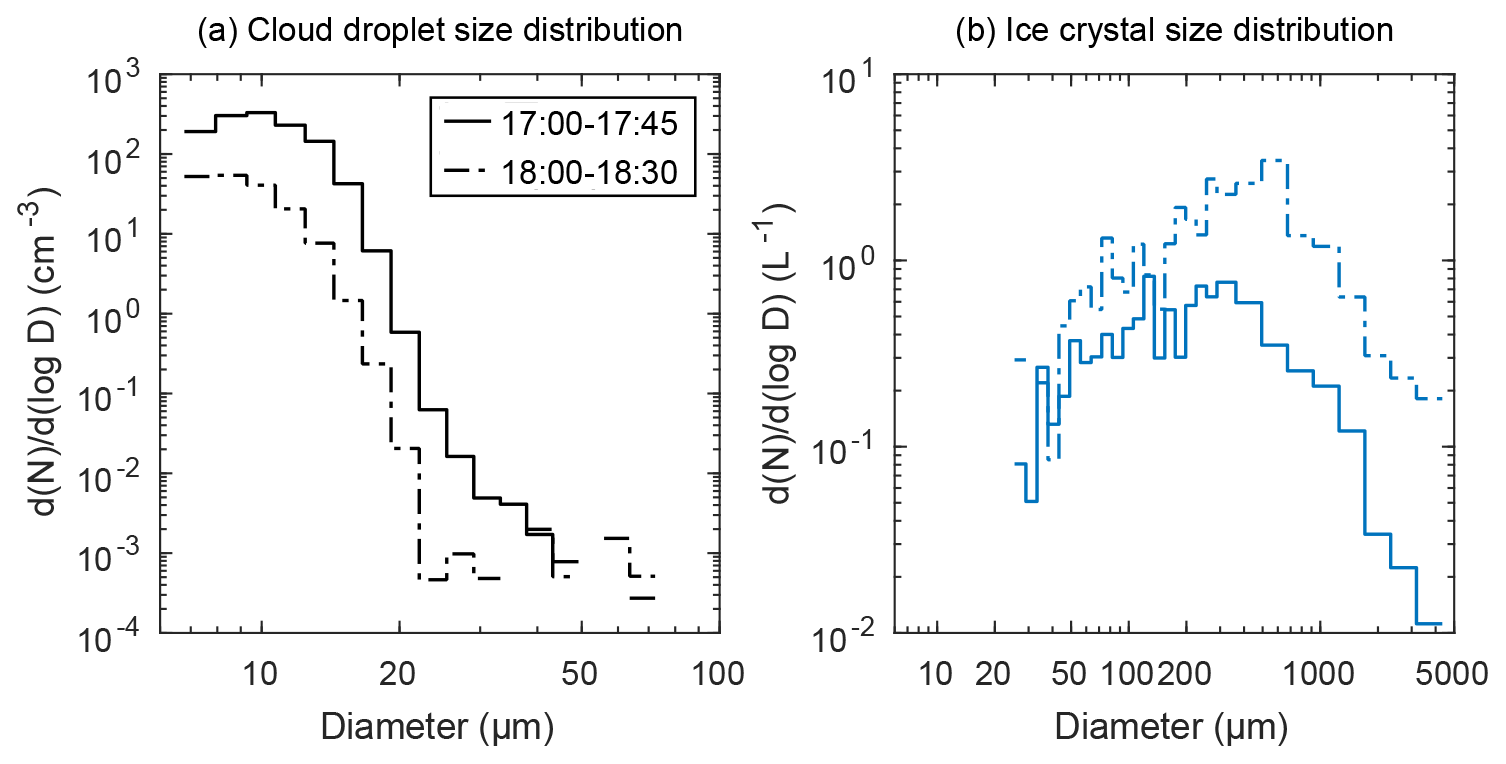
Figure 7Cloud droplet (a) and ice crystal (b) size distributions observed with the HoloBalloon platform. The size distributions were averaged between 17:00 and 17:45 UTC (solid line) and between 18:00 and 18:30 UTC (dashed line).
The ICNC was in the range of 1 to 4 L−1 between 16:00 and 18:00 UTC (Fig. 6b). ICNCs were higher when fallstreaks of enhanced radar reflectivity reached the surface. During the main precipitation event, after 18:00 UTC, the ICNC increased up to 14 L−1. During the same time period, the ratio between the ice water content (IWC) and total water content (TWC), which is often used to characterize the cloud phase (e.g., Korolev et al., 2003; Lohmann et al., 2016a), increased from 0.05 to 0.3 (liquid to mixed phase) to 0.9 (ice phase). Thus, a transition from a mixed-phase low-level cloud (before 18:00 UTC) to an ice-dominated low-level cloud (after 18:00 UTC) was observed during the passage of the cloud system (Fig. 6c). The cloud radar and microwave radiometer observations suggest that the entire cloud layer glaciated as an increase in the radar reflectivity (Fig. 4a) and a decrease in the LWP (Fig. 4d) was observed after 18:00 UTC. In the absence of sufficiently large updraft velocities for additional cloud droplet activation, the presence of large ice particles or high ICNC can lead to rapid glaciation of the cloud by the WBF process (Korolev and Isaac, 2003).
Even though downward motions were present on the lee side of the mountain barrier (see increased fraction of negative Doppler velocities in Fig. 5b) which contributed to hydrometeor evaporation/sublimation (see decreased reflectivity in Fig. 5a), a persistent low-level liquid layer was observed at Wolfgang. We suggest that this shallow low-level feeder cloud formed due to orographic lifting as the low-level flow in the lee of the mountain barrier was decoupled from the large-scale flow (Fig. 3a) and was forced to rise from Klosters (1200 m) to Wolfgang (1630 m) over the local topography. Similarly, in another case study of the RACLETS campaign, we found that the interaction between local flow effects and topography can induce the formation of updrafts and low-level feeder clouds (Ramelli et al., 2021). It is assumed that this shallow cloud could not generate significant precipitation by itself due to the limited time available for the collision and coalescence of cloud droplets to produce precipitation-sized particles and due to the high temperatures ( ∘C) which were limiting the amount of INPs and thus ice formed through primary ice nucleation. However, the hydrometeors that formed in the generating cells can “feed” on the low-level liquid layer and thus enhance precipitation by riming and depositional growth. Additionally, it can provide an environment favorable for the production of secondary ice particles, as will be discussed in Sect. 4.3.
4.2 The origin and growth of ice crystals in cloud top generating cells
Observations from the cloud radar, microwave radiometer, HoloBalloon platform and ground-based aerosol measurements were combined to study the microphysics within cloud top generating cells. Since no in situ observations within generating cells or near cloud top were available during the RACLETS campaign, the analysis of the microphysics was limited to observations from remote sensing instrumentation and balloon-borne in situ measurements near cloud base. In the first part of this section, the overall dynamical and microphysical structure of generating cells is characterized, whereas in the second part the origin of ice crystals and the microphysical growth processes active within generating cells are investigated from an INP-cloud perspective.
When the strongest generating cells were present, vertical overshooting of up to 500 m was observed at the cloud top (Fig. 8; e.g., at 16:00 and 16:45 UTC), indicating the presence of strong updrafts.

Figure 8Time series of the radar reflectivity (a), maximum Doppler velocity (b) and number of peaks (c). The black line in panel (a) shows the 17:00 UTC fallstreak, and the dashed lines indicate the regions inside (GCin) and outside (GCout) of the 17:00 UTC fallstreak which were used for the analysis in Fig. 9. The maximum Doppler velocity was derived from the Doppler spectra (see Appendix A). The number of peaks were obtained from the peakTree analysis (see Sect. 2.3.2). The evolution of the cloud top anomalies is shown in (d). The radar reflectivity (blue line) and spectral width (red line) were averaged over 600 m from the cloud top. The anomalies were normalized to the mean value, which is indicated in panel (d). The results of the Spearman's rank correlation are shown to the right of panel (d), with ρ indicating the correlation coefficient and pv the p value of the Spearman's rank correlation.
This was also supported by observations of the maximum Doppler velocity (Fig. 8b), which was derived from the Doppler spectra (see Appendix A) and used as a proxy to identify updraft regions. The maximum Doppler velocity suggests that the strongest updrafts were present in the core regions of the cloud top generating cells (>3 m s−1), whereas updrafts were weaker outside of the generating cells and at altitudes below 3000 m (Fig. 8b). It is likely that liquid water was produced in these updraft cells as a positive correlation was found between the vertically integrated maximum Doppler velocity and the LWP measured by the microwave radiometer (see Fig. A1b). Moreover, anomalies in the cloud top properties and the LWP were observed during the periods with generating cells (Fig. 8d). Coinciding peaks in the anomaly signal were labeled as GC1 (16:00 UTC), GC2 (16:45 UTC) and GC3 (17:55 UTC). The Spearman's rank correlation coefficients of the anomalies ranged between 0.46 (for reflectivity and spectral width) and 0.73 (for reflectivity and LWP), significant at the 5 % level. Thus, given the significant correlation between updrafts, LWP and radar reflectivity within generating cells, it is likely that the updrafts acted as a major driver for the formation and maintenance of generating cells by providing a continuous source of liquid water and thereby enhancing ice nucleation and growth through immersion freezing, subsequent vapor deposition and riming.
To further explore the microphysics within cloud top generating cells, the Doppler spectra along the 17:00 UTC fallstreak were investigated (Fig. 9). This approach allows us to obtain a continuous picture of the evolution of the particle populations along the fallstreak and to draw conclusions regarding the microphysical processes active. Previous studies used the Doppler spectra information for the classification and characterization of ice particle shape and particle populations (e.g., Myagkov et al., 2016; Bühl et al., 2016).
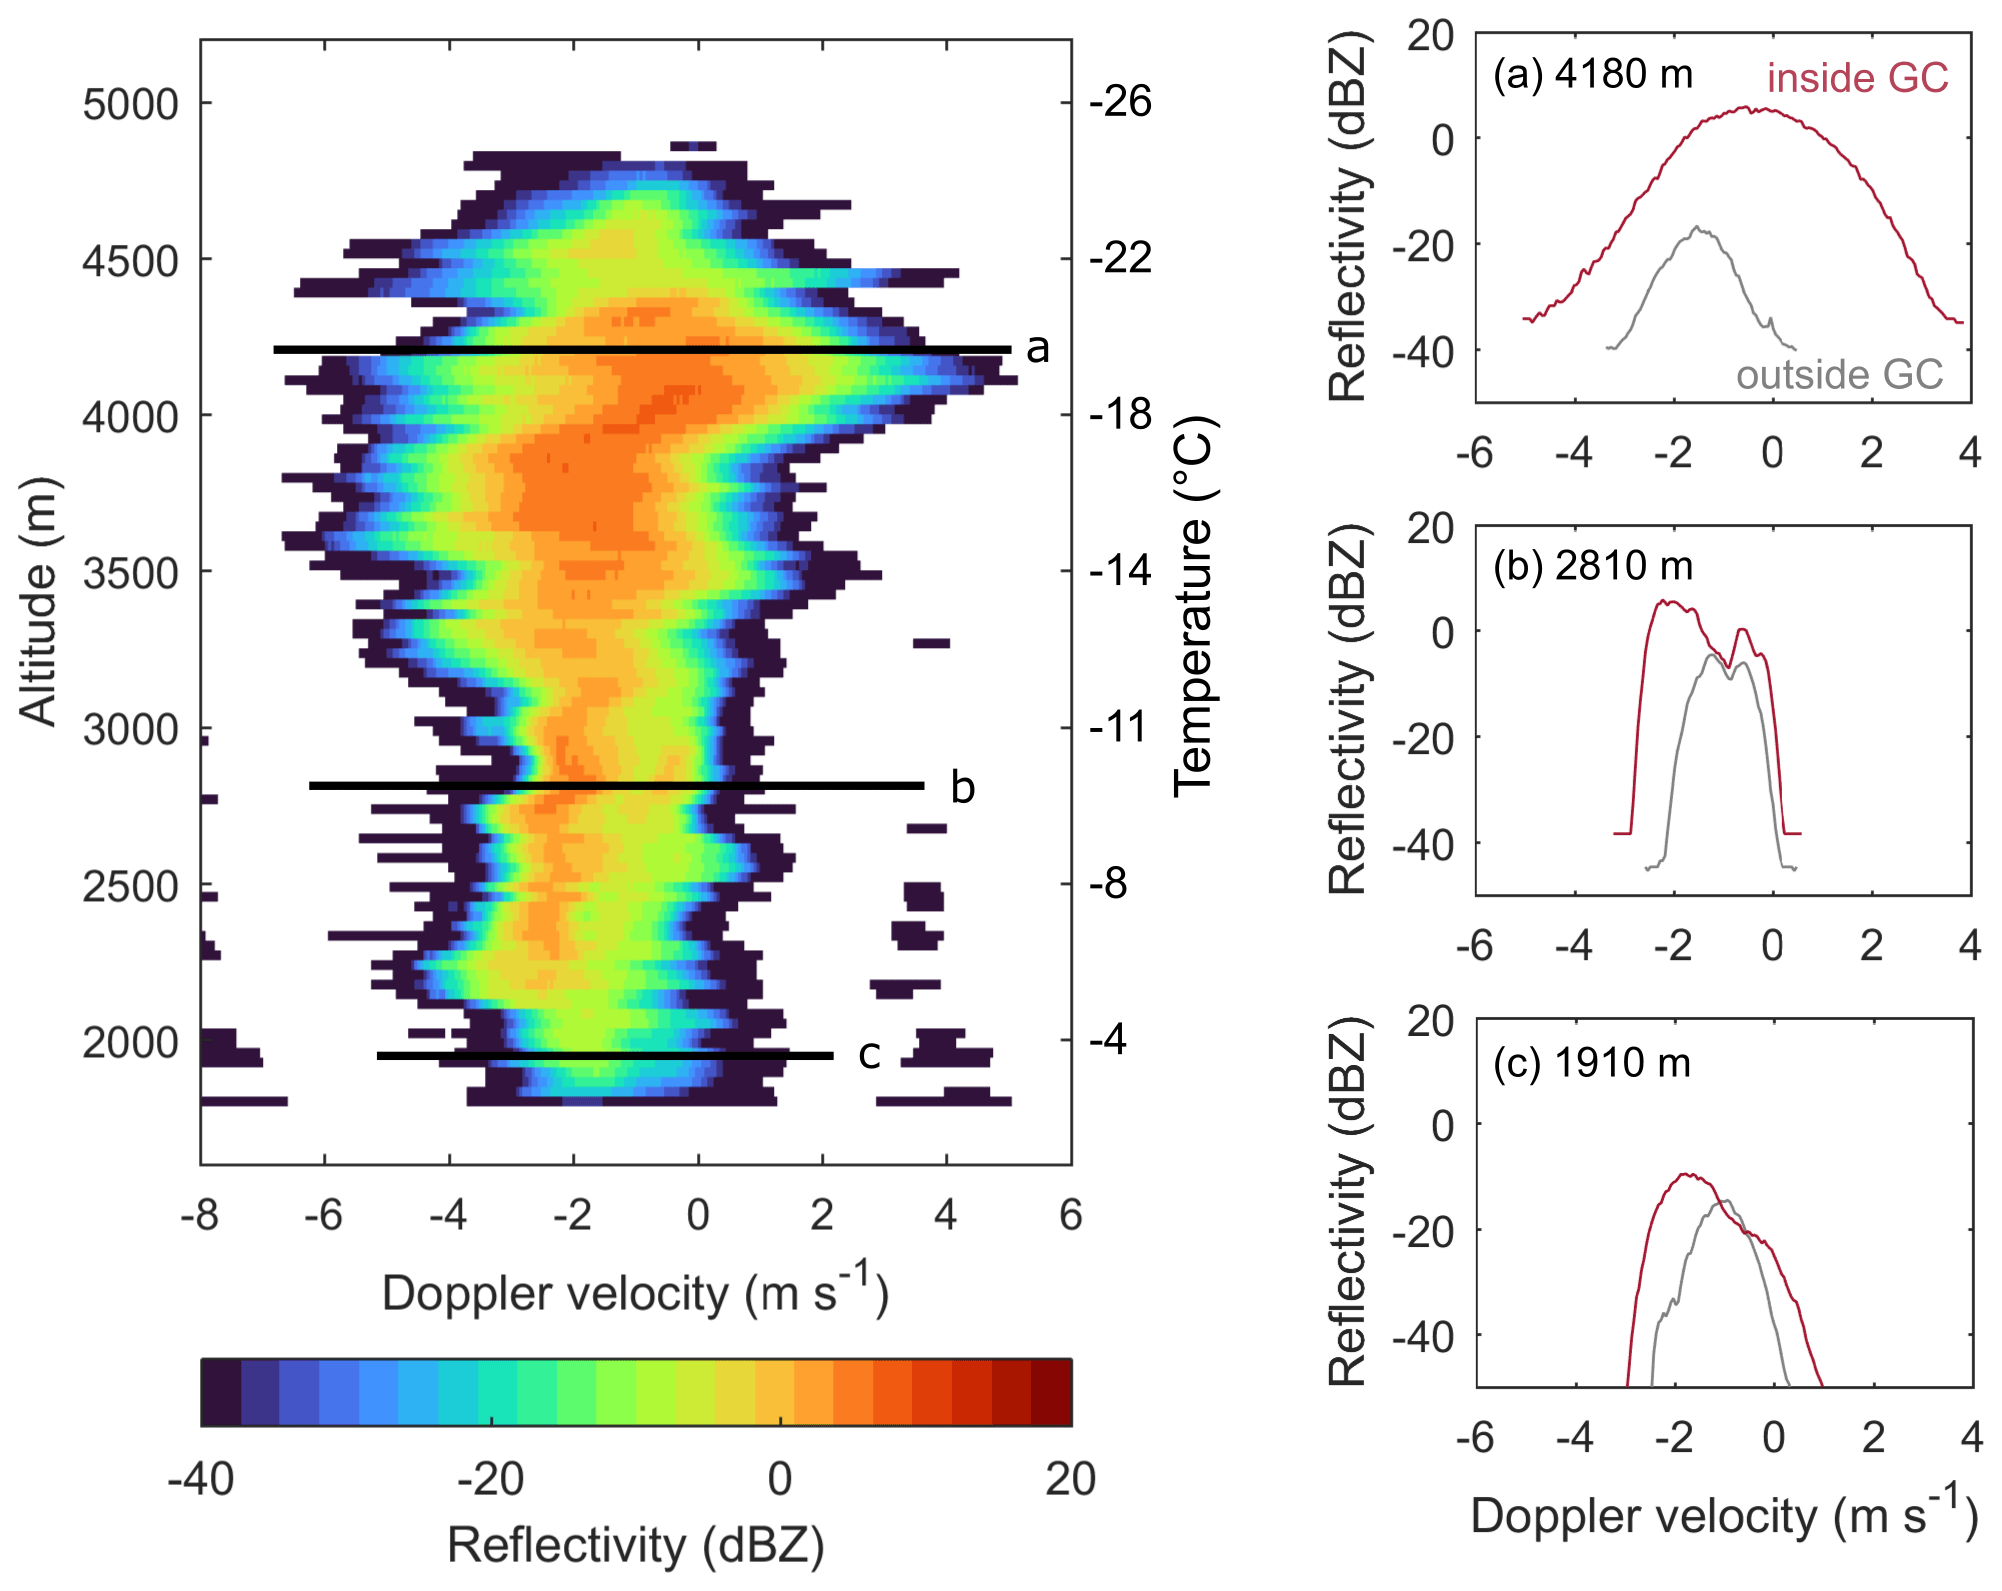
Figure 9Vertical profile of the Doppler spectra along the 17:00 UTC fallstreak averaged over 1 min (indicated by black line in Fig. 8a). The Doppler spectra at three selected heights are shown on the right: 4180 m (within turbulent layer), 2810 m (at mountain barrier height) and 1910 m (at balloon flight height). The red line indicates the Doppler spectrum inside the 17:00 UTC fallstreak (GCin), whereas the gray spectrum was measured before the fallstreak (GCout in Fig. 8a).
The vertical profile of the Doppler spectra shows a broad particle distribution spanning from −5 to 4 m s−1 between 3300 and 5000 m height, indicative of a turbulent layer. This layer likely marked the extent of the generating cell where ice crystals were produced and initial growth occurred. The Doppler spectra show a spectral bimodality below 3300 m (Fig. 9; i.e., presence of multiple particle populations with different fall speeds) which extends down to the surface. When analyzing the Doppler spectra of the full period with the peakTree technique (Sect. 2.3.2), multi-peaked situations become evident at the leading edges of the fallstreaks (Fig. 8c). For example, the Doppler spectrum in Fig. 9b (red line) indicates the presence of two particle populations: a fast falling one (−2 m s−1) and a slow falling one (−0.5 m s−1). The LDR of the slower falling particle population was slightly higher (−25 dB; not shown) compared to the faster-falling population (−28 dB; not shown). These LDR values are characteristic for oblate or plate-like particles (Myagkov et al., 2016). The observed Doppler spectra and the ice habits observed near cloud base (Fig. 13) suggest that the faster falling population represents heavily rimed ice particles and/or graupel, whereas the slower falling population was associated with stellar dendrites. This is also consistent with the observed temperature (dendrite regime; Magono and Lee, 1966; Bailey and Hallett, 2009) and the presence of supercooled liquid (riming) within the generating cells. It is likely that these two particle populations were already present above but only separated below the turbulent layer due to the weaker updrafts and their difference in fall speed.
In the following, we will further investigate the origin of ice particles that formed within generating cells. Numerous studies have observed enhanced ice formation and growth in these updraft regions (Houze et al., 1981; Hogan et al., 2002; Plummer et al., 2014; Ikeda et al., 2007; Crosier et al., 2014; Kumjian et al., 2014; Rauber et al., 2015). For example, Plummer et al. (2014) found that the ICNC was enhanced by a factor of 2 to 3 within the core region of generating cells compared to the region between the cells. While most of the studies agree that radiative cooling is a major driver for the formation and maintenance of cloud top generating cells, less research has focused on the reason for the enhanced ICNCs that were observed within these cells. Here we provide potential reasons from an INP-cloud perspective and propose possible mechanisms by considering the measured INP concentrations and cloud base observations of the ICNC and ice particle size.
INP concentrations were measured at the valley site of Wolfgang (1630 m) and at the mountaintop station of Weissfluhjoch (2700 m) (Fig. 10).
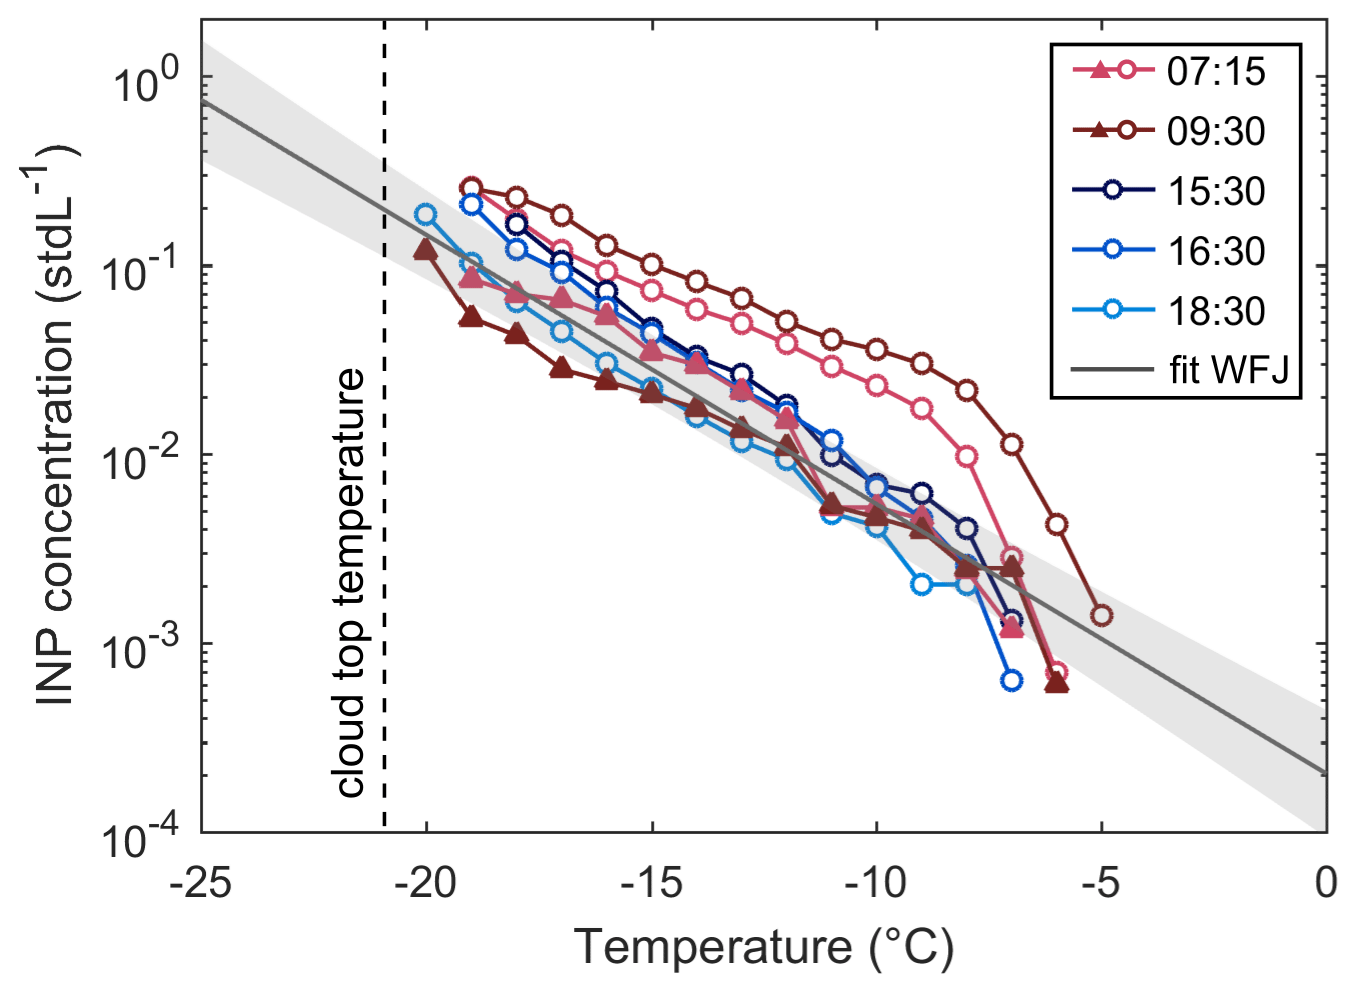
Figure 10INP concentrations measured at Wolfgang (1630 m, circle) and Weissfluhjoch (2700 m, triangle) for different temperatures and times, as indicated in the legend. The cloud top temperature of −21 ∘C is shown by the vertical dashed line. The dark gray line is a fit to the INP concentrations measured at Weissfluhjoch at temperatures between −9 and −17 ∘C (pre-cloud INP conditions). The gray shaded area shows the 95 % confidence interval of the fit which was used as an estimate of the upper and lower bounds of the INP concentration (see Fig. 11).
The observed INP concentrations at a given temperature spanned over 1 order of magnitude. The INP concentration measured at 07:15 and 09:30 UTC was a factor of 3–10 higher at Wolfgang compared to Weissfluhjoch, which was presumably a consequence of the decoupled low-level flow (see Fig. 3a) and thus the sampling of different air masses. Based on the INP measurements at Weissfluhjoch, an INP concentration of 0.27 L−1 (0.15 to 0.48 L−1) was extrapolated at cloud top (Fig. 10). It is important to note that the cloud top INP concentration was estimated from the Weissfluhjoch measurements in the morning (i.e., representative for pre-cloud INP concentrations) as no INP concentrations were measured at Weissfluhjoch during the passage of the cloud system.
Additionally, cloud measurements were conducted by the HoloBalloon platform near cloud base. Since no in situ observations were available within the generating cells, assumptions regarding the upper-level cloud properties were required. We assumed that the largest ice particles (>400 µm; derived from particle size distribution in Fig. 7b) formed near cloud top and grew to these large sizes while falling to the surface. This criterion is based on the assumption that the large ice particles did not sublimate completely prior to reaching the surface. The ICNC>400 µm observed near cloud base was in the same order of magnitude as the radar-retrieved ICNC at cloud top (red dots in Fig. 11). This observation further supports the assumption that ice particles larger than 400 µm originated near cloud top.
The comparison between the observed ICNC>400 µm and the estimated INP concentration at cloud top shows a discrepancy between the INP concentration and observed ICNC during certain time periods (Fig. 11). This suggests that the observed ICNC cannot be solely explained by primary ice nucleation, but that other mechanisms were active.
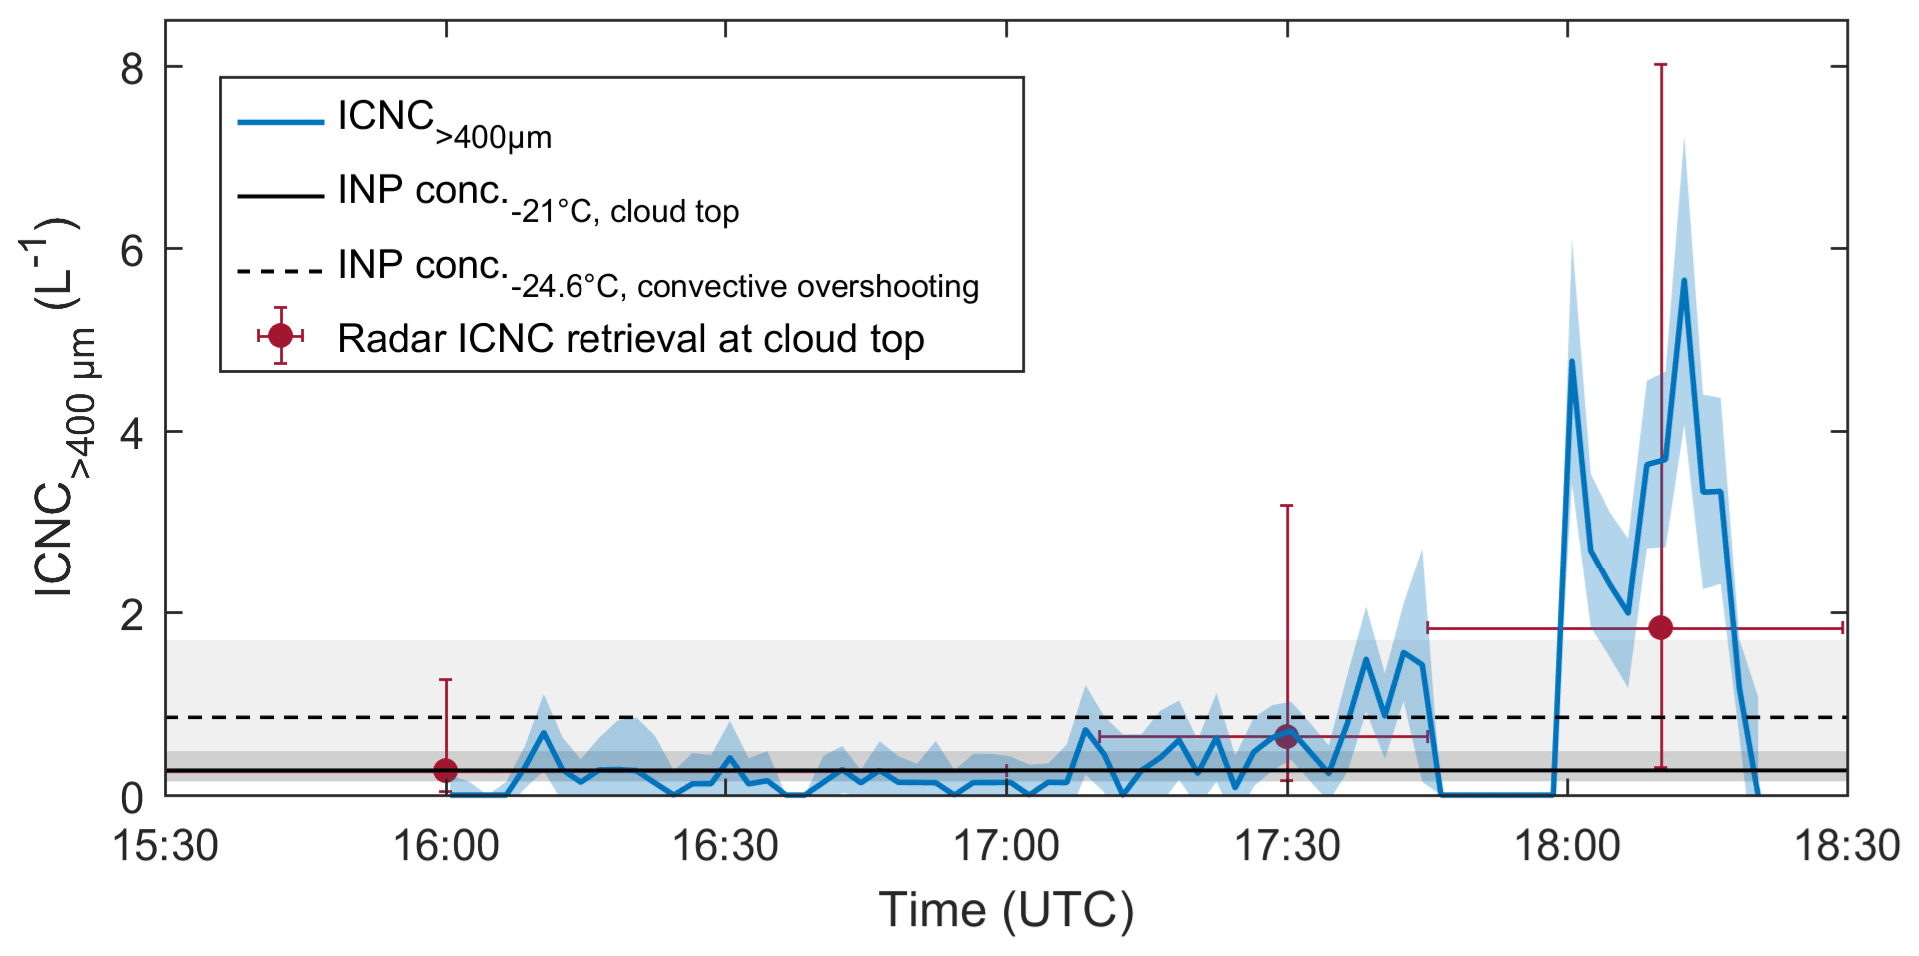
Figure 11Time series of the ICNC>400 µm (blue line) measured near cloud base by the HoloBalloon platform. Ice particles larger than 400 µm in diameter were assumed to have formed near cloud top. The blue shaded area indicates the uncertainty of the ICNC. No measurements were available between 17:50 and 18:00 UTC. The estimated INP concentrations extrapolated to −21 ∘C (cloud top, solid line) and to −24.6 ∘C (convective overshooting, dashed line) are indicated by the black horizontal lines. The gray shaded areas show the upper and lower bounds of the estimated cloud top INP concentration (dark gray) and of the estimated INP concentration at −24.6 ∘C (light gray) (estimated from the 95 % confidence interval of the fit in Fig. 10). The cloud top ICNCs retrieved from the radar observations (Sect. 2.3.1) are shown by the red dots. The reported ICNCs represent an average over the top 10 range gates (300 m from cloud top) for three different time periods (14:30–17:00 UTC, 17:10–17:45 UTC, 17:45–18:30 UTC). The vertical red lines indicate the error in the retrieved ICNC, whereas the horizontal red lines mark the extent of the time periods.
Static instability driven by cloud top radiative cooling can produce strong updrafts (Fig. 8b) and lead to convective overshooting of cloud top generating cells (see red arrows in Fig. 8a). This convective overshooting can decrease the cloud top temperature and therefore increase the ICNC formed by primary ice nucleation. For example, the cloud top height during GC1 increased by 500 m from 4500 to 5000 m. Considering the observed temperature profile in Fig. 2b, the cloud top temperature decreased by 3.6 ∘C from −21 ∘C (at the average cloud top height) to −24.6 ∘C (at 5000 m) upon convective overshooting. Consequently, the estimated INP concentration increased by a factor of 3.1 from 0.27 L−1 (0.15 to 0.48 L−1) to 0.85 L−1 (0.42 to 1.7 L−1) (Fig. 10) due to the lower cloud top temperature. The ICNC>400 µm measured at cloud base lied below or near the extrapolated INP concentration at −24.6 ∘C before 18:00 UTC (Fig. 11). This suggests that the observed ICNC>400 µm before 18:00 UTC can be solely explained by primary ice nucleation and convective overshooting. After 18:00 UTC, the ICNC>400 µm measured near cloud base lied several factors above the convective overshooting line (Fig. 11), suggesting that other processes were occurring.
For example, the positive feedback between supercooled liquid water, radiative cooling and turbulence that has been observed near cloud tops (e.g., Morrison et al., 2012) might have contributed to enhanced ice formation. The presence of supercooled liquid can lead to strong longwave radiative cooling (e.g., Possner et al., 2017). This radiative cooling decreases the stability near cloud top, which causes turbulent motions that in turn can produce further supercooled liquid water. The magnitude of the longwave radiative cooling strongly depends on the cloud phase, the liquid water content (LWC) and particle size distribution, among other factors (e.g., Turner et al., 2018). Indeed, the LWP, as measured by the microwave radiometer, was enhanced within generating cells (see Fig. 8d) and thus likely increased the longwave radiative cooling at cloud top. The question is by how much the radiative cooling was enhanced within generating cells due to the increased cloud liquid water compared to their surrounding regions. Previous studies observed longwave radiative cooling rates in the range of 1 to 5 K h−1 near cloud top (e.g., Chen and Cotton, 1987; Pinto, 1998; Jiang et al., 2000; Rasmussen et al., 2002; Morrison et al., 2011; Morrison et al., 2012; Possner et al., 2017; Turner et al., 2018; Eirund et al., 2019). Additionally, Turner et al. (2018) computed radiative heating rate (RHR) profiles in the atmosphere as a function of cloud type and LWP by using an observational dataset. According to Turner et al. (2018), an increase in the LWP from 50 to 150 g m−2 (e.g., GC2 in Fig. 8) in MPCs can increase the longwave radiative cooling rate from around 1.7 to 2.9 K h−1 (ΔRHR = 1.2 K h−1). This could potentially cool the cloud top temperature by 0.3 K if a lifetime of 15 min is assumed for generating cells (i.e., 1.2 K h−1 × 15 min = 0.3 K) and increase the estimated INP concentration from 0.27 to 0.3 L−1 (a factor of 1.1; see Fig. 10). Thus, in the present case study, longwave radiative cooling only plays a minor role in enhancing primary ice nucleation. Nevertheless, longwave radiative cooling is of major importance for the production of radiatively driven turbulence near cloud top and thus for maintaining generating cells.

Figure 12Potential mechanisms that could enhance the ICNC in cloud top generating cells: convective overshooting (left), radiative cooling (center) and droplet shattering upon freezing (right). Their ice crystal enhancement factors for the present case study are estimated at the bottom and further discussed in Appendix B.
Other mechanisms must be active to explain the increased ICNCs after 18:00 UTC. For instance, the enhanced updrafts in generating cells allow for all hydrometeors to grow to larger sizes. It is unlikely that the larger cloud droplet size would significantly increase primary ice nucleation by immersion freezing, which is the dominant ice nucleation mechanism in MPCs (e.g., Ansmann et al., 2008; De Boer et al., 2011; Westbrook and Illingworth, 2011). However, it can play an important role for SIP. For example, the freezing of drizzle-sized droplets can release small secondary ice particles (e.g., Langham and Mason, 1958; Mason and Maybank, 1960; Lauber et al., 2018; Korolev and Leisner, 2020). This process is known as droplet shattering and has been observed to be strongly dependent on the cloud droplet size and to be potentially effective over a large temperature range (Keinert et al., 2020; Korolev and Leisner, 2020). Previous field studies have observed the presence of drizzle-sized droplets in the size range of 100 to 300 µm in regions of strong vertical updrafts (e.g., Hauf and Schröder, 2006; Ikeda et al., 2007; Lauber et al., 2021). Thus, droplet shattering could increase the ICNC in generating cells by several factors if supercooled drizzle drops are present in the updraft regions. However, in situ observations within generating cells would be necessary to further investigate this hypothesis.
In summary, the increased ICNC in generating cells can be the result of different mechanisms or a combination of several mechanisms. Three possible mechanisms have been proposed in this study, and their potential contributions are summarized in Fig. 12 and further discussed in Appendix B.
Firstly, primary ice nucleation in generating cells can be increased due to convective overshooting or radiative cooling. The ICNC observed before 18:00 UTC can likely be explained by these two mechanisms since the estimated INP concentration and the ICNC>400 µm measured near cloud base agreed within the same order of magnitude (Fig. 11). For the present study, we found that the ice crystal enhancement factor from convective overshooting (factor 2.2 to 5.2) was larger than that of radiative cooling (factor 1 to 1.4). On the other hand, the ICNC>400 µm after 18:00 UTC exceeded the estimated cloud top INP concentration by up to a factor of 8, suggesting that SIP processes such as droplet shattering might have been active within generating cells and contributed to the glaciation of the MPC. However, more targeted studies are necessary to understand which mechanisms are responsible for enhanced ice formation and growth within cloud top generating cells. In particular, in situ measurements of the cloud properties within generating cells and their environmental conditions (e.g., temperature, updrafts, INP conditions) are of major importance to address these questions.
4.3 Secondary ice production processes in feeder cloud
Ice crystals that formed in the seeder region can grow by microphysical interactions with other cloud particles while falling through the cloud layer and thus influence the microphysics of the entire cloud. For example, if large ice particles fall through a supercooled liquid layer, they can initiate the glaciation of the cloud layer through the WBF process and/or grow by riming. The total number of peaks in Fig. 8c shows multi-peaked situations below 3300 m, indicating the presence of multiple particle populations with different fall speeds. This suggests that secondary ice particles might be produced in the feeder region of the cloud. In the following, we investigate the importance of ice growth and SIP in the feeder region by analyzing the phase-resolved cloud properties measured in situ with the HoloBalloon platform. In particular, the analysis of the ice crystal habit and size can provide important information about the formation and growth history of ice particles.
Figure 13 shows a representative set of ice particle images observed by HOLIMO as a function of height and time. It can be seen that ice crystal habits varied greatly during the passage of the cloud system.
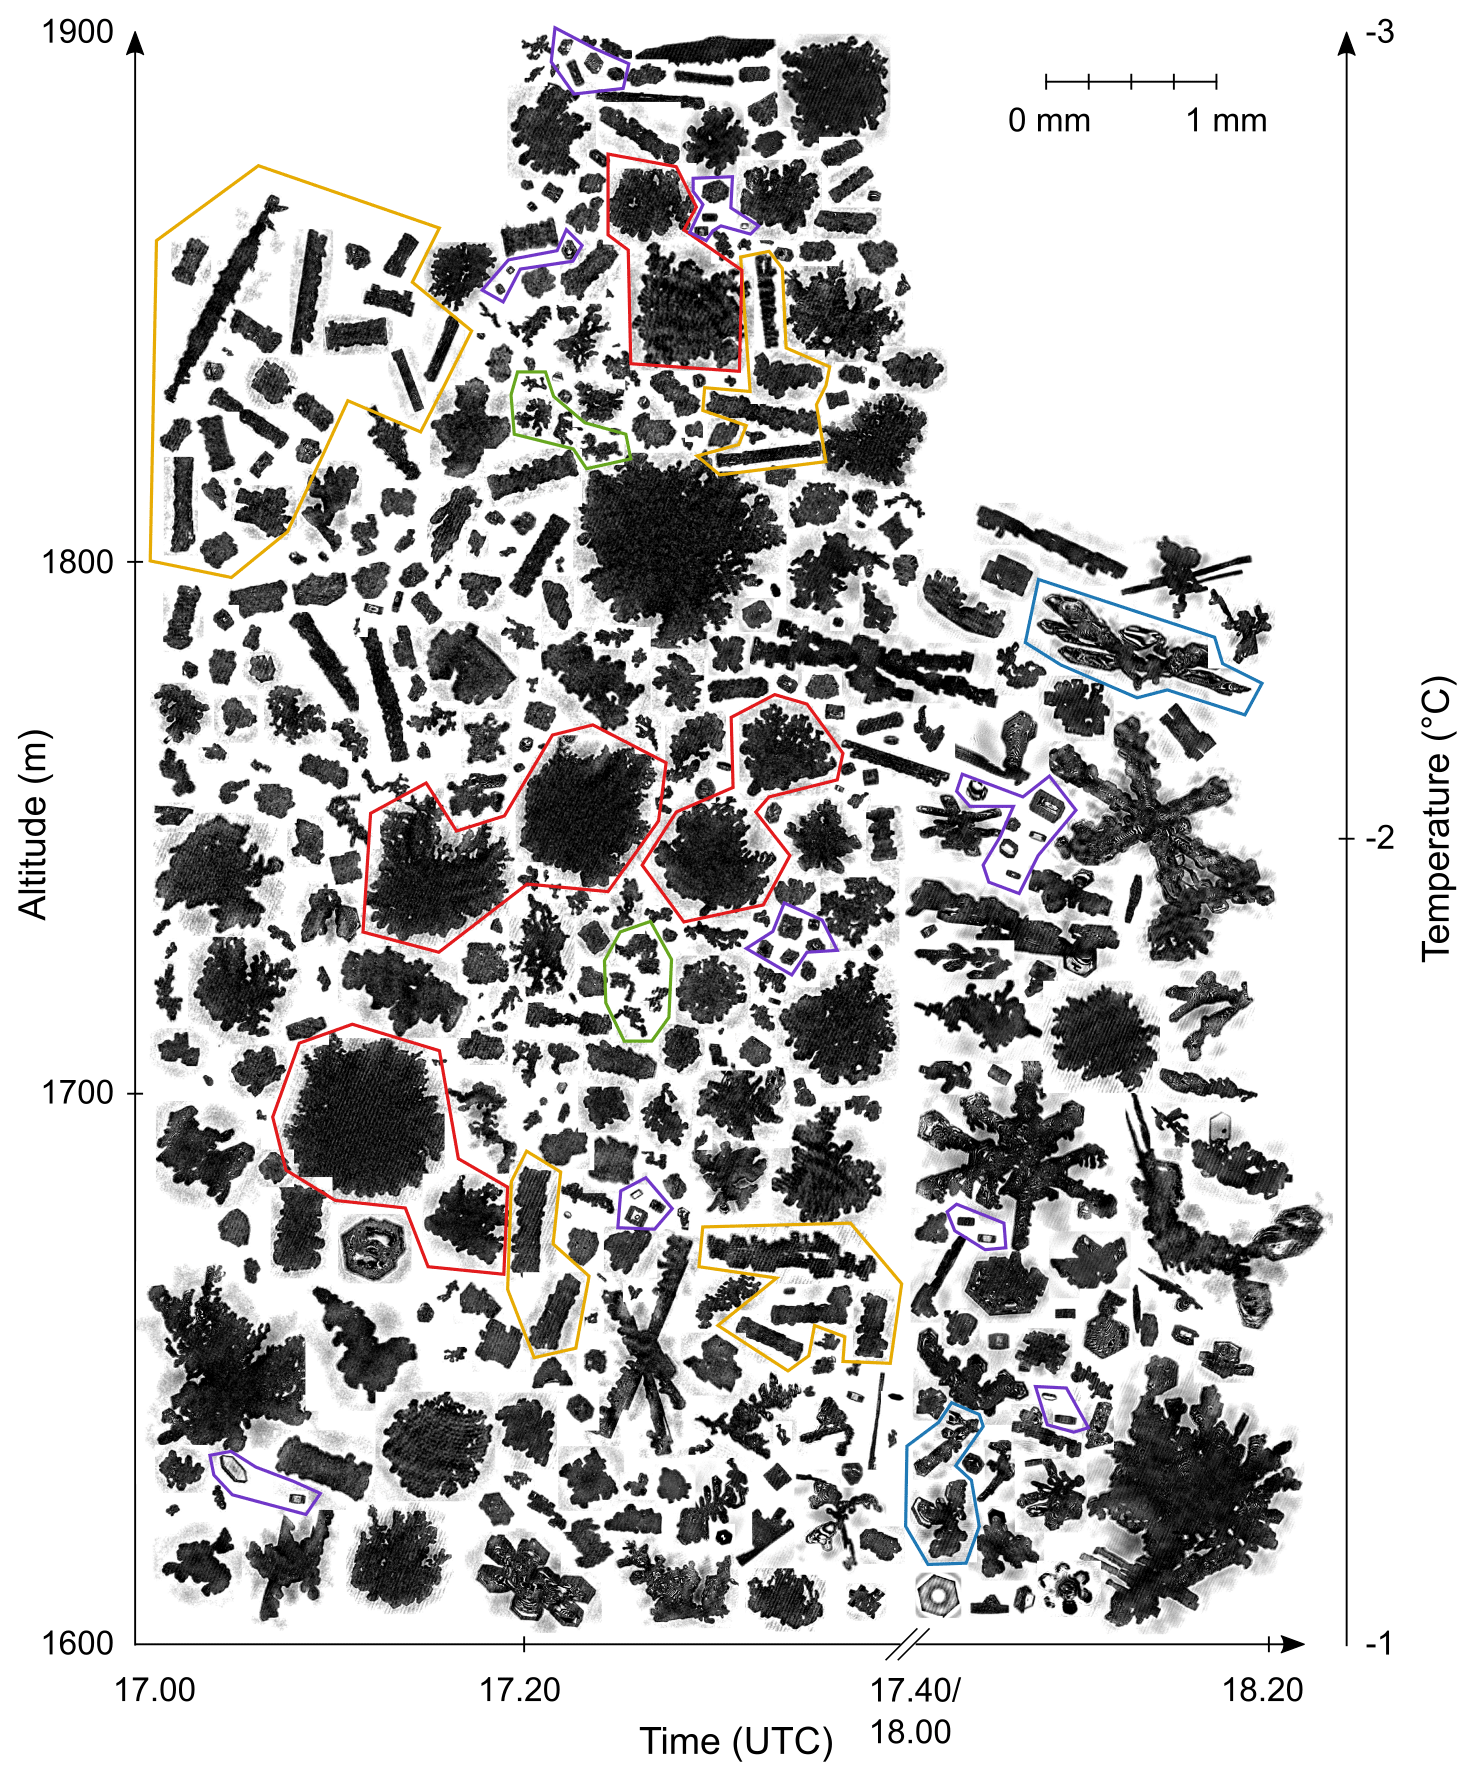
Figure 13Example images of the ice crystals observed with HOLIMO as a function of height and time. The height-corresponding temperature is shown on the y axis on the right side. The boxes indicate columns (yellow), pristine ice particles (purple), large rimed particles (red), irregular particles (green) and aggregates (blue).
For example, the images indicate the presence of numerous columns between 17:00 and 17:20 UTC at altitudes above 1780 m (yellow boxes) which are known to grow at temperatures between −3 and −10 ∘C (Magono and Lee, 1966; Bailey and Hallett, 2009). Furthermore, irregular-shaped particles including ice fragments were abundant (green boxes), consistent with previous studies (e.g., Korolev et al., 1999; Stoelinga et al., 2007). A large fraction of graupel and rimed particles was observed between 17:00 and 17:40 UTC (red boxes). After 18:00 UTC, the ice crystals became more aggregated (blue boxes) and less rimed (see also MASC data in Fig. 14d), suggesting a decrease in the amount of liquid water available for riming. Furthermore, from 18:00 UTC onwards dendrites and broken branches of dendrites were more abundant. Small pristine ice crystals (plates and columns) were present over the entire period (see Fig. 15c and purple boxes in Fig. 13).
The large variability in ice crystal habit and size suggests that the ice crystals have formed and grown in different cloud regions. As discussed in Sect. 4.2, it is likely that the heavily rimed ice particles and large dendrites (Fig. 13) were produced within the seeder region of the cloud and gained mass by riming and deposition while falling through the cloud. On the other hand, the small pristine ice crystals were likely formed within the feeder region of the cloud. Previous studies have found that small pristine ice crystals (<100 µm) were spatially correlated with their environment of origin (e.g., Korolev et al., 2020). For example, it is possible that the observed columns originated within the multi-peaked structures (Fig. 8c) as the temperature below 3000 m was in the temperature regime of columnar growth (Bailey and Hallett, 2009). Pristine plates likely grew in the lowest part of the cloud where the prevailing temperature was above −3 ∘C. These small ice crystals (<100 µm) could have formed either by primary ice nucleation or by SIP processes within the feeder cloud and rapidly grown by diffusion to larger sizes (e.g., Korolev et al., 2020). The contribution of primary ice nucleation to the observed ICNC can be estimated from the measured INP concentration at Wolfgang (Fig. 10; assuming coupling between the surface and the lower part of the cloud), which was below the minimum detectable concentration at a temperature of −3 ∘C. Thus, the minimum detectable concentration of (see Sect. 2.2.3) represents an upper limit for the INP concentration within the feeder region. The ICNC<100 µm in diameter observed in the feeder cloud (1 to 2 L−1; Fig. 14a) exceeded the estimated INP concentration by 3 orders of magnitude, suggesting that primary ice nucleation alone cannot explain the small ice crystals observed.
Secondary ice production processes are necessary to explain the observed ICNC in the feeder cloud. Since the cloud droplets in the low-level feeder cloud were small (< 50 µm in diameter; Fig. 7a), droplet shattering was likely not the responsible mechanism. However, as the temperature at 1900 m was around −3 ∘C and large rimed particles (Fig. 14a) and cloud droplets larger than 25 µm in diameter (Fig. 14b) were observed in the feeder cloud, the Hallett–Mossop process may have been active (Hallett and Mossop, 1974; Mossop, 1978).
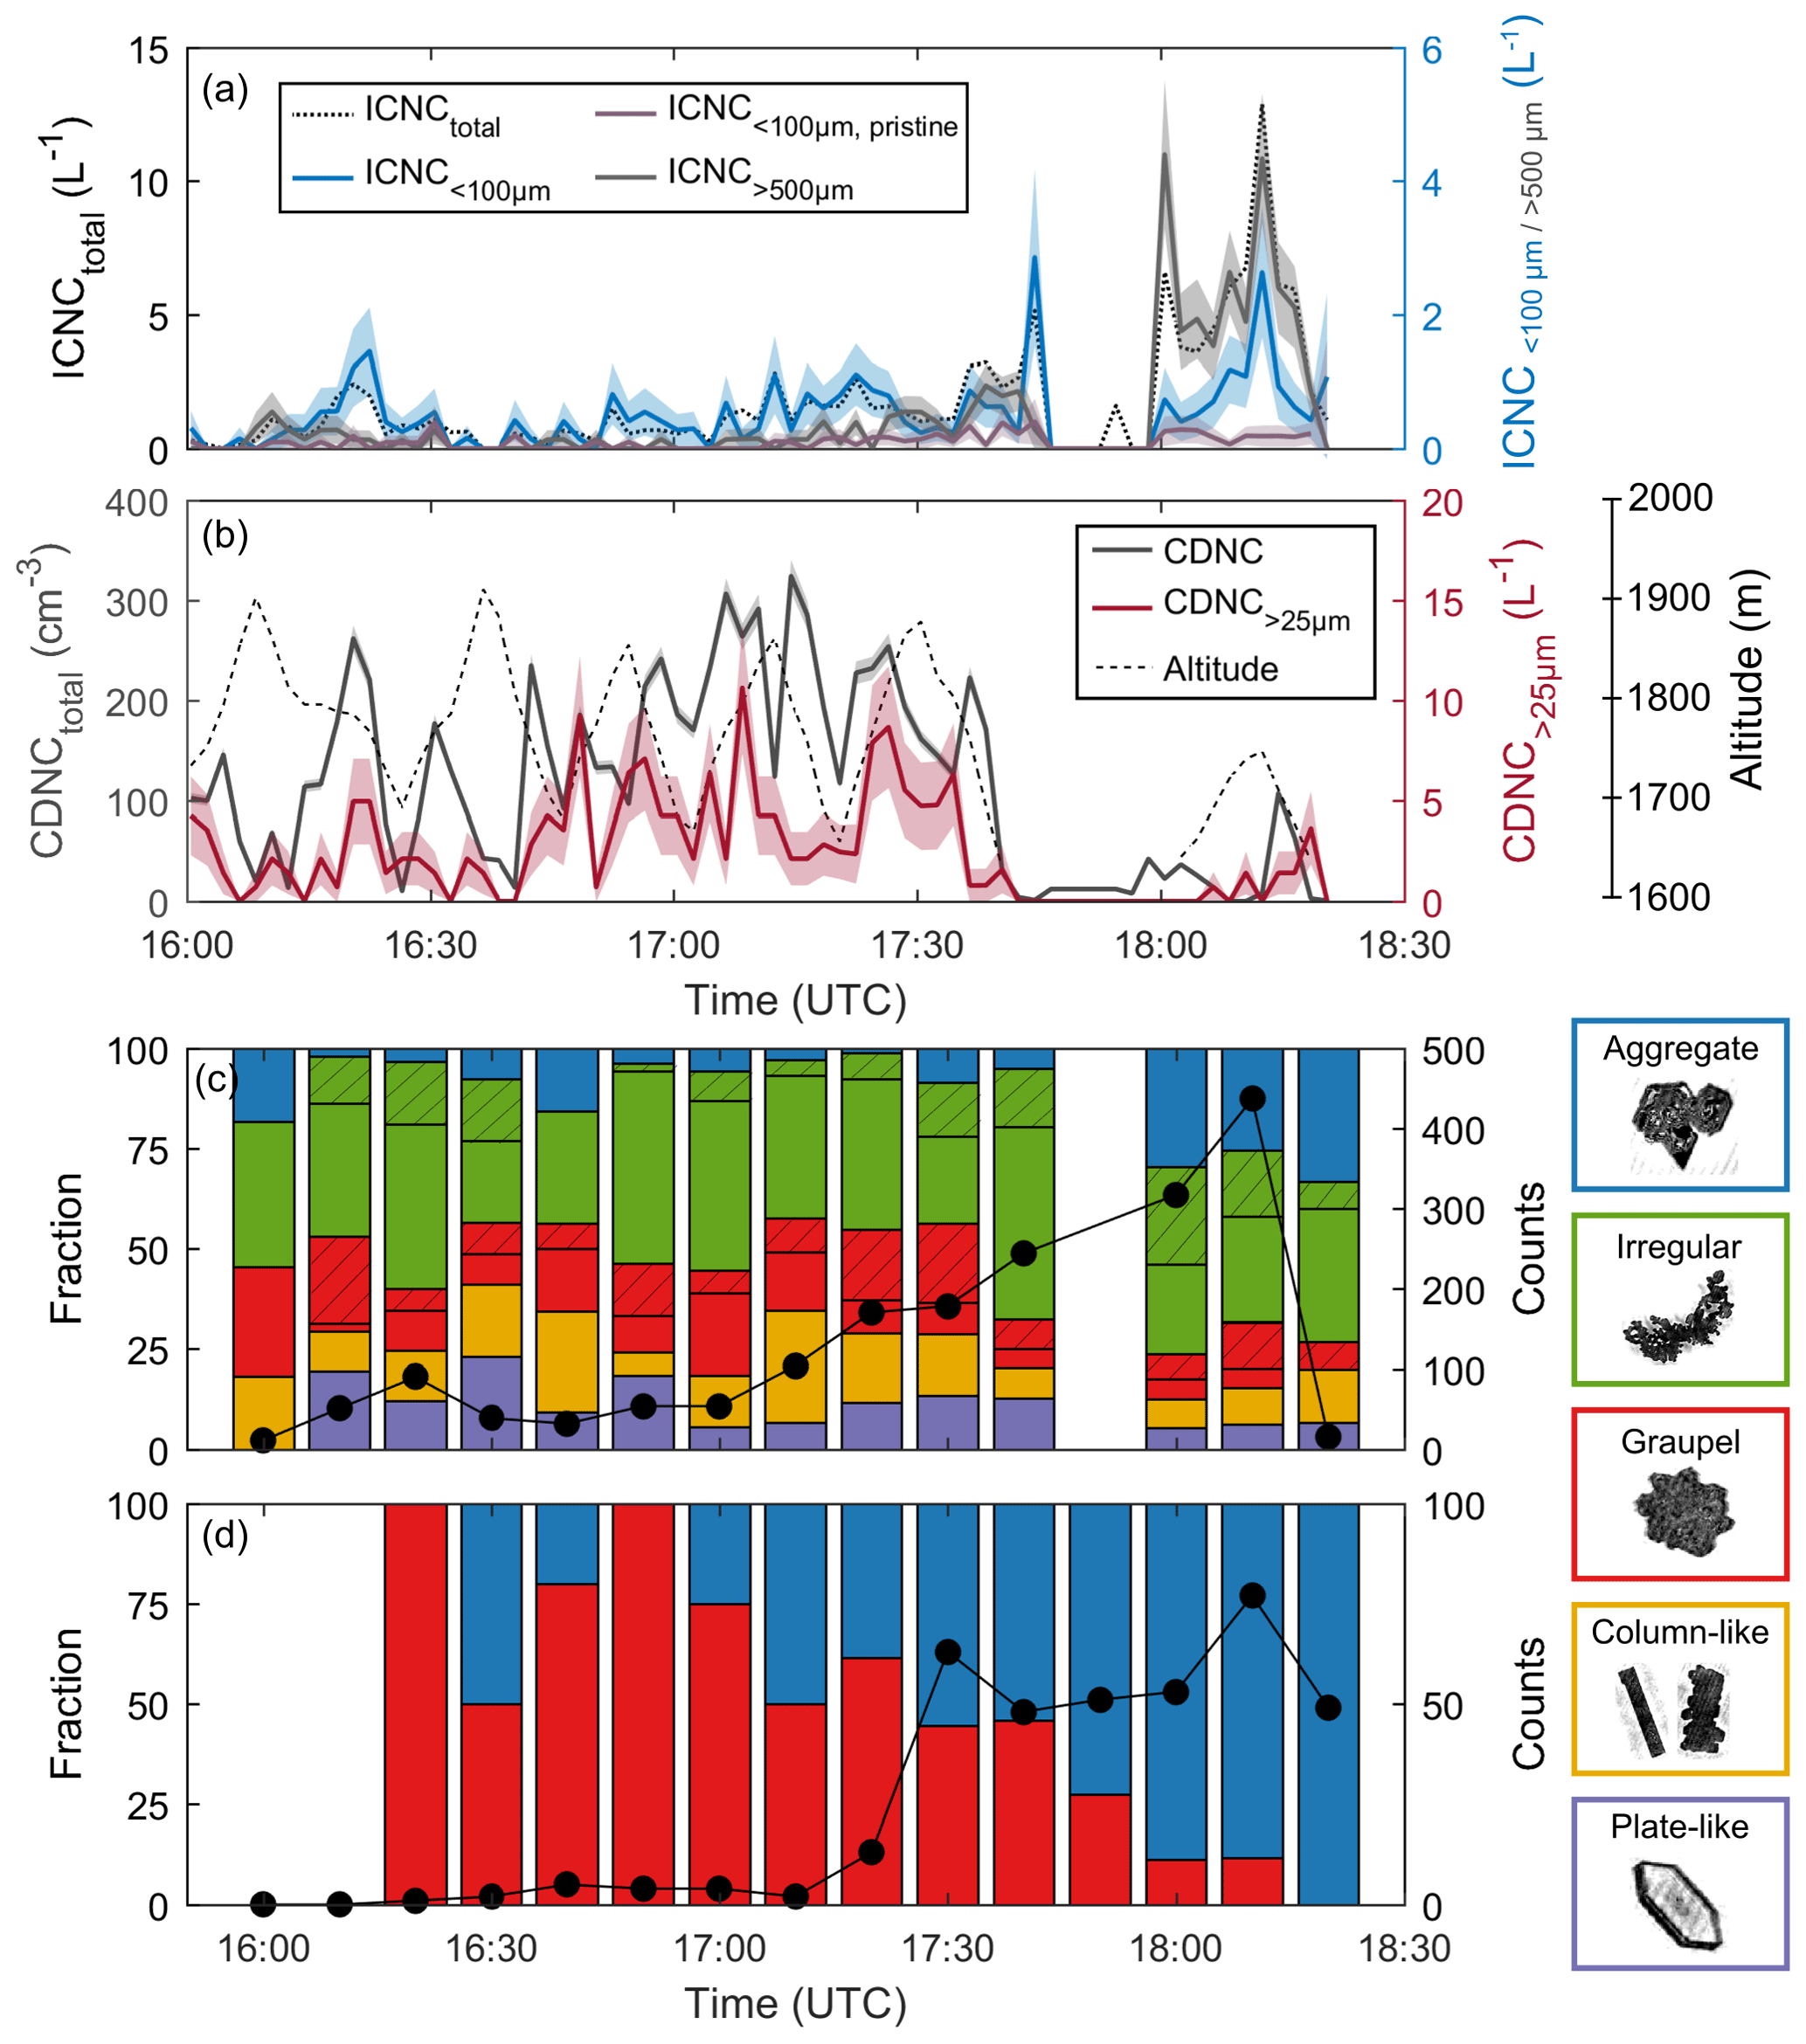
Figure 14Time series of the ice (a) and liquid (b) cloud properties measured by the HoloBalloon platform. The left y axes in (a) and (b) show the total cloud particle concentrations (a: ICNC, b: CDNC), whereas the other cloud properties are displayed on the right y axes. The shaded areas indicate the uncertainty of the concentrations. The dashed line in (b) shows the altitude of the balloon. The temporal evolution of the ice habit fraction is shown in (c), HOLIMO, and (d), MASC (see Sect. 2.2.1 for more information about the classification). The total counts during the 10 min interval are indicated by the black dots. Example ice particles are shown on the right. Shaded areas in (c) indicate particles with a higher degree of riming.
Another mechanism that could have led to the production of secondary ice particles in the low-level feeder cloud is ice particle fragmentation upon ice–ice collisions (e.g., Vardiman, 1978; Takahashi et al., 1995). As the low-level liquid layer contained small pristine and large rimed ice particles (Fig. 14a), which have different terminal fall velocities and therefore enhanced collision efficiencies, collisional ice fragmentation may have been occurring. Indeed, the ice crystal images in Fig. 13 indicate the presence of ice fragments (e.g., broken-off arms of dendrites after 18:00 UTC). Based on the temporal evolution of the cloud properties within the feeder cloud (Fig. 14a, b), which shows an increase in the ICNC and a decrease in the number of large cloud droplets after 18:00 UTC, we suggest that ice particle fragmentation upon collision was the dominant SIP process after 18:00 UTC. In contrast, the presence of large cloud droplets (>25 µm) before 18:00 UTC suggests that both the Hallett–Mossop process and collisional ice fragmentation contributed to the observed ICNC.
Previous studies have observed large discrepancies between the INP concentration and ICNC in the feeder region of clouds (e.g., Rogers and Vali, 1987; Lloyd et al., 2015; Beck et al., 2018; Lowenthal et al., 2019). These observations were frequently conducted at mountaintop research stations or near mountain slopes where ICNCs of several hundreds to thousands per liter have been reported (e.g., Rogers and Vali, 1987; Lloyd et al., 2015; Lowenthal et al., 2019). These large ICNCs were attributed to the influence of surface processes such as blowing snow (Rogers and Vali, 1987, Geerts et al., 2015), hoar frost (Lloyd et al., 2015), riming on snow-covered surfaces (Rogers and Vali, 1987) or ice crystal enhancement through turbulence and convergence (Beck et al., 2018), whereas the contribution of SIP processes has been suggested to be minor or has been difficult to assess (Lloyd et al., 2015, Beck et al., 2018). By performing balloon-borne measurements in a mountain valley, we measured ICNCs that were 2 orders of magnitude lower than previous observations at mountaintops (1 to 10 L−1 instead of 100 to 1000 L−1) and thus were able to significantly reduce the impact of surface processes. Based on the estimated INP concentration (Fig. 10) and observed ICNC (Fig. 14a), we suggest that SIP processes contributed up to 1–2 L−1 to the observed ICNC in the presented case study and thus accounted for up to 50 % of the total ICNC before 18:00 UTC. However, the increase in the ICNC from 3 up to 14 L−1 after 18:00 UTC (Fig. 14a) cannot be solely explained by SIP within the feeder cloud since the observed increase was primarily due to large ice particles (>300 µm; see Fig. 7b). As a substantial fraction of aggregates after 18:00 UTC are dendrites and broken-off arms of dendrites, the ICNC might be attributed to ice–ice collision breakup within the seeder region. Interestingly, the discrepancy between the INP concentration and ICNC observed in the present study after 18:00 UTC (factor of around 8; see Sect. 4.2) is strikingly similar to the ice multiplication factor of dendrites previously observed at Jungfraujoch in winter clouds (Mignani et al., 2019) even if both studies applied different approaches to determine the enhancement factor and to reduce the influences of surface processes.
If only a small concentration of secondary ice particles is captured by updrafts or turbulence within the feeder region and lifted aloft, they can initiate further ice formation and growth at temperatures well above typical INP activation temperatures and have a significant impact on the development of the cloud (e.g., cloud properties, glaciation, lifetime). While the CDNC and CDNC>25 µm decreased above 1850 m, the vertical profiles of the ICNC showed no height dependence over the 200 m height interval (Fig. 15).

Figure 15Mean vertical profile of the liquid and ice properties measured in the low-level feeder cloud between 16:45 and 17:45 UTC with the HoloBalloon platform. The shaded areas indicate the uncertainty of the concentrations.
This suggests that SIP was active over the entire low-level feeder cloud. However, due to the limited vertical extent of the profiles, we cannot make a final statement regarding the impact of SIP within the feeder region on the cloud microphysics aloft. Further observations in “surface-decoupled” environments (i.e., reduced influence of surface processes) with a larger vertical extent are required to assess the role of SIP in feeder clouds. This is important as secondary ice production in the feeder region can potentially enhance orographic precipitation.
In this paper, we investigated the microphysical evolution of a mixed-phase cloud passing over the Swiss Alps using a multi-dimensional set of observations and instruments including (1) ground-based remote sensing, (2) in situ microphysical observations on a tethered balloon system, (3) INP measurements and (4) surface precipitation measurements. A particular emphasis was placed on studying the microphysics within cloud top generating cells and a persistent low-level feeder cloud from an aerosol–cloud–precipitation perspective. The key findings are summarized as follows:
-
The microphysical structure of the MPC was observed with a vertically pointing Ka-band polarimetric cloud radar and with a tethered balloon system. The phase transition from a liquid to an ice cloud was observed during the passage of the cloud system. It is likely that the Wegener–Bergeron–Findeisen process contributed to the glaciation of the MPC. Regarding the vertical cloud structure, generating cells with enhanced radar reflectivity were observed near the cloud top, which acted as a seeder region and produced fallstreaks of enhanced radar reflectivity. Furthermore, the decoupled boundary layer circulation in the lee of the mountain barrier produced local updrafts and turbulence which led to the formation of a persistent low-level feeder cloud.
-
The cloud radar and microwave radiometer observations suggest that ice formation and growth, as well as liquid water production, were enhanced within the cloud top generating cells. While numerous studies have observed enhanced ICNCs within generating cells, uncertainties exist regarding their ice formation mechanism. Here we proposed different processes and discussed their potential contribution. Cooling associated with convective overshooting was suggested to increase the ICNC by a factor of 2.2 to 5.2 in the present study, whereas radiative cooling was estimated to increase the ICNC formed by primary ice nucleation only by a factor of 1 to 1.4. In addition, secondary ice production through droplet shattering was proposed to potentially increase the ICNC by several factors and might have contributed to the glaciation of the MPC.
-
The co-existence of small pristine ice crystals and large rimed ice particles was observed in the low-level feeder cloud, suggesting the occurrence of secondary ice production. By using a tethered balloon to observe the feeder cloud in the mountain valley, we were able to significantly reduce the influence of surface processes compared to previous observations at mountaintops and to investigate the contribution of secondary ice production in the feeder region of clouds. The ICNC of small ice crystals (<100 µm) measured near cloud base exceeded the INP concentration by 3 orders of magnitude. Conditions favorable for the Hallett–Mossop process and ice particle fragmentation upon ice–ice collisions were found. We suggest that secondary ice production in the feeder cloud increased the ICNC by a factor of up to 2.
Overall, this study observed the temporal and spatial evolution of the microphysics within the seeder and feeder region of an MPC passing over the Swiss Alps. We found that a significant increase in ice formation and growth within the seeder region can induce the glaciation of the MPC. In addition, we found that secondary ice production mechanisms were active in the feeder cloud, which initiated ice formation at temperatures at which no INP were detectable. This case study demonstrates that secondary ice production can occur in different cloud regions and have important implications for precipitation initiation and the lifetime of MPCs in general. Further studies are required to understand the role of secondary ice production in both the seeder and feeder regions of clouds. These studies should include vertically resolved in situ observations of the microphysical properties, aerosol properties (e.g., INP) and environmental conditions (e.g., temperature, vertical updraft velocity) over the entire cloud depth and should be performed in a “surface-decoupled” environment (i.e., reduced influence of surface processes).
In the framework of the present study, the maximum Doppler velocity was used as a proxy to identify regions with updrafts and liquid water. The maximum Doppler velocity vmax was derived from the Doppler spectra as shown in Fig. A1a.
In order to be more robust regarding the presence of extreme values, vmax was defined as follows:
where Zmin and Zmax are the minimum and maximum radar reflectivities. To validate whether vmax can also be used to identify regions with liquid water, it was compared to the LWP measured by the microwave radiometer. Since the LWP is integrated over the whole vertical column, the vertically integrated vmax is shown in Fig. A1b. A positive correlation was found between vmax and the LWP with a Spearman's rank correlation coefficient of 0.5, significant at the 5 % level. Based on this result, we assume that vmax can be used as a proxy for updraft regions and regions with liquid water.
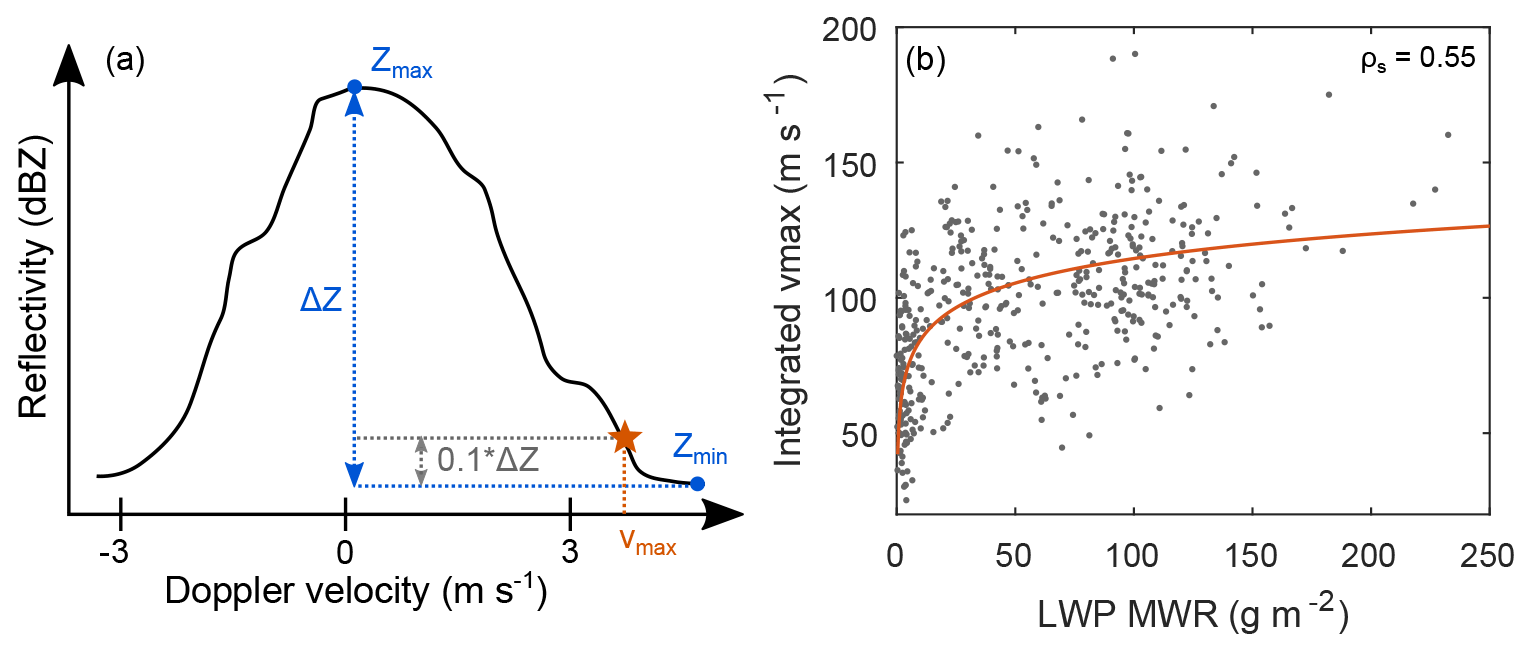
Figure A1An example Doppler spectrum is shown in (a) to demonstrate the derivation of the maximum Doppler velocity vmax (orange star), where Zmin and Zmax are the minimum and maximum radar reflectivities (see text for more details). The relationship between the vertically integrated vmax and the LWP measured by the microwave radiometer for the time period 15:00–18:00 UTC is shown in panel (b). The orange line is a logarithmic fit through the data points, and ρs indicates the Spearman's rank correlation coefficient.
In Sect. 4.2, we proposed different mechanisms that potentially enhance ice nucleation and growth in cloud top generating cells (convective overshooting, radiative cooling, droplet shattering) on the basis of INP measurements and cloud base observations of the ICNC and ice particle size. In the following, we estimate the potential contribution of these mechanisms to the observed ICNC and discuss the related uncertainties.
B1 Convective overshooting
Generating cells can be associated with an overshooting cloud top, for instance, when static instabilities due to radiative cooling occur at cloud top. In the present case study, convective overshooting of up to 500 m was observed at cloud top (e.g., GC1 in Fig. 8). The consequent decrease in cloud top temperature increases the number of INPs active due to the lower temperatures and thus increases the number of ice crystals likely formed by primary ice nucleation. The ice crystal enhancement factor due to convective overshooting can be summarized as follows:
where mice, cos is the ice crystal enhancement factor due to convective overshooting, INPC(T) is the INP concentration at a given temperature, Tcos is the cloud top temperature after convective overshooting, TCT is the initial cloud top temperature, Γamb is the ambient lapse rate, and hcos is the height of the cloud top overshooting. As discussed in the main text, these variables were estimated from the available observations. With TCT = -21 ∘C, INPC(TCT) = 0.27 L−1, Γamb=7.2 K/1000 m (± 1 K/1000 m), hcos=500 m (± 100 m) and thus INPC to −26 ∘C) = 0.61 to 1.4 L−1 (from Fig. 10), the ice crystal enhancement factor due to convective overshooting ranges between 2.2 and 5.2 in the present study. Since the calculation of the ice crystal enhancement factor is based on an extrapolation of the fit line to the INP data to lower temperatures (Fig. 10), this may induce an additional source of uncertainty. The ice crystal enhancement factor due to convective overshooting can be significantly different for other cases depending on the ambient conditions (e.g., lapse rate), the magnitude of the overshooting and the temperature dependence of the INP population.
B2 Cloud top radiative cooling
Radiative cooling plays an important role for the formation and maintenance of generating cells. The magnitude of the longwave radiative cooling strongly depends on the microphysical cloud properties (e.g., liquid water content). Large updrafts within the core region of generating cells can enhance the production of supercooled liquid water and thereby increase radiative cooling at cloud top. The ice crystal enhancement factor due to radiative cooling can be estimated as follows:
where Trc is the cloud top temperature after radiative cooling, ΔRHR is the increase in the radiative heating rate within generating cells compared to their surrounding regions, and tGC is the duration of the generating cell. With ∘C, INPC(TCT)=0.27 L−1, ΔRHR=1.2 K h−1 (± 1 K h−1), tGC=15 min (± 10 min) and thus INPC to −22 ∘C) = 0.27 to 0.37 L−1 (from Fig. 10), the ice crystal enhancement factor due to radiative cooling is in the range of 1 to 1.4 for the present case study. The radiative heating rates that were used in our analysis were solely based on literature values (Turner et al., 2018) and thus are associated with large uncertainties. Furthermore, the calculation of the enhancement factor is based on an extrapolation of the fit line to the INP data at lower temperatures (Fig. 10), which may induce an additional source of uncertainty. Nevertheless, despite the underlying assumptions, we show that the contribution of radiative cooling to the ICNC is small compared to the contribution of convective overshooting.
B3 Droplet shattering
Drizzle-sized droplets can release small secondary ice particles upon freezing. This process might also be active in cloud top generating cells if the droplets exceed a diameter of about 40 µm, which has been identified as a critical threshold in previous studies (e.g., Lawson et al., 2015; Korolev et al., 2020). As highlighted by Lauber et al. (2021), the number of secondary ice particles produced by large cloud droplets depends on the droplet freezing rate, the droplet fragmentation probability during freezing and the number of splinters produced per fragmenting droplet. Since no in situ observations of the cloud properties were available within generating cells to obtain these parameters, the contribution of droplet shattering to the ICNC is not investigated further in this study.
The dataset of this study is available for download at: https://doi.org/10.5281/zenodo.4644552 (Ramelli et al., 2021a). The scripts to reproduce the figures of this study are available at: https://doi.org/10.5281/zenodo.4645426 (Ramelli et al., 2021b). The elevation data were obtained from the digital height model DHM25 of the Federal Office of Topography swisstopo: https://shop.swisstopo.admin.ch/de/products/height_models/dhm25200 (last access: 9 March 2020). The datasets of the RACLETS campaign are available for download at: https://www.envidat.ch/group/raclets-field-campaign (last access: 18 December 2020).
FR analyzed the observational data and prepared the figures of the manuscript. FR, JH, JTP and AL performed the HoloBalloon measurements. JB computed the ICNC retrievals from the remote sensing observations. MR performed the peakTree analysis. PS processed the remote sensing data and Doppler spectra of MIRA-36. JW and CM collected and processed the INP data. RE operated the OCEANET container during the RACLETS campaign. MH operated the radar wind profiler and processed the wind profiler data. JB, MR and PS helped in interpreting the remote sensing data. FR, JH, ROD and UL analyzed and interpreted the observational data. FR prepared the manuscript with contributions from all authors.
The authors declare that they have no conflict of interest.
The authors would like to thank the participants of the RACLETS campaign for their technical support and many fruitful discussions. In particular, we are thankful to Michael Lehning (WSL/SLF, EPFL) and his whole team for their substantial support for realizing the RACLETS campaign by providing local contacts and support in requesting the necessary permissions. We would like to thank Paul Fopp for providing his land for the RACLETS campaign. We would also like to thank Alexander Beck for helping with the organization of the field campaign. Moreover, the authors are thankful to Susanne Crewell (University of Cologne) and Bernhard Pospichal (University of Cologne) for their help in interpreting the microwave radiometer data. We would also like to acknowledge Benjamin Walter (SLF) for providing data of the snowdrift station located at Gotschnagrat. We thank the Swiss Federal Office of Meteorology and Climatology for providing the meteorological measurements, ceilometer data from Klosters, MASC observations and access to the COSMO1 and weather radar data. Furthermore, we would also like to thank Eberhard Bodenschatz (MPI Göttingen) for his technical support during the development of the HoloBalloon platform. We would like to thank the Federal Office of Civil Aviation, particularly Judith Baumann and Jeroen Kroese, for their pragmatic approach in obtaining the flight permit. Finally, we thank two anonymous reviewers for their constructive and helpful feedback on the manuscript.
This research has been supported by the Swiss National Science Foundation (SNSF) (grant no. 200021_175824). Robert O. David received funding from the European Research Council (ERC) (grant no. StG 758005). Claudia Mignani received funding from the SNSF (grant no. 200021_169620).
This paper was edited by Ottmar Möhler and reviewed by two anonymous referees.
Ansmann, A., Tesche, M., Althausen, D., Müller, D., Seifert, P., Freudenthaler, V., Heese, B., Wiegner, M., Pisani, G., Knippertz, P., and Dubovik, O.: Influence of Saharan dust on cloud glaciation in southern Morocco during the SaharanMineral Dust Experiment, J. Geophys. Res., 113, D04210, https://doi.org/10.1029/2007JD008785, 2008. a
Bailey, M. P. and Hallett, J.: A comprehensive habit diagram for atmospheric ice crystals: Confirmation from the laboratory, AIRS II, and other field studies, J. Atmos. Sci., 66, 2888–2899, 2009. a, b, c, d, e
Beck, A.: Observing the Microstructure of Orographic Clouds with HoloGondel, PhD thesis, ETH Zurich, Zurich, 2017. a, b
Beck, A., Henneberger, J., Schöpfer, S., Fugal, J., and Lohmann, U.: HoloGondel: in situ cloud observations on a cable car in the Swiss Alps using a holographic imager, Atmos. Meas. Tech., 10, 459–476, https://doi.org/10.5194/amt-10-459-2017, 2017. a, b, c, d
Beck, A., Henneberger, J., Fugal, J. P., David, R. O., Lacher, L., and Lohmann, U.: Impact of surface and near-surface processes on ice crystal concentrations measured at mountain-top research stations, Atmos. Chem. Phys., 18, 8909–8927, https://doi.org/10.5194/acp-18-8909-2018, 2018. a, b, c, d, e
Bergeron, T.: On the physics of clouds and precipitation, Proc. 5th Assembly UGGI, Lisbon, Portugal, 1935, 156–180, 1935. a
Borys, R. D., Lowenthal, D. H., and Mitchell, D. L.: The relationships among cloud microphysics, chemistry, and precipitation rate in cold mountain clouds, Atmos. Environ., 34, 2593–2602, 2000. a, b
Borys, R. D., Lowenthal, D. H., Cohn, S. A., and Brown, W. O. J.: Mountaintop and radar measurements of anthropogenic aerosol effects on snow growth and snowfall rate, Geophys. Res. Lett., 30, 1538, https://doi.org/10.1029/2002GL016855, 2003. a, b, c, d, e
Bühl, J., Seifert, P., Myagkov, A., and Ansmann, A.: Measuring ice- and liquid-water properties in mixed-phase cloud layers at the Leipzig Cloudnet station, Atmos. Chem. Phys., 16, 10609–10620, https://doi.org/10.5194/acp-16-10609-2016, 2016. a
Bühl, J., Seifert, P., Radenz, M., Baars, H., and Ansmann, A.: Ice crystal number concentration from lidar, cloud radar and radar wind profiler measurements, Atmos. Meas. Tech., 12, 6601–6617, https://doi.org/10.5194/amt-12-6601-2019, 2019. a, b
Carvalho, E., Sindt, C., Verdier, A., Galan, C., O’Donoghue, L., Parks, S., and Thibaudon, M.: Performance of the Coriolis air sampler, a high-volume aerosol-collection system for quantification of airborne spores and pollen grains, Aerobiologia, 24, 191–201, 2008. a
Chen, C. and Cotton, W. R.: The physics of the marine stratocumulus-capped mixed layer, J. Atmos. Sci., 44, 2951–2977, 1987. a
Connolly, P. J., Emersic, C., and Field, P. R.: A laboratory investigation into the aggregation efficiency of small ice crystals, Atmos. Chem. Phys., 12, 2055–2076, https://doi.org/10.5194/acp-12-2055-2012, 2012. a
Crewell, S. and Löhnert, U.: Accuracy of cloud liquid water path from ground-based microwave radiometry 2. Sensor accuracy and synergy, Radio Sci., 38, 7–1, 2003. a
Cronce, M., Rauber, R. M., Knupp, K. R., Jewett, B. F., Walters, J. T., and Phillips, D.: Vertical motions in precipitation bands in three winter cyclones, J. Appl. Meteorol. Climatol., 46, 1523–1543, 2007. a
Crosier, J., Choularton, T., Westbrook, C., Blyth, A., Bower, K., Connolly, P., Dearden, C., Gallagher, M., Cui, Z., and Nicol, J.: Microphysical properties of cold frontal rainbands, Q. J. Roy. Meteor. Soc., 140, 1257–1268, 2014. a, b
David, R. O., Cascajo-Castresana, M., Brennan, K. P., Rösch, M., Els, N., Werz, J., Weichlinger, V., Boynton, L. S., Bogler, S., Borduas-Dedekind, N., Marcolli, C., and Kanji, Z. A.: Development of the DRoplet Ice Nuclei Counter Zurich (DRINCZ): validation and application to field-collected snow samples, Atmos. Meas. Tech., 12, 6865–6888, https://doi.org/10.5194/amt-12-6865-2019, 2019. a
De Boer, G., Morrison, H., Shupe, M. D., and Hildner, R.: Evidence of liquid dependent ice nucleation in high‐latitude stratiform clouds from surface remote sensors, Geophys. Res. Lett., 38, L01803, https://doi.org/10.1029/2010GL046016, 2011. a
Dorsi, S., Shupe, M., Persson, P., Kingsmill, D., and Avallone, L.: Phase-specific characteristics of wintertime clouds across a midlatitude mountain range, Mon. Weather Rev., 143, 4181–4197, 2015. a
Eirund, G. K., Possner, A., and Lohmann, U.: Response of Arctic mixed-phase clouds to aerosol perturbations under different surface forcings, Atmos. Chem. Phys., 19, 9847–9864, https://doi.org/10.5194/acp-19-9847-2019, 2019. a, b
Evans, A. G., Locatelli, J. D., Stoelinga, M. T., and Hobbs, P. V.: The IMPROVE-1 storm of 1–2 February 2001. Part II: Cloud structures and the growth of precipitation, J. Atmos. Sci., 62, 3456–3473, 2005. a
Findeisen, W.: Kolloid-meteorologische Vorgänge bei Neiderschlags-bildung, Meteor. Z, 55, 121–133, 1938. a
Fukuta, N. and Takahashi, T.: The growth of atmospheric ice crystals: A summary of findings in vertical supercooled cloud tunnel studies, J. Atmos. Sci., 56, 1963–1979, 1999. a
Garrett, T. J., Fallgatter, C., Shkurko, K., and Howlett, D.: Fall speed measurement and high-resolution multi-angle photography of hydrometeors in free fall, Atmos. Meas. Tech., 5, 2625–2633, https://doi.org/10.5194/amt-5-2625-2012, 2012. a
Geerts, B., Pokharel, B., and Kristovich, D. A.: Blowing snow as a natural glaciogenic cloud seeding mechanism, Mon. Weather Rev., 143, 5017–5033, 2015. a, b
Georgakaki, P., Bougiatioti, A., Wieder, J., Mignani, C., Ramelli, F., Kanji, Z. A., Henneberger, J., Hervo, M., Berne, A., Lohmann, U., and Nenes, A.: On the drivers of droplet variability in Alpine mixed-phase clouds, Atmos. Chem. Phys. Discuss. [preprint], https://doi.org/10.5194/acp-2020-1036, in review, 2020. a, b
Görsdorf, U., Lehmann, V., Bauer-Pfundstein, M., Peters, G., Vavriv, D., Vinogradov, V., and Volkov, V.: A 35-GHz polarimetric Doppler radar for long-term observations of cloud parameters – Description of system and data processing, J. Atmos. Ocean. Tech., 32, 675–690, 2015. a, b
Hallett, J. and Mossop, S.: Production of secondary ice particles during the riming process, Nature, 249, 26–28, https://doi.org/10.1038/249026a0, 1974. a, b
Harrington, J. Y., Reisin, T., Cotton, W. R., and Kreidenweis, S. M.: Cloud resolving simulations of Arctic stratus: Part II: Transition-season clouds, Atmos. Res., 51, 45–75, 1999. a
Hauf, T. and Schröder, F.: Aircraft icing research flights in embedded convection, Meteorol. Atmos. Phys., 91, 247–265, 2006. a
Henneberger, J., Fugal, J. P., Stetzer, O., and Lohmann, U.: HOLIMO II: a digital holographic instrument for ground-based in situ observations of microphysical properties of mixed-phase clouds, Atmos. Meas. Tech., 6, 2975–2987, https://doi.org/10.5194/amt-6-2975-2013, 2013. a, b
Hogan, R. J., Field, P., Illingworth, A., Cotton, R., and Choularton, T.: Properties of embedded convection in warm-frontal mixed-phase cloud from aircraft and polarimetric radar, Q. J. Roy. Meteor. Soc., 128, 451–476, 2002. a, b, c, d
Houze Jr., R. A., Rutledge, S. A., Matejka, T. J., and Hobbs, P. V.: The mesoscale and microscale structure and organization of clouds and precipitation in midlatitude cyclones. III: Air motions and precipitation growth in a warm-frontal rainband, J. Atmos. Sci., 38, 639–649, 1981. a, b, c, d
Ikeda, K., Rasmussen, R. M., Hall, W. D., and Thompson, G.: Observations of freezing drizzle in extratropical cyclonic storms during IMPROVE-2, J. Atmos. Sci., 64, 3016–3043, 2007. a, b, c
Jiang, H., Cotton, W. R., Pinto, J. O., Curry, J. A., and Weissbluth, M. J.: Cloud resolving simulations of mixed-phase Arctic stratus observed during BASE: Sensitivity to concentration of ice crystals and large-scale heat and moisture advection, J. Atmos. Sci., 57, 2105–2117, 2000. a
Keeler, J. M., Jewett, B. F., Rauber, R. M., McFarquhar, G. M., Rasmussen, R. M., Xue, L., Liu, C., and Thompson, G.: Dynamics of cloud-top generating cells in winter cyclones. Part II: Radiative and instability forcing, J. Atmos. Sci., 73, 1529–1553, 2016. a
Keinert, A., Spannagel, D., Leisner, T., and Kiselev, A.: Secondary ice production upon freezing of freely falling drizzle droplets, J. Atmos. Sci., 77, 2959–2967, 2020. a
Ketterer, C., Zieger, P., Bukowiecki, N., Coen, M. C., Maier, O., Ruffieux, D., and Weingartner, E.: Investigation of the planetary boundary layer in the Swiss Alps using remote sensing and in situ measurements, Bound.-Lay. Meteorol., 151, 317–334, 2014. a
Korolev, A. and Isaac, G.: Phase transformation of mixed-phase clouds, Q. J. Roy. Meteor. Soc., 129, 19–38, 2003. a
Korolev, A. and Leisner, T.: Review of experimental studies of secondary ice production, Atmos. Chem. Phys., 20, 11767–11797, https://doi.org/10.5194/acp-20-11767-2020, 2020. a, b
Korolev, A., Isaac, G., and Hallett, J.: Ice particle habits in Arctic clouds, Geophys. Res. Lett., 26, 1299–1302, 1999. a
Korolev, A., Heckman, I., Wolde, M., Ackerman, A. S., Fridlind, A. M., Ladino, L. A., Lawson, R. P., Milbrandt, J., and Williams, E.: A new look at the environmental conditions favorable to secondary ice production, Atmos. Chem. Phys., 20, 1391–1429, https://doi.org/10.5194/acp-20-1391-2020, 2020. a, b, c
Korolev, A. V., Isaac, G. A., Cober, S. G., Strapp, J. W., and Hallett, J.: Microphysical characterization of mixed-phase clouds, Q. J. Roy. Meteor. Soc., 129, 39–65, 2003. a
Kumjian, M. R., Rutledge, S. A., Rasmussen, R. M., Kennedy, P. C., and Dixon, M.: High-resolution polarimetric radar observations of snow-generating cells, J. Appl. Meteorol. Climatol., 53, 1636–1658, 2014. a, b, c, d, e
Lamb, D. and Verlinde, J.: Physics and Chemistry of Clouds, Cambridge University Press, Cambridge, 2011. a
Langham, E. and Mason, B. J.-N.: The heterogeneous and homogeneous nucleation of supercooled water, P. Roy. Soc. Lond. A, 247, 493–504, 1958. a, b
Lauber, A., Kiselev, A., Pander, T., Handmann, P., and Leisner, T.: Secondary ice formation during freezing of levitated droplets, J. Atmos. Sci., 75, 2815–2826, 2018. a, b
Lauber, A., Henneberger, J., Mignani, C., Ramelli, F., Pasquier, J. T., Wieder, J., Hervo, M., and Lohmann, U.: Continuous secondary-ice production initiated by updrafts through the melting layer in mountainous regions, Atmos. Chem. Phys., 21, 3855–3870, https://doi.org/10.5194/acp-21-3855-2021, 2021. a, b, c
Lawson, R. P., Woods, S., and Morrison, H.: The microphysics of ice and precipitation development in tropical cumulus clouds, J. Atmos. Sci., 72, 2429–2445, 2015. a
Lloyd, G., Choularton, T. W., Bower, K. N., Gallagher, M. W., Connolly, P. J., Flynn, M., Farrington, R., Crosier, J., Schlenczek, O., Fugal, J., and Henneberger, J.: The origins of ice crystals measured in mixed-phase clouds at the high-alpine site Jungfraujoch, Atmos. Chem. Phys., 15, 12953–12969, https://doi.org/10.5194/acp-15-12953-2015, 2015. a, b, c, d, e, f, g
Löffler-Mang, M. and Joss, J.: An optical disdrometer for measuring size and velocity of hydrometeors, J. Atmos. Ocean. Tech., 17, 130–139, 2000. a
Lohmann, U., Henneberger, J., Henneberg, O., Fugal, J., Bühl, J., and Kanji, Z. A.: Persistence of orographic mixed-phase clouds, Geophys. Res. Lett., 43, 10–512, 2016a. a, b
Lohmann, U., Lüönd, F., and Mahrt, F.: An Introduction to Clouds: From the Microscale to Climate, Cambridge University Press, Cambridge, https://doi.org/10.1017/CBO9781139087513, 2016b. a
Löhnert, U. and Crewell, S.: Accuracy of cloud liquid water path from ground‐based microwave radiometry 1. Dependency on cloud model statistics, Radio Sci., 38, 8041, https://doi.org/10.1029/2002RS002654, 2003. a
Lowenthal, D., Hallar, A. G., McCubbin, I., David, R., Borys, R., Blossey, P., Muhlbauer, A., Kuang, Z., and Moore, M.: Isotopic fractionation in wintertime orographic clouds, J. Atmos. Ocean. Tech., 33, 2663–2678, 2016. a, b, c, d
Lowenthal, D. H., Borys, R. D., Cotton, W., Saleeby, S., Cohn, S. A., and Brown, W. O.: The altitude of snow growth by riming and vapor deposition in mixed-phase orographic clouds, Atmos. Environ., 45, 519–522, 2011. a, b, c
Lowenthal, D. H., Hallar, A. G., David, R. O., McCubbin, I. B., Borys, R. D., and Mace, G. G.: Mixed-phase orographic cloud microphysics during StormVEx and IFRACS, Atmos. Chem. Phys., 19, 5387–5401, https://doi.org/10.5194/acp-19-5387-2019, 2019. a, b, c, d, e, f
Magono, C. and Lee, C. W.: Meteorological classification of natural snow crystals, Journal of the Faculty of Science, Hokkaido University. Series 7, Geophysics, 2, 321–335, 1966. a, b, c
Marshall, J. S. and Langleben, M. P.: A theory of snow-crystal habit and growth, J. Meteorol., 11, 104–120, 1954. a
Mason, B. and Maybank, J.: The fragmentation and electrification of freezing water drops, Q. J. Roy. Meteor. Soc., 86, 176–185, 1960. a, b
Mignani, C., Creamean, J. M., Zimmermann, L., Alewell, C., and Conen, F.: New type of evidence for secondary ice formation at around −15 ∘C in mixed-phase clouds, Atmos. Chem. Phys., 19, 877–886, https://doi.org/10.5194/acp-19-877-2019, 2019. a, b
Mignani, C., Wieder, J., Sprenger, M. A., Kanji, Z. A., Henneberger, J., Alewell, C., and Conen, F.: Towards parameterising atmospheric concentrations of ice-nucleating particles active at moderate supercooling, Atmos. Chem. Phys., 21, 657–664, https://doi.org/10.5194/acp-21-657-2021, 2021. a, b
Miller, A. J., Brennan, K. P., Mignani, C., Wieder, J., David, R. O., and Borduas-Dedekind, N.: Development of the drop Freezing Ice Nuclei Counter (FINC), intercomparison of droplet freezing techniques, and use of soluble lignin as an atmospheric ice nucleation standard, Atmos. Meas. Tech. Discuss. [preprint], https://doi.org/10.5194/amt-2020-414, in review, 2020. a
Mitchell, D. L.: Use of mass-and area-dimensional power laws for determining precipitation particle terminal velocities, J. Atmos. Sci., 53, 1710–1723, 1996. a
Mitchell, D. L., Zhang, R., and Pitter, R. L.: Mass-dimensional relationships for ice particles and the influence of riming on snowfall rates, J. Appl. Meteorol., 29, 153–163, 1990. a, b
Morrison, H., Zuidema, P., Ackerman, A. S., Avramov, A., de Boer,G., Fan, J., Fridlind, A. M., Hashino, T., Harrington, J. Y., Luo,Y., Mikhail Ovchinnikov, M., and Shipway, B.: Intercompari-son of cloud model simulations of Arctic mixed-phase boundarylayer clouds observed during SHEBA, J. Adv. Mod. Earth Systems, 3, M06003, https://doi.org/10.1029/2011MS000066, 2011. a
Morrison, H., De Boer, G., Feingold, G., Harrington, J., Shupe, M. D., and Sulia, K.: Resilience of persistent Arctic mixed-phase clouds, Nat. Geosci., 5, 11–17, 2012. a, b
Mossop, S.: The influence of drop size distribution on the production of secondary ice particles during graupel growth, Q. J. Roy. Meteor. Soc., 104, 323–330, 1978. a, b
Mülmenstädt, J., Sourdeval, O., Delanoë, J., and Quaas, J.: Frequency of occurrence of rain from liquid-, mixed-, and ice-phase clouds derived from A-Train satellite retrievals, Geophys. Res. Lett., 42, 6502–6509, 2015. a
Myagkov, A., Seifert, P., Wandinger, U., Bauer-Pfundstein, M., and Matrosov, S. Y.: Effects of antenna patterns on cloud radar polarimetric measurements, J. Atmos. Ocean. Tech., 32, 1813–1828, 2015. a
Myagkov, A., Seifert, P., Wandinger, U., Bühl, J., and Engelmann, R.: Relationship between temperature and apparent shape of pristine ice crystals derived from polarimetric cloud radar observations during the ACCEPT campaign, Atmos. Meas. Tech., 9, 3739–3754, https://doi.org/10.5194/amt-9-3739-2016, 2016. a, b
Pinto, J. O.: Autumnal mixed-phase cloudy boundary layers in the Arctic, J. Atmos. Sci., 55, 2016–2038, 1998. a
Plummer, D. M., McFarquhar, G. M., Rauber, R. M., Jewett, B. F., and Leon, D. C.: Structure and statistical analysis of the microphysical properties of generating cells in the comma head region of continental winter cyclones, J. Atmos. Sci., 71, 4181–4203, 2014. a, b, c, d
Plummer, D. M., McFarquhar, G. M., Rauber, R. M., Jewett, B. F., and Leon, D. C.: Microphysical properties of convectively generated fall streaks within the stratiform comma head region of continental winter cyclones, J. Atmos. Sci., 72, 2465–2483, 2015. a, b, c
Possner, A., Ekman, A. M., and Lohmann, U.: Cloud response and feedback processes in stratiform mixed-phase clouds perturbed by ship exhaust, Geophys. Res. Lett., 44, 1964–1972, 2017. a, b, c
Praz, C., Roulet, Y.-A., and Berne, A.: Solid hydrometeor classification and riming degree estimation from pictures collected with a Multi-Angle Snowflake Camera, Atmos. Meas. Tech., 10, 1335–1357, https://doi.org/10.5194/amt-10-1335-2017, 2017. a
Radenz, M., Bühl, J., Seifert, P., Griesche, H., and Engelmann, R.: peakTree: a framework for structure-preserving radar Doppler spectra analysis, Atmos. Meas. Tech., 12, 4813–4828, https://doi.org/10.5194/amt-12-4813-2019, 2019. a, b, c
Ramelli, F., Beck, A., Henneberger, J., and Lohmann, U.: Using a holographic imager on a tethered balloon system for microphysical observations of boundary layer clouds, Atmos. Meas. Tech., 13, 925–939, https://doi.org/10.5194/amt-13-925-2020, 2020. a, b
Ramelli, F., Henneberger, J., David, R. O., Lauber, A., Pasquier, J. T., Wieder, J., Bühl, J., Seifert, P., Engelmann, R., Hervo, M., and Lohmann, U.: Influence of low-level blocking and turbulence on the microphysics of a mixed-phase cloud in an inner-Alpine valley, Atmos. Chem. Phys., 21, 5151–5172, https://doi.org/10.5194/acp-21-5151-2021, 2021. a, b
Ramelli, F., Henneberger, J., David, R. O., Bühl, J., Radenz, M., Seifert, P., Wieder, J., Lauber, A., Pasquier, J. T., Engelmann, R., Baars, H., Mignani, C., Hervo, M., and Lohmann, U.: Data for the publication “Microphysical investigation of the seeder and feeder region of an Alpine mixed-phase cloud”, Zenodo, https://doi.org/10.5281/zenodo.4644553, 2021a. a
Ramelli, F., Henneberger, J., David, R. O., Bühl, J., Radenz, M., Seifert, P., Wieder, J., Lauber, A., Pasquier, J. T., Engelmann, R., Mignani, C., Hervo, M., and Lohmann, U.: Scripts for the publication “Microphysical investigation of the seeder and feeder region of an Alpine mixed-phase cloud”, Zenodo, https://doi.org/10.5281/zenodo.4645427, 2021b. a
Rasmussen, R. M., Geresdi, I., Thompson, G., Manning, K., and Karplus, E.: Freezing drizzle formation in stably stratified layer clouds: The role of radiative cooling of cloud droplets, cloud condensation nuclei, and ice initiation, J. Atmos. Sci., 59, 837–860, 2002. a
Rauber, R. M. and Grant, L. O.: The characteristics and distribution of cloud water over the mountains of northern Colorado during wintertime storms. Part II: Spatial distribution and microphysical characteristics, J. Clim. Appl. Meteorol., 25, 489–504, 1986. a
Rauber, R. M. and Tokay, A.: An explanation for the existence of supercooled water at the top of cold clouds, J. Atmos. Sci., 48, 1005–1023, 1991. a
Rauber, R. M., Plummer, D. M., Macomber, M. K., Rosenow, A. A., McFarquhar, G. M., Jewett, B. F., Leon, D., Owens, N., and Keeler, J. M.: The role of cloud-top generating cells and boundary layer circulations in the finescale radar structure of a winter cyclone over the Great Lakes, Mon. Weather Rev., 143, 2291–2318, 2015. a, b, c
Reinking, R. F., Snider, J. B., and Coen, J. L.: Influences of storm-embedded orographic gravity waves on cloud liquid water and precipitation, J. Appl. Meteorol., 39, 733–759, 2000. a
Rogers, D. C. and Vali, G.: Ice crystal production by mountain surfaces, J. Clim. Appl. Meteorol., 26, 1152–1168, 1987. a, b, c, d, e, f
Rose, T., Crewell, S., Löhnert, U., and Simmer, C.: A network suitable microwave radiometer for operational monitoring of the cloudy atmosphere, Atmos. Res., 75, 183–200, 2005. a
Rosenow, A. A., Plummer, D. M., Rauber, R. M., McFarquhar, G. M., Jewett, B. F., and Leon, D.: Vertical velocity and physical structure of generating cells and convection in the comma head region of continental winter cyclones, J. Atmos. Sci., 71, 1538–1558, 2014. a, b, c
Saleeby, S. M., Cotton, W. R., Lowenthal, D., Borys, R. D., and Wetzel, M. A.: Influence of cloud condensation nuclei on orographic snowfall, J. Appl. Meteorol. Climatol., 48, 903–922, 2009. a
Saleeby, S. M., Cotton, W. R., and Fuller, J. D.: The cumulative impact of cloud droplet nucleating aerosols on orographic snowfall in Colorado, J. Appl. Meteorol. Climatol., 50, 604–625, 2011. a
Saleeby, S. M., Cotton, W. R., Lowenthal, D., and Messina, J.: Aerosol impacts on the microphysical growth processes of orographic snowfall, J. Appl. Meteorol. Climatol., 52, 834–852, 2013. a
Stark, D., Colle, B. A., and Yuter, S. E.: Observed microphysical evolution for two East Coast winter storms and the associated snow bands, Mon. Weather Rev., 141, 2037–2057, 2013. a, b
Steinke, S., Eikenberg, S., Löhnert, U., Dick, G., Klocke, D., Di Girolamo, P., and Crewell, S.: Assessment of small-scale integrated water vapour variability during HOPE, Atmos. Chem. Phys., 15, 2675–2692, https://doi.org/10.5194/acp-15-2675-2015, 2015. a
Stoelinga, M. T., Locatelli, J. D., and Woods, C. P.: The occurrence of “irregular” ice particles in stratiform clouds, J. Atmos. Sci., 64, 2740–2750, 2007. a
Stopelli, E., Conen, F., Zimmermann, L., Alewell, C., and Morris, C. E.: Freezing nucleation apparatus puts new slant on study of biological ice nucleators in precipitation, Atmos. Meas. Tech., 7, 129–134, https://doi.org/10.5194/amt-7-129-2014, 2014. a
Sun, Z. and Shine, K. P.: Studies of the radiative properties of ice and mixed-phase clouds, Q. J. Roy. Meteor. Soc., 120, 111–137, 1994. a, b
Takahashi, T., Nagao, Y., and Kushiyama, Y.: Possible high ice particle production during graupel–graupel collisions, J. Atmos. Sci., 52, 4523–4527, 1995. a
Tokay, A., Wolff, D. B., and Petersen, W. A.: Evaluation of the new version of the laser-optical disdrometer, OTT Parsivel2, J. Atmos. Ocean. Technol., 31, 1276–1288, 2014. a
Touloupas, G., Lauber, A., Henneberger, J., Beck, A., and Lucchi, A.: A convolutional neural network for classifying cloud particles recorded by imaging probes, Atmos. Meas. Tech., 13, 2219–2239, https://doi.org/10.5194/amt-13-2219-2020, 2020. a, b
Turner, D., Shupe, M., and Zwink, A.: Characteristic atmospheric radiative heating rate profiles in Arctic clouds as observed at Barrow, Alaska, J. Appl. Meteorol. Climatol., 57, 953–968, 2018. a, b, c, d, e
Vali, G.: Revisiting the differential freezing nucleus spectra derived from drop-freezing experiments: methods of calculation, applications, and confidence limits, Atmos. Meas. Tech., 12, 1219–1231, https://doi.org/10.5194/amt-12-1219-2019, 2019. a
Vardiman, L.: The generation of secondary ice particles in clouds by crystal–crystal collision, J. Atmos. Sci., 35, 2168–2180, 1978. a, b
Walter, B., Huwald, H., Gehring, J., Bühler, Y., and Lehning, M.: Radar measurements of blowing snow off a mountain ridge, The Cryosphere, 14, 1779–1794, https://doi.org/10.5194/tc-14-1779-2020, 2020. a
Wang, Y., McFarquhar, G. M., Rauber, R. M., Zhao, C., Wu, W., Finlon, J. A., Stechman, D. M., Stith, J., Jensen, J. B., Schnaiter, M., Järvinen, E., Waitz, F., Vivekanandan, J., Dixon, M., Rainwater, B., and Toohey, D. W.: Microphysical properties of generating cells over the Southern Ocean: Results from SOCRATES, J. Geophys. Res.-Atmos., 125, e2019JD032237, https://doi.org/10.1029/2019JD032237, 2020. a
Wegener, A.: Thermodynamik der Atmosphäre, J. A. Barth Verlag, Leipzig, Germany, 331 pp., 1911. a
Westbrook, C. D. and Illingworth, A. J.: Evidence that ice forms primarily in supercooled liquid clouds at temperatures >−27 ∘C, Geophys. Res. Lett., 38, L14808, https://doi.org/10.1029/2011GL048021, 2011. a
- Abstract
- Introduction
- Data and methods
- Description of the case study
- Results and discussion
- Conclusions
- Appendix A: The use of the maximum Doppler velocity as a proxy for regions with updrafts and liquid water
- Appendix B: Potential mechanisms in generating cells and their contribution to ICNC
- Code and data availability
- Author contributions
- Competing interests
- Acknowledgements
- Financial support
- Review statement
- References