the Creative Commons Attribution 4.0 License.
the Creative Commons Attribution 4.0 License.
 | 27 Apr 2021
Mapping the drivers of formaldehyde (HCHO) variability from 2015 to 2019 over eastern China: insights from Fourier transform infrared observation and GEOS-Chem model simulation
Youwen Sun
Hao Yin
Lin Zhang
Mathias Palm
Justus Notholt
Corinne Vigouroux
Wei Wang
Nicholas Jones
Changong Shan
Min Qin
Yuan Tian
Qihou Hu
Fanhao Meng
Jianguo Liu
The major air pollutant emissions have decreased, and the overall air quality has substantially improved across China in recent years as a consequence of active clean air policies for mitigating severe air pollution problems. As key precursors of formaldehyde (HCHO) and ozone (O3), the volatile organic compounds (VOCs) in China are still increasing due to the lack of mitigation measures for VOCs. In this study, we investigated the drivers of HCHO variability from 2015 to 2019 over Hefei, eastern China, by using ground-based high-resolution Fourier transform infrared (FTIR) spectroscopy and GEOS-Chem model simulation. Seasonal and interannual variabilities of HCHO over Hefei were analyzed and hydroxyl (OH) radical production rates from HCHO photolysis were evaluated. The relative contributions of emitted and photochemical sources to the observed HCHO were analyzed by using ground-level carbon monoxide (CO) and Ox (O3 + nitrogen oxide (NO2)) as tracers for emitted and photochemical HCHO, respectively. Contributions of emission sources from various categories and geographical regions to the observed HCHO summertime enhancements were determined by using a series of GEOS-Chem sensitivity simulations. The column-averaged dry air mole fractions of HCHO (XHCHO) reached a maximum monthly mean value of 1.1 ± 0.27 ppbv in July and a minimum monthly mean value of 0.4 ± 0.11 ppbv in January. The XHCHO time series from 2015 to 2019 over Hefei showed a positive change rate of 2.38 ± 0.71 % per year. The photochemical HCHO is the dominant source of atmospheric HCHO over Hefei for most of the year (68.1 %). In the studied years, the HCHO photolysis was an important source of OH radicals over Hefei during all sunlight hours of both summer and winter days. The oxidations of both methane (CH4) and nonmethane VOCs (NMVOCs) dominate the HCHO production over Hefei and constitute the main driver of its summertime enhancements. The NMVOC-related HCHO summertime enhancements were dominated by the emissions within eastern China. The observed increasing change rate of HCHO from 2015 to 2019 over Hefei was attributed to the increase in photochemical HCHO resulting from increasing change rates of both CH4 and NMVOC oxidations, which overwhelmed the decrease in emitted HCHO. This study provides a valuable evaluation of recent VOC emissions and regional photochemical capacity in China. In addition, understanding the sources of HCHO is a necessary step for tackling air pollution in eastern China and mitigating the emissions of pollutants.
- Article
(5418 KB) - Full-text XML
-
Supplement
(307 KB) - BibTeX
- EndNote


Formaldehyde (HCHO) is one of the most critical tropospheric pollutants, which not only directly threatens human health, but also plays a significant role in atmospheric photochemical reactions (Franco et al., 2015; Jones et al., 2009; Notholt et al., 1992, 2000; Vigouroux et al., 2009). Indeed, the chemistry of HCHO is common to virtually all mechanisms of tropospheric chemistry (Seinfeld and Pandis, 2016, chap. 6). Furthermore, the observation of HCHO variability allows us to constrain volatile organic compound (VOC) emissions and improve current understanding of the complex degradation mechanisms of VOCs (e.g., Palmer et al., 2003; Millet et al., 2008; Boersma et al., 2009; Stavrakou et al., 2009; Fortems-Cheiney et al., 2012; Barkley et al., 2013; Marais et al., 2014; Streets et al., 2013; Gao et al., 2018).
Natural sources such as biomass burning emission and anthropogenic sources such as vehicle exhausts, industrial emissions, and coal combustions can emit HCHO directly into the atmosphere (Albrecht et al., 2002; Holzinger et al., 1999). The emitted HCHO is mainly attributed to incomplete combustion and is closely associated with the emissions of benzene (C9H12O), toluene (C7H8), or carbon monoxide (CO) (Friedfeld et al., 2002; Garcia et al., 2006; Ma et al., 2016). In addition, photochemical formation of HCHO has been identified from the atmospheric oxidation of methane (CH4) and numerous nonmethane VOCs (NMVOCs), which are closely associated with the formation of ozone (O3) or Ox (O3 + nitrogen dioxide (NO2)) or glyoxal (CHOCHO) (Seinfeld and Pandis, 2016, chap. 6; Friedfeld et al., 2002; Garcia et al., 2006; Zhang et al., 2019). As a result, the relative contribution of emitted and photochemical sources to atmospheric HCHO can be estimated via a linear multiple regression analysis method that aims at reproducing the time series of observed HCHO from a linear combination of the time series of CO (or C9H12O or C7H8) and O3 (or Ox or CHOCHO) as tracers for emitted and photochemical HCHO, respectively (Friedfeld et al., 2002; Garcia et al., 2006; Hong et al., 2018; Li et al., 2010; Lui et al., 2017; Ma et al., 2016; Su et al., 2019). The separation between emitted and photochemical sources of HCHO is important for improving the air quality in megacities (Garcia et al., 2006).
The relative contribution of emitted and photochemical sources to atmospheric HCHO has been analyzed by using the CO–O3 (Friedfeld et al., 2002; Li et al., 2010; Lui et al., 2017; Su et al., 2019), CO–Ox (Hong et al., 2018), CO–CHOCHO (Garcia et al., 2006) and CO C9H12O C7H8–O3 (Ma et al., 2016) tracer pairs in various polluted environments. In these studies, HCHO column measurements were sometimes used as representatives of near-surface conditions because the HCHO has a vertical distribution that is heavily weighted toward the lower troposphere over polluted areas. Improved knowledge of the contributions of different emission categories and geographical regions to HCHO enhancements is significant for improving the understanding of the HCHO production regime and further for regulatory and control purposes (Molina and Molina, 2002; Surl et al., 2018). However, previous studies have often concentrated on the separation between emitted and photochemical sources of HCHO, while contributions of different emission categories and geographical regions were rarely mentioned or only analyzed qualitatively by using the back-trajectory analysis technique (Friedfeld et al., 2002; Franco et al., 2016; Garcia et al., 2006; Hong et al., 2018; Li et al., 2010; Lui et al., 2017; Ma et al., 2016; Su et al., 2019). In this study, the drivers of HCHO variability over Hefei, eastern China, were mapped using ground-based high-resolution Fourier transform infrared (FTIR) spectroscopy and GEOS-Chem model simulation. Seasonal and interannual variabilities of HCHO were investigated and hydroxyl (OH) radical production rates from HCHO photolysis were evaluated. In addition to separation between emitted and photochemical sources, contributions of different emission categories and geographical regions to the observed HCHO summertime enhancement were also investigated.
China has implemented a series of active clean air policies in recent years to mitigate severe air pollution problems. Therefore, the emissions of major air pollutants have decreased, and the overall air quality has substantially improved (Sun et al., 2018a; Zhang et al., 2019; Zheng et al., 2018). However, current clean air policies lack mitigation measures for VOCs, which are key precursors of HCHO and O3 (Lu et al., 2018; Zheng et al., 2018). The recent increasing trend in O3 in China was largely attributed to the increase in VOCs in recent years (Lu et al., 2019). Multi-year time series of ground-based FTIR measurements of HCHO in this study provide an evaluation of recent regional VOC emissions over eastern China. The degradation of HCHO provides a large source of OH radicals, which play a significant role in atmospheric photochemical reactions (chap. 6, Seinfeld and Pandis, 2016). The OH radical production rates from HCHO photolysis estimated in this study provide an evaluation of regional photochemical capacity related to the degradation of HCHO over eastern China. In addition, understanding the sources of HCHO is a necessary step for tackling the problems of poor air quality in eastern China and mitigating the emissions of pollutants.
The next section describes the methodology which includes site description and instrumentation, the ground-based FTIR HCHO dataset, the third regression model used to determine seasonal and interannual variabilities of HCHO, the linear regression model used for source separation, and the GEOS-Chem sensitivity simulations used for source attribution. Section 3 reports the results for comparison with ground-level in situ measurements, HCHO variability on different timescales, source separation, and OH radical production rates from HCHO photolysis. Section 4 reports the results for source attribution using GEOS-Chem sensitivity simulations. Conclusions are presented in Sect. 5.
2.1 Site description and instrumentation
As shown in Fig. 1, the FTIR observation site (117∘10′ E, 31∘54′ N; 30 m a.s.l. – above sea level) is located on an island in the western suburbs of the megacity Hefei (the capital of Anhui Province) in eastern China (Tian et al., 2017; Yin et al., 2019). The Anhui Institute of Optics and Fine Mechanics, Chinese Academy of Sciences (AIOFM-CAS), directly operates this site on campus, adjacent to the Shu Shan Lake that covers an area of 207.5 km2. This area is dominated by southeasterly winds in summer and northwesterly winds in winter. The regional landscape is mostly flat with a few hills. Downtown Hefei is located to the southeast of this site and is densely populated with 7 million people. The site is surrounded by wetlands or cultivated lands in other directions (Tian et al., 2017). Local anthropogenic emissions mainly come from the city, and natural emissions originate from cultivated lands or wetlands.
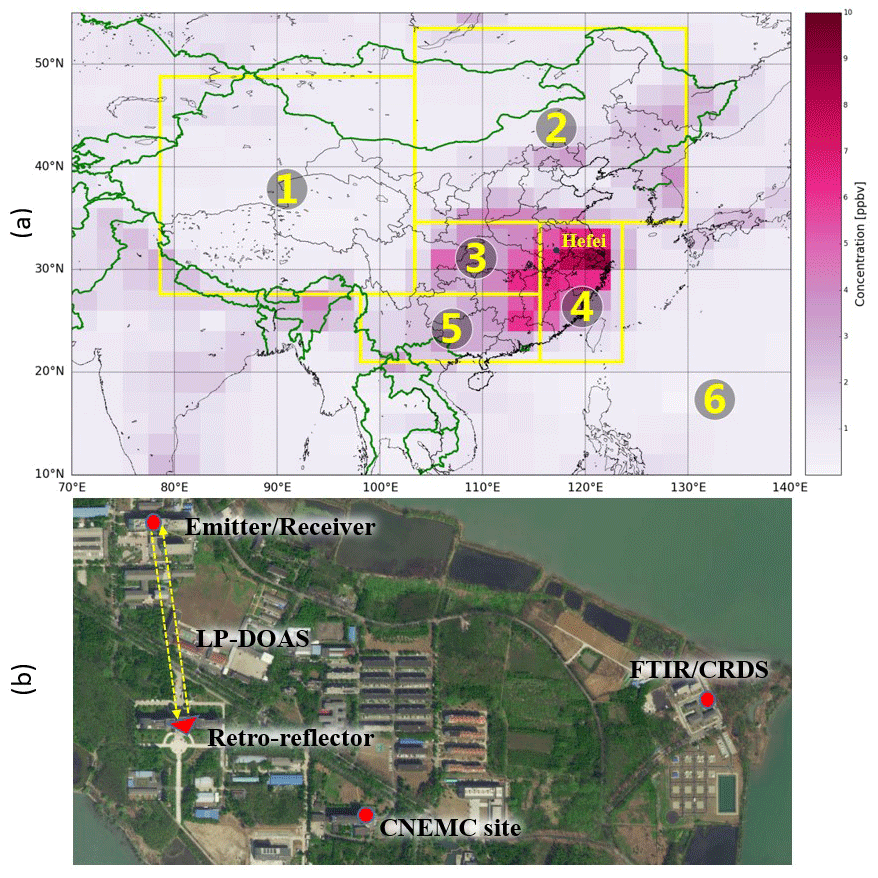
Figure 1(a) Location of the FTIR site at Hefei, eastern China, and geographical regions used in GEOS-Chem sensitivity simulation. See Table 3 for latitude and longitude delimitation of each region. GEOS-Chem HCHO simulations on 24 July 2016 were selected for demonstration of summertime enhancement over eastern China. Region (1) covers a few sparse city clusters representing the region with the least population and industrialization in China. Regions (2), (4), and (5) cover the North China Plain (NCP), Yangtze River delta (YRD), and Pearl River delta (PRD) city clusters, respectively, which are the three most developed city clusters with severe air pollution in China. Region (3) covers the Sichuan Basin (SCB) and central Yangtze River (CYR) city clusters with newly emerging severe air pollution in China. (b) An overview of the location of the FTIR site, the CNEMC site and the optical path of the xenon LP-DOAS instrument. The base map of (a) is created by the Basemap package of Python. The base map of (b) is provided by AMAP software (http://ditu.amap.com/, last access: 24 January 2021).
The FTIR observatory consists of a high-resolution FTIR spectrometer (IFS125HR, Bruker GmbH, Germany) and a solar tracker (Tracker-A Solar 547, Bruker GmbH, Germany). The near-infrared (NIR) and middle-infrared (MIR) solar spectra are alternately recorded in routine observations (Wang et al., 2017). The MIR spectra are recorded with a spectral resolution of 0.005 cm−1 which follows the requirements of the Network for Detection of Atmospheric Composition Change (NDACC, http://www.ndacc.org/, last access: 3 June 2019). In this study, the instrument is equipped with a KBr beam splitter, an InSb detector, and a filter centered at 2800 cm−1 for HCHO measurements. The entrance field stop size ranging from 0.80 to 1.5 mm was employed to maximize the signal-to-noise ratio (SNR) consistent with the maximum frequency possible for the selected wavenumber range. The number of HCHO measurements on each measurement day varied from 1 to 17, with an average of 6. In total, there were 523 d of qualified measurements between 2015 and 2019.
Ground-level hourly mean concentrations of CO, O3, and NO2 from 2015 to 2019 were provided by the China National Environmental Monitoring Center (CNEMC) network operated by the Chinese Ministry of Ecology and Environment (http://www.cnemc.cn/en/, last access: 22 March 2020). The CNEMC network has monitored six ground-level air pollutants (including CO, O3, NO2, SO2, PM10, and PM2.5) in nationwide sites in mainland China since 2013, and by 2019, it had been extended to more than 2000 sites in 454 cities. The datasets have been used in many studies to evaluate local air quality over China (Gao et al., 2018; Hong et al., 2018; Hu et al., 2017; Li et al., 2018; Lu et al., 2018; Shen et al., 2019; Su et al., 2019). The measurements taken at the nearest CNEMC site were used in this study, which is approximately 700 m away from the FTIR site (Fig. 1b). The O3 and NO2 measurements are based on a differential optical absorption spectroscopy (DOAS) analyzer, and the CO measurements are based on a gas correlation filter infrared analyzer. All analyzers are regularly calibrated by the CNEMC staffs to ensure the measurement errors for all gases are within 2 % (http://www.cnemc.cn/en/, last access: 22 March 2020).
Ground-level 10 min mean concentrations of HCHO from 2017 to 2019 were provided by a long-path DOAS instrument (LP-DOAS) located over approximately 900 m away from the FTIR site (Fig. 1b). The LP-DOAS instrument consists of a 150 W xenon short-arc lamp as the light source, a telescope with a diameter of 220 mm and focal length of 650 mm acting as the transmitting and receiving component, a retro-reflector and a grating spectrograph. The telescope and the retro-reflector were placed about 30 m above ground at two buildings which are separated by a distance of 350 m, resulting in a total measurement optical path of 700 m. Light from the xenon lamp is directed to the telescope and transmitted towards to the retro-reflector. Reflected light from the retro-reflector is received by the same telescope and redirected to the spectrograph for spectral analysis. A fan is installed in the emitter/receiver unit to avoid the influence of O3 generated by the xenon lamp. A similar experimental setup with LEDs as the light source has been demonstrated by Chan et al. (2012) and Zheng et al. (2018). The measurement error for HCHO by the LP-DOAS is estimated to be 3 % (Chan et al., 2012; Ling et al., 2014).
Ground-level minutely mean concentrations of H2O from 2015 to 2019 were available from a cavity ring-down spectroscopy (CRDS) analyzer (G2401m, Picarro, Inc., USA) which is located side by side with the FTIR spectrometer (Fig. 1b). The CRDS analyzer samples ambient air on the building roof near the solar tracker dome and outputs H2O concentration with a measurement error of 1 %.
2.2 Ground-based FTIR HCHO dataset
2.2.1 Retrieval strategy
The SFIT4 version 0.9.4.4 algorithm was used in the HCHO retrieval, and the retrieval settings were prescribed from a harmonization project described in Vigouroux et al. (2018). We refer to Pougatchev et al. (1995) for more details on the retrieval principles. Total columns and volume mixing ratio (VMR) vertical profiles of HCHO are obtained from its pressure and temperature-dependent absorption lines. Four micro-windows (MWs) were used: two strong lines within 2778–2782 cm−1 and two weak lines within 2763–2766 cm−1 (Vigouroux et al., 2018). The profiles of CH4 and O3 and total columns of HDO and N2O were simultaneously retrieved in addition to the HCHO profile for minimizing the cross interference.
All spectroscopic absorption parameters were based on the atm16 line list from the compilation of Geoffrey Toon (Vigouroux et al., 2018). In this atm16 line list, the HCHO and N2O lines correspond to the HITRAN 2012 database (Rothman et al., 2013). This HITRAN 2012 database includes the latest improved HCHO parameters (broadening coefficients, Jacquemart et al., 2010), which complement the release in HITRAN 2008 (Rothman et al., 2009) of new HCHO line intensities from the same group (Perrin et al., 2009). The spectroscopic parameters for the lines of H2O and its isotopologs in atm16 are from Toth 2003 (http://mark4sun.jpl.nasa.gov/data/spec/H2O/RAToth_H2O.tar; last access: 5 September 2019); some lines from O3 and CH4 in the vicinity of HCHO have been empirically adjusted or replaced with older HITRAN versions in atm16 when obvious problems were found in the HITRAN 2012 database (Vigouroux et al., 2018).
The a priori profiles of temperature, pressure, and H2O were interpolated from the National Centers for Environmental Protection (NCEP) 6-hourly reanalysis data, and the a priori profiles of other gases were from the averages of the Whole-Atmosphere Community Climate Model version 6 (WACCM) simulations from 1980 to 2020. The diagonal elements of the a priori profile covariance matrix Sa and the measurement noise covariance matrix Sε were set to the standard deviation (SD) of the WACCM simulations and the inverse square of the signal-to-noise ratio (SNR) of each spectrum, respectively. The non-diagonal elements of both Sa and Sε were set to zero. We regularly used a low-pressure HBr cell to diagnose the instrument line shape (ILS) of the high-resolution FTIR spectrometer at Hefei and included the measured ILS in the retrieval (Hase et al., 2012; Sun et al., 2018b).
2.2.2 Averaging kernels and error budget
The vertical information contained in the FTIR retrievals can be characterized by the averaging kernel matrix A (Rodgers, 2000). The rows of A are the so-called averaging kernels, and they represent the sensitivity of the retrieved profile to the real profile. Their full width at half maximum (FWHM) is a measure of the vertical resolution of the retrieval at a given altitude. The area of averaging kernels represents sensitivity of the retrievals to the measurement. This sensitivity at a specific altitude is calculated as the sum of the elements of the corresponding averaging kernels (Vigouroux et al., 2018). It indicates the fraction of the retrieval at each altitude that comes from the measurement rather than from the a priori information (Rodgers, 2000). A value close to zero at a certain altitude indicates that the retrieved profile at that altitude is nearly independent of measurement and therefore approaches the a priori profile. The trace of the averaging kernel matrix A is the so-called degrees of freedom for signal (DOFs), and it quantifies the amount of independent information in the retrieved vertical profile.
Figure 2 shows the averaging kernels, cumulative sum of DOFs, and VMR profile of randomly selected HCHO retrieval at Hefei. The ground-based FTIR measurements of HCHO at Hefei have a sensitivity larger than 0.5 from the ground to about 15 km altitude, indicating that the retrievals are mainly sensitive to the troposphere. This also means that the retrieved profile information above 15 km comes for less than 50 % from the measurement, or, in other words, that the a priori information influences the retrieval by more than 50 %. The typical DOF over the total atmosphere obtained at Hefei for HCHO is 1.2 ± 0.2 (1σ), meaning that we cannot provide more than one piece of information on the vertical profile. This is the reason that only total columns of HCHO or column-averaged dry air mole fractions of HCHO (XHCHO) are discussed in this paper and not vertical profiles. As expected by the low DOFs, the shape of the retrieved profile which is heavily weighted toward the lower troposphere is very similar to the shape of the a priori profile (not shown here).
We calculated the error budget following the formalism of Rodgers (2000) and separated all error items into systematic or random errors depending on whether they are constant over consecutive measurements or vary randomly. Table 1 summarizes the random, systematic, and combined error budgets for the total column of HCHO demonstrated in Fig. 2. The input covariance matrix of temperature has been estimated using the differences between an ensemble of NCEP and sonde temperature profiles near Hefei, leading to 2 to 5 K in the troposphere and 3 to 7 K in the stratosphere. For each interfering species, the associated covariance matrix was obtained with the WACCM v6 climatology. The input covariance matrix of the measurement error is based on the inverse square of the SNR of each spectrum (see Sect. 2.2.1). The FTIR spectrometer at Hefei is assumed to be not far from the ideal condition, and the input uncertainties for background curvature, optical path difference, field of view, interferogram phase, and ILS are estimated to be 1 %. For the HCHO spectroscopic parameters, the line list in atm16 follows HITRAN 2012 (Rothman et al., 2013), which used the work of Jacquemart et al. (2010), and we use 10 % for line intensity and pressure- and temperature-broadening coefficients. For each individual retrieval parameter and the smoothing error, the input covariance matrix is prescribed from the optimal estimation retrieval output.
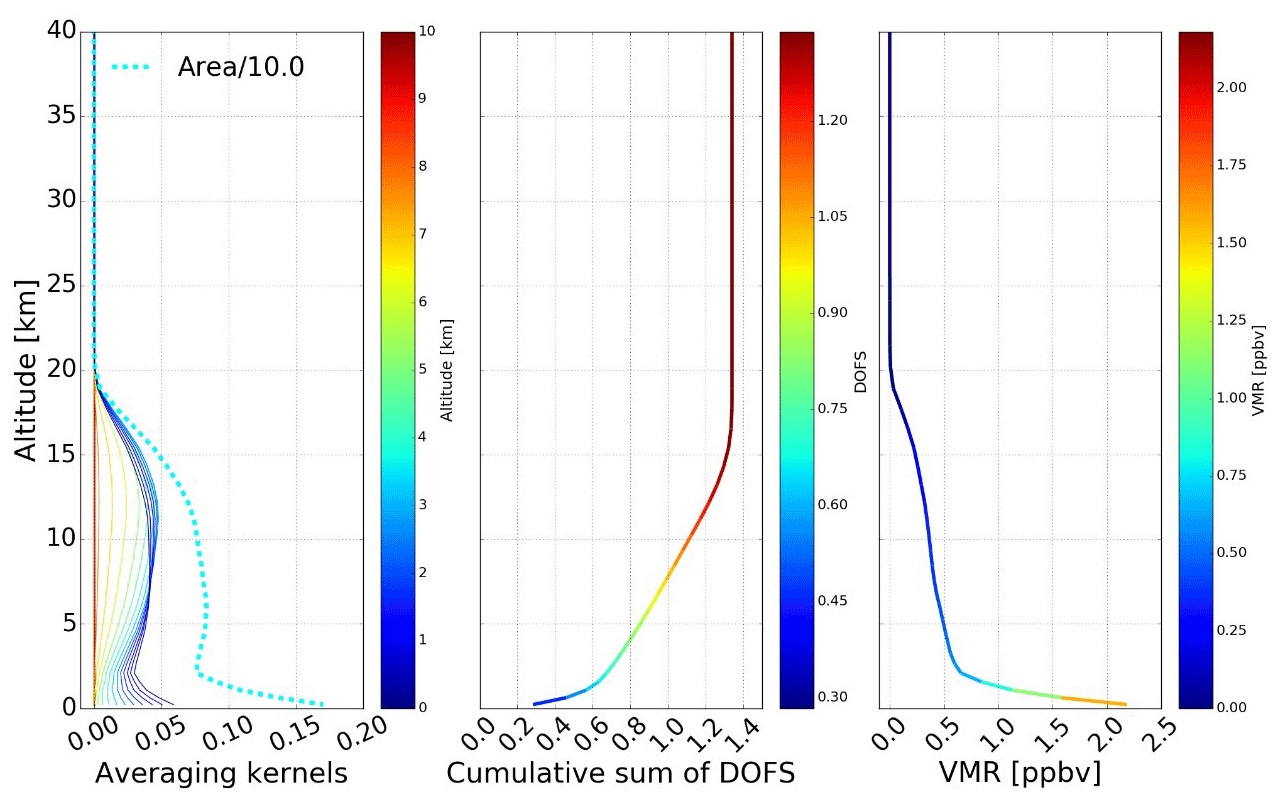
Figure 2Averaging kernels, cumulative sum of degrees of freedom for signal (DOFs) and volume mixing ratio (VMR) profile of randomly selected HCHO retrievals at Hefei, eastern China.
Table 1Error budget and degrees of freedom (DOFs) for the signal of the HCHO retrieval at Hefei.
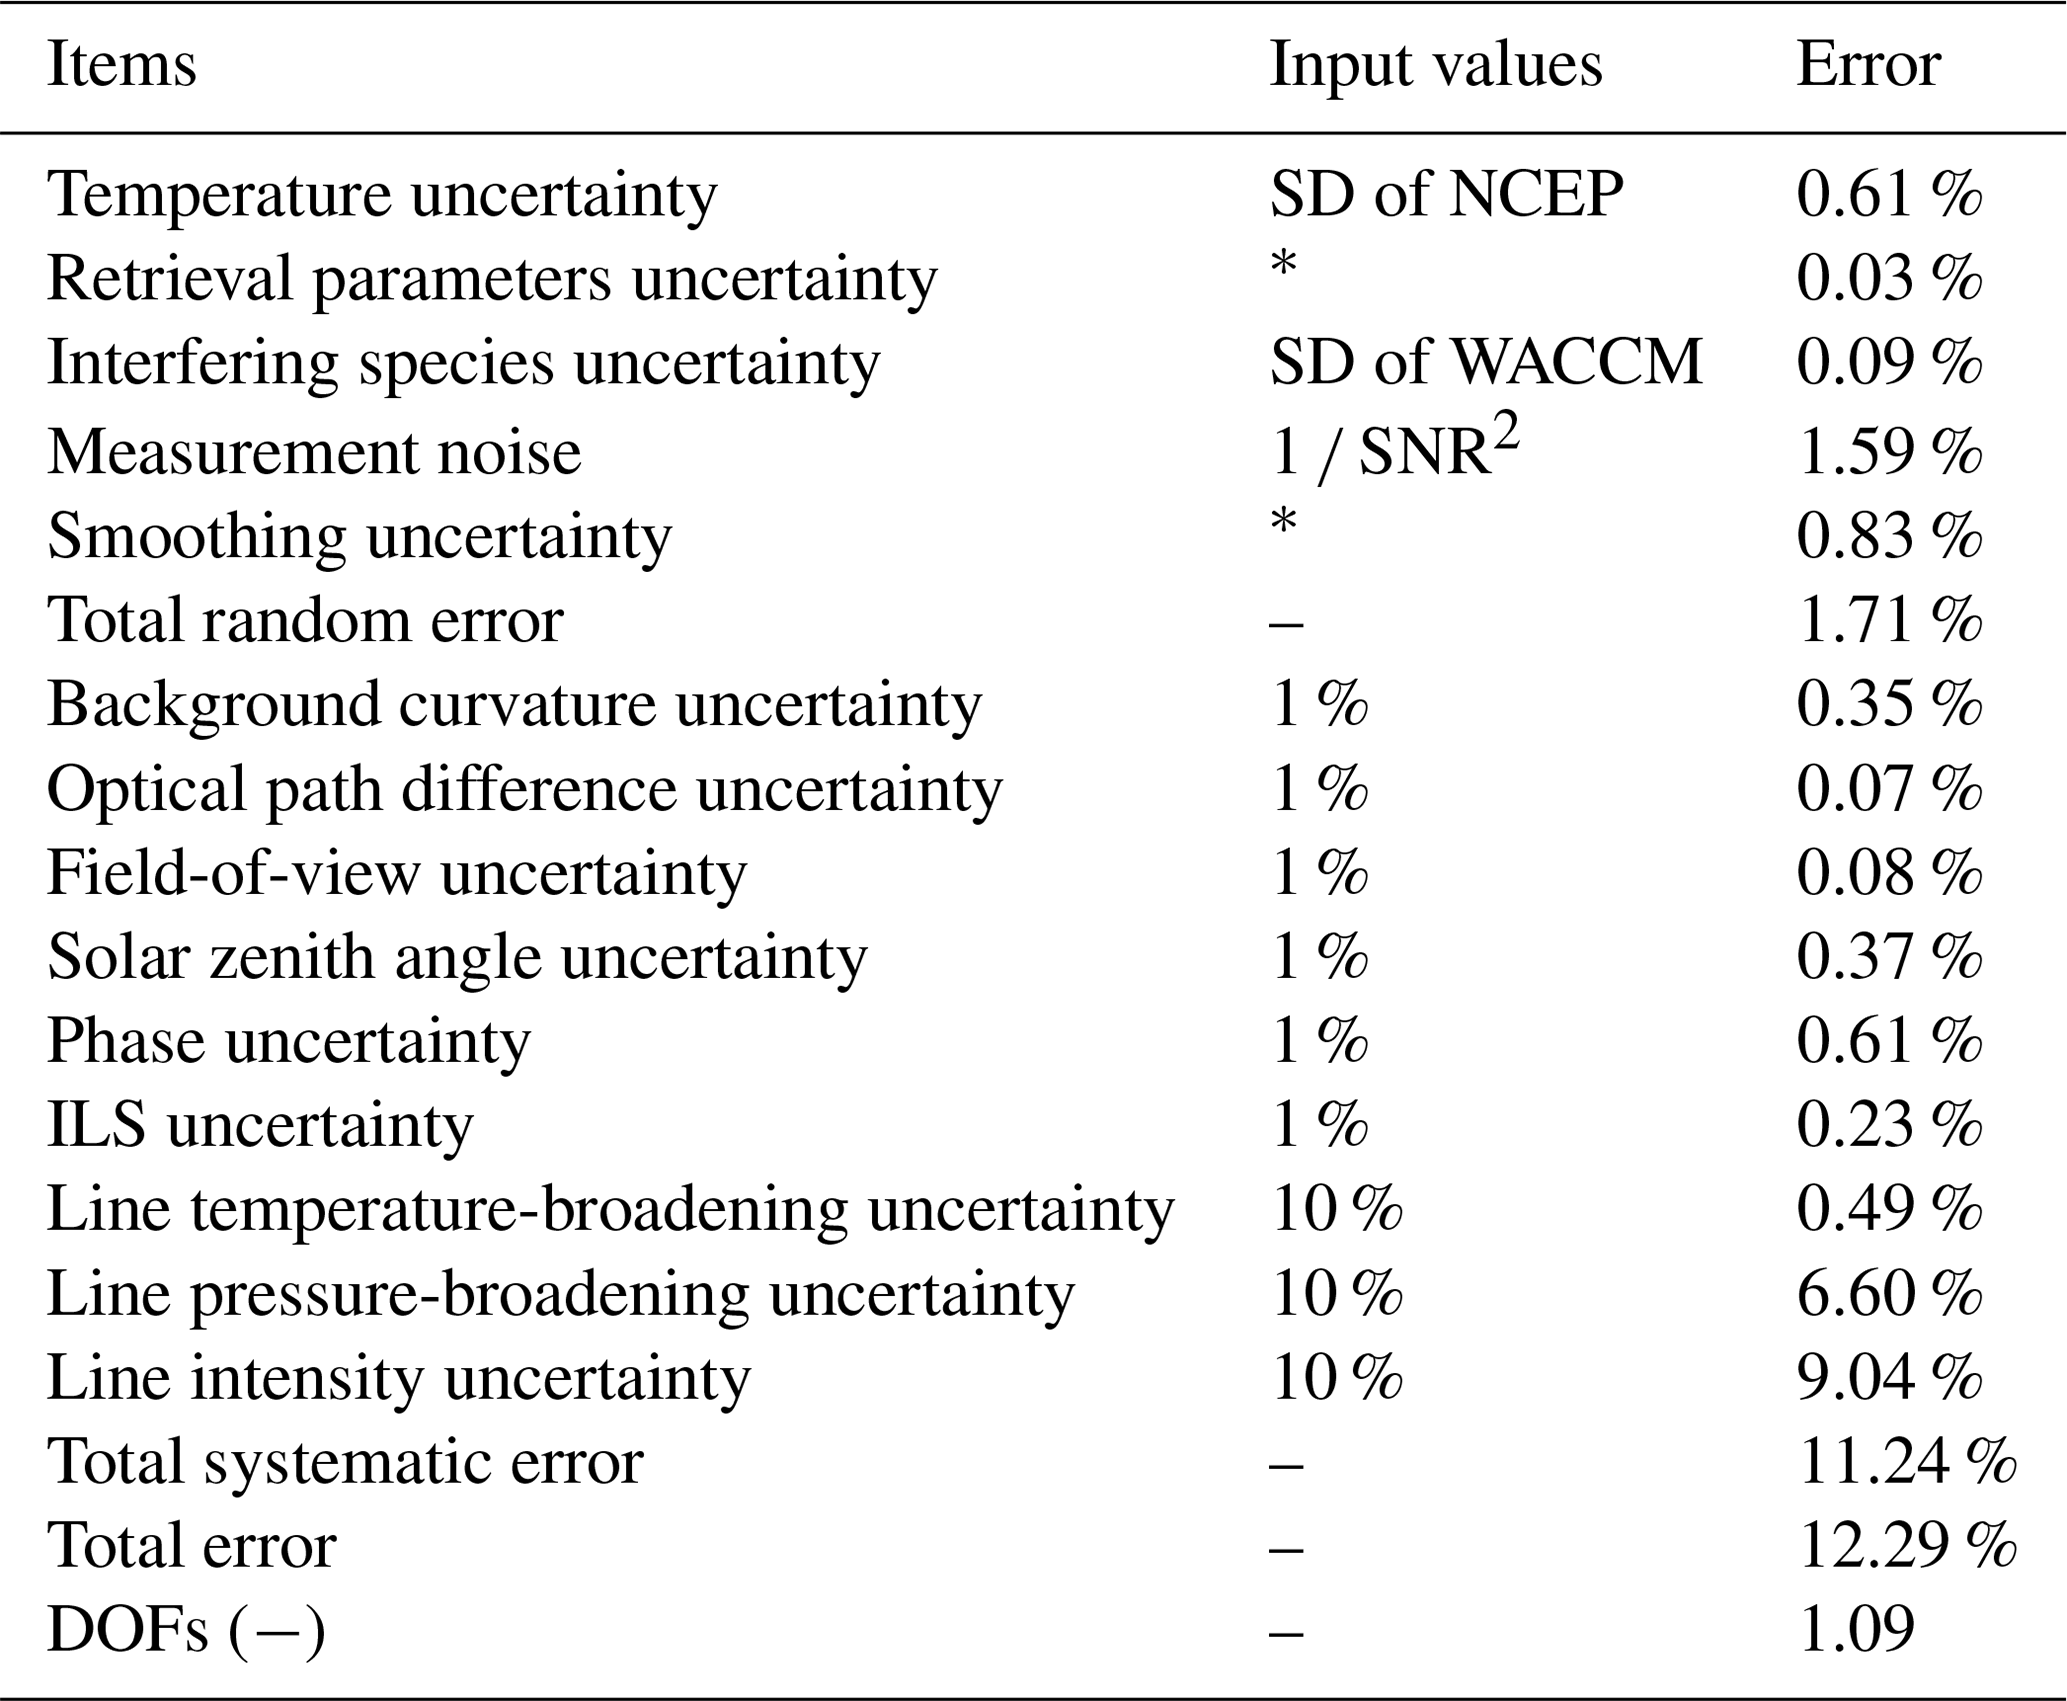
* These input values used for error estimation are prescribed from the retrieval output.
We see from Table 1 that the major random errors for HCHO retrieval at Hefei are measurement noise (1.59 %), smoothing error (0.83 %), and temperature uncertainty (0.61 %), and the major systematic errors are line intensity uncertainty (9.04 %) and line pressure-broadening uncertainty (6.60 %). Total random and systematic errors are estimated to be 1.71 % and 11.24 %, respectively. Total retrieval error calculated as the square root sum of the squares of total random and systematic errors is estimated to be 12.29 %.
2.3 Regression model for seasonal and interannual variabilities
The seasonality and interannual variability of HCHO from 2015 to 2019 were evaluated using a bootstrap resampling method following that of Gardiner et al. (2008). Gardiner et al. (2008)'s method has been used by many studies to estimate the variability of atmospheric compounds on different timescales (including Gardiner et al., 2008; Jones et al., 2009; Sun et al., 2018a, 2020; Tian et al., 2017; Viatte et al., 2014; Vigouroux et al., 2015, 2018; Zeng et al., 2012; Franco et al., 2016). The following nonlinear regression model was applied to fit the FTIR time series of HCHO :
where A0 is the intercept, A1 is the annual growth rate, and is the interannual change rate discussed below. The A2–A5 parameters describe the seasonal cycle, t is the measurement time elapsed since 2015, and ε(t) represents the residuals between the measurements and the fitting model. Generally, the bootstrap resampling model cannot capture the diurnal cycle of an atmospheric compound with a large diurnal variability. In order to minimize this influence, we performed the regression fit on the daily mean dataset and incorporated the error arising from the autocorrelation in the residual into the uncertainty in the change rate following the procedure of Santer et al. (2008). Fractional differences of the FTIR HCHO time series relative to their seasonal mean values represented by were calculated in Eq. (3) to analyze seasonal enhancements.
2.4 Regression model for source separation
The emitted and photochemical HCHO was separated by using ground-level CO and Ox (O3 + NO2) as tracers, respectively. The methodology in this study follows that of Friedfeld et al. (2002), which has been used extensively in source separation for atmospheric HCHO (including Friedfeld et al., 2002; Garcia et al., 2006; Hong et al., 2018; Li et al., 1994, 2010; Lui et al., 2017; Ma et al., 2016; Su et al., 2019; Wang et al., 2015). Over a polluted atmosphere, O3 reacts with nitric oxide (NO) emitted from vehicle exhaust to form NO2. In this case, Ox (O3 + NO2) is in principle a better surrogate of photochemical processes as it also accounts for titrated O3 (Garcia et al., 2006; Li et al., 1994). Therefore, this study uses Ox as a tracer for photochemical HCHO. A linear regression model was used to establish a link among the time series of HCHO, CO, and Ox (Garcia et al., 2006). The observed HCHO can be reproduced by the following linear regression model :
where α0, α1, and α2 are coefficients obtained from the multiple linear regression fit. α0, which is neither classified as emitted or photochemical contributions, represents the regional HCHO condition in the background atmosphere, α1 is the emission ratio of HCHO with respect to CO, and α2 denotes the portion of HCHO from photochemical production. ε(t) is the fitting residual, which is assumed to be independent with a constant variance and a mean of zero (Garcia et al., 2006). and are ground-level VMR time series of CO and Ox, respectively. The relative contributions of emitted (Re), photochemical (Rp), and background (Rb) sources to the observed HCHO can be calculated by Friedfeld et al. (2002), Garcia et al. (2006), Hong et al. (2018), Li et al. (2010), Lui et al. (2017), Ma et al. (2016), Su et al. (2019), and Wang et al. (2015):
To compare the results, the regression analysis in Garcia et al. (2006) was run using subsets of data, which comprise a comparable number of data points for each considered time period. By dividing the data into several periods of interest, it is possible to lower the residual and improve the fitting correlation (Garcia et al., 2006). Garcia et al. (2006) also concluded that the fitting results were more robust by using a real background value to initialize the regression analysis. Generally, this initial background level can be approximated by the measurement in the “clean” atmosphere at a rural site or derived from statistics of previous studies in the studied region (Garcia et al., 2006; Hong et al., 2018; Ma et al., 2016; Su et al., 2019; Wang et al., 2015). The findings of Garcia et al. (2006) have been used by many studies in source separation for atmospheric HCHO (including Hong et al., 2018; Li et al., 2010, Lui et al., 2017; Ma et al., 2016, Su et al., 2019; Wang et al., 2015). For multi-year time series of HCHO in this study, we grouped all measurements by month and performed the regression analysis for source separation on a monthly basis. The empirical background level of previous studies in the Yangtze River delta (YRD) region was used to initialize the regression analysis.
2.5 GEOS-Chem sensitivity simulations
2.5.1 GEOS-Chem model description
The drivers of the observed HCHO variability were determined by using the GEOS-Chem chemical transport model version 12.2.1 (Bey et al., 2001; http://geos-chem.org, last access: 14 February 2020). GEOS-Chem is a global 3D chemical transport model capable of simulating global trace gas (more than 100 tracers) and aerosol distributions. The GEOS-Chem model implements a universal tropospheric–stratospheric Chemistry (UCX) mechanism (Eastham et al., 2014). All simulations were performed in a standard GEOS-Chem full-chemistry mode with a horizontal resolution of 2∘ × 2.5∘ and were initialized for 1 year (July 2014 to July 2015) to remove the influence of the initial conditions. The model is driven by the Goddard Earth Observing System-Forward Processing (GEOS-FP) meteorological fields at a horizontal resolution of 2∘ × 2.5∘ degraded from their native resolution of 0.25∘ × 0.3125∘. The temporal resolutions are 1 h for surface variables and boundary layer height and 3 h for the other variables. The photolysis rates were obtained from the FAST-JX v7.0 photolysis scheme (Bian and Prather, 2002). Dry deposition was calculated by the resistance-in-series algorithm (Wesely, 1989; Zhang et al., 2001), and wet deposition followed that of Liu et al. (2001). The GEOS-Chem model outputs 72 vertical layers of HCHO VMR concentration ranging from the surface to 0.01 hPa at a temporal resolution of 1 h. This study only considered the HCHO simulations from 2015 to 2019 in the grid box containing Hefei (31.52–32.11∘ N by 116.53–118.02∘ E).
Emissions in GEOS-Chem are processed through the Harvard–NASA Emission Component (HEMCO) (Keller et al., 2014). The anthropogenic emissions were from the Community Emissions Data System (CEDS; the latest 2015 condition is used for the model simulation) inventory (Hoesly et al., 2018), which overwrites regional emissions over Asia with the MIX inventory (Li et al., 2017; Lu et al., 2019; Zheng et al., 2018; Yin et al., 2020). In particular, the latest Chinese anthropogenic emissions for 2016 and 2017 from the Multi-resolution Emission Inventory for China (MEIC; http://www.meicmodel.org, last access: 14 April 2020) were implemented (Lu et al., 2019; Zheng et al., 2018). The MEIC is a bottom-up emission inventory with particular improvements in the accuracy of unit-based power plant emission estimates (Liu et al., 2015), vehicle emission modeling (Zheng et al., 2014), and the NMVOC speciation method (Li et al., 2014). Global biomass burning emissions were from the Global Fire Emissions Database version 4 (GFED4) inventory (Giglio et al., 2013). Biogenic emissions were from the Model of Emissions of Gases and Aerosols from Nature (MEGAN version 2.1) inventory (Guenther et al., 2012), and soil NOx emissions were calculated following the method of Hudman et al. (2010, 2012). Mixing ratios of CH4 are prescribed in the model based on spatially interpolated monthly mean surface CH4 observations from the NOAA Global Monitoring Division for 1983–2016 and are extended to 2020 using the linear extrapolation of local 2011–2016 trends (Murray, 2016).
Total emissions of all atmospheric compounds in 2016 and 2017 over China by category are summarized in Table 2. In this study, we separated the anthropogenic emissions into fossil fuel and biofuel emissions. The global biofuel inventory is only available for the year 2015. The number of atmospheric compounds and the emission amounts in the biofuel emission inventory are much smaller than those in the fossil fuel emission inventory. In addition, the combination of biogenic and biomass burning emissions is referred to as natural emission. Total annual Chinese anthropogenic emissions of NOx and NMVOCs are, respectively, 22.5 and 28.4 Tg in 2016 and 22.0 and 28.6 Tg in 2017. Total annual Chinese natural emissions of NOx and NMVOCs are, respectively, 1.74 and 27.16 Tg in 2016 and 1.56 and 28.02 Tg in 2017. The anthropogenic emissions of all atmospheric compounds are dominated by fossil fuel emissions, and the natural NMVOC emissions are dominated by biogenic emissions. We cannot separate the CH4 emissions into anthropogenic and natural emissions since the CH4 concentrations are prescribed based on NOAA measurements and hence cannot be shut off the same way as for other emission inventories. We find 1 % increases in CH4 concentration over eastern China in 2017 relative to 2016 (Lu et al., 2019).
Table 2Total emissions of all atmospheric compounds over China used in the GEOS-Chem model.

2.5.2 GEOS-Chem model configurations
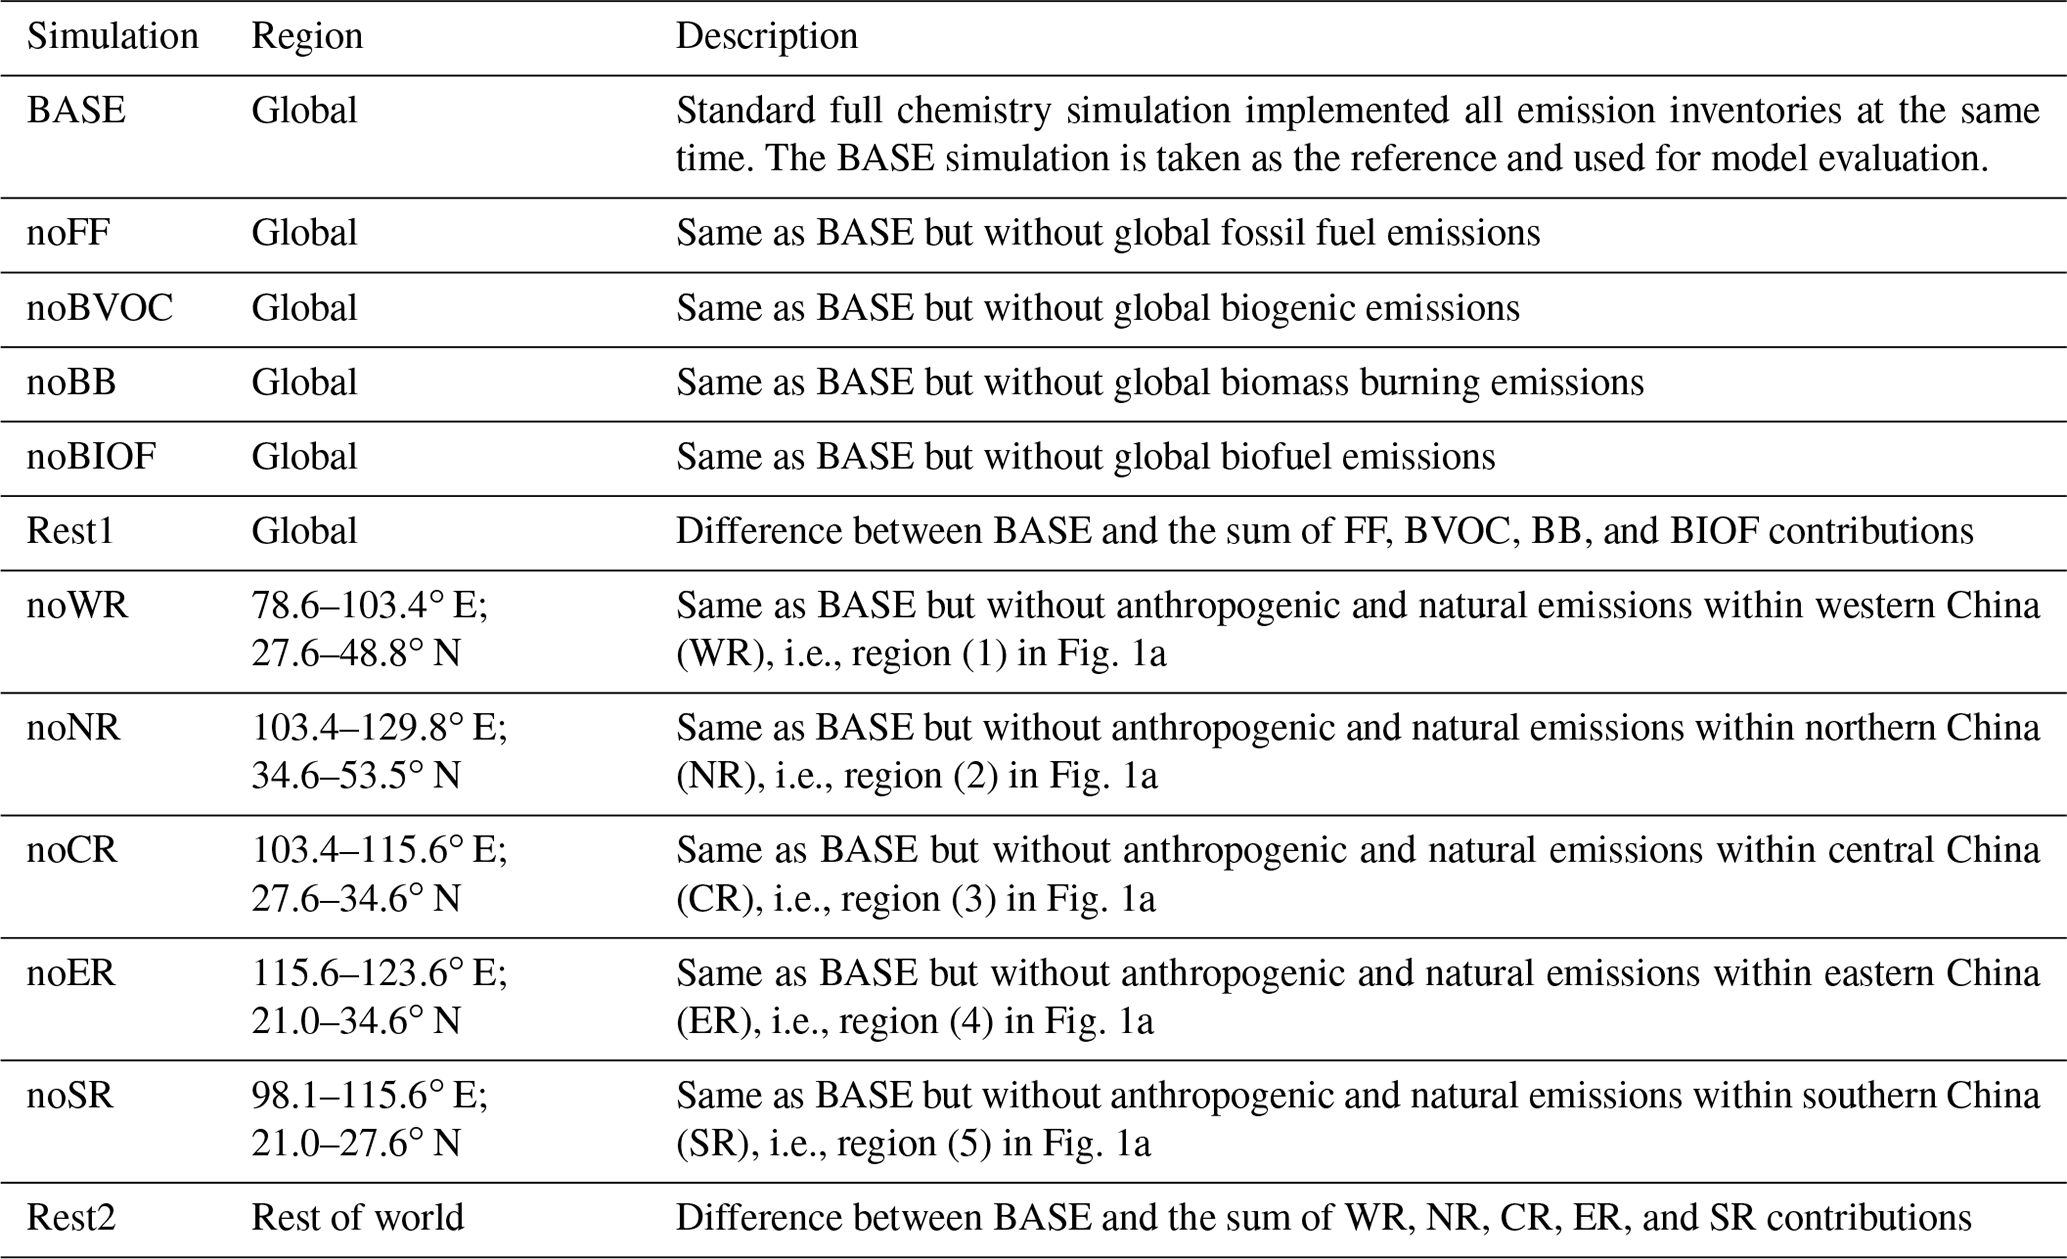
First, we conducted a standard full chemistry simulation (hereafter BASE) including all emission inventories as described in Table 2 and took it as the reference. Then, we conducted a series of sensitivity simulations to assess the change in each sensitivity simulation relative to the BASE simulation. We followed the method of Franco et al. (2016) and did not shut off the CH4 inventory in all sensitivity simulations; i.e., CH4 concentrations were still derived from the NOAA measurements as for the BASE simulation. The model configurations used in this study are summarized in Table 3 and were designed as follows.
-
To analyze the contributions of different emission categories, each individual emission inventory was shut off to evaluate the change in the simulation in the presence of all other emission inventories. Thus, the relative contribution of each emission category was estimated as the relative difference between the GEOS-Chem simulation in the presence and absence of that emission inventory. We have conducted four such sensitivity simulations by shutting off the (1) fossil fuel emission inventory (including missions from agriculture, industry, power plant, residential, and transport), (2) biogenic emission inventory, (3) biomass burning emission inventory, and (4) biofuel emission inventory (Table 2). When an emission inventory was shut off, global emissions of all atmospheric compounds in this inventory were set to be zero.
-
To analyze the contributions of different geographical regions, the emission inventory clusters within each geographical region were shut off to assess the change in the simulation in the presence of emissions outside that geographical region. Thus, the relative contribution of each geographical region was estimated as the relative difference between the GEOS-Chem simulation in the presence and absence of the emission inventory clusters within that geographical region. We have conducted five such sensitivity simulations by shutting off the emission inventory clusters within five geographical regions. Here the emission inventory clusters are defined as all emission inventories except the CH4 inventory in Table 2. When the emission inventory clusters in a specific region were shut off, emissions of all relevant atmospheric compounds within that region were set to be zero. The geographical regions are shown in Fig. 1a, and the resulting delimitations are summarized in Table 3. The delimitations of these geographical regions are based on the levels of urbanization and industrialization in China. Region (1) in Fig. 1a only covers a few sparse city clusters representing the region with the least population and industrialization in China (Lu et al. 2019). Regions (2), (4), and (5) cover the North China Plain (NCP), YRD, and Pearl River delta (PRD) city clusters, respectively, which are the three most developed city clusters facing severe air pollution in China. Region (3) covers the Sichuan Basin (SCB) and central Yangtze River (CYR) city clusters with newly emerging severe air pollution in China.
Regional air quality is not only influenced by local emission, but also by long-range transport. In addition, a reduction in one pollutant may affect the conditions of many atmospheric compounds via a chain of complex atmospheric chemical reactions. Sensitivity simulations in this study were performed by shutting off all atmospheric compounds simultaneously rather than the HCHO precursors only. This approach provides an evaluation for the consequence of the recent clean air policies which affect not only HCHO precursors, but also many other atmospheric pollutants (Zheng et al., 2018).
Table 3GEOS-Chem model configurations and delimitations of all geographical regions. For all sensitivity simulations, the CH4 emission inventory is always switched on.
The FTIR measurements taken with a solar intensity variation (SIV) of larger than 10 %, or retrievals with DOFs of less than 0.7 or a root-mean square (rms) of fitting residuals of larger than 2 % were excluded in this study. This filter criterion excluded the measurements seriously affected by instable weather conditions or by the a priori profile due to low measurement information content in less favorable observational conditions, e.g., around noontime when the probed atmosphere is thinner or in winter when HCHO is less abundant. With this criterion, 12.4 % of FTIR measurements were excluded in subsequent study. For the ground-level in situ datasets provided by the CNEMC site, LP-DOAS and CRDS analyzers, the measurements collected during maintenance, adjustments, and calibrations were excluded as well as measurements collected during electricity failures.
3.1 Comparison with LP-DOAS dataset
The LP-DOAS ground-level HCHO measurements nearest to each individual FTIR XHCHO measurement were included for comparison. The temporal difference between FTIR and the LP-DOAS dataset is within ± 5 min. Correlation plots of FTIR XHCHO measurements against LP-DOAS ground-level HCHO measurements are shown in Fig. 3. The results show that the HCHO variabilities observed by FTIR and LP-DOAS are in good agreement with a correlation coefficient (r2) of 0.88. The amplitude of the LP-DOAS ground-level measurements is on average 7.89 times that of the FTIR column-averaged measurements. This means HCHO column measurements at Hefei can be used as representative of near-surface conditions. As a result, this study used a constant factor of 7.89 to scale the column-averaged HCHO concentration to ground-level HCHO concentration, or vice versa.
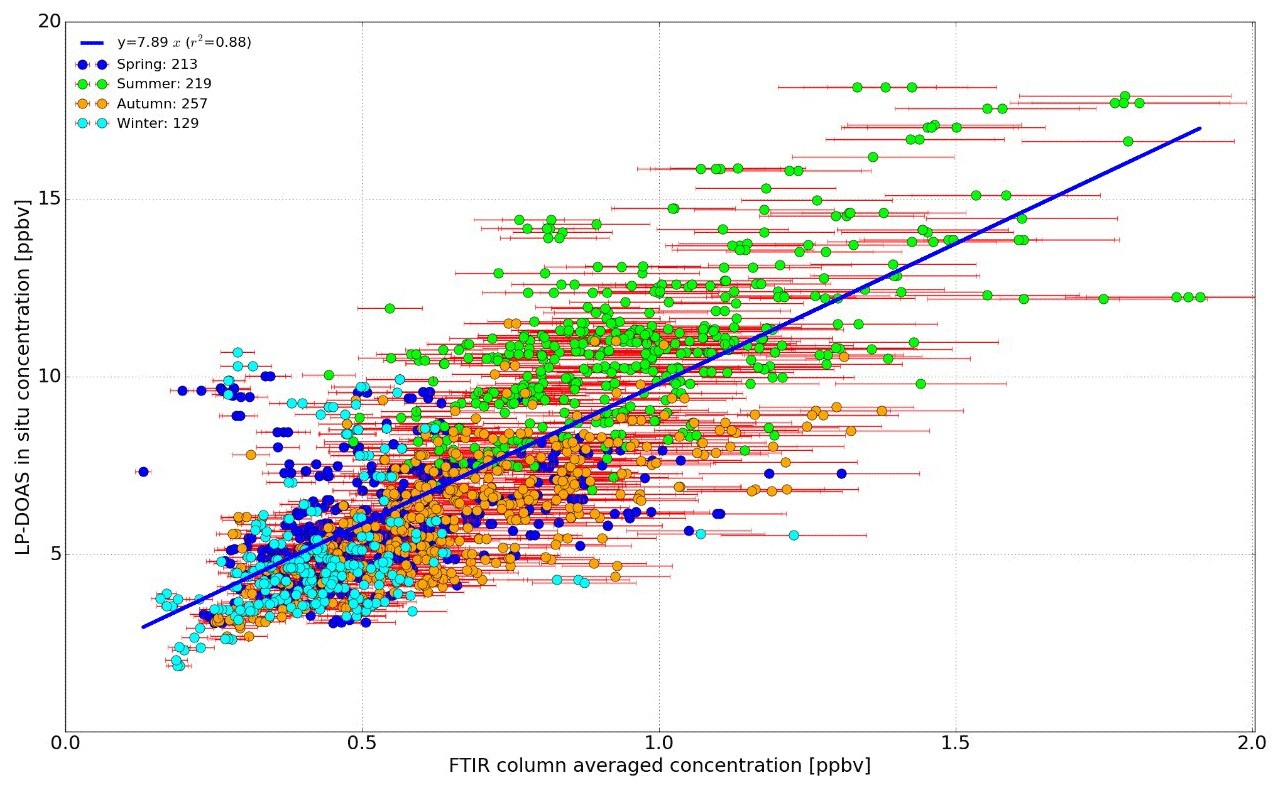
Figure 3Correlation plots of FTIR XHCHO measurements against LP-DOAS ground-level HCHO measurements. The blue lines are linear-fitted curves of respective scatter points. All concurrent data pairs were grouped by season. The number of data pairs within each season was also included.
Over a polluted atmosphere, the HCHO column measurements can be used as a representative of near-surface conditions because HCHO is a tropospheric gas and has a vertical distribution that is heavily weighted toward the lower troposphere (Martin et al., 2004). As shown in Fig. 2c, the HCHO concentration decreased by 72.7 %, with an increase in the height from the surface to 3 km, and continued to decrease slowly in the troposphere above 3 km. The HCHO partial column below 3 km accounted for 67.1 % of the HCHO total column. This percentage is expected to show less seasonal variation since the shape of the retrieved profile is very similar to the shape of the a priori profile due to the low DOFs (Fig. 2c). Many studies have taken advantage of this favorable vertical distribution of HCHO to derive surface emissions of VOCs from space (e.g., Palmer et al., 2003; Millet et al., 2008; Boersma et al., 2009; Stavrakou et al., 2009; Fortems-Cheiney et al., 2012; Barkley et al., 2013; Marais et al., 2014; Streets et al., 2013; Gao et al., 2018). Meanwhile, the use of HCHO column measurements to explore tropospheric O3 sensitivities has been the subject of several past studies, which disclosed that this diagnosis of O3 production rate (PO3) is consistent with the findings of surface photochemistry (e.g., Martin et al., 2004; Duncan et al., 2010; Choi et al., 2012; Witte et al., 2011; Jin and Holloway, 2015; Mahajan et al., 2015; Jin et al., 2017; Schroeder et al. 2017). Source separation of atmospheric HCHO in Hong et al. (2018) and Su et al. (2019) also takes advantage of column measurements of HCHO being fairly representative of near-surface conditions.
3.2 Seasonal and interannual variabilities
We have used the bootstrap resampling method of Gardiner et al. (2008) with a third Fourier series plus a linear function to fit FTIR daily mean time series of XHCHO (Fig. 4a). Generally, the measured features in terms of seasonality and interannual variability from 2015 to 2019 can be reproduced by the bootstrap resampling model with a correlation coefficient (r2) of 0.81. The FTIR XHCHO roughly increases over time for the first half of the year and decreases over time for the second half of the year (Fig. 4b). The XHCHO reached a maximum monthly mean value of (1.1 ± 0.27) ppbv in July and a minimum monthly mean value of (0.4 ± 0.11) ppbv in January. The FTIR XHCHO values in July were on average 1.75 times higher than those in January. In terms of HCHO total column, the maximum and minimum monthly mean values are (1.68 ± 0.39) and (0.66 ± 0.16) × 1016 molec cm−2, respectively. The annual mean values of XHCHO and HCHO total column over Hefei are (0.55 ± 0.14) ppbv and (1.04 ± 0.27) × 1016 molec cm−2, respectively. As commonly observed, the seasonal HCHO enhancements spanned a wide range of −50.0 % to 60.0 % depending on the season and measurement time (Fig. 4b). The observed HCHO time series from 2015 to 2019 showed a positive change rate of (2.38 ± 0.71) % per year (Fig. 4a). This positive change rate in HCHO concentration over China was in agreement with the positive trends observed by the spaceborne Ozone Monitoring Instrument (OMI) from 2004 to 2014 by De Smedt et al. (2015) and from 2005 to 2017 by Zhang et al. (2019).
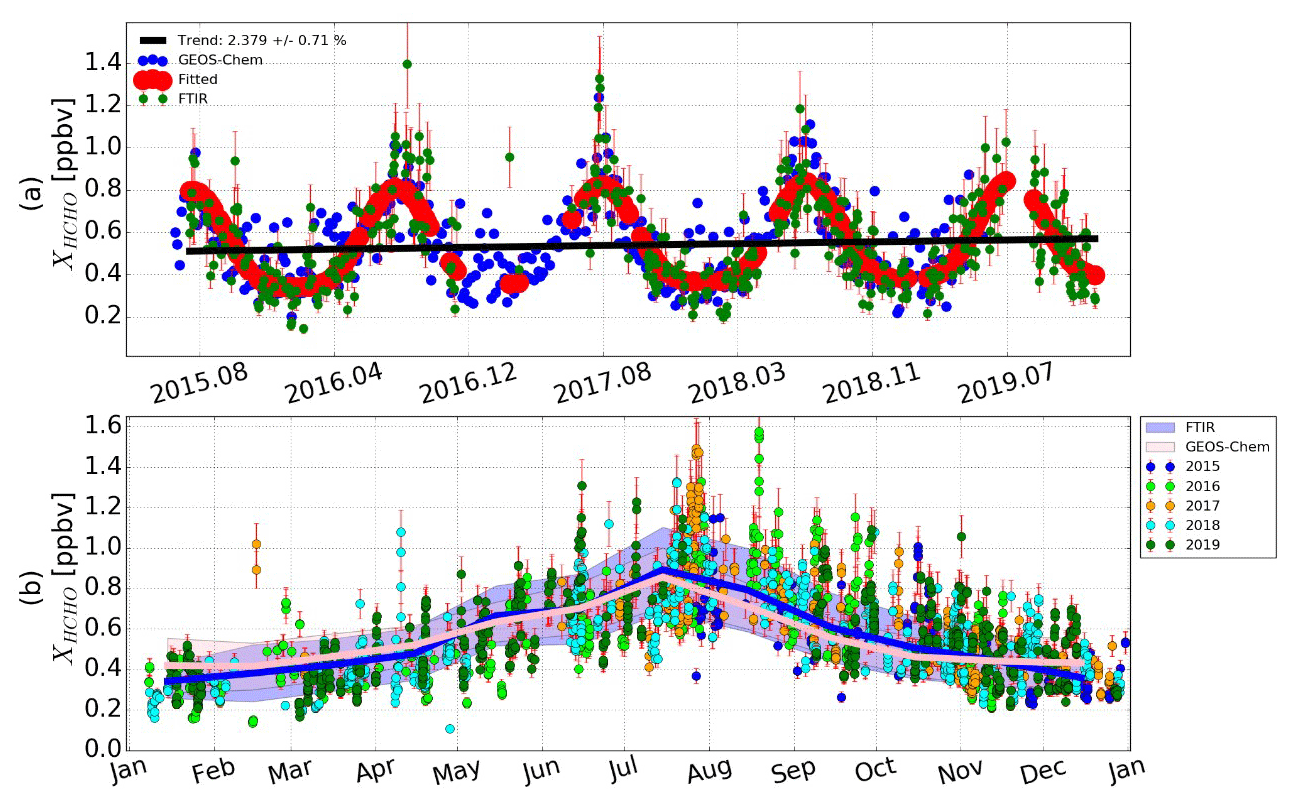
Figure 4Daily mean time series of XHCHO comparison between FTIR observation and GEOS-Chem model BASE simulation from 2015 to 2019 over Hefei, China (a). The seasonality and interannual change rate are represented by red dots and black line, respectively, which are fitted by using a bootstrap resampling model with a third Fourier series plus a linear function. (b) Seasonal variations of XHCHO by FTIR and GEOS-Chem simulation. Bold curves and the shadows are monthly mean values and the 1σ standard variations, respectively. Vertical error bars represent retrieval uncertainties.
Recently, Vigouroux et al. (2018) presented an unprecedented harmonized HCHO total column dataset from 21 ground-based FTIR stations around the globe. These FTIR stations sample a wide range of HCHO total columns from 0.1 to 2.2 × 10¹⁶ molec cm−2 and are classified as clean, intermediate, and high-level HCHO stations. Vigouroux et al. (2018) found that high levels of HCHO are typically observed at the places which are affected by large anthropogenic emissions such as Toronto and Mexico City (means of 0.95 and 2.21 × 10¹⁶ molec cm−2) or affected by large biogenic emissions such as Wollongong (mean of 0.79 × 10¹⁶ molec cm−2) and Porto Velho, located at the edge of the Amazon rainforest (mean of 1.9 × 10¹⁶ molec cm−2). In comparison, the Hefei site is affected by both anthropogenic and biogenic emissions due to the surrounding megacity, wetlands and cultivated lands (see Sect. 2.1). The HCHO total columns at Hefei are comparable with those at Toronto and are lower than those at Mexico City and Porto Velho. With the classification criteria in Vigouroux et al. (2018), the Hefei site can be classified as a high-level HCHO station and has the third-highest levels of HCHO concentration around the globe.
3.3 Separation between emitted and photochemical sources
The CNEMC ground-level CO and Ox measurements nearest to each individual FTIR XHCHO measurement were included for source separation. The temporal difference between the FTIR and CNEMC datasets is within ± 30 min. For the polluted atmosphere over Hefei, it is impossible to directly measure the background HCHO concentration, and thus an empirical value derived in previous studies in the YRD region was used. According to the ground-level measurements of HCHO at a rural site in the YRD region by Ma et al. (2016) and Wang et al. (2015), the background level of HCHO near the surface was approximately 1.0 ppbv in springtime. We scaled this background level (1.0 ppbv) into column-averaged concentration with the scale factor deduced in Sect. 3.1 and coupled the resulting value with a third Fourier series to reconcile the seasonal difference in HCHO background. As a result, the fitting process in this study was initiated by assigning the background with a third Fourier series with an amplitude of 0.22 ppbv. Garcia et al. (2006) carried out a series of sensitivity tests by using a series of empirical background concentrations to initialize the regression analysis. Garcia et al. (2006) found that the percent fraction of emitted HCHO is almost constant in all sensitivity tests, but the percent fractions of background and photochemical HCHO contributions are anti-correlated and scale linearly with the background value. The fact that photochemical HCHO decreases as the background HCHO increases suggests a relation of the background with photochemistry rather than emission sources (Garcia et al., 2006). It is worth noting that imperfections in source separation with this regression model are likely to become significant in certain cases. In this study, photochemical HCHO production from CH4 oxidation in the free troposphere which can hardly be accounted for by the in situ tracers is in fact erroneously (or at least partly) interpreted background HCHO. In addition, the measurements with large temporal variations of HCHO/CO or HCHO Ox ratios generally cannot be reproduced by this regression model. A more sophisticated multi-regression model might be able to reduce the uncertainties, but this is beyond the scope of the present work.
Seasonal variabilities of absolute and relative contributions of emitted, photochemical, and background sources to the observed XHCHO are shown in Fig. 5. The correlation coefficient value (r2) from the regression analysis indicates the proportion of HCHO measurements that can be reproduced by the regression model (Green, 1998). The results indicate that this proportion is for all subsets of the dataset well above 80 % and up to 92 %, reflecting the fact that the CO–Ox tracer pair – while not perfect – generally replicates well the observations. Statistical modeling results for relative contributions of different sources to the observed XHCHO from 2015 to 2019 are listed in Table 4. The relative contributions of emitted and photochemical sources spanned a wide range of values throughout the year; however, the relative contributions of the background source were roughly a constant value. Depending on measurement time and season, the relative contributions of emitted sources varied from 14.0 % to 58.0 %, and relative contributions of photochemical sources varied from 20 % to 82 %. On average, the relative contributions of emitted, photochemical, and background sources to the observed XHCHO from 2015 to 2019 were 29.0 ± 19.2 %, 49.2 ± 18.5 %, and 21.8 ± 6.1 %, respectively. As evidenced in Table 2, the emitted HCHO are mainly from fossil fuel and biomass burning emissions. In addition to oxidation of CH4, oxidations of both fossil fuel and biogenic NMVOCs could have large contributions to photochemical HCHO, which will be discussed in detail in Sect. 4.2.

Figure 5(a) Separation between emitted and photochemical HCHO by using CO–Ox tracers to model FTIR observations. (b) Relative contributions of emitted, photochemical and background sources to the observed XHCHO from 2015 to 2019 over Hefei, eastern China. The grey vertical shaded area indicates summertime measurements.
Table 4Statistical modeling results for relative contributions of different sources to the observed XHCHO from 2015 to 2019 over Hefei, eastern China.

a There are 480 measurements dominated by the emitted source which accounts for 31.9 % of all measurements. b Larger than the seasonal mean value (see Eq. 3 for details). c The mean contribution of the emitted source is 29.0 ± 19.2 %.
All measurements were further separated into emitted-dominated or photochemical-dominated measurements according to a larger contribution to the observed XHCHO (Table 4). Generally, photochemical HCHO is the dominant source of atmospheric HCHO over Hefei for most of the year (68.1 %). The largest contrast between photochemical and emitted in terms of domination percent fraction occurs in the afternoon (after 00:00 local time – LT) in the summer and fall (JJA/SON) seasons when the photochemistry for HCHO formation is enhanced. Indeed, the LP-DOAS measurements in this study and many previous studies with either an in situ dataset (Li et al., 2010, Lui et al., 2017; Ma et al., 2016, Wang et al., 2015) or a remote sensing dataset (De Smedt et al., 2015; Vigouroux et al., 2018; Franco et al., 2016; Peters et al., 2012) disclosed that the typical diurnal modulation of HCHO at mid latitudes shows a pronounced peak in the early afternoon.
3.4 Hydroxyl (OH) radical production from HCHO
Photolysis plays a significant role in the degradation of HCHO and one of its two photo dissociative paths provides a large source of OH radicals. The photolysis pathways of HCHO to form the OH radical are summarized as follows (Seinfeld and Pandis, 2016, chap. 6).
In air, the photolysis of HCHO first generates a hydroperoxyl (HO2) radical at wavelengths below 370 nm. Then, HO2 rapidly reacts with NO to generate the OH radical and subsequently affects the oxidative capacity of the atmosphere (Possanzini et al., 2002; Volkamer et al., 2010). Under steady-state conditions, the total OH radical production rate from the photolysis of HCHO through the above chain of reactions is
where [HCHO] is the concentration of HCHO and Ja is the photolysis constant of Reaction (1). In comparison, applying steady state to Reactions (6)–(8),
the total OH radical production rate from O3 is given by Seinfeld and Pandis (2016, chap. 6):
where [O3], [H2O], and [Mair] are the concentrations of O3, H2O, and air, respectively; Jc is the photolysis constant of Reaction (6); and kd and ke are the reaction rate coefficients for Reactions (7) and (8), respectively.
In this study, photolysis rate constants for HCHO and O3 were available from the GEOS-Chem simulation, and the reaction rate coefficients were calculated according to a well-known procedure (Table B1 in Seinfeld and Pandis, 2016). Surface H2O concentrations were available from an in situ CRDS analyzer. For the atmosphere N2 O2 mixture at 298 K, the values of kd and ke are 2.9 × 10⁻¹¹ and 2.2 × 10⁻¹⁰ cm3 molec−1 s−1, respectively. The air concentration [Mair] is 0.99 molec cm−3 (Seinfeld and Pandis, 2016, chap. 6). The concentrations of HCHO and O3 were based on FTIR observations and the CNEMC network, respectively. To reconcile the difference between the ground-level concentration and column-averaged concentration, all individual FTIR XHCHO concentrations were converted to ground-level VMRs with the scale factor deduced in Sect. 3.1. For the ground-level H2O and O3 datasets, only measurements nearest to each individual FTIR measurement were considered. The temporal difference between FTIR and CNEMC (CRDS) is within ± 30 min (± 30 s).
The total OH radical production rates from the photolysis of HCHO and O3 from 2015 to 2019 over Hefei calculated via Reactions (5) and (9) are shown in Fig. 6. For both gases, the OH radical production rates in summertime are higher than those in wintertime. Generally, OH radical production rates from the photolysis of HCHO are comparable with those from the photolysis of O3 in all seasons. In wintertime when the concentrations in O3 and H2O are low or when emitted sources dominate the HCHO measurements, OH radical production rates from HCHO photolysis are higher than those from O3 photolysis. In other seasons, when the concentrations in O3 and H2O are high or when photochemical sources dominate the HCHO measurements, OH radical production rates from HCHO photolysis are lower than those from O3 photolysis. On average, the OH production rate from O3 photolysis is 6.1 % higher than that from HCHO photolysis. The results clearly indicate that HCHO photolysis was by far an important source of OH radicals over eastern China during all sunlight hours of both summer and winter days.

Figure 6Total OH radical production rates from the photolysis of HCHO (a) and O3 (b) from 2015 to 2019 over Hefei, eastern China. (c) The ratios of OH radical production rates from O3 photolysis to that from HCHO photolysis. The grey vertical shaded area indicates summertime measurements. The red line denotes the one-to-one line.
4.1 Model evaluation
The GEOS-Chem model was used to evaluate relative contributions of various emission categories and geographical regions to the observed HCHO summertime enhancements. For model evaluation, the observed XHCHO seasonal cycle was compared to the GEOS-Chem BASE simulations to investigate the chemical model performance for the specifics of polluted regions over eastern China. As the vertical resolution of GEOS-Chem is different from the FTIR measurement, a smoothing correction was applied to the GEOS-Chem profiles. First, the GEOS-Chem daily mean profiles of HCHO were interpolated to the FTIR altitude grid to ensure a common altitude grid. Since the FTIR instrument only operates during daytime, the average for GEOS-Chem simulations is only performed during daytime from 09:00 to 17:00 LT. The interpolated profiles were then smoothed by the seasonal mean FTIR averaging kernels and a priori profiles (Rodgers, 2000; Rodgers and Connor, 2003). The GEOS-Chem XHCHO concentrations were calculated subsequently from the smoothed profiles by using the corresponding regridded air density profiles from the model. Finally, the GEOS-Chem XHCHO time series only for the days with available FTIR observations were averaged by month and compared with the FTIR monthly mean data.
Figure 4a shows the comparison of daily mean time series of XHCHO between the FTIR observation and the smoothed GEOS-Chem model simulation from 2015 to 2019. Figure 4b compares the seasonal cycles derived from Fig. 4a for the days with available FTIR observations only. The observed day-to-day variability cannot always be reproduced by the GEOS-Chem simulation, especially in the trough and peak of the measurements (Fig. 4a). This can be partially explained by the fact that many oxidation pathways of VOC precursors leading the HCHO production, which are numerous, might not be optimally implemented (especially very short-lived VOCs) or merely not considered in the model (Franco et al., 2016). In addition, large uncertainties remain concerning the various sources of precursor emissions, their geographical distributions and how these sources can influence the air masses over polluted sites such as Hefei. Finally, GEOS-Chem averages HCHO concentration over a large coverage area due to its relatively coarse spatial resolution (here 2∘ × 2.5∘). The Hefei site is located in a densely populated and industrialized area in eastern China. The regional differences in HCHO concentration could aggravate the inhomogeneity within the selected GEOS-Chem coverage grid cell, which also affects the comparison with observations. Nevertheless, the measured feature in terms of the seasonal cycle of HCHO loadings over Hefei can be reproduced by GEOS-Chem simulations with a correlation coefficient (r2) of 0.78 (Fig. 4b). The averaged difference between GEOS-Chem and the FTIR dataset (GEOS-Chem minus FTIR) is −0.05 ± 0.2 ppbv (−2.6 ± 10.4 %), which is within the FTIR uncertainty budget. As a result, GEOS-Chem can simulate the concentration and seasonal variation of HCHO for the heavily polluted regions over eastern China. Previous studies have also found that global chemistry transport models were able to reproduce the absolute values as well as seasonal cycles of the ground-based FTIR HCHO observations in the other parts of the world (Franco et al., 2016; Vigouroux et al., 2018).
4.2 Emission category contribution to HCHO enhancement
In this part of the study, the summertime HCHO model simulations are analyzed to assess the contribution of each emission category to the maximum seasonal enhancements throughout the year. Figure 7a shows daily mean XHCHO time series averaged in the summers of 2015 to 2019 over Hefei simulated by GEOS-Chem, according to the BASE and sensitivity (i.e., noFF, noBVOC, noBB, and noBIOF) simulations. Figure 7b presents the relative contribution of each emission category calculated as the relative difference between the BASE simulation and the corresponding sensitivity simulation (in %).
As can be seen in Fig. 7a and b, shutting off emission sources of fossil fuel and biogenics significantly impacts the simulated HCHO summertime loadings over Hefei, with the XHCHO derived from either the noFF or noBOVC simulations reduced by 10 %–65 % relative to the BASE simulation. However, shutting off biomass burning and biofuel emissions has almost no effect on the simulated HCHO summertime loadings over Hefei, with the XHCHO derived from either the noBB or noBIOF simulations reduced by less than 3 % relative to the BASE simulation. In addition, the variations of the influences of noFF and noBOVC are also much larger than those of noBB and noBIOF. Modeled XHCHO summertime simulations from 2015 to 2019 were on average reduced by 0.18, 0.23, 0.01, and 0.01 ppbv in the absence of fossil fuel, biogenic, biomass burning, and biofuel emission inventories, respectively, which contribute 24.98 %, 29.81 %, 1.0 %, and 0.95 % to the HCHO summertime enhancements (Fig. S1). The anthropogenic emissions accounted for 25.93 % and the natural emissions accounted for 30.81 % of the HCHO summertime enhancements. Contributions of fossil fuel and biogenic emissions are much larger than those of biomass burning and biofuel emissions because of larger NMVOC emissions from fossil fuel and biogenic sources (Table 2).
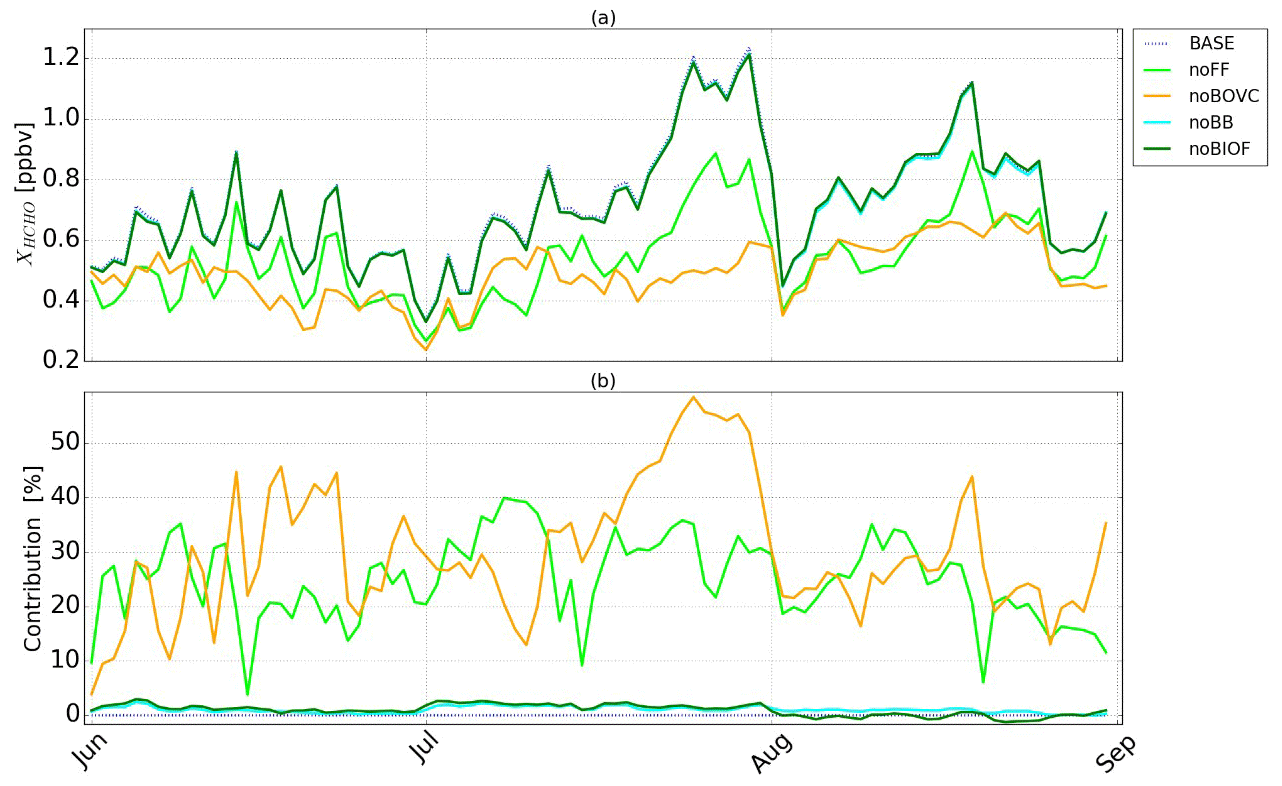
Figure 7(a) Daily mean XHCHO (in ppbv) time series averaged over the summertime of 2015 to 2019 above Hefei simulated by GEOS-Chem, according to the BASE and sensitivity (i.e., noFF, noBVOC, noBB, and noBIOF) simulations. In the sensitivity simulations, the fossil fuel, biogenic, biomass burning and biofuel emissions of all atmospheric compounds have been shut off globally, while the CH4 concentrations are still derived from NOAA measurements, as for the BASE simulation. (b) Relative contribution of each emission category calculated as the relative difference between the BASE simulation and the corresponding sensitivity simulation (in %).
The remaining contribution was calculated as the difference between the BASE simulation and the sum of all emission contributions as estimated from the sensitivity simulations and was 0.29 ppbv (43.27 %). This remaining contribution can be largely attributed to the global CH4 emissions and the nonlinear interactional effects among different sources which were not captured by the sensitivity simulations. Indeed, shutting off some emission sources in the GEOS-Chem sensitivity simulations eventually resulted in slightly enhanced HCHO amounts (by 1 %–1.5 %) compared to the BASE simulation, as shown in Fig. 7b for the noBIOF simulation and, to a lesser extent, for the noBB simulation during later summer. In these particular cases, shutting off an emission inventory may induce significantly lower concentrations in many atmospheric compounds globally, some of which mainly react with OH. This would lead to higher OH concentrations available for the oxidation of HCHO precursors and eventually enhances the HCHO production from other emission categories (Franco et al., 2016). However, it is difficult to quantify the nonlinear impact of each individual emission category, since the types of atmospheric compounds and their concentrations in each emission category are different. Especially when the emissions of NO are suppressed, the impacts become hard to assess, since this compound plays a key role in both HCHO formation (through the degradation of peroxy radicals) and destruction (by contributing to the regeneration of OH) (Franco et al., 2016). Investigating the nonlinear impact of each individual emission category would require additional work that is beyond the scope of the present work.
These above sensitivity tests suggest that the oxidations of both NMVOCs and CH4 (not included in the emission perturbations here) dominate the HCHO production and are the main drivers of its summertime enhancements over Hefei. This is different from Franco et al. (2016), who found that HCHO summertime loadings over the Jungfraujoch, Switzerland, were dominated by the oxidation of CH4, and the contribution of NMVOCs was rather limited. For the HCHO loadings over the Jungfraujoch, it is most likely that a large part of the short-lived NMVOCs is already oxidized before being transported to this high-altitude site (3580 m a.s.l.). Hence these NMVOC compounds do not contribute directly to the HCHO loadings over the Jungfraujoch, although their biogenic secondary products can be transported to the upper troposphere and contribute to the HCHO abundance there (Franco et al., 2016). However, the low-altitude Hefei site (30 m a.s.l.) is surrounded by megacity, wetlands or cultivated lands (see Sect. 2.1). A large amount of NMVOC compounds originating from both anthropogenic and natural emissions contributed directly to the HCHO summertime loadings over Hefei, resulting in a much larger NMVOC contribution than that over the Jungfraujoch.
4.3 Geographical region contribution to HCHO enhancement
We present in this section a contribution of each geographical region in China to the observed HCHO summertime enhancements. Geographical delimitations of these regions are summarized in Table 3. Figure 8a shows daily mean XHCHO time series averaged in the summers of 2015 to 2019 over Hefei simulated by GEOS-Chem, according to the BASE and sensitivity (i.e., noER, noCR, noNR, noWR, and noSR) simulations. Figure 8b shows the relative contribution of each geographical region calculated as the relative difference between the BASE simulation and the corresponding sensitivity simulation (in %).
We can see from Fig. 8a and b that shutting off emission clusters in eastern China (noER) dominantly impacts the simulated HCHO summertime loadings over Hefei, with the XHCHO derived from noER simulations reduced by a wide range of 20 %–70 % relative to the BASE simulation. Shutting off emission clusters in either central (noER), northern (noNR), or southern (noSR) China occasionally reduces the simulated HCHO summertime loadings over Hefei by an intermediate amplitude of 10 %–30 %. However, shutting off emission clusters in western China (noWR) has almost no effect on the simulated HCHO summertime loadings over Hefei, with the XHCHO derived from noWR simulations reduced by less than 2 % relative to the BASE simulation. Modeled XHCHO summertime simulations from 2015 to 2019 were on average reduced by 0.33, 0.06, 0.03, 0.01, and 0.03 ppbv in the absence of the emission clusters in eastern China, central China, northern China, western China, and southern China, respectively, which correspond to contributions of 44.36 %, 7.24 %, 4.2 %, 0.98 %, and 4.59 % to the HCHO summertime enhancements (Fig. S2). The remaining contribution was calculated as the difference between the BASE simulation and the sum of all geographical sensitivity simulations and was 0.27 ppbv (38.62 %). This remaining contribution can be largely attributed to global CH4 emissions, NMVOC emissions outside China and the nonlinear interactional effects among the geographical sensitivity simulations. Indeed, shutting off regional emission clusters in the GEOS-Chem geographical sensitivity tests investigated here eventually resulted in slightly enhanced HCHO amounts (by 0.5 %–2 %) produced by GEOS-Chem compared to the BASE simulation, as shown in Fig. 8b for the noSR simulations during later summer. It is worth noting that the remaining contribution here is 4.65 % lower than that in Sect. 4.2 (without global CH4 emissions shut off in both cases), indicating that the nonlinear effects with emission sources shut off globally are larger than those with regional emission clusters shut off.
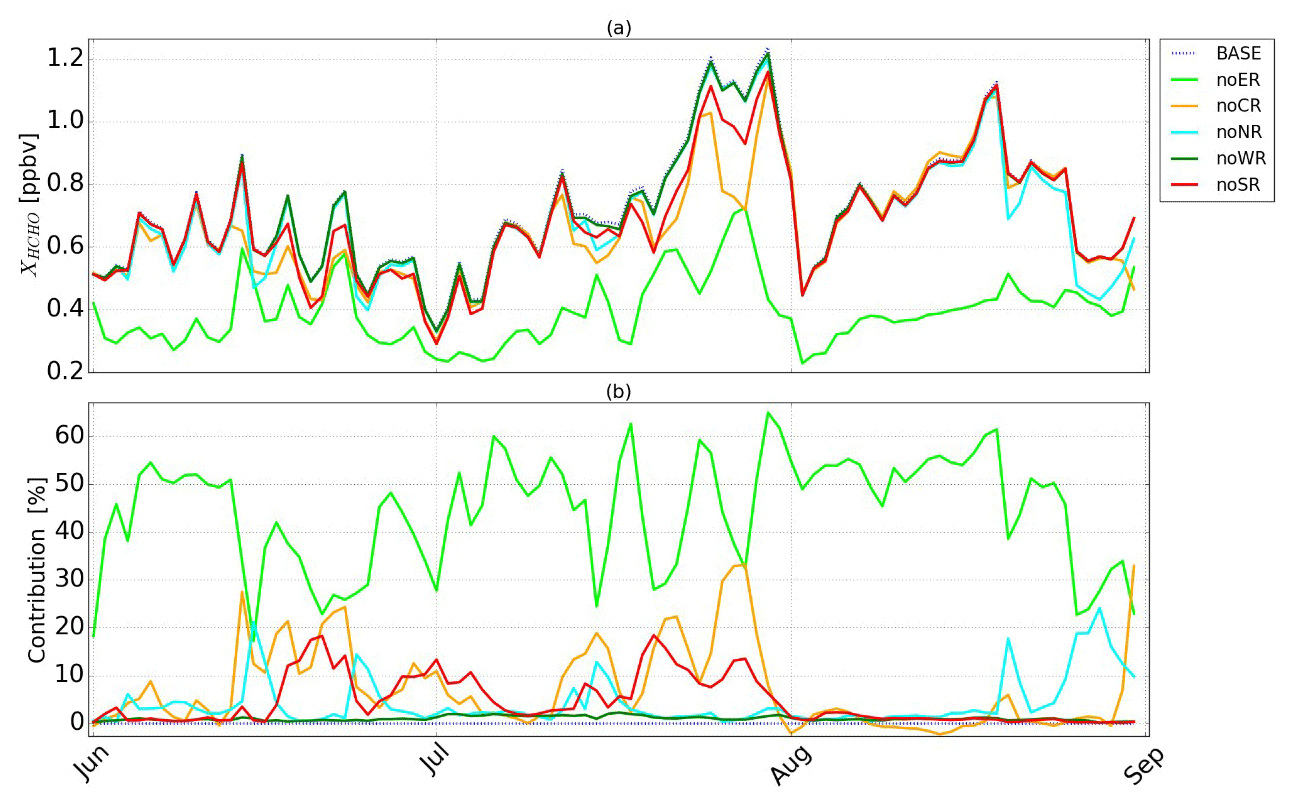
Figure 8(a) Daily mean XHCHO (in ppbv) time series averaged over the summertime of 2015 to 2019 above Hefei simulated by GEOS-Chem, according to the BASE and sensitivity (i.e., noER, noCR, noNR, noWR, and noSR) simulations. In the sensitivity simulations, the fossil fuel, biogenic, biomass burning and biofuel emissions of all atmospheric compounds within the studied region have been shut off, while the CH4 concentrations are still derived from NOAA measurements, as for the BASE simulation. (b) Relative contribution of each geographical region calculated as the relative difference between the BASE simulation and the corresponding sensitivity simulation (in %).
As a short-lived species (a few hours), the primarily emitted HCHO is heavily contributed from emissions in local and nearby regions. However, HCHO precursors originating from distant areas can be transported to the Hefei site under favorable weather conditions and thus contribute to photochemical HCHO formation. In addition, atmospheric compounds, originating from sources either nearby or in distant areas and affecting the chemistry of HCHO or its precursors, could contribute to photochemical HCHO formation or background. As a result, in the vicinity of the observation site, emissions over eastern China dominated both the emitted and photochemical HCHO. Emissions outside eastern China mainly contributed to the photochemical or background HCHO at the observation site because of long-distance transport. Indeed, the sensitivity tests suggest that the NMVOC-related HCHO summertime enhancements were exclusively dominated by the emissions within eastern China.
The emissions in western China are typically lower than those in other parts of China because of lower population and industries in the region (Lu et al., 2019; Zheng et al., 2018). The strong easterly and southwesterly flows prevail in the lower troposphere during the summer Asian monsoon, including the South Asian summer monsoon and East Asian summer monsoon (Liu et al., 2003; Wu et al., 2012). Therefore, western China has the lowest contribution to the observed HCHO summertime enhancements due to the lowest HCHO precursor emissions and few air masses transported from this region during the summer Asian monsoon.
4.4 Potential factors driving interannual variability of HCHO
In this study, we use previous HCHO measurements at a rural site in the YRD region to represent the background HCHO concentration in the “clean” atmosphere over Hefei and assume its amplitude to be constant over years. As a result, the observed interannual variability of HCHO from 2015 to 2019 was not driven by the background portion but by either emitted or photochemical portions, or both. China has implemented a series of active clean air policies since 2013 to mitigate severe air pollution problems (Sun et al., 2020; Zhang et al., 2019; Zheng et al., 2018). Since then the anthropogenic emissions of major air pollutants have decreased, and the overall air quality has substantially improved (Sun et al., 2020; Zhang et al., 2019; Zheng et al., 2018). The Prevention and Control of Atmospheric Pollution also included the prohibition of crop residue burning over China in 2015 because crop residue burning emissions can result in poor air quality (http://www.chinalaw.gov.cn, last access: 19 June 2020), leading to a dramatic decrease in the crop residue burning events over China since then (Sun et al., 2020). Indeed, as evidenced in Table 2, the anthropogenic and biomass burning emissions of many air pollutants, such as HCHO, sulfur dioxide (SO2), NOx, TSP (particulate matter with an aerodynamic diameter of 100 µm or less), particulate matter 2.5 (PM2.5), particulate matter 10 (PM10), CO, black carbon (BC), and organic carbon (OC), showed decreases in 2017 relative to 2016 (Lu et al., 2019; Zhang et al., 2019; Zheng et al., 2018).
Anthropogenic and biomass burning HCHO emissions showed relative change rates of −2.0 % and −17.0 %, respectively, resulting in a total change rate of −9.5 % in 2017 relative to 2016. As for photochemical HCHO, biomass burning emissions of its NMVOC precursors showed a significant negative change rate of −17.0 % in 2017 relative to 2016 as a consequence of the prohibition of crop residue burning over China. However, both anthropogenic and biogenic emissions of NMVOCs showed positive change rates of 1.0 % and 6.4 %, respectively, in 2017 relative to 2016. When taking all emission categories into account, NMVOC emissions were increased by 1.9 % in 2017 relative to 2016. Furthermore, as an important precursor of HCHO, CH4 emissions over eastern China were increased by approximately 1 % in 2017 relative to 2016 (Table 2). As a result, the observed increasing change rate of HCHO from 2015 to 2019 can be, to a large extent, attributed to the increase in photochemical HCHO resulting from increasing change rates of both NMVOCs and CH4, which overwhelmed the decrease in emitted HCHO.
China has implemented a series of active clean air policies in recent years to mitigate severe air pollution problems. Therefore, the emissions of major air pollutants have decreased, and the overall air quality across China has substantially improved. However, the volatile organic compound (VOC) emissions, which are key precursors of formaldehyde (HCHO) and ozone (O3), are still increasing because the current clean air policies in China lack mitigation measures for VOCs.
This study mapped the drivers of the observed variability in HCHO from 2015 to 2019 over Hefei, eastern China, using ground-based high-resolution Fourier transform infrared (FTIR) spectroscopy and GEOS-Chem model simulations. The column-averaged dry air mole fractions of HCHO (XHCHO) reached a maximum monthly mean value of (1.1 ± 0.27) ppbv in July and a minimum monthly mean value of (0.4 ± 0.11) ppbv in January. FTIR XHCHO concentrations in July were on average 1.75 times higher than those in January. The XHCHO time series from 2015 to 2019 over Hefei showed a positive change rate of (2.38 ± 0.71) % yr−1. The variability of XHCHO observed by FTIR at Hefei is in good agreement with that of the ground-level HCHO measurements provided by a long-path differential optical absorption spectroscopy (LP-DOAS) instrument, and thus the FTIR column measurements can be used as representatives of near-surface conditions. The relative contributions of emitted and photochemical sources to the observed HCHO were analyzed using ground-level CO and Ox (O3 + NO2) as tracers for emitted and photochemical HCHO, respectively. On average, the contributions of emitted, photochemical, and background sources to the observed XHCHO from 2015 to 2019 were 29.0 ± 19.2 %, 49.2 ± 18.5 %, and 21.8 ± 6.1 %, respectively. The photochemical HCHO was the dominant source of atmospheric HCHO over Hefei for most of the year (68.1 %). In the studied years, total hydroxyl (OH) radical production rates from the photolysis of HCHO and O3 were comparable. The HCHO photolysis was by far an important source of OH radicals over Hefei during all sunlight hours of both summer and winter days.
We found the GEOS-Chem model can simulate the concentrations and seasonal variations of HCHO for the heavily polluted regions over eastern China, and thus it can be used for source attribution. Contributions of different emission categories and geographical regions in China to the observed HCHO were determined by using a series of GEOS-Chem model sensitivity simulations. The oxidations of both CH4 (methane) and nonmethane VOCs (NMVOCs) dominate the HCHO production over Hefei and constitute the main driver of its summertime enhancements. The NMVOC and CH4 emissions accounted for about 56.73 % and 43.27 % of the HCHO summertime enhancements over Hefei, respectively. The NMVOC-related HCHO summertime enhancements were exclusively dominated by the emissions within eastern China. The observed increasing change rate of HCHO from 2015 to 2019 over Hefei is attributed to the increase in photochemical HCHO resulting from increasing change rates of both NMVOCs and CH4, which overwhelmed the decrease in emitted HCHO.
This study can provide an evaluation of recent VOC emissions and regional photochemical capacity in China. In addition, understanding the sources of HCHO is a necessary step for tackling the problems of poor air quality in eastern China and mitigating the emissions of pollutants.
The FTIR HCHO measurements and GEOS-Chem sensitivity simulations in this study are available on request.
The supplement related to this article is available online at: https://doi.org/10.5194/acp-21-6365-2021-supplement.
YS conceived the concept and prepared the paper with input from all the co-authors. HY carried out the GEOS-Chem sensitivity simulations. The remaining authors contributed to this work by providing refined data or constructive comments.
The authors declare that they have no conflict of interest.
The processing and post-processing environments for SFIT4 are provided by the National Center for Atmospheric Research (NCAR), Boulder, Colorado, USA. The NDACC network is thanked for supplying the SFIT software. The LINEFIT code is provided by Frank Hase, Karlsruhe Institute of Technology (KIT), Institute for Meteorology and Climate Research (IMK-ASF), Germany. We thank the senate of Bremen, Germany, for support. We thank the FTIR group at the University of Wollongong, Australia, for help in setting up and operating the FTIR spectrometer at Hefei. We thank the FTIR group at the Royal Belgian Institute for Space Aeronomy (BIRA-IASB), Belgium, for providing the harmonized HCHO retrieval setup. We thank the GEOS-Chem team for the support and Tsinghua University, China, for providing the latest MEIC inventory. We thank Ziheng Song from the Hefei Thomas School for his contribution to the work of spectra filtering, retrieval, validation, and data curation and investigation.
This research has been supported by the National High Technology Research and Development Program of China (nos. 2019YFC0214802, 2017YFC0210002, 2018YFC0213201, and 2019YFC0214702), the National Science Foundation of China (nos. 51778596, 41977184, and 41775025), the Major Projects of High Resolution Earth Observation Systems of National Science and Technology (05-Y30B01-9001-19/20-3), the Sino-German Mobility programme (M-0036), and the Anhui Province Natural Science Foundation of China (no. 2008085QD180).
This paper was edited by Qiang Zhang and reviewed by three anonymous referees.
Albrecht, T., Notholt, J., Wolke, R., Solberg, S., Dye, C., and Malberg, H.: Variations of CH2O and C2H2 determined from ground-based FTIR measurements and comparison with model results, Adv. Space Res., 29, 1713–1718, https://doi.org/10.1016/S0273-1177(02)00120-5, 2002.
Barkley, M. P.: Top-down isoprene emissions over tropical South America inferred from SCIAMACHY and OMI formaldehyde columns, J. Geophys. Res.-Atmos., 118, 6849–6868, https://doi.org/10.1002/jgrd.50552, 2013.
Bey, I., Jacob, D. J., Yantosca, R. M., Logan, J. A., Field, B. D., Fiore, A. M., Li, Q. B., Liu, H. G. Y., Mickley, L. J., and Schultz, M. G.: Global modeling of tropospheric chemistry with assimilated meteorology: Model description and evaluation, J. Geophys. Res.-Atmos., 106, 23073–23095, 2001.
Bian, H. S. and Prather, M. J.: Fast-J2: Accurate simulation of stratospheric photolysis in global chemical models, J. Atmos. Chem., 41, 281–296, 2002.
Boersma, K. F., Jacob, D. J., Trainic, M., Rudich, Y., DeSmedt, I., Dirksen, R., and Eskes, H. J.: Validation of urban NO2 concentrations and their diurnal and seasonal variations observed from the SCIAMACHY and OMI sensors using in situ surface measurements in Israeli cities, Atmos. Chem. Phys., 9, 3867–3879, https://doi.org/10.5194/acp-9-3867-2009, 2009.
Chan, K. L., Ling, L. Y., Hartl, A., Zheng, N. N., Kuhlmann, G., Qin, M., Sun, Y. W., Xie, P. H., Liu, W. Q., and Wenig, M. O.: Comparing different light-emitting diodes as light sources for long path differential optical absorption spectroscopy NO2 and SO2 measurements, Chinese Phys., 21, 119301, https://doi.org/10.1088/1674-1056/21/11/119301, 2012.
Choi, W., Faloona, I. C., Bouvier-Brown, N. C., McKay, M., Goldstein, A. H., Mao, J., Brune, W. H., LaFranchi, B. W., Cohen, R. C., Wolfe, G. M., Thornton, J. A., Sonnenfroh, D. M., and Millet, D. B.: Observations of elevated formaldehyde over a forest canopy suggest missing sources from rapid oxidation of arboreal hydrocarbons, Atmos. Chem. Phys., 10, 8761–8781, https://doi.org/10.5194/acp-10-8761-2010, 2010.
De Smedt, I., Stavrakou, T., Hendrick, F., Danckaert, T., Vlemmix, T., Pinardi, G., Theys, N., Lerot, C., Gielen, C., Vigouroux, C., Hermans, C., Fayt, C., Veefkind, P., Müller, J.-F., and Van Roozendael, M.: Diurnal, seasonal and long-term variations of global formaldehyde columns inferred from combined OMI and GOME-2 observations, Atmos. Chem. Phys., 15, 12519–12545, https://doi.org/10.5194/acp-15-12519-2015, 2015.
Duncan, B. N., Yoshida, Y., Olson, J. R., Sillman, S., Martin, R. V., Lamsal, L., Hu, Y. T., Pickering, K. E., Retscher, C., Allen, D. J., and Crawford, J. H.: Application of OMI observations to a space-based indicator of NOx and VOC controls on surface ozone formation, Atmos. Environ., 44, 2213–2223, 2010.
Eastham, S. D., Weisenstein, D. K., and Barrett, S. R. H.: Development and evaluation of the unified tropospheric-stratospheric chemistry extension (UCX) for the global chemistry-transport model GEOS-Chem, Atmos. Environ., 89, 52–63, 2014.
Fortems-Cheiney, A., Chevallier, F., Pison, I., Bousquet, P., Saunois, M., Szopa, S., Cressot, C., Kurosu, T. P., Chance, K., and Fried, A.: The formaldehyde budget as seen by a global-scale multi-constraint and multi-species inversion system, Atmos. Chem. Phys., 12, 6699–6721, https://doi.org/10.5194/acp-12-6699-2012, 2012.
Franco, B., Hendrick, F., Van Roozendael, M., Müller, J.-F., Stavrakou, T., Marais, E. A., Bovy, B., Bader, W., Fayt, C., Hermans, C., Lejeune, B., Pinardi, G., Servais, C., and Mahieu, E.: Retrievals of formaldehyde from ground-based FTIR and MAX-DOAS observations at the Jungfraujoch station and comparisons with GEOS-Chem and IMAGES model simulations, Atmos. Meas. Tech., 8, 1733–1756, https://doi.org/10.5194/amt-8-1733-2015, 2015.
Franco, B., Marais, E. A., Bovy, B., Bader, W., Lejeune, B., Roland, G., Servais, C., and Mahieu, E.: Diurnal cycle and multi-decadal trend of formaldehyde in the remote atmosphere near 46∘ N, Atmos. Chem. Phys., 16, 4171–4189, https://doi.org/10.5194/acp-16-4171-2016, 2016.
Friedfeld, S., Fraser, M., Ensor, K., Tribble, S., Rehle, D., Leleux, D., and Tittel, F.: Statistical analysis of primary and secondary atmospheric formaldehyde, Atmos. Environ., 36, 4767–4775, https://doi.org/10.1016/S1352-2310(02)00558-7, 2002.
Gao, M., Beig, G., Song, S. J., Zhang, H. L., Hu, J. L., Ying, Q., Liang, F. C., Liu, Y., Wang, H. K., Lu, X., Zhu, T., Carmichael, G. R., Nielsen, C. P., and McElroy, M. B.: The impact of power generation emissions on ambient PM2.5 pollution and human health in China and India, Environ. Int., 121, 250–259, 2018.
Garcia, A. R., Volkamer, R., Molina, L. T., Molina, M. J., Samuelson, J., Mellqvist, J., Galle, B., Herndon, S. C., and Kolb, C. E.: Separation of emitted and photochemical formaldehyde in Mexico City using a statistical analysis and a new pair of gas-phase tracers, Atmos. Chem. Phys., 6, 4545–4557, https://doi.org/10.5194/acp-6-4545-2006, 2006.
Gardiner, T., Forbes, A., de Mazière, M., Vigouroux, C., Mahieu, E., Demoulin, P., Velazco, V., Notholt, J., Blumenstock, T., Hase, F., Kramer, I., Sussmann, R., Stremme, W., Mellqvist, J., Strandberg, A., Ellingsen, K., and Gauss, M.: Trend analysis of greenhouse gases over Europe measured by a network of ground-based remote FTIR instruments, Atmos. Chem. Phys., 8, 6719–6727, https://doi.org/10.5194/acp-8-6719-2008, 2008.
Giglio, L., Randerson, J. T., and van der Werf, G. R.: Analysis of daily, monthly, and annual burned area using the fourth-generation global fire emissions database (GFED4), J. Geophys. Res.-Biogeo., 118, 317–328, https://doi.org/10.1002/jgrg.20042, 2013.
Green, W. H.: Econometric Analysis, 3rd Edn., Pretince Hall Inc., 1998.
Guenther, A. B., Jiang, X., Heald, C. L., Sakulyanontvittaya, T., Duhl, T., Emmons, L. K., and Wang, X.: The Model of Emissions of Gases and Aerosols from Nature version 2.1 (MEGAN2.1): an extended and updated framework for modeling biogenic emissions, Geosci. Model Dev., 5, 1471–1492, https://doi.org/10.5194/gmd-5-1471-2012, 2012.
Hase, F.: Improved instrumental line shape monitoring for the ground-based, high-resolution FTIR spectrometers of the Network for the Detection of Atmospheric Composition Change, Atmos. Meas. Tech., 5, 603–610, https://doi.org/10.5194/amt-5-603-2012, 2012.
Hoesly, R. M., Smith, S. J., Feng, L., Klimont, Z., Janssens-Maenhout, G., Pitkanen, T., Seibert, J. J., Vu, L., Andres, R. J., Bolt, R. M., Bond, T. C., Dawidowski, L., Kholod, N., Kurokawa, J.-I., Li, M., Liu, L., Lu, Z., Moura, M. C. P., O'Rourke, P. R., and Zhang, Q.: Historical (1750–2014) anthropogenic emissions of reactive gases and aerosols from the Community Emissions Data System (CEDS), Geosci. Model Dev., 11, 369–408, https://doi.org/10.5194/gmd-11-369-2018, 2018.
Holzinger, R., Warneke, C., Hansel, A., Jordan, A., Lindinger, W., Scharffe, D. H., Schade, G., and Crutzen, P. J.: Biomass burning as a source of formaldehyde, acetaldehyde, methanol, acetone, acetonitrile, and hydrogen cyanide, Geophys. Res. Lett., 26, 1161–1164, 1999.
Hong, Q., Liu, C., Chan, K. L., Hu, Q., Xie, Z., Liu, H., Si, F., and Liu, J.: Ship-based MAX-DOAS measurements of tropospheric NO2, SO2, and HCHO distribution along the Yangtze River, Atmos. Chem. Phys., 18, 5931–5951, https://doi.org/10.5194/acp-18-5931-2018, 2018.
Hu, J., Li, X., Huang, L., Ying, Q., Zhang, Q., Zhao, B., Wang, S., and Zhang, H.: Ensemble prediction of air quality using the WRF/CMAQ model system for health effect studies in China, Atmos. Chem. Phys., 17, 13103–13118, https://doi.org/10.5194/acp-17-13103-2017, 2017.
Hudman, R. C., Russell, A. R., Valin, L. C., and Cohen, R. C.: Interannual variability in soil nitric oxide emissions over the United States as viewed from space, Atmos. Chem. Phys., 10, 9943–9952, https://doi.org/10.5194/acp-10-9943-2010, 2010.
Hudman, R. C., Moore, N. E., Mebust, A. K., Martin, R. V., Russell, A. R., Valin, L. C., and Cohen, R. C.: Steps towards a mechanistic model of global soil nitric oxide emissions: implementation and space based-constraints, Atmos. Chem. Phys., 12, 7779–7795, https://doi.org/10.5194/acp-12-7779-2012, 2012.
Jacquemart, D., Laraia, A., Tchana, F. K., Gamache, R. R., Perrin, A., and Lacome, N.: Formaldehyde around 3.5 and 5.7 µm: Measurement and calculation of broadening coefficients, J. Quant. Spectrosc. Ra., 111, 1209–1222, 2010.
Jin, X. M. and Holloway, T.: Spatial and temporal variability of ozone sensitivity over China observed from the Ozone Monitoring Instrument, J. Geophys. Res.-Atmos., 120, 7229–7246, 2015.
Jin, X. M., Fiore, A. M., Murray, L. T., Valin, L. C., Lamsal, L. N., Duncan, B., Folkert Boersma, K., De Smedt, I., Abad, G. G., Chance, K., and Tonnesen, G. S.: Evaluating a Space-Based Indicator of Surface Ozone-NOx-VOC Sensitivity Over Midlatitude Source Regions and Application to Decadal Trends, J. Geophys. Res.-Atmos., 122, 10439–10461, https://doi.org/10.1002/2017JD026720, 2017.
Jones, N. B., Riedel, K., Allan, W., Wood, S., Palmer, P. I., Chance, K., and Notholt, J.: Long-term tropospheric formaldehyde concentrations deduced from ground-based fourier transform solar infrared measurements, Atmos. Chem. Phys., 9, 7131–7142, https://doi.org/10.5194/acp-9-7131-2009, 2009.
Keller, C. A., Long, M. S., Yantosca, R. M., Da Silva, A. M., Pawson, S., and Jacob, D. J.: HEMCO v1.0: a versatile, ESMF-compliant component for calculating emissions in atmospheric models, Geosci. Model Dev., 7, 1409–1417, https://doi.org/10.5194/gmd-7-1409-2014, 2014.
Li, M., Zhang, Q., Streets, D. G., He, K. B., Cheng, Y. F., Emmons, L. K., Huo, H., Kang, S. C., Lu, Z., Shao, M., Su, H., Yu, X., and Zhang, Y.: Mapping Asian anthropogenic emissions of non-methane volatile organic compounds to multiple chemical mechanisms, Atmos. Chem. Phys., 14, 5617–5638, https://doi.org/10.5194/acp-14-5617-2014, 2014.
Li, M., Zhang, Q., Kurokawa, J.-I., Woo, J.-H., He, K., Lu, Z., Ohara, T., Song, Y., Streets, D. G., Carmichael, G. R., Cheng, Y., Hong, C., Huo, H., Jiang, X., Kang, S., Liu, F., Su, H., and Zheng, B.: MIX: a mosaic Asian anthropogenic emission inventory under the international collaboration framework of the MICS-Asia and HTAP, Atmos. Chem. Phys., 17, 935–963, https://doi.org/10.5194/acp-17-935-2017, 2017.
Li, N., He, Q., Greenberg, J., Guenther, A., Li, J., Cao, J., Wang, J., Liao, H., Wang, Q., and Zhang, Q.: Impacts of biogenic and anthropogenic emissions on summertime ozone formation in the Guanzhong Basin, China, Atmos. Chem. Phys., 18, 7489–7507, https://doi.org/10.5194/acp-18-7489-2018, 2018.
Li, S. M., Anlauf, K. G., Wiebe, H. A., and Bottenheim, J. W.: Estimating Primary and Secondary Production of HCHO in Eastern North-America Based on Gas-Phase Measurements and Principal Component Analysis, Geophys. Res. Lett., 21, 669–672, 1994.
Li, Y., Shao, M., Lu, S., Chang, C.-C., and Dasgupta, P. K.: Variations and sources of ambient formaldehyde for the 2008 Beijing Olympic games, Atmos. Environ., 44, 2632–2639, https://doi.org/10.1016/j.atmosenv.2010.03.045, 2010.
Ling, H., Schäfer, K., Xin, J., Qin, M., Suppan, P., and Wang, Y.: Small-scale spatial variations of gaseous air pollutants – a comparison of path-integrated and in situ measurement methods, Atmos. Environ., 92, 566–575, 2014.
Liu, F., Zhang, Q., Tong, D., Zheng, B., Li, M., Huo, H., and He, K. B.: High-resolution inventory of technologies, activities, and emissions of coal-fired power plants in China from 1990 to 2010, Atmos. Chem. Phys., 15, 13299–13317, https://doi.org/10.5194/acp-15-13299-2015, 2015.
Liu, H. Y., Jacob, D. J., Bey, I., and Yantosca, R. M.: Constraints from Pb-210 and Be-7 on wet deposition and transport in a global three-dimensional chemical tracer model driven by assimilated meteorological fields, J. Geophys. Res.-Atmos., 106, 12109–12128, 2001.
Liu, H. Y., Jacob, D. J., Bey, I., Yantosca, R. M., Duncan, B. N., and Sachse, G. W.: Transport pathways for Asian pollution outflow over the Pacific: Interannual and seasonal variations, J. Geophys. Res.-Atmos., 108, 8786, https://doi.org/10.1029/2002JD003102, 2003.
Lu, X., Hong, J. Y., Zhang, L., Cooper, O. R., Schultz, M. G., Xu, X. B., Wang, T., Gao, M., Zhao, Y. H., and Zhang, Y. H.: Severe Surface Ozone Pollution in China: A Global Perspective, Environ. Sci. Tech. Let., 5, 487–494, 2018.
Lu, X., Zhang, L., Chen, Y., Zhou, M., Zheng, B., Li, K., Liu, Y., Lin, J., Fu, T.-M., and Zhang, Q.: Exploring 2016–2017 surface ozone pollution over China: source contributions and meteorological influences, Atmos. Chem. Phys., 19, 8339–8361, https://doi.org/10.5194/acp-19-8339-2019, 2019.
Lui, K. H., Ho, S. S. H., Louie, P. K. K., Chan, C. S., Lee, S. C., Hu, D., Chan, P. W., Lee, J. C. W., and Ho, K. F.: Seasonal behavior of carbonyls and source characterization of formaldehyde (HCHO) in ambient air, Atmos. Environ., 152, 51–60, https://doi.org/10.1016/j.atmosenv.2016.12.004, 2017.
Ma, Y., Diao, Y., Zhang, B., Wang, W., Ren, X., Yang, D., Wang, M., Shi, X., and Zheng, J.: Detection of formaldehyde emissions from an industrial zone in the Yangtze River Delta region of China using a proton transfer reaction ion-drift chemical ionization mass spectrometer, Atmos. Meas. Tech., 9, 6101–6116, https://doi.org/10.5194/amt-9-6101-2016, 2016.
Mahajan, A. S., Smedt, I. D., Biswas, M. S., Ghude, S., and Roozendael, M. V.: Inter-annual variations in satellite observations of nitrogen dioxide and formaldehyde over India, Atmos. Environ., 116, 194–201, 2015.
Marais, E. A., Jacob, D. J., Guenther, A., Chance, K., Kurosu, T. P., Murphy, J. G., Reeves, C. E., and Pye, H. O. T.: Improved model of isoprene emissions in Africa using Ozone Monitoring Instrument (OMI) satellite observations of formaldehyde: implications for oxidants and particulate matter, Atmos. Chem. Phys., 14, 7693–7703, https://doi.org/10.5194/acp-14-7693-2014, 2014.
Martin, R. V., Fiore, A. M., and van Donkelaar, A.: Space-based diagnosis of surface ozone sensitivity to anthropogenic emissions, Geophys. Res. Lett., 31, L06120, https://doi.org/10.1029/2004GL019416, 2004.
Millet, D. B., Jacob, D. J., Boersma, K. F., Fu, T. M., Kurosu, T. P., Chance, K., Heald, C. L., and Guenther, A.: Spatial distribution of isoprene emissions from North America derived from formaldehyde column measurements by the OMI satellite sensor, J. Geophys. Res.-Atmos., 113, D02307, https://doi.org/10.1029/2007JD008950, 2008.
Molina, L. T. and Molina, M. J.: Air Quality in the Mexico Megacity, Springer, The Netherlands, 2006.
Murray, L. T.: Lightning NOx and Impacts on Air Quality, Current Pollution Reports, 2, 115–133, https://doi.org/10.1007/s40726-016-0031-7, 2016.
Notholt, J., Hjorth, J., Raes, F., and Schrems, O.: Simultaneous Long Path Field-Measurements of HNO2, CH2O and Aerosol, Ber. Bunsen Phys. Chem., 96, 290–293, 1992.
Notholt, J., Toon, G. C., Rinsland, C. P., Pougatchev, N. S., Jones, N. B., Connor, B. J., Weller, R., Gautrois, M., and Schrems, O.: Latitudinal variations of trace gas concentrations in the free troposphere measured by solar absorption spectroscopy during a ship cruise, J. Geophys. Res.-Atmos., 105, 1337–1349, 2000.
Palmer, P. I., Jacob, D. J., Fiore, A. M., Martin, R. V., Chance, K., and Kurosu, T. P.: Mapping isoprene emissions over North America using formaldehyde column observations from space, J. Geophys. Res.-Atmos., 108, 4180, https://doi.org/10.1029/2002JD00215, 2003.
Perrin, A., Jacquemart, D., Kwabia Tchana, F., and Lacome, N.: Absolute line intensities measurements and calculations for the 5.7 and 3.6 µm bands of formaldehyde, J. Quant. Spectrosc. Ra., 110, 700–716, https://doi.org/10.1016/j.jqsrt.2008.11.005, 2009.
Peters, E., Wittrock, F., Großmann, K., Frieß, U., Richter, A., and Burrows, J. P.: Formaldehyde and nitrogen dioxide over the remote western Pacific Ocean: SCIAMACHY and GOME-2 validation using ship-based MAX-DOAS observations, Atmos. Chem. Phys., 12, 11179–11197, https://doi.org/10.5194/acp-12-11179-2012, 2012.
Possanzini, M., Di Palo, V., and Cecinato, A.: Sources and photodecomposition of formaldehyde and acetaldehyde in Rome ambient air, Atmos. Environ., 36, 3195–3201, 2002.
Pougatchev, N. S., Connor, B. J., and Rinsland, C. P.: Infrared Measurements of the Ozone Vertical-Distribution above Kitt Peak, J. Geophys. Res.-Atmos., 100, 16689–16697, 1995.
Rodgers, C.: Inverse Methods for Atmospheric Sounding: Theory and Practice, Singapore, 2000.
Rodgers, C. D. and Connor, B. J.: Intercomparison of remote sounding instruments, J. Geophys. Res.-Atmos., 108, 4116, https://doi.org/10.1029/2002jd002299, 2003.
Rothman, L. S., Gordon, I. E., Barbe, A., Benner, D. C., Bernath, P. F., Birk, M., Boudon, V., Brown, L. R., Campargue, A., Champion, J. P., Chance, K., Coudert, L. H., Dana, V., Devi, V. M., Fally, S., Flaud, J. M., Gamache, R. R., Goldman, A., Jacquemart, D., Kleiner, I., Lacome, N., Lafferty, W. J., Mandin, J. Y., Massie, S. T., Mikhailenko, S. N., Miller, C. E., Moazzen-Ahmadi, N., Naumenko, O. V., Nikitin, A. V., Orphal, J., Perevalov, V. I., Perrin, A., Predoi-Cross, A., Rinsland, C. P., Rotger, M., Šimečková, M., Smith, M. A. H., Sung, K., Tashkun, S. A., Tennyson, J., Toth, R. A., Vandaele, A. C., and Vander Auwera, J.: The HITRAN 2008 molecular spectroscopic database, J. Quant. Spectrosc. Ra., 110, 533–572, https://doi.org/10.1016/j.jqsrt.2009.02.013, 2009.
Rothman, L. S., Gordon, I. E., Babikov, Y., Barbe, A., Benner, D. C., Bernath, P. F., Birk, M., Bizzocchi, L., Boudon, V., Brown, L. R., Campargue, A., Chance, K., Cohen, E. A., Coudert, L. H., Devi, V. M., Drouin, B. J., Fayt, A., Flaud, J.-M., Gamache, R. R., Harrison, J. J., Hartmann, J.-M., Hill, C., Hodges, J. T., Jacquemart, D., Jolly, A., Lamouroux, J., Roy, R. J. L., Li, G., Long, D. A., Lyulin, O. M., Mackie, C. J., Massie, S. T., Mikhailenk, S., Müller, H. S. P., Naumenko, O. V., and Nikitin, A. V.: The HITRAN2012 molecularspectroscopic database, J. Quant. Spectrosc. Ra., 130, 4–50, https://doi.org/10.1016/j.jqsrt.2013.07.002, 2013.
Santer, B. D., Thorne, P. W., Haimberger, L., Taylor, K. E., Wigley, T. M. L., Lanzante, J. R., Solomon, S., Free, M., Gleckler, P. J., Jones, P. D., Karl, T. R., Klein, S. A., Mears, C., Nychka, D., Schmidt, G. A., Sherwood, S. C., and Wentz, F. J.: Consistency of modelled and observed temperature trends in the tropical troposphere, Int. J. Climatol., 28, 1703–1722, 2008.
Schroeder, J. R., Crawford, J. H., Fried, A., Walega, J., Weinheimer, A., Wisthaler, A., Müller, M., Mikoviny, T., Chen, G., and Shook, M.: New insights into the column ratio as an indicator of near-surface ozone sensitivity, J. Geophys. Res.-Atmos., 122, 8885–8907, https://doi.org/10.1002/2017JD026781, 2017.
Seinfeld, J. H. and Pandis, S. N.: Atmospheric chemistry and physics: from air pollution to climate change, John Wiley & Sons, California, USA, 2016.
Shen, L., Jacob, D. J., Liu, X., Huang, G., Li, K., Liao, H., and Wang, T.: An evaluation of the ability of the Ozone Monitoring Instrument (OMI) to observe boundary layer ozone pollution across China: application to 2005–2017 ozone trends, Atmos. Chem. Phys., 19, 6551–6560, https://doi.org/10.5194/acp-19-6551-2019, 2019.
Stavrakou, T., Müller, J.-F., De Smedt, I., Van Roozendael, M., van der Werf, G. R., Giglio, L., and Guenther, A.: Evaluating the performance of pyrogenic and biogenic emission inventories against one decade of space-based formaldehyde columns, Atmos. Chem. Phys., 9, 1037–1060, https://doi.org/10.5194/acp-9-1037-2009, 2009.
Streets, D. G., Canty, T., Carmichael, G. R., de Foy, B., Dickerson, R. R., Duncan, B. N., Edwards, D. P., Haynes, J. A., Henze, D. K., Houyoux, M. R., Jacobi, D. J., Krotkov, N. A., Lamsal, L. N., Liu, Y., Lu, Z. F., Martini, R. V., Pfister, G. G., Pinder, R. W., Salawitch, R. J., and Wechti, K. J.: Emissions estimation from satellite retrievals: A review of current capability, Atmos. Environ., 77, 1011–1042, https://doi.org/10.1016/j.atmosenv.2013.05.051, 2013.
Su, W., Liu, C., Hu, Q., Zhao, S., Sun, Y., Wang, W., Zhu, Y., Liu, J., and Kim, J.: Primary and secondary sources of ambient formaldehyde in the Yangtze River Delta based on Ozone Mapping and Profiler Suite (OMPS) observations, Atmos. Chem. Phys., 19, 6717–6736, https://doi.org/10.5194/acp-19-6717-2019, 2019.
Sun, Y., Liu, C., Palm, M., Vigouroux, C., Notholt, J., Hu, Q., Jones, N., Wang, W., Su, W., Zhang, W., Shan, C., Tian, Y., Xu, X., De Mazière, M., Zhou, M., and Liu, J.: Ozone seasonal evolution and photochemical production regime in the polluted troposphere in eastern China derived from high-resolution Fourier transform spectrometry (FTS) observations, Atmos. Chem. Phys., 18, 14569–14583, https://doi.org/10.5194/acp-18-14569-2018, 2018a.
Sun, Y., Palm, M., Liu, C., Hase, F., Griffith, D., Weinzierl, C., Petri, C., Wang, W., and Notholt, J.: The influence of instrumental line shape degradation on NDACC gas retrievals: total column and profile, Atmos. Meas. Tech., 11, 2879–2896, https://doi.org/10.5194/amt-11-2879-2018, 2018b.
Sun, Y., Liu, C., Zhang, L., Palm, M., Notholt, J., Yin, H., Vigouroux, C., Lutsch, E., Wang, W., Shan, C., Blumenstock, T., Nagahama, T., Morino, I., Mahieu, E., Strong, K., Langerock, B., De Mazière, M., Hu, Q., Zhang, H., Petri, C., and Liu, J.: Fourier transform infrared time series of tropospheric HCN in eastern China: seasonality, interannual variability, and source attribution, Atmos. Chem. Phys., 20, 5437–5456, https://doi.org/10.5194/acp-20-5437-2020, 2020.
Surl, L., Palmer, P. I., and González Abad, G.: Which processes drive observed variations of HCHO columns over India?, Atmos. Chem. Phys., 18, 4549–4566, https://doi.org/10.5194/acp-18-4549-2018, 2018.
Tian, Y., Sun, Y. W., Liu, C., Wang, W., Shan, C. G., Xu, X. W., and Hu, Q. H.: Characterisation of methane variability and trends from near-infrared solar spectra over Hefei, China, Atmos. Environ., 173, 198–209, 2018.
Viatte, C., Strong, K., Walker, K. A., and Drummond, J. R.: Five years of CO, HCN, C2H6, C2H2, CH3OH, HCOOH and H2CO total columns measured in the Canadian high Arctic, Atmos. Meas. Tech., 7, 1547–1570, https://doi.org/10.5194/amt-7-1547-2014, 2014.
Vigouroux, C., Hendrick, F., Stavrakou, T., Dils, B., De Smedt, I., Hermans, C., Merlaud, A., Scolas, F., Senten, C., Vanhaelewyn, G., Fally, S., Carleer, M., Metzger, J.-M., Müller, J.-F., Van Roozendael, M., and De Mazière, M.: Ground-based FTIR and MAX-DOAS observations of formaldehyde at Réunion Island and comparisons with satellite and model data, Atmos. Chem. Phys., 9, 9523–9544, https://doi.org/10.5194/acp-9-9523-2009, 2009.
Vigouroux, C., Blumenstock, T., Coffey, M., Errera, Q., García, O., Jones, N. B., Hannigan, J. W., Hase, F., Liley, B., Mahieu, E., Mellqvist, J., Notholt, J., Palm, M., Persson, G., Schneider, M., Servais, C., Smale, D., Thölix, L., and De Mazière, M.: Trends of ozone total columns and vertical distribution from FTIR observations at eight NDACC stations around the globe, Atmos. Chem. Phys., 15, 2915–2933, https://doi.org/10.5194/acp-15-2915-2015, 2015.
Vigouroux, C., Bauer Aquino, C. A., Bauwens, M., Becker, C., Blumenstock, T., De Mazière, M., García, O., Grutter, M., Guarin, C., Hannigan, J., Hase, F., Jones, N., Kivi, R., Koshelev, D., Langerock, B., Lutsch, E., Makarova, M., Metzger, J.-M., Müller, J.-F., Notholt, J., Ortega, I., Palm, M., Paton-Walsh, C., Poberovskii, A., Rettinger, M., Robinson, J., Smale, D., Stavrakou, T., Stremme, W., Strong, K., Sussmann, R., Té, Y., and Toon, G.: NDACC harmonized formaldehyde time series from 21 FTIR stations covering a wide range of column abundances, Atmos. Meas. Tech., 11, 5049–5073, https://doi.org/10.5194/amt-11-5049-2018, 2018.
Volkamer, R., Sheehy, P., Molina, L. T., and Molina, M. J.: Oxidative capacity of the Mexico City atmosphere – Part 1: A radical source perspective, Atmos. Chem. Phys., 10, 6969–6991, https://doi.org/10.5194/acp-10-6969-2010, 2010.
Wang, M., Chen, W., Shao, M., Lu, S., Zeng, L., and Hu, M.: Investigation of carbonyl compound sources at a rural site in the Yangtze River Delta region of China, J. Environ. Sci., 28, 128–136, 2015.
Wang, W., Tian, Y., Liu, C., Sun, Y., Liu, W., Xie, P., Liu, J., Xu, J., Morino, I., Velazco, V. A., Griffith, D. W. T., Notholt, J., and Warneke, T.: Investigating the performance of a greenhouse gas observatory in Hefei, China, Atmos. Meas. Tech., 10, 2627–2643, https://doi.org/10.5194/amt-10-2627-2017, 2017.
Wesely, M. L.: Parameterization of Surface Resistances to Gaseous Dry Deposition in Regional-Scale Numerical-Models, Atmos. Environ., 23, 1293–1304, https://doi.org/10.1016/0004-6981(89)90153-4, 1989.
Witte, J. C., Duncan, B. N., Douglass, A. R., Kurosu, T. P., Chance, K., and Retscher, C.: The unique OMI feature during the 2008 Beijing Olympics: Implications for ozone production sensitivity, Atmos. Environ., 45, 3103–3111, 2011.
Wu, G. X., Liu, Y. M., He, B., Bao, Q., Duan, A. M., and Jin, F. F.: Thermal Controls on the Asian Summer Monsoon, Sci. Rep.-UK, 2, 404, https://doi.org/10.1038/srep00404, 2012.
Yin, H., Sun, Y. W., Liu, C., Zhang, L., Lu, X., Wang, W., Shan, C. G., Hu, Q. H., Tian, Y., Zhang, C. X., Su, W. J., Zhang, H. F., Palm, M. A., Notholt, J., and Liu, J. G.: FTIR time series of stratospheric NO2 over Hefei, China, and comparisons with OMI and GEOS-Chem model data, Opt. Express, 27, 1225–1240, 2019.
Yin, H., Sun, Y. W., Liu, C., Lu, X., Smale, D., Blumenstock, T., Nagahama, T., Wang, W., Tian, Y., Hu, Q. H., Shan, C. G., Zhang, H. F., and Liu, J. G.: Ground-based FTIR observation of hydrogen chloride (HCl) over Hefei, China, and comparisons with GEOS-Chem model data and other ground-based FTIR stations data, Opt. Express, 28, 8041–8055, 2020.
Zeng, G., Wood, S. W., Morgenstern, O., Jones, N. B., Robinson, J., and Smale, D.: Trends and variations in CO, C2H6, and HCN in the Southern Hemisphere point to the declining anthropogenic emissions of CO and C2H6, Atmos. Chem. Phys., 12, 7543–7555, https://doi.org/10.5194/acp-12-7543-2012, 2012.
Zhang, C. X., Liu, C., Hu, Q. H., Cai, Z. N., Su, W. J., Xia, C. Z., Zhu, Y. Z., Wang, S. W., and Liu, J. G.: Satellite UV-Vis spectroscopy: implications for air quality trends and their driving forces in China during 2005–2017, Light-Sci. Appl., 8, https://doi.org/10.1038/s41377-019-0210-6, 2019.
Zhang, L. M., Gong, S. L., Padro, J., and Barrie, L.: A size-segregated particle dry deposition scheme for an atmospheric aerosol module, Atmos. Environ., 35, 549–560, https://doi.org/10.1016/S1352-2310(00)00326-5, 2001.
Zheng, B., Huo, H., Zhang, Q., Yao, Z. L., Wang, X. T., Yang, X. F., Liu, H., and He, K. B.: High-resolution mapping of vehicle emissions in China in 2008, Atmos. Chem. Phys., 14, 9787–9805, https://doi.org/10.5194/acp-14-9787-2014, 2014.
Zheng, B., Tong, D., Li, M., Liu, F., Hong, C., Geng, G., Li, H., Li, X., Peng, L., Qi, J., Yan, L., Zhang, Y., Zhao, H., Zheng, Y., He, K., and Zhang, Q.: Trends in China's anthropogenic emissions since 2010 as the consequence of clean air actions, Atmos. Chem. Phys., 18, 14095–14111, https://doi.org/10.5194/acp-18-14095-2018, 2018.
Zheng, N., Chan, K. L., Xie, P., Qin, M., Ling, L., Wu, F., and Hu, R.: Observations of atmospheric trace gases in china using a compact led long path doas system, Atmos. Pollut. Res., 9, 379–387, 2018.