the Creative Commons Attribution 4.0 License.
the Creative Commons Attribution 4.0 License.
 | 18 Jan 2021
Variability in the mass absorption cross section of black carbon (BC) aerosols is driven by BC internal mixing state at a central European background site (Melpitz, Germany) in winter
Jinfeng Yuan
Marco Zanatta
Andreas B. Herber
Thomas Müller
Birgit Wehner
Laurent Poulain
Thomas Tuch
Urs Baltensperger
Martin Gysel-Beer
Properties of atmospheric black carbon (BC) particles were characterized during a field experiment at a rural background site (Melpitz, Germany) in February 2017. BC absorption at a wavelength of 870 nm was measured by a photoacoustic extinctiometer, and BC physical properties (BC mass concentration, core size distribution and coating thickness) were measured by a single-particle soot photometer (SP2). Additionally, a catalytic stripper was used to intermittently remove BC coatings by alternating between ambient and thermo-denuded conditions. From these data the mass absorption cross section of BC (MACBC) and its enhancement factor (EMAC) were inferred for essentially water-free aerosol as present after drying to low relative humidity (RH). Two methods were applied independently to investigate the coating effect on EMAC: a correlation method (MACBC, ambient vs. BC coating thickness) and a denuding method (MACBC, ambient vs. MACBC, denuded). Observed EMAC values varied from 1.0 to 1.6 (lower limit from denuding method) or ∼1.2 to 1.9 (higher limit from correlation method), with the mean coating volume fraction ranging from 54 % to 78 % in the dominating mass equivalent BC core diameter range of 200–220 nm. MACBC and EMAC were strongly correlated with coating thickness of BC. By contrast, other potential drivers of EMAC variability, such as different BC sources (air mass origin and absorption Ångström exponent), coating composition (ratio of inorganics to organics) and BC core size distribution, had only minor effects. These results for ambient BC measured at Melpitz during winter show that the lensing effect caused by coatings on BC is the main driver of the variations in MACBC and EMAC, while changes in other BC particle properties such as source, BC core size or coating composition play only minor roles at this rural background site with a large fraction of aged particles. Indirect evidence suggests that potential dampening of the lensing effect due to unfavorable morphology was most likely small or even negligible.
- Article
(5163 KB) - Full-text XML
-
Supplement
(1714 KB) - BibTeX
- EndNote


Black carbon (BC), which commonly refers to graphitic elemental carbon (Petzold et al., 2013), is a major component of atmospheric aerosols. BC-containing particles are emitted from incomplete combustion processes. BC is highly refractory, insoluble and a strong light absorber across the whole solar spectrum (Corbin et al., 2019). The latter makes BC the dominant light-absorbing component of atmospheric aerosols and causes a substantial positive radiative forcing through aerosol–radiation interactions (Bond et al., 2013). Two parameters are required to quantify the light absorption coefficient of BC (bap, BC; [Mm−1]) in climate models: the mass absorption cross section of black carbon (MACBC; [m2 g−1]) and the BC mass concentration (mBC; [µg m−3]), as shown in Eq. (1),
BC mass concentrations are simulated with chemical transport models, taking BC emission inventories as input. MACBC values must be assumed or calculated from simplified optical models based on knowledge gained from laboratory and field measurements.
The term “aerosol mixing state” refers to the distribution of different particulate species among particles, where an internally mixed particle contains multiple species and an externally mixed particle only contains a single species. For example, when BC is freshly emitted, it is often separated from other species, which refers to the externally mixed state. During the atmospheric aging of BC, non-BC particles coagulate (e.g., particulate sulfate, nitrate, organics) with (and gaseous species condense onto) BC particles to form a variety of internal mixing states.
The mixing state of BC with other particulate matter in the same particle – the internal mixing state – is relevant because it influences the light absorption by the BC in this particle. Based on a simple configuration of concentric spheres core–shell morphology, Mie theory provides a solution to predict light absorption by coated BC particles (Bohren and Huffman, 1998). According to this theory, if a BC particle is coated with non-absorbing species, more light is focused towards the BC core, enhancing the amount of light it absorbs and thereby increasing its MACBC value (Eq. 1). This is known as the “lensing effect” (van de Hulst, 1957). The MACBC enhancement factor, EMAC, due to lensing is conceptually defined as the MAC value of the mixed particle, MACBC, mixed, divided by the MAC value of the bare BC core:
The lensing effect cannot result in unlimited enhancement of light absorption. Instead, a saturation point occurs, above which EMAC does not increase any further with continued increase in coating thickness. The maximal MAC enhancement factor that can be reached for a BC core depends on particle morphology and size, with greater values for smaller cores. Mie theory (Bohren and Huffman, 1998) predicts that the lensing effect saturates at an enhancement factor of 2–3 for concentric coatings around BC cores with mass equivalent diameters in the range between 100 and 300 nm, which is the diameter range where ambient BC mass size distributions typically peak (Bond et al., 2006). Therefore, EMAC factors of up to ∼3 are plausible for ambient BC particles (Bond et al., 2006; Zhang et al., 2017).
Particle morphology, i.e., the shape of the particle and the core, as well as the position of the BC core within a particle, also affect absorption enhancement. More sophisticated numerical simulations of light absorption by BC particles of variable morphology indicate that the fractal dimension, the location inside the particle and the refractive index of BC aggregates also influence EMAC. Considering these factors typically results in smaller EMAC than would be expected with simpler core–shell morphologies (Adachi et al., 2010; Zhang et al., 2017).
As well as being theoretically predicted, the lensing effect has also been observed in laboratory experiments. For example, Shiraiwa et al. (2010) coated colloidal graphite particles (compact, near-spherical shape) with volatile organic species (oleic acid and glycerol, boiling points are 290 and 360 ∘C, respectively) and measured the BC core size distribution, coating thickness, and light absorption properties of both untreated and thermo-denuded samples (at 400 ∘C). They observed that EMAC at 532 nm increased from 1.3 to 2 as the coating volume fraction was increased from 42 % to 88 %. In contrast, Qiu et al. (2012) observed a negligible lensing effect when they coated 150 nm combustion soot particles with secondary organic aerosol formed by the OH-initiated oxidation of toluene in an environmental chamber. The observed EMAC values at 532 nm only reached 1.1 for volume equivalent coating fractions from 54 % to 70 %. It should be noted that the results of Qiu et al. (2012) are outliers among the more numerous laboratory studies showing notable absorption enhancements.
The BC lensing effect and its relationship to internal mixing state have also been investigated with field measurements of atmospheric aerosols. Some studies have used a soot particle aerosol mass spectrometer (SP-AMS, Aerodyne Inc.) to measure relative coating masses as an indicator for BC internal mixing state. The SP-AMS is a modified form of the aerosol mass spectrometer (AMS) performed by coupling a 1064 nm laser source to an AMS instrument, making it possible to measure both BC and non-refractory aerosol components. Using this instrument one can measure the chemical composition of BC-containing particles (specifically, the average ratio of non-BC to BC core mass, referred to as Rcoat-BC). However, the detection efficiency of BC cores in an SP-AMS is sensitive to BC mixing state, since coatings affect the focusing of BC-containing particles within the instrument, and consequently the degree of overlap between the instrument's laser and particle beams (Willis et al., 2014; Taylor et al., 2015). This complicates the quantification of absolute BC core and coating mass concentrations with the SP-AMS, particularly in ambient campaigns where a wide variety of BC mixing states might be encountered (e.g., Collier et al., 2018).
Other field studies have employed traditional single-particle soot photometer (SP2) instruments to measure absolute BC coating thicknesses. Unlike the SP-AMS, the detection efficiency of BC particles in the SP2 does not depend on particle mixing state. Therefore, SP2 measurements are more quantitative than SP-AMS measurements in terms of both refractory BC (rBC) mass and BC core diameter. In addition, incandescence measurements are combined with optical measurements of particle size in the SP2, allowing quantitative measurement of the BC coating thickness under the assumptions of a core–shell morphology for BC-containing particles, as well as certain material properties (Gao et al., 2007; Laborde et al., 2012a). The derived coating thickness values are sensitive to these assumptions, as discussed in detail below in Sect. 4.2.1 and by Taylor et al. (2015), which necessitates the exercise of considerable care when using the SP2 to perform quantitative coating thickness measurements.
Cappa et al. (2019) summarized the most recent ambient observations of BC mixing state and the lensing effect. In some studies (Liu et al., 2015b; Peng et al., 2016) a strong lensing effect was observed, with EMAC reaching above 2 for mean ratios of coating to core mass (Rcoat-BC) values up to 6. However, in other studies, only a weak or negligible lensing effect was observed (EMAC < 1.2 for Rcoat-BC in the range 0.6 to 20) (Healy et al., 2015; Cappa et al., 2019). Cappa et al. (2019) formulated two hypotheses to explain the large difference in EMAC values observed in these two different groups of studies: (1) the diversity of coating mass fraction among individual particles (e.g., Fierce et al., 2016) and (2) different mixing morphologies (e.g., off-center behavior of BC within a particle caused reduced EMAC, Adachi et al., 2010). Furthermore, the composition of the coating material may, via composition dependence of mixed particle morphology (Moffet et al., 2016), also affect the resulting lensing effect (e.g., Zhang et al., 2018; Wei et al., 2013). However, the relative importance and interplay of these effects in atmospheric aerosols remain poorly understood.
Zanatta et al. (2016) reported MACBC values inferred from long-term observations at various European sites of the European Research Infrastructure for the observation of aerosol, clouds and trace gases (ACTRIS), additionally providing indirect evidence that the lensing effect occurs. In this study, we performed an intensive field experiment at one of these sites – the Melpitz observatory in Germany – with the goal to directly quantify the main drivers behind variations of MACBC, with a particular focus on mixing state and lensing effect.
2.1 Methods to quantify the lensing effect
To explore the light absorption and the coating-induced enhancement by the same BC mass, the mass absorption cross section of BC (MACBC) is a key parameter to start with. Inverse to the modeling calculation shown in Eq. (1) in Sect. 1, the MACBC ([m2 g−1]) is defined in Eq. (3). To infer MACBC, the BC absorption coefficient (bap, BC; [Mm−1]) at 870 nm and the BC mass concentration (mBC; [µg m−3]) need to be measured.
Two independent approaches were chosen in this study to quantify the lensing effect on the MACBC of atmospheric BC-containing particles. The first approach, hereafter referred to as the correlation method, is based on a correlation analysis of concurrent quantitative measurements of both MACBC and BC particle mixing state. The mixing state is inferred as the coating thickness resulting from the difference of measured diameters between the entire particle and the BC core based on an assumed core–shell configuration. The relationships between this specific metric of BC mixing state and more general measures of aerosol mixing state (e.g., the mixing state index χ) are discussed in the review of Riemer et al. (2019). The second approach, hereafter referred to as the denuding method, is based on modifying the mixing state of atmospheric BC-containing particles, i.e., to remove the coatings present on atmospheric BC using a catalytic stripper. Measurements of the MACBC in both the untreated ambient aerosols and the corresponding denuded aerosols make it possible to establish the causal relationship between the lensing effect and BC mixing state. For this purpose, the EMAC is calculated with Eq. (4) under the assumption that the MACBC of the denuded aerosol represents the properties of bare BC (i.e., by assuming that MACBC, denuded = MACBC, bare).
The two approaches described above were applied during a field experiment, which is described in detail in the following.
2.2 The Melpitz site
The intensive field campaign was conducted at the research site of the Leibniz Institute for Tropospheric Research (TROPOS) in Melpitz (51∘32'N, 12∘56'E, 86 m a.s.l.). The Melpitz site is a rural and regional background site, belonging to many international (GAW, ACTRIS and EMEP) and domestic (GUAN) observational networks (Birmili et al., 2016; Poulain et al., 2014; Spindler et al., 2010; Spindler et al., 2013). The station is located near the town of Torgau with 20 000 inhabitants in eastern Germany and 50 km northeast from the city of Leipzig, with 600 000 inhabitants. The observational containers are situated on the flat and semi-natural meadow surround by agricultural land. A federal main road (B 87) is 1.5 km north from the station and two conservative forests are located 2.5 and 1 km in the north and south direction, respectively. The Melpitz site is about 130 km from the Polish border and anthropogenic emissions between Melpitz and Poland are negligible (Spindler et al., 2013). The measurements here are regarded as representative of the lowland background atmosphere in central Europe (Asmi et al., 2011; Aas et al., 2012; Birmili et al., 2009). The two main wind directions for Melpitz are southwest (SW) and east (E) with the different air masses arriving at Melpitz: air masses crossing the western part of central Europe, including the city of Leipzig, and continental air masses with anthropogenic emissions from countries in eastern Europe via long-range transport. Seasonally, the particulate mass concentration is highest with the easterly wind direction in winter and lowest with the westerly wind direction in summer (Spindler et al., 2013).
The field experiment was conducted from 1 to 23 February 2017. Contributions from different BC sources are expected during the winter season. Furthermore, the higher pollution level makes it possible to achieve higher time resolution with the online instruments.
2.3 Experimental setup
The sampling setup, including the instruments, is shown in Fig. 1. The ambient air was passed through a PM10 inlet followed by a Nafion dryer (relative humidity, RH, <30 %) and a flow splitter. A first branch fed the instruments permanently probing untreated ambient aerosol, including a multi-angle absorption photometer (MAAP; aerosol absorption coefficient at 637 nm wavelength), an Aethalometer AE33 (spectral dependence of the aerosol absorption coefficient) and an aerosol chemical speciation monitor (ACSM). The ACSM (Aerodyne Research, MA, US; Ng et al., 2011) measured the near-PM1 bulk chemical composition of non-refractory aerosol species, including organics (Org), nitrate (NO3), sulfate (SO4), ammonium (NH4) and chloride (Chl). The ACSM measurements are described as near-PM1 since the instrument inlet has an upper cut-off at an aerodynamic diameter of around 1 µm.
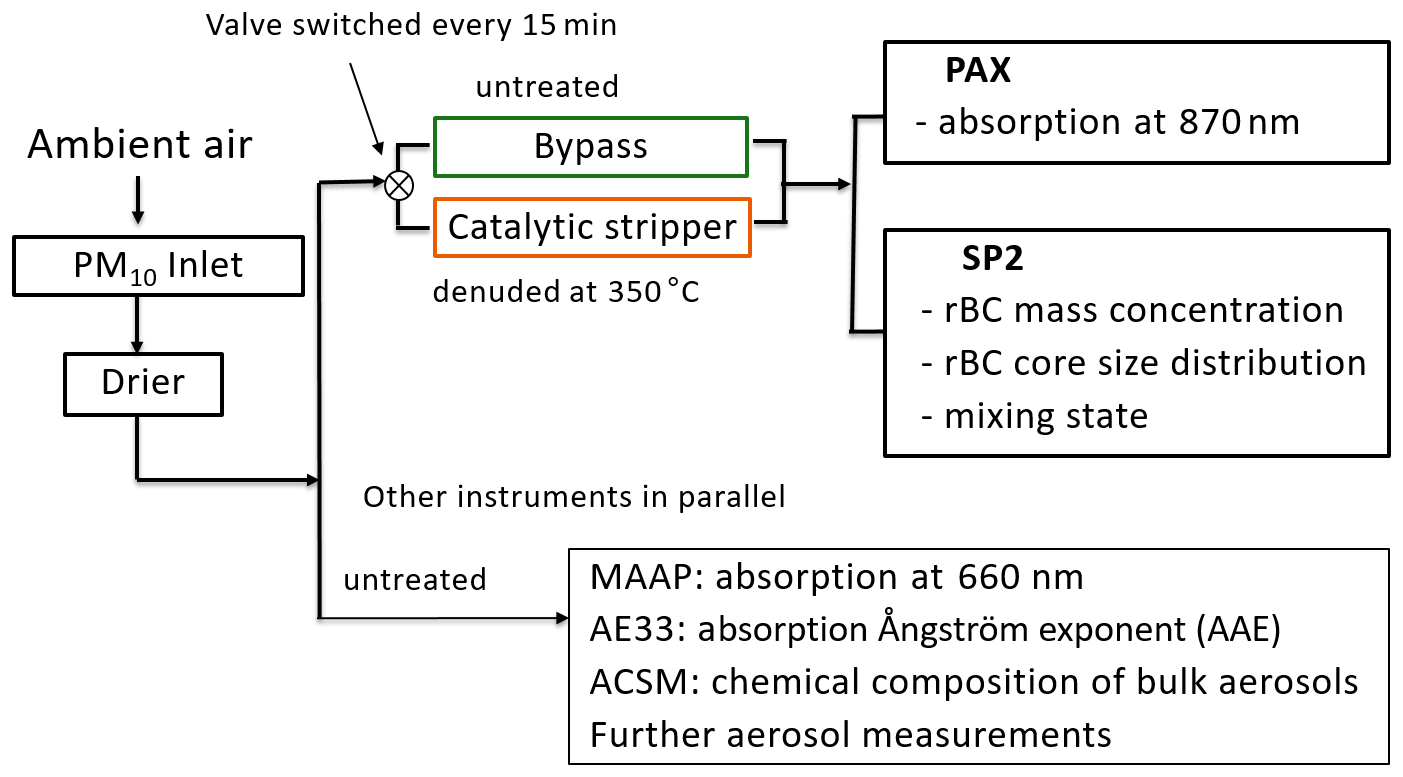
Figure 1Schematic of the sampling system, instruments and target quantities related to this study. PAX is photoacoustic extinctiometer, and SP2 is single-particle soot photometer. PAX and SP2 analyzed both ambient and denuded samples. The other instruments only analyzed the untreated ambient aerosol, including a multi-angle absorption photometer (MAAP), an Aethalometer (AE33), an aerosol chemical speciation monitor (ACSM) and further instruments, which are not shown here.
A second branch directed sample to a three-way valve, from which the aerosol passed through either a catalytic stripper or a bypass line. The valve was automatically switched every 15 min, alternately delivering untreated ambient or denuded aerosol to a photo-acoustic extinctiometer (PAX) and a single-particle soot photometer, which measured the aerosol absorption coefficient at 870 nm wavelength and BC properties, respectively. The measurements were averaged to 3 h intervals (separately for each branch behind the switching inlet), as the signal-to-noise ratio of the 15 min data was insufficient for some instruments.
Beside the aerosol measurements, co-located trace gas measurements (including SO2, NO and NO2) were also performed (not shown in Fig. 1), which were used to indicate air mass origins combined with the patterns of meteorology and aerosol chemical properties (Sect. 3.1). Concentrations of SO2 were measured with a UV-Fluorescence instrument (Type APSA 360A, HORIBA Jobin Yvon GmbH, Germany), and NO and NO2 (NOx) concentrations were measured with a Trace Level NOx Analyzer (Type 42i-TL, Thermo Fisher Scientific GmbH, Germany).
2.4 Instrumentation
2.4.1 The single-particle soot photometer (SP2)
The SP2 is based on the laser-induced incandescence technique (LII), and the principles have been described in previous studies (Stephens et al., 2003; Schwarz et al., 2006). Briefly, particles pass through an intra-cavity, continuous-wave Nd:YAG laser beam at 1064 nm. Since BC is the most strongly light-absorbing and refractory aerosol material in the atmosphere (Pöschl, 2003; Schwarz et al., 2006), BC can absorb infrared light (Schwarz et al., 2010) and be heated to its boiling point as high as around 4230–4325 K (Moteki and Kondo, 2010), emitting thermal radiation as measurable incandescence before sublimation. The emitted incandescent light is optically filtered before being detected by a photomultiplier tube (PMT), which is sensitive to a wide wavelength range (broadband between ∼350 and 800 nm), equipped with high gain and low gain. The peak intensity of the incandescent light is proportional to the BC mass in the particle regardless of its mixing state (Slowik et al., 2007) since non-BC species evaporate at temperatures much lower than the BC sublimation temperature. Based on this operational characteristic, BC quantified by the LII method is hereafter termed as refractory BC (rBC), following the terminology recommended by Petzold et al. (2013).
The inherent limitation for detection of BC by the SP2 is that for very small rBC mass in a single particle or insufficient lower laser intensities the conductive cooling dominates over BC absorption and thus BC cannot be heated to sublimation (Schwarz et al., 2010). The SP2 used in this study has 100 % number-detection efficiency on a single-particle basis when the rBC mass per particle is above ∼0.5 fg, which corresponds to an rBC mass equivalent diameter, DrBC, of ∼80 nm using a void-free material density of 1.8 g cm−3. For BC cores greater than the upper limit of detection of the SP2, the particles are detected while the rBC mass cannot be quantified due to the signal saturation from the analog-to-digital (A/D) converter. Therefore, the upper quantification limit (LOQ) is ∼200 fg rBC mass per particle, corresponding to an rBC mass equivalent core diameter (DrBC) of ∼600 nm. Note that the SP2 is also equipped with a narrow band incandescence detector (NB; 630–800 nm; Schwarz et al., 2006). However, we did not further use these signals as the upper LOQ was at similar BC core mass as for the broadband detectors and because two-color pyrometry is out of the scope of this paper.
As discussed by Pileci et al. (2020), there are a number of different methods for quantifying and correcting for the mass of BC outside the SP2 size detection limits (if the user decides to apply a correction at all). These methods are based on extrapolation of SP2-measured BC core mass size distributions. In this study we used the lognormal fit approach. Further, to better represent the upper portion of the size distributions where most of the missing mass appeared to lie (Fig. S5), we fitted lognormal functions separately to the lower (80<DrBC<300 nm) and upper portions (230<DrBC<600 nm) of the measured size distributions. The extrapolated portions of these two types of fits are displayed in Fig. S5 for each of the four main periods of the campaign (which are introduced and described in Sect. 3.1). From the extrapolated sections of the fitted curves we estimate the missing mass percentages below the lower LOQ were 1.1 %, 0.4 %, 1.6 %, and 0.8 % for periods 1, 2, 3, and the short plume case, respectively. The corresponding percentages for the missing mass above the upper LOQ were 1.3 %, 4.9 %, 4.0 %, and 26 %. Since these estimated percentages are low (less than 5 %, except for the small portion of the dataset represented by the short plume case), we chose not to apply correction factors to account for the BC mass potentially missed by the SP2. Some possible consequences of this decision are discussed in Sect. 3.3.
The recommended calibration of the incandescence channels with an aerosol particle mass analyzer (APM) is described elsewhere (Laborde et al., 2012a; Baumgardner et al., 2012; Moteki and Kondo, 2010). Briefly, an empirical calibration of the relationship between BC mass in a particle and resulting incandescence signal amplitude is required. Mass selected fullerene soot from Alfa Aesar (stock no. 40971, lot no. FS12S011) was shown to provide calibration curves that match the response of the SP2 to BC from diesel exhaust (Laborde et al., 2012a) and atmospheric BC (Moteki and Kondo, 2010). In this study we used a different batch of fullerene soot (Alfa Aesar; stock no. 40971, lot no. W08A039) for SP2 calibration. The SP2 response to this batch was later shown to be equal to that of the batch FS12S011, and therefore this calibration is in full agreement with the recommended approach. The reproducibility of rBC mass using this calibration approach is estimated to be better than ±10 % and to represent BC mass in atmospheric aerosols from different sources within ±20 %.
Particles passing the laser beam also elastically scatter laser light, which is detected by avalanche photodetectors (APDs). BC-free non-absorbing particles do not evaporate within the laser beam and remain unperturbed, and the scattering signal is determined by a standard APD. The amplitude of the scattering signal is proportional to the partial scattering cross section of the detected particle for the solid angle covered by the detector optics. From the measured scattering cross section the optical diameter of the particles (Dopt) is inferred using Mie theory (Bohren and Huffman, 1998, i.e., assuming spherical particle shape). The refractive index of the particles is assumed to be 1.50 + 0i, which typically provides optical size distributions that agree within 20 % with corresponding mobility size distributions, excepting some outlying cases when the total aerosol load was very low (Fig. S1). Unit detection efficiency for the standard optical sizing was achieved for optical diameters Dopt>∼150 nm and the upper LOQ, which is restricted by detector saturation, was at Dopt = 500 nm. Absolute calibration of the scattering cross section measurement was done using spherical polystyrene latex (PSL) size standards of 269 nm (Thermo Scientific) and calculation based on Mie theory with known scattering cross section.
The BC-containing particles are heated to above 4000 K due to BC core absorption, such that the non-refractory coating materials evaporate within the laser beam. Therefore, the measured scattering amplitude is not proportional to the scattering cross section of the unperturbed particle. However, the leading edge of the light scattering signal still contains information on the scattering cross section of the unperturbed particle. Interpretation of the leading edge signal is only possible if the laser intensity profile is known and if the time axis of the scattering signal can be related to the position of the particle in the laser beam. This is achieved with an additional position sensitive detector (PSD) introduced by Gao et al. (2007). Knowing the particle position in the laser beam makes it possible to infer the optical diameter of the unperturbed particle before evaporation onset in the leading edge of the laser beam, commonly referred to as leading-edge-only (LEO) method. Details on the LEO optical sizing approach can be found in previous studies (Gao et al., 2007; Laborde et al., 2012a; Taylor et al., 2015).
Accurate optical sizing with the LEO method requires several validations. A first one is to verify that the position-dependent laser intensity is correctly accounted for. This is done by comparing the LEO results from the scattering detector with the corresponding standard optical sizing for BC-free particles (see Fig. S2a for details). The LEO sizing can also be done with the PSD signal, in which case an adjustable factor is used to make the LEO results match the results of a normal scattering detector, as shown in Fig. S2b. This approach implicitly ties the PSD detector to the calibration of the normal scattering detector. We used the PSD detector instead of the normal scattering detector for the LEO sizing because the 10 % and 90 % percentiles are much narrower for the former, as shown in Fig. S2c and d.
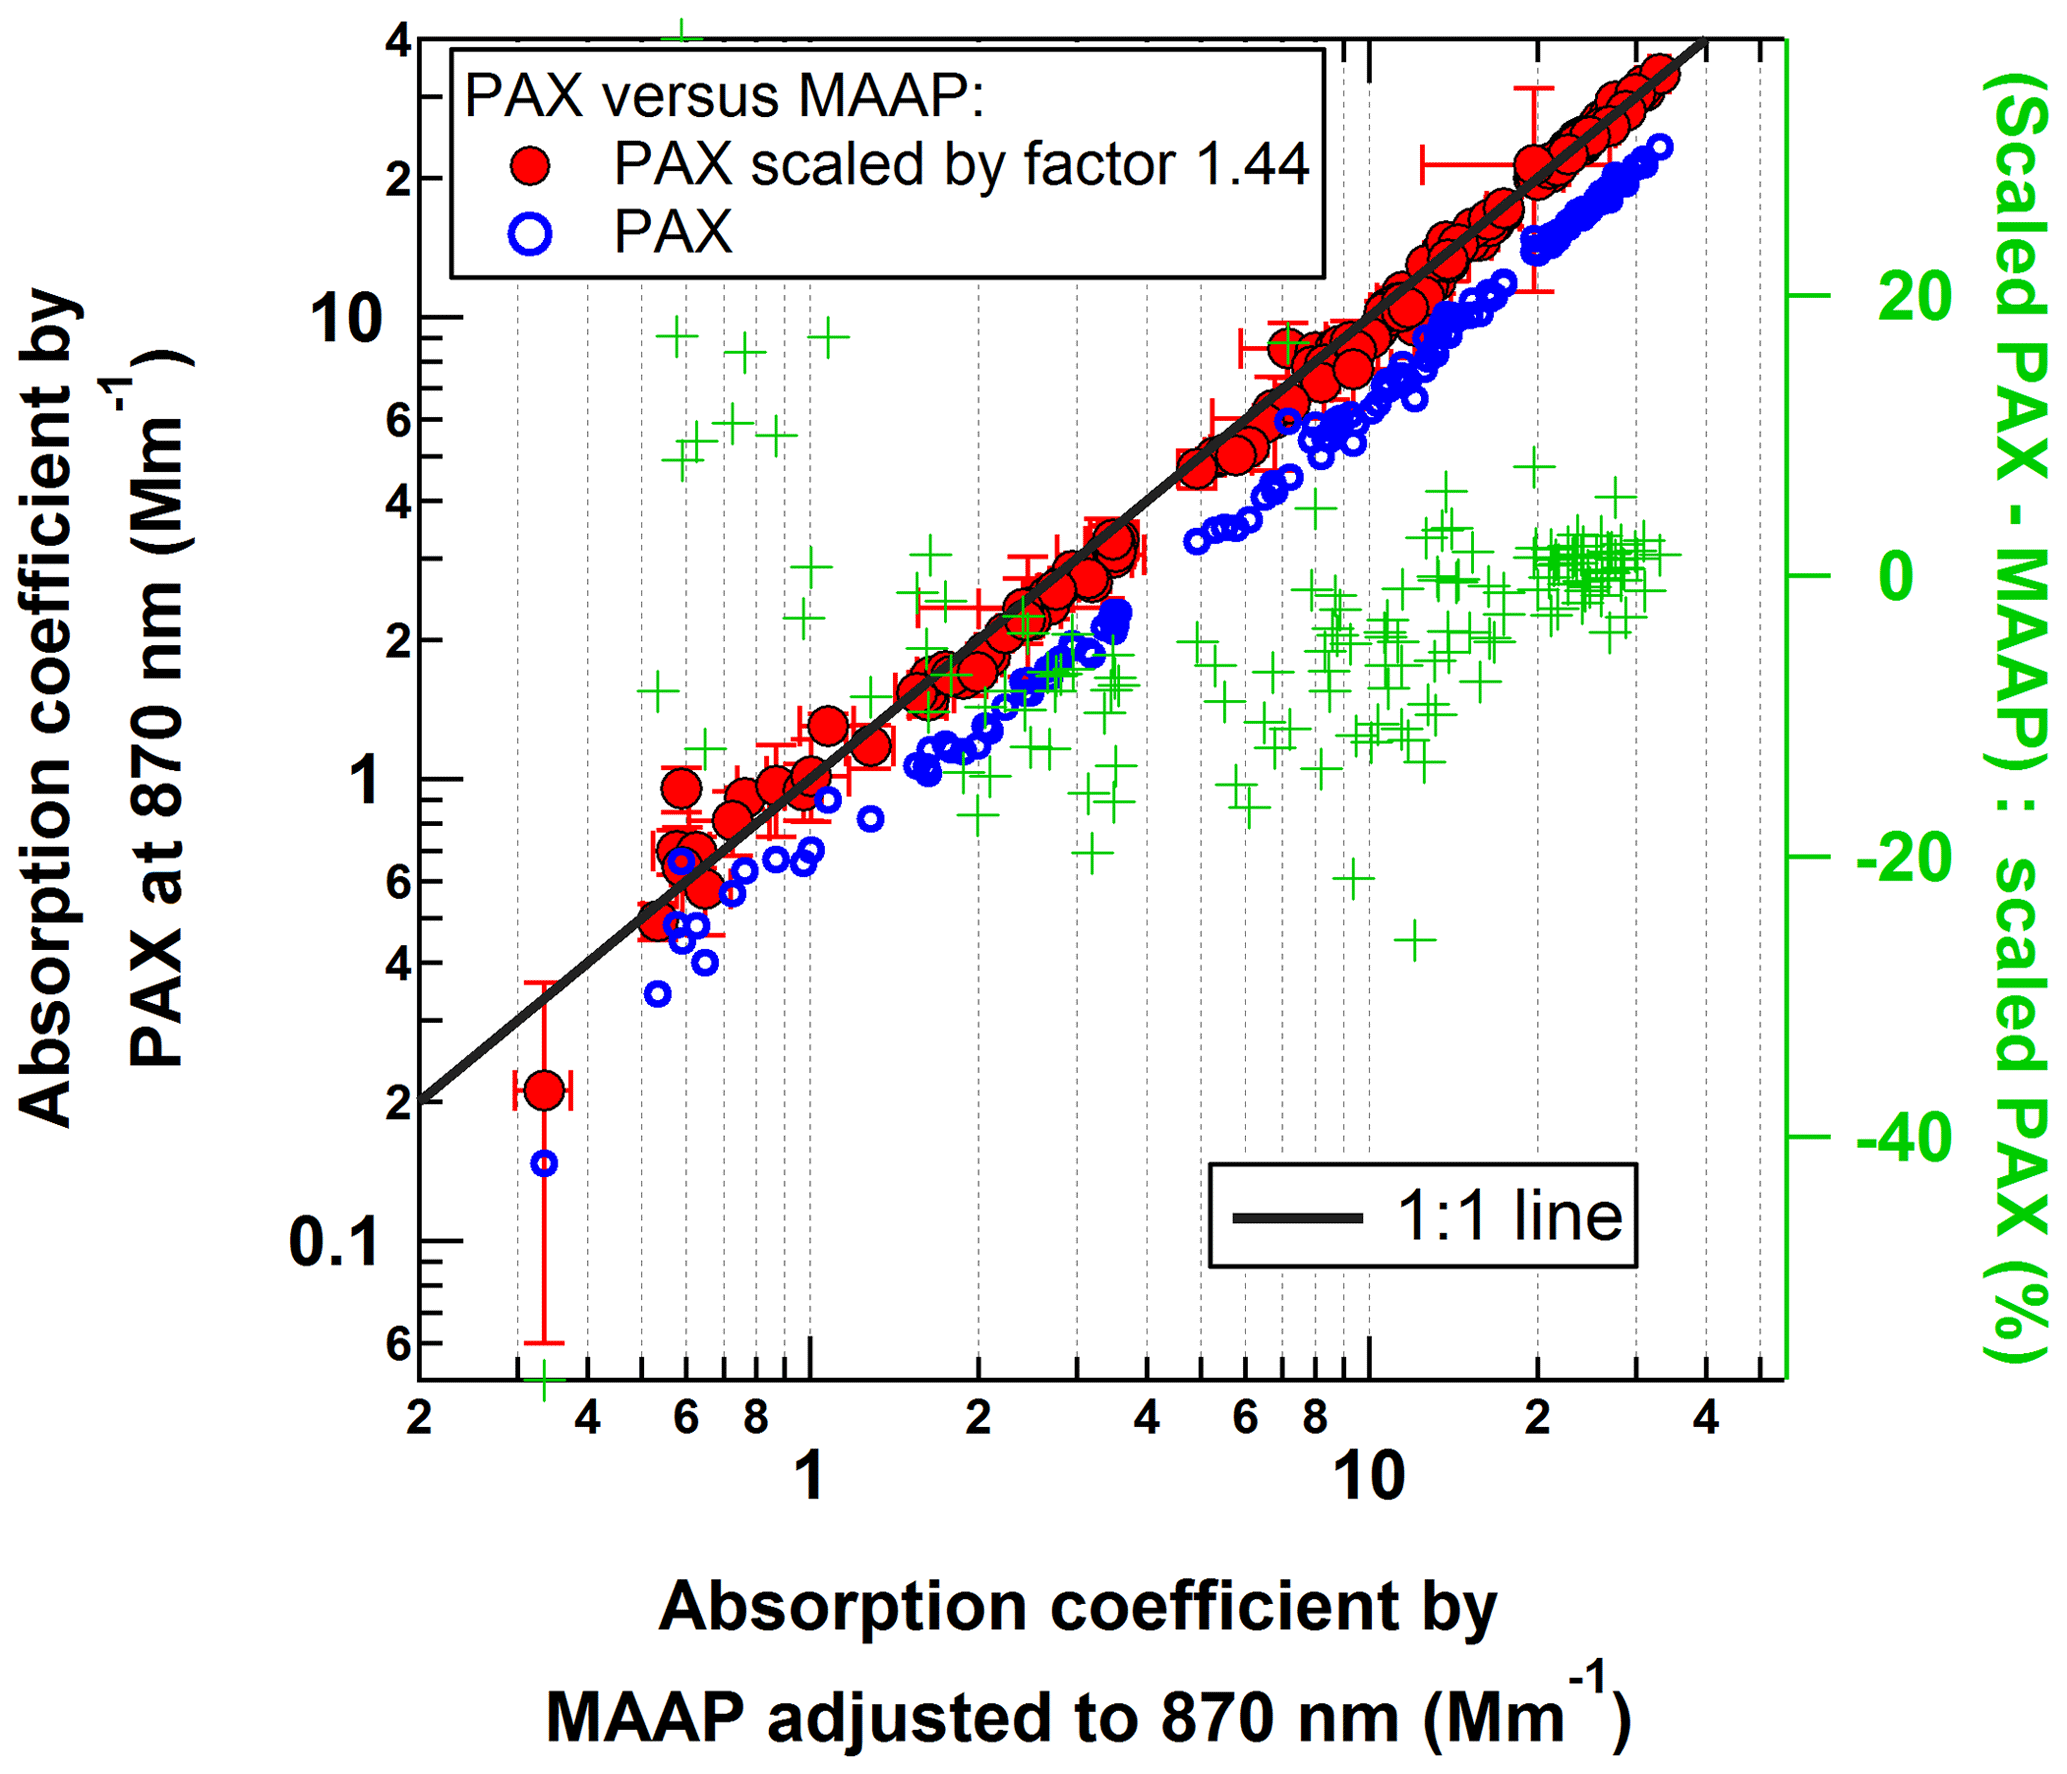
Figure 2Comparison of the absorption coefficients measured by the PAX and the MAAP. The MAAP data measured at 637 nm were adjusted to 870 nm using the spectral dependence of the absorption measured by the aethalometer. The PAX data measured at 870 nm are shown with the original calibration and after scaling by a factor 1.44 to match the MAAP data on average. The percentage difference between the scaled PAX and MAAP measurements is plotted on the right-hand y axis (green crosses).
The principle behind the LEO sizing can be applied to the time-resolved signal of the normal scattering signal at any position in the laser beam (Laborde et al., 2012a). The scattering signal of a BC-containing particle at incandescence onset represents that of the bare BC core, which makes it possible to infer its optical diameter (Dopt, BC). This is done by assuming spherical shape and a certain BC refractive index (RIBC). Figure S3 shows a comparison of the optical diameter of the BC core with the BC mass-equivalent diameter inferred from the incandescence signal. The refractive index of the bare BC core was chosen to be 1.75 + 0.43i, which made the two diameters match in this study. This value is lower than the value most commonly used for ambient soot in other studies with SP2 measurement at various sites (RIBC = 2.26 + 1.26i; Moteki et al., 2010; Laborde et al., 2012b, 2013; Zanatta et al., 2018; Dahlkötter et al., 2014). The reason for achieving the BC diameter match with a lower than usual refractive index is not known, nor should this approach be interpreted as an accurate refractive index measurement. However, choosing it in this manner ensures bias-free measurements of the coating thickness of bare BC particles (i.e., this choice results in coating thickness histograms for bare BC particles that are centered around 0 nm).
The optical size of the individual BC-containing particle (Dtotal) can be inferred from the combination of Mie model calculation, the measured scattering signal of the entire particle and the core diameter (DrBC) (Taylor et al., 2015; Schwarz et al., 2008). Briefly, based on a concentric core-shell configuration, the Mie model is able to calculate the scattering cross section of the BC core with the input of DrBC and RIBC. Then Dtotal can be inferred by the Mie model with the input of the refractive index of the coating (RIcoat) with scattering by coating (difference between measured scatter signal of entire particle and Mie calculated BC core scattering signal). The particle-scattering cross sections with fixed DrBC, Dtotal, RIBC and RIcoat inputs by the Mie model are stored in a series of 2-D lookup tables for data analysis in the PSI SP2 toolkit run with Igor Pro (Wavemetrics, OR, USA). Finally, the coating thickness (Tcoat) can be calculated with the reconstructed Dtotal and DrBC:
The coating thickness is more sensitive to RIcore than RIcoat, which is consistent with previous sensitivity evaluation (Taylor et al., 2015). The precision of the coating thickness retrieved by the LEO method was estimated to be about ±20 % (Laborde et al., 2012b) for DrBC ranging from 150 to 400 nm.
2.4.2 Absorption measurements
Instruments
A MAAP (Thermo Fisher Scientific, MA, USA; Petzold and Schönlinner, 2004) was used to measure the aerosol absorption coefficient at 637 nm. The MAAP measures both the light radiation transmitted and backscattered from a particle-loaded fiber filter and determines the fraction of light absorption by absorbing aerosol components via a radiative transfer program. To minimize the interference by the light-scattering aerosol components on the angular distribution of the backscattered radiation, the measurements are performed with three detectors at different angles. For the data analysis in this study, a factor of 1.05 has been applied for the required wavelength correction (from 660 to 637 nm) according to Müller et al. (2011).
A PAX (Droplet Measurement Technologies, CO, USA) was used to measure the aerosol absorption coefficient at 870 nm, which minimizes interference from light-absorbing particulate matter other than BC, such as brown carbon or dust. It applies photo-acoustic spectroscopy, which is described in detail in Arnott et al. (1999). Photo-acoustic spectroscopy has been widely used in recent years as it is an in situ measurement without perturbing particle morphology (Lack et al., 2006). The PAX was calibrated following the manufacturer instructions. However, the precision of these calibrations was insufficient and the absorption coefficients measured with application of these calibration coefficients were inconsistent with the results from the MAAP, as further discussed below (Müller et al., 2011).
An Aethalometer (Model AE33, Magee Scientific, CA, USA; Hansen et al., 1984) was also used to measure the aerosol absorption coefficients at seven wavelengths (370, 470, 520, 590, 660, 880 and 950 nm). The AE33 is also a filter-based instrument, with associated limitations in quantifying the absorption coefficient absolutely. However, in this study we only applied the AE33 to infer the relative spectral dependence of light absorption. For this purpose we used the default instrument output, which includes a loading compensation and a correction for the effects of multiple scattering within the filter matrix (Drinovec et al., 2015). Note that the absolute value of the multiple-scattering correction is irrelevant for our purpose, except for the fact that it is assumed to be independent of wavelength.
The spectral dependence of the aerosol absorption coefficient, bap, often follows a power law in good approximation. The exponent AAE is commonly referred to as the absorption Ångström exponent. In this study we use absorption coefficients measured by the AE33 at two different wavelengths (λ1 and λ2) to infer the AAE using the following equation (Moosmüller et al., 2011):
BC absorbs light broadly from near-UV to near-infrared wavelengths and thus has a weak spectral dependence (AAE ≈1; van de Hulst, 1957). By contrast, light-absorbing organics (Corbin et al., 2019), can exhibit substantial light absorption at near-UV and blue wavelengths while being negligible at red to near-infrared wavelengths, which normally results in AAE larger than 1.
Typical AAE values for traffic emissions are close to unity since BC is the only light-absorbing component. However, AAE values are significantly larger than unity in biomass burning emissions due to co-emission of BC and brown carbon. The difference of the two branches of AAE values can be used for source apportionment via an “AAE model” (Zotter et al., 2017; Liu et al., 2014; Elser et al., 2016). Note that the application of the model is only precise under favorable conditions, in which traffic and biomass burning are the only sources.
Absorption coefficient
The absorption coefficient was quantified with a combination of PAX, MAAP and AE33 data. The absorption coefficient measured by the MAAP at λ=637 nm was adjusted to λ=870 nm, using the 3 h averaged AAE data obtained from the AE33.
The correlation between wavelength-adjusted MAAP data and PAX data is excellent in the range above ∼1 Mm−1 (Fig. 2). However, the measurements are systematically biased lower than the measurements by 31 %, which is most likely a result of imprecise and hence inaccurate PAX calibration (as discussed above). The MAAP demonstrated good accuracy in several intercomparison studies, and it has been shown to have a low instrument-to-instrument variability of less than 5 % (Müller et al., 2011). Therefore, we decided to scale the PAX data by a constant scaling factor of to match , as shown in Fig. 2. Application of this constant scaling factor brings the scaled PAX and MAAP measurements into good agreement at absorption coefficients greater than ∼15 Mm−1, while the scaled PAX measurements are up to 10 % lower than the corresponding MAAP measurements in the range down to 1 Mm−1 (as shown by the green crosses in Fig. 2). The scaled PAX data provide absorption coefficients with high time resolution and for both ambient and denuded inlets, with absolute calibration referenced to the MAAP.
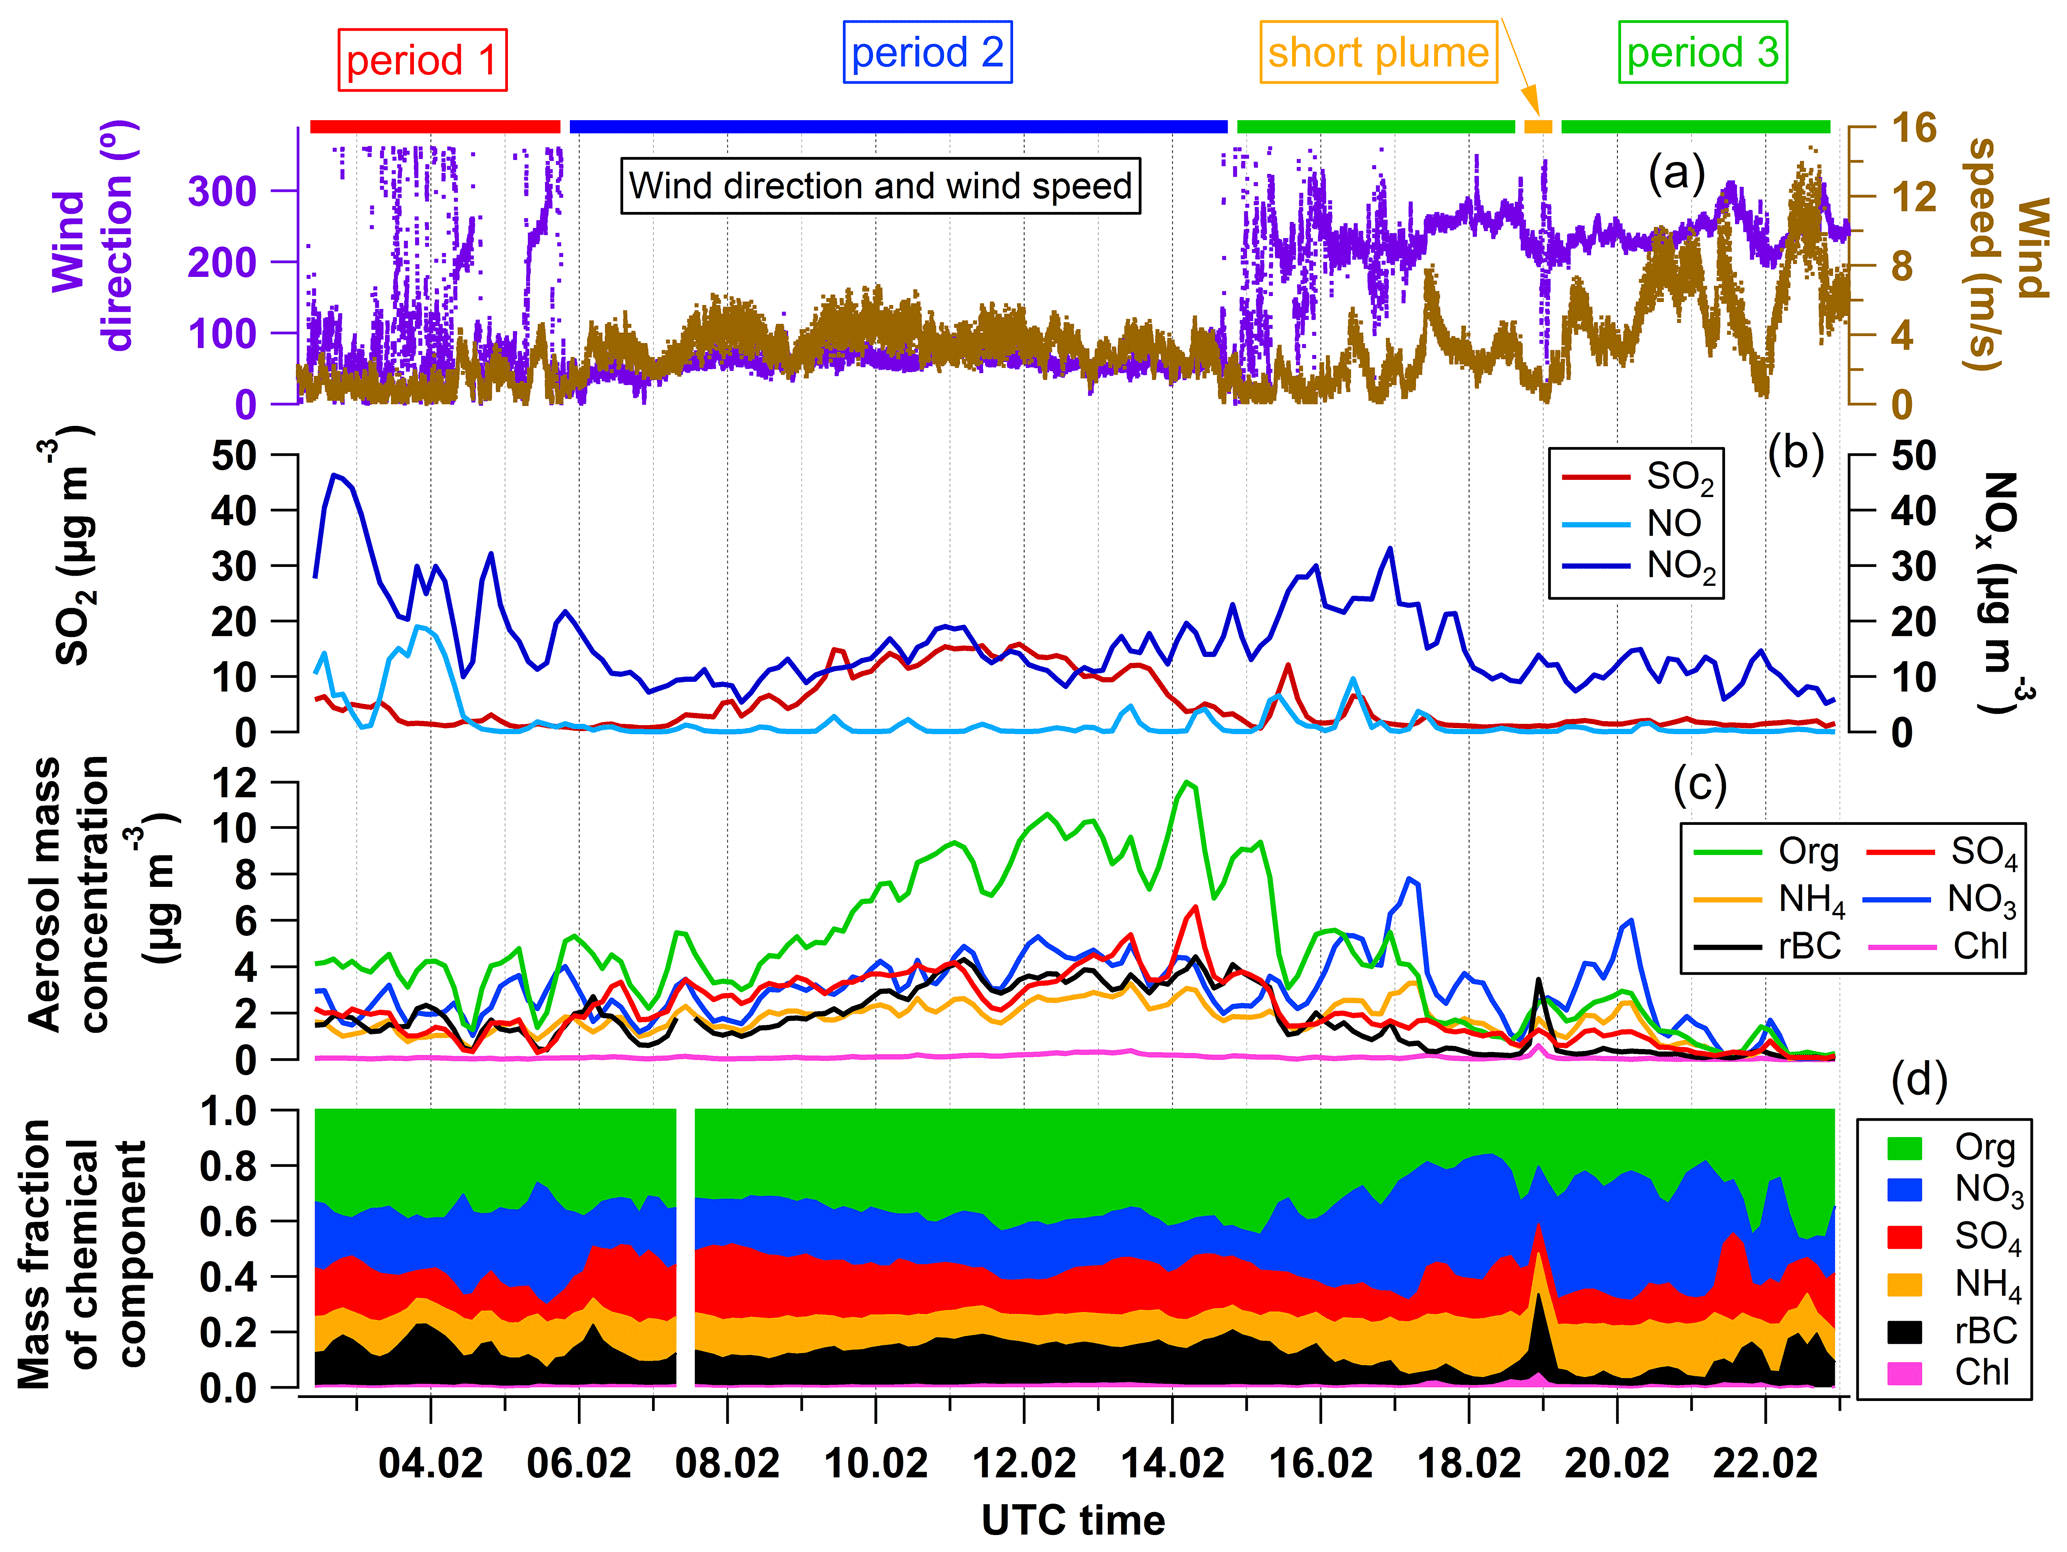
Figure 3Time series of (a) wind direction and wind speed at 10 min time resolution measured 6 m above ground; (b) concentrations of gas-phase species SO2, NO, and NO2 at 3 h time resolution; (c) mass concentrations of aerosol-phase chemical components measured by the ACSM and the SP2 at 3 h time resolution; and (d) relative mass fractions of the measured aerosol chemical components.
2.4.3 The catalytic stripper (CS)
The basic principle and inner structure of the catalytic stripper (CS; Catalytic Instruments; Model CS015) have been described in Amanatidis et al. (2013). The residence time of the CS used in this study was approximately 0.35 s, with a flow rate of 1.5 L min−1, and the temperature was set to 350 ∘C. As shown in Fig. S5, the denuding process by the catalytic stripper did not influence the shape of the rBC core size distribution in the range ∼60 to 600 nm. The fractional loss of rBC mass was up to 20 % for DrBC below 300 nm. The losses likely introduced only negligible bias in the MACBC values since the absorption measurement by the PAX was also behind the CS. The median coating thickness was 58 and 32 nm before and after denuding, respectively, indicating that the CS did not remove the coating completely. Denuding could potentially cause some compaction of the BC cores. However, the denuded sample data were only used to determine the MACBC of the bare BC cores – more precisely an upper limit of it due to residual coating – and hence such denuding does not significantly affect the interpretation of our results.
3.1 Periods with distinct air mass origin
The time series of wind direction and wind speed, as well as chemical information, are shown in Fig. 3. Three distinct periods and a short plume case were identified based on these data and on air mass back trajectory analyses (Fig. 4; calculated for an air mass arrival altitude of 100 m). The exact time windows and characteristics of the different periods are summarized in Table S1. In period 1 (2 February 2017 09:00 to 5 February 2017 21:00 UTC), the local wind speed at Melpitz was low (median: 1.2 m s−1; interquartile range, IQR: 0.8 to 1.7 m s−1) and the local wind direction at the site varied frequently. Back trajectory analysis showed that most of the air masses came from south to southwest (S to SW) of the sampling site, passing through the high Alps region. The local wind directions were generally not consistent with the air mass origin sector according to the back trajectory analysis. However, given the low and variable local winds during this time period, the back trajectory result is more relevant for interpreting the aerosol- and gas-phase composition. The gas-phase mixing ratios were usually strongly dominated by NOx (except for period 2; see Table S1). The median SO2 to NOx ratio was 0.08 (IQR: 0.05–0.11). Similarly, the aerosol properties were comparable among the periods except for period 2. For period 1, the median value of the total aerosol mass concentration from the integrated ACSM data (non-BC) and the SP2 (BC) was 10.6 µg m−3 (IQR: 8.7–11.7; Table S1), the mass ratio of particulate inorganics to organics was 1.45 (IQR: 1.22–1.55), and the sulfate to nitrate mass ratio was 0.60 (IQR: 0.39–0.71). Note, these mass concentrations approximately correspond to PM1 composition due to the intrinsic upper detection limits of the ACSM and SP2. The aerosol composition measured in this study is consistent with previous observations from Melpitz and indicate that NOx-rich vehicle emissions were a dominant source of pollution in these air masses (Spindler et al., 2013).

Figure 4Map of air mass back trajectories: 96 h air mass back trajectories terminating at Melpitz site (yellow star) at an altitude of 100 m for every hour of the campaign. Trajectories terminating at altitudes of 10 and 500 m were similar to those shown here. The map is based on the HYSPLIT atmospheric transport and dispersion modeling system provided by Air Resources Laboratory (ARL) (Stein et al., 2015).
In period 2 (5 February 2017 21:00 to 14 February 2017 22:00 UTC), the local wind speed at the site (median: 3.4; IQR: 2.7–4.1 m s−1) was higher than that of period 1 with constant local wind direction from the northeast to southeast (Fig. 3a). Back trajectory analysis indicated that the air masses arriving at the site had traveled from northeastern, eastern and southeastern Europe (Fig. 4), consistent with the local wind directions. In the gas phase, the most striking feature of the measurements is that SO2 was present at significantly higher levels than in the other periods, with a median concentration of 9.2 (IQR 3.2–13.2) µg m−3 (Fig. 3b). The SO2 to NOx ratio was also much higher with a median value of 0.63 (IQR 0.28–0.83). The PM1 aerosol mass concentration from integrated ACSM (non-BC) and SP2 (BC) also showed the highest levels observed during the whole campaign period, with a median mass concentration of 23.0 (IQR 20.4–27.2) µg m−3 (Table. S1), which was almost twice as high compared to the other periods. Despite the higher concentrations of chemical components (Fig. 3c), the relative composition of organic and total inorganic components (Fig. 3d) was similar to that of period 1 and remained relatively stable within period 2. However, within the inorganic fraction, the sulfate to nitrate mass ratio was remarkably high, with a median value of 1.1 (0.9–1.2) during this period. The source of sulfur leading to the high concentrations of SO2 and sulfate in period 2 was likely residential and industrial solid fuel burning in eastern and southeastern Europe, where coal with a high sulfur content is still used as a fuel source. For example, Poland, located 150 km east of the Melpitz site, has the highest SO2 emissions among EU countries (Glasius et al., 2018). Previous studies have shown that combustion of coal and biomass (wood) are significant sources of carbonaceous aerosols in Poland in winter (Spindler et al., 2013; Ciarelli et al., 2017; Glasius et al., 2018).
In period 3 (14 February 2017 22:00 to 23 February 2017 00:00 UTC), the local wind at the site was dominated by westerly winds with generally higher and more variable wind speeds (median: 4 m s−1: IQR: 2.5–6.3 m s−1) than those of period 1 and 2. The majority of the back trajectories originate from western Europe (Fig. 4), consistent with local wind direction. In the particle phase, total aerosol mass concentrations decreased steadily throughout period 3 to the lowest values observed during the whole campaign. The median total aerosol mass concentration was 10.9 µg m−3 (IQR: 8.1–15.8) during the period (Table S1). Among the aerosol components, substantially higher mass fractions of nitrate (35 %, 25 %–41 %) were found compared to the other periods, while rBC mass concentrations (0.6, 0.3–1.4 µg m−3) and rBC mass fractions (7 %, 4 %–11 %) reached their lowest levels for the whole campaign (Fig. 3c and d, Table S1). Organic mass fractions were less than 30 % (Table S1), lower than the fractions observed in periods 1 and 2.
A short plume of BC aerosol passed over the sampling site between 18 February 17:00 and 19 February 07:00 UTC. Given the stagnant air conditions and low wind speed during this period, this plume likely resulted from a local emission. As shown in Fig. 3c, the 3-hourly averaged rBC mass concentration peaked at ∼4 µg m−3 during this event, which was the highest value reached during the campaign. The organic aerosol concentration was stable during the event (2.3, 2.1–2.5 µg m−3), which suggests that the plume did not come from a forest fire or biomass burning event since such events would emit large amounts of organics. A coal burning source for the plume is also not evident since the SO2 did not increase as shown in Fig. 3b. The fact that the AAE470, 950 dropped to around 1.0 during the period within the absorbing aerosol plume may indicate fresh emissions from a combustion engine as BC source. In addition, the observed much larger BC core diameters (above 300 nm, Fig. 5b) in the plume compared to the other periods likely indicated a super-polluter. Very dirty trucks or cars are known to produce larger BC particles than typical engines do (Schneider et al., 2015); however, the persistence of the plume rather indicates a nearby stationary rather than multiple mobile sources. In summary, the short plume seems to have resulted from a local event, but the exact source is not apparent.
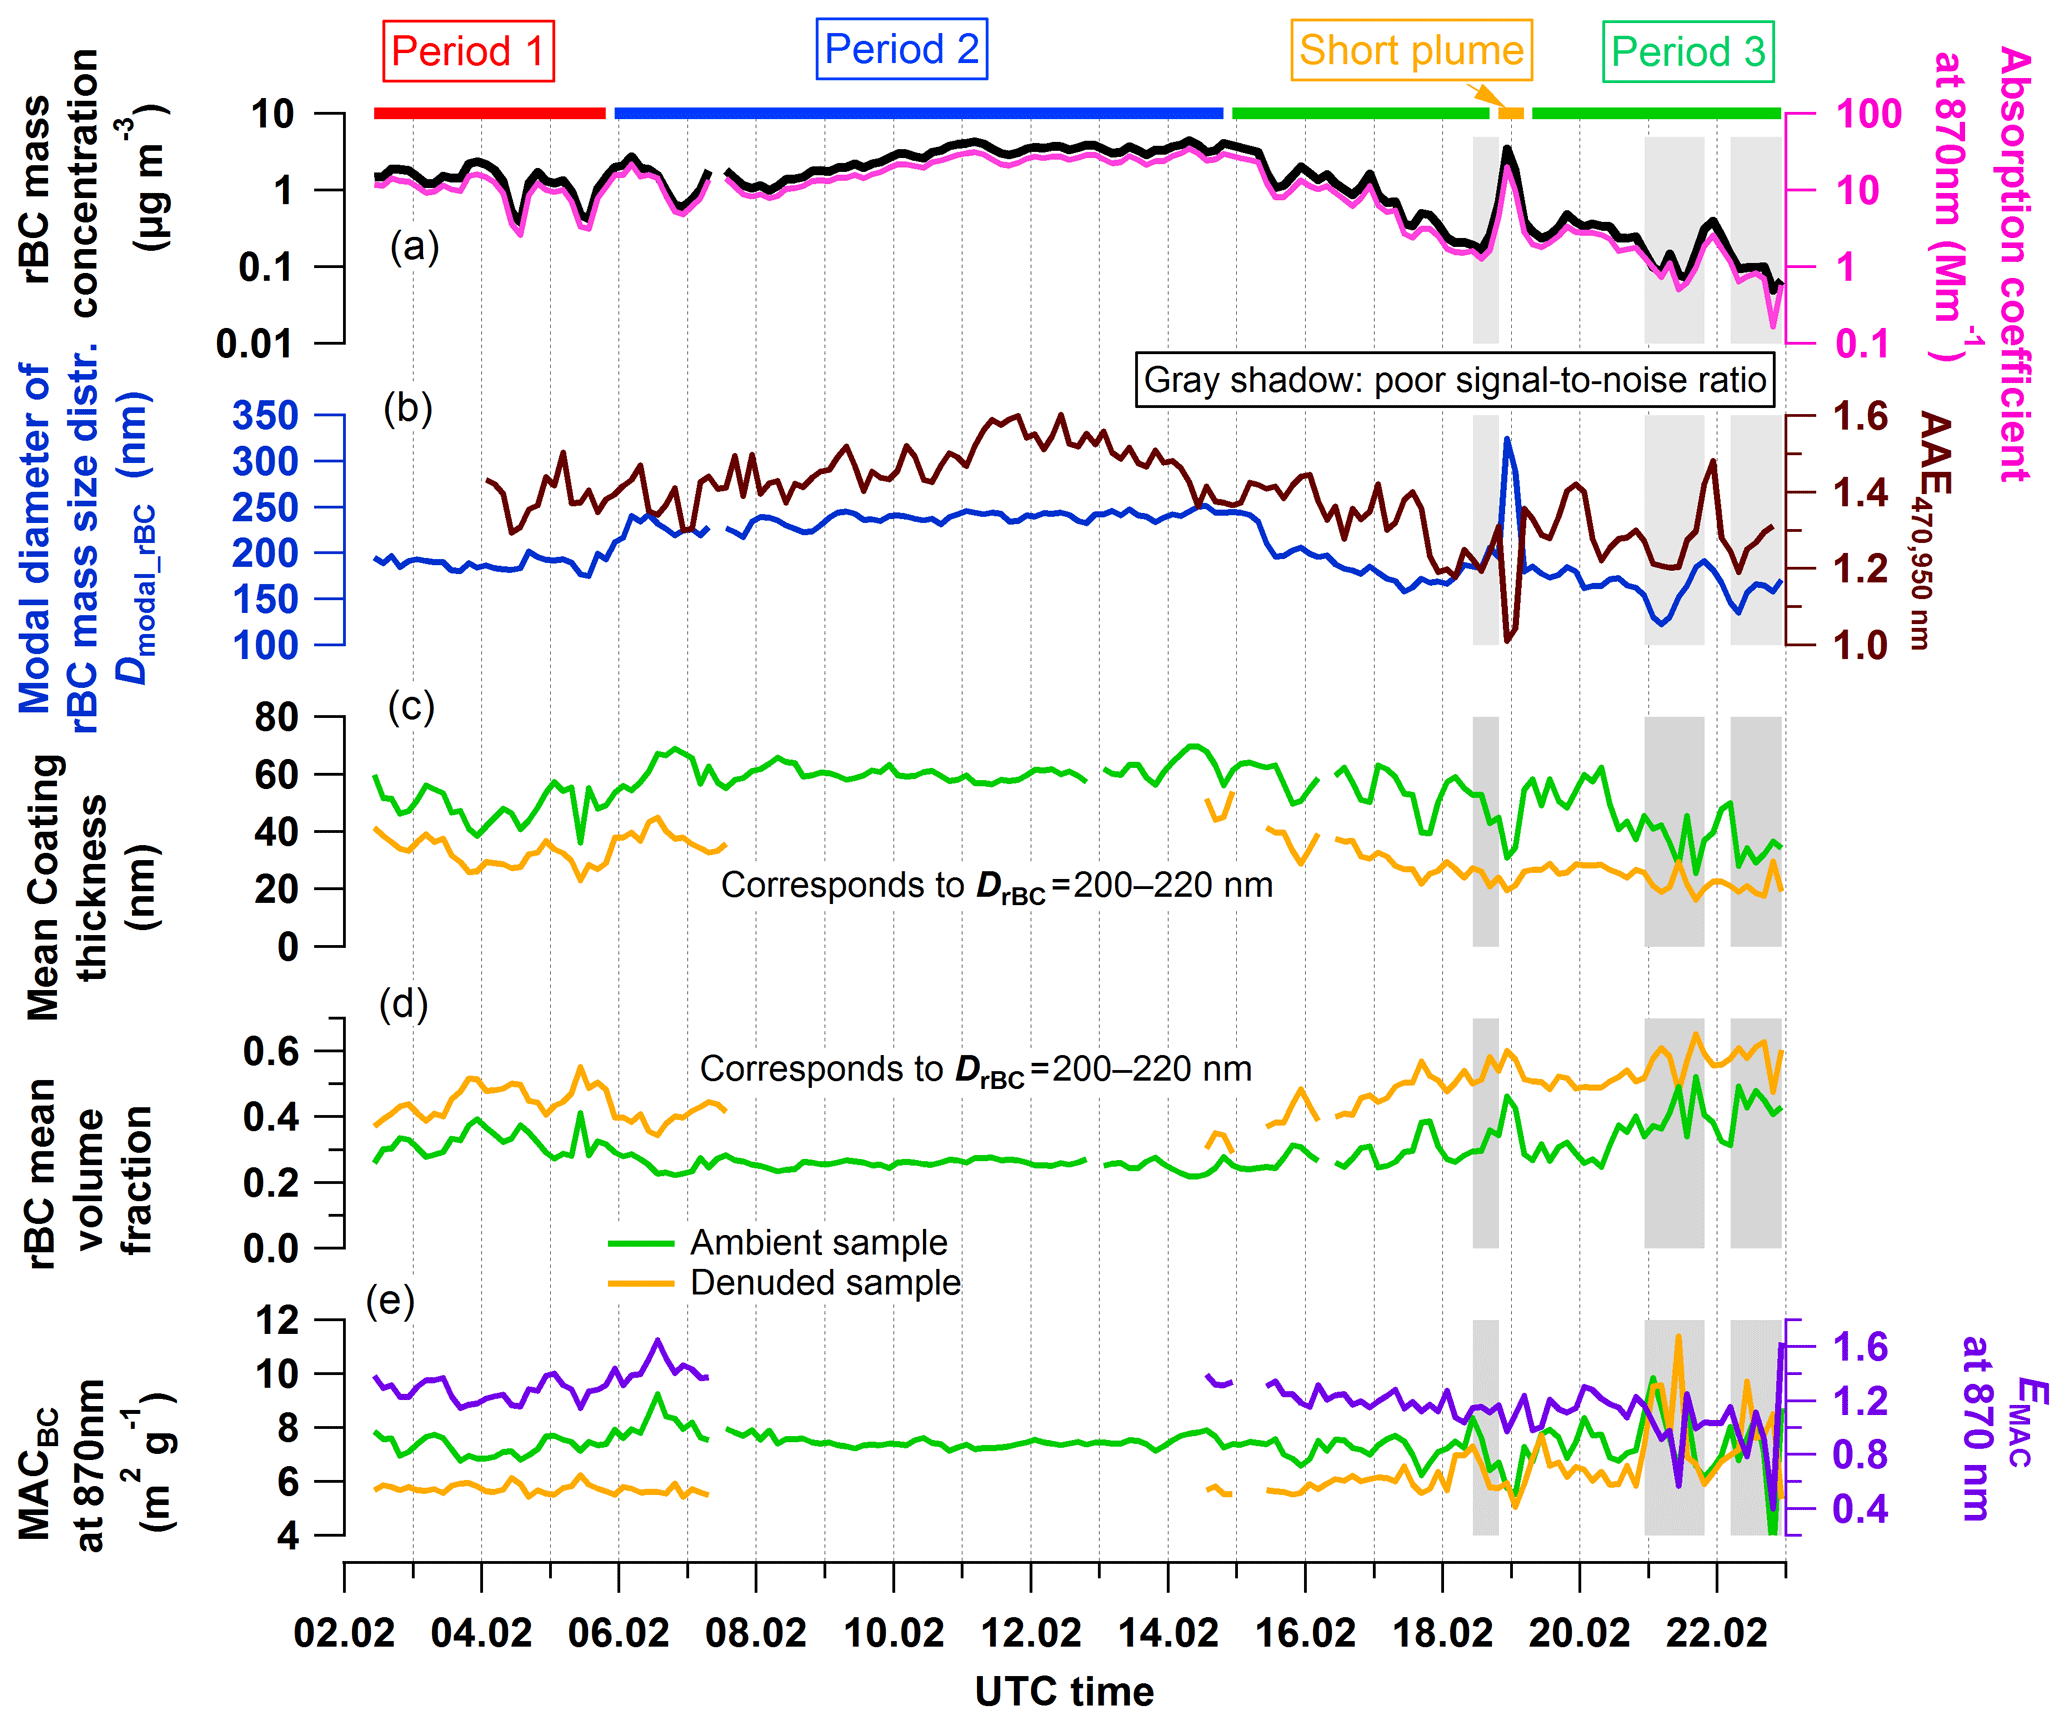
Figure 5Time series of the physical and optical parameters of BC in the dried aerosol sample at 3 h time resolution: (a) ambient rBC mass concentration measured by SP2 (left axis) and absorption coefficient of bulk aerosol measured by PAX at 870 nm (right axis); (b) model BC core diameter of rBC mass size distributions determined with lognormal fits shown in Fig. S6 (left axis) and AAE470, 950 (right axis); (c) mean thickness of non-BC coatings on ambient and denuded rBC cores with mass-equivalent diameters in the range 200 to 220 nm, calculated from single-particle data; (d) mean rBC volume fractions for ambient and denuded rBC particles calculated from the coating thickness data shown in (c); (e) mean MACBC of ambient and denuded samples (left axis) and corresponding EMAC calculated with Eq. (4) (right axis). The gap in the denuded time series in (c) and (d) (and corresponding gap in the EMAC time series in e) from 6 to 14 February is due to malfunction of the valve-switching system. The time periods when rBC mass was less than 0.2 µg m−3 are marked with gray shading due to poor signal-to-noise ratio.
3.2 Physical and optical properties of BC
Time series of the physical and optical properties of BC in the essentially water-free aerosol sample as present after drying to low RH are shown in Fig. 5. The BC mass concentration and absorption coefficient measurements were highly uncertain during periods of low aerosol loading (gray-shaded periods occurring at the end of the campaign) due to the SP2 data acquisition settings (the SP2 was set to save data from only 1 out of every 200 particles) and instrumental limits (the manufacturer-reported sensitivity of the PAX is <1 Mm−1 at 60 s averaging time, which is consistent with instrument performance demonstrated in Fig. 2). Therefore, based on these considerations, a criterion of rBC mass concentrations <0.2 µg m−3 was used to filter out data from further statistical analysis.
The ambient rBC mass concentration ranged between 1.00 and 3.03 µg m−3 (IQR) throughout the whole campaign, but with systematic differences between the distinct campaign periods. Overall, the rBC mass concentration was higher in air masses from eastern Europe, consistent with previous observations at Melpitz in winter (Spindler et al., 2013). Specifically, the rBC mass concentration ranged from 1.79 to 3.48 µg m−3 during period 2, increasing from ∼0.5 to 4 µg m−3 over the first 4 d of the period and then maintaining a relatively stable level at around 3.5 µg m−3. In contrast, the rBC mass concentrations only ranged from 1.21 to 1.73 µg m−1 during period 1 with air masses from southern and southwestern Europe (Fig. 4). In period 3, the rBC mass concentration varied from 0.60 to 2.19 µg m−3. At the beginning of this period, the rBC mass concentration decreased rapidly from ∼4 to 1 µg m−1 in a single day, as a result of the rapid switching of air arriving from eastern to western Europe. Following this sharp change, the rBC mass concentration was generally less than 1 µg m−3 for the remainder of the period, which was likely the result of stronger dilution of emissions due to higher wind speeds and possibly also lower emissions in western Europe compared to eastern Europe.
The modal diameter of rBC mass equivalent diameter, calculated as the geometric mean of three-hourly averaged lognormal rBC mass size distributions (Dmodal_rBC), is shown in Fig. 5b. Dmodal_rBC ranged from 186 to 240 nm throughout the whole campaign, which is a typical level for aged BC particles in continental remote or urban areas. For example, previous studies have observed Dmodal_rBC values of ∼240 nm in the European Arctic region (Zanatta et al., 2018), ∼200 nm in continental air masses from eastern Europe measured in Paris (Laborde et al., 2013), and ∼210–220 nm in Asian outflow measured at a remote site in Japan (Ueda et al., 2016). During this campaign, systematically larger median Dmodal_rBC values were measured in period 2 (239 nm) than in periods 1 (190 nm) and 3 (181 nm). The larger BC particles measured in period 2 might be related to coal burning emissions (e.g., lignite coal burning in Poland); while the burning of hard coal briquette emits particles that lie mostly in the nuclei and Aitken mode (20–100 nm), the number size distribution of lignite emissions peaks in the accumulation mode (100–1000 nm) (Bond et al., 2002). Therefore, it is possible that BC cores from lignite burning are larger than BC from other common sources such as traffic. Wood burning emissions from domestic heating are also expected to generate larger BC cores than those emitted by traffic and thus could also be partly responsible for the generally larger BC cores observed during period 2. During the short and distinct plume, Dmodal_rBC ranged from 192 to 298 nm, substantially larger than the values measured in remote background air, which supports the interpretation that the plume resulted from local emissions.
3.3 BC mixing state, MACBC and the lensing effect
The ambient MACBC at 870 nm ranged from 7.2 to 7.9 m2 g−1 during the whole campaign, with a geometric mean value of 7.4 m2 g−1. These values are slightly higher than the MACBC values calculated over three winter seasons in Melpitz and reported by Zanatta et al. (2016). These authors applied a MAAP and thermal-optical elemental carbon mass measurements, and reported a MACBC at 637 nm of 8.2 m2 g−1. This value corresponds to a MACBC at 870 nm value of 5.3 to 5.7 m2 g−1, assuming AAE637, 870 values of 1.2 and 1.4, respectively. Nordmann et al. (2013) previously reported 7.4 m2 g−1 for MACBC at 637 nm based on a week-long measurement combining MAAP and Raman spectroscopy, which is 10 % lower than the value from Zanatta et al. (2016). The discrepancies between the values measured in this study and those reported by Zanatta et al. (2016) and Nordmann et al. (2013) could be related to the fact that the studies were conducted over different time periods, or they might be due to the different techniques that were used to measure the BC mass concentration in each study. Pileci et al. (2020) showed from multiple field campaigns that co-located rBC and EC concentrations measurements can differ by as much as ∼50 % in European background air. Given this fact, the agreement between the MACBC values reported in this study and those previously reported is well within expectations.
The degree of internal mixing, expressed as the thickness of non-BC material coating the BC cores (“coating thickness”), was measured by the SP2 as described in Sect. 2.4.1. The modal diameters of the BC core mass distribution (Dmodal_rBC) were around 200–220 nm mass equivalent diameter during the campaign (Fig. 5b). Fortunately, these modal diameters were in the range of diameters for which the LEO-fit analysis described in Sect. 2.4.1 could be successfully applied to all types of internally mixed BC particles (i.e., all types of BC particles ranging from uncoated to thickly coated particles). Therefore, to obtain a representative indicator of BC internal mixing state that is applicable to the mode of the BC mass size distributions, coating thicknesses are presented here for BC cores with diameters between 200–220 nm. For simplicity we hereafter refer to this parameter as “coating thickness” without specifying the range of BC core diameters over which it has been calculated. The mean coating thickness at 3 h time resolution (Fig. 5c) was calculated from single-particle data as shown in Fig. S7. The coating thickness for ambient particles ranged from 51 to 61 nm (IQR) over the whole campaign, which corresponds to rBC volume fractions between 25 % and 30 % (Fig. 5d).
It is apparent from the time series in Fig. 5c and e that the ambient MACBC and BC coating thickness correlated well. These two properties of the dried aerosol are plotted as a scatter plot in Fig. 6a, indicating that ambient MACBC and coating thickness were positively correlated with a Pearson correlation coefficient of 0.73. This provides evidence that there was indeed a lensing effect during the campaign and that the BC mixing state was the main driver of MACBC variability. We hereafter refer to this method of directly evaluating the dependence of MACBC on the internal mixing state as the correlation method. To investigate the robustness of the results of the correlation method, Fig. S10 displays versions of Fig. 6a with different scaling factors applied to the underlying quantities used to calculate MACBC. In particular, we investigated the effect of applying a loading-dependent scaling factor to PAX data in Fig. S10b (as motivated by Fig. 2 and the discussion in Sect. 2.4.2), as well as the effect of applying separate missing rBC mass correction factors for each time period of the campaign in Fig. S10c (as discussed in Sect. 2.4.1 ). In these cases (as well as the case when both types of scaling factors are applied, Fig. S10d), the positive correlation between MACBC and the mean coating thickness remains, supporting the evidence for an observed lensing effect.
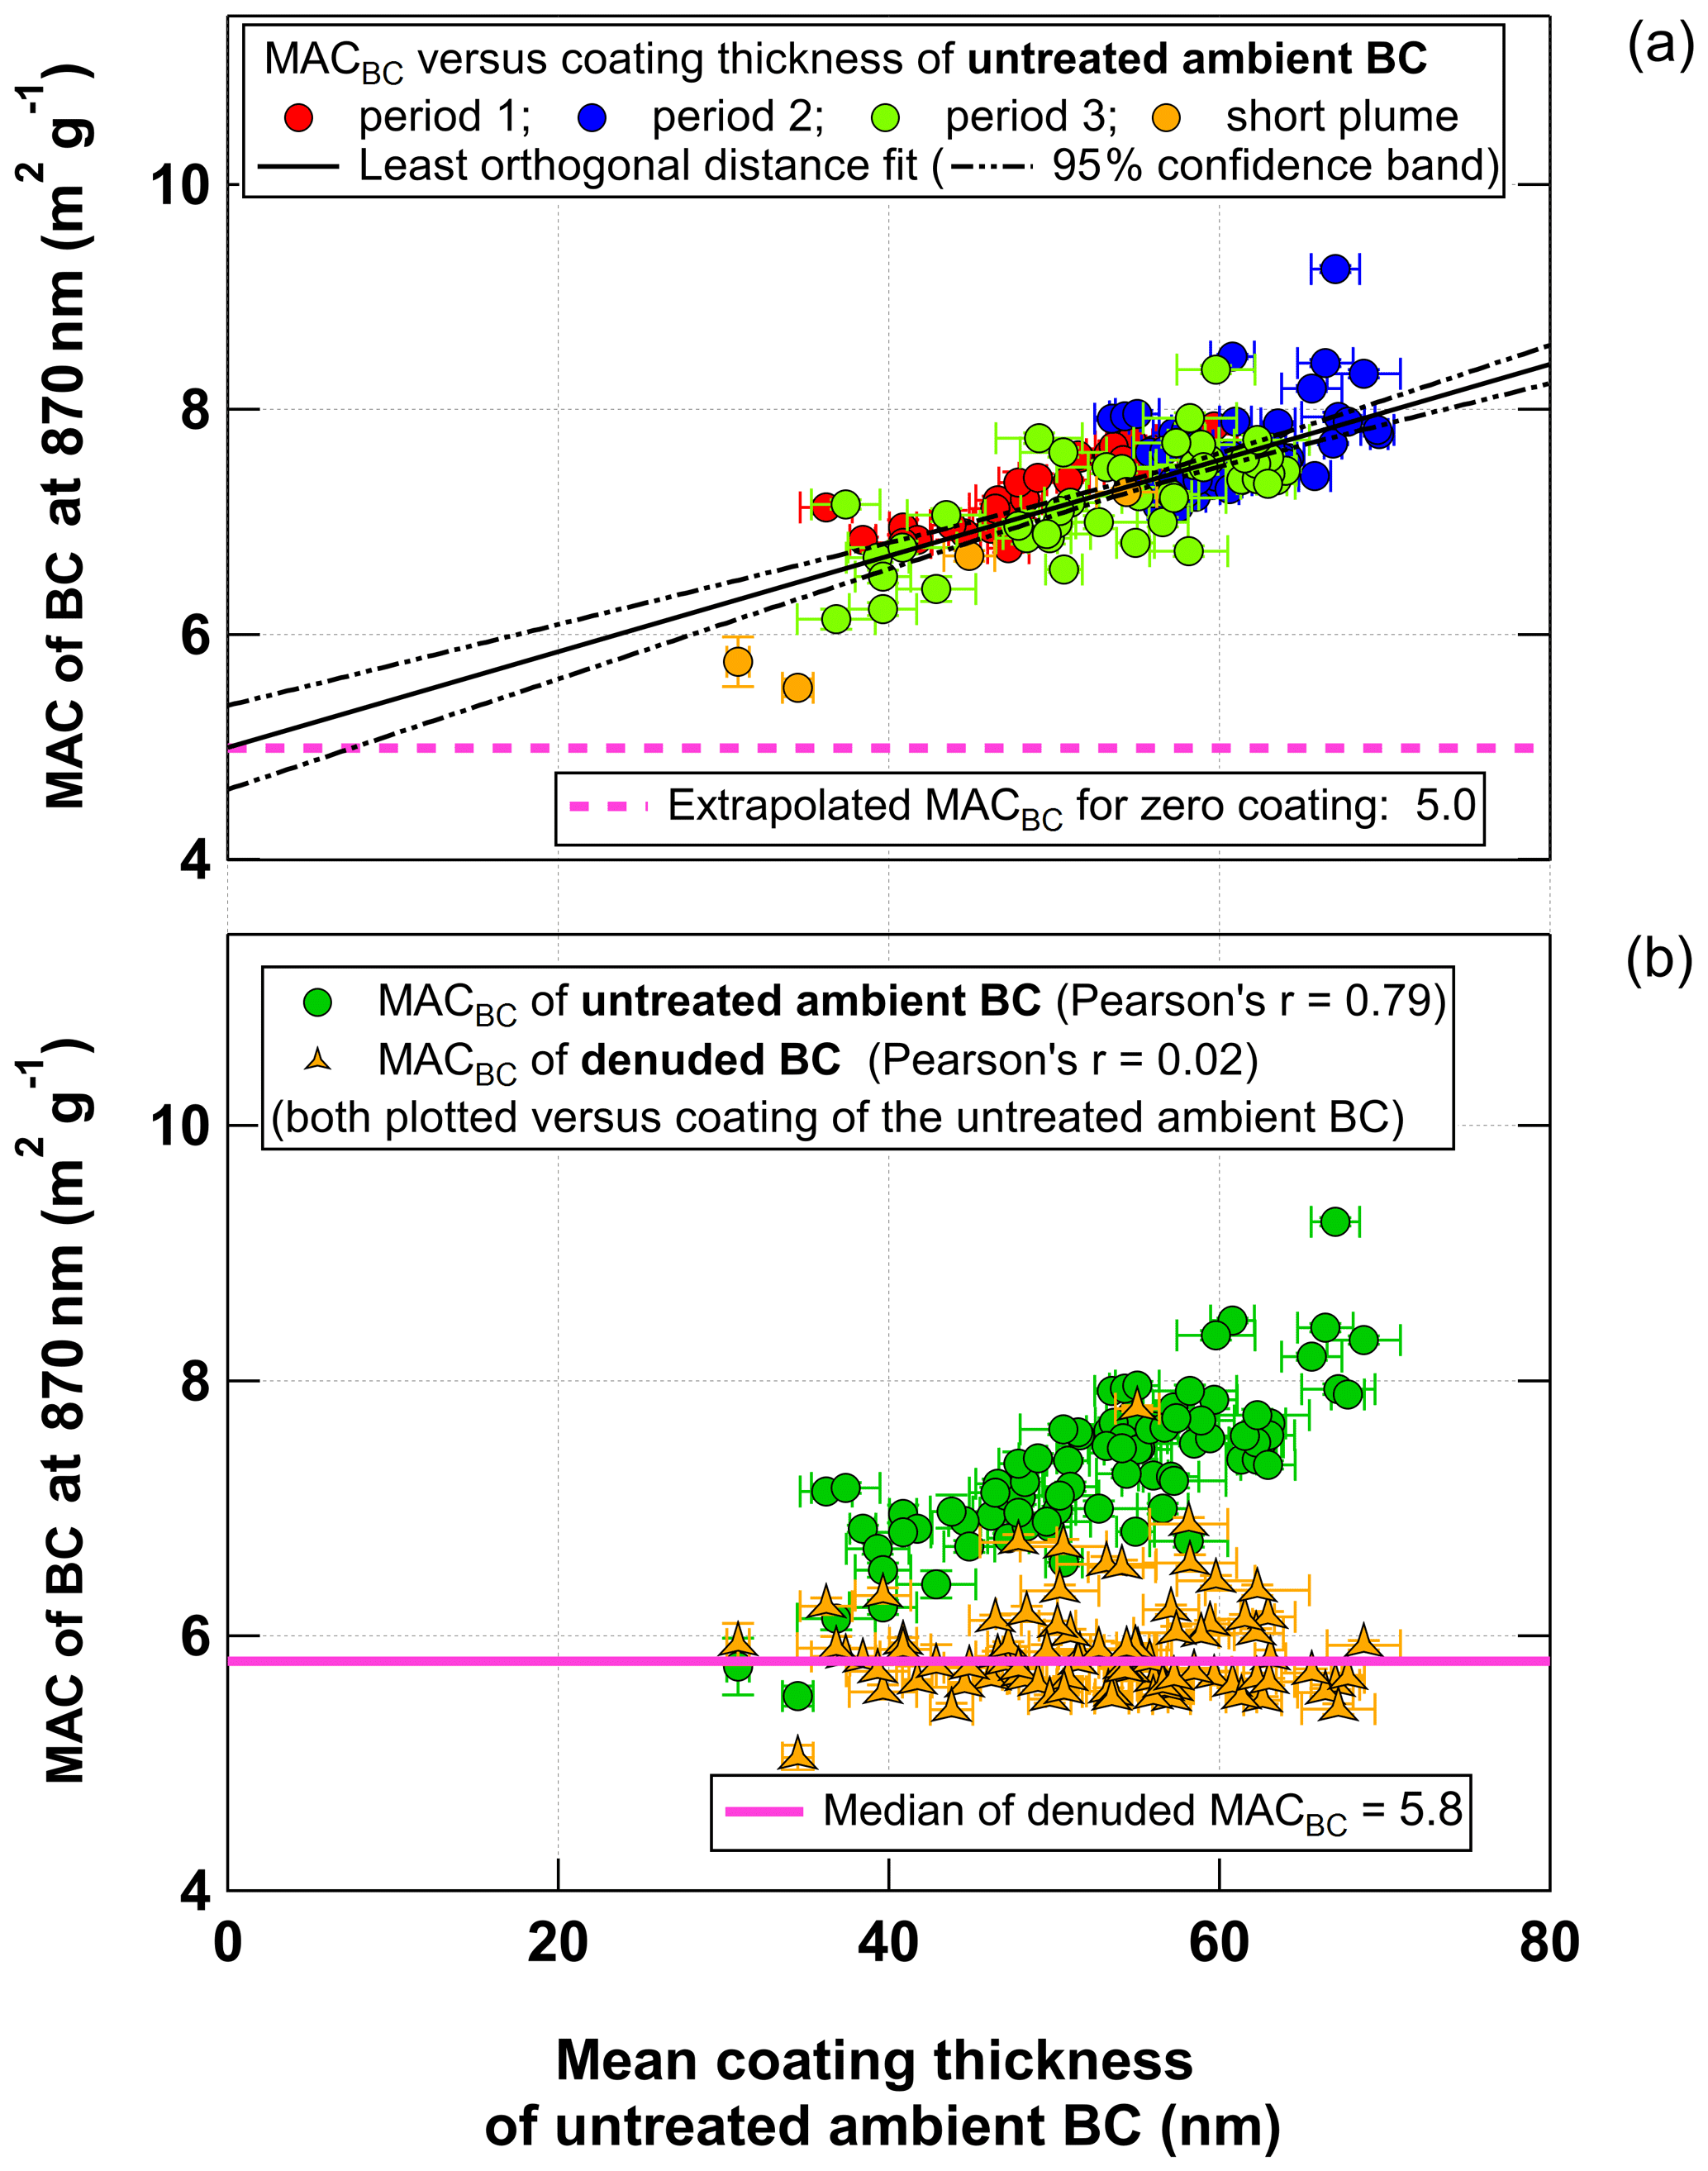
Figure 6(a) MACBC of the aerosol sample dried to low RH against the mean coating thickness of ambient rBC particles with core diameters in the range 200–220 nm mass equivalent diameter. (b) MACBC of ambient and thermo-denuded samples against the mean coating thickness of ambient rBC particles. Each data point represents an average value over a 3 h time period with error bars representing the standard error of the mean (these averages were performed with 1 min resolution data in the case of the MACBC values and 1 s resolution data in the case of the mean coating thicknesses). An orthogonal distance linear regression was applied to the ambient data to calculate a y-intercept value that represents an estimate of the MAC for zero coating, i.e., MACBC, bare. Note that the number of ambient MACBC data points in (b) is smaller than in (a) due to the gap of missing data in the denuded MACBC time series from 7 to 14 February shown in Fig. 5e.
In order to estimate the MACBC of bare, uncoated BC (MACBC, bare) a linear function was fit to the measurements in Fig. 6a (via orthogonal distance regression, ODR, fit) to obtain a y-intercept of 5.0 m2 g−1. Since the relationship between MACBC and coating thickness may not be linear for lightly coated BC (the lensing effect appears to be weaker for lightly coated than moderately to heavily coated BC; Peng et al., 2016; Liu et al., 2017), this extrapolated intercept is regarded as a lower limit estimate of MACBC, bare.
A second, more direct approach was also applied to investigate the lensing effect – we refer to this as the denuding method. In this method a catalytic stripper (CS) was used to remove BC coating material (Fig. 5c) before the MACBC measurement. Figure 5e shows that this process resulted in lower MACBC for the denuded samples relative to the corresponding ambient samples. In Fig. 6b, the ambient and denuded MACBC values are plotted against the mean coating thickness of the unperturbed, ambient BC particles (i.e., before denuding by the CS). It is seen that most of the denuded-MACBC values fall in the range from 5.6 to 6.0 m2 g−1 (median = 5.8 m2 g−1) and that the values are largely independent of the original coating thickness, with a Pearson correlation coefficient of only 0.02 (the denuded-MACBC values are also largely independent of the coating thickness of the denuded particles as shown in Fig. S4, with a Pearson correlation coefficient of −0.29). This is in contrast to the trend observed for the ambient MACBC measurements, which showed strong correlation with the coating thickness of the unperturbed BC particles. These results suggest that the coating material removed from the BC particles by the CS was largely responsible for the lensing effect displayed by the ambient BC particles.
The results displayed in Figs. 5c and S8 indicate that the CS did not remove all coating material from the BC particles, likely due to the short residence time of around 0.35 s only. The denuded particles retained thin coatings which might still be responsible for a lensing effect. However, such a lensing effect is not apparent when plotting the denuded-MACBC values against the coating thickness of the denuded particles (Fig. S10). In any case, we consider the median denuded MACBC of 5.8 m2 g−1 to represent an upper limit estimate of MACBC, bare. The true value of MACBC, bare likely falls within the range of 5.0 to 5.8 m2 g−1 defined by the lower and upper limit estimates arising from the correlation and denuding methods, respectively. Still, the results of the two methods are roughly consistent with each other, strengthening the conclusion that the internal mixing of BC drove the variability of MACBC in this campaign.
3.4 Influence of other BC particle properties on MACBC
In this section, the importance of BC particle properties other than the internal mixing state is explored in relation to MACBC variability.
First, we address the question of whether the ambient MACBC is dependent on the BC “source”. In a qualitative manner, the air mass origins characterized in Sect. 3.1 can be used to indicate different emission sources of BC particles in order to answer this question. In Fig. 6a, it is seen that the MACBC measurements from all air mass origin periods (Fig. 6a) scatter around the same regression fitting line. This suggests that the differences in MACBC between the periods are driven by differences in coating thickness, rather than the air mass origins or the characteristics of BC from different sources.
As introduced in Sect. 2.4.2, the absorption Ångström exponent (AAE) can indicate different BC sources (e.g., traffic emissions typically display AAE ∼1, while wood burning emissions generally have AAE >1). Therefore, in a more quantitative manner, the correlation of MACBC and AAE can be calculated to explore a possible source dependence for MACBC. Time series of AAE values calculated between different pairs of wavelengths are shown in Fig. S9a, indicating similar behavior for all wavelength pairs. Given this fact, AAE470, 950 was chosen to explore the correlation with MACBC in Fig. 5b in order to have the wavelength dependence of absorption across a wide range of wavelengths (from blue to near-infrared).
AAE470, 950 ranged from approximately 1.2 to 1.6 during the campaign, except for the short plume period where values around 1 were observed. This indicates that there were contributions from emission sources other than traffic to BC during the campaign. Wood burning is performed in winter in central Europe for heating purposes, and it is likely that brown carbon emissions from this activity resulted in absorption at shorter wavelengths, contributing to high AAE470, 950 values (>1). If it is assumed that additional emission sources such as coal burning did not contribute to the sample, the aethalometer model for source apportionment (Zotter et al., 2017) can be used to separate the contributions of wood burning and traffic emissions to total absorption (and therefore equivalent BC). The results of this model are shown in Fig. S9b. During periods 1 and 3, the model suggests that traffic and wood burning emissions contributed roughly equally to the observed total BC mass concentration. In contrast, during period 2, the modeled wood burning contribution dominated over the traffic contribution.
It is important to stress, however, that the AAE model can only apportion the measured absorption to two sources. As discussed in Sect. 3.1, it is likely that a third source – coal burning emissions – also contributed to the BC measured during the campaign, at least in period 2 when the SO2 to NOx ratio was significantly higher. Bond et al. (1999) observed that the industrial burning of lignite coal produced a yellowish, carbonaceous aerosol with strong absorption wavelength dependence. More generally, Bond et al. (2002) observed AAE435, 880 values between 1 and 3 for aerosol produced from the burning of different types of coal. Given the wide range of observed AAE for coal burning emissions, and the lack of knowledge regarding a specific value that is appropriate for central Europe (e.g., as is the case for biomass burning aerosols; Zotter et al., 2017), it is not possible to use measured AAE values to apportion a specific fraction of equivalent BC to coal emissions. Still, the AAE470, 950 values found here were mostly above 1.4 during period 2, which is consistent with the assumption that coal burning (lignite) emissions were relevant during this period. Therefore, we conclude that coal burning emissions likely contributed to the BC measured during the campaign, however, without being able to quantify this contribution. In this case, the contributions of wood burning and traffic to BC as calculated with the aethalometer model and displayed in Fig. S9b should be considered as upper limit estimates, since these contributions would likely be lower if a third source was included in the model.
Independent of a precise BC source apportionment the correlation of AAE with MACBC can still be assessed to explore a potential source dependence for MACBC. Figure 7a indicates there was no clear relationship between MACBC and AAE470, 950 during the campaign. This supports the conclusion of the analysis displayed in Fig. 6a that MACBC variability was driven by coating thickness, and not by the characteristics of BC from different sources.
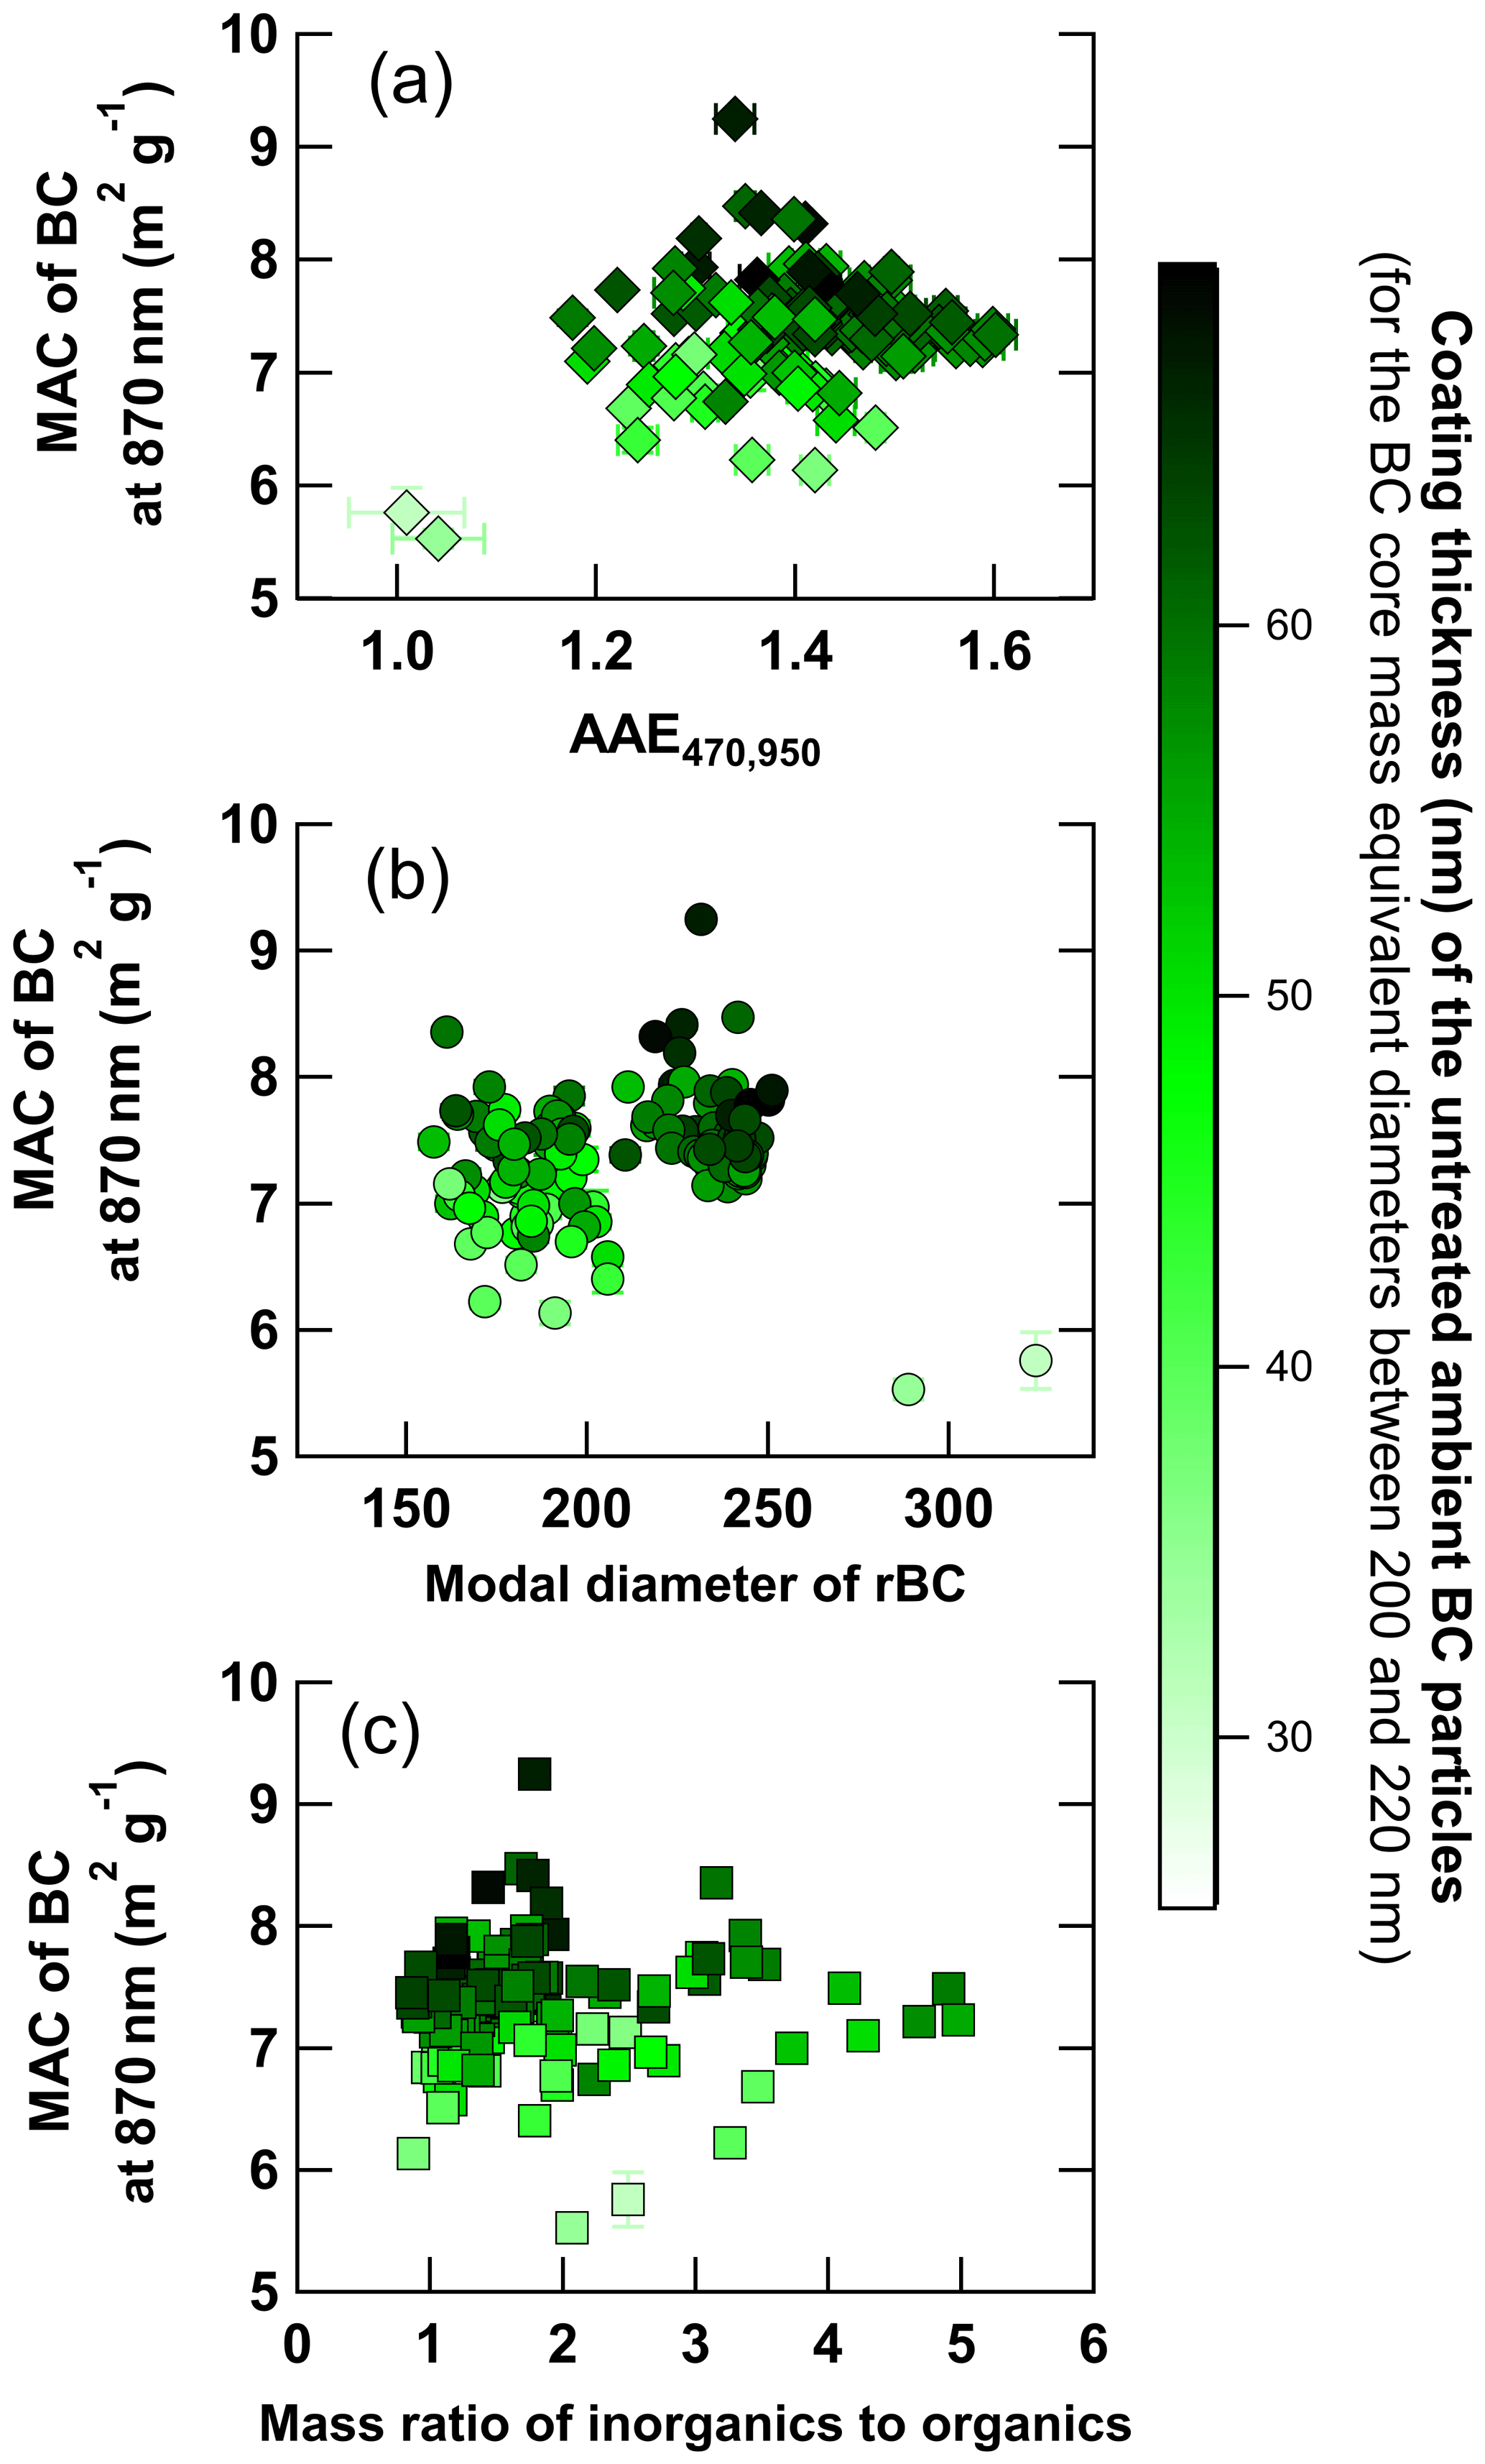
Figure 7Time-resolved MACBC values of untreated ambient BC particles at 870 nm wavelength calculated at 3 h resolution plotted against (a) the absorption Ångström exponent, AAE470, 950, between 470 and 950 nm wavelength; (b) the modal diameter of the BC core mass size distributions (DrBC) (expressed as mass equivalent diameter); and (c) the ratio of non-refractory inorganic to organic components measured in near-PM1 by the ACSM.
Second, we address the question of whether the MACBC depends on the BC core diameter. Figure 7b shows that there was no clear relationship between MACBC and BC core diameter (R2=0.01, or 0.09 with the two outlying points with the largest modal diameters removed), which indicates that the variation in BC size was not responsible for the MACBC variability. This is because the modal diameters of the BC core mass size distributions only varied within a relatively narrow range during the campaign (DrBC from 150 to 250 nm). This corresponds to dimensionless size parameters in the range from 0.5 to 0.9. In both the Rayleigh (x≪1) and Mie regime (x∼1), the size-distribution-weighted MACBC is relatively independent of DrBC. For much greater DrBC (x≫1, known as the geometric regime) incident light is unable to penetrate through the whole particle: absorption only occurs in the outer layer of the particle, which results in a strong negative relationship between MACBC and DrBC in this regime. The modal diameters of the BC core mass size distributions observed during this campaign were not large enough to reach the geometric regime, which is why no clear relationship was observed between MACBC and DrBC.
Third, the dependence of the ambient MACBC on the coating composition is evaluated. Moffet et al. (2016) indicated that the chemical composition of the BC coating material may affect the optical properties of BC by influencing the location of a BC core within its hosting particle. These authors observed in a field study in central California that BC cores in particles with organic-rich coatings were located near particle centers while BC cores in particles with inorganic coatings were located near particle edges. They hypothesized that the latter case occurs due to crystallization of the inorganic species. In terms of light absorption enhancement, a few laboratory and field studies have found evidence that EMAC values depend on whether BC is internally mixed with organic or inorganic species. Wei et al. (2013) found that glycerol-coated BC had EMAC at 532 nm of ∼1.4 while BC cores coated with solid ammonium sulfate and ammonium nitrate had EMAC at 532 nm of only 1.10 and 1.06, respectively. However, it should be noted that the amount of coating could not be quantified conclusively in these experiments, and therefore it must be considered likely that the coating volume fractions differed for the different coating compositions. Zhang et al. (2018) applied a multi-linear regression analysis to positive matrix factorization (PMF) source apportionment results to conclude that highly oxidized secondary organic aerosol was the major chemical component responsible for aerosol light absorption enhancement observed at an urban background site in Paris, France. These authors showed that EMAC at 870 nm displayed a positive relationship with the mass ratio of bulk secondary organic to secondary inorganic aerosol, with EMAC at 870 nm increasing from 1 to 2 as the mass ratio of organics to inorganic increased from 2 to 8. However, it should also be noted here that coating amounts were not measured, and therefore the observed relationship could potentially be the result of cross-correlation between coating composition and coating thickness.
In this study, the chemical composition was measured for bulk aerosols by an ACSM. No chemical or mixing state information is available at the single-particle level. Therefore, we used the bulk ratio of measured inorganic to organic particulate matter as a proxy variable to investigate a possible dependence of MACBC on coating composition. In Fig. 7c it is seen that MACBC displays no clear relationship with the inorganic to organic ratio. By contrast, darker points are systematically higher up than brighter points, indicating that the amount of coating (coating thickness) had a large effect on absorption enhancement through the lensing effect, whereas variations in coating composition only had a negligible effect during this campaign. However, it cannot be ruled out that a relationship between coating chemical composition and absorption enhancement did in fact exist, but that the relationship is not apparent in Fig. 7c because the bulk ratio of inorganic to organic aerosol mass is a poor indicator of the composition of coatings on individual particles.
Despite the fact that atmospheric aging processes tend to make aerosols more homogeneous during transport away from sources, e.g., by increasing the degree of internal mixing, some dependence of MACBC on BC source could be retained. Possible drivers for such source dependence include differences in BC core size and morphology, in chemical microstructure of the BC, in morphology of the coated BC due to differences in coating processes and/or coating composition. The MACBC of denuded aerosol samples exhibited very limited variability (Fig. S4b) suggesting that potential differences in MACBC of bare cores from different sources are small. The analyses presented above further suggest that BC-source-related differences in MACBC, which may or may not exist close to sources, largely disappear during transport to the rural background site. The only exceptions are variations in coating thickness, which have been shown to drive MACBC variations, and which may have retained some residual relation with BC source.
3.5 Absorption enhancement factors (lensing effect) and their comparison with previous studies
The relationship between EMAC and the internal mixing state of BC is shown in Fig. 8a. In order to directly compare the results of this study with those from previous studies, the BC mixing state is represented in Fig. 8a by the mean ratio of coating to core mass (Rcoat-BC) for BC cores with mass equivalent diameter between 200 and 220 nm, rather than mean coating thickness over this same size range as in Fig. 6. Two sets of data points from this study are shown in Fig. 8a: lower limit estimates of EMAC that were obtained with constraining the MACBC of bare BC cores by the denuding method (i.e., m2 g−1) and upper limit estimates of EMAC that were obtained with constraining the MACBC of bare BC cores by the correlation method (i.e., m2 g−1), as described in Sect. 3.3. The differences between these two sets of measurements is at least partly due to the fact that the thermo-denuding process at 350 ∘C employed here was not sufficient to completely remove all coating material from the BC particles (Figs. 5c and S8). This is an important point to consider in all studies that employ similar types of thermodenuders in order to remove coatings from BC particles.
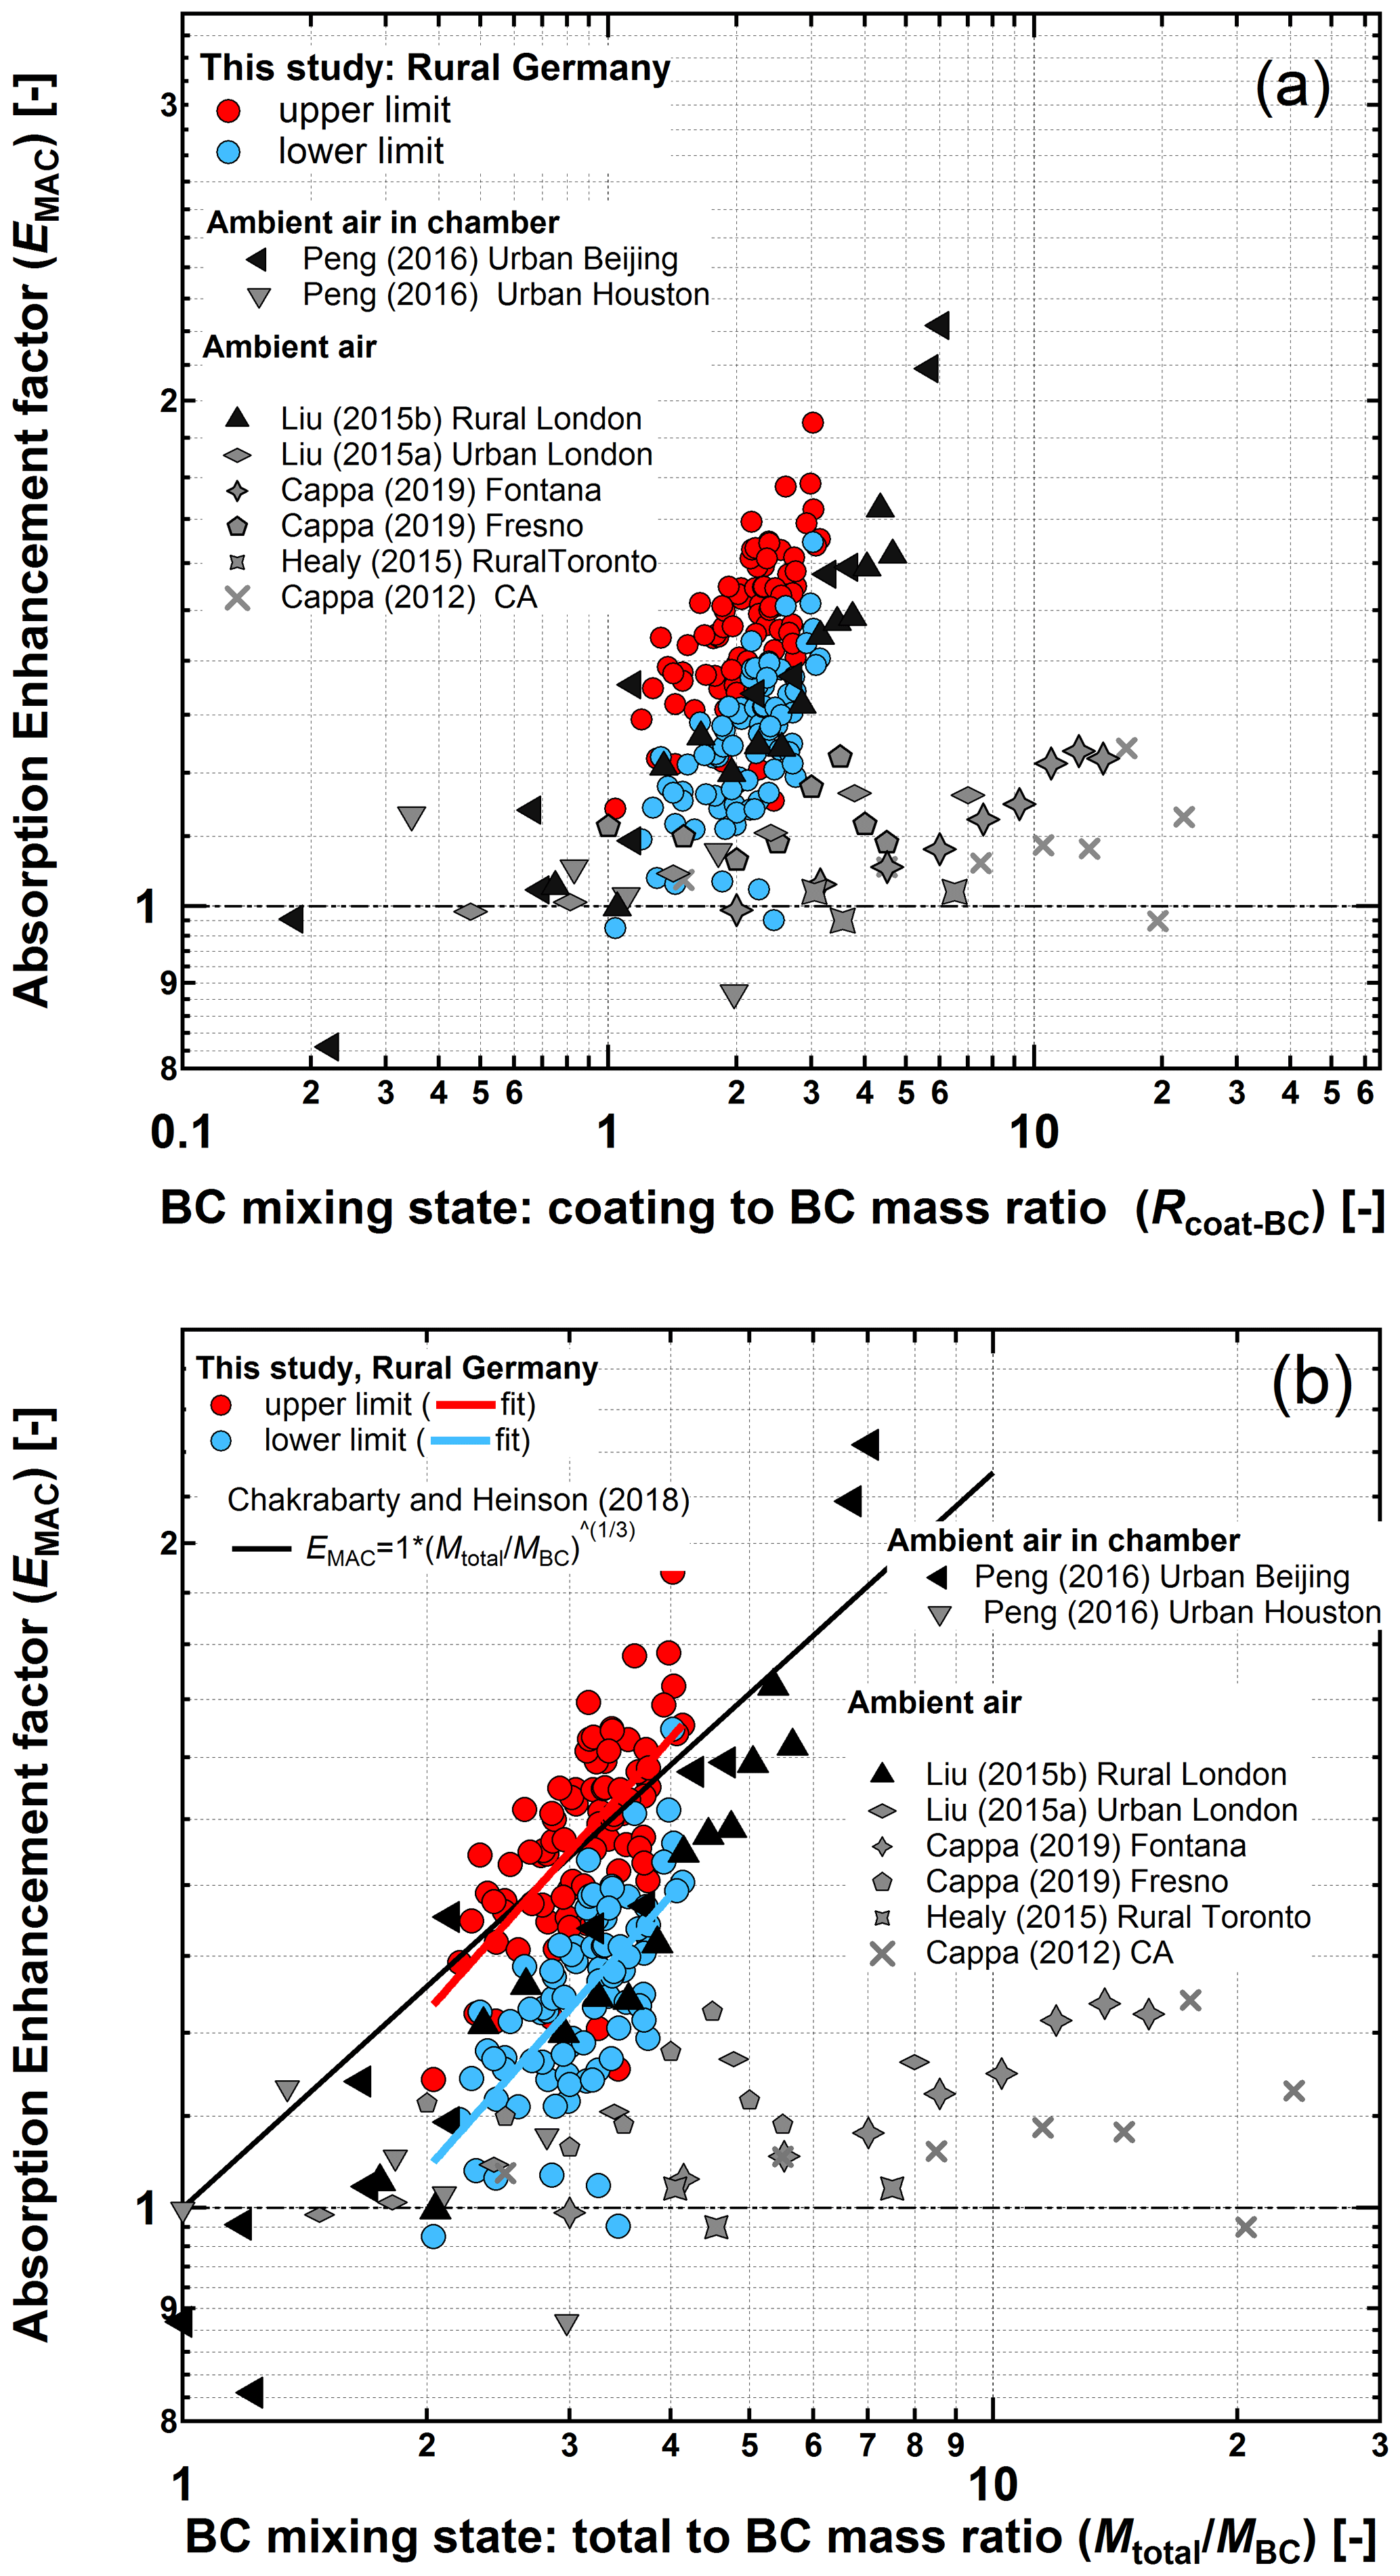
Figure 8Summary of EMAC values and their dependence on BC mixing state from this study compared with literature data measured at wavelengths from 532 to 870 nm. The EMAC values are plotted vs. the ratio of coating to BC core mass (a) and vs. the ratio of total particle mass to BC core mass (only considering BC-containing particles) (b). Panel (a) is an updated version of a figure from Cappa et al. (2019), while in panel (b) the abscissa has been changed to Mtotal∕MBC to additionally include the simple power law parameterization of the lensing effect proposed by Chakrabarty and Heinson (2018), which uses Mtotal∕MBC as the input parameter to represent BC mixing state (where Mtotal refers to the mass of the total particle, such that ). The two approaches applied to obtain the lower and upper limit of EMAC values presented for this study are discussed in Sect. 3.3). Note that the data points from the study of Liu et al. (2015a) deviate marginally from those in the original figure by Cappa et al. (2019), as the abscissa values were recalculated from the original data using material densities for BC and coating material of 1.8 and 1.6 g cm−3, respectively, as applied in this study.
EMAC measurements from previous studies are also displayed in Fig. 8a in order to place the results from this study in context. The most striking aspect of this comparison is that ambient EMAC measurements tend to cluster into two main branches of points, as was recently pointed out by Cappa et al. (2019). One branch of measurements, indicated by light gray markers in Fig. 8a, suggest that EMAC has little or no relationship to Rcoat-BC (i.e., a weak lensing effect). By contrast, the second branch of measurements (black markers in Fig 8a) indicate a strong positive relationship between EMAC and Rcoat-BC (i.e., a clear lensing effect). The results from this study populate the latter branch of points, indicating the occurrence of a clear lensing effect.
The reasons why a strong lensing effect is observed in some ambient studies but not in others remain elusive and hypothetical. Firstly, it is important to note that there are methodological differences between the studies summarized in Fig. 8a. Some studies employed an SP-AMS to measure BC mixing state (Cappa et al., 2012, 2019; Healy et al., 2015; Liu et al., 2015b), while others used alternative instruments such as SP2, and a V-TDMA (volatility tandem differential mobility analyzer) for this purpose (Liu et al., 2015a; Peng et al., 2016, and this study). It is noteworthy that the majority of SP-AMS-based studies observed only a weak lensing effect. However, a weak lensing effect was also observed in one SP2-based study (Liu et al., 2015a) and a strong lensing effect in one SP-AMS-based study (Liu et al., 2015b), which suggests that the discrepancies between studies are not only due to this methodological reason. Nevertheless, dedicated SP-AMS and SP2 instrument intercomparison experiments should be conducted to directly compare Rcoat-BC measurements from these two instruments to see to what extent discrepancies between the methods can explain the divergence of results in Fig. 8a.
Secondly, there are plausible physical explanations to explain the clustering of measurements into the two branches of points displayed in Fig. 8a, as discussed by Cappa et al. (2019). One hypothesis is that the relative location of BC and other aerosol components within the BC-containing particles determines whether a lensing effect occurs or not. Theoretical studies (Adachi et al., 2010; Zhang et al., 2017) and laboratory measurements (Schnaiter et al., 2005) indicate that BC particles encapsulated in a core–shell configuration display substantial absorption enhancement, while BC particles that are only partially encapsulated or “attached” to the edge of other particles display little or no absorption enhancement. TEM studies have found that both of these types of mixed BC particles can be found in the ambient atmosphere (Ueda et al., 2016; Liu et al., 2015b), and some studies have even linked the presence of concentrically coated BC particles to higher observed EMAC (Ueda et al., 2016). Recent studies indicate that a threshold value of Rcoat-BC appears to exist beyond which particles collapse to a core–shell-like configuration and display a substantial lensing effect (Peng et al., 2016; Liu et al., 2017). Aside from typical morphology and average mixing state, the distribution of coating material across an ensemble of particles is also an important determinant of the average absorption enhancement displayed by that ensemble (Fierce et al., 2016). This is another potential hypothesis for why some studies have measured lower than expected EMAC values for aerosols with large Rcoat-BC.
During the Melpitz campaign, neither measurements of BC particle morphologies nor single-particle-level coating thickness measurements over the full size range of BC particles are available (representative LEO-fit measurements only cover a limited range; see Sect. 2.4.1). Therefore, we are unable to say definitively why a clear lensing effect was observed in this study and not in other studies. However, given the fact that a clear lensing effect was observed, we assume that the majority of BC particles were above the threshold of absorption enhancement and were fully coated in a core-shell like configuration. This in turn suggests that BC particles measured at the rural background site of Melpitz during winter were in a relatively aged state.
Recently, Chakrabarty and Heinson (2018) proposed that the absorption enhancement of BC particles as a function of the total particle to BC core mass ratio follows a simple power law with an exponent of one-third. This finding is based on numerically exact electromagnetic calculations of simulated BC aggregates with variable degree of internal mixing with non-absorbing matter, and it is also in agreement with some previous experimental studies. The EMAC results from this study and selected ambient literature studies are plotted against BC mixing state expressed as Mtotal∕MBC in Fig. 8b (where ). Our results and some of the other studies that have a clear lensing effect (black markers) are generally consistent with the proposed power-function scaling law. However, other studies that have a weak lensing effect (light gray markers) disagree with the scaling law, which could be due to the hypotheses mentioned previously. It is noteworthy that the upper-limit EMAC estimates of this study appear to more closely follow the scaling law than the lower-limit estimates. This may suggest that the upper limit EMAC estimates are more realistic, which could be reasonable considering that the lower limit estimates were derived from the denuding measurements, which failed to completely remove the BC coatings. However, quantitative comparison of ambient results should be treated with care, given the limited range of mass ratios that were observed and the potential influence of other minor factors on EMAC as described in Sect. 3.4. Nevertheless, the agreement of the observations of this study with a model based on coated BC particles with morphologies favorable for occurrence of the lensing effect provides indirect evidence that dampening of the lensing effect due to particle shapes with unfavorable morphologies was only minor or negligible for the rural background aerosol at Melpitz in winter.
Field measurements of BC particle properties and additional aerosol characteristics were performed at the rural background site of Melpitz, Germany during winter (February 2017). Two independent methods (the denuding and correlation methods) were used to show that the variability of MACBC at this site was driven by the degree of BC internal mixing state (i.e., a clear lensing effect was observed). The enhancement of light absorption by BC due to coatings varied from 1.0 to 1.6 (lower limit estimates), or 1.2 to 1.9 (higher limit estimates), for mean BC volume fractions that varied from 46 % to 22 % (for BC core sizes from 200 to 220 nm). The lower and higher limit estimates were determined using two different approaches, one of them involving denuding by means of a catalytic stripper, and the difference between the two may potentially be caused by incomplete coating removal. All of these results apply for essentially water-free aerosol as present after drying to low RH.
The strong lensing effect observed in this study agrees well with a recently published theoretical relationship and with a subset of previous ambient studies. No evidence was found for cases with absence of lensing effect despite internally mixed BC, as reported in other previous studies. By contrast, evidence suggests that potential dampening of the lensing effect due to unfavorable morphology was most likely small or even negligible. Additional potential drivers of MACBC variations including dominant BC source, average BC core size and coating composition were also investigated. None of these was found to have a substantial effect at the rural background site Melpitz with a large fraction of aged particles. However, such effects could potentially be obscured by the lack of single-particle composition and morphology information that would be required for a single-particle level quantitative assessment.
Overall, the results of this study support that knowing the BC mixing state in terms of BC volume fraction in the internally mixed particles is sufficient to describe the lensing effect and MACBC in good approximation. By contrast, the influence of coating composition appears to be minor for atmospheric aerosols. However, future field studies addressing the coating composition effect would have to combine coating composition and quantification with morphology measurements, which remains an experimental challenge. In addition to this challenge, follow up studies should aim to intercompare different techniques for measuring BC volume fractions (e.g., SP2 vs. SP-AMS measurements of Rcoat-BC).
The data archive for this paper is available on Zenodo (https://doi.org/10.5281/zenodo.4290328, Yuan et al., 2020).
The supplement related to this article is available online at: https://doi.org/10.5194/acp-21-635-2021-supplement.
MGB acquired the funding and designed the experiment jointly with RLM and JY. BW coordinated the campaign. JY, RLM, MZ, TM, LP, BW and TT took the measurements and/or analyzed the raw data. JY interpreted the results and wrote the manuscript together with RLM and MGB. All co-authors reviewed and commented on the manuscript.
The authors declare that they have no conflict of interest.
The authors gratefully acknowledge Achim Grüner and Gerald Spindler for regular operation of the Melpitz observatory and the NOAA Air Resources Laboratory (ARL) for the provision of the HYSPLIT transport and dispersion model. While the Swiss Government contributed to funding, the opinions expressed and arguments employed herein do not necessarily reflect the official views of the Swiss Government.
This research has been supported by the European Research Council (grant no. 615922-BLACARAT), the Horizon 2020 project ACTRIS-2 (grant no. 654109), the Staatssekretariat für Bildung, Forschung und Innovation (grant no. 15.0159-1), and the Deutsche Forschungsgemeinschaft (grant no. 268020496) – TRR 172, within the Transregional Collaborative Research Center “ArctiC Amplification: Climate Relevant Atmospheric and SurfaCe Processes, and Feedback Mechanisms (AC)3”.
This paper was edited by Yugo Kanaya and reviewed by two anonymous referees.
Aas, W., Tsyro, S., Bieber, E., Bergström, R., Ceburnis, D., Ellermann, T., Fagerli, H., Frölich, M., Gehrig, R., Makkonen, U., Nemitz, E., Otjes, R., Perez, N., Perrino, C., Prévôt, A. S. H., Putaud, J.-P., Simpson, D., Spindler, G., Vana, M., and Yttri, K. E.: Lessons learnt from the first EMEP intensive measurement periods, Atmos. Chem. Phys., 12, 8073–8094, https://doi.org/10.5194/acp-12-8073-2012, 2012.
Adachi, K., Chung, S., and R. Buseck, P.: Shapes of soot aerosol particles and implications for their effects on climate, J. Geophys. Res.-Atmos., 115, D15206, https://doi.org/10.1029/2009JD012868, 2010.
Amanatidis, S., Ntziachristos, L., Giechaskiel, B., Katsaounis, D., Samaras, Z., and Bergmann, A.: Evaluation of an oxidation catalyst (“catalytic stripper”) in eliminating volatile material from combustion aerosol, J. Aerosol Sci., 57, 144–155, https://doi.org/10.1016/j.jaerosci.2012.12.001, 2013.
Arnott, W. P., Moosmüller, H., Rogers, C. F., Tianfeng, J., and Bruch, R.: Photoacoustic spectrometer for measuring light absorption by aerosol: Instrument description, Atmos. Environ., 33, 2845–2852, https://doi.org/10.1016/S1352-2310(98)00361-6, 1999.
Asmi, A., Wiedensohler, A., Laj, P., Fjaeraa, A.-M., Sellegri, K., Birmili, W., Weingartner, E., Baltensperger, U., Zdimal, V., Zikova, N., Putaud, J.-P., Marinoni, A., Tunved, P., Hansson, H.-C., Fiebig, M., Kivekäs, N., Lihavainen, H., Asmi, E., Ulevicius, V., Aalto, P. P., Swietlicki, E., Kristensson, A., Mihalopoulos, N., Kalivitis, N., Kalapov, I., Kiss, G., de Leeuw, G., Henzing, B., Harrison, R. M., Beddows, D., O'Dowd, C., Jennings, S. G., Flentje, H., Weinhold, K., Meinhardt, F., Ries, L., and Kulmala, M.: Number size distributions and seasonality of submicron particles in Europe 2008–2009, Atmos. Chem. Phys., 11, 5505–5538, https://doi.org/10.5194/acp-11-5505-2011, 2011.
Baumgardner, D., Popovicheva, O., Allan, J., Bernardoni, V., Cao, J., Cavalli, F., Cozic, J., Diapouli, E., Eleftheriadis, K., Genberg, P. J., Gonzalez, C., Gysel, M., John, A., Kirchstetter, T. W., Kuhlbusch, T. A. J., Laborde, M., Lack, D., Müller, T., Niessner, R., Petzold, A., Piazzalunga, A., Putaud, J. P., Schwarz, J., Sheridan, P., Subramanian, R., Swietlicki, E., Valli, G., Vecchi, R., and Viana, M.: Soot reference materials for instrument calibration and intercomparisons: a workshop summary with recommendations, Atmos. Meas. Tech., 5, 1869–1887, https://doi.org/10.5194/amt-5-1869-2012, 2012.
Birmili, W., Weinhold, K., Nordmann, S., Wiedensohler, A., Spindler, G., Müller, K., Herrmann, H., Gnauk, T., Pitz, M., Cyrys, J., Flentje, H., Nickel, C., Kuhlbusch, T. A. J., and Löschau, G.: Atmospheric aerosol measurements in the German Ultrafine Aerosol Network (GUAN): Part 1 – soot and particle number size distribution, Gefahrst. Reinh. Luft, 69, 137–145, 2009.
Birmili, W., Weinhold, K., Rasch, F., Sonntag, A., Sun, J., Merkel, M., Wiedensohler, A., Bastian, S., Schladitz, A., Löschau, G., Cyrys, J., Pitz, M., Gu, J., Kusch, T., Flentje, H., Quass, U., Kaminski, H., Kuhlbusch, T. A. J., Meinhardt, F., Schwerin, A., Bath, O., Ries, L., Gerwig, H., Wirtz, K., and Fiebig, M.: Long-term observations of tropospheric particle number size distributions and equivalent black carbon mass concentrations in the German Ultrafine Aerosol Network (GUAN), Earth Syst. Sci. Data, 8, 355–382, https://doi.org/10.5194/essd-8-355-2016, 2016.
Bohren, C. F. and Huffman, D. R.: Absorption and scattering by a sphere, in: Absorption and scattering of light by small particles, WILEY-VCH, Weinheim, Germany, 82–129, 1998.
Bond, T. C., Bussemer, M., Wehner, B., Keller, S., Charlson, R. J., and Heintzenberg, J.: Light absorption by primary particle emissions from a lignite burning plant, Environ. Sci. Technol., 33, 3887–3891, https://doi.org/10.1021/es9810538, 1999.
Bond, T. C., Covert, D. S., Kramlich, J. C., Larson, T. V., and Charlson, R. J.: Primary particle emissions from residential coal burning: Optical properties and size distributions, J. Geophys. Res.-Atmos., 107, 8347, https://doi.org/10.1029/2001jd000571, 2002.
Bond, T. C., Habib, G., and Bergstrom, R. W.: Limitations in the enhancement of visible light absorption due to mixing state, J. Geophys. Res., 111, D20211, https://doi.org/10.1029/2006jd007315, 2006.
Bond, T. C., Doherty, S. J., Fahey, D. W., Forster, P. M., Berntsen, T., DeAngelo, B. J., Flanner, M. G., Ghan, S., Kärcher, B., Koch, D., Kinne, S., Kondo, Y., Quinn, P. K., Sarofim, M. C., Schultz, M. G., Schulz, M., Venkataraman, C., Zhang, H., Zhang, S., Bellouin, N., Guttikunda, S. K., Hopke, P. K., Jacobson, M. Z., Kaiser, J. W., Klimont, Z., Lohmann, U., Schwarz, J. P., Shindell, D., Storelvmo, T., Warren, S. G., and Zender, C. S.: Bounding the role of black carbon in the climate system: A scientific assessment, J. Geophys. Res.-Atmos., 118, 5380–5552, https://doi.org/10.1002/jgrd.50171, 2013.
Cappa, C. D., Onasch, T. B., Massoli, P., Worsnop, D. R., Bates, T. S., Cross, E. S., Davidovits, P., Hakala, J., Hayden, K. L., Jobson, B. T., Kolesar, K. R., Lack, D. A., Lerner, B. M., Li, S. M., Mellon, D., Nuaaman, I., Olfert, J. S., Petaja, T., Quinn, P. K., Song, C., Subramanian, R., Williams, E. J., and Zaveri, R. A.: Radiative absorption enhancements due to the mixing state of atmospheric black carbon, Science, 337, 1078–1081, https://doi.org/10.1126/science.1223447, 2012.
Cappa, C. D., Zhang, X., Russell, L. M., Collier, S., Lee, A. K. Y., Chen, C.-L., Betha, R., Chen, S., Liu, J., Price, D. J., Sanchez, K. J., McMeeking, G. R., Williams, L. R., Onasch, T. B., Worsnop, D. R., Abbatt, J., and Zhang, Q.: Light absorption by ambient black and brown carbon and its dependence on black carbon coating state for two California, USA, cities in winter and summer, J. Geophys. Res.-Atmos., 124, 1550–1577, https://doi.org/10.1029/2018jd029501, 2019.
Chakrabarty, R. K. and Heinson, W. R.: Scaling laws for light absorption enhancement due to nonrefractory coating of atmospheric black carbon aerosol, Phys. Rev. Lett., 121, 218701, https://doi.org/10.1103/PhysRevLett.121.218701, 2018.
Ciarelli, G., Aksoyoglu, S., El Haddad, I., Bruns, E. A., Crippa, M., Poulain, L., Äijälä, M., Carbone, S., Freney, E., O'Dowd, C., Baltensperger, U., and Prévôt, A. S. H.: Modelling winter organic aerosol at the European scale with CAMx: evaluation and source apportionment with a VBS parameterization based on novel wood burning smog chamber experiments, Atmos. Chem. Phys., 17, 7653–7669, https://doi.org/10.5194/acp-17-7653-2017, 2017.
Collier, S., Williams, L. R., Onasch, T. B., Cappa, C. D., Zhang, X., Russell, L. M., Chen, C.-L., Sanchez, K. J., Worsnop, D. R., and Zhang, Q.: Influence of emissions and aqueous processing on particles containing black carbon in a polluted urban environment: Insights from a soot particle-aerosol mass spectrometer, J. Geophys. Res.-Atmos., 123, 6648–6666, https://doi.org/10.1002/2017jd027851, 2018.
Corbin, J. C., Czech, H., Massabò, D., de Mongeot, F. B., Jakobi, G., Liu, F., Lobo, P., Mennucci, C., Mensah, A. A., Orasche, J., Pieber, S. M., Prévôt, A. S. H., Stengel, B., Tay, L. L., Zanatta, M., Zimmermann, R., El Haddad, I., and Gysel, M.: Infrared-absorbing carbonaceous tar can dominate light absorption by marine-engine exhaust, Npj Clim. Atmos. Sci., 2, 12, https://doi.org/10.1038/s41612-019-0069-5, 2019.
Dahlkötter, F., Gysel, M., Sauer, D., Minikin, A., Baumann, R., Seifert, P., Ansmann, A., Fromm, M., Voigt, C., and Weinzierl, B.: The Pagami Creek smoke plume after long-range transport to the upper troposphere over Europe – aerosol properties and black carbon mixing state, Atmos. Chem. Phys., 14, 6111–6137, https://doi.org/10.5194/acp-14-6111-2014, 2014.
Drinovec, L., Močnik, G., Zotter, P., Prévôt, A. S. H., Ruckstuhl, C., Coz, E., Rupakheti, M., Sciare, J., Müller, T., Wiedensohler, A., and Hansen, A. D. A.: The “dual-spot” Aethalometer: an improved measurement of aerosol black carbon with real-time loading compensation, Atmos. Meas. Tech., 8, 1965–1979, https://doi.org/10.5194/amt-8-1965-2015, 2015.
Elser, M., Huang, R.-J., Wolf, R., Slowik, J. G., Wang, Q., Canonaco, F., Li, G., Bozzetti, C., Daellenbach, K. R., Huang, Y., Zhang, R., Li, Z., Cao, J., Baltensperger, U., El-Haddad, I., and Prévôt, A. S. H.: New insights into PM2.5 chemical composition and sources in two major cities in China during extreme haze events using aerosol mass spectrometry, Atmos. Chem. Phys., 16, 3207–3225, https://doi.org/10.5194/acp-16-3207-2016, 2016.
Fierce, L., Bond, T. C., Bauer, S. E., Mena, F., and Riemer, N.: Black carbon absorption at the global scale is affected by particle-scale diversity in composition, Nat. Commun., 7, 12361, https://doi.org/10.1038/ncomms12361, 2016.
Gao, R. S., Schwarz, J. P., Kelly, K. K., Fahey, D. W., Watts, L. A., Thompson, T. L., Spackman, J. R., Slowik, J. G., Cross, E. S., Han, J. H., Davidovits, P., Onasch, T. B., and Worsnop, D. R.: A novel method for estimating light-scattering properties of soot aerosols using a modified single-particle soot photometer, Aerosol Sci. Technol., 41, 125–135, https://doi.org/10.1080/02786820601118398, 2007.
Glasius, M., Hansen, A. M. K., Claeys, M., Henzing, J. S., Jedynska, A. D., Kasper-Giebl, A., Kistler, M., Kristensen, K., Martinsson, J., Maenhaut, W., Nøjgaard, J. K., Spindler, G., Stenström, K. E., Swietlicki, E., Szidat, S., Simpson, D., and Yttri, K. E.: Composition and sources of carbonaceous aerosols in northern europe during winter, Atmos. Environ., 173, 127–141, https://doi.org/10.1016/j.atmosenv.2017.11.005, 2018.
Hansen, A. D. A., Rosen, H., and Novakov, T.: The aethalometer – an instrument for the real-time measurement of optical absorption by aerosol particles, Sci. Total Environ., 36, 191–196, https://doi.org/10.1016/0048-9697(84)90265-1, 1984.
Healy, R. M., Wang, J. M., Jeong, C. H., Lee, A. K. Y., Willis, M. D., Jaroudi, E., Zimmerman, N., Hilker, N., Murphy, M., Eckhardt, S., Stohl, A., Abbatt, J. P. D., Wenger, J. C., and Evans, G. J.: Light-absorbing properties of ambient black carbon and brown carbon from fossil fuel and biomass burning sources, J. Geophys. Res.-Atmos., 120, 6619–6633, https://doi.org/10.1002/2015jd023382, 2015.
Laborde, M., Mertes, P., Zieger, P., Dommen, J., Baltensperger, U., and Gysel, M.: Sensitivity of the Single Particle Soot Photometer to different black carbon types, Atmos. Meas. Tech., 5, 1031–1043, https://doi.org/10.5194/amt-5-1031-2012, 2012a.
Laborde, M., Schnaiter, M., Linke, C., Saathoff, H., Naumann, K.-H., Möhler, O., Berlenz, S., Wagner, U., Taylor, J. W., Liu, D., Flynn, M., Allan, J. D., Coe, H., Heimerl, K., Dahlkötter, F., Weinzierl, B., Wollny, A. G., Zanatta, M., Cozic, J., Laj, P., Hitzenberger, R., Schwarz, J. P., and Gysel, M.: Single Particle Soot Photometer intercomparison at the AIDA chamber, Atmos. Meas. Tech., 5, 3077–3097, https://doi.org/10.5194/amt-5-3077-2012, 2012b.
Laborde, M., Crippa, M., Tritscher, T., Jurányi, Z., Decarlo, P. F., Temime-Roussel, B., Marchand, N., Eckhardt, S., Stohl, A., Baltensperger, U., Prévôt, A. S. H., Weingartner, E., and Gysel, M.: Black carbon physical properties and mixing state in the European megacity Paris, Atmos. Chem. Phys., 13, 5831–5856, https://doi.org/10.5194/acp-13-5831-2013, 2013.
Lack, D. A., Lovejoy, E. R., Baynard, T., Pettersson, A., and Ravishankara, A. R.: Aerosol absorption measurement using photoacoustic spectroscopy: Sensitivity, calibration, and uncertainty developments, Aerosol Sci. Technol., 40, 697–708, https://doi.org/10.1080/02786820600803917, 2006.
Liu, D., Allan, J. D., Young, D. E., Coe, H., Beddows, D., Fleming, Z. L., Flynn, M. J., Gallagher, M. W., Harrison, R. M., Lee, J., Prevot, A. S. H., Taylor, J. W., Yin, J., Williams, P. I., and Zotter, P.: Size distribution, mixing state and source apportionment of black carbon aerosol in London during wintertime, Atmos. Chem. Phys., 14, 10061–10084, https://doi.org/10.5194/acp-14-10061-2014, 2014.
Liu, D., Taylor, J. W., Young, D. E., Flynn, M. J., Coe, H., and Allan, J. D.: The effect of complex black carbon microphysics on the determination of the optical properties of brown carbon, Geophys. Res. Lett., 42, 613–619, https://doi.org/10.1002/2014gl062443, 2015a.
Liu, S., Aiken, A. C., Gorkowski, K., Dubey, M. K., Cappa, C. D., Williams, L. R., Herndon, S. C., Massoli, P., Fortner, E. C., Chhabra, P. S., Brooks, W. A., Onasch, T. B., Jayne, J. T., Worsnop, D. R., China, S., Sharma, N., Mazzoleni, C., Xu, L., Ng, N. L., Liu, D., Allan, J. D., Lee, J. D., Fleming, Z. L., Mohr, C., Zotter, P., Szidat, S., and Prevot, A. S. H.: Enhanced light absorption by mixed source black and brown carbon particles in uk winter, Nat. Commun., 6, 8435, https://doi.org/10.1038/ncomms9435, 2015b.
Liu, D., Whitehead, J., Alfarra, M. R., Reyes-Villegas, E., Spracklen Dominick V., Reddington, C. L., Kong, S., Williams, P. I., Ting, Y.-C., Haslett, S., Taylor, J. W., Flynn, M. J., Morgan, W. T., McFiggans, G., Coe, H., and Allan, J. D.: Black-carbon absorption enhancement in the atmosphere determined by particle mixing state, Nat. Geosci., 10, 184–188, https://doi.org/10.1038/ngeo2901, 2017.
Moffet, R. C., O'Brien, R. E., Alpert, P. A., Kelly, S. T., Pham, D. Q., Gilles, M. K., Knopf, D. A., and Laskin, A.: Morphology and mixing of black carbon particles collected in central California during the CARES field study, Atmos. Chem. Phys., 16, 14515–14525, https://doi.org/10.5194/acp-16-14515-2016, 2016.
Moosmüller, H., Chakrabarty, R. K., Ehlers, K. M., and Arnott, W. P.: Absorption Ångström coefficient, brown carbon, and aerosols: basic concepts, bulk matter, and spherical particles, Atmos. Chem. Phys., 11, 1217–1225, https://doi.org/10.5194/acp-11-1217-2011, 2011.
Moteki, N. and Kondo, Y.: Dependence of laser-induced incandescence on physical properties of black carbon aerosols: Measurements and theoretical interpretation, Aerosol Sci. Technol., 44, 663–675, https://doi.org/10.1080/02786826.2010.484450, 2010.
Moteki, N., Kondo, Y., and Nakamura, S.-I.: Method to measure refractive indices of small nonspherical particles: Application to black carbon particles, J. Aerosol Sci., 41, 513–521, https://doi.org/10.1016/j.jaerosci.2010.02.013, 2010.
Müller, T., Henzing, J. S., de Leeuw, G., Wiedensohler, A., Alastuey, A., Angelov, H., Bizjak, M., Collaud Coen, M., Engström, J. E., Gruening, C., Hillamo, R., Hoffer, A., Imre, K., Ivanow, P., Jennings, G., Sun, J. Y., Kalivitis, N., Karlsson, H., Komppula, M., Laj, P., Li, S.-M., Lunder, C., Marinoni, A., Martins dos Santos, S., Moerman, M., Nowak, A., Ogren, J. A., Petzold, A., Pichon, J. M., Rodriquez, S., Sharma, S., Sheridan, P. J., Teinilä, K., Tuch, T., Viana, M., Virkkula, A., Weingartner, E., Wilhelm, R., and Wang, Y. Q.: Characterization and intercomparison of aerosol absorption photometers: result of two intercomparison workshops, Atmos. Meas. Tech., 4, 245–268, https://doi.org/10.5194/amt-4-245-2011, 2011.
Ng, N. L., Herndon, S. C., Trimborn, A., Canagaratna, M. R., Croteau, P. L., Onasch, T. B., Sueper, D., Worsnop, D. R., Zhang, Q., Sun, Y. L., and Jayne, J. T.: An aerosol chemical speciation monitor (ACSM) for routine monitoring of the composition and mass concentrations of ambient aerosol, Aerosol Sci. Technol., 45, 780–794, https://doi.org/10.1080/02786826.2011.560211, 2011.
Nordmann, S., Birmili, W., Weinhold, K., Müller, K., Spindler, G., and Wiedensohler, A.: Measurements of the mass absorption cross section of atmospheric soot particles using Raman spectroscopy, J. Geophys. Res.-Atmos., 118, 12075–12085, https://doi.org/10.1002/2013jd020021, 2013.
Peng, J., Hu, M., Guo, S., Du, Z., Zheng, J., Shang, D., Levy Zamora, M., Zeng, L., Shao, M., Wu, Y.-S., Zheng, J., Wang, Y., Glen, C. R., Collins, D. R., Molina, M. J., and Zhang, R.: Markedly enhanced absorption and direct radiative forcing of black carbon under polluted urban environments, P. Natl. Acad. Sci. USA, 113, 4266–71, https://doi.org/10.1073/pnas.1602310113, 2016.
Petzold, A. and Schönlinner, M.: Multi-angle absorption photometry – a new method for the measurement of aerosol light absorption and atmospheric black carbon, J. Aerosol Sci., 35, 421–441, https://doi.org/10.1016/j.jaerosci.2003.09.005, 2004.
Petzold, A., Ogren, J. A., Fiebig, M., Laj, P., Li, S.-M., Baltensperger, U., Holzer-Popp, T., Kinne, S., Pappalardo, G., Sugimoto, N., Wehrli, C., Wiedensohler, A., and Zhang, X.-Y.: Recommendations for reporting ”black carbon” measurements, Atmos. Chem. Phys., 13, 8365–8379, https://doi.org/10.5194/acp-13-8365-2013, 2013.
Pileci, R. E., Modini, R. L., Bertò, M., Yuan, J., Corbin, J. C., Marinoni, A., Henzing, B. J., Moerman, M. M., Putaud, J. P., Spindler, G., Wehner, B., Müller, T., Tuch, T., Trentini, A., Zanatta, M., Baltensperger, U., and Gysel-Beer, M.: Comparison of co–located rBC and EC mass concentration measurements during field campaigns at several European sites, Atmos. Meas. Tech. Discuss., https://doi.org/10.5194/amt-2020-192, in review, 2020.
Pöschl, U.: Aerosol particle analysis: Challenges and progress, Anal. Bioanal. Chem., 375, 30–32, https://doi.org/10.1007/s00216-002-1611-5, 2003.
Poulain, L., Birmili, W., Canonaco, F., Crippa, M., Wu, Z. J., Nordmann, S., Spindler, G., Prévôt, A. S. H., Wiedensohler, A., and Herrmann, H.: Chemical mass balance of 300 ∘C non-volatile particles at the tropospheric research site Melpitz, Germany, Atmos. Chem. Phys., 14, 10145–10162, https://doi.org/10.5194/acp-14-10145-2014, 2014.
Qiu, C., Khalizov, A. F., and Zhang, R.: Soot aging from oh-initiated oxidation of toluene, Environ. Sci. Technol., 46, 9464–9472, https://doi.org/10.1021/es301883y, 2012.
Riemer, N., Ault, A. P., West, M., Craig, R. L., and Curtis, J. H.: Aerosol mixing state: Measurements, modeling, and impacts, Rev. Geophys., 57, 187–249, https://doi.org/10.1029/2018rg000615, 2019.
Schnaiter, M., Linke, C., Mohler, O., Naumann, K. H., Saathoff, H., Wagner, R., Schurath, U., and Wehner, B.: Absorption amplification of black carbon internally mixed with secondary organic aerosol, J. Geophys. Res., 110, D19204, https://doi.org/10.1029/2005jd006046, 2005.
Schneider, I. L., Teixeira, E. C., Silva Oliveira, L. F., and Wiegand, F.: Atmospheric particle number concentration and size distribution in a traffic-impacted area, Atmos. Pollut. Res., 6, 877–885, https://doi.org/10.5094/apr.2015.097, 2015.
Schwarz, J. P., Gao, R. S., Fahey, D. W., Thomson, D. S., Watts, L. A., Wilson, J. C., Reeves, J. M., Darbeheshti, M., Baumgardner, D. G., Kok, G. L., Chung, S. H., Schulz, M., Hendricks, J., Lauer, A., Kärcher, B., Slowik, J. G., Rosenlof, K. H., Thompson, T. L., Langford, A. O., Loewenstein, M., and Aikin, K. C.: Single-particle measurements of midlatitude black carbon and light-scattering aerosols from the boundary layer to the lower stratosphere, J. Geophys. Res., 111, D16207, https://doi.org/10.1029/2006jd007076, 2006.
Schwarz, J. P., Spackman, J. R., Fahey, D. W., Gao, R. S., Lohmann, U., Stier, P., Watts, L. A., Thomson, D. S., Lack, D. A., Pfister, L., Mahoney, M. J., Baumgardner, D., Wilson, J. C., and Reeves, J. M.: Coatings and their enhancement of black carbon light absorption in the tropical atmosphere, J. Geophys. Res., 113, D03203, https://doi.org/10.1029/2007jd009042, 2008.
Schwarz, J. P., Spackman, J. R., Gao, R. S., Perring, A. E., Cross, E., Onasch, T. B., Ahern, A., Wrobel, W., Davidovits, P., Olfert, J., Dubey, M. K., Mazzoleni, C., and Fahey, D. W.: The detection efficiency of the single particle soot photometer, Aerosol Sci. Technol., 44, 612–628, https://doi.org/10.1080/02786826.2010.481298, 2010.
Shiraiwa, M., Kondo, Y., Iwamoto, T., and Kita, K.: Amplification of light absorption of black carbon by organic coating, Aerosol Sci. Technol., 44, 46–54, https://doi.org/10.1080/02786820903357686, 2010.
Slowik, J. G., Cross, E. S., Han, J.-H., Davidovits, P., Onasch, T. B., Jayne, J. T., Williams, L. R., Canagaratna, M. R., Worsnop, D. R., Chakrabarty, R. K., Moosmüller, H., Arnott, W. P., Schwarz, J. P., Gao, R.-S., Fahey, D. W., Kok, G. L., and Petzold, A.: An inter-comparison of instruments measuring black carbon content of soot particles, Aerosol Sci. Technol., 41, 295–314, https://doi.org/10.1080/02786820701197078, 2007.
Spindler, G., Brüggemann, E., Gnauk, T., Grüner, A., Müller, K., and Herrmann, H.: A four-year size-segregated characterization study of particles PM10, PM2.5 and PM1 depending on air mass origin at Melpitz, Atmos. Environ., 44, 164–173, https://doi.org/10.1016/j.atmosenv.2009.10.015, 2010.
Spindler, G., Grüner, A., Müller, K., Schlimper, S., and Herrmann, H.: Long-term size-segregated particle (PM10, PM2.5, PM1) characterization study at melpitz – influence of air mass inflow, weather conditions and season, J. Atmos. Chem., 70, 165–195, https://doi.org/10.1007/s10874-013-9263-8, 2013.
Stein, A. F., Draxler, R. R., Rolph, G. D., Stunder, B. J. B., Cohen, M. D., and Ngan, F.: NOAA's HYSPLIT atmospheric transport and dispersion modeling system, B. Am. Meteor. Soc., 96, 2059–2077, https://doi.org/10.1175/bams-d-14-00110.1, 2015.
Stephens, M., Turner, N., and Sandberg, J.: Particle identification by laser-induced incandescence in a solid-state laser cavity, Appl. Opt., 42, 3726–3736, https://doi.org/10.1364/AO.42.003726, 2003.
Taylor, J. W., Allan, J. D., Liu, D., Flynn, M., Weber, R., Zhang, X., Lefer, B. L., Grossberg, N., Flynn, J., and Coe, H.: Assessment of the sensitivity of core / shell parameters derived using the single-particle soot photometer to density and refractive index, Atmos. Meas. Tech., 8, 1701–1718, https://doi.org/10.5194/amt-8-1701-2015, 2015.
Ueda, S., Nakayama, T., Taketani, F., Adachi, K., Matsuki, A., Iwamoto, Y., Sadanaga, Y., and Matsumi, Y.: Light absorption and morphological properties of soot-containing aerosols observed at an East Asian outflow site, Noto Peninsula, Japan, Atmos. Chem. Phys., 16, 2525–2541, https://doi.org/10.5194/acp-16-2525-2016, 2016.
van de Hulst, H. C.: Light scattering by small particles, J. Wiley, Chapman and Hall, New York, 1957.
Wei, Y., Ma, L., Cao, T., Zhang, Q., Wu, J., Buseck, P. R., and Thompson, J. E.: Light scattering and extinction measurements combined with laser-induced incandescence for the real-time determination of soot mass absorption cross section, Anal Chem, 85, 9181–9188, https://doi.org/10.1021/ac401901b, 2013.
Willis, M. D., Lee, A. K. Y., Onasch, T. B., Fortner, E. C., Williams, L. R., Lambe, A. T., Worsnop, D. R., and Abbatt, J. P. D.: Collection efficiency of the soot-particle aerosol mass spectrometer (SP-AMS) for internally mixed particulate black carbon, Atmos. Meas. Tech., 7, 4507–4516, https://doi.org/10.5194/amt-7-4507-2014, 2014.
Yuan, J., Modini, R. L., Zanatta, M., Herber, A. B., Mueller, T., Wehner, B., Poulain, L., Tuch, T., Baltensperger, U., and Gysel-Beer, M.: Data archive for the peer-reviewed journal article “Variability in the mass absorption cross-section of black carbon (BC) aerosols is driven by BC internal mixing state at a central European background site (Melpitz, Germany) in winter”, Zenodo, https://doi.org/10.5281/zenodo.4290328, 2020.
Zanatta, M., Gysel, M., Bukowiecki, N., Müller, T., Weingartner, E., Areskoug, H., Fiebig, M., Yttri, K. E., Mihalopoulos, N., Kouvarakis, G., Beddows, D., Harrison, R. M., Cavalli, F., Putaud, J. P., Spindler, G., Wiedensohler, A., Alastuey, A., Pandolfi, M., Sellegri, K., Swietlicki, E., Jaffrezo, J. L., Baltensperger, U., and Laj, P.: A european aerosol phenomenology-5: Climatology of black carbon optical properties at 9 regional background sites across Europe, Atmos. Environ., 145, 346–364, https://doi.org/10.1016/j.atmosenv.2016.09.035, 2016.
Zanatta, M., Laj, P., Gysel, M., Baltensperger, U., Vratolis, S., Eleftheriadis, K., Kondo, Y., Dubuisson, P., Winiarek, V., Kazadzis, S., Tunved, P., and Jacobi, H.-W.: Effects of mixing state on optical and radiative properties of black carbon in the European Arctic, Atmos. Chem. Phys., 18, 14037–14057, https://doi.org/10.5194/acp-18-14037-2018, 2018.
Zhang, X., Mao, M., Yin, Y., and Wang, B.: Absorption enhancement of aged black carbon aerosols affected by their microphysics: A numerical investigation, J. Quant. Spectros. Rad. Trans., 202, 90–97, https://doi.org/10.1016/j.jqsrt.2017.07.025, 2017.
Zhang, Y., Favez, O., Canonaco, F., Liu, D., Močnik, G., Amodeo, T., Sciare, J., Prévôt, A. S. H., Gros, V., and Albinet, A.: Evidence of major secondary organic aerosol contribution to lensing effect black carbon absorption enhancement, Npj Clim. Atmos. Sci., 1, 47, https://doi.org/10.1038/s41612-018-0056-2, 2018.
Zotter, P., Herich, H., Gysel, M., El-Haddad, I., Zhang, Y., Močnik, G., Hüglin, C., Baltensperger, U., Szidat, S., and Prévôt, A. S. H.: Evaluation of the absorption Ångström exponents for traffic and wood burning in the Aethalometer-based source apportionment using radiocarbon measurements of ambient aerosol, Atmos. Chem. Phys., 17, 4229–4249, https://doi.org/10.5194/acp-17-4229-2017, 2017.