the Creative Commons Attribution 4.0 License.
the Creative Commons Attribution 4.0 License.
 | 27 Apr 2021
Contributions to OH reactivity from unexplored volatile organic compounds measured by PTR-ToF-MS – a case study in a suburban forest of the Seoul metropolitan area during the Korea–United States Air Quality Study (KORUS-AQ) 2016
Dianne Sanchez
Roger Seco
Alex Guenther
John Mak
Youngjae Lee
Danbi Kim
Joonyoung Ahn
Don Blake
Scott Herndon
Daun Jeong
John T. Sullivan
Thomas Mcgee
Rokjin Park
We report OH reactivity observations by a chemical ionization mass spectrometer–comparative reactivity method (CIMS-CRM) instrument in a suburban forest of the Seoul metropolitan area (SMA) during the Korea–United States Air Quality Study (KORUS-AQ 2016) from mid-May to mid-June of 2016. A comprehensive observational suite was deployed to quantify reactive trace gases inside of the forest canopy including a high-resolution proton transfer reaction time-of-flight mass spectrometer (PTR-ToF-MS). An average OH reactivity of 30.7±5.1 s−1 was observed, while the OH reactivity calculated from CO, NO+NO2 (NOx), ozone (O3), sulfur dioxide (SO2), and 14 volatile organic compounds (VOCs) was 11.8±1.0 s−1. An analysis of 346 peaks from the PTR-ToF-MS accounted for an additional 6.0±2.2 s−1 of the total measured OH reactivity, leaving 42.0 % missing OH reactivity. A series of analyses indicate that the missing OH reactivity most likely comes from VOC oxidation products of both biogenic and anthropogenic origin.
- Article
(3557 KB) - Full-text XML
-
Supplement
(1806 KB) - BibTeX
- EndNote


Total OH reactivity (s−1), the inverse of OH lifetime, is a measure of the total amount of reactive trace gases in the atmosphere on the scale of reactivity, which allow us to quantitatively evaluate our ability to constrain trace gases by comparing measurements of total OH reactivity with the OH reactivity calculated from a speciated reactive-gas measurement dataset. The fraction of observed OH reactivity that cannot be reconciled by calculated OH reactivity is known as “missing OH reactivity” (Di Carlo et al., 2004; Goldstein and Galbally, 2007; Yang et al., 2016). A substantial amount of missing OH reactivity has consistently been reported in forest environments (30 %–80 %). Di Carlo et al. (2004) conducted a study in a mixed forest near Pellston, Michigan, where they reported missing OH reactivity (∼30 %) larger than observational uncertainty. The authors concluded that the missing sources of reactivity were primary biogenic volatile organic compound (biogenic VOC, BVOC) emissions, as the degree of missing OH reactivity followed the temperature dependence of terpenoid emissions. In a boreal forest in Hyytiälä, Finland, Sinha et al. (2010) report a similar result with observed trace gases that account for only 50 % of the measured OH reactivity. They argued that oxidation products of BVOCs alone could not account for the missing OH reactivity. Thus, they also concluded that primary emissions were more likely to be the source of missing OH reactivity, and they further suggest that this could be the result of the contribution of small amounts of many reactive gases. Follow-up studies (Nölscher et al., 2012; Praplan et al., 2019) at the same site have presented a consistent conclusion. Nölscher et al. (2012) observed the highest level of missing OH reactivity during a heat wave episode, possibly inducing a stress emission response from the local forest. A comprehensive analysis by Praplan et al. (2019) using a long-term observation dataset and a photochemical model framework with the Master Chemical Mechanism illustrates that the model-simulated oxidation compound contribution can only contribute 7 % of missing OH reactivity.
On the other hand, some studies have attributed the sources of the missing OH reactivity to unmeasured oxidation products of well-characterized BVOCs. Edwards et al. (2013) measured OH reactivity in a pristine tropical forest in the Sabah region of Borneo during the “Oxidant and particle photochemical processes” (OP3) field campaign (Hewitt et al., 2010). This study implemented the Master Chemical Mechanism (MCMv3.2) (Saunders et al., 2003; Jenkin et al., 1997) into a box model framework to quantify potential contributions from unmeasured oxidation products. The model was constrained with VOCs such as isoprene, monoterpenes, and alkanes and alkenes and other observed trace gases such as NO+NO2 (NOx) and ozone (O3). The authors reported that the model-simulated oxygenated VOCs (OVOCs) could contribute 47.1 % of the calculated OH reactivity – surpassing the contribution from isoprene, the primary emission of this ecosystem. It is notable that 30 % of observed OH reactivity could not be accounted for by the box model simulations. After examining the comprehensive observational suite of VOCs, the authors determined that the most significant missing sources of OH reactivity were likely secondary multifunctional carbon compounds rather than primary BVOC emissions. Hansen et al. (2014) suggested that their observed missing OH reactivity was likely from unmeasured oxidation products during the Community Atmosphere–Biosphere INteractions EXperiments (CABINEX 2009) in Michigan. This notion was also consistent with findings reported by Kim et al. (2011), who measured OH reactivity of branch enclosures from four representative tree species in the forest canopy during the CABINEX study. They reconciled most of the measured OH reactivity of four representative tree species with well-known BVOCs, such as isoprene and monoterpenes. Finally, Nakashima et al. (2014) reported that 29.5 % OH reactivity could not be reconciled by the speciated trace gas dataset during the Bio-hydro-atmosphere interactions of Energy, Aerosols, Carbon, H2O, Organics and Nitrogen-Southern Rocky Mountain 2008 (BEACHON-SMR08) field campaign (Ortega et al., 2014). The campaign took place at the Manitou Experimental Forest (MEF) in Colorado, a ponderosa pine plantation dominated by primary BVOC emissions of 2-methyl-3-butene-2-ol (232-MBO) and monoterpenes (Ortega et al., 2014). The authors also reported that the missing OH reactivity was likely from BVOC oxidation products. In the same context, Kim et al. (2010) conducted proton transfer reaction mass spectrometer (PTR-MS) mass spectrum analysis for both ambient air and branch enclosures at the MEF site. They reported more conspicuous unidentified signals on PTR-MS mass spectra in the ambient samples than on those from branch enclosure samples at this site.
During the Southern Oxidant and Aerosol Study (SOAS) in 2013, Kaiser et al. (2016) used a comprehensive suite of VOC measurements at an isoprene-dominant forest site in the southeastern USA to examine the role of the OVOC species in missing reactive carbon. The authors used MCMv3.2 embedded in the University of Washington Chemical Model (UWCM) to compare OH reactivity from model-generated OVOCs to OH reactivity from measurements of OVOCs. There was no significant discrepancy between the average measured and calculated OH reactivity including observed trace gases and model-calculated oxidation products of VOCs. However, it was noted that a small portion (1 s−1) of observed OH reactivity could not be reconciled by the model calculation. As this fraction was not correlated to isoprene oxidation products, it was suggested that the missing OH reactivity may be due to unmeasured primary emissions. One caveat of this analysis pointed out by the authors was that the concentrations of the modeled first-generation isoprene oxidation products (e.g., MVK, MACR, isoprene hydroxy hydroperoxides – ISOPOOH, isoprene nitrates – ISOPN, and hydroperoxy aldehydes – HPALD) were significantly overpredicted in the afternoon. Consequently, the uncertainty in the model calculation is likely to be much higher for the multi-generation oxidation products and their contributions to the OH reactivity contributions. This result highlights the uncertainty in relying solely on box model results to assess OH reactivity. This status quo urges us to take a convergent approach by effectively integrating observational results from novel instrumentation and model outcomes.
This study examines the OH reactivity observations at the Taehwa Research Forest (TRF) supersite from 15 May to 7 June 2016 during the Korea–United States Air Quality Study 2016 (KORUS-AQ 2016) campaign. TRF (37∘18′19.08′′ N, 127∘19′7.12′′ E; 162 m altitude) is operated by Seoul National University and located in Gwangju in Gyeonggi Province in South Korea (Kim et al., 2013b). The site is about 35 km southeast from the center of Seoul and borders the greater Seoul metropolitan area (SMA) with its population of 25.6 million. This geographical proximity to the SMA results in a significant level of anthropogenic influence, particularly in terms of elevated NOx (Kim et al., 2016). Additionally, occasional pollution transport events occur at regional scales. Previous studies at the site have consistently highlighted the importance of BVOC photochemistry at TRF (Kim et al., 2013a, 2015, 2016). Isoprene and monoterpenes are the dominant OH sinks at the site among observed VOCs. The elevated NOx accelerates the photochemical processing of VOCs (Kim et al., 2015). Thus, this site is an ideal natural laboratory to study contributions towards total OH reactivity from primary trace gas emissions from both natural and anthropogenic processes and their oxidation products. This motivated us to deploy a high-resolution proton transfer reaction time-of-flight mass spectrometer (PTR-ToF-MS) to quantify trace amounts of VOCs with unknown molecular structures by taking advantage of the universal sensitivity of hydronium ion chemistry towards reactive VOCs (Graus et al., 2010; Jordan et al., 2009). Therefore, we intend to observationally constrain the contributions of conventionally unidentified or unmeasured VOCs towards OH reactivity.
2.1 Field site
The Taehwa Research Forest is a Korean pine (Pinus koraiensis) plantation (300 m×300 m) surrounded by a deciduous forest dominated by oak trees (Kim et al., 2013b). A flux tower (40 m height) at the center of TRF has air-sampling inlets at multiple heights (4, 8 12, and 16 m) below the canopy top (20 m). Each inlet consists of Teflon tubing ( o.d.) with ∼1 s of residence time. The trace gas dataset including VOCs presented is the average of concentrations measured at the inlets inside of the canopy as previous studies illustrate that there is no substantial vertical VOC gradients inside of the canopy (within 3 %; Kim et al., 2013b). An air-conditioned instrument shack located at the base of the flux tower housed the PTR-ToF-MS for VOC measurements; a mini tunable infrared laser direct absorption spectroscopy (mini-TILDAS) instrument for HCHO, methane, and methanol measurements; and analyzers for carbon monoxide (CO), sulfur dioxide (SO2), ozone (O3), and meteorological measurements. The OH reactivity and NOx analyzers were located in another nearby air-conditioned shack (3 m apart) and sampled air through an extended Teflon inlet line of 4 m ( o.d.) from the ground with a flow rate of 4 slpm resulting in a 0.5 s residence time. The height of the ambient air intake was 3.5 m. The analytical characteristics of the instrumentation suite are summarized in Table 1. A ceilometer backscattering characterized boundary layer vertical structure at the site. The ceilometer analysis described by Sullivan et al. (2019) reveals the diurnal boundary layer height evolution, indicating a maximum in the afternoon around 1–3 km and a minimum in the early morning below 500 m.
2.2 OH reactivity measurements
A chemical ionization mass spectrometer–comparative reactivity method (CIMS-CRM) instrument was used to measure OH reactivity. The University of California, Irvine (UCI) CIMS-CRM system includes a chemical ionization mass spectrometer with a hydronium reagent ion. The CRM measures total OH reactivity by quantifying the relative loss of pyrrole, a highly reactive gas ( at 298 K; Dillon et al., 2012) that is rarely found in the atmosphere (Sinha et al., 2008). Nitrogen gas flows through a bubbler full of ultrapure-liquid chromatography mass spectrometer (LC-MS)-grade water to produce water vapor. The water vapor then flows into a glass reactor where it is photolyzed into OH radicals by a mercury lamp (Pen-Ray® Light Source P/N 90-0012-01). The measurement uncertainty is 16.7 % (1σ) with a limit of detection of 4.5 s−1 over 2 min (3σ).
The UCI CIMS-CRM instrument has been deployed on multiple occasions, including in the Megacity Air Pollution Study (MAPS)-Seoul 2015 campaign that incorporated previous measurements at the TRF ground site during September 2015 (Sanchez et al., 2018; Kim et al., 2016). During the SOAS 2013 campaign, an ambient OH reactivity intercomparison study was conducted with a laser-induced fluorescence (LIF) system (Sanchez et al., 2018). The instrument intercomparison showed that the OH reactivity measurements from the CRM and LIF instruments generally agreed within the analytical uncertainty. An average of a 16 % difference between the techniques was noted in the late afternoons when the CRM measurements were lower than those from LIF. As discussed in Sanchez et al. (2018), this is likely caused by the difference in sampling strategies, as the CRM measurements relied on a lengthy Teflon inlet (15 m), while the LIF directly sampled air at the top of a walk-up tower. As mentioned above, at TRF we used a shorter inlet line to minimize residence time and avoid inlet line loss.
An extensive intercomparison study was conducted by Fuchs et al. (2017) with various OH reactivity measurement techniques that highlighted potential analytical artifacts in the CRM technique. These artifacts have all been examined, and preventive measures have been implemented in the UCI CIMS-CRM system deployed at TRF. This included a laboratory-built catalytic converter (Pt wool at 350 ∘C) that minimized the interferences due to changes in air to prevent the interference from the difference in humidity for the zero-air characterizations. Hansen et al. (2015) illustrated that NOx may be generated from the catalytic converter. To prevent potential NOx interferences, they used a scrubber with Purafil and activated charcoal, which modulates the humidity in the sample. Our approach to this type of interference has been to determine the maximum NO level, noticeably interfering with the calibration regression line shown in Sanchez et al. (2018). Laboratory tests indicate that the statistical agreement started to veer off when the NO level was 5 ppb at 1σ of the linear regression between instrument response (unitless) and OH reactivity (s−1) as the slope for the calibration curve had changed from 0.238 to 0.246. In addition, Kim et al. (2016) achieved an OH reactivity budget closure in high-NO2 conditions, which implies no significant interferences from NO2. However, in response to the Fuchs et al. (2017) observation that various CRM configurations suffer from different levels of NOx interferences, we plan to conduct more systematic NOx interference tests to more accurately characterize this system. In conclusion, one should note that our reported OH reactivity could potentially underestimate actual ambient OH reactivity as much as the contributions from those from ambient NO2.
We consistently kept the pyrrole-to-OH ratio at 3:1 and so did not achieve a pseudo first-order relationship. Even in the field environment with various relative humidity, we have not observed noticeable changes in this ratio as we flow bulk humidified nitrogen (150 sccm min−1) to the reactor with a total flow of 240 sccm min−1, which results in dampening the temporal ambient relative humidity variations. Therefore, we performed multi-point calibrations (5 to 30 s−1) with a propene mixture using a National Institute of Standards and Technology traceable gas standard (Air Liquide LLC, 0.847 ppm) during the field campaign to avoid any circumstances where the pseudo first-order reaction regime is not established. Detailed calibration procedures for the OH reactivity system including laboratory multi-component calibration results can be found in Sanchez et al. (2018).
In addition, Fuchs et al. (2017) also described a potential interference from ambient O3 in some CRM systems. In the 2015 field campaigns conducted in Seoul, South Korea (Kim et al., 2016), we conducted a standard addition experiment for the propene standard for an additional ∼30 s−1 in two different ozone environments of 65 and 123 ppb. The outcome illustrates an agreement between two additions within the analytical uncertainty although a systematic laboratory study will warrant an accurate uncertainty assessment from ozone. Again, as the CRM is a relatively new technique, one should keep in mind that future studies may find potential artifacts that we do not report in this study.
2.3 PTR-ToF-MS measurements
A high-resolution PTR-ToF-MS (Ionicon Analytik GmbH) (de Gouw and Warneke, 2007; Jordan et al., 2009) was deployed at the TRF site. The instrument was operated with a drift tube temperature of 60 ∘C, 560 V drift voltage, and 2.27 mbar drift tube to maintain the field density ratio (E N) of 126 Td. Background checks were manually conducted about three times a day for a 10 min duration by scrubbing the ambient air through a catalytic convertor (Pt wool maintained at 350 ∘C). The detectable peaks from the ambient spectra were assessed by subtracting the background spectrum. The instrument was calibrated with a gas mixture manufactured by Apel Riemer Environmental Inc. The mixture contains ∼1 ppmv of acetaldehyde, acetone, isoprene, methyl vinyl ketone, methacrolein, benzene, methyl ethyl ketone, toluene, o-xylene, and α-pinene. This standard mixture was used only for the PTR-ToF-MS calibration and not for the CRM-CIMS calibration. The concentrations of the compounds were assessed in the laboratory of the Rowland–Blake Group at the University of California, Irvine, and members of this lab also conducted the airborne VOC analysis using whole-air samples during the KORUS-AQ campaign on the NASA DC-8 (Colman et al., 2001).
A mass range of 40 to 267 was analyzed from the recorded PTR-ToF-MS mass spectra. An automatic mass-scale calibration was conducted every 5 min on the data averaged over 30 s. The raw PTR-ToF-MS data were processed using the PTRwid software described by Holzinger (2015). We normalized the mass peaks by 106 reagent ion counts (H3O+). As the majority of the VOC mass peaks could not be directly calibrated, we determined the VOC sensitivities using Eq. (1). This method has been employed by a number of previous studies such as Cappellin et al. (2012). The benzene calibration factor was used to calculate mixing ratios by applying its proton transfer reaction rate coefficient (kbenzene, cm3 s−1) and sensitivity (sbenzene, ncps ppb−1) for the available compounds. The application of this equation can be justified since PTRwid provides the mass-discrimination-corrected counts as a final computational product.
where χVOC is the mixing ratio of an analyte, sbenzene is the assessed sensitivity of benzene (11.94 ncps ppb−1), cVOC is the mass-discrimination-corrected normalized count for an analyte, and kbenzene is the proton transfer reaction rate constant for benzene. kVOC is the proton transfer reaction rate constant for an analyte.
For the mass peaks where specific proton transfer reaction rates were unavailable, we estimated the mixing ratios by applying a proton transfer reaction rate coefficient () of cm3 s−1, the default value for PTRwid calculations. The spectra had a limit of detection of tens of parts per trillion for a 30 s average. The calibrated compounds had a range of detection limits as low as 3.7 ppt for α-pinene and as high as 48 ppt for toluene.
2.4 OH reactivity calculation
OH reactivity was calculated from the concentrations of all the compounds observed by the instrumental suite described in Table 1. The original data can be found in the KORUS-AQ 2016 data archive at https://www-air.larc.nasa.gov/missions/korus-aq/ (last access: 29 March 2021). A total of 360 mass peaks measured by the PTR-ToF-MS were analyzed above the background (3σ or above) to assess their contribution to the calculated OH reactivity. Fourteen of the mass peaks were identified as VOCs commonly reported for PTR-MS measurements (Table 1), leaving 346 unidentified peaks. These remaining mass peaks were grouped into three categories in order to estimate their possible OH reactivity contribution.
Table 1Description of instrument and measured parameters.
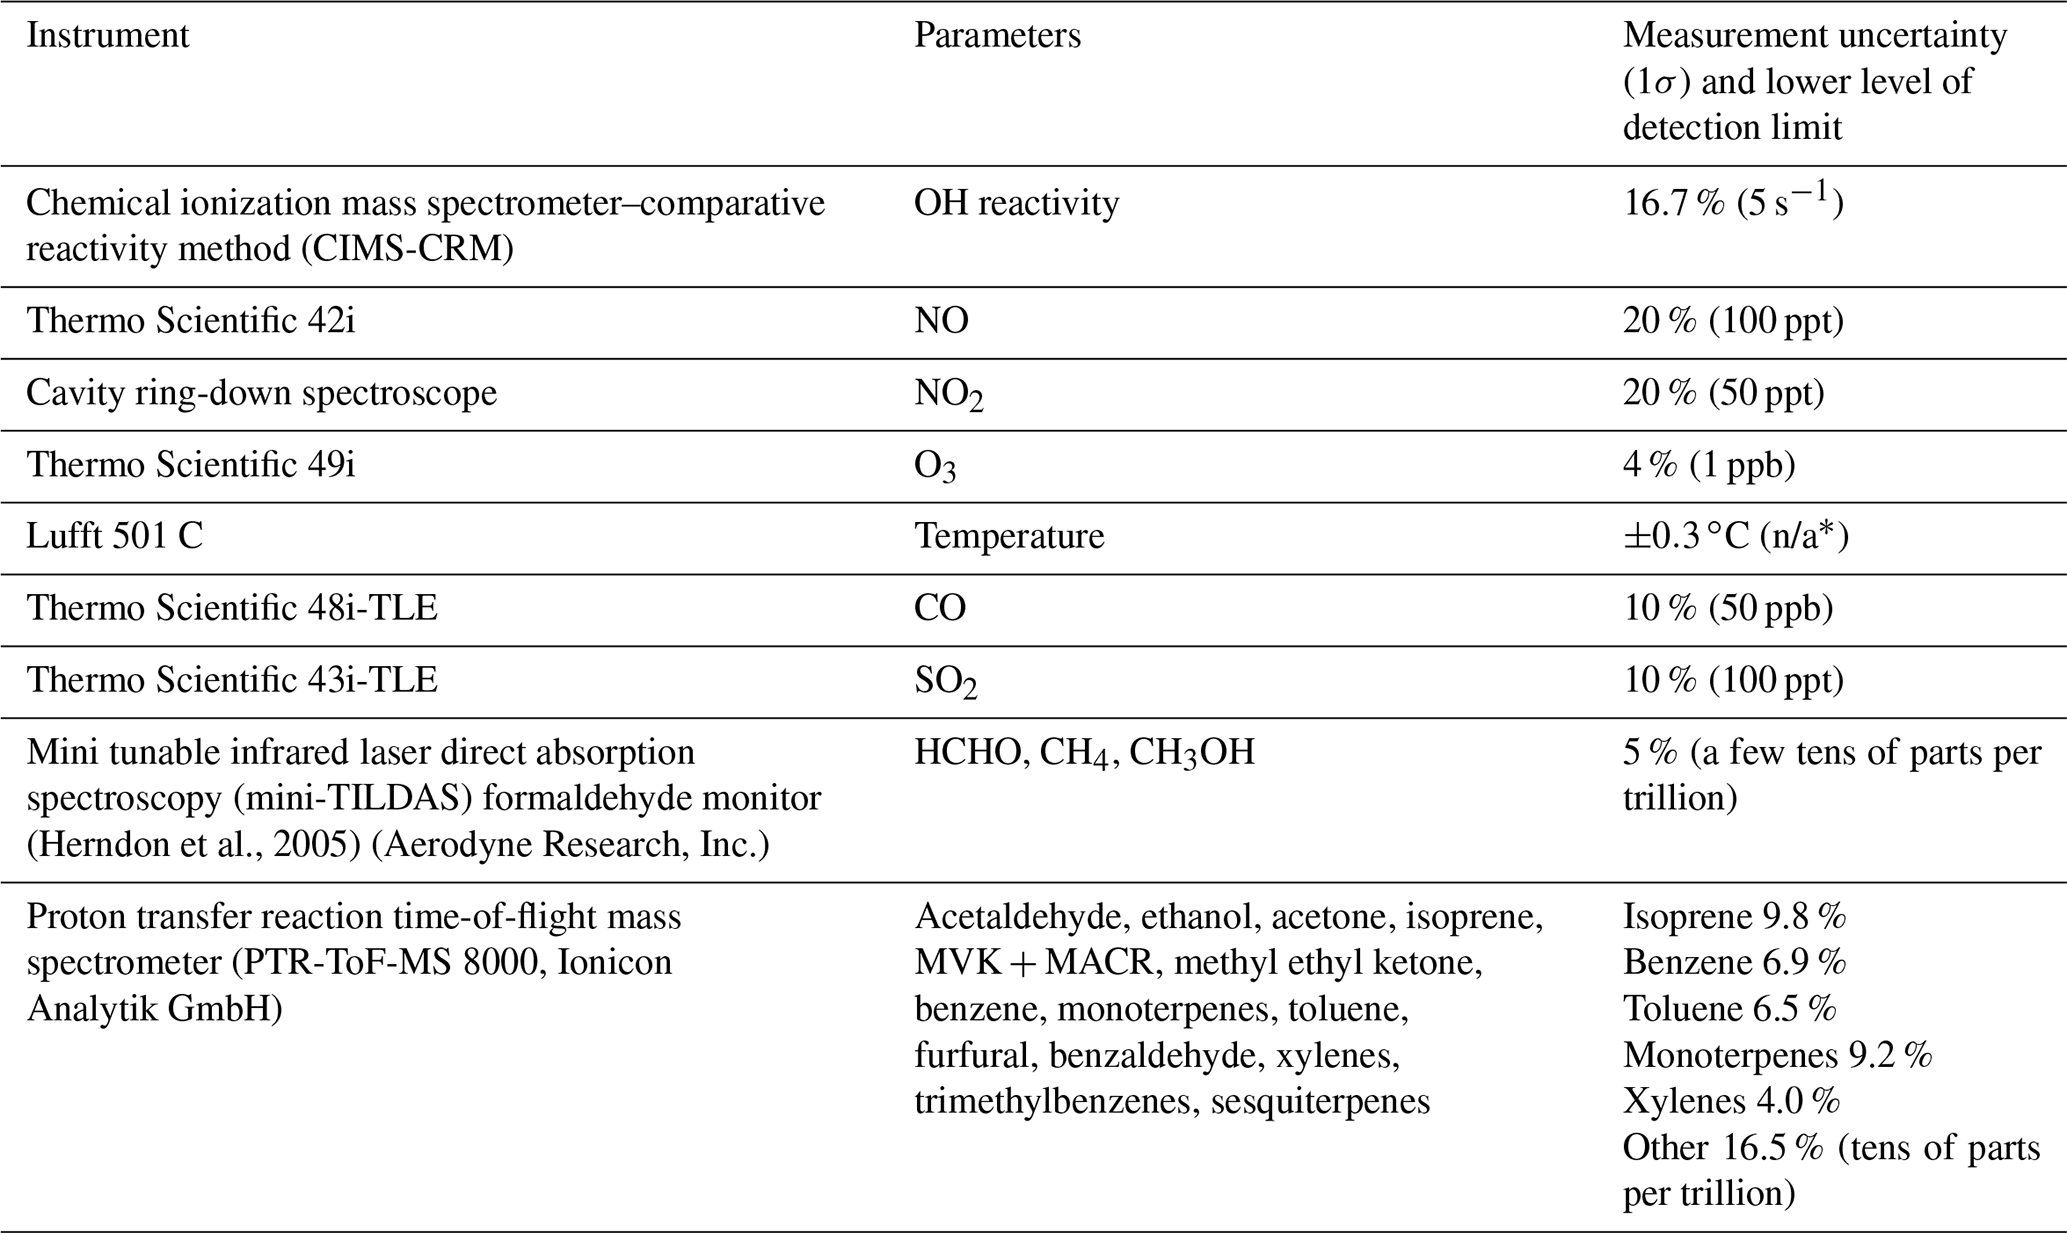
* n/a stands for not applicable.
Category I (81 peaks) included mass peaks for which the PTRwid software calculated a molecular formula. OH reaction rate coefficients for the individual peaks were obtained from the NIST WebBook library. As the only information we have is the molecular composition, we identified multiple isomers with different functional groups and thus different reactivity. We have extensively reviewed previous publications (Williams et al., 2001; De Gouw et al., 2003; de Gouw and Warneke, 2007; Jordan et al., 2009; Ruuskanen et al., 2011; Müller et al., 2012; Koss et al., 2017) identifying ambient VOCs using PTR-MS with both quadrupole and time-of-flight systems to identify possible compounds. For example, for the of 75.043, there are four possible compounds including hydroxy acetone, propionic acid, methyl acetate, and ethyl formate. We used the median reaction constant for the set of possible compounds. The detailed description of the OH reaction constant determination process for the Category I peaks is described in Sanchez (2019). If the information was unavailable from the NIST WebBook database, a structure–reactivity relationship described by Kwok and Atkinson (1995) was applied to obtain reaction rate coefficients. This is an empirical calculation system to estimate kOH based upon the number of carbons and the functional groups of given VOCs. The framework is able to calculate kOH within a factor of 2 according to a thorough assessment presented in Kwok and Atkinson (1995). However, the authors discourage the application of the framework to compounds that were not examined in the study such as halogenated compounds. Although halogenated compounds are not included in this study, one should be aware of a potentially significant uncertainty.
Category II (28 peaks) included mass peaks for which the PTRwid software could not assess an exact molecular composition due to uncertainty in the data processing system. Nonetheless, this group of compounds illustrated a positive correlation (R2 is 0.19 to 0.88) with either anthropogenic (benzene, toluene) or biogenic (MVK + MACR and monoterpenes) VOCs. Category II compounds are further grouped into subcategories corresponding to these two main VOC sources. OH reaction rate constants (kOH) were estimated with equations based on the relationship between the and the kOH of compounds in Table 1 (Fig. S1 in the Supplement). More specifically, we assume that kOH is linearly correlated with . To apply this linear relationship, the compounds with known kOH were grouped into five bins and the average kOH of each bin was calculated. The green triangles represent five -binned averages from these compounds plotted with their respective average kOH. This approach can be justified by the fact that the reaction constants of VOCs towards OH tend to increase as a function of molecular mass within functional groups (Kwok and Atkinson, 1995; Atkinson, 1987). The y intercepts of the linear regressions were assessed using the kOH values of the biogenic or anthropogenic compounds and their masses.
Category III (237 peaks) included mass peaks with very low mixing ratios (average is 4.8±19.5 ppt) that were above the limit of detection. We applied a kOH value corresponding to the dark green best-fit line in Fig. S1 to these peaks. The y intercept of the dark green line was based on that of acetaldehyde, as it was the lowest mass compound used for the OH reactivity calculations in this study.
There are two components that need to be considered for the assessment of uncertainty associated with calculated OH reactivity: the concentration and the reaction constants with OH. The uncertainty in the observed trace gases is in the range of 5 % to 20 % as shown in Table 1 and is associated with the rate constants from laboratory experiments (Atkinson et al., 2006). Combining 15 % uncertainty from reaction constants and 13.5 % from trace gas observations results in 20 % of uncertainty in calculated OH reactivity. This should be considered a conservative estimate as most VOC concentrations and associated rate constants are empirically estimated.
An average OH reactivity of 30.7±5.1 s−1 was observed from 15 May–7 June 2016 (Fig. 1). This was within the range of OH reactivity observed in urban regions (10–33 s−1) (Kovacs et al., 2003; Ren et al., 2003; Sinha et al., 2008; Dolgorouky et al., 2012; Whalley et al., 2016; Kim et al., 2016; Yang et al., 2017) and in the range of previously reported observations and model calculations at the TRF site (∼15–35 s−1) (Kim et al., 2015, 2016). The total calculated OH reactivity of 11.8±1.0 s−1 from the measured compounds in Table 1 resulted in 63.3 % missing OH reactivity. Again, the potential underestimation in ambient OH reactivity as much as the contributions from ambient NO2, presented in the Methods section, should be well noted. However, an additional OH reactivity of 6.0±2.2 s−1 was further calculated from the reactivity of the VOCs in categories I–III. The contribution lowered the missing OH reactivity level to 42 % of the measured OH reactivity. Kim et al. (2016) had previously measured an average OH reactivity of 16.5 s−1 at TRF during the MAPS-Seoul campaign from 1–15 September 2015, a substantially lower level than what we report during this springtime study. Although small alkanes and alkenes such as ethane, ethene, propane, and propene were not observed on the site, we utilized the dataset from the NASA DC-8 that flew at 700 m above the site, which indicates that their contribution was consistently small (∼0.7 s−1 on average). In this suburban forest, we do not think there are any substantial emission sources of these relatively long-lived VOCs.
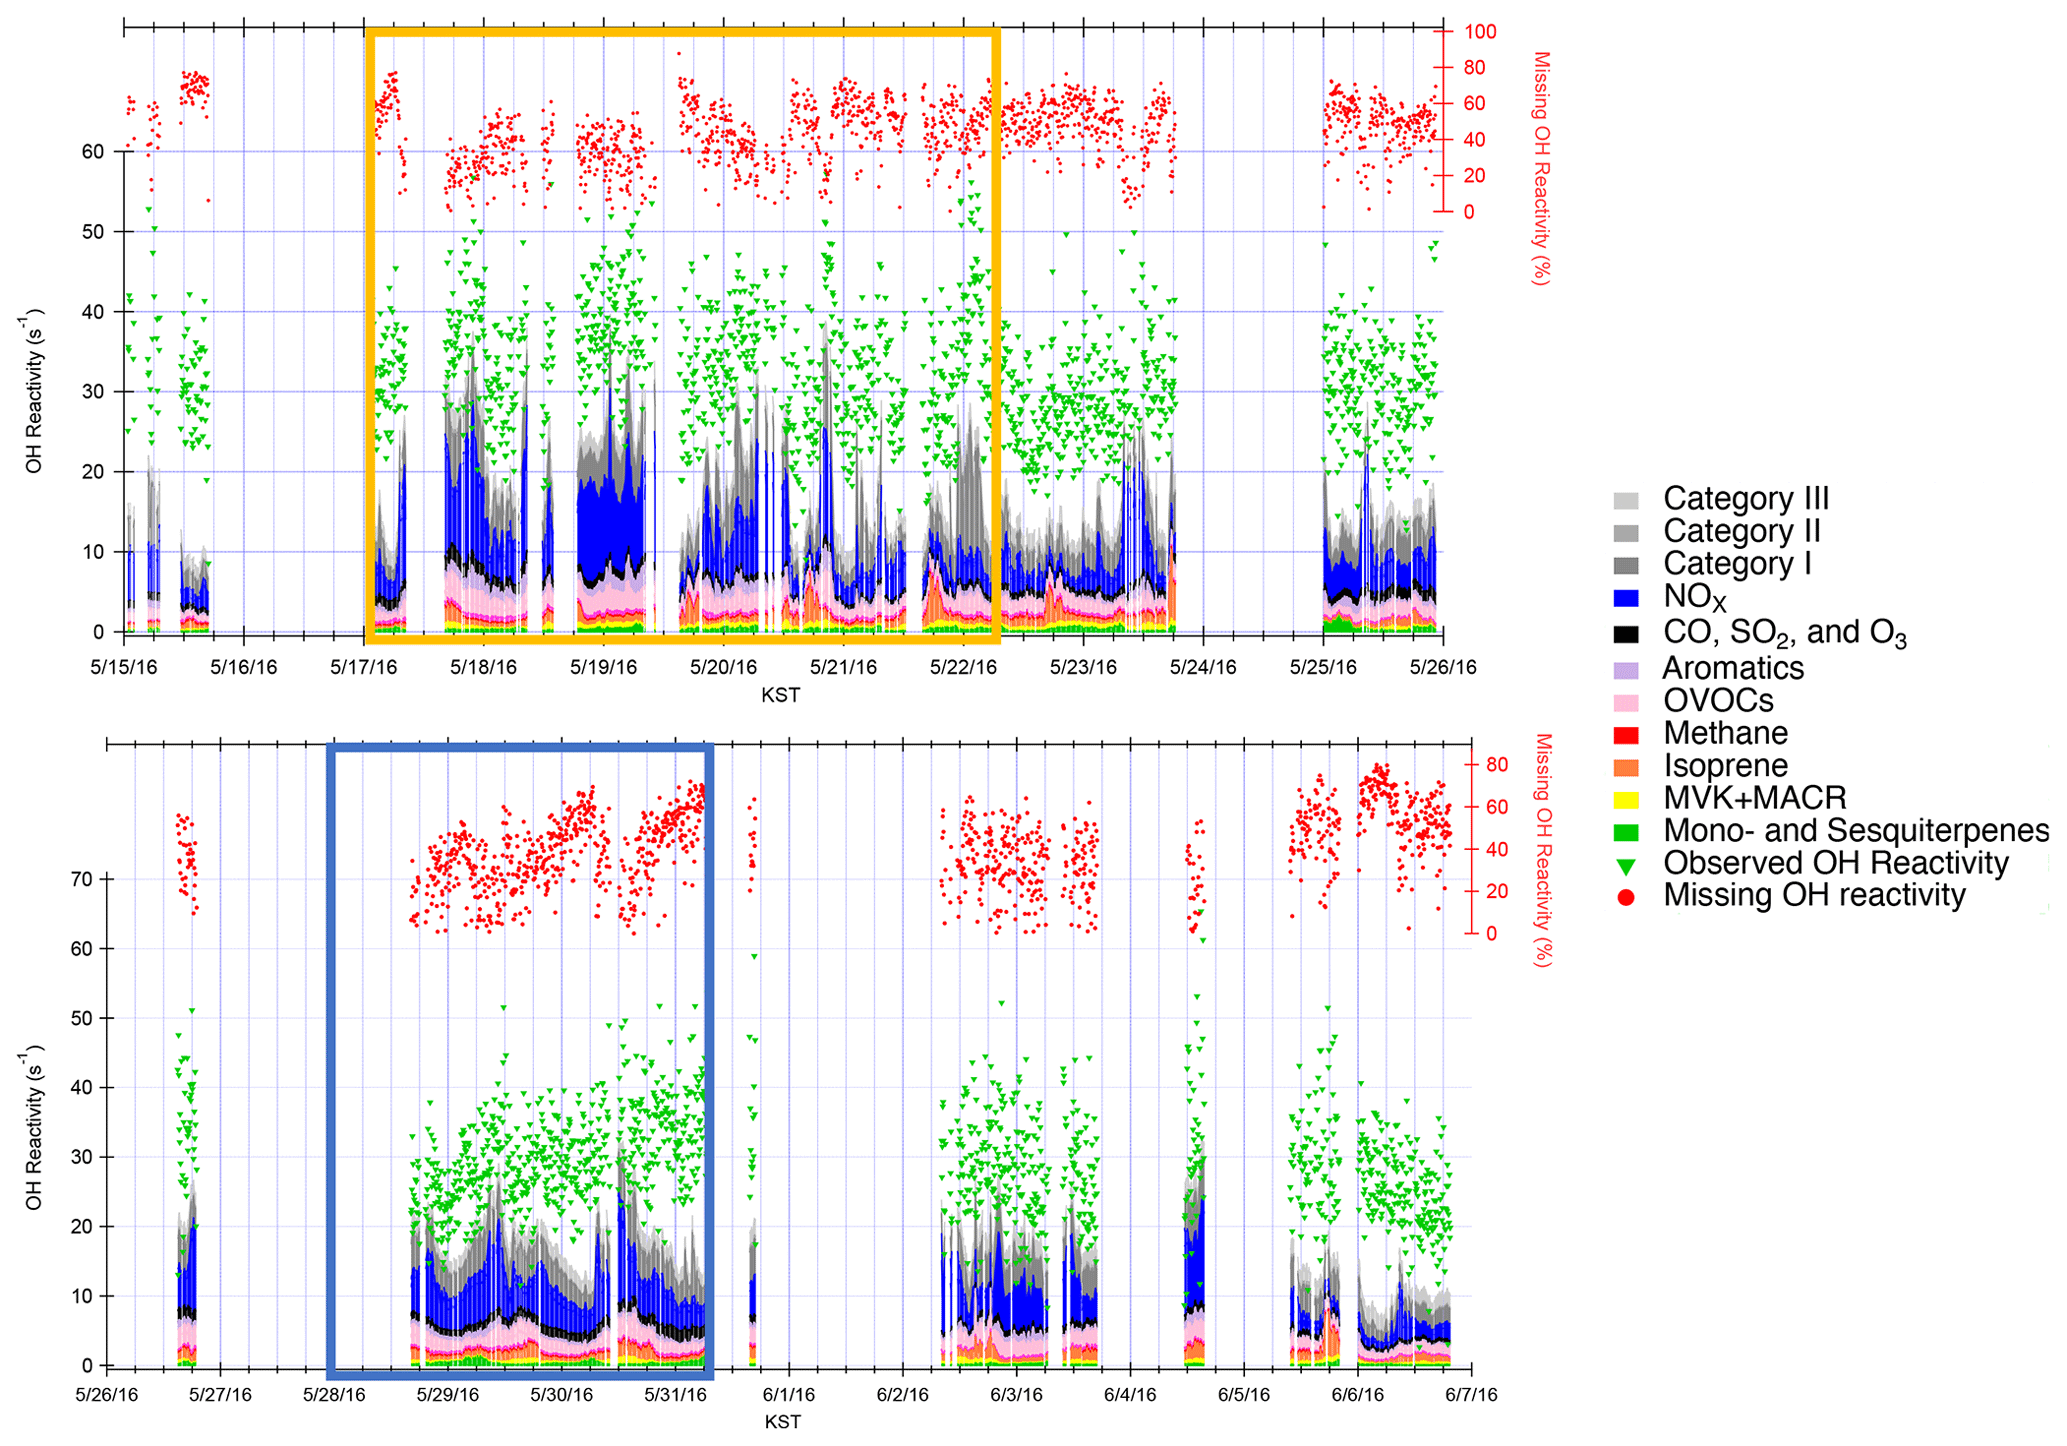
Figure 1Observed and calculated OH reactivity during KORUS-AQ 2016. The measured and calculated OH reactivity are on the left axis, while the missing OH reactivity is on the right axis. The yellow box represents the stagnation period, and the blue box represents the transport period.
The difference can be attributed to the notably higher reactive trace gas loadings during KORUS-AQ compared to the TRF measurements during MAPS-Seoul. The NOx, benzene, and toluene concentrations were 3 times higher during KORUS-AQ, and CO was 1.4 times higher (Fig. S2). Although the average isoprene concentrations were similar between the two campaigns, MVK and MACR concentrations during KORUS-AQ were ∼3 times higher, illustrating a more highly oxidative environment. There was a persistently high MVK + MACR-to-isoprene ratio of 1.8 during the KORUS-AQ campaign at TRF. This ratio was similar to the value reported during the summer in a moderately polluted forest in the Pearl River Delta that was attributed to a strong atmospheric oxidation capacity (Gong et al., 2018). The missing OH reactivity during KORUS-AQ was generally much higher than levels reported during urban observations (up to 50 % missing OH reactivity) (Kovacs et al., 2003; Ren et al., 2003; Sinha et al., 2008; Dolgorouky et al., 2012; Whalley et al., 2016; Kim et al., 2016; Yang et al., 2017) and within the range of previously reported values in forest regions where as much as 80 % missing OH reactivity has been reported (Kim et al., 2016; Di Carlo et al., 2004; Nölscher et al., 2012, 2016; Edwards et al., 2013; Ramasamy et al., 2018; Nakashima et al., 2014).
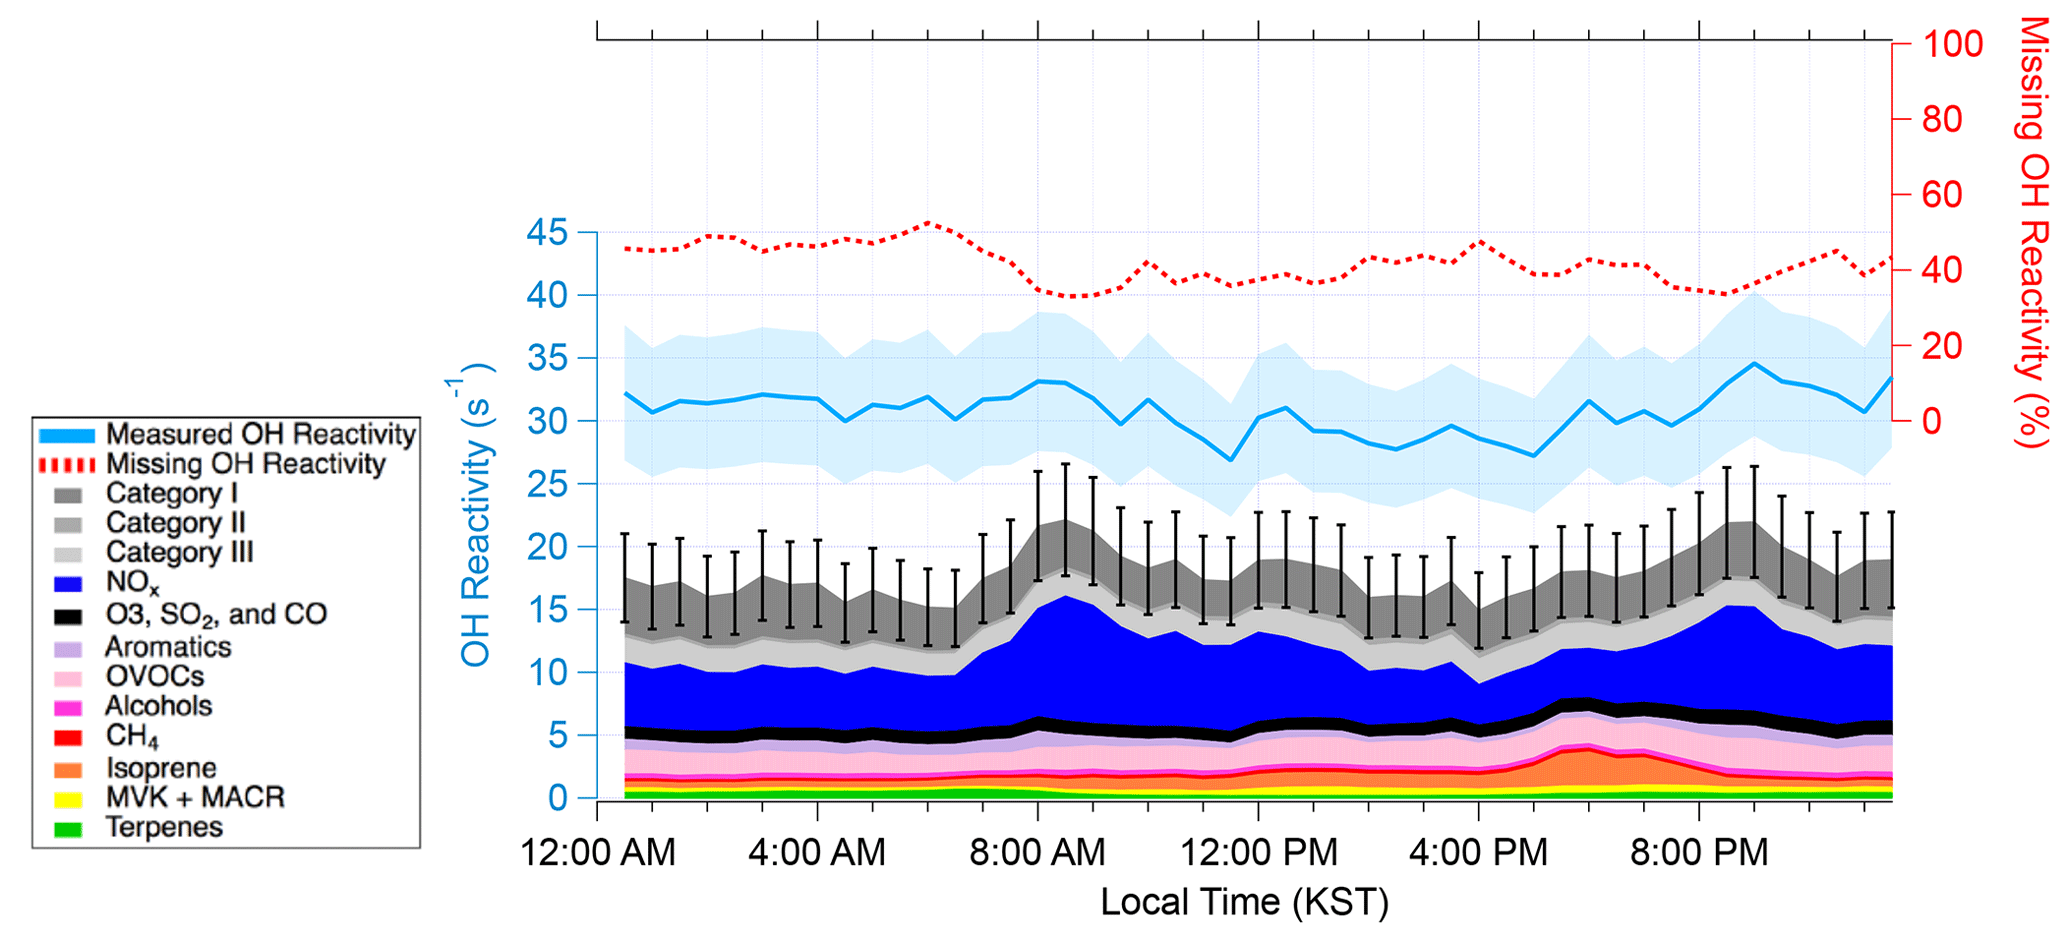
Figure 2The diurnal average of OH reactivity from 15 May–7 June 2016. The measured and calculated OH reactivity are on the left axis. The blue shading represents uncertainty in the measured OH reactivity. The black bars represent the propagated uncertainty in calculated OH reactivity. The missing OH reactivity in the percentage scale can be read using the right axis.
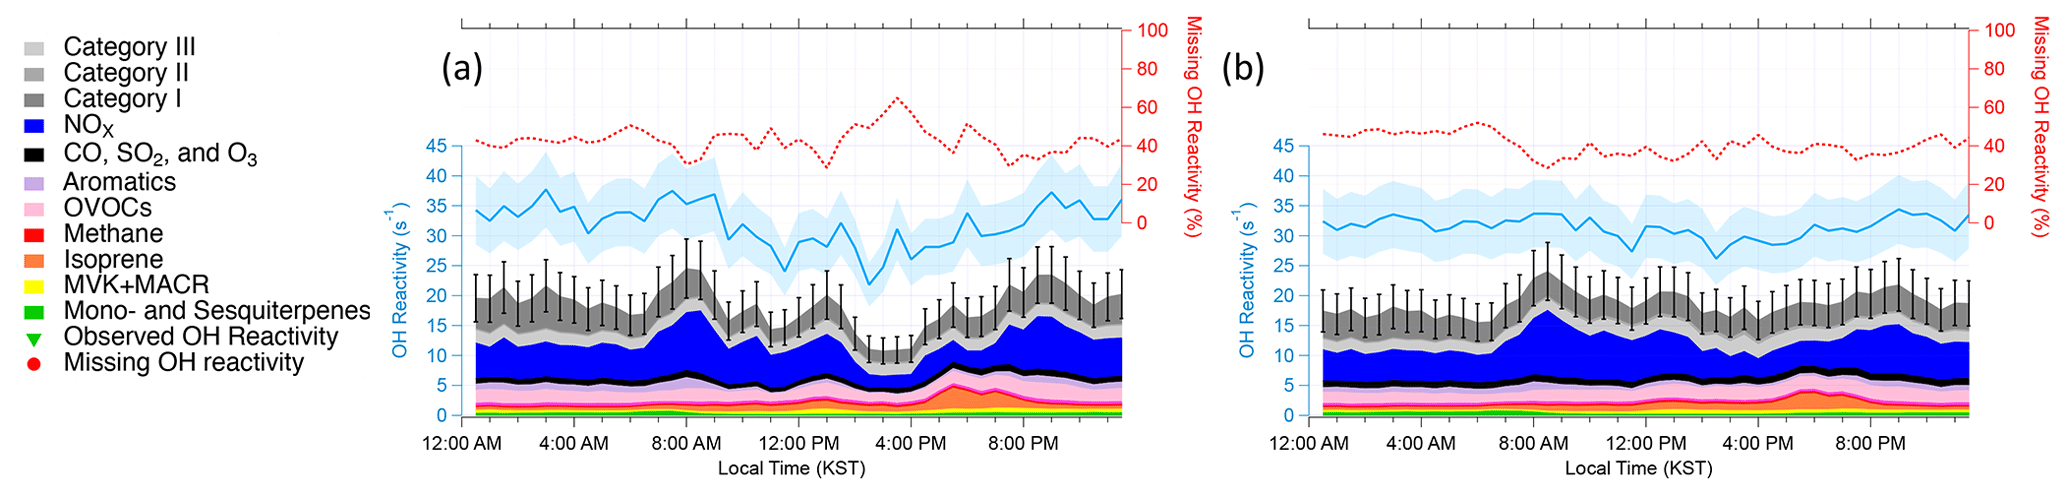
Figure 3Diurnal averages of OH reactivity during (a) the stagnation period from 17–22 May 2016 and (b) the transport period from 28 May–1 June 2016. The measured and calculated OH reactivity are on the left. The blue shading represents an uncertainty of 16.7 % at 1σ. The black bars represent the propagated uncertainty of 20.1 % at 1σ from calculated missing OH reactivity. The percent of missing OH reactivity is on the right axis.
Figure 2 shows the diurnal average of measured, calculated, and missing OH reactivity from 15 May–7 June 2016. Isoprene was the largest contributor to VOC OH reactivity in the afternoon and the early evening (36 % of the calculated OH reactivity in the evening), consistent with the previous studies conducted at this site (Kim et al., 2013b, 2015, 2016). Among all the trace gases, the largest average contributor to the calculated OH reactivity was NOx, which contributed 18.2 % (5.6 s−1) to the measured OH reactivity. The NOx contribution to OH reactivity is higher during the morning and evening rush hour and at a minimum in the afternoon, which has been reported consistently in previous reports conducted near megacities (Kovacs et al., 2003; Mao et al., 2010; Dolgorouky et al., 2012; Ren et al., 2003; Shirley et al., 2006). Enhanced OH reactivity during the morning or night and minimum OH reactivity during the afternoon has been reported in urban areas (Kovacs et al., 2003; Ren et al., 2006; Shirley et al., 2006; Dolgorouky et al., 2012; Mao et al., 2010; Whalley et al., 2016). On the other hand, strong light-sensitive biogenic emissions (e.g., isoprene) result in a maximum observed OH reactivity in the afternoon in forested regions (Ren et al., 2006; Sinha et al., 2012; Edwards et al., 2013; Hansen et al., 2014; Zannoni et al., 2017; Nölscher et al., 2016). One exception is an OH reactivity observation conducted in Hyytiälä, a forested site that has low isoprene levels, by Sinha et al. (2010). They attributed a flat diurnal OH reactivity variation to the interplay between high daytime emissions and a low nighttime boundary layer height. In urban environments, it is mostly anthropogenic trace gases such as aromatics and OVOCs that contribute to OH reactivity. These compounds have a longer lifetime compared to the diurnal boundary layer evolution. This leads to the accumulation of such compounds in the shallow boundary layer during the night. On the other hand, strong emissions of reactive BVOCs in deciduous forest regions enhance OH reactivity during the daytime but then quickly react away. Very subtle diurnal differences observed in this study (Fig. 2), therefore, can be understood as the competitive influences of both anthropogenic and biogenic compounds on the OH reactivity.
As described in detail in Sullivan et al. (2019) and Jeong et al. (2019), a strong regional stagnation episode occurred during the KORUS-AQ campaign between 17–23 May. Later, the Korean Peninsula was affected by a period of continental pollution outflow between 28 May and 1 June. The diurnal averages of the two periods and their calculated OH reactivity are presented in Fig. 3. It is notable that there is very little difference in the observed OH reactivity between the two distinct periods in terms of the amount of OH reactivity and its diurnal pattern (Fig. 4). Furthermore, no significant variance of the different classes of reactive gases such as criteria air pollutants (CO, NOx, O3, and SO2), mostly contributed by NOx, OVOCs (acetone, acetaldehyde, formaldehyde, methylglyoxal, methanol, methyl ethyl ketone), aromatics (benzene, toluene, xylenes, styrene, benzaldehyde, trimethylbenzenes), and BVOCs (isoprene, monoterpenes, sesquiterpenes, MVK + MACR), was observed during the different periods (Fig. 5). These different classes of reactive gases generally differed by less than 10 % from the overall campaign during the two periods. This observation shows that the presence of reactive gases is mostly controlled by relatively short-lived compounds determined by local emissions and their oxidation products.

Figure 4The observed OH reactivity during the overall campaign, stagnation period, and transport period.
The diurnal variation behavior of each chemical class reflects the chemical lifetime of the compounds (e.g., aromatics vs. BVOCs). The calculated OH reactivity from OVOCs does not show a strong diurnal variation. This reflects the fact that OVOCs are mostly generated or emitted during the daytime and their lifetime is generally longer than their precursors, which allows nocturnal accumulation due to the absence of OH. The differences in the diurnal variation in different classes of reactive gases can also be used to interpret the origin of the compounds in categories I–III as presented in Fig. 6. The diurnal variations in Category I resemble those of relatively long-lived chemical species with a distinct nocturnal accumulation pattern. This diurnal pattern has been previously reported for both anthropogenic VOCs such as toluene and benzene and temperature-dependent monoterpenes such as α-pinene. It is notable that the diurnal pattern is enhanced during the stagnation period during early morning hours. This enhancement is also seen in the aromatic trace gases particularly during the stagnation period (Fig. 5b).
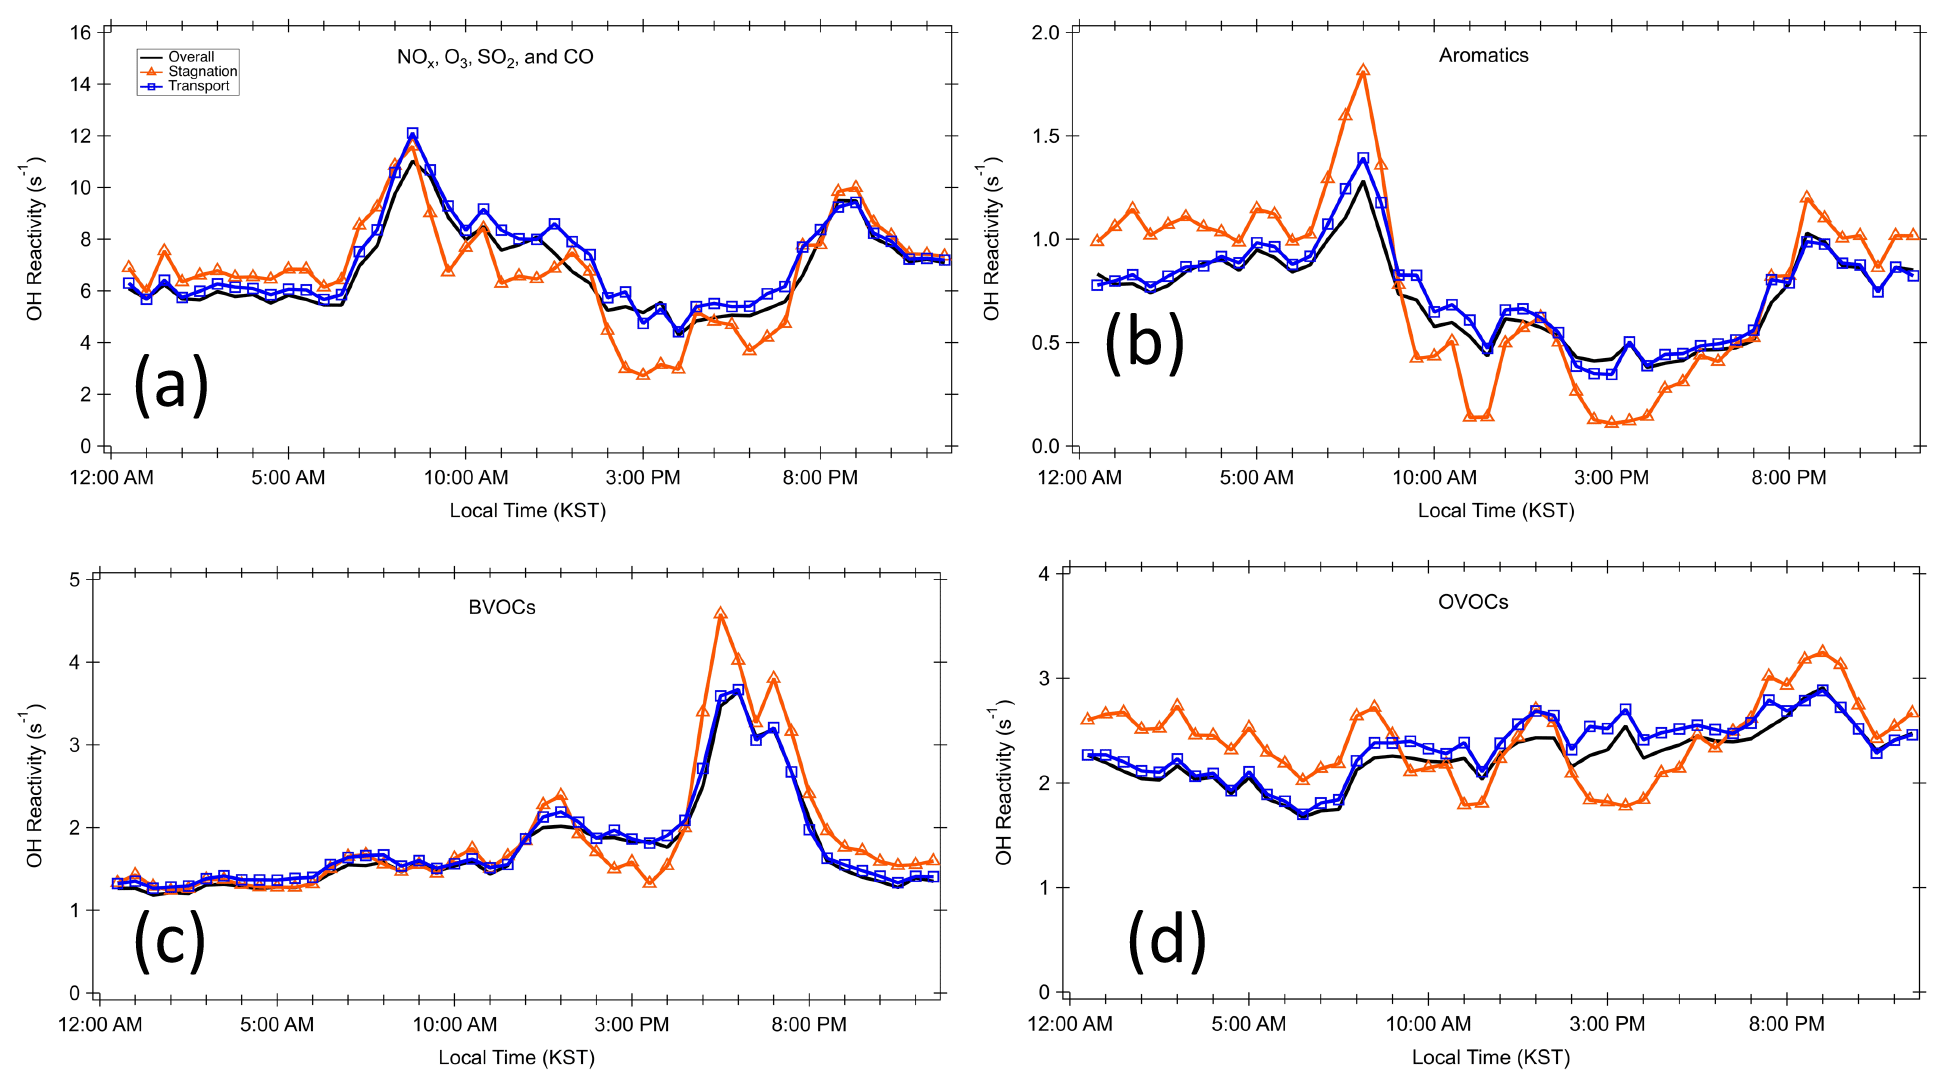
Figure 5Diurnal profiles for different classes of trace gases during the different periods. (a) Criteria pollutants NOx, O3, SO2, and CO; (b) aromatics; (c) BVOCs; and (d) OVOCs.
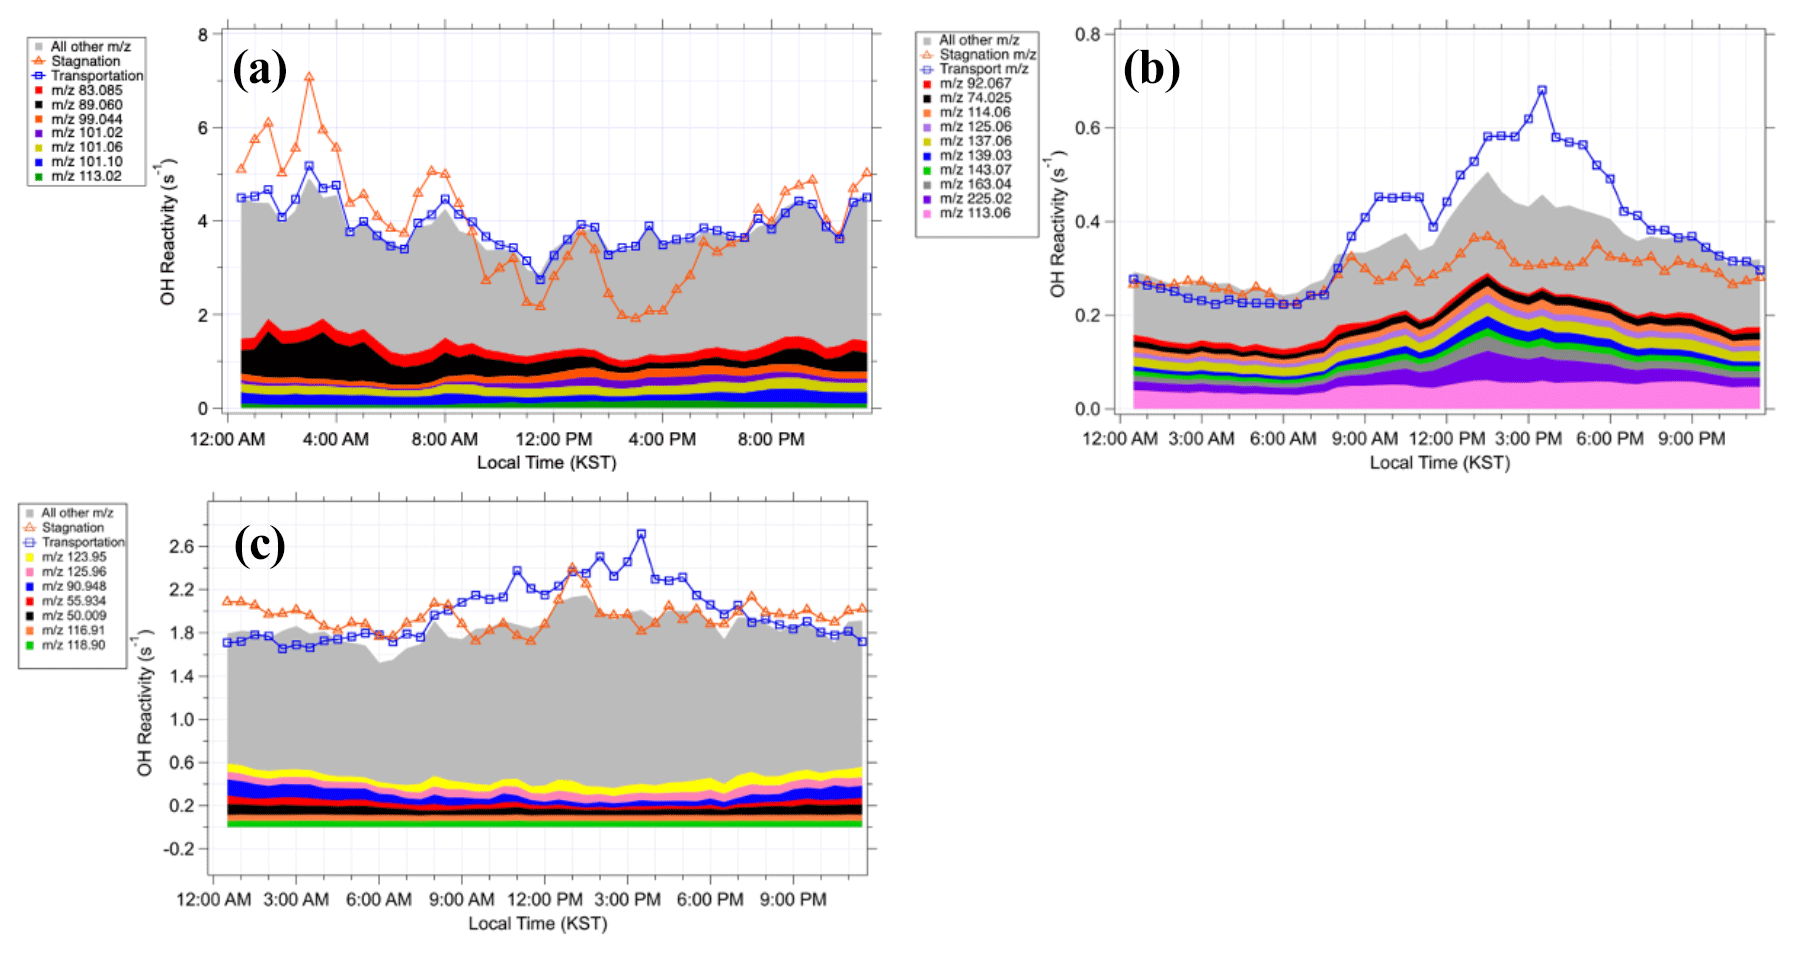
Figure 6Diurnal averages of the OH reactivity from the compounds in (a) Category I, (b) Category II, and (c) Category III.
Indeed, there are both biogenic and anthropogenic contributions towards the Category I compounds, which contribute an average of 3.8 s−1 to the OH reactivity assessment, the largest amount among the three categories (Fig. 6a). The largest contributors to Category I, which appear to be from a mixture of biogenic and anthropogenic sources, include 89.060, 101.06, and 101.096, and they contributed 0.3, 0.2, and 0.2 s−1, respectively. The 89.060 had a molecular formula of C4H8O2H+ and was correlated to the anthropogenic compounds such as benzene and toluene. The 101.06 peak had the molecular formula of C5H8O2H+ and had a diurnal variation similar to that of MVK + MACR. This mass peak has been previously identified in laboratory (Zhao et al., 2004) and field (Williams et al., 2001) studies as the C5 hydroxy carbonyl, an isoprene oxidation product. Results from an indoor chamber photooxidation experiment conducted by Lee et al. (2006) showed that 101 is a common fragment of unidentified oxidation products of monoterpenes, sesquiterpenes, and isoprene. Lee et al. (2006) also reported that this mass peak also composed over 5 % of the fragments of unidentified α-humulene and linalool oxidation products. The molecular formula of this peak is C6H12OH+, and it has been identified in previous studies as C6 carbonyls (Koss et al., 2017) or hexanal (Brilli et al., 2014; Rinne et al., 2005). Furthermore, 99.044 and 113.023 were also among the highest contributors to Category I and were correlated with MVK and MACR. The 99 was previously reported to be a fragment ion of unidentified terpene oxidation products in a chamber experiment (Lee et al., 2006). The 113 was observed by a PTR-MS in a ponderosa pine forest in central California by Holzinger et al. (2005). In this case, it was formed within the canopy from the rapid oxidation of terpinolene, myrcene, and α-terpinene. Furthermore, 113 was observed to come from the photooxidation and ozonolysis of multiple terpenes in two indoor chamber studies by Lee et al. (2006). The 113 composed over 5 % of the oxidation product fragments of myrcene and verbenone. Finally, 83.085 had the molecular formula of and was correlated to benzene. Multiple studies have identified this peak as cyclohexane, methyl-cyclopentane, or methylcyclohexane, typically found in areas rich in oil and gas (Koss et al., 2017; Gueneron et al., 2015; Yuan et al., 2014). In summary, both the gross diurnal pattern and the individual peak analyses consistently illustrate that both anthropogenic and biogenic compounds comprise Category I, the largest contributor to the previously unexplored compounds in the PTR-ToF-MS spectrum at this research site.
Category II contributed an average of 0.3 s−1 to the calculated OH reactivity, the lowest amount for the three categories (Fig. 6b). The compounds in Category II appear to correlate to either BVOCs or acetone, depending on the time period. In Fig. 6b, the maximum during the transport period is enhanced to about 0.2 s−1 higher than the overall campaign and shifted about 3 h later to ∼16:00 Korean standard time. The OH reactivity calculated from Category II is strongly correlated to MVK + MACR (R2=0.82) during this period as well. On the other hand, during the stagnation period the average OH reactivity from Category II correlates more strongly with acetone (R2=0.62) than with MVK + MACR (R2=0.28). In fact, six of the highest contributors to Category II (Fig. 6b) are more strongly correlated to acetone (R2>0.40) during the stagnation period compared to the transport period. The sources of acetone can be either biogenic or anthropogenic. Biogenic sources include direct emissions from plants or their oxidation products and plant decay (Jacob et al., 2002; Seco et al., 2007). Anthropogenic sources of acetone include vehicular emissions, solvent use, and the oxidation of other anthropogenic VOCs (Jacob et al., 2002). Therefore, this illustrates that the compounds in Category II also have a complex source profile of both biogenic and anthropogenic origin.
Category III contributed 1.9 s−1 to the calculated OH reactivity (Fig. 6c). The 6 highest contributors out of 236 mass peaks contributed a total of 0.43 s−1 of the calculated OH reactivity. Overall, Category III compounds had no strong correlations to isoprene, MVK + MACR, benzene, or toluene during either the stagnation or the transport periods. However, Category III compounds were highly correlated to methylglyoxal (R2 is 0.85, 0.82, and 0.78 for the stagnation, transport, and overall period, respectively), one of the measured OVOCs. A global modeling study illustrated that methylglyoxal is mainly produced from isoprene oxidation processes and the second most important source is acetone oxidation (Fu et al., 2008). In addition, aromatics and alkenes are also known to produce methylglyoxal through atmospheric oxidation processes (Henry et al., 2012). As TRF is a high-aromatic and high-isoprene environment, the source profile of methyl glyoxal in the region is likely complex, which can be applied to interpret the source of the Category III compounds.
Overall, the OH reactivity estimates from categories I–III contributed an average of 6.0±2.2 s−1 to the calculated OH reactivity. In summary, there is consistency that both anthropogenic and the biogenic contributions need to be further studied in the PTR-ToF-MS spectrum. Furthermore, by adding this additional signal from categories I–III, VOC contribution to calculated OH reactivity (11.0 s−1) becomes larger than that (6.8 s−1) from criteria air pollutants (CO, NOx, SO2, and O3). This should be considered when evaluating ozone production regimes (Kim et al., 2018).

Figure 7The correlation between NOx OH reactivity and (a) absolute missing OH reactivity and (b) percent of missing OH reactivity.
Even with the inclusion of the additional peaks to the calculated OH reactivity, we still find a missing OH reactivity of 42 %. Thus, it is important to investigate the origin of this missing fraction. A correlation can be observed between missing OH reactivity as a percentage and OH reactivity from NOx (R2=0.5; Fig. 7a) but not between OH reactivity from NOx and absolute missing OH reactivity (s−1) (R2=0.24; Fig. 7b). This leads us to speculate that there is a consistent presence of unquantified trace gases, likely oxidation products of both anthropogenic and biogenic VOCs as we explored the origin of the unexplored peaks causing missing OH reactivity. In other words, NOx is relatively well measured with a highly pronounced temporal variation that determines the percentage of missing OH reactivity.
Finally, unaccounted for uncertainty associated with the reaction rate constant estimations described in the method section should also be further explored. For example, to reconcile the averaged missing OH reactivity during the day (10 s−1), it requires ∼60 ppm of methane but only ∼4 ppb of isoprene. This clearly demonstrates the importance of rate constant estimation. Indeed, if we apply the reaction rate constant of isoprene with OH ( at 298 K) to Category II and Category III compounds, then the observed OH reactivity is fully reconciled (Fig. S3). Proton ion chemistry may have an intrinsic limitation for quantifying highly oxidized OVOCs. Moreover, due to the different inlet configurations for OH reactivity and VOC observations, their contributions towards observed and calculated OH reactivity may not have been consistently evaluated (e.g., Sanchez et al., 2018). Therefore, a comprehensive analysis along with a dataset from other instrumentation is necessary for reconciling missing OH reactivity with observational constraints. Finally, it is highly plausible that we may double-count for fragmented molecules in the mass spectrum. Although it would not affect concentration evaluation as the intensity of ion signals from the fragmented molecules would be fully accounted for by adding parent-ion and fragmented-ion signals, the OH reactivity calculated from the fragmented ions is susceptible to underestimation from the assumption that kOH positively correlates with molecular masses.
We present OH reactivity observations at a suburban forest site during the KORUS-AQ field campaign. A comprehensive trace gas dataset including 14 VOCs quantified by the PTR-ToF-MS is used to calculate OH reactivity, which only accounts for 36.7 % of the averaged observed OH reactivity.
This study presents a detailed methodology for retrieving OH reactivity contributions from all of the peaks of the PTR-ToF-MS mass spectrum. This decreases the amount of missing OH reactivity as the majority of them have not been accounted for in calculated OH reactivity in previous studies. First, we converted the raw signals to concentrations using a constant proton transfer reaction rate ( cm3 s−1). Then, we grouped the previously unaccounted for peaks into three categories to estimate reaction constants for each compound. The contributions of the unaccounted for peaks in the mass spectrum account for a calculated OH reactivity of ∼6 s−1, which decreases missing OH reactivity from 63.3 % to 42.0 %. It is noteworthy that the diurnal variations in observed OH reactivity and calculated OH reactivity from the various groups of trace gases do not have a high variability during the field campaign even though there were several synoptic meteorological configuration changes. This suggests that the reactive trace gas loading is mostly determined by local emission and oxidation processes not influenced by the synoptic meteorological conditions.
In conclusion, this study highlights PTR-ToF-MS instruments as tools for observationally constraining missing OH reactivity. Further study is required particularly towards characterizing proton reaction rate constants and reaction constants with OH for the many unknown compounds detected on a PTR-ToF-MS. In addition, other mass spectrometry techniques, such as nitrate or iodine ion chemistry systems, should be utilized in future studies to complement the PTR technique, which is sensitive to volatile to semi-volatile VOCs, to quantify lower-volatility compounds and comprehensively constrain OH reactivity contributions from VOCs.
Data are available at https://www-air.larc.nasa.gov/missions/korus-aq/ (last access: 29 March 2021) (NASA, 2021).
The supplement related to this article is available online at: https://doi.org/10.5194/acp-21-6331-2021-supplement.
DS, RS, AG, and SK conceived and planned the experiments. DS, RS, DG, AG, YL, DK, JA, DB, SH, DJ, JTS, TM, and SK carried out the experiments. DS, RS, DG, AG, JM, DJ, RP, and SK contributed to the interpretation of the results. DS, and SK took the lead in writing the manuscript. All authors provided critical feedback and helped shape the research, analysis, and manuscript.
The authors declare that they have no conflict of interest.
This study is supported by NASA (NNX15AT90G) and NIER. We highly appreciate NASA ESPO for logistical support. Taehwa Research Forest is operated by the College of Agriculture and Life Sciences at Seoul National University. Saewung Kim would like to acknowledge funding support from the Brain Pool Program of the National Research Foundation Korea (NRF) funded by the Ministry of Science and ICT (no. 2020H1D3A2A01060699).
This research has been supported by NASA (grant no. NNX15AT90G), the National Institute of Environmental Research (NIER-RP0219-152) of South Korea, and the Brain Pool Program of the National Research Foundation Korea (NRF) funded by the Ministry of Science and ICT (no. 2020H1D3A2A01060699).
This paper was edited by Andreas Hofzumahaus and reviewed by Arnaud P. Praplan and two anonymous referees.
Atkinson, R.: A Structure-Activity Relationship for the Estimation of Rate Constants for the Gas-Phase Reactions of Oh Radicals with Organic-Compounds, Int. J. Chem. Kinet., 19, 799–828, https://doi.org/10.1002/kin.550190903, 1987.
Atkinson, R., Baulch, D. L., Cox, R. A., Crowley, J. N., Hampson, R. F., Hynes, R. G., Jenkin, M. E., Rossi, M. J., Troe, J., and IUPAC Subcommittee: Evaluated kinetic and photochemical data for atmospheric chemistry: Volume II – gas phase reactions of organic species, Atmos. Chem. Phys., 6, 3625–4055, https://doi.org/10.5194/acp-6-3625-2006, 2006.
Brilli, F., Gioli, B., Ciccioli, P., Zona, D., Loreto, F., Janssens, I. A., and Ceulemans, R.: Proton Transfer Reaction Time-of-Flight Mass Spectrometric (PTR-TOF-MS) determination of volatile organic compounds (VOCs) emitted from a biomass fire developed under stable nocturnal conditions, Atmos. Environ., 97, 54–67, https://doi.org/10.1016/j.atmosenv.2014.08.007, 2014.
Cappellin, L., Karl, T., Probst, M., Ismailova, K., Winkler, P. M., Soukoulis, C., Aprea, E., Mark, T. D., Gasperi, F., and Biasioli, F.: On quantitative determination of volatile organic compound concentrations using proton transfer reaction Time-of-Flight Mass Spectrometry, Environ. Sci. Technol., 46, 2283–2290, https://doi.org/10.1021/es203985t, 2012.
Colman, J. J., Swanson, A. L., Meinardi, S., Sive, B. C., Blake, D. R., and Rowland, F. S.: Description of the analysis of a wide range of volatile organic compounds in whole air samples collected during PEM-Tropics A and B, Anal. Chem., 73, 3723–3731, 2001.
de Gouw, J. and Warneke, C.: Measurements of volatile organic compounds in the earth's atmosphere using proton-transfer-reaction mass spectrometry, Mass Spectrom. Rev., 26, 223–257, https://doi.org/10.1002/mas.20119, 2007.
De Gouw, J., Goldan, P., Warneke, C., Kuster, W., Roberts, J. M., Marchewka, M., Bertman, S. B., Pszenny, A., and Keene, W.: Validation of proton transfer reaction-mass spectrometry (PTR-MS) measurements of gas phase organic compounds in the atmosphere during the New England Air Quality Study (NEAQS) in 2002, J. Geophys. Res., 108, 4682, https://doi.org/10.1029/2003JD003863, 2003.
Di Carlo, P., Brune, W. H., Martinez, M., Harder, H., Lesher, R., Ren, X. R., Thornberry, T., Carroll, M. A., Young, V., Shepson, P. B., Riemer, D., Apel, E., and Campbell, C.: Missing OH reactivity in a forest: Evidence for unknown reactive biogenic VOCs, Science, 304, 722–725, https://doi.org/10.1126/Science.1094392, 2004.
Dillon, T. J., Tucceri, M. E., Dulitz, K., Horowitz, A., Vereecken, L., and Crowley, J. N.: Reaction of Hydroxyl Radicals with C4H5N (Pyrrole): Temperature and Pressure Dependent Rate Coefficients, J. Phys. Chem. A, 116, 6051–6058, https://doi.org/10.1021/jp211241x, 2012.
Dolgorouky, C., Gros, V., Sarda-Esteve, R., Sinha, V., Williams, J., Marchand, N., Sauvage, S., Poulain, L., Sciare, J., and Bonsang, B.: Total OH reactivity measurements in Paris during the 2010 MEGAPOLI winter campaign, Atmos. Chem. Phys., 12, 9593–9612, https://doi.org/10.5194/acp-12-9593-2012, 2012.
Edwards, P. M., Evans, M. J., Furneaux, K. L., Hopkins, J., Ingham, T., Jones, C., Lee, J. D., Lewis, A. C., Moller, S. J., Stone, D., Whalley, L. K., and Heard, D. E.: OH reactivity in a South East Asian tropical rainforest during the Oxidant and Particle Photochemical Processes (OP3) project, Atmos. Chem. Phys., 13, 9497–9514, https://doi.org/10.5194/acp-13-9497-2013, 2013.
Fu, T. M., Jacob, D. J., Wittrock, F., Burrows, J. P., Vrekoussis, M., and Henze, D. K.: Global budgets of atmospheric glyoxal and methylglyoxal, and implications for formation of secondary organic aerosols, J. Geophys. Res.-Atmos., 113, D15303, https://doi.org/10.1029/2007JD009505, 2008.
Fuchs, H., Novelli, A., Rolletter, M., Hofzumahaus, A., Pfannerstill, E. Y., Kessel, S., Edtbauer, A., Williams, J., Michoud, V., Dusanter, S., Locoge, N., Zannoni, N., Gros, V., Truong, F., Sarda-Esteve, R., Cryer, D. R., Brumby, C. A., Whalley, L. K., Stone, D., Seakins, P. W., Heard, D. E., Schoemaecker, C., Blocquet, M., Coudert, S., Batut, S., Fittschen, C., Thames, A. B., Brune, W. H., Ernest, C., Harder, H., Muller, J. B. A., Elste, T., Kubistin, D., Andres, S., Bohn, B., Hohaus, T., Holland, F., Li, X., Rohrer, F., Kiendler-Scharr, A., Tillmann, R., Wegener, R., Yu, Z., Zou, Q., and Wahner, A.: Comparison of OH reactivity measurements in the atmospheric simulation chamber SAPHIR, Atmos. Meas. Tech., 10, 4023–4053, https://doi.org/10.5194/amt-10-4023-2017, 2017.
Goldstein, A. H. and Galbally, I. E.: Known and unexplored organic constituents in the earth's atmosphere, Environ. Sci. Technol., 41, 1514–1521, 2007.
Gong, D., Wang, H., Zhang, S., Wang, Y., Liu, S. C., Guo, H., Shao, M., He, C., Chen, D., He, L., Zhou, L., Morawska, L., Zhang, Y., and Wang, B.: Low-level summertime isoprene observed at a forested mountaintop site in southern China: implications for strong regional atmospheric oxidative capacity, Atmos. Chem. Phys., 18, 14417–14432, https://doi.org/10.5194/acp-18-14417-2018, 2018.
Graus, M., Muller, M., and Hansel, A.: High Resolution PTR-TOF: Quantification and Formula Confirmation of VOC in Real Time, J. Am. Soc. Mass Spectrom., 21, 1037–1044, 2010.
Gueneron, M., Erickson, M. H., VanderSchelden, G. S., and Jobson, B. T.: PTR-MS fragmentation patterns of gasoline hydrocarbons, Int. J. Mass Spectrom., 379, 97–109, https://doi.org/10.1016/j.ijms.2015.01.001, 2015.
Hansen, R. F., Griffith, S. M., Dusanter, S., Rickly, P. S., Stevens, P. S., Bertman, S. B., Carroll, M. A., Erickson, M. H., Flynn, J. H., Grossberg, N., Jobson, B. T., Lefer, B. L., and Wallace, H. W.: Measurements of total hydroxyl radical reactivity during CABINEX 2009 – Part 1: field measurements, Atmos. Chem. Phys., 14, 2923–2937, https://doi.org/10.5194/acp-14-2923-2014, 2014.
Hansen, R. F., Blocquet, M., Schoemaecker, C., Léonardis, T., Locoge, N., Fittschen, C., Hanoune, B., Stevens, P. S., Sinha, V., and Dusanter, S.: Intercomparison of the comparative reactivity method (CRM) and pump–probe technique for measuring total OH reactivity in an urban environment, Atmos. Meas. Tech., 8, 4243–4264, https://doi.org/10.5194/amt-8-4243-2015, 2015.
Henry, S. B., Kammrath, A., and Keutsch, F. N.: Quantification of gas-phase glyoxal and methylglyoxal via the Laser-Induced Phosphorescence of (methyl)GLyOxal Spectrometry (LIPGLOS) Method, Atmos. Meas. Tech., 5, 181–192, https://doi.org/10.5194/amt-5-181-2012, 2012.
Herndon, S. C., Jayne, J. T., Zahniser, M. S., Worsnop, D. R., Knighton, B., Alwine, E., Lamb, B. K., Zavala, M., Nelson, D. D., McManus, J. B., Shorter, J. H., Canagaratna, M. R., Onasch, T. B., and Kolb, C. E.: Characterization of urban pollutant emission fluxes and ambient concentration distributions using a mobile laboratory with rapid response instrumentation, Faraday Discuss., 130, 327–339, https://doi.org/10.1039/b500411j, 2005.
Hewitt, C. N., Lee, J. D., MacKenzie, A. R., Barkley, M. P., Carslaw, N., Carver, G. D., Chappell, N. A., Coe, H., Collier, C., Commane, R., Davies, F., Davison, B., DiCarlo, P., Di Marco, C. F., Dorsey, J. R., Edwards, P. M., Evans, M. J., Fowler, D., Furneaux, K. L., Gallagher, M., Guenther, A., Heard, D. E., Helfter, C., Hopkins, J., Ingham, T., Irwin, M., Jones, C., Karunaharan, A., Langford, B., Lewis, A. C., Lim, S. F., MacDonald, S. M., Mahajan, A. S., Malpass, S., McFiggans, G., Mills, G., Misztal, P., Moller, S., Monks, P. S., Nemitz, E., Nicolas-Perea, V., Oetjen, H., Oram, D. E., Palmer, P. I., Phillips, G. J., Pike, R., Plane, J. M. C., Pugh, T., Pyle, J. A., Reeves, C. E., Robinson, N. H., Stewart, D., Stone, D., Whalley, L. K., and Yin, X.: Overview: oxidant and particle photochemical processes above a south-east Asian tropical rainforest (the OP3 project): introduction, rationale, location characteristics and tools, Atmos. Chem. Phys., 10, 169–199, https://doi.org/10.5194/acp-10-169-2010, 2010.
Holzinger, R.: PTRwid: A new widget tool for processing PTR-TOF-MS data, Atmos. Meas. Tech., 8, 3903–3922, https://doi.org/10.5194/amt-8-3903-2015, 2015.
Holzinger, R., Lee, A., Paw, K. T., and Goldstein, U. A. H.: Observations of oxidation products above a forest imply biogenic emissions of very reactive compounds, Atmos. Chem. Phys., 5, 67–75, https://doi.org/10.5194/acp-5-67-2005, 2005.
Jacob, D. J., Field, B. D., Jin, E. M., Bey, I., Li, Q. B., Logan, J. A., Yantosca, R. M., and Singh, H. B.: Atmospheric budget of acetone, J. Geophys. Res.-Atmos., 107, 4100, https://doi.org/10.1029/2001jd000694, 2002.
Jenkin, M. E., Saunders, S. M., and Pilling, M. J.: The tropospheric degradation of volatile organic compounds: A protocol for mechanism development, Atmos. Environ., 31, 81–104, https://doi.org/10.1016/S1352-2310(96)00105-7, 1997.
Jeong, D., Seco, R., Gu, D., Lee, Y., Nault, B. A., Knote, C. J., Mcgee, T., Sullivan, J. T., Jimenez, J. L., Campuzano-Jost, P., Blake, D. R., Sanchez, D., Guenther, A. B., Tanner, D., Huey, L. G., Long, R., Anderson, B. E., Hall, S. R., Ullmann, K., Shin, H., Herndon, S. C., Lee, Y., Kim, D., Ahn, J., and Kim, S.: Integration of airborne and ground observations of nitryl chloride in the Seoul metropolitan area and the implications on regional oxidation capacity during KORUS-AQ 2016, Atmos. Chem. Phys., 19, 12779–12795, https://doi.org/10.5194/acp-19-12779-2019, 2019.
Jordan, A., Haidacher, S., Hanel, G., Hartungen, E., Märk, L., Seehauser, H., Schottkowsky, R., Sulzer, P., and Märk, T. D.: A high resolution and high sensitivity proton-transfer-reaction time-of-flight mass spectrometer (PTR-TOF-MS), Int. J. Mass Spectrom., 286, 122–128, https://doi.org/10.1016/j.ijms.2009.07.005, 2009.
Kaiser, J., Skog, K. M., Baumann, K., Bertman, S. B., Brown, S. B., Brune, W. H., Crounse, J. D., de Gouw, J. A., Edgerton, E. S., Feiner, P. A., Goldstein, A. H., Koss, A., Misztal, P. K., Nguyen, T. B., Olson, K. F., St. Clair, J. M., Teng, A. P., Toma, S., Wennberg, P. O., Wild, R. J., Zhang, L., and Keutsch, F. N.: Speciation of OH reactivity above the canopy of an isoprene-dominated forest, Atmos. Chem. Phys., 16, 9349–9359, https://doi.org/10.5194/acp-16-9349-2016, 2016.
Kim, S., Karl, T., Guenther, A., Tyndall, G., Orlando, J., Harley, P., Rasmussen, R., and Apel, E.: Emissions and ambient distributions of Biogenic Volatile Organic Compounds (BVOC) in a ponderosa pine ecosystem: interpretation of PTR-MS mass spectra, Atmos. Chem. Phys., 10, 1759–1771, https://doi.org/10.5194/acp-10-1759-2010, 2010.
Kim, S., Guenther, A., Karl, T., and Greenberg, J.: Contributions of primary and secondary biogenic VOC tototal OH reactivity during the CABINEX (Community Atmosphere-Biosphere INteractions Experiments)-09 field campaign, Atmos. Chem. Phys., 11, 8613–8623, https://doi.org/10.5194/acp-11-8613-2011, 2011.
Kim, S., Wolfe, G. M., Mauldin, L., Cantrell, C., Guenther, A., Karl, T., Turnipseed, A., Greenberg, J., Hall, S. R., Ullmann, K., Apel, E., Hornbrook, R., Kajii, Y., Nakashima, Y., Keutsch, F. N., DiGangi, J. P., Henry, S. B., Kaser, L., Schnitzhofer, R., Graus, M., Hansel, A., Zheng, W., and Flocke, F. F.: Evaluation of HOx sources and cycling using measurement-constrained model calculations in a 2-methyl-3-butene-2-ol (MBO) and monoterpene (MT) dominated ecosystem, Atmos. Chem. Phys., 13, 2031–2044, https://doi.org/10.5194/acp-13-2031-2013, 2013a.
Kim, S. Y., Jiang, X. Y., Lee, M., Turnipseed, A., Guenther, A., Kim, J. C., Lee, S. J., and Kim, S.: Impact of biogenic volatile organic compounds on ozone production at the Taehwa Research Forest near Seoul, South Korea, Atmos. Environ., 70, 447–453, https://doi.org/10.1016/J.Atmosenv.2012.11.005, 2013b.
Kim, S., Kim, S.-Y., Lee, M., Shim, H., Wolfe, G. M., Guenther, A. B., He, A., Hong, Y., and Han, J.: Impact of isoprene and HONO chemistry on ozone and OVOC formation in a semirural South Korean forest, Atmos. Chem. Phys., 15, 4357–4371, https://doi.org/10.5194/acp-15-4357-2015, 2015.
Kim, S., Sanchez, D., Wang, M. D., Seco, R., Jeong, D., Hughes, S., Barletta, B., Blake, D. R., Jung, J., Kim, D., Lee, G., Lee, M., Ahn, J., Lee, S.-D., Cho, G., Sung, M.-Y., Lee, Y.-H., Kim, D. B., Kim, Y., Woo, J. H., Jo, D., Park, R., Park, J. H., Hong, Y.-D., and Hong, J.-H.: OH Reactivity in Urban and Suburban regions in Seoul, South Korea-An East Asia megacity in a rapid transition, Faraday Discuss., 189, 231–251, https://doi.org/10.1039/C5FD00230C, 2016.
Kim, S., Jeong, D., Sanchez, D., Wang, M., Seco, R., Blake, D., Meinardi, S., Barletta, B., Hughes, S., Jung, J., Kim, D., Lee, G., Lee, M., Ahn, J., Lee, S.-D., Cho, G., Sung, M.-Y., Lee, Y.-H., and Park, R.: The Controlling Factors of Photochemical Ozone Production in Seoul, South Korea, Aerosol Air Qual. Res., 18, 2253–2261, https://doi.org/10.4209/aaqr.2017.11.0452, 2018.
Koss, A., Yuan, B., Warneke, C., Gilman, J. B., Lerner, B. M., Veres, P. R., Peischl, J., Eilerman, S., Wild, R., Brown, S. S., Thompson, C. R., Ryerson, T., Hanisco, T., Wolfe, G. M., St. Clair, J. M., Thayer, M., Keutsch, F. N., Murphy, S., and de Gouw, J.: Observations of VOC emissions and photochemical products over US oil- and gas-producing regions using high-resolution H3O+ CIMS (PTR-ToF-MS), Atmos. Meas. Tech., 10, 2941–2968, https://doi.org/10.5194/amt-10-2941-2017, 2017.
Kovacs, T. A., Brune, W. H., Harder, H., Martinez, M., Simpas, J. B., Frost, G. J., Williams, E., Jobson, T., Stroud, C., Young, V., Fried, A., and Wert, B.: Direct measurements of urban OH reactivity during Nashville SOS in summer 1999, J. Environ. Monitor., 5, 68–74, https://doi.org/10.1039/b204339d, 2003.
Kwok, E. S. C. and Atkinson, R.: Estimation of Hydroxyl Radical Reaction-Rate Constants for Gas-Phase Organic-Compounds Using a Structure-Reactivity Relationship – an Update, Atmos. Environ., 29, 1685–1695, https://doi.org/10.1016/1352-2310(95)00069-B, 1995.
Lee, A., Goldstein, A. H., Kroll, J. H., Ng, N. L., Varutbangkul, V., Flagan, R. C., and Seinfeld, J. H.: Gas-phase products and secondary aerosol yields from the photooxidation of 16 different terpenes, J. Geophys. Res.-Atmos., 111, D17305, https://doi.org/10.1029/2006jd007050, 2006.
Mao, J. Q., Ren, X. R., Chen, S. A., Brune, W. H., Chen, Z., Martinez, M., Harder, H., Lefer, B., Rappengluck, B., Flynn, J., and Leuchner, M.: Atmospheric oxidation capacity in the summer of Houston 2006: Comparison with summer measurements in other metropolitan studies, Atmos. Environ., 44, 4107–4115, https://doi.org/10.1016/j.atmosenv.2009.01.013, 2010.
Müller, M., Graus, M., Wisthaler, A., Hansel, A., Metzger, A., Dommen, J., and Baltensperger, U.: Analysis of high mass resolution PTR-TOF mass spectra from 1,3,5-trimethylbenzene (TMB) environmental chamber experiments, Atmos. Chem. Phys., 12, 829–843, https://doi.org/10.5194/acp-12-829-2012, 2012.
Nakashima, Y., Kato, S., Greenberg, J., Harley, P., Karl, T., Turnipseed, A., Apel, E., Guenther, A., Smith, J., and Kajii, Y.: Total OH reactivity measurements in ambient air in a southern Rocky mountain ponderosa pine forest during BEACHON-SRM08 summer campaign, Atmos. Environ., 85, 1–8, 2014.
NASA: KORUS-AQ – An International Cooperative Air Quality Field Study in Korea, available at: https://www-air.larc.nasa.gov/missions/korus-aq/, last access: 29 March 2021.
Nölscher, A. C., Williams, J., Sinha, V., Custer, T., Song, W., Johnson, A. M., Axinte, R., Bozem, H., Fischer, H., Pouvesle, N., Phillips, G., Crowley, J. N., Rantala, P., Rinne, J., Kulmala, M., Gonzales, D., Valverde-Canossa, J., Vogel, A., Hoffmann, T., Ouwersloot, H. G., Vilà-Guerau de Arellano, J., and Lelieveld, J.: Summertime total OH reactivity measurements from boreal forest during HUMPPA-COPEC 2010, Atmos. Chem. Phys., 12, 8257–8270, https://doi.org/10.5194/acp-12-8257-2012, 2012.
Nölscher, A. C., Yanez-Serrano, A. M., Wolff, S., de Araujo, A. C., Lavric, J. V., Kesselmeier, J., and Williams, J.: Unexpected seasonality in quantity and composition of Amazon rainforest air reactivity, Nat. Commun., 7, 10383, https://doi.org/10.1038/ncomms10383, 2016.
Ortega, J., Turnipseed, A., Guenther, A. B., Karl, T. G., Day, D. A., Gochis, D., Huffman, J. A., Prenni, A. J., Levin, E. J. T., Kreidenweis, S. M., DeMott, P. J., Tobo, Y., Patton, E. G., Hodzic, A., Cui, Y. Y., Harley, P. C., Hornbrook, R. S., Apel, E. C., Monson, R. K., Eller, A. S. D., Greenberg, J. P., Barth, M. C., Campuzano-Jost, P., Palm, B. B., Jimenez, J. L., Aiken, A. C., Dubey, M. K., Geron, C., Offenberg, J., Ryan, M. G., Fornwalt, P. J., Pryor, S. C., Keutsch, F. N., DiGangi, J. P., Chan, A. W. H., Goldstein, A. H., Wolfe, G. M., Kim, S., Kaser, L., Schnitzhofer, R., Hansel, A., Cantrell, C. A., Mauldin, R. L., and Smith, J. N.: Overview of the Manitou Experimental Forest Observatory: site description and selected science results from 2008 to 2013, Atmos. Chem. Phys., 14, 6345–6367, https://doi.org/10.5194/acp-14-6345-2014, 2014.
Praplan, A. P., Tykkä, T., Chen, D., Boy, M., Taipale, D., Vakkari, V., Zhou, P., Petäjä, T., and Hellén, H.: Long-term total OH reactivity measurements in a boreal forest, Atmos. Chem. Phys., 19, 14431–14453, https://doi.org/10.5194/acp-19-14431-2019, 2019.
Ramasamy, S., Nagai, Y., Takeuchi, N., Yamasaki, S., Shojia, K., Ida, A., Jones, C., Tsurumaru, H., Suzuki, Y., Yoshino, A., Shimada, K., Nakashima, Y., Kato, S., Hatakeyama, S., Matsuda, K., and Kajii, Y.: Comprehensive measurements of atmospheric OH reactivity and trace species within a suburban forest near Tokyo during AQUAS-TAMA campaign, Atmos. Environ., 184, 166–176, https://doi.org/10.1016/j.atmosenv.2018.04.035, 2018.
Ren, X. R., Harder, H., Martinez, M., Lesher, R. L., Oliger, A., Shirley, T., Adams, J., Simpas, J. B., and Brune, W. H.: HOx concentrations and OH reactivity observations in New York City during PMTACS-NY2001, Atmos. Environ., 37, 3627–3637, https://doi.org/10.1016/S1352-2310(03)00460-6, 2003.
Ren, X. R., Brune, W. H., Oliger, A., Metcalf, A. R., Simpas, J. B., Shirley, T., Schwab, J. J., Bai, C. H., Roychowdhury, U., Li, Y. Q., Cai, C. X., Demerjian, K. L., He, Y., Zhou, X. L., Gao, H. L., and Hou, J.: OH, HO2, and OH reactivity during the PMTACS-NY Whiteface Mountain 2002 campaign: Observations and model comparison, J. Geophys. Res.-Atmos., 111, D10s03, https://doi.org/10.1029/2005jd006126, 2006.
Rinne, J., Ruuskanen, T. M., Reissell, A., Taipale, R., Hakola, H., and Kulmala, M.: On-line PTR-MS measurements of atmospheric concentrations of volatile organic compounds in a European boreal forest ecosystem, Boreal Environ. Res., 10, 425–436, 2005.
Ruuskanen, T. M., Müller, M., Schnitzhofer, R., Karl, T., Graus, M., Bamberger, I., Hörtnagl, L., Brilli, F., Wohlfahrt, G., and Hansel, A.: Eddy covariance VOC emission and deposition fluxes above grassland using PTR-TOF, Atmos. Chem. Phys., 11, 611–625, https://doi.org/10.5194/acp-11-611-2011, 2011.
Sanchez, D.: Towards the closure of OH reactivity and volatile organic compound budget in the troposphere using in situ observations, PhD thesis, Deaprtment of Earth System Science, University of California, Irvine, 2019.
Sanchez, D., Jeong, D., Seco, R., Wrangham, I., Park, J.-H., Brune, W. H., Koss, A., Gilman, J., de Gouw, J., Misztal, P., Goldstein, A., Baumann, K., Wennberg, P. O., Keutsch, F. N., Guenther, A., and Kim, S.: Intercomparison of OH and OH reactivity measurements in a high isoprene and low NO environment during the Southern Oxidant and Aerosol Study (SOAS), Atmos. Environ., 174, 227–236, https://doi.org/10.1016/j.atmosenv.2017.10.056, 2018.
Saunders, S. M., Jenkin, M. E., Derwent, R. G., and Pilling, M. J.: Protocol for the development of the Master Chemical Mechanism, MCM v3 (Part A): tropospheric degradation of non-aromatic volatile organic compounds, Atmos. Chem. Phys., 3, 161–180, https://doi.org/10.5194/acp-3-161-2003, 2003.
Seco, R., Penuelas, J., and Filella, I.: Short-chain oxygenated VOCs: Emission and uptake by plants and atmospheric sources, sinks, and concentrations, Atmos. Environ., 41, 2477–2499, https://doi.org/10.1016/j.atmosenv.2006.11.029, 2007.
Shirley, T. R., Brune, W. H., Ren, X., Mao, J., Lesher, R., Cardenas, B., Volkamer, R., Molina, L. T., Molina, M. J., Lamb, B., Velasco, E., Jobson, T., and Alexander, M.: Atmospheric oxidation in the Mexico City Metropolitan Area (MCMA) during April 2003, Atmos. Chem. Phys., 6, 2753–2765, https://doi.org/10.5194/acp-6-2753-2006, 2006.
Sinha, V., Williams, J., Crowley, J. N., and Lelieveld, J.: The Comparative Reactivity Method – a new tool to measure total OH Reactivity in ambient air, Atmos. Chem. Phys., 8, 2213–2227, https://doi.org/10.5194/acp-8-2213-2008, 2008.
Sinha, V., Williams, J., Lelieveld, J., Ruuskanen, T. M., Kajos, M. K., Patokoski, J., Hellen, H., Hakola, H., Mogensen, D., Boy, M., Rinne, J., and Kulmala, M.: OH Reactivity Measurements within a Boreal Forest: Evidence for Unknown Reactive Emissions, Environ. Sci. Technol., 44, 6614–6620, https://doi.org/10.1021/Es101780b, 2010.
Sinha, V., Williams, J., Diesch, J. M., Drewnick, F., Martinez, M., Harder, H., Regelin, E., Kubistin, D., Bozem, H., Hosaynali-Beygi, Z., Fischer, H., Andrés-Hernández, M. D., Kartal, D., Adame, J. A., and Lelieveld, J.: Constraints on instantaneous ozone production rates and regimes during DOMINO derived using in-situ OH reactivity measurements, Atmos. Chem. Phys., 12, 7269–7283, https://doi.org/10.5194/acp-12-7269-2012, 2012.
Sullivan, J. T., McGee, T. J., Stauffer, R. M., Thompson, A. M., Weinheimer, A., Knote, C., Janz, S., Wisthaler, A., Long, R., Szykman, J., Park, J., Lee, Y., Kim, S., Jeong, D., Sanchez, D., Twigg, L., Sumnicht, G., Knepp, T., and Schroeder, J. R.: Taehwa Research Forest: a receptor site for severe domestic pollution events in Korea during 2016, Atmos. Chem. Phys., 19, 5051–5067, https://doi.org/10.5194/acp-19-5051-2019, 2019.
Whalley, L. K., Stone, D., Bandy, B., Dunmore, R., Hamilton, J. F., Hopkins, J., Lee, J. D., Lewis, A. C., and Heard, D. E.: Atmospheric OH reactivity in central London: observations, model predictions and estimates of in situ ozone production, Atmos. Chem. Phys., 16, 2109–2122, https://doi.org/10.5194/acp-16-2109-2016, 2016.
Williams, J., Poschl, U., Crutzen, P. J., Hansel, A., Holzinger, R., Warneke, C., Lindinger, W., and Lelieveld, J.: An atmospheric chemistry interpretation of mass scans obtained from a proton transfer mass spectrometer flown over the tropical rainforest of Surinam, J. Atmos. Chem., 38, 133–166, https://doi.org/10.1023/A:1006322701523, 2001.
Yang, Y., Shao, M., Keßel, S., Li, Y., Lu, K., Lu, S., Williams, J., Zhang, Y., Zeng, L., Nölscher, A. C., Wu, Y., Wang, X., and Zheng, J.: How the OH reactivity affects the ozone production efficiency: case studies in Beijing and Heshan, China, Atmos. Chem. Phys., 17, 7127–7142, https://doi.org/10.5194/acp-17-7127-2017, 2017.
Yang, Y. D., Shao, M., Wang, X. M., Nolscher, A. C., Kessel, S., Guenther, A., and Williams, J.: Towards a quantitative understanding of total OH reactivity: A review, Atmos. Environ., 134, 147–161, https://doi.org/10.1016/j.atmosenv.2016.03.010, 2016.
Yuan, B., Warneke, C., Shao, M., and de Gouw, J. A.: Interpretation of volatile organic compound measurements by proton-transfer-reaction mass spectrometry over the deepwater horizon oil spill, Int. J. Mass Spectrom., 358, 43–48, https://doi.org/10.1016/j.ijms.2013.11.006, 2014.
Zannoni, N., Gros, V., Sarda Esteve, R., Kalogridis, C., Michoud, V., Dusanter, S., Sauvage, S., Locoge, N., Colomb, A., and Bonsang, B.: Summertime OH reactivity from a receptor coastal site in the Mediterranean Basin, Atmos. Chem. Phys., 17, 12645–12658, https://doi.org/10.5194/acp-17-12645-2017, 2017.
Zhao, J., Zhang, R. Y., Fortner, E. C., and North, S. W.: Quantification of hydroxycarbonyls from OH-isoprene reactions, J. Am. Chem. Soc., 126, 2686–2687, https://doi.org/10.1021/ja0386391, 2004.