the Creative Commons Attribution 4.0 License.
the Creative Commons Attribution 4.0 License.
 | 26 Apr 2021
In-depth characterization of submicron particulate matter inter-annual variations at a street canyon site in northern Europe
Aku Helin
Minna Aurela
Kimmo Teinilä
Milla Friman
Leena Kangas
Jarkko V. Niemi
Harri Portin
Anu Kousa
Liisa Pirjola
Topi Rönkkö
Sanna Saarikoski
Atmospheric aerosols play an important role in air pollution. Aerosol particle chemical composition is highly variable depending on the season, hour of the day, day of the week, meteorology, and location of the measurement site. Long measurement periods and highly time-resolved data are required in order to achieve a statistically relevant amount of data for assessing those variations and evaluating pollution episodes. In this study, we present continuous atmospheric PM1 (particulate matter < 1 µm) concentration and composition measurements at an urban street canyon site located in Helsinki, Finland. The study was performed for 4.5 years (2015–2019) and involved highly time-resolved measurements by taking advantage of a suite of online state-of-the-art instruments such as an aerosol chemical speciation monitor (ACSM), a multi-angle absorption photometer (MAAP), a differential mobility particle sizer (DMPS), and an Aethalometer (AE). PM1 consisted mostly of organics, with mean mass concentrations of 2.89 µg m−3 (53 % of PM1) followed by inorganic species (1.56 µg m−3, 29 %) and equivalent black carbon (eBC, 0.97 µg m−3, 18 %). A trend analysis revealed a decrease in BC from fossil fuel (BCFF), organics, and nitrate over the studied years. Clear seasonal and/or diurnal variations were found for the measured atmospheric PM1 constituents. Particle number and mass size distributions over different seasons revealed the possible influence of secondary organic aerosols (SOAs) during summer and the dominance of ultrafine traffic aerosols during winter. The seasonality of measured constituents also impacted the particle's coating and absorptive properties. The investigation of pollution episodes observed at the site showed that a large fraction of aerosol particle mass was comprised of inorganic species during long-range transport, while during local episodes eBC and organics prevailed together with elevated particle number concentration. Overall, the results increased knowledge of the variability of PM1 concentration and composition in a Nordic traffic site and its implications on urban air quality. Considering the effects of PM mitigation policies in northern Europe in the last decades, the results obtained in this study may be considered illustrative of probable future air quality challenges in countries currently adopting similar environmental regulations.
- Article
(6231 KB) - Full-text XML
-
Supplement
(2322 KB) - BibTeX
- EndNote


Increasing concentrations of ambient particulate matter (PM) due to fast industrialization, urbanization, and economic growth have become a worldwide concern during the past decades. PM is recognized as one of the most problematic air pollutants due to its global adverse effects on human health, climate, and ecosystems as well as related economic impacts (e.g. IPCC, 2013; Lelieveld et al., 2015). The World Health Organization (WHO) has estimated that, globally, 4.2 million premature deaths were attributable to outdoor ambient air pollution in 2016 (WHO, 2018), from which PM may play an important contribution even at low levels (e.g. Feng et al., 2016). Atmospheric particles can also impact the Earth's climate (Pöschl, 2005), and they represent one of the largest sources of uncertainty in predicting future climate change (IPCC, 2018), primarily due to the complex nature of the particles. Furthermore, PM is responsible for detrimental local effects, such as smog production, decrease in visibility, and damage to crops, forests, and cultural heritage sites (e.g. Bonazza et al., 2016; von Schneidemesser et al., 2015; Wang et al., 2009).
Atmospheric PM is a complex mixture of organic and inorganic species, originating from a variety of biogenic and anthropogenic sources, and of black carbon (BC) formed from incomplete combustion of fossil fuels and biomass (e.g. Goldberg, 1985; Jiang et al., 2019; Zhang et al., 2015). The main constituents of ambient PM are carbonaceous compounds, inorganic ions, mineral dust, trace elements, and water (e.g. Gani et al., 2019; Myhre et al., 2013). The absolute and relative concentrations of these constituents have a large spatial and temporal variation (e.g. Jimenez et al., 2009; Myhre et al., 2013). Atmospheric PM concentration and composition have been increasingly studied in different regions of the world, and the mitigation measures for reducing PM concentrations are under discussion and implementation (e.g. Chuwah et al., 2016; Davidson et al., 2005).
In general, PM concentrations in Nordic European countries are low. Earlier studies and monitoring performed in Nordic metropolitan areas revealed mean PM1 and PM2.5 concentrations of about 5–10 µg m−3 (Aurela et al., 2015; EEA, 2019; Teinilä et al., 2019; Vogt et al., 2013). The main local anthropogenic fine particle sources in Nordic cities are residential wood burning, traffic-related emissions, energy production, and industrial processes (Korhonen et al., 2019), but pollution episodes originating from long-range transport can also significantly influence the measured atmospheric aerosols (e.g. Molnár et al., 2017; Niemi et al., 2009). However, previous studies have been lacking either long-term measurement periods or comprehensive chemical characterization of PM1. A few long-lasting campaigns have been performed in northern Europe, but not in urban areas (e.g. Heikkinen et al., 2020) or only involving measurements of specific elements such as BC (e.g. Luoma et al., 2020).
In this study, we present continuous in-depth chemical characterization and size distribution measurements of atmospheric PM1 at a busy street canyon site located in Helsinki, Finland. This study was performed during a period of 4.5 years, by employing a variety of instruments for characterizing PM1: an aerosol chemical speciation monitor (ACSM) for the characterization of non-refractory PM1 (NR-PM1) constituents, a multi-angle absorption photometer (MAAP) for the measurement of equivalent black carbon (eBC), and an Aethalometer for the source apportionment of eBC. Results are compared with other data concurrently measured at the sampling site, including particle number and mass concentrations, particle size distributions, atmospheric oxidants (O3, NOx), and meteorological variables. This study focuses on the diurnal, seasonal, and inter-annual variation in PM1 concentration, composition, and size distributions in a Nordic traffic environment. Results give insights into how the mitigation actions targeted at traffic emissions are affecting the PM constituents in northern Europe.
2.1 Measurement site
Measurements were carried out in Helsinki, Finland, at an urban supersite measurement station (street address Mäkelänkatu 50) located in a street canyon and operated by the Helsinki Region Environmental Services Authority (HSY). The measurement site is situated at the curbside of one of the main streets in Helsinki and represents a typical northern European traffic site. The street consists of six lanes, two rows of trees, two tram lines, and two pavements, resulting in a total width of 42 m (Hietikko et al., 2018). During the measurement campaign, the average number of vehicles driving along the street during weekdays was 28 000 d−1 and the share of heavy-duty vehicles was 10 %–12 % (statistics from the City of Helsinki). The residential area surrounding the street canyon uses mostly thermal energy from district heating, and therefore the local residential biomass burning contribution to PM is expected to be negligible. Apart from maintenance breaks, measurements spanned from June 2015 to December 2019. Figure S1 in the Supplement shows the measurement periods of the different instruments employed in this study.
2.2 Measurements of atmospheric aerosol particles
The instruments were installed inside a measurement container. The outdoor air was drawn from the roof of the measurement station (4 ; metres above the ground) through a 50 mm stainless-steel tube with an air blower to provide large flow (> 200 L min−1) and reduce particle losses. From that large flow, measurement instruments were taking smaller sample flows as described in the following sections.
2.2.1 Aerosol chemical speciation monitor
A quadrupole-aerosol chemical speciation monitor (Q-ACSM, Ng et al. (2011), Aerodyne Research Inc., Billerica, USA) was employed for the characterization of non-refractory PM1 (total organics, sulfate, nitrate, ammonium, and chloride). The ACSM system sampled ambient air with a by-pass pump (3 L min−1). A cyclone was used to remove particles larger than PM2.5. A Nafion drier was installed prior to the instrument inlet. The relative humidity (RH) of the sample flow was mainly below 30 %–40 %. A subsample was then taken by the ACSM at ∼ 0.08 L min−1 through a 100 µm diameter critical orifice located at the inlet of an aerodynamic lens. The aerodynamic lens is used to focus submicron particles into a high-vacuum system. The typical 50 % transmission efficiency range in vacuum aerodynamic diameter (Dva) of the lens is ca. 90–650 nm (Liu et al., 2007). After the lens, non-refractory particles are flash vaporized at 600 ∘C and ionized by electron ionization (70 eV). The resulting ions are then separated and detected, according to their mass-to-charge () ratios, by a Prisma quadrupole mass spectrometer (Pfeiffer Vacuum, model QMS220). The detected ions were classified into inorganic and organic fragments using a fragmentation table presented by Allan et al. (2004).
During data acquisition, filtered and particle-laden air were measured interchangeably by averaging 28 scans, resulting in a circa 30 min time resolution. The filtered signals (gases) are subtracted from the particle-laden signal (particles + gases) yielding only the particles' signal. The effective nitrate response factor () and relative ionization efficiency of sulfate () were determined by performing an instrumental calibration to convert analyte signals into nitrate equivalent mass concentrations using dried and size-selective (300 nm of mobility diameter) ammonium nitrate and ammonium sulfate particles. An effusive source of naphthalene, located in the detection region, is used as a reference for and ion transmission calibrations. Post-processing of data was performed using ACSM local v. 1.6.1.0 within the Igor Pro v. 6.37 (WaveMetrics, OR, USA).
The collection efficiency was calculated according to Middlebrook et al. (2012), by determining a chemical time-dependent collection efficiency to correct particle losses due to bouncing off the vaporizer before flash vaporization (Fig. S2). As an exception from Middlebrook et al. (2012), a collection efficiency of 0.45 was used for samples when ammonium was below the detection limit. The limit of detection (LOD) for ammonium was determined by adding a HEPA filter to the sampling line, averaging the measured mass concentrations of ammonium using a collection efficiency of 0.5 and multiplying the resulting standard deviation by 3. The obtained LOD value for ammonium was 0.232 µg m−3.
2.2.2 Multi-angle absorption photometer
A multi-angle absorption photometer (MAAP, model 5012, Thermo Fisher Scientific) was used to measure eBC mass concentrations in real time. MAAP has been described in detail by Petzold and Schönlinner (2004). Briefly, MAAP measures the change in optical transmission as particles are collected on a filter, in combination with the simultaneous measurement of scattered light with multiple detectors to reduce instrumental artefacts and to provide a more accurate measurement of eBC. A mass absorption cross-section value of 6.6 m2 g−1 was used to convert the measured light absorption coefficient value (at wavelength 670 nm) to eBC mass concentration. The flow to MAAP was 11 L min−1, and a PM1 inlet was used. The measurements' time resolution was set to 1 min. The measured eBC from MAAP was used to calculate the coating factor (CF) according to Drinovec et al. (2017), which defined CF as the mass of potential material available for the coating of BC particles, expressed as the sum of sulfate, ammonium, nitrate, and organic mass, divided by the eBC mass.
2.2.3 Aethalometer
For the source apportionment of eBC, a dual-spot Aethalometer (AE33, Magee Scientific) was used (Drinovec et al., 2015; Hansen et al., 1983). The AE33 allows for the real-time measurement of aerosol particle light absorption and corresponding eBC mass concentrations at seven different wavelengths (370–950 nm), and it compensates for filter loading artefacts and tape advancement errors when measuring eBC concentrations (Drinovec et al., 2015). The sampling flow rate was set to 5 L min−1, the inlet cut-off size was 1 µm (sharp cut cyclone, BGI model SCC1.197), and the measurement time resolution was set to 1 min. The filter tapes (Magee Scientific) consisted of TFE-coated glass fibre filters, and during the long-term measurements different types of tapes were used. From October 2015 to December 2017 a M8020 filter tape was employed (apart from a period from September 2016 to October 2016 when the filter tape was a M8050), while from January 2018 to December 2019 the filter tape was a M8060. As the manufacturers' research report has shown (Magee Scientific, 2017), the M8050 tape could not have been used for eBC source apportionment, and thus the data from the 2 months when this tape was used (autumn 2016) were rejected.
To estimate the contribution from wood burning and fossil fuel to eBC, the source apportionment method referred to as the Aethalometer model was employed (Sandradewi et al., 2008). Briefly, the light absorption coefficients measured at wavelengths of 470 and 950 nm were used to calculate the biomass burning percentage (BB), which was then used to determine the eBC from fossil fuel combustion (BCFF) and from wood burning (BCWB) concentrations. The fossil fuel absorption Ångström exponent (αFF) used in this study was 1.1, while the corresponding exponent for wood burning (αWB) was 1.6. These α values have been previously optimized for the sampling site of our study (Helin et al., 2018). For the calculation of BCFF and BCWB mass concentrations, the eBC measured by MAAP was used. In addition, the filter-loading effect compensation parameter (k), which in AE33 is used to correct the light absorption coefficient in real time and is given directly as data output values, was used for interpreting results.
The manufacturers' research report (Magee Scientific, 2017) has specified that the BB percentage results are 10 % larger with the filter tape M8060 than with the filter tape M8020. In this study, it was estimated that the difference in BB percentage between the filter tape types was approximately 12 %; thus the results after 2018 were post-corrected by applying this correction factor to account for the artificial tape-induced change in the BB percentage (Fig. S3).
2.2.4 Differential mobility particle sizer
Particle number size distributions for the sub-micrometre particles were determined by using a differential mobility particle sizer (DMPS; Knutson and Whitby, 1975). DMPS has a differential mobility analyser (DMA, Vienna type), for the selection of particle sizes, and a condensation particle counter (CPC, A20 Airmodus) to obtain particle number concentrations for each size bin. The scanned size range in this study was from 6 to 801 nm (mobility diameter, Dm). In order to match the sizes of particles measured by the ACSM and MAAP with the particle sizes measured by DMPS for comparison purposes, the Dm was converted into Dva that corresponds to the diameter of particles measured by ACSM. For that purpose, the particle density was determined by using the chemical composition data from the ACSM and MAAP and calculating a chemical time-dependent gravimetric density based on the following Eq. (1) from Salcedo et al. (2006):
The calculated mean density was 1.42 g cm−3. This mean density value was then employed to convert Dm into Dva. A time series of density can be found in the Supplement (Fig. S2). The density obtained for each data point was subsequently used to convert particle number concentration (PNC) into particle mass concentration (PMC), by selecting Dm between 6 and 549 nm from DMPS measurements. The upper Dm size range value corresponds to a Dva of ∼ 780 nm when employing a density of 1.42 g cm−3. Even though there is an associated uncertainty on the selected size range, since it depends on the calculated density and the ACSM transmission efficiency not being 100 % for all size ranges, the resulting PMC was considered a reasonable approximation to the one estimated from ACSM and MAAP measurements.
2.2.5 Auxiliary measurements
Basic air quality parameters were measured at the Supersite with the following instruments: nitrogen oxides (NOx) with Horiba APNA-370, ozone (O3) with Horiba APOA-370, and fine particles (PM2.5) with TEOM 1405. Temperature (T), RH, and precipitation were also measured at the supersite, while wind speed and wind direction measurements were carried at a meteorological station above roof level (53 ; metres above the land surface) located approximately 500 m to the north-west from the measurement site. The mixing height was calculated using the model (MPP-FMI) presented by Karppinen et al. (2000). The wind speed and mixing heights were used to evaluate the role of atmospheric dilution in pollutant concentrations by determining the ventilation coefficient (VC), which has been previously used in other studies to characterize dilution of pollutants (e.g. Gani et al., 2019; Sujatha et al., 2016).
2.3 Data handling
Most air quality and meteorological parameters were monitored with a 1 min time resolution throughout the corresponding sampling periods (Fig. S1). However, hourly mean or median values were used for data analysis. All data shown are displayed in local time (UTC+2/UTC+3). As required in the EU air quality regulations, all aerosol particle components were calculated to prevailing T and p conditions, while gases are presented in STP conditions (+20 ∘C).
The full time series of individual air quality parameters was employed for most of the data handling. However, since the measurement periods of used instruments differed slightly (Fig. S1), the data captured have been harmonized in some analysis to account for the comparability of results. For example, to calculate the relative contribution of aerosol particle constituents to PM2.5, only the concomitant measurement points between the TEOM, ACSM, MAAP, and Aethalometer were used.
Since the ACSM response was varying over time (Fig. S4a), an additional correction of ACSM was required. For that purpose, monthly mean values of NR-PM1 constituents measured by ACSM and eBC measured by MAAP were used to calculate the mean density per month, which was then employed to determine the monthly mean mass concentration of particles measured by DMPS. The obtained mass concentration was subtracted by eBC and divided by NR-PM1 to obtain monthly correction factors that were employed to ACSM data. A similar correction has also been applied in Heikkinen et al. (2020). The corrected NR-PM1 values were subsequently used to recalculate the particle density and determine the PMC from DMPS measurements as referred to in Sect. 2.2.4. This approach provides a reasonable estimate of NR-PM1 atmospheric concentrations. However, it has an associated uncertainty, which is expected to be minor considering that it is mostly determined by the particle density used in the correction, and the particle components are in both the nominator and denominator in the density Eq. (1).
Table 1The concentrations of PM1 constituents measured by ACSM (10 June 2015–31 December 2019) and MAAP (1 June 2015–31 December 2019) and of PM2.5 measured by TEOM (1 June 2015–31 December 2019). NR-PM1 was obtained by summing all the constituents measured by the ACSM, while PM1 is the sum of NR-PM1 and eBC from MAAP. The eBC from fossil fuel combustion (BCFF) and from wood burning (BCWB) measured by the Aethalometer (30 November 2015–31 December 2019) is also included. Hourly mean (± standard deviation), median (± median absolute deviation), 25th and 75th percentiles, and maximum concentrations are included.

In order to perform a trend analysis for the individual aerosol particle components, the Theil–Sen approach was used (Sen, 1968; Theil, 1950). The Theil–Sen slope estimator was applied by using the Theil–Sen function of the openair R package in R software (Carslaw, 2019; Carslaw and Ropkins, 2012; R Core Team, 2020). Monthly mean values were derived by using a data coverage criterion of ≥ 30 %, and the time series were deseasonalized by using the stl (seasonal trend decomposition using loess) function (Carslaw, 2019). Since the stl function does not allow for missing data, the missing months were linearly interpolated (Carslaw, 2019). Autocorrelation was taken into account in the time series (Carslaw, 2019). The trend analysis output includes the resulting Theil–Sen slope estimate value with the 95 % confidence interval and the corresponding p value indicating the significance level. A similar approach for trend analysis has been previously used in several studies (e.g. Font and Fuller, 2016; Grange et al., 2020; Henschel et al., 2015; Masiol et al., 2017; Masiol and Harrison, 2015; Munir et al., 2013).
The potential source areas of particles during long-range-transport episodes were investigated using back trajectories produced by the Hybrid Single Particle Lagrangian Integrated Trajectory (HYSPLIT) model (Rolph et al., 2017; Stein et al., 2015).
Aerosol particle chemical composition and concentration are subject to significant variations over the seasons and years because of changes in anthropogenic and biogenic activities, meteorology, and political measures to improve air quality. In this section, we discuss airborne particle chemical composition, concentration, and other critical parameters influencing air quality. A general description of meteorology at the supersite station during the measurement period (2015–2019) is presented in Sect. S2 of the Supplement.
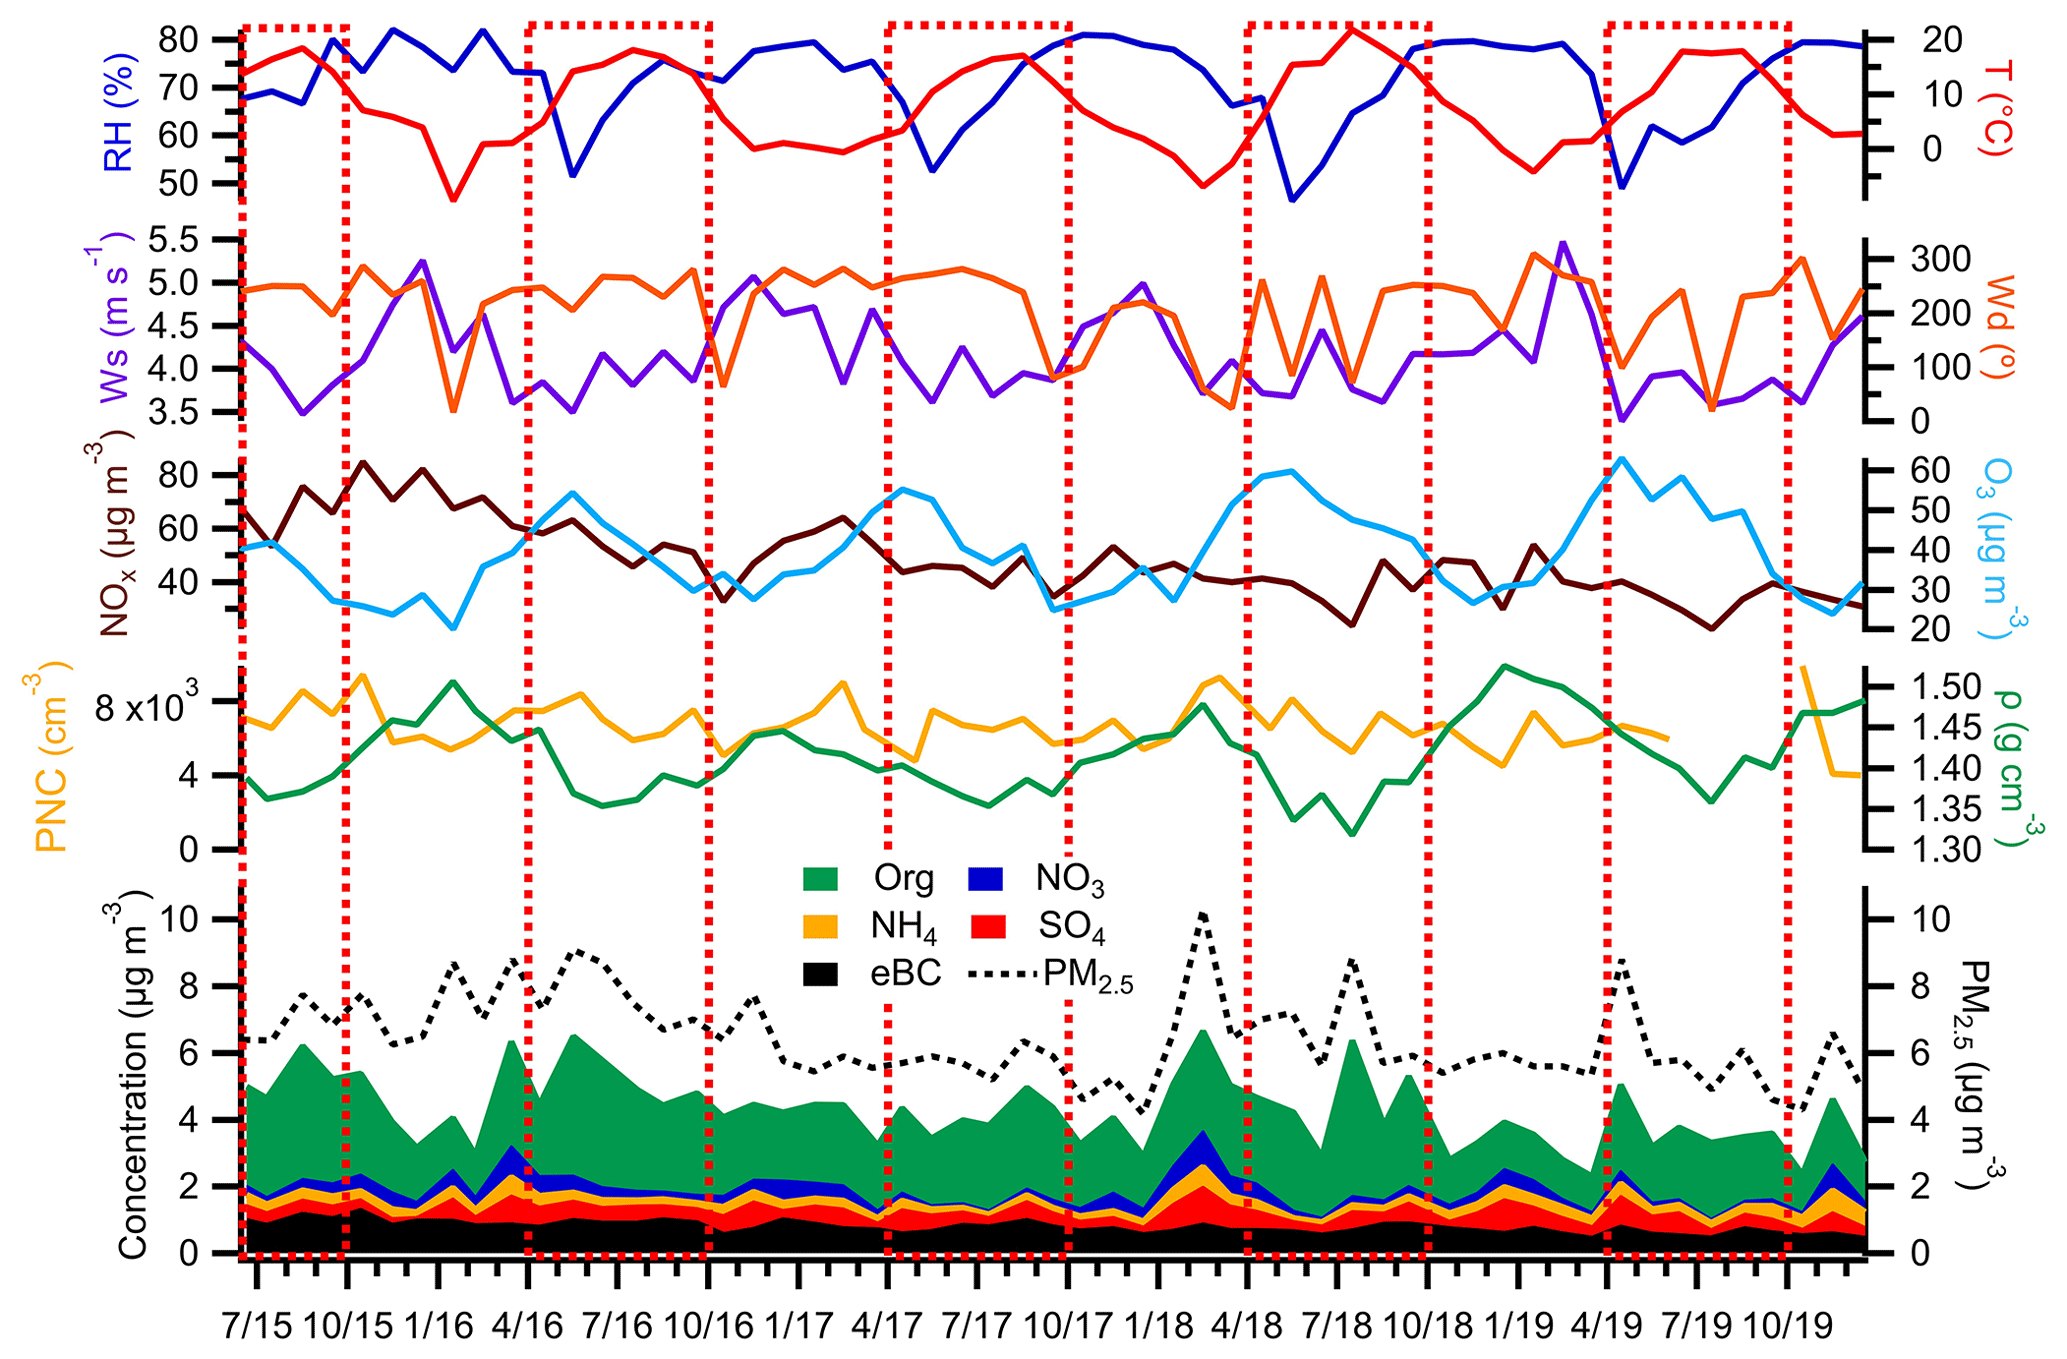
Figure 1Temporal variation (monthly median) of PM1 chemical species (organics, NO3, NH4, SO4, and eBC), PM2.5 (determined by TEOM), PNC (measured by DMPS), particle density, atmospheric oxidants (NOx and O3), and the most relevant meteorological parameters (Wd (monthly mean), Ws (monthly mean), T, RH). Red dotted rectangles represent the warmest period of the year (April–September).
3.1 Trends in chemical composition and concentration of submicron aerosol particles
The mean and median concentrations of PM2.5 measured by TEOM and PM1 constituents measured by ACSM and MAAP are represented in Table 1. The BCFF and BCWB measured by an Aethalometer are also included. For an overview, the monthly median concentrations of organics, sulfate, nitrate, ammonium, eBC, PM2.5, particle number concentration (PNC), particle density, and the most relevant meteorological parameters (T, RH, Ws (wind speed, monthly mean), Wd (wind direction, monthly mean)), and gases (NOx and O3) are shown in Fig. 1.

Figure 2Trend analysis results of selected pollutants (a: PM2.5, b: organics, c: NO3, d: NH4, e: SO4, f: eBC, g: NOx, h: BCFF, i: BCWB). The plots show the deseasonalized monthly mean concentrations of different pollutants. The solid red line shows the trend estimate, and the dashed red lines show the 95 % confidence intervals for the trend. The overall trend value is presented at the top centre of each plot as corresponding units per year, and the 95 % confidence intervals in the slope are presented in the brackets. The symbols shown next to each trend estimate indicate the statistical significance of the trend estimate (p<0.001 = , p<0.05 = ∗, and p<0.1 = +).
The measured PM2.5 mean concentrations were 21 %–25 % lower in our study than the concentrations measured between 1999–2001 and 2013–2015 at urban traffic sites in Helsinki, where the 3- and 2-year PM2.5 mean concentrations were 9.6 µg m−3 (Laakso et al., 2003) and 9.1 µg m−3 (Teinilä et al., 2019), respectively. Similarly, PM1 concentrations were about 25 % lower in our results when compared to the measurements conducted in 2013–2015 (Teinilä et al., 2019). In our study, a decrease of 0.46 (p< 0.05) was observed for PM2.5 from 2015–2019 (Fig. 2a). This decrease has also been observed by Luoma et al. (2020) at the same sampling site from 2015–2018. The reduction in PM2.5 has been observed in Helsinki during the last decade, at both traffic and background sites (Laakso et al., 2003; Lorelei de Jesus et al., 2020; Luoma et al., 2020). This PM2.5 reduction has been generally observed in the European Union (EU) due to decreasing pollutant emissions, which also impacts the measured concentrations caused by long-range transport (EEA, 2019). Furthermore, the local PM10 from street dust has decreased in Helsinki by employing efficient cleaning methods and a dust binding agent (CaCl2), which also reduces PM2.5 (Stojiljkovic et al., 2019).
The sum of NR-PM1 concentrations measured by ACSM and eBC concentrations measured by MAAP was compared to the mass concentration calculated from the DMPS data (Fig. S4b). A correlation of R2 = 0.84 and a slope of 0.855 ± 0.002 were obtained, showing a reasonable agreement between the measurement techniques considering the nature of these long-term measurements that included periods with both high and low mass loadings. The observed differences from the unity may be attributed to uncertainties in the estimation of density for organics and slight differences in particle size ranges measured by the ACSM, MAAP, and DMPS. A default density value of 1.2 g cm−3 has been used for organics, although the density can vary between 0.77–1.90 g cm−3 (Turpin and Lim, 2001). In addition, uncertainties associated with the calibration procedure and changes in the transmission efficiency over the size range of measured particles have been previously reported for ACSM analysis (Bressi et al., 2016; Liu et al., 2007) and cannot be excluded in this study. Since most air quality regulation is based on PM2.5 (Council Directive 2008/50/EC, 2008), PM1 from ACSM and MAAP was also compared with PM2.5 measured by TEOM. As shown in Fig. S5, the slope of PM1 vs. PM2.5 was 0.613 ± 0.003, indicating that slightly more than half of PM2.5 consisted of PM1 particles.
Organics dominated the PM1 mass concentrations over the measurement period. The trend analysis revealed a statistically significant decrease in organics of 0.26 (p< 0.05, Fig. 2b). Of the inorganic constituents, sulfate dominated (13 % of PM1), followed by nitrate (10 % of PM1) and ammonium (6 % of PM1). Nitrate decreased at a rate of 0.048 (p< 0.10, Fig. 2c), which might be a consequence of decreasing NOx emissions at the measurement site (e.g. Luoma et al., 2020, and Fig. 2g). A decrease in ammonium nitrate during the past years as a result of both increasing temperature and reduced emissions has been also reported in another study (Megaritis et al., 2014). Any statistically significant changes in concentration over the years was not observed for the remaining inorganic constituents measured in this study (Fig. 2d and e).
Statistically significant decreasing trends were observed for eBC and NOx, with reduction rates of 0.14 and 11.01 , respectively (p< 0.001, Fig. 2f and g). A similar decrease in eBC concentrations of 0.09 has been found in another study from 2015–2018 (Luoma et al., 2020). In the same study, the decrease in eBC has also been followed by a 11.00 µg m−3 yearly decrease in NOx, suggesting the dominant implication of vehicle fleet renewal on the observed eBC reduction. In our study, we also performed a trend analysis for the source apportionment of eBC. The trend analysis of BCFF and BCWB revealed that traffic was the main driving force behind the decrease in eBC, with decreasing rates of 0.09 (p< 0.001, Fig. 2h). No significant decreasing trend was found for BCWB (Fig. 2i).
It should be noted that, although all studied time series spanned about 4.5 years, the duration of these measurements might still be slightly short for long-term trend analysis. The uncertainties associated with MAAP and ACSM measurements could have also influenced the trend analysis.
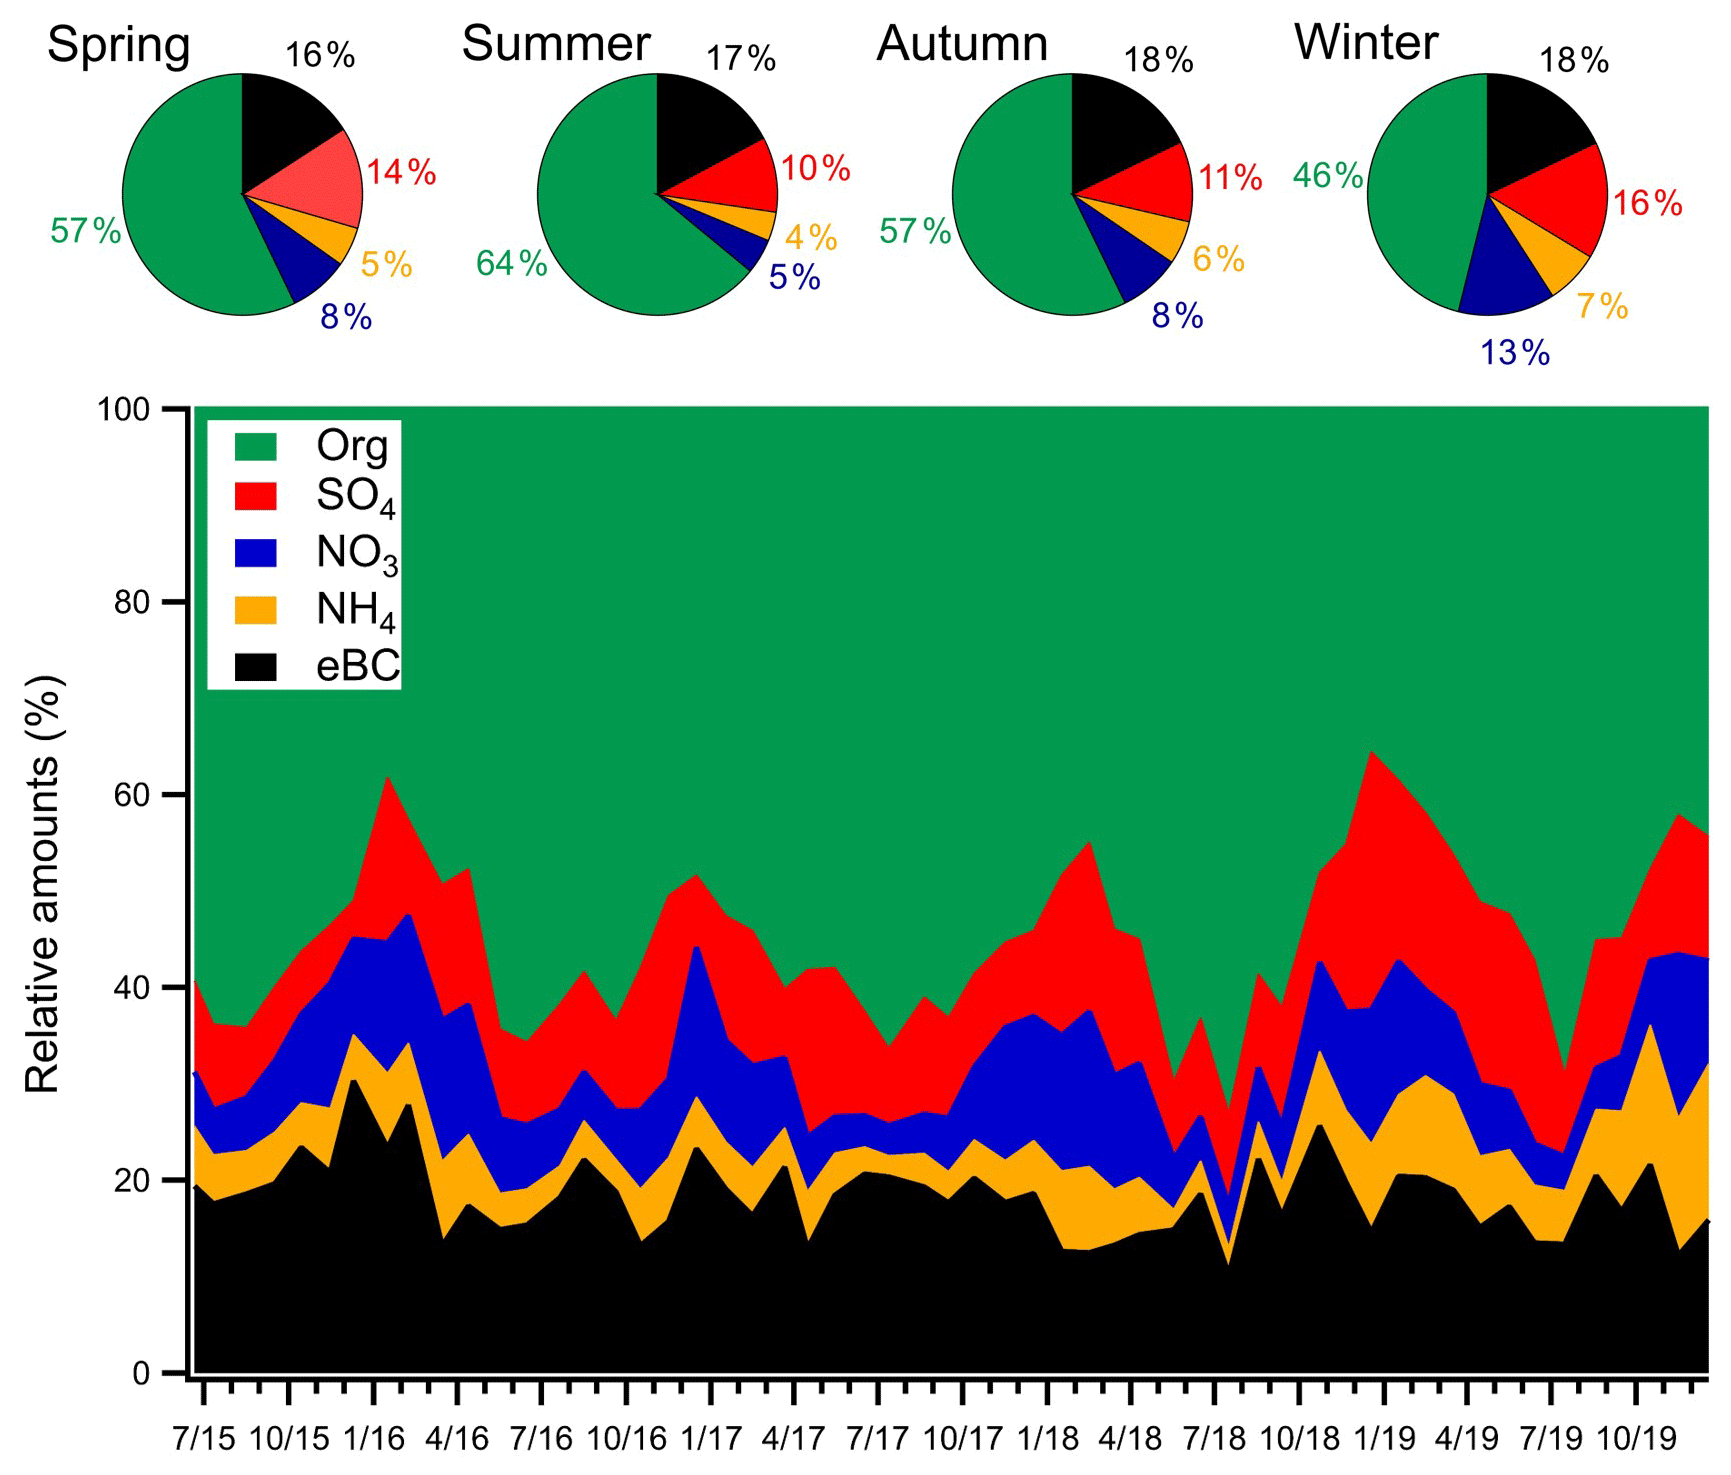
Figure 3Time series of the PM1 species monthly median mass fractions measured by ACSM (Org, SO4, NO3, NH4) and MAAP (eBC). Pie plots represent the relative contribution of each species during different seasons of the year (spring (March–May), summer (June–August), autumn (September–November), and winter (December–February)).
3.2 Seasonal variation in aerosol particle chemical constituents
The fractional contribution of PM1 constituents is represented in Fig. 3. The monthly median contribution of organics varied between 36 % and 73 %. The dominance of organics was particularly evident during summer, with a relative contribution to PM1 of 64 %. The predominance of organics in PM1 has been reported in many other studies performed at urban sites (e.g. Katsanos et al., 2019; Ripoll et al., 2015).
The seasonal median contribution of eBC to PM1 was relatively constant, varying between 16 % and 18 %. However, the eBC contribution in our study was relatively large when compared to previous studies performed in Helsinki, where a 13 % contribution in winter 2010/11 (1 December 2010–7 January 2011; Aurela et al., 2015) and a 11 % contribution between 2013–2015 were observed (May 2013–April 2015; Teinilä et al., 2019). The relative contribution of eBC was also high when compared to some of the studies performed at urban sites around the word (Fig. S6). This is partially explained by the fact that the site of our study was located beside a busy street. Furthermore, the proportion of heavy-duty vehicles, which are mostly powered by diesel engines, was about 10 %–12 % at the sampling site. Therefore, these vehicles are likely contributing significantly to the measured eBC concentrations. This evidence depicts the importance of local traffic emissions to the currently measured PM1.
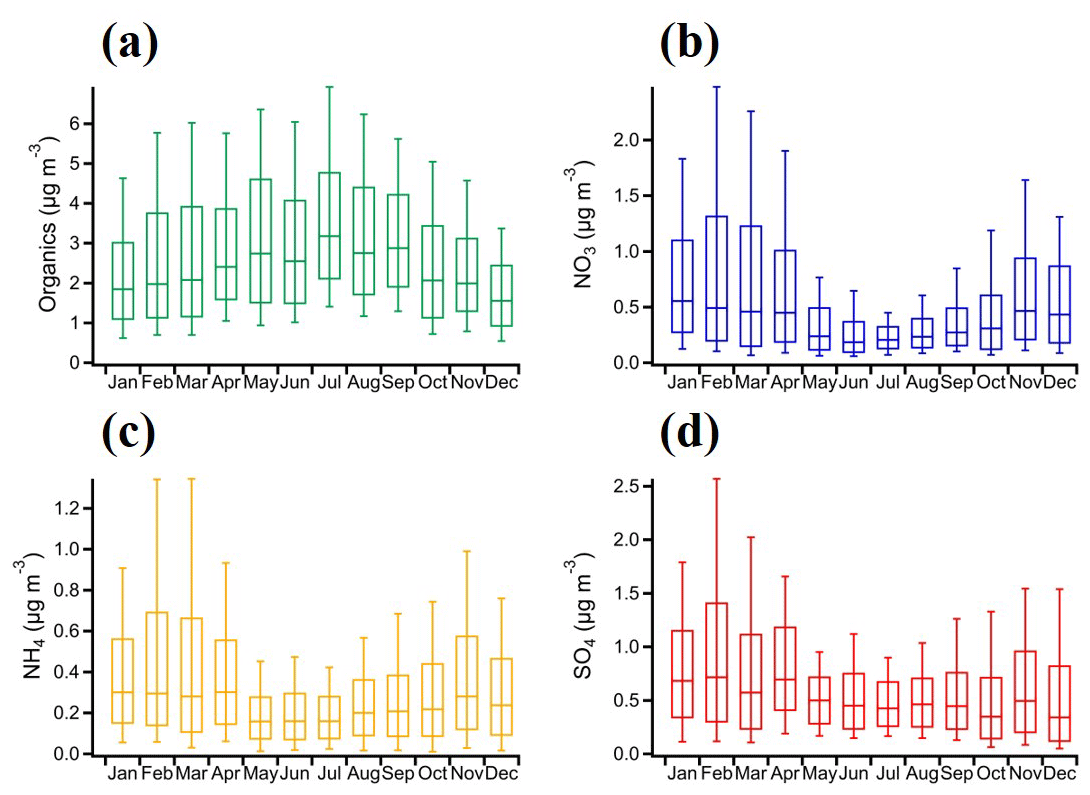
Figure 4Monthly variation in the NR-PM1 constituents (organics, NO3, NH4, and SO4) measured by ACSM. In each box, the mid-line shows the median value for each x value component, the whisker bottom and top correspond to the 10th and 90th percentiles, and the box top and bottom correspond to the 75th and 25th percentiles, respectively.
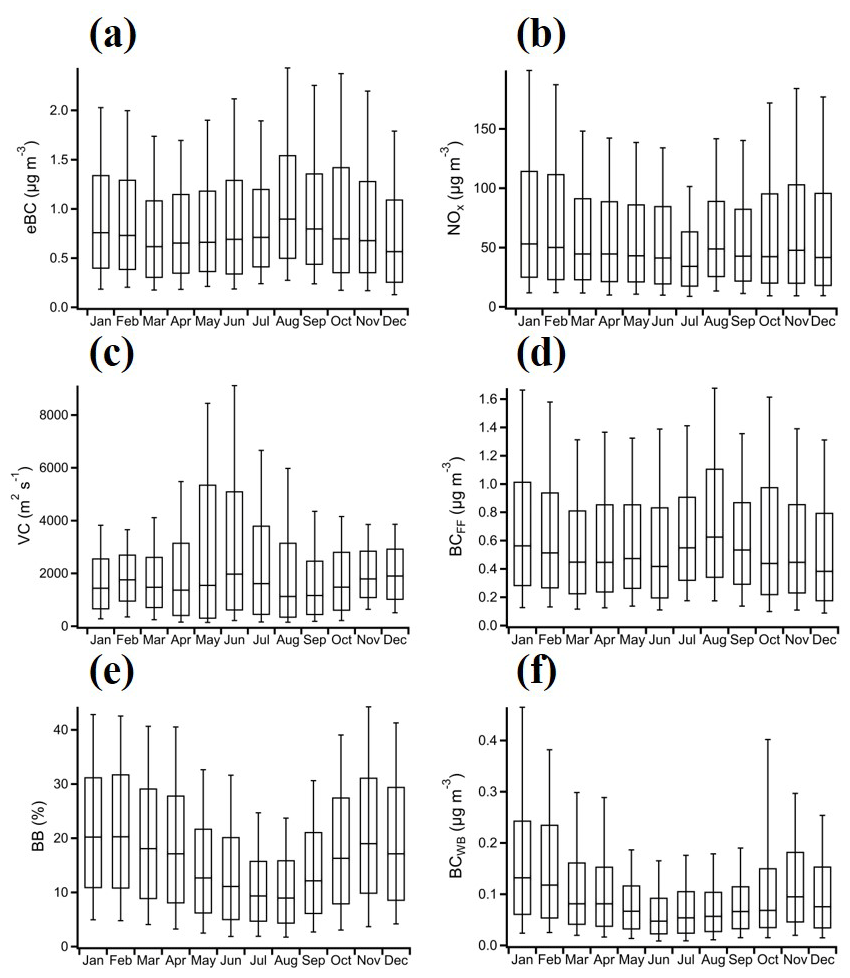
Figure 5Monthly variation in eBC, NOx, VC, BCFF, BB, and BCWB. In each box, the mid-line shows the median value for each x value component, the whisker bottom and top correspond to the 10th and 90th percentiles, and the box top and bottom correspond to 75th and 25th percentiles, respectively.
The monthly variations in the PM1 constituents measured in this study are shown in Figs. 4 and 5. Organics exhibited the largest seasonal variations among all NR-PM1 components (Fig. 4a). The median concentration of organics increased during spring and summer, reaching up to 3.18 µg m−3 in July. This increase in organics is likely linked to the enhancement of local SOA formation from biogenic and/or anthropogenic precursors, as a result of photochemical processes in the atmosphere that are predominant during the warmest periods of the year (e.g. Heikkinen et al., 2020). Furthermore, biogenic SOA can also be regionally transported into the sampling site, which will influence the measured concentration of organics. For nitrate and ammonium, a slight decrease in concentrations was observed during summer (Fig. 4b and c). Nitrate can be formed by traffic activities through the oxidation of NOx (e.g. Zhang et al., 2015), but the high volatility of ammonium nitrate causes its dissociation at high temperatures, which can partially explain the decrease in these PM1 constituents during the warmest months of the year together with changes in VC (Fig. S7). On the other hand, lower temperatures and high RH shift the equilibrium towards the particle phase by favouring the thermodynamic gas-to-particle partitioning of ammonium nitrate (e.g. Zhang et al., 2015). Sulfate had slightly less seasonal variability than organics or nitrate (Fig. 4d), even though higher concentrations were observed during winter.
Interestingly, all inorganics had large variations during winter and early spring. A possible explanation is that, during cold months, there is an intensification of anthropogenic pollution sources of some aerosol particle constituents (e.g. sulfate from coal- and oil-fired energy production and heating sources). This intensification can promote an increase in inorganic particulate composition at both local and distal regions through long-range transport, with the increase being exacerbated by unfavourable meteorological conditions favouring tropospheric accumulation that occur more frequently during winter (e.g. stagnant conditions and shallower mixing layer height) (e.g. Pey et al., 2010). In general, emission mitigation actions have decreased industrial and traffic emissions in northern Europe during the last decades (e.g. Anttila and Tuovinen, 2010; EEA, 2019; Hienola et al., 2016), which have resulted in a decrease in atmospheric SO2 and NOx concentrations. Even though these mitigations must hold in the entire EU, relatively high inorganic concentrations have been recently measured in other European countries such as in Greece (e.g. Athens, Katsanos et al., 2019) Spain (e.g. Montsec, Ripoll et al., 2015; Montseny, Minguillón et al., 2015), and the Netherlands (e.g. Cabauw, Schlag et al., 2016).
When considering the seasonality of eBC, monthly concentrations remained relatively constant (Fig. 5a). This result was somewhat expected since the largest source of eBC at the measurement site was traffic, and the traffic counts at the site are relatively constant when excluding specific time periods such as public holidays and summer vacations (e.g. Luoma et al., 2020). Similar eBC patterns have been observed in other studies performed at traffic sites (Kutzner et al., 2018; Singh et al., 2018).
For estimating the percentage of local eBC emissions, the eBC measured at an urban background site (Kallio) and at a regional background site (Luukki) (Luoma et al., 2020) was subtracted from the eBC measured at the street canyon site, and the remaining eBC was divided by the street canyon eBC concentration (Fig. S8). A median contribution of up to 71 % when subtracting eBC from the urban background site was obtained for local eBC during summer. This percentage could be considered to be a roughly descriptive estimate of the influence of the on-site traffic eBC emissions. When subtracting eBC from the regional background site, a local eBC median percentage of up to 85 % was obtained. The local contribution of eBC was lower during winter, possibly due to stagnant conditions during this period of the year favouring eBC accumulation at the background sites after regional transport. The presence of other sources of eBC (e.g. BCWB) can also contribute to the observed results, especially in winter when the background concentrations of eBC are higher than in summer (Luoma et al., 2020).
Interestingly, the highest median concentrations of eBC (Fig. 5a) and local contribution of eBC (Fig. S8) were reached in August. A high concentration of NOx was also observed in August (Fig. 5b), even though the lowest concentrations were observed in spring and early summer when volatile organic compound (VOC) consumption of NO is higher, the atmospheric dispersion is more efficient in summer, and a decrease in traffic rates during the holiday period (June–July) is observed. A similar increase in eBC concentrations during summer months has been verified in previous studies conducted in environments dominated by traffic emissions (Healy et al., 2017; Singh et al., 2018). The elevated concentration of eBC in August might be partly explained by poorer dispersion as the VC characterizing atmospheric dilution clearly decreased in this month (Fig. 5c). The VC is higher in June and July but decreases in August, reaching the lowest median values of the year, which is probably explained by the cold temperatures already observed in August from late evenings to early mornings. However, the fairly high eBC concentrations in June and July are still surprising, especially considering the diminishing of traffic during holidays, and additional studies are needed to investigate this phenomenon further.
A factor that might have influenced the measured eBC concentrations is the light absorption enhancement due to the coating of BC particles (e.g. more SOA present during summer for coating and thus for absorption enhancement). This so-called “lensing effect” has been previously described in other studies (e.g. Drinovec et al., 2017; Zhang et al., 2018). As shown in Fig. S9a, the coating factor (CF) slightly increased during spring and summer. Similarly, the k, which has been found in previous studies to be applicable as a proxy for the determination of a particle's coating (Drinovec et al., 2017), was also lower in our study during summer (Fig. S9b). Thus, the seasonal variation in both CF and k indicates that the particles were potentially more coated during the warmest periods of the year. For this reason, it is possible that the lensing effect was more pronounced during summer than during winter. However, additional studies are still needed to confirm this hypothesis or identify the existence of a prominent eBC source during summertime. According to our results, the source would likely be local since the background eBC concentration over the seasons remained relatively constant, and the eBC daily trends during the warmest months showed the traffic rush-hour peak, which excludes sources such as forest fires (e.g. Fig. S12).
The BCFF followed the seasonal variation in eBC (Fig. 5d), demonstrating that traffic is the dominant source of eBC at the measurement site. The median biomass burning percentage (BB) was small during most of the seasons but increased up to about 20 % during winter (Fig. 5e), which suggests an increase in BCWB during the coldest season (Fig. 5f). In Helsinki, wood combustion is typically of residential origin and can be regionally transported into the measurement site (Aurela et al., 2015; Helin et al., 2018; Hellén et al., 2017).
3.3 Diurnal and weekly variation in atmospheric aerosol particle composition
Diurnal and weekly profiles of atmospheric aerosol particle constituents can provide insights into sources and atmospheric processes since diurnal changes are affected by an interplay of factors, including daytime photochemistry, gas–particle partitioning, and local source emissions.

Figure 6Diurnal variation in eBC, NOx, BCFF, VC, BB, and BCWB. In each box, the mid-line shows the median value for each x value, the whisker bottom and top correspond to the 10th and 90th percentiles, and the box top and bottom correspond to the 75th and 25th percentiles, respectively. Note that BB and BCWB diurnal variations include only winter months (December–February).
The diurnal and weekly pattern of BCFF was similar to the one obtained for eBC and NOx (Figs. 6a–c and S10a and b), reflecting the dominant contribution of traffic to the obtained profiles. These species had the largest daily variations, with maximums during morning and afternoon rush hours. Similar diurnal cycles of BCFF have been observed in previous studies conducted at other European sites influenced by traffic (e.g. Crilley et al., 2015; Fuller et al., 2014; Herich et al., 2011; Jereb et al., 2018). A distinct seasonality on BCFF rush-hour concentrations was observed (Fig. S11). In winter, BCFF concentrations were similar during morning and afternoon rush-hour peaks, whereas in the other seasons BCFF concentrations were clearly higher during the morning rush hour. These results suggest that planetary boundary layer dynamics play a major role in the measured BCFF concentrations since VC was generally higher during the afternoon (Fig. 6d), increasing over the day during the warmer seasons while remaining constant during wintertime (Fig. S7). The influence of mixing conditions is particularly evident during summer mornings when weak mixing conditions were observed (Fig. S7), causing high concentrations of BCFF, even though the effect of cold start emissions cannot be totally excluded.
The BCWB diurnal and weekly variations were also investigated (Figs. 6e, f and S10c, d). Since concentrations were low during most of the year (Fig. 5f), only winter concentrations were considered for diurnal variations. The concentrations of BCWB slightly increased late at night and during weekends, which is likely associated with the use of wood burning for heating purposes. The same evidence was observed by Herich et al. (2011) in an urban background site located in the city centre of Zurich.
For a more comprehensive overview, the diurnal and monthly variations in BCFF during workdays (Fig. S12a) were also compared with the corresponding weekend variations (Fig. S12b). Clear differences were observed for these periods of the week, as expected for a traffic-dominated site (e.g. Helin et al., 2018). Similar diurnal and monthly patterns as for eBC were observed for NOx during weekdays and weekends (Fig. S12c and d). The previously referred to increase in BCWB during late evening on the weekend is particularly notorious in Fig. S12e and f, especially for the coldest months, which supports the likely influence of wood burning from regional transport during those periods of the year.
In terms of the NR-PM1 constituents, distinct diurnal variations were observed. The concentrations of organics increased only slightly during the morning rush hour, which suggests a small contribution from traffic-induced sources (Fig. S13a). However, when organic compound diurnal and monthly variations during workdays (Fig. S12g) are compared with the corresponding weekend variations (Fig. S12h), a clear seasonality is observed. During winter rush hour, particulate organic compound content was clearly higher during workdays when compared to weekends, revealing the high influence from traffic during this season. On spring and autumn workdays, organics increased during morning rush hour due to traffic, since this variation was not observed during weekends, but decreased during the afternoon rush hour, suggesting a role of meteorology (Fig. S12i and j). During summer, the variation in organic concentration during workdays and weekends was less clear, which is likely caused by a dominant influence of biogenic organics formed by oxidation processes during this season of the year. In fact, the organic compound variation is relatively similar to the one observed by Heikkinen et al. (2020) at a rural site in Finland.
Nitrate was increasing throughout the night and decreasing during the day, following the boundary layer dynamics and temperature profiles (Fig. S13b). Ammonium and sulfate did not reveal a clear daily variation (Fig. S13c and d). This was expected since their concentrations were likely affected by the occurrence of long-range or regional transport. Therefore, the low influence from local traffic density and/or gas-phase production results in the nonexistence of daily patterns of these atmospheric constituents at the measurement site.
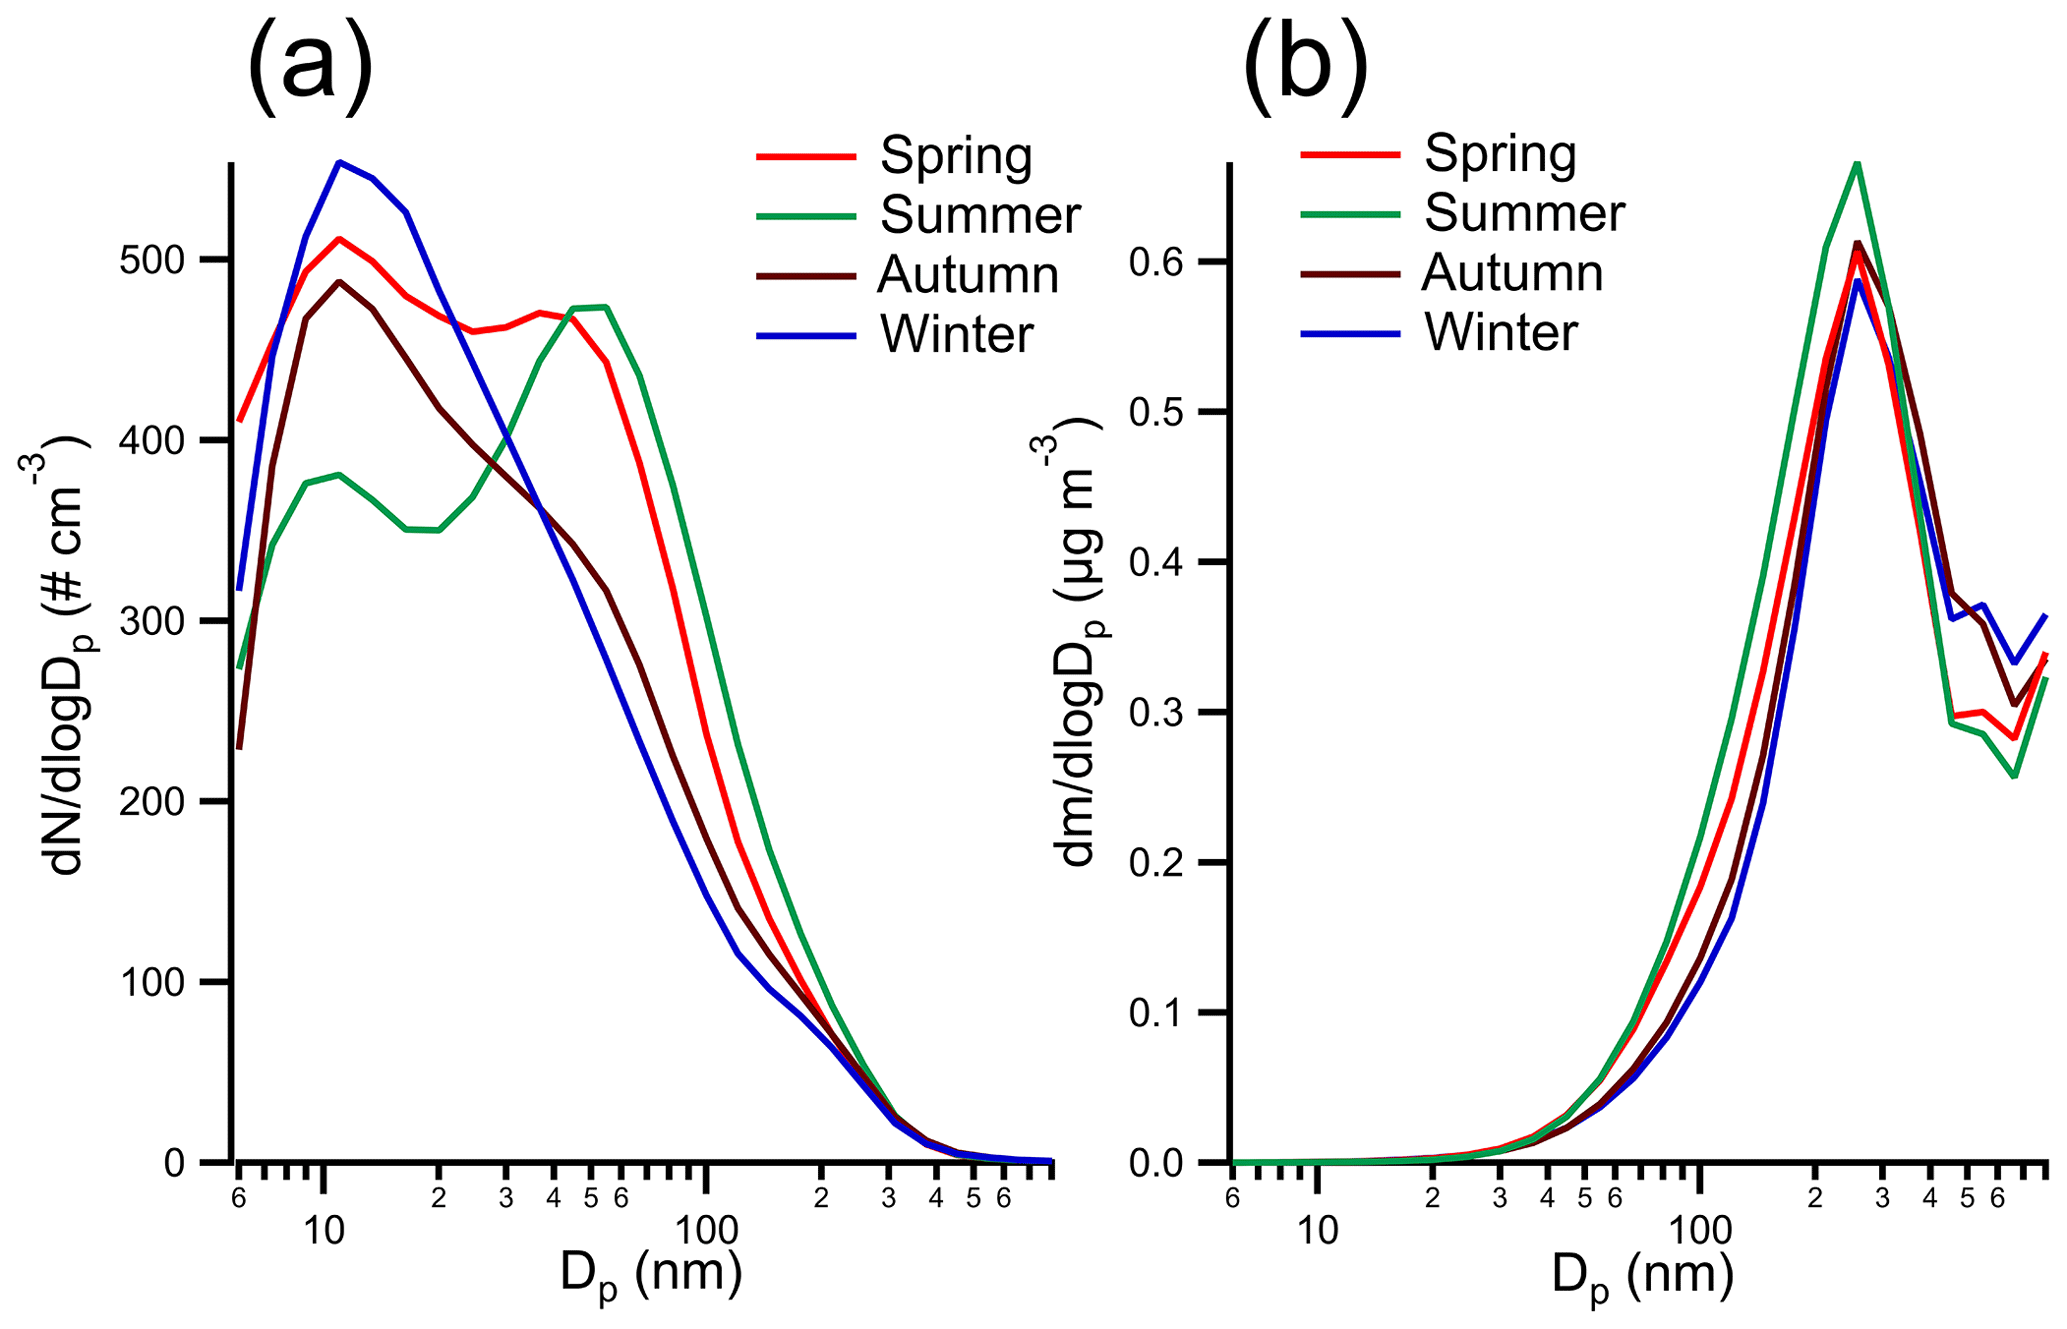
Figure 7Seasonal variation in median particle number and mass size distributions (note that Dp corresponds to the particle's mobility diameter).
3.4 Seasonal variations in aerosol particle number and mass size distributions
In addition to PM1 variations in chemical composition, the seasonal variations in particle number and mass size distributions observed during our long-term measurements were evaluated in more detail. As can be seen in Fig. 7a, the median particle number size distributions showed a clear seasonal variability. The wintertime particle number size distribution was characterized by a dominating nucleation mode that peaked at ∼ 11 nm. Particle size distributions consisting of a major peak at 5–12 nm have been associated with fresh traffic emissions (Al-Dabbous and Kumar, 2015; Rönkkö and Timonen, 2019).
In the other seasons, the particle number size distributions had two modes, the first one appearing at a size close to 11 nm and the second mode occurring in the Aitken mode range with a maximum between 40–60 nm. Similar size distributions have been found in other studies performed at traffic environments (Barone and Zhu, 2008; Ondráček et al., 2011; Rönkkö et al., 2017; Virtanen et al., 2006; Voigtländer et al., 2006). As referred to previously, the mode at ∼ 10 nm has been related to fresh traffic emissions, including both direct emissions of nanoparticles from the exhaust and particles formed through nucleation of low-volatility vapours after their cooling; while the second mode has been associated with coagulation of these particles and/or condensation of low-volatility vapours on the primary particles (Barone and Zhu, 2008; Ondráček et al., 2011) even though soot might have also played a role. Interestingly, the second mode was clearly higher in our study during summer compared to the first mode. This result suggests that SOA formation, fuelled by large emissions of SOA precursors and the presence of reactive tracer atmospheric oxidants, prevails during this time of the year. Elevated summer concentrations have also been observed in lung deposit surface area (LDSA) results from recent measurements performed in Helsinki (Kuula et al., 2020). Furthermore, Rivas et al. (2020) have found that biogenic emissions were an important contributor to ultrafine particles in Helsinki during summer, in both urban background and street canyon environments.
The seasonality of particle mass size distributions was also investigated (Fig. 7b). Similar distributions were observed for the different seasons, with maximum mass concentrations occurring at around ∼ 258 nm. These highest mass concentrations varied between 3.6 µg m−3 in winter and 40.1 µg m−3 in summer. The mass mode was also larger in summer and spring compared to the other seasons, particularly at sizes from 45 to 258 nm.
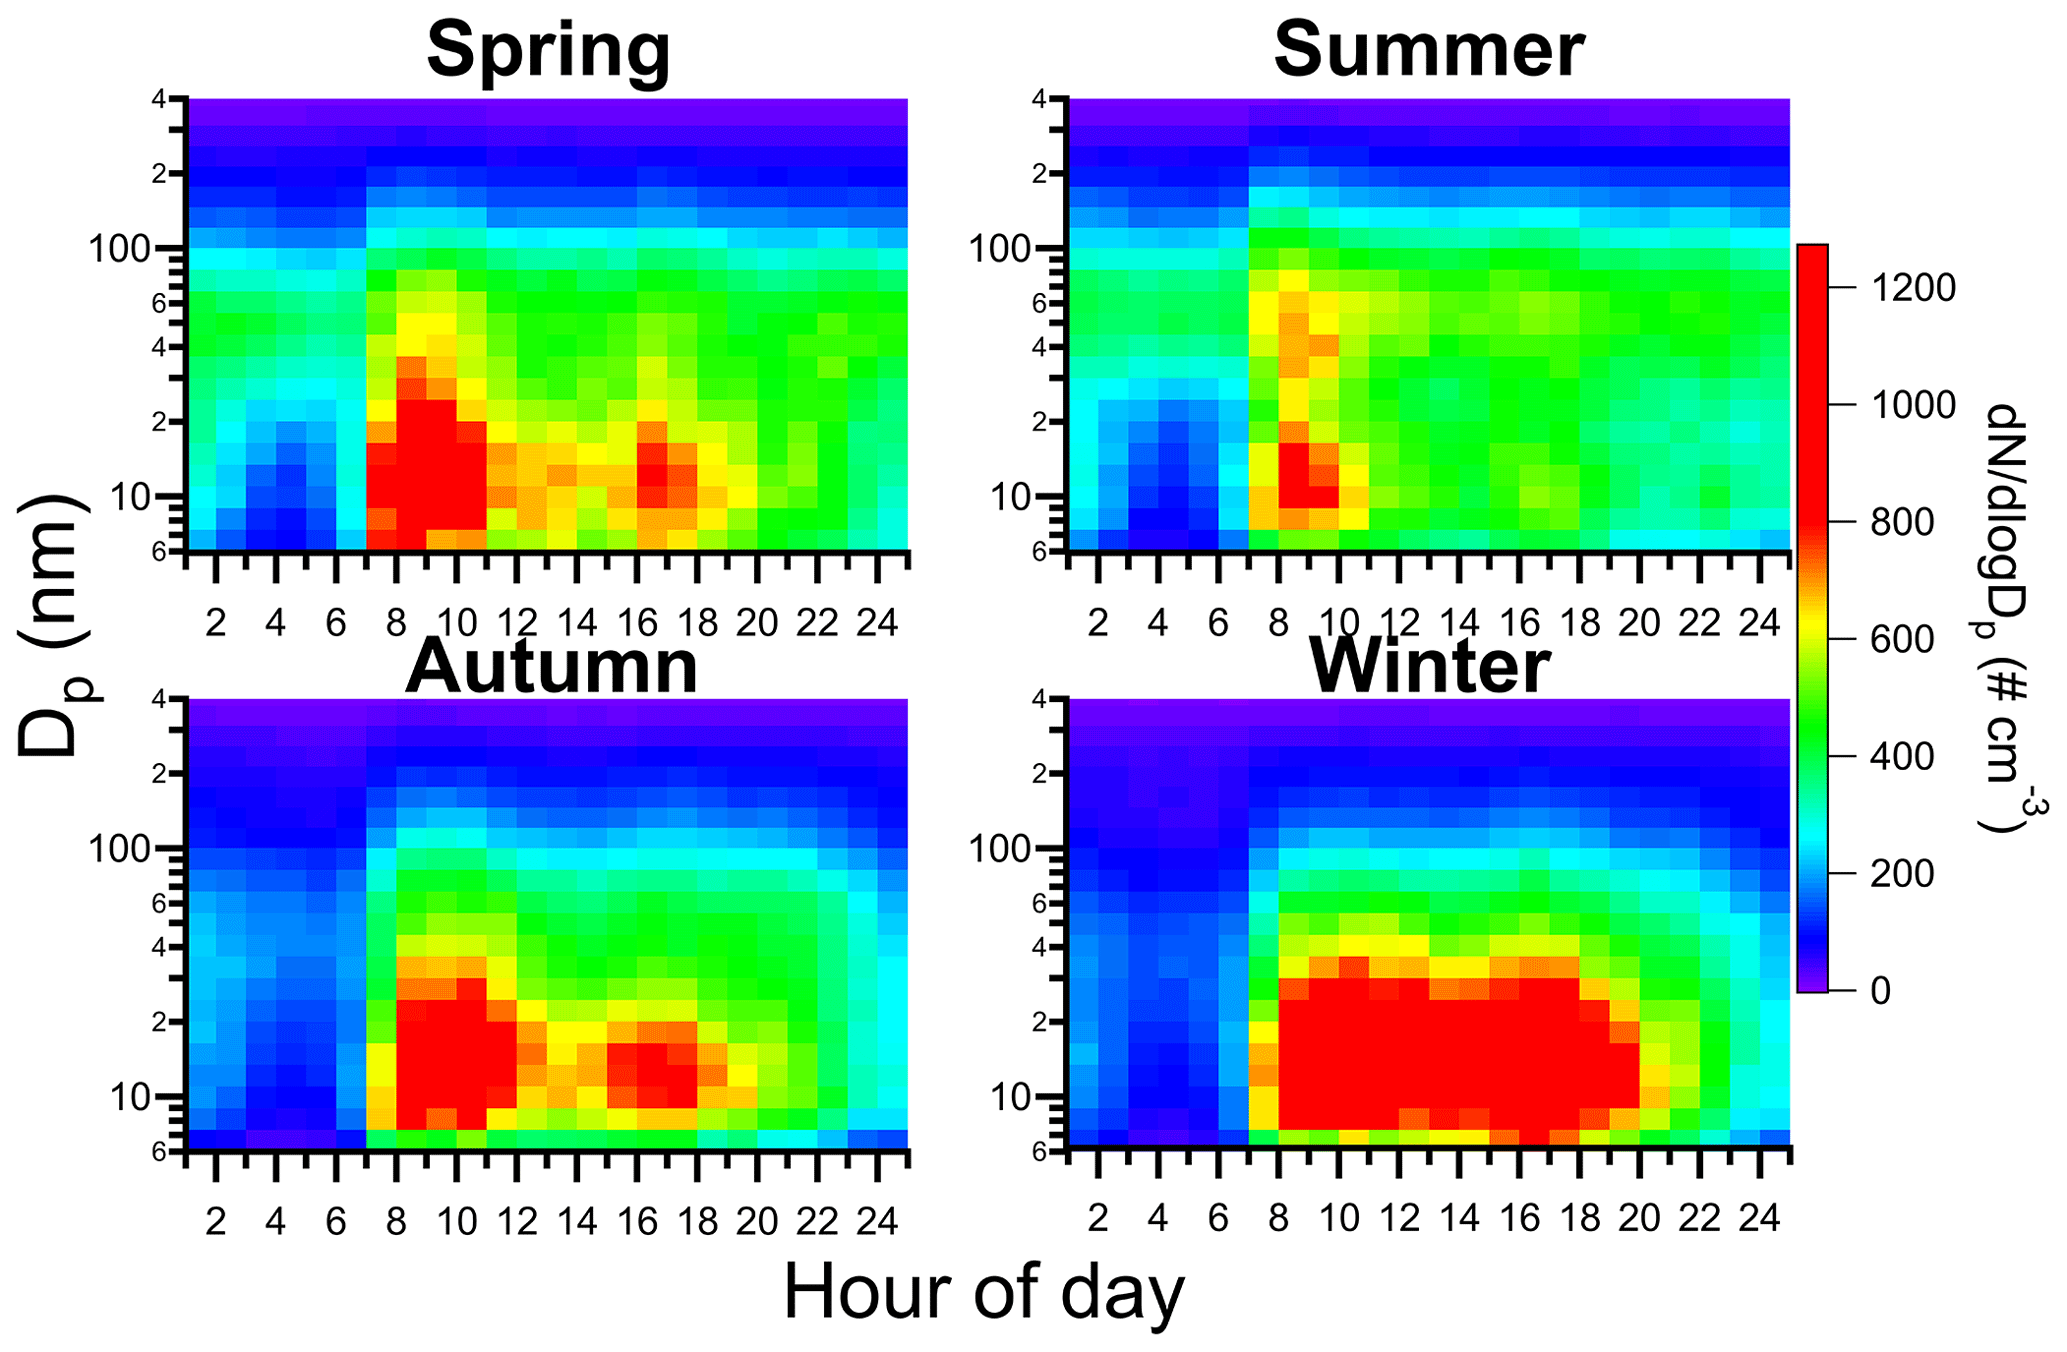
Figure 8Hourly variation in median particle number size distributions over the different seasons of the year (note that Dp corresponds to the particle's mobility diameter).
The diurnal variation in particle number size distributions was also evaluated (Fig. 8). The size distributions of particles observed during morning and afternoon rush hours varied greatly between seasons. From autumn to spring, the maximum of number size distributions ranged between 7 and 40 nm, while in summer high concentrations were observed up to ∼ 80 nm likely due to the presence of SOA. In winter, number size distributions were comparable during morning and afternoon rush hours. However, in the other seasons, maximums of the number size distributions were much lower during the afternoon rush hour due to the previously referred to VC effect. This effect seems to impact mostly particles with larger sizes, suggesting that the planetary boundary layer and meteorological conditions play an important role in size distributions.
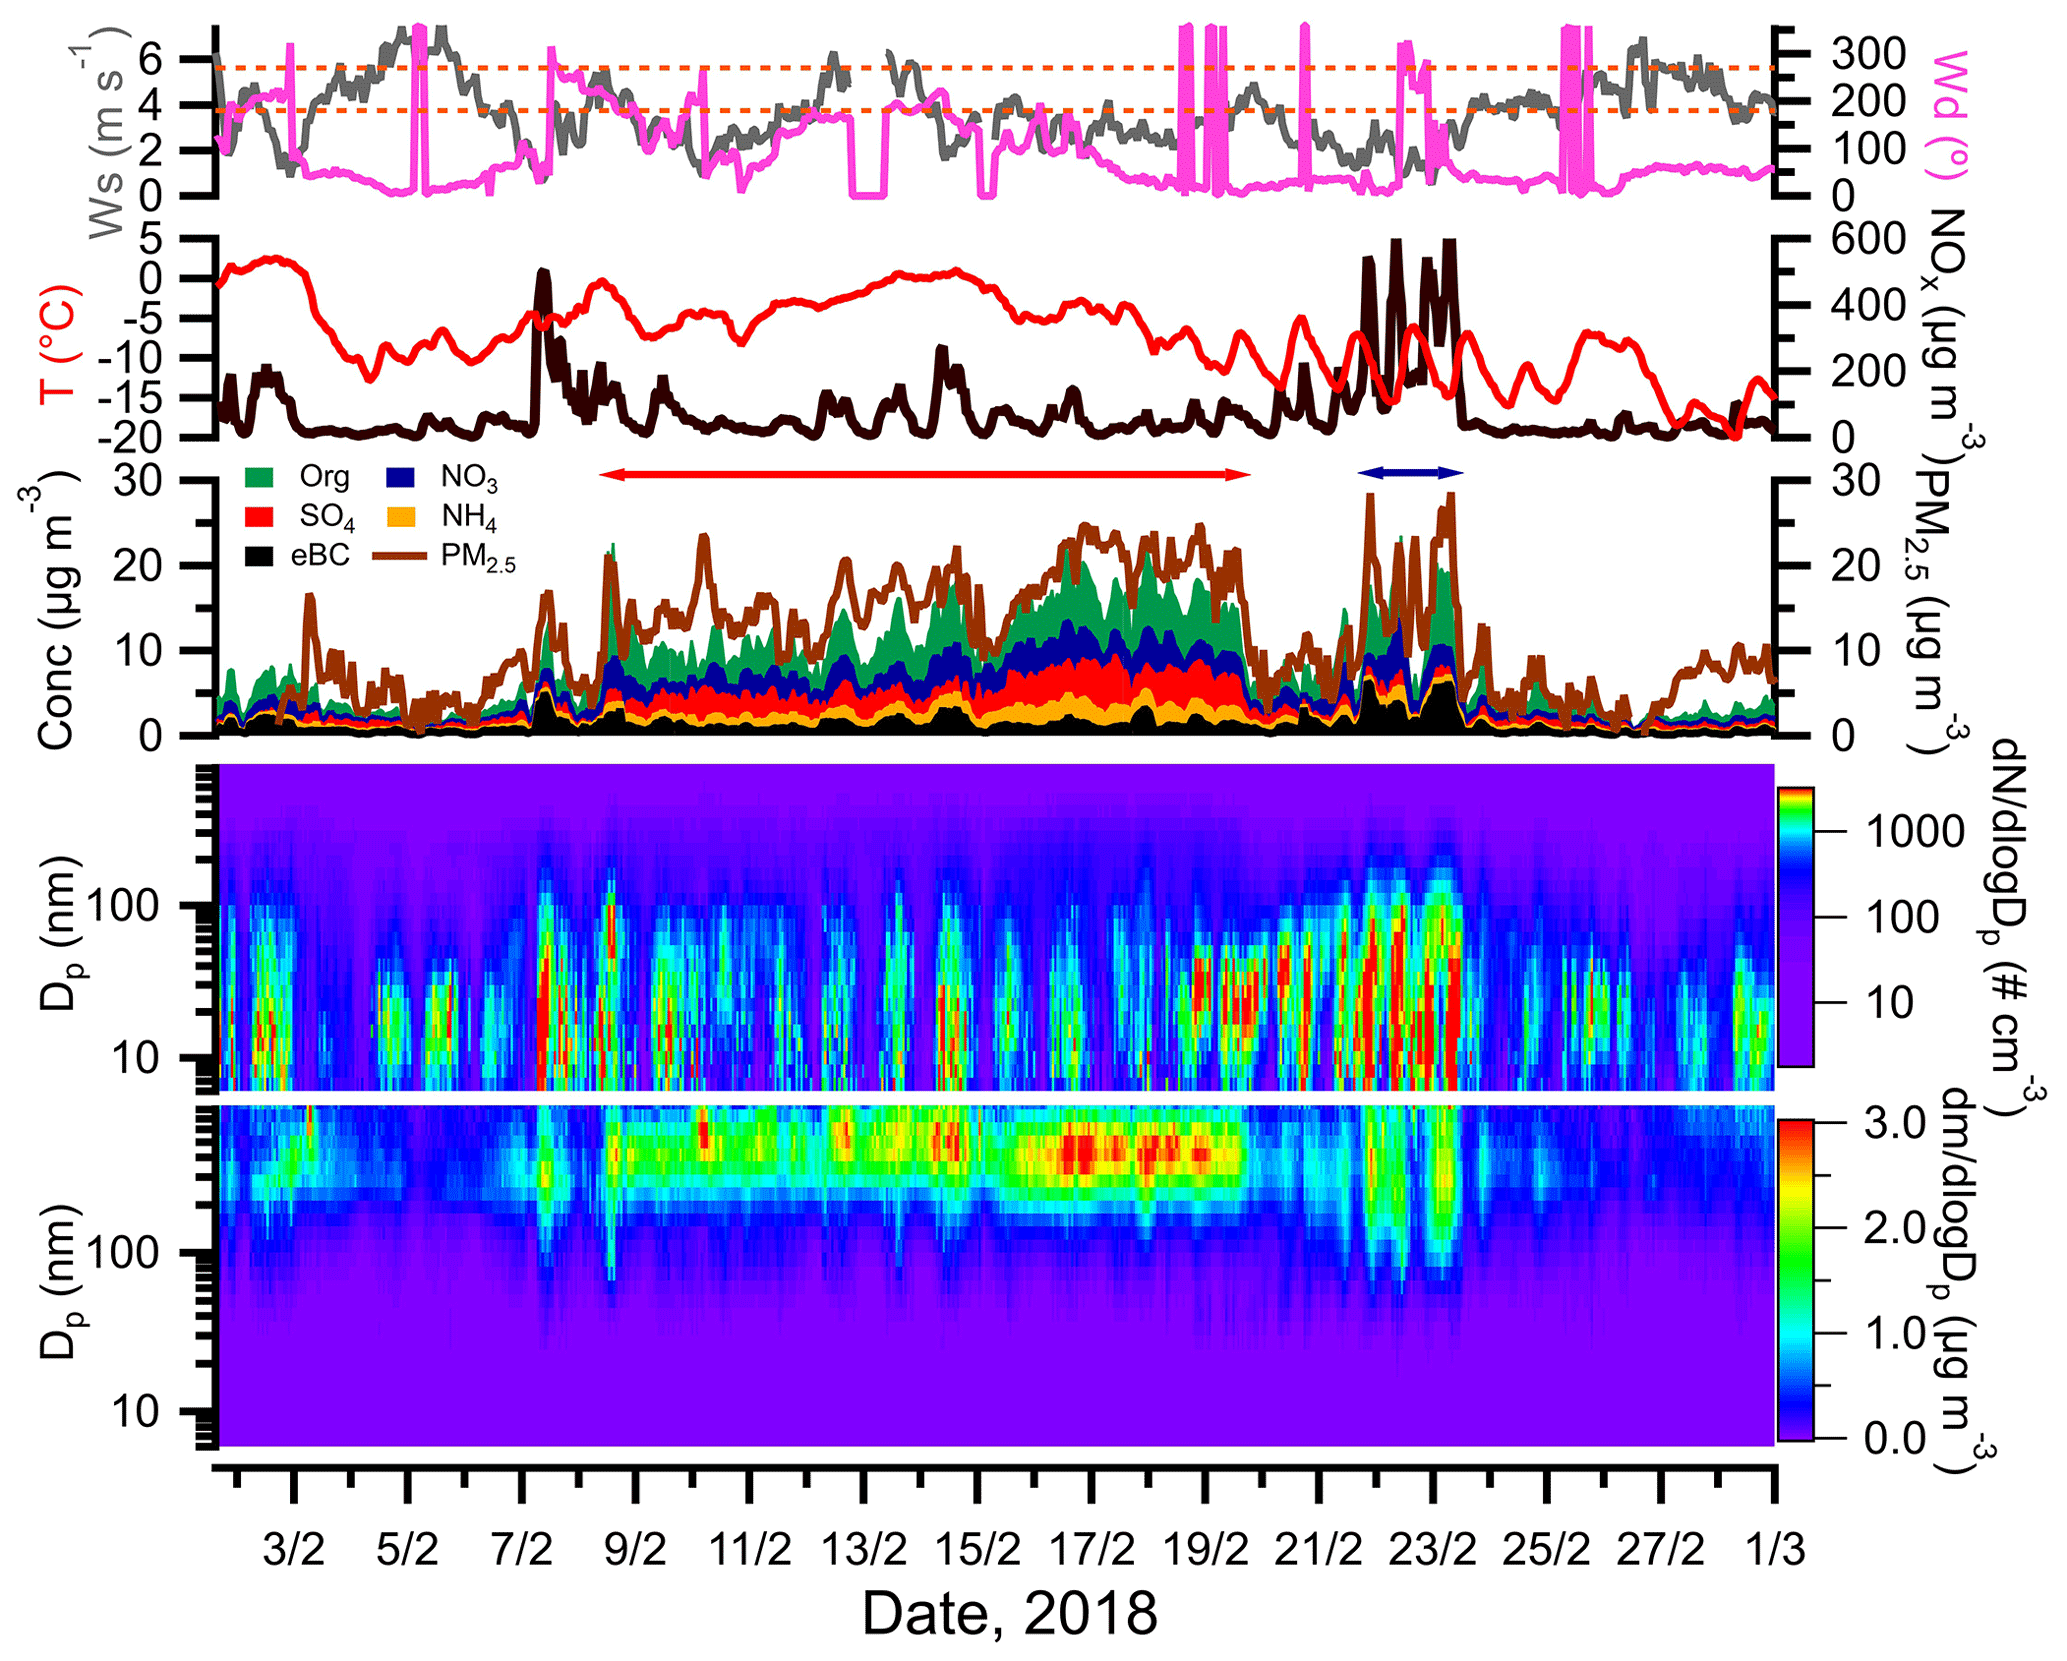
Figure 9Hourly median PM1 composition and concentration, PM2.5 concentration, mass and number size distributions, and other atmosphere-relevant parameters (T, NOx, Ws (hourly mean), Wd (hourly mean)) during a case study where local and long-range-transport pollution events occurred. The red sideway arrow indicates the time period of the long-range-transport event, while the blue sideway arrow indicates the local pollution episode. Orange lines represent the south and west wind directions (180 and 270∘).
3.5 Effects of local and long-range-transport pollution episodes on the measured aerosol particle composition
Air quality in Nordic cities is affected by local and long-range-transport pollution episodes. In this study, the influence of both pollution episodes was evaluated. Figure 9 shows a time period when a long-range-transport episode caused a long-lasting increase in PM1 (8 to 19 February 2018). Additionally, a local pollution episode took place after the long-range-transport episode (21 to 23 February 2018) as a result of an atmospheric inversion. The selected period occurred during winter, when local pollution is particularly severe due to an interplay of factors that include stagnant conditions and generally low mixing height, which favours the local confinement and accumulation of PM (e.g. Brown et al., 2006). During both pollution events, the hourly median levels of PM2.5 reached/exceeded the concentration of 25 µg m−3, which is the guideline limit given by the World Health Organization for the 24 h mean PM2.5 mass (WHO, 2006).
As observed in Fig. S14a, south-eastern to south-western winds brought polluted air masses to Helsinki during the long-range-transport event. This is typically observed for long-range-transport episodes detected in Helsinki (Niemi et al., 2009; Timonen et al., 2013). The pollution event caused an increase in PM2.5 hourly median concentration of up to 24.9 µg m−3, with PM1 concentrations reaching up to 22.6 µg m−3. The median relative contribution of inorganic species to PM1 was highest, accounting for 52 %, while the contributions of organics and eBC were 39 % and 9 %, respectively. Of inorganic species, sulfate dominated PM1 with a median fraction of 25 %, suggesting that the long-range-transport particles were formed from coal-fired plants and industrial sources. Nitrate and ammonium contributed to 16 % and 11 % of PM1, respectively. The long-range-transport aerosols mostly caused an increase in mass concentrations within the accumulation mode size range (approx. 200–800 nm). According to back trajectories, this long-range transport originated from eastern or eastern/central Europe (i.e. Russia, Belarus, Poland, and Baltic countries).
In contrast, an increase in the contribution of traffic-related particulate matter was clearly observed during the local pollution episode under calm wind conditions. The hourly median PM1 and PM2.5 levels reached 23.5 and 28.6 µg m−3, respectively, with a dominant fraction arising from the organics (up to 58 %) and eBC (up to 42 %). A simultaneous increase in NOx levels was observed. Back trajectories revealed that Nordic air masses were dominant during the local pollution event (Fig. S14b), which justifies the low concentration of inorganics during the event. Contrary to the long-range-transport episode, the particle number concentrations during the local pollution episode increased sharply, especially at the nanoparticle size with diameter < 100 nm. The impact of traffic-related particles on health is related to their small size, since they can penetrate efficiently the respiratory tract (e.g. Carvalho et al., 2011). Therefore, considering the morbidity and lethality associated with carbonaceous aerosols (e.g. Lelieveld et al., 2015), the observed increase in ultrafine particles during the local pollution event is of particular significance.
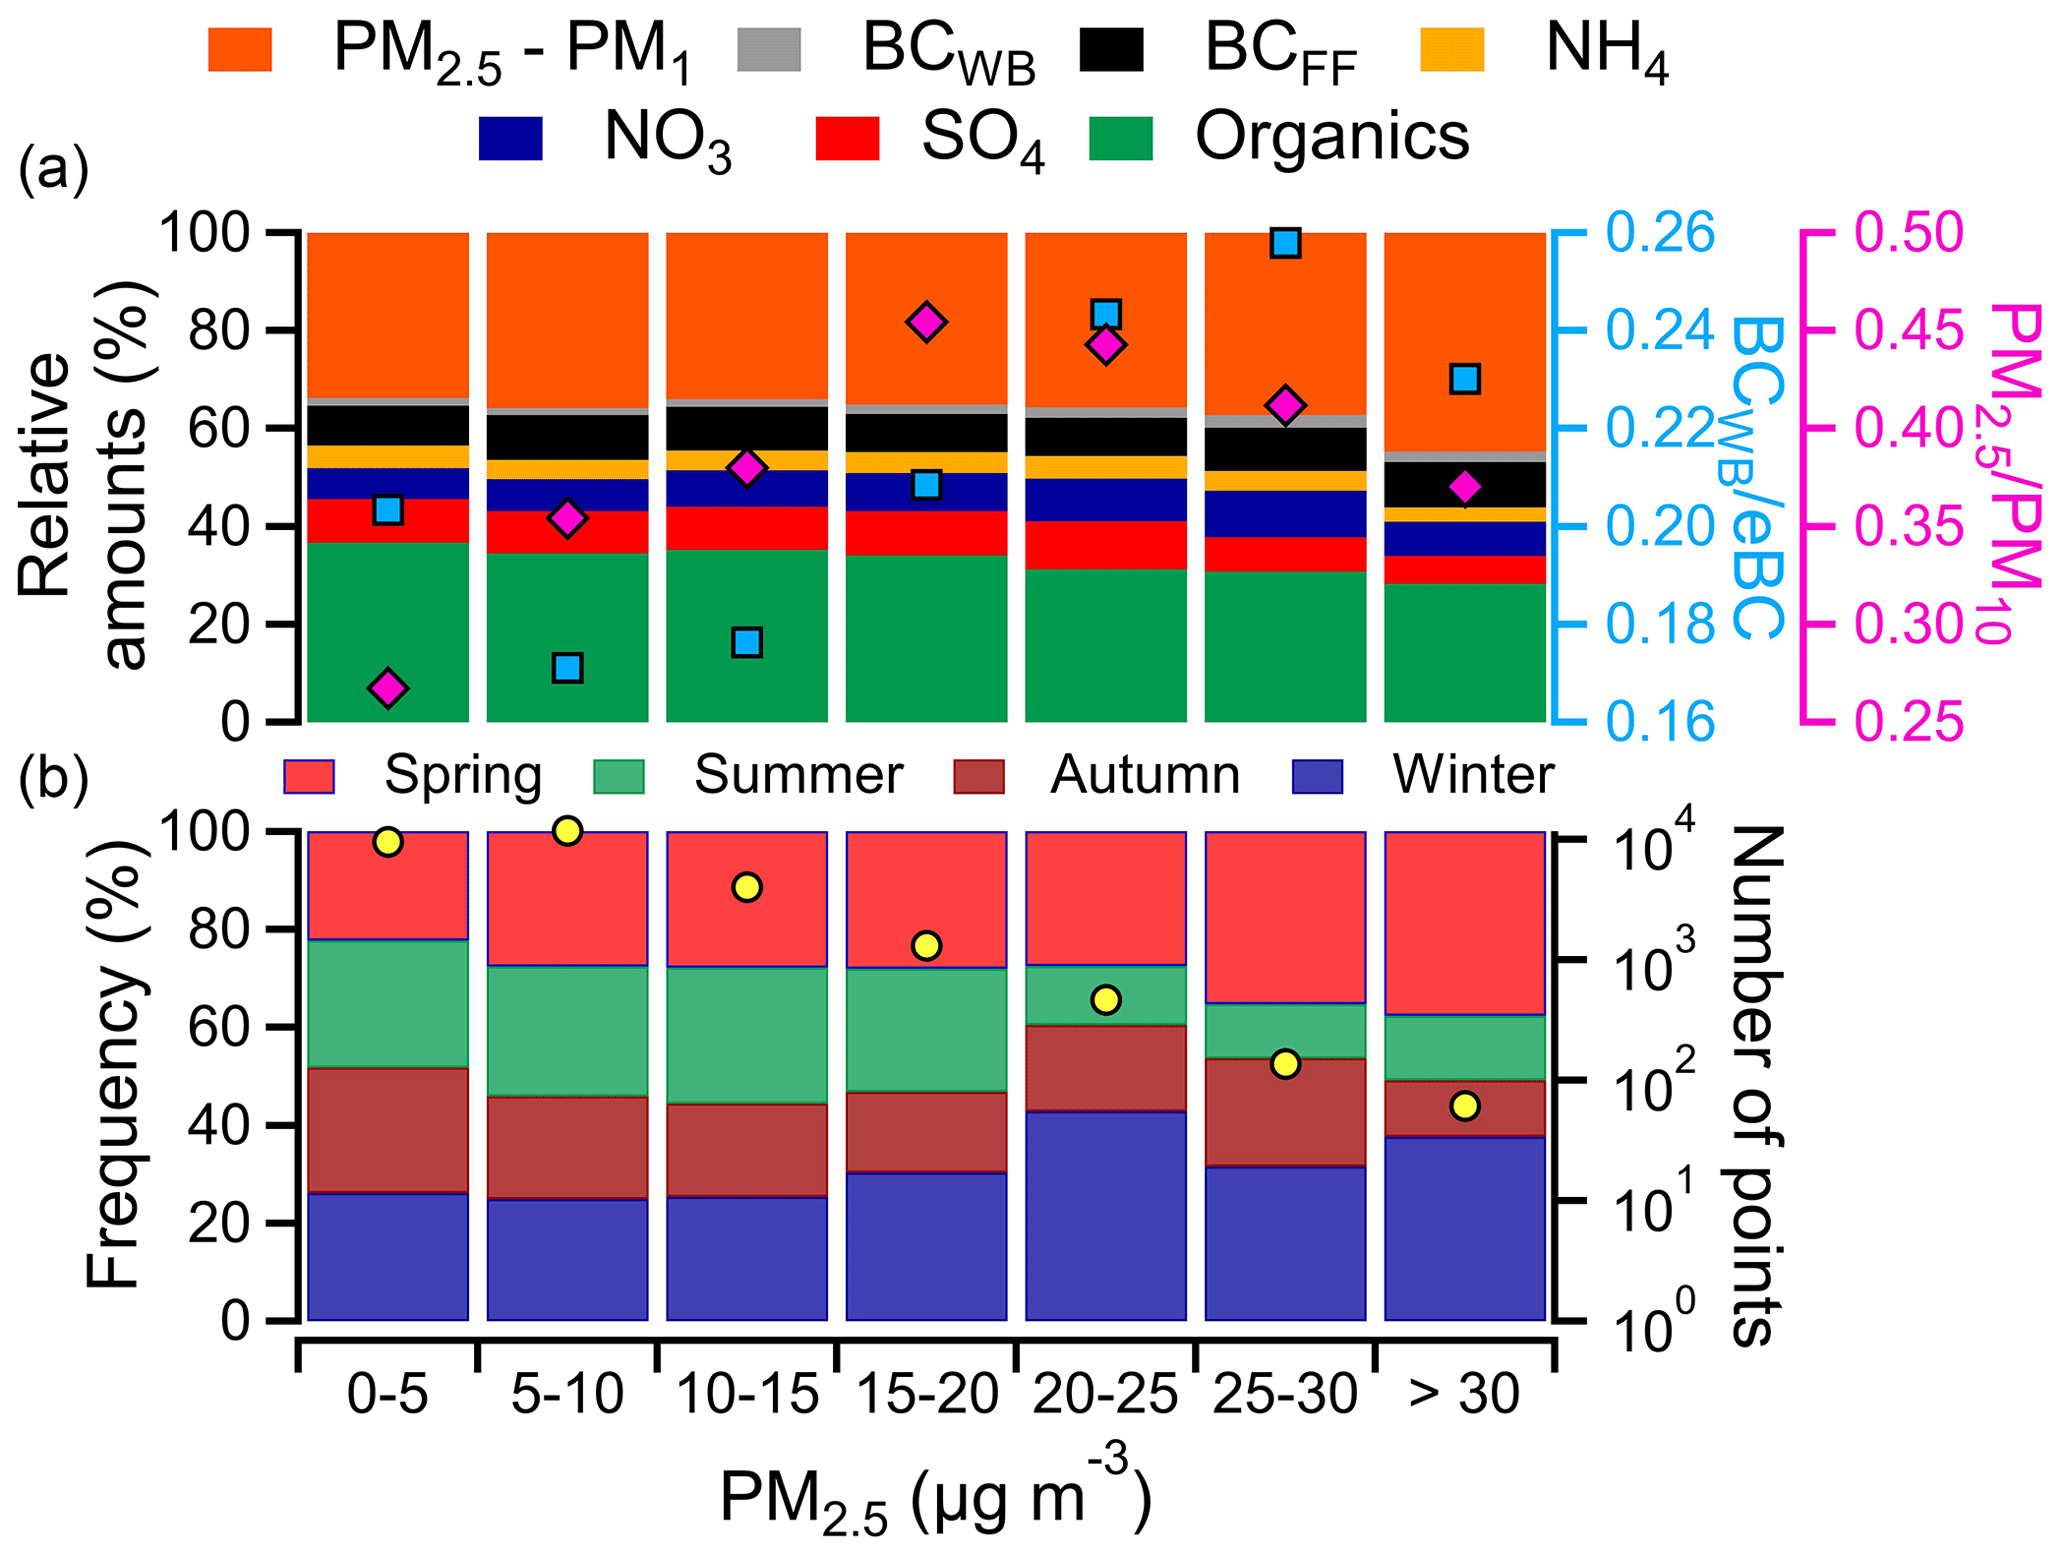
Figure 10Median relative contribution of chemical composition to different PM2.5 concentration bins (a) and seasonal frequency, including number of hour points (yellow dots), in each PM2.5 concentration bin (b). The ratios of BCWB to eBC (blue squares) and (purple diamonds) were also included.
Besides the case study shown above, we also investigated the role of long-range transport and local pollution over the whole measurement period (2015–2019). The PM2.5 levels were used for that purpose by determining the median contribution of PM1 chemical constituents for different PM2.5 mass classes (Fig. 10a). A similar approach was used by Petit et al. (2015) but by using a mass classification based on PM1. The unanalysed fraction of PM2.5 determined by subtracting the sum of total NR-PM1 and eBC from the PM2.5 was included in our study. By frequency, most of the high-pollution episodes (e.g. PM2.5 bins > 20 µg m−3 that includes 2.3 % of measurement time) occurred during autumn, winter, and early spring (see lower diagram in Figs. 10b, S15, and S16). These episodes of cool season were often characterized by an increased inorganic fraction, especially the fraction of sulfate, emphasizing the role of long-range transport and fossil fuels as major sources (Fig. S16). On the other hand, organics were higher during spring and summertime episodes (Fig. S16), which can be associated with SOA formation. The unanalysed fraction of PM2.5 was highest during the spring-time street dust periods.
In general, the fraction of organics was higher for PM2.5 concentrations of up to 20 µg m−3 (top diagram in Fig. 10a). However, the contribution of organics decreased from 36.7 % to 28.3 % with the increase in PM2.5. On the other hand, the fraction of nitrate continuously increased from 6.4 % to 9.4 % for concentrations of up to 30 µg m−3, while sulfate and ammonium contribution increased from 8.6 % to 9.9 % and from 3.9 % to 4.6 %, respectively, for PM2.5 of 5 to 25 µg m−3. The relative contribution of BCFF remained relatively constant over the different PM2.5 masses, varying between 7.8 % and 9.3 %. The almost constant BCFF contribution indicates that the local primary emissions from traffic exhaust are not usually the main source of high-PM2.5 episodes since primary exhaust emissions are characterized with the high fraction of BCFF (Fig. 9). However, the frequency of long-range pollution events is probably higher comparatively to the local ones due to the dominant SE to SW wind directions at the sampling site. These coordinates coincide with the ones where long-range pollution events are expected to be particularly intense, and their prevalence can then hinder the increase in BCFF during local events on a long-term analysis. The contribution of BCWB was the smallest for all PM2.5 concentration bins.
Interestingly, the unanalysed fraction of PM2.5 increased from 10 to over 30 µg m−3 of PM2.5, reaching a contribution of 44.7 % at the latest concentration bin. Since the contribution of inorganics decreased during the highest concentrations of PM2.5, regional/local pollution episodes (e.g. biomass burning and street dust) likely contribute to the high unanalysed PM2.5 fraction. As observed in Fig. 10a, the ratio of BCWB to eBC also increased for the highest levels of PM2.5, suggesting that biomass burning (e.g. larger particles caused by wildfires) plays a role in the PM2.5 unanalysed fraction. Furthermore, the ratio decreased for PM2.5 concentrations over 20 µg m−3, with the decrease being particularly significant for PM2.5 levels over 30 µg m−3. These results suggest that both biomass burning and street-dust pollution episodes are contributing to the increased unanalysed fraction of PM2.5, with street dust air pollution possibly being the most important contributor due to its prominence during spring.
In this study, highly time-resolved measurements were performed at a street canyon for a period of 4.5 years. The results revealed the seasonal and daily variances of PM1 chemical constituents that influence local air quality in Helsinki. Generally, organics had the highest contribution to PM1 mass, followed by eBC and inorganic species (sulfate, nitrate, and ammonium). A clear seasonal variation was observed for organics, with the highest concentrations being measured during summer. The organics formed from traffic seemed to be more prominent during the coldest months, while biogenic organics likely prevailed during summer. Inorganic species presented similar diurnal cycles that were mainly driven by the dynamics of the planetary boundary layer and long-range transport. The BCFF remained mostly constant over the seasons, reflecting the relatively regular traffic volume but had the highest diurnal and weekday to weekend variability. The BCWB was higher during late evening on the weekend in winter. The trend analysis revealed that BCFF and organics decrease over the years, while only a minor decrease in BCWB was observed. Regarding measured PM1 inorganic species, a decreasing trend was observed for nitrate but not for sulfate and ammonium. Particle number and mass size distributions in different seasons revealed the possible influence of SOA during summertime, while ultrafine traffic particle production and exposure were predominant during wintertime with possible consequences for public health.
The investigation of pollution episodes showed that both local and long-range-transported pollutants can cause elevated PM1 and PM2.5 concentrations. A large fraction of PM2.5 consisted of inorganics during long-range-transport episodes, while local episodes showed an increase in eBC and organics. Ultrafine particle number concentration was particularly significant during local episodes, while particle mass was higher during long-range transport. Street dust seemed to be an important contributor for the PM2.5 missing fraction in spring. Even though the use of studded winter tyres and the spreading of traction sand to sidewalks and streets are common measures to increase traffic safety in Finland during winter, the influence of street dust on air pollution might still be significant, which would require additional efforts to prevent dust particles from stirring up into the atmosphere. Altogether, our results show that measures tackling the main constituents of the submicron aerosol fraction require both national-based policies to reduce local pollutants and concerted actions at the European level for efficiently complying with PM2.5 legislations and guidelines.
The primary emissions from traffic are expected to be under continuous change. The urgent need for greener sources of energy will shift fossil fuels towards other types of energy supplies at a fast pace, and the development of more efficient catalysts and cleaner technologies is on-going. Due to the stricter emission laws and improvements on vehicle technologies, a decrease in the contribution of traffic to PM1 is expected to occur. Even though the traffic-related PM1 emissions will likely decrease, continuous long-term measurements at urban environments will be of paramount importance, especially concerning non-exhaust emissions that will be of growing concern during the transition from fossil fuel vehicles. Long-term studies using high-time-resolution instrumentation are still required to understand the impact of atmospheric pollutants on air quality in traffic environments, which is fundamental for the development and implementation of effective pollution mitigation strategies by policymakers in future air quality and climate decisions and to protect human health.
The data shown in the paper are available on request to the corresponding author.
The supplement related to this article is available online at: https://doi.org/10.5194/acp-21-6297-2021-supplement.
HT, TR, and JVN designed the experiments and MA, KT, JVN, HP, AK, LP, and LMFB carried them out. LMFB, MF, HT, MA, SS, AH, LK, HP, and AK contributed to the data analysis and interpretation. HT, TR, LP, JVN, and SS contributed to the funding acquisition and supervision. LMFB wrote the manuscript. All authors participated in the interpretation of the results and paper editing.
The authors declare that they have no conflict of interest.
We acknowledge funding from the Black Carbon Footprint project funded by Business Finland and participating companies (grant 528/31/2019), from European Regional Development Fund, Urban innovative actions initiative (HOPE; Healthy Outdoor Premises for Everyone, project no. UIA03-240), MegaSense Growth Engine: Air Quality Monitoring funded by Business Finland (grant 7517/31/2018), and ACCC Flagship funded by the Academy of Finland (grant nos. 337552, 337549). We also acknowledge Finland Flagship funding Atmosphere and Climate Competence Center COST–COLOSSAL (CA16109) for the guidance towards high-quality instrument operation and the long-term research co-operation and support from HSY to this project. The authors gratefully acknowledge the NOAA Air Resources Laboratory (ARL) for the provision of the HYSPLIT transport and dispersion model and/or READY website (https://www.ready.noaa.gov, last access: 8 August 2020) used in this publication.
This research has been supported by Business Finland and participating companies (grant no. 528/31/2019), the European Regional Development Fund, Urban innovative actions initiative (grant no. UIA03-240), Business Finland (grant no. 7517/31/2018), and the ACCC Flagship funded by the Academy of Finland (grant nos. 337552 and 337549).
This paper was edited by Lea Hildebrandt Ruiz and reviewed by two anonymous referees.
Al-Dabbous, A. N. and Kumar, P.: Source apportionment of airborne nanoparticles in a Middle Eastern city using positive matrix factorization, Environ. Sci.-Proc. Imp., 17, 802–812, https://doi.org/10.1039/C5EM00027K, 2015.
Allan, J. D., Delia, A. E., Coe, H., Bower, K. N., Alfarra, M. R., Jimenez, J. L., Middlebrook, A. M., Drewnick, F., Onasch, T. B., Canagaratna, M. R., Jayne, J. T., and Worsnop, D. R.: A generalised method for the extraction of chemically resolved mass spectra from Aerodyne aerosol mass spectrometer data, J. Aerosol Sci., 35, 909–922, https://doi.org/10.1016/j.jaerosci.2004.02.007, 2004.
Anttila, P. and Tuovinen, J.-P.: Trends of primary and secondary pollutant concentrations in Finland in 1994–2007, Atmos. Environ., 44, 30–41, https://doi.org/10.1016/j.atmosenv.2009.09.041, 2010.
Aurela, M., Saarikoski, S., Niemi, J. V., Canonaco, F., Prevot, A. S. H., Frey, A., Carbone, S., Kousa, A., and Hillamo, R.: Chemical and Source Characterization of Submicron Particles at Residential and Traffic Sites in the Helsinki Metropolitan Area, Finland, Aerosol Air Qual. Res., 15, 1213–1226, https://doi.org/10.4209/aaqr.2014.11.0279, 2015.
Barone, T. L. and Zhu, Y.: The morphology of ultrafine particles on and near major freeways, Atmos. Environ., 42, 6749–6758, https://doi.org/10.1016/j.atmosenv.2008.05.019, 2008.
Bonazza, A., Nuntiis, P., Mandrioli, P., and Sabbioni, C.: Aerosol Impact on Cultural Heritage: Deterioration Processes and Strategies for Preventive Conservation, in: Atmospheric Aerosols: Life Cycles and Effects on Air Quality and Climate, edited by: Tomasi, C., Fuzzi, S., and Kokhanovsky, A., John Wiley & Sons, Ltd., https://doi.org/10.1002/9783527336449.ch11, pp. 645–670, 2016.
Bressi, M., Cavalli, F., Belis, C. A., Putaud, J.-P., Fröhlich, R., Martins dos Santos, S., Petralia, E., Prévôt, A. S. H., Berico, M., Malaguti, A., and Canonaco, F.: Variations in the chemical composition of the submicron aerosol and in the sources of the organic fraction at a regional background site of the Po Valley (Italy), Atmos. Chem. Phys., 16, 12875–12896, https://doi.org/10.5194/acp-16-12875-2016, 2016.
Brown, S. G., Hyslop, N. P., Roberts, P. T., McCarthy, M. C., and Lurmann, F. W.: Wintertime Vertical Variations in Particulate Matter (PM) and Precursor Concentrations in the San Joaquin Valley during the California Regional Coarse PM/Fine PM Air Quality Study, J. Air Waste Manage., 56, 1267–1277, https://doi.org/10.1080/10473289.2006.10464583, 2006.
Carslaw, D. C.: c. Manual for version 2.6-6, available at: https://CRAN.R-project.org/package=openair (last acces: 13 May 2020), University of York, 2019.
Carslaw, D. C. and Ropkins, K.: Openair – An R Package for Air Quality Data Analysis, Environ. Modell. Softw., 27–28, 52–61, https://doi.org/10.1016/j.envsoft.2011.09.008, 2012.
Carvalho, T. C., Peters, J. I., and Williams, R. O.: Influence of particle size on regional lung deposition – What evidence is there?, Int. J. Pharm., 406, 1–10, https://doi.org/10.1016/j.ijpharm.2010.12.040, 2011.
Chuwah, C., van Noije, T., van Vuuren, D. P., Le Sager, P., and Hazeleger, W.: Global and regional climate impacts of future aerosol mitigation in an RCP6.0-like scenario in EC-Earth, Climatic Change, 134, 1–14, https://doi.org/10.1007/s10584-015-1525-9, 2016.
Council Directive 2008/50/EC: Directive 2008/50/EC of the European Parliament and of the Council of 21 May 2008 on ambient air quality and cleaner air for Europe, Journal of the European Communities, L 152, 1–44, 2008.
Crilley, L. R., Bloss, W. J., Yin, J., Beddows, D. C. S., Harrison, R. M., Allan, J. D., Young, D. E., Flynn, M., Williams, P., Zotter, P., Prevot, A. S. H., Heal, M. R., Barlow, J. F., Halios, C. H., Lee, J. D., Szidat, S., and Mohr, C.: Sources and contributions of wood smoke during winter in London: assessing local and regional influences, Atmos. Chem. Phys., 15, 3149–3171, https://doi.org/10.5194/acp-15-3149-2015, 2015.
Davidson, C. I., Phalen, R. F., and Solomon, P. A.: Airborne Particulate Matter and Human Health: A Review, Aerosol Sci. Tech., 39, 737–749, https://doi.org/10.1080/02786820500191348, 2005.
Drinovec, L., Močnik, G., Zotter, P., Prévôt, A. S. H., Ruckstuhl, C., Coz, E., Rupakheti, M., Sciare, J., Müller, T., Wiedensohler, A., and Hansen, A. D. A.: The ”dual-spot” Aethalometer: an improved measurement of aerosol black carbon with real-time loading compensation, Atmos. Meas. Tech., 8, 1965–1979, https://doi.org/10.5194/amt-8-1965-2015, 2015.
Drinovec, L., Gregorič, A., Zotter, P., Wolf, R., Bruns, E. A., Prévôt, A. S. H., Petit, J.-E., Favez, O., Sciare, J., Arnold, I. J., Chakrabarty, R. K., Moosmüller, H., Filep, A., and Močnik, G.: The filter-loading effect by ambient aerosols in filter absorption photometers depends on the coating of the sampled particles, Atmos. Meas. Tech., 10, 1043–1059, https://doi.org/10.5194/amt-10-1043-2017, 2017.
EEA: Air quality in Europe – 2019 report, European Environment Agency, EEA Report No 10/2019, ISSN 1977-8449, available at: https://www.eea.europa.eu/publications/air-quality-in-europe-2019 (last access: 31 July 2020), 2019.
Feng, S., Gao, D., Liao, F., Zhou, F., and Wang, X.: The health effects of ambient PM2.5 and potential mechanisms, Ecotoxicol. Environ. Saf., 128, 67–74, https://doi.org/10.1016/j.ecoenv.2016.01.030, 2016.
Font, A. and Fuller, G. W.: Did policies to abate atmospheric emissions from traffic have a positive effect in London?, Environ. Pollut., 218, 463–474, https://doi.org/10.1016/j.envpol.2016.07.026, 2016.
Fuller, G. W., Tremper, A. H., Baker, T. D., Yttri, K. E., and Butterfield, D.: Contribution of wood burning to PM10 in London, Atmos. Environ., 87, 87–94, https://doi.org/10.1016/j.atmosenv.2013.12.037, 2014.
Gani, S., Bhandari, S., Seraj, S., Wang, D. S., Patel, K., Soni, P., Arub, Z., Habib, G., Hildebrandt Ruiz, L., and Apte, J. S.: Submicron aerosol composition in the world's most polluted megacity: the Delhi Aerosol Supersite study, Atmos. Chem. Phys., 19, 6843–6859, https://doi.org/10.5194/acp-19-6843-2019, 2019.
Goldberg, E. D.: Black Carbon in the Environment, John Wiley and Sons, New York, https://doi.org/10.1002/qj.49711247219, 1985.
Grange, S. K., Lötscher, H., Fischer, A., Emmenegger, L., and Hueglin, C.: Evaluation of equivalent black carbon source apportionment using observations from Switzerland between 2008 and 2018, Atmos. Meas. Tech., 13, 1867–1885, https://doi.org/10.5194/amt-13-1867-2020, 2020.
Hansen, A. D. A., Rosen, H., and Novakov, T.: Aethalometer – an instrument for the real-time measurement of optical absorption by aerosol particles, Lawrence Berkeley Lab., CA, USA, available at: https://www.osti.gov/biblio/5535057 (last access: 30 April 2020), 1983.
Healy, R. M., Sofowote, U., Su, Y., Debosz, J., Noble, M., Jeong, C.-H., Wang, J. M., Hilker, N., Evans, G. J., Doerksen, G., Jones, K., and Munoz, A.: Ambient measurements and source apportionment of fossil fuel and biomass burning black carbon in Ontario, Atmos. Environ., 161, 34–47, https://doi.org/10.1016/j.atmosenv.2017.04.034, 2017.
Heikkinen, L., Äijälä, M., Riva, M., Luoma, K., Dällenbach, K., Aalto, J., Aalto, P., Aliaga, D., Aurela, M., Keskinen, H., Makkonen, U., Rantala, P., Kulmala, M., Petäjä, T., Worsnop, D., and Ehn, M.: Long-term sub-micrometer aerosol chemical composition in the boreal forest: inter- and intra-annual variability, Atmos. Chem. Phys., 20, 3151–3180, https://doi.org/10.5194/acp-20-3151-2020, 2020.
Helin, A., Niemi, J. V., Virkkula, A., Pirjola, L., Teinilä, K., Backman, J., Aurela, M., Saarikoski, S., Rönkkö, T., Asmi, E., and Timonen, H.: Characteristics and source apportionment of black carbon in the Helsinki metropolitan area, Finland, Atmos. Environ., 190, 87–98, https://doi.org/10.1016/j.atmosenv.2018.07.022, 2018.
Hellén, H., Kangas, L., Kousa, A., Vestenius, M., Teinilä, K., Karppinen, A., Kukkonen, J., and Niemi, J. V.: Evaluation of the impact of wood combustion on benzo[a]pyrene (BaP) concentrations; ambient measurements and dispersion modeling in Helsinki, Finland, Atmos. Chem. Phys., 17, 3475–3487, https://doi.org/10.5194/acp-17-3475-2017, 2017.
Henschel, S., Le Tertre, A., Atkinson, R. W., Querol, X., Pandolfi, M., Zeka, A., Haluza, D., Analitis, A., Katsouyanni, K., Bouland, C., Pascal, M., Medina, S., and Goodman, P. G.: Trends of nitrogen oxides in ambient air in nine European cities between 1999 and 2010, Atmos. Environ., 117, 234–241, https://doi.org/10.1016/j.atmosenv.2015.07.013, 2015.
Herich, H., Hueglin, C., and Buchmann, B.: A 2.5 year's source apportionment study of black carbon from wood burning and fossil fuel combustion at urban and rural sites in Switzerland, Atmos. Meas. Tech., 4, 1409–1420, https://doi.org/10.5194/amt-4-1409-2011, 2011.
Hienola, A. I., O'Donnell, D., Pietikäinen, J.-P., Svensson, J., Lihavainen, H., Virkkula, A., Korhonen, H., and Laaksonen, A.: The radiative impact of Nordic anthropogenic black carbon, Tellus B, 68, 27428, https://doi.org/10.3402/tellusb.v68.27428, 2016.
Hietikko, R., Kuuluvainen, H., Harrison, R. M., Portin, H., Timonen, H., Niemi, J. V., and Rönkkö, T.: Diurnal variation of nanocluster aerosol concentrations and emission factors in a street canyon, Atmos. Environ., 189, 98–106, https://doi.org/10.1016/j.atmosenv.2018.06.031, 2018.
IPCC: Climate Change 2013: The Physical Science Basis. Contribution of Working Group I to the Fifth Assessment Report of the Intergovernmental Panel on Climate Change, edited by: Stocker, T. F., Qin, D., Plattner, G.-K., Tignor, M., Allen, S. K., Boschung, J., Nauels, A., Xia, Y., Bex, V., and Midgley, P. M., Cambridge University Press, Cambridge, UK and New York, NY, USA, 1535, https://doi.org/10.1017/CBO9781107415324, 2013.
IPCC: Global warming of 1.5 ∘C. An IPCC Special Report on the impacts of global warming of 1.5 ∘C above pre-industrial levels and related 315 global greenhouse gas emission pathways, in the context of strengthening the global response to the threat of climate change, sustainable development, and efforts to eradicate poverty, edited by: Masson-Delmotte, V., Zhai, P., Pörtner, H. O., Roberts, D., Skea, J., Shukla, P. R., Pirani, A., Moufouma-Okia, W., Péan, C., Pidcock, R., Connors, S., Matthews, J. B. R., Chen, Y., Zhou, X., Gomis, M. I., Lonnoy, E., Maycock, M., Tignor, M., and Waterfield, T., IPCC, available at: https://www.ipcc.ch/report/sixth-assessment-report-working-group-ii/ (last access: 2 July 2020), 2018.
Jereb, B., Batkovič, T., Herman, L., Šipek, G., Kovše, Š., Gregorič, A., and Močnik, G.: Exposure to Black Carbon during Bicycle Commuting–Alternative Route Selection, Atmosphere, 9, 21, https://doi.org/10.3390/atmos9010021, 2018.
Jiang, J., Aksoyoglu, S., El-Haddad, I., Ciarelli, G., Denier van der Gon, H. A. C., Canonaco, F., Gilardoni, S., Paglione, M., Minguillón, M. C., Favez, O., Zhang, Y., Marchand, N., Hao, L., Virtanen, A., Florou, K., O'Dowd, C., Ovadnevaite, J., Baltensperger, U., and Prévôt, A. S. H.: Sources of organic aerosols in Europe: a modeling study using CAMx with modified volatility basis set scheme, Atmos. Chem. Phys., 19, 15247–15270, https://doi.org/10.5194/acp-19-15247-2019, 2019.
Jimenez, J. L., Canagaratna, M. R., Donahue, N. M., Prevot, A. S. H., Zhang, Q., Kroll, J. H., DeCarlo, P. F., Allan, J. D., Coe, H., Ng, N. L., Aiken, A. C., Docherty, K. S., Ulbrich, I. M., Grieshop, A. P., Robinson, A. L., Duplissy, J., Smith, J. D., Wilson, K. R., Lanz, V. A., Hueglin, C., Sun, Y. L., Tian, J., Laaksonen, A., Raatikainen, T., Rautiainen, J., Vaattovaara, P., Ehn, M., Kulmala, M., Tomlinson, J. M., Collins, D. R., Cubison, M. J., E, Dunlea, J., Huffman, J. A., Onasch, T. B., Alfarra, M. R., Williams, P. I., Bower, K., Kondo, Y., Schneider, J., Drewnick, F., Borrmann, S., Weimer, S., Demerjian, K., Salcedo, D., Cottrell, L., Griffin, R., Takami, A., Miyoshi, T., Hatakeyama, S., Shimono, A., Sun, J. Y., Zhang, Y. M., Dzepina, K., Kimmel, J. R., Sueper, D., Jayne, J. T., Herndon, S. C., Trimborn, A. M., Williams, L. R., Wood, E. C., Middlebrook, A. M., Kolb, C. E., Baltensperger, U., and Worsnop, D. R.: Evolution of Organic Aerosols in the Atmosphere, Science, 326, 1525–1529, https://doi.org/10.1126/science.1180353, 2009.
Karppinen, A., Joffre, S. M., and Kukkonen, J.: The refinement of a meteorological pre-processor for the urban environment, Int. J. Environ. Pollut., 14, 565, https://doi.org/10.1504/IJEP.2000.000580, 2000.
Katsanos, D., Bougiatioti, A., Liakakou, E., Kaskaoutis, D. G., Stavroulas, I., Paraskevopoulou, D., Lianou, M., Psiloglou, B. E., Gerasopoulos, E., Pilinis, C., and Mihalopoulos, N.: Optical Properties of Near-Surface Urban Aerosols and their Chemical Tracing in a Mediterranean City (Athens), Aerosol Air Qual. Res., 19, 49–70, https://doi.org/10.4209/aaqr.2017.11.0544, 2019.
Knutson, E. O. and Whitby, K. T.: Accurate measurement of aerosol electric mobility moments, J. Aerosol Sci., 6, 453–460, https://doi.org/10.1016/0021-8502(75)90061-0, 1975.
Korhonen, A., Lehtomäki, H., Rumrich, I., Karvosenoja, N., Paunu, V.-V., Kupiainen, K., Sofiev, M., Palamarchuk, Y., Kukkonen, J., Kangas, L., Karppinen, A., and Hänninen, O.: Influence of spatial resolution on population PM2.5 exposure and health impacts, Air Qual. Atmos. Hlth., 12, 705–718, https://doi.org/10.1007/s11869-019-00690-z, 2019.
Kutzner, R. D., von Schneidemesser, E., Kuik, F., Quedenau, J., Weatherhead, E. C., and Schmale, J.: Long-term monitoring of black carbon across Germany, Atmos. Environ., 185, 41–52, https://doi.org/10.1016/j.atmosenv.2018.04.039, 2018.
Kuula, J., Kuuluvainen, H., Niemi, J. V., Saukko, E., Portin, H., Kousa, A., Aurela, M., Rönkkö, T., and Timonen, H.: Long-term sensor measurements of lung deposited surface area of particulate matter emitted from local vehicular and residential wood combustion sources, Aerosol Sci. Tech., 54, 190–202, https://doi.org/10.1080/02786826.2019.1668909, 2020.
Laakso, L., Hussein, T., Aarnio, P., Komppula, M., Hiltunen, V., Viisanen, Y., and Kulmala, K.: Diurnal and annual characteristics of particle mass andnumber concentrations in urban, rural and Arctic environments in Finland, Atmos. Environ., 37, 2629–2641, https://doi.org/10.1016/S1352-2310(03)00206-1, 2003.
Lelieveld, J., Evans, J. S., Fnais, M., Giannadaki, D., and Pozzer, A.: The contribution of outdoor air pollution sources to premature mortality on a global scale, Nature, 525, 367–371, https://doi.org/10.1038/nature15371, 2015.
Liu, P. S. K., Deng, R., Smith, K. A., Williams, L. R., Jayne, J. T., Canagaratna, M. R., Moore, K., Onasch, T. B., Worsnop, D. R., and Deshler, T.: Transmission Efficiency of an Aerodynamic Focusing Lens System: Comparison of Model Calculations and Laboratory Measurements for the Aerodyne Aerosol Mass Spectrometer, Aerosol Sci. Tech., 41, 721–733, https://doi.org/10.1080/02786820701422278, 2007.
Lorelei de Jesus, A., Thompson, H., Knibbs, L. D., Kowalski, M., Cyrys, J., Niemi, J. V., Kousa, A., Timonen, H., Luoma, K., Petäjä, T., Beddows, D., Harrison, R. M., Hopke, P., and Morawska, L.: Long-term trends in PM2.5 mass and particle number concentrations in urban air: The impacts of mitigation measures and extreme events due to changing climates, Environ. Pollut., 263, 114500, https://doi.org/10.1016/j.envpol.2020.114500, 2020.
Luoma, K., Niemi, J. V., Aurela, M., Fung, P. L., Helin, A., Hussein, T., Kangas, L., Kousa, A., Rönkkö, T., Timonen, H., Virkkula, A., and Petäjä, T.: Spatiotemporal variation and trends in equivalent black carbon in the Helsinki metropolitan area in Finland, Atmos. Chem. Phys., 21, 1173–1189, https://doi.org/10.5194/acp-21-1173-2021, 2021.
Magee Scientific: Replacement Filter Tape for the Magee Scientific Model AE33 Aethalometer®, 2017.
Masiol, M. and Harrison, R. M.: Quantification of air quality impacts of London Heathrow Airport (UK) from 2005 to 2012, Atmos. Environ., 116, 308–319, https://doi.org/10.1016/j.atmosenv.2015.06.048, 2015.
Masiol, M., Squizzato, S., Formenton, G., Harrison, R. M., and Agostinelli, C.: Air quality across a European hotspot: Spatial gradients, seasonality, diurnal cycles and trends in the Veneto region, NE Italy, Sci. Total Environ., 576, 210–224, https://doi.org/10.1016/j.scitotenv.2016.10.042, 2017.
Megaritis, A. G., Fountoukis, C., Charalampidis, P. E., Denier van der Gon, H. A. C., Pilinis, C., and Pandis, S. N.: Linking climate and air quality over Europe: effects of meteorology on PM2.5 concentrations, Atmos. Chem. Phys., 14, 10283–10298, https://doi.org/10.5194/acp-14-10283-2014, 2014.
Middlebrook, A. M., Bahreini, R., Jimenez, J. L., and Canagaratna, M. R.: Evaluation of Composition-Dependent Collection Efficiencies for the Aerodyne Aerosol Mass Spectrometer using Field Data, Aerosol Sci. Tech., 46, 258–271, https://doi.org/10.1080/02786826.2011.620041, 2012.
Minguillón, M. C., Ripoll, A., Pérez, N., Prévôt, A. S. H., Canonaco, F., Querol, X., and Alastuey, A.: Chemical characterization of submicron regional background aerosols in the western Mediterranean using an Aerosol Chemical Speciation Monitor, Atmos. Chem. Phys., 15, 6379–6391, https://doi.org/10.5194/acp-15-6379-2015, 2015.
Molnár, P., Tang, L., Sjöberg, K., and Wichmann, J.: Long-range transport clusters and positive matrix factorization source apportionment for investigating transboundary PM2.5 in Gothenburg, Sweden, Environmental Science: Processes & Impacts, 19, 1270–1277, https://doi.org/10.1039/C7EM00122C, 2017.
Munir, S., Habeebullah, T. M., Seroji, A. R., Gabr, S. S., Mohammed, A. M. F., and Morsy, E. A.: Quantifying temporal trends of atmospheric pollutants in Makkah (1997–2012), Atmos. Environ., 77, 647–655, https://doi.org/10.1016/j.atmosenv.2013.05.075, 2013.
Myhre, G., Myhre, C. E. L., Samset, B. H., and Storelymo, T.: Aerosols and their relation to global climate and climate sensitivity, Nature Education Knowledge, 4, 1–7, 2013.
Ng, N. L., Herndon, S. C., Trimborn, A., Canagaratna, M. R., Croteau, P. L., Onasch, T. B., Sueper, D., Worsnop, D. R., Zhang, Q., Sun, Y. L., and Jayne, J. T.: An Aerosol Chemical Speciation Monitor (ACSM) for Routine Monitoring of the Composition and Mass Concentrations of Ambient Aerosol, Aerosol Sci. Tech., 45, 780–794, https://doi.org/10.1080/02786826.2011.560211, 2011.
Niemi, J. V., Saarikoski, S., Aurela, M., Tervahattu, H., Hillamo, R., Westphal, D. L., Aarnio, P., Koskentalo, T., Makkonen, U., Vehkamäki, H., and Kulmala, M.: Long-range transport episodes of fine particles in southern Finland during 1999–2007, Atmos. Environ., 43, 1255–1264, https://doi.org/10.1016/j.atmosenv.2008.11.022, 2009.
Ondráček, J., Schwarz, J., Ždímal, V., Andělová, L., Vodička, P., Bízek, V., Tsai, C.-J., Chen, S.-C., and Smolík, J.: Contribution of the road traffic to air pollution in the Prague city (busy speedway and suburban crossroads), Atmos. Environ., 45, 5090–5100, https://doi.org/10.1016/j.atmosenv.2011.06.036, 2011.
Petit, J.-E., Favez, O., Sciare, J., Crenn, V., Sarda-Estève, R., Bonnaire, N., Močnik, G., Dupont, J.-C., Haeffelin, M., and Leoz-Garziandia, E.: Two years of near real-time chemical composition of submicron aerosols in the region of Paris using an Aerosol Chemical Speciation Monitor (ACSM) and a multi-wavelength Aethalometer, Atmos. Chem. Phys., 15, 2985–3005, https://doi.org/10.5194/acp-15-2985-2015, 2015.
Petzold, A. and Schönlinner, M.: Multi-angle absorption photometry – a new method for the measurement of aerosol light absorption and atmospheric black carbon, J. Aerosol Sci., 35, 421–441, https://doi.org/10.1016/j.jaerosci.2003.09.005, 2004.
Pey, J., Querol, X., and Alastuey, A.: Discriminating the regional and urban contributions in the North-Western Mediterranean: PM levels and composition, Atmos. Environ., 44, 1587–1596, https://doi.org/10.1016/j.atmosenv.2010.02.005, 2010.
Pöschl, U.: Atmospheric Aerosols: Composition, Transformation, Climate and Health Effects, Angew. Chem. Int. Edit., 44, 7520–7540, https://doi.org/10.1002/anie.200501122, 2005.
R Core Team: R: a Language and Environment for Statistical Computing, R Foundation for Statistical Computing, Vienna, Austria, available at: https://cran.r-project.org/, last access: 13 May 2020.
Ripoll, A., Minguillón, M. C., Pey, J., Jimenez, J. L., Day, D. A., Sosedova, Y., Canonaco, F., Prévôt, A. S. H., Querol, X., and Alastuey, A.: Long-term real-time chemical characterization of submicron aerosols at Montsec (southern Pyrenees, 1570 m a.s.l.), Atmos. Chem. Phys., 15, 2935–2951, https://doi.org/10.5194/acp-15-2935-2015, 2015.
Rivas, I., Beddows, D. C. S., Amato, F., Green, D. C., Järvi, L., Hueglin, C., Reche, C., Timonen, H., Fuller, G. W., Niemi, J. V., Pérez, N., Aurela, M., Hopke, P. K., Alastuey, A., Kulmala, M., Harrison, R. M., Querol, X., and Kelly, F. J.: Source apportionment of particle number size distribution in urban background and traffic stations in four European cities, Environ. Int., 135, 105345, https://doi.org/10.1016/j.envint.2019.105345, 2020.
Rolph, G., Stein, A., and Stunder, B.: Real-time Environmental Applications and Display sYstem: READY, Environ. Modell. Softw., 95, 210–228, https://doi.org/10.1016/j.envsoft.2017.06.025, 2017.
Rönkkö, T. and Timonen, H.: Overview of Sources and Characteristics of Nanoparticles in Urban Traffic-Influenced Areas, J. Alzheimers Dis., 72, 15–28, https://doi.org/10.3233/JAD-190170, 2019.
Rönkkö, T., Kuuluvainen, H., Karjalainen, P., Keskinen, J., Hillamo, R., Niemi, J. V., Pirjola, L., Timonen, H. J., Saarikoski, S., Saukko, E., Järvinen, A., Silvennoinen, H., Rostedt, A., Olin, M., Yli-Ojanperä, J., Nousiainen, P., Kousa, A., and Maso, M. D.: Traffic is a major source of atmospheric nanocluster aerosol, P. Natl. Acad. Sci. USA, 114, 7549–7554, https://doi.org/10.1073/pnas.1700830114, 2017.
Salcedo, D., Onasch, T. B., Dzepina, K., Canagaratna, M. R., Zhang, Q., Huffman, J. A., DeCarlo, P. F., Jayne, J. T., Mortimer, P., Worsnop, D. R., Kolb, C. E., Johnson, K. S., Zuberi, B., Marr, L. C., Volkamer, R., Molina, L. T., Molina, M. J., Cardenas, B., Bernabé, R. M., Márquez, C., Gaffney, J. S., Marley, N. A., Laskin, A., Shutthanandan, V., Xie, Y., Brune, W., Lesher, R., Shirley, T., and Jimenez, J. L.: Characterization of ambient aerosols in Mexico City during the MCMA-2003 campaign with Aerosol Mass Spectrometry: results from the CENICA Supersite, Atmos. Chem. Phys., 6, 925–946, https://doi.org/10.5194/acp-6-925-2006, 2006.
Sandradewi, J., Prévôt, A. S. H., Szidat, S., Perron, N., Alfarra, M. R., Lanz, V. A., Weingartner, E., and Baltensperger, U.: Using Aerosol Light Absorption Measurements for the Quantitative Determination of Wood Burning and Traffic Emission Contributions to Particulate Matter, Environ. Sci. Technol., 42, 3316–3323, https://doi.org/10.1021/es702253m, 2008.
Schlag, P., Kiendler-Scharr, A., Blom, M. J., Canonaco, F., Henzing, J. S., Moerman, M., Prévôt, A. S. H., and Holzinger, R.: Aerosol source apportionment from 1-year measurements at the CESAR tower in Cabauw, the Netherlands, Atmos. Chem. Phys., 16, 8831–8847, https://doi.org/10.5194/acp-16-8831-2016, 2016.
Sen, P. K.: Estimates of the Regression Coefficient Based on Kendall's Tau, J. Am. Stat. Assoc., 63, 1379–1389, https://doi.org/10.1080/01621459.1968.10480934, 1968.
Singh, V., Ravindra, K., Sahu, L., and Sokhi, R.: Trends of atmospheric black carbon concentration over the United Kingdom, Atmos. Environ., 178, 148–157, https://doi.org/10.1016/j.atmosenv.2018.01.030, 2018.
Stein, A. F., Draxler, R. R., Rolph, G. D., Stunder, B. J. B., Cohen, M. D., and Ngan, F.: NOAA's HYSPLIT Atmospheric Transport and Dispersion Modeling System, B. Am. Meteor. Soc., 96, 2059–2077, https://doi.org/10.1175/BAMS-D-14-00110.1, 2015.
Stojiljkovic, A., Kauhaniemi, M., Kukkonen, J., Kupiainen, K., Karppinen, A., Denby, B. R., Kousa, A., Niemi, J. V., and Ketzel, M.: The impact of measures to reduce ambient air PM10 concentrations originating from road dust, evaluated for a street canyon in Helsinki, Atmos. Chem. Phys., 19, 11199–11212, https://doi.org/10.5194/acp-19-11199-2019, 2019.
Sujatha, P., Mahalakshmi, D. V., Ramiz, A., Rao, P. V. N., and Naidu, C. V.: Ventilation coefficient and boundary layer height impact on urban air quality, edited by: Wang, Z., Cogent Environ. Sci., 2, 1125284, https://doi.org/10.1080/23311843.2015.1125284, 2016.
Teinilä, K., Aurela, M., Niemi, J. V., Kousa, A., Petäjä, T., Järvi, L., Hillamo, R., Kangas, L., Saarikoski, S., and Timonen, H.: Concentration variation of gaseous and particulate pollutants in the Helsinki city centre – observations from a two-year campaign from 2013–2015, Boreal Environ. Res., 24, 115–136, 2019.
Theil, H.: A rank-invariant method of linear and polynomial regression analysis, 3; confidence regions for the parameters of polynomial regression equations, Indagationes Mathematicae, 1, 467–482, 1950.
Timonen, H., Carbone, S., Aurela, M., Saarnio, K., Saarikoski, S., Ng, N. L., Canagaratna, M. R., Kulmala, M., Kerminen, V.-M., Worsnop, D. R., and Hillamo, R.: Characteristics, sources and water-solubility of ambient submicron organic aerosol in springtime in Helsinki, Finland, J. Aerosol Sci., 56, 61–77, https://doi.org/10.1016/j.jaerosci.2012.06.005, 2013.
Turpin, B. J. and Lim, H.-J.: Species Contributions to PM2.5 Mass Concentrations: Revisiting Common Assumptions for Estimating Organic Mass, Aerosol Sci. Tech., 35, 602–610, https://doi.org/10.1080/02786820119445, 2001.
Virtanen, A., Rönkkö, T., Kannosto, J., Ristimäki, J., Mäkelä, J. M., Keskinen, J., Pakkanen, T., Hillamo, R., Pirjola, L., and Hämeri, K.: Winter and summer time size distributions and densities of traffic-related aerosol particles at a busy highway in Helsinki, Atmos. Chem. Phys., 6, 2411–2421, https://doi.org/10.5194/acp-6-2411-2006, 2006.
Vogt, M., Johansson, C., Mårtensson, M., Struthers, H., Ahlm, L., and Nilsson, D.: Heated submicron particle fluxes using an optical particle counter in urban environment, Atmos. Chem. Phys., 13, 3087–3096, https://doi.org/10.5194/acp-13-3087-2013, 2013.
Voigtländer, J., Tuch, T., Birmili, W., and Wiedensohler, A.: Correlation between traffic density and particle size distribution in a street canyon and the dependence on wind direction, Atmos. Chem. Phys., 6, 4275–4286, https://doi.org/10.5194/acp-6-4275-2006, 2006.
von Schneidemesser, E., Monks, P. S., Allan, J. D., Bruhwiler, L., Forster, P., Collins, D., Lauer, A., Morgan, W. T., Paasonen, P., Righi, M., Sindelarova, K., and Sutton, M. A.: Chemistry and the Linkages between Air Quality and Climate Change, Chem. Rev., 115, 3856–3897, https://doi.org/10.1021/acs.chemrev.5b00089, 2015.
Wang, K., Dickinson, R. E., and Liang, S.: Clear Sky Visibility Has Decreased over Land Globally from 1973 to 2007, Science, 323, 1468–1470, https://doi.org/10.1126/science.1167549, 2009.
WHO: World Health Organization air quality guidelines for particulate matter, ozone, nitrogen dioxide and sulfur dioxide, Global update 2005, available at: http://whqlibdoc.who.int/hq/2006//WHO_SDE_PHE_OEH_06.02_eng.pdf (last access: 2 July 2020), 2006.
WHO: Air pollution, available at: https://www.who.int/airpollution/en/ (last access: 23 July 2020), 2018.
Zhang, R., Wang, G., Guo, S., Zamora, M. L., Ying, Q., Lin, Y., Wang, W., Hu, M., and Wang, Y.: Formation of Urban Fine Particulate Matter, Chem. Rev., 115, 3803–3855, https://doi.org/10.1021/acs.chemrev.5b00067, 2015.
Zhang, Y., Favez, O., Canonaco, F., Liu, D., Močnik, G., Amodeo, T., Sciare, J., Prévôt, A. S. H., Gros, V., and Albinet, A.: Evidence of major secondary organic aerosol contribution to lensing effect black carbon absorption enhancement, npj Clim. Atmos. Sci., 1, 47, https://doi.org/10.1038/s41612-018-0056-2, 2018.