the Creative Commons Attribution 4.0 License.
the Creative Commons Attribution 4.0 License.
 | 20 Apr 2021
El Niño–Southern Oscillation (ENSO) effect on interannual variability in spring aerosols over East Asia
Anbao Zhu
Haiming Xu
Jiechun Deng
Jing Ma
Shuhui Li
Effects of the El Niño–Southern Oscillation (ENSO) on the interannual variability in spring aerosols over East Asia are investigated using the Modern Era Retrospective analysis for Research and Applications Version 2 (MERRA-2) reanalysis aerosol data. Results show that the ENSO has a crucial effect on the spring aerosols over mainland South East Asia, southern China, and the ocean south of Japan. The above-normal (below-normal) aerosols are found over these regions during the ensuing spring of El Niño (La Niña). In contrast to the local aerosol diffusion in winter, the ENSO affects East Asian aerosols in the following spring mainly via the modulation of upstream aerosol generation and transport processes. The underlying physical mechanism is that during the ensuing spring of El Niño (La Niña), the dry (wet) air and reduced (enhanced) precipitation are beneficial for the increase (reduction) in biomass burning activities over northern mainland South East Asia, resulting in more (fewer) carbonaceous aerosol emissions. On the other hand, the anomalous anticyclone (cyclone) over the north-western Pacific (WNP) associated with El Niño (La Niña) enhances (weakens) the low-level south-westerly wind from northern mainland South East Asia to southern Japan, which transports more (less) carbonaceous aerosol downstream. Anomalous precipitation plays a role in reducing aerosols over the source region, but its washout effect over the downstream region is limited. The ENSO's impact on the ensuing spring aerosols is mainly attributed to the eastern Pacific ENSO rather than the central Pacific ENSO.
- Article
(19542 KB) - Full-text XML
- BibTeX
- EndNote


East Asia, especially China, has suffered heavy air pollution from various emission sources in recent decades (e.g. Streets and Waldhoff, 2000; Chan and Yao, 2008; Tao et al., 2017). An increase in anthropogenic aerosol emission due to human activities, such as economic development and urbanization, has been considered to be the primary reason for the sharp increase in the occurrence of haze pollution events (e.g. Zhang et al., 2013; An et al., 2019). Furthermore, due to their physical and chemical properties, aerosols have adverse effects on human health (e.g. Cohen et al., 2017; Lelieveld et al., 2019) and ecosystems (e.g. Yue et al., 2017; Werdell et al., 2019).
As an important component of the atmosphere, aerosols play a crucial role in climate change through aerosol–radiation interactions (i.e. the direct effect) and aerosol–cloud interactions (i.e. the indirect effect). Aerosols can directly absorb (e.g. dust, black and brown carbon) and scatter (e.g. sulfate, nitrate, and organics) solar radiation, altering the radiation budget (Forster et al., 2007; Myhre et al., 2013), while they indirectly produce changes in radiation and precipitation via the modification of cloud microphysical properties and lifetime (Rosenfeld, 2000; Rosenfeld et al., 2008; Li et al., 2011). Both effects by aerosols can induce strong large-scale atmospheric-circulation change (Allen et al., 2012; Song et al., 2014; Shen and Ming, 2018; Deng et al., 2020) and regional climate responses (e.g. Lau et al., 2006; Zhang et al., 2007; Dong and Zhou, 2014; Wang et al., 2019a) and even tropical sea surface temperatures (e.g. Yang et al., 2016; Lou et al., 2019) through changing radiative balance and poleward heat transport. On the other hand, climate change may also act to redistribute the East Asian aerosol loading in turn. Changes in the intensity of the East Asia monsoon can directly affect the transport and lifetime of a wide variety of aerosols (Wu et al., 2016). For instance, the weakening of the East Asia winter monsoon (EAWM) has led to an increase in heavy fog haze over eastern China during recent years (Niu et al., 2010), while the East Asia summer monsoon (EASM) is negatively correlated with aerosol concentrations over eastern China (Zhang et al., 2010a). In addition, the East Asian aerosol variation can be modulated by climate anomalies due to other factors, including the Arctic sea ice (Wang et al., 2015; Zou et al., 2017), Eurasian snowpack (Yin and Wang, 2017), and sea surface temperature (SST) (e.g. Liu et al., 2013; Feng et al., 2016b; Sun et al., 2018).
As the strongest signal of interannual climate variability, the El Niño–Southern Oscillation (ENSO) can cause remarkable climate anomalies at a global scale. Thus, it may affect the East Asian aerosols through changing atmospheric circulation. Gao and Li (2015) showed that an El Niño (La Niña) event is likely to bring more (fewer) haze days in eastern China in winter during 1981–2010. Sun et al. (2018) also found that the weakened EAWM during El Niño events increases aerosols in eastern China, especially over northern China. However, Zhao et al. (2018) revealed that haze days over southern China tended to be less (more) frequent in the El Niño (La Niña) winters of 1960–2014, but there is no significant relationship between ENSO and winter haze days over northern and eastern China. Using station observational data, Wang et al. (2019b) compared two individual ENSO events and found that higher fine-particulate-matter (PM2.5) concentrations were observed at most northern China stations during the El Niño (2015/2016) winter but at a majority of stations in southern China during the La Niña (2017/2018) winter. However, the influence of ENSO on aerosols differs among events. Results from a chemical transport model showed that the 1987/1988 El Niño event decreased the aerosols during its maturing and decaying spring over eastern China, whereas the El Niño event of 1997/1998 increased the aerosols over the whole lifespan over eastern China (Feng et al., 2016b). In addition, different ENSO intensity also has different effects on East Asian aerosols. Using a climate–aerosol coupled model, Yu et al. (2019) reported that the moderate El Niño events largely increase surface aerosol concentrations over eastern China, which is caused by anomalous south-westerly winds transporting more aerosol particles from South and South East Asia, while the strong and weak events obviously decrease the aerosol loading over northern China through the enhanced aerosol diffusions by El Niño-induced northerly wind anomalies. Since ENSO events can be further divided into two types (i.e. the eastern Pacific (EP) El Niño and central Pacific (CP) El Niño (or El Niño Modoki) as well as the EP La Niña and CP La Niña), previous studies demonstrated that the impacts of CP El Niño events on the atmospheric circulation over East Asia considerably differ from those of EP El Niño events (e.g. Weng et al., 2009; Feng et al., 2011), and the same is true for aerosols (Feng et al., 2016a, 2017; Yu et al., 2019). The CP El Niño events can increase the wintertime aerosol burden over southern China more than the EP events with similar intensity (Yu et al., 2019). The impact of different CP La Niña events on East Asian aerosols also varies. For example, Feng et al. (2017) found an anomalous dipole pattern of aerosol concentrations over eastern China (i.e. increased aerosols in the south and reduced aerosols in the north) during the mature phase of the strong ENSO event of 1998/1999, while this dipole pattern was reversed during the moderate event of 2000/2001.
Most of these studies only focused on the winter season (Gao and Li, 2015; Sun et al., 2018; Zhao et al., 2018; Yu et al., 2019), and some discrepancies exist among these results; e.g. the regions with significant aerosol changes are different between the findings of Sun et al. (2018) and Zhao et al. (2018). However, spring sees the highest aerosol optical depth (AOD) over East Asia in the annual cycle, which is related to the dust and anthropogenic emissions (Kim et al., 2007; Bao et al., 2009). Carbonaceous aerosols (CAs) from South Asia (Zhang et al., 2010b) and South East Asia (Lin et al., 2009; Yadav et al., 2017) can be transported to East Asia during this season. However, little attention has been paid to spring. Although a few studies attempted to reveal the impacts of ENSO on ensuing spring aerosols (Feng et al., 2016a, b, 2017; Wang et al., 2019b), their use of individual ENSO events may give rise to uncertainties due to the lack of statistical significance based on the long-term observational data. In addition, the different impacts of the two types of ENSO on aerosols are not thoroughly investigated. Thus, it is necessary to further explore the impacts of ENSO on ensuing spring aerosols over East Asia based on the composite analyses of several ENSO events, which would enlarge the sample size and increase the confidence level.
This study aims to address the following questions using long-term reanalysis aerosol data: (1) what are the impacts of ENSO on the temporal and spatial distribution of ensuing spring aerosols over East Asia, and (2) what are the physical processes and relative roles of anomalous circulation and rainfall in altering ensuing spring aerosols over the region? This study differs from previous studies by focusing on the influence of ENSO (including its two types) on interannual variation in East Asian aerosols in spring based on the long-term observational data and on different mechanisms in winter and ensuing spring. The rest of this paper is structured as follows. The data and methodology are presented in Sect. 2. The impacts of ENSO on the ensuing spring AOD are explored in Sect. 3. In Sect. 4, we discuss the physical mechanisms involved. In Sect. 5, we outline different influences by the two types of ENSO. In Sect. 6, we provide the discussion and conclusions.
2.1 Data and methods
We use the monthly data for atmospheric variables from the fifth generation European Centre for Medium-Range Weather Forecasts (ECMWF) reanalysis data (ERA5) (Hersbach and Dee, 2016), including geopotential height and zonal and meridional wind components on a 0.25∘ grid. Monthly precipitation data on a 2.5∘ grid is the Climate Prediction Center (CPC) Merged Analysis of Precipitation (CMAP) dataset (Xie and Arkin, 1997) provided by the National Oceanic and Atmospheric Administration (NOAA). We also use monthly mean SST on a 1∘ grid from the HadISST V1.1 SST dataset (Rayner et al., 2003) provided by the UK Met Office Hadley Centre.
The aerosol data are from the National Aeronautics and Space Administration (NASA)'s Modern Era Retrospective analysis for Research and Applications Version 2 (MERRA-2) (Gelaro et al., 2017), with a spatial resolution of 0.5∘ by 0.625∘ (longitude by latitude) on 72 vertical levels. MERRA-2 is generated using the advanced global data assimilation system, the Goddard Earth Observing System Model Version 5 (GEOS-5), including the assimilation of AOD retrieved from the Advanced Very High Resolution Radiometer (AVHRR) instrument over the oceans (Heidinger et al., 2014), the Moderate resolution Imaging Spectroradiometer (MODIS) (Levy et al., 2010), non-bias-corrected AOD retrieved from the Multiangle Imaging SpectroRadiometer (MISR). (Kahn et al., 2005) over bright surfaces, and ground-based Aerosol Robotic Network (AERONET) observations (Holben et al., 1998). This dataset includes all the processes of aerosol transport, deposition, microphysics, and radiative forcing. As the first long-term aerosol reanalysis dataset, MERRA-2 has been adequately evaluated in previous studies (e.g. Buchard et al., 2017; Song et al., 2018; Che et al., 2019; Sun et al., 2019) and widely used for analysing the interactions between aerosols and climate systems (e.g. Lau et al., 2018; Sun et al., 2018; Che et al., 2019; Yuan et al., 2019). In this study, the monthly mean AOD at 550 nm is used to analyse the spatio-temporal characteristics of aerosols. As the tracers, aerosol species (black carbon (BC) and organic carbon (OC)) fields are used for diagnosing transport properties (Lau et al., 2018; Yuan et al., 2019).
For consistency, all of the variables cover the same period of 1980–2019. To highlight interannual variability, the Fourier analysis is performed to remove the first four waves of these variables, which are usually related to interdecadal variability (Awan and Bae, 2016). The empirical-orthogonal-function (EOF) analysis, linear-regression analysis, composite analysis, and correlation are also used in this study and are subjected to the two-tailed Student's t test for statistical significance.
2.2 Identification of ENSO events
We select the ENSO events defined by the NOAA CPC. Events are defined as five consecutive overlapping 3-month periods at or above the +0.5 ∘C SST anomaly in the Niño 3.4 region (5∘ S–5∘ N, 120–170∘ W) for warm (El Niño) events and at or below the −0.5 ∘C anomaly for cold (La Niña) events, based on centred 30-year base periods updated every 5 years. More details on the definition of ENSO events can be found on the website: https://origin.cpc.ncep.noaa.gov/products/analysis_monitoring/ensostuff/ONI_v5.php (last access: 22 March 2021). For consecutive ENSO years, the relatively stronger El Niño and La Niña winters are taken as representatives in this study, such as 1986/87 for the 1986–1988 El Niño event and 1999/2000 for the 1998–2001 La Niña event. Thus, 11 El Niño events (1982/83, 1986/87, 1991/92, 1994/95, 1997/98, 2002/03, 2004/05, 2006/07, 2009/10, 2015/16, and 2018/19) and 12 La Niña events (1983/84, 1984/85, 1988/89, 1995/96, 1999/2000, 2005/06, 2007/08, 2008/09, 2010/11, 2011/12, 2016/17, and 2017/18) are selected.
There are many ways to distinguish the two types of ENSO events (e.g. Ashok et al., 2007; Ren and Jin, 2011). Here, following the studies of Zhang et al. (2011) and Li et al. (2019), different ENSO types are identified based on their spatial distributions of SST anomalies. When the SST anomaly centre is located east of 150∘ W, the ENSO event is categorized as an EP ENSO event, in contrast to the CP ENSO event, when the SST anomaly centre is located west of 150∘ W. This method has a distinct advantage that can effectively distinguish the two ENSO types for both El Niño and La Niña events. Then, the 11 El Niño events are divided into six EP and five CP El Niño events, and the 12 La Niña events are divided to six EP and CP types each (Table 1). A more detailed description on how to define the two ENSO types can be found in Li et al. (2019).


Figure 1Spatial distribution of climatological spring (MAM) mean aerosol optical depth (AOD; shading) and 850 hPa wind (vector; m s−1). Black contours denote spring AOD's variance with interval of 0.02.
3.1 Variation in spring aerosols
Figure 1 shows the climatological spring mean AOD in East Asia during 1980–2019. The large AOD appears over eastern China, especially over the Sichuan Basin and east-central China, with a maximum exceeding 0.6. The aerosol loading gradually decreases from eastern China through Japan up to the North Pacific along midlatitude westerlies, similarly to the climatological annual mean AOD (Bao et al., 2009). As spring is a transitional season, relatively weak north-westerlies prevail at the low-level troposphere (850 hPa) over northern East Asia, while southern China and the north of mainland South East Asia are mainly controlled by the south-westerly wind, where the AOD is also relatively high. The characteristics of the spring mean AOD pattern agree well with the results of Che et al. (2019), who also used the MERRA-2 AOD in the same period.
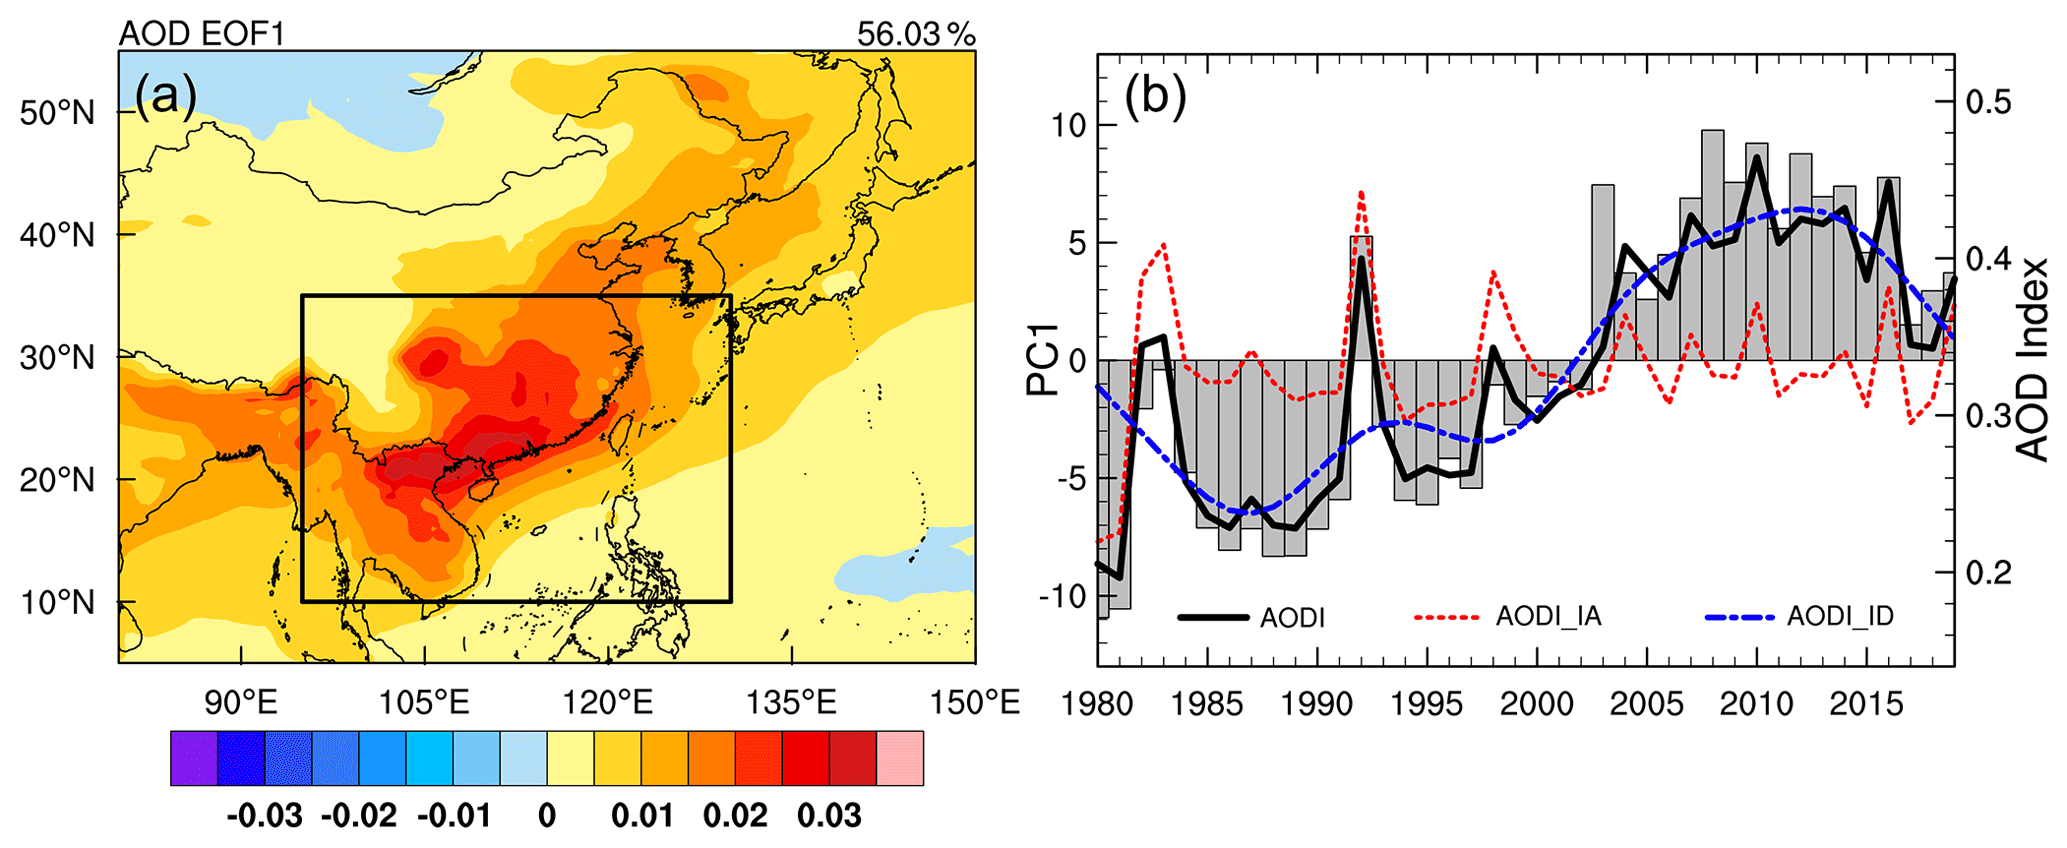
Figure 2(a) Spatial pattern (shading) and (a) principal component (grey bars) of the first EOF mode of MAM mean AOD over East Asia during 1980–2019. The East Asian spring AOD index (AODI; solid black line), defined as AOD averaged over East Asia (10–35∘ N, 95–130∘ E; the black box in a), is also plotted in (b), together with its interannual component (AODI_IA; dashed red line) and interdecadal component (AODI_ID; dashed blue line).
To clarify the spatio-temporal variation in aerosols, the EOF analysis is applied to AOD anomalies relative to the 1980–2019 mean. The first EOF mode (EOF1; Fig. 2) explains 56.03 % of the total variance. The spatial pattern (Fig. 2a) is highly in line with the distribution of the AOD variance (Fig. 1), characterized by large variances over the Sichuan Basin, southern China, and mainland South East Asia, with the maximum centre located in northern mainland South East Asia. Thus, an AOD index (AODI) is defined using the AOD averaged over the selected key region of 10–35∘ N, 95–130∘ E (the black box in Fig. 2a), with larger AOD variance. Figure 2b illustrates the respective principal component of EOF1 (PC1), together with the AODI and its interdecadal (AODI_ID) and interannual (AODI_IA) components. The correlation between AODI and PC1 exceeds 0.96, indicating that the AODI can measure both interannual and interdecadal variation in the spring aerosol over East Asia well. On the interdecadal timescale, the AODI stayed at a low level from 1980 to 1998 and increased dramatically during 1998–2013. This interdecadal change is suggested to be dominated by meteorological factors (Che et al., 2019) rather than generated by rapid economic growth as previously thought (Wu et al., 2016). However, the AODI declined rapidly after 2013, consistent with the recent study by Zhang et al. (2018), showing that the AOD over southern China had a decreasing trend since 2012 based on the MODIS records. Note that the AODI reached two peaks in the early 1980s and 1990s, which were most likely associated with two giant volcano eruption events, respectively (Che et al., 2019). On the other hand, the AODI also exhibits large interannual fluctuation. Given that interannual variability is an important part of the total aerosol variability, we mainly focus on the atmospheric anomalies associated with the interannual AOD variation over East Asia in this study. Note that the variables used hereafter all refer to their interannual components.
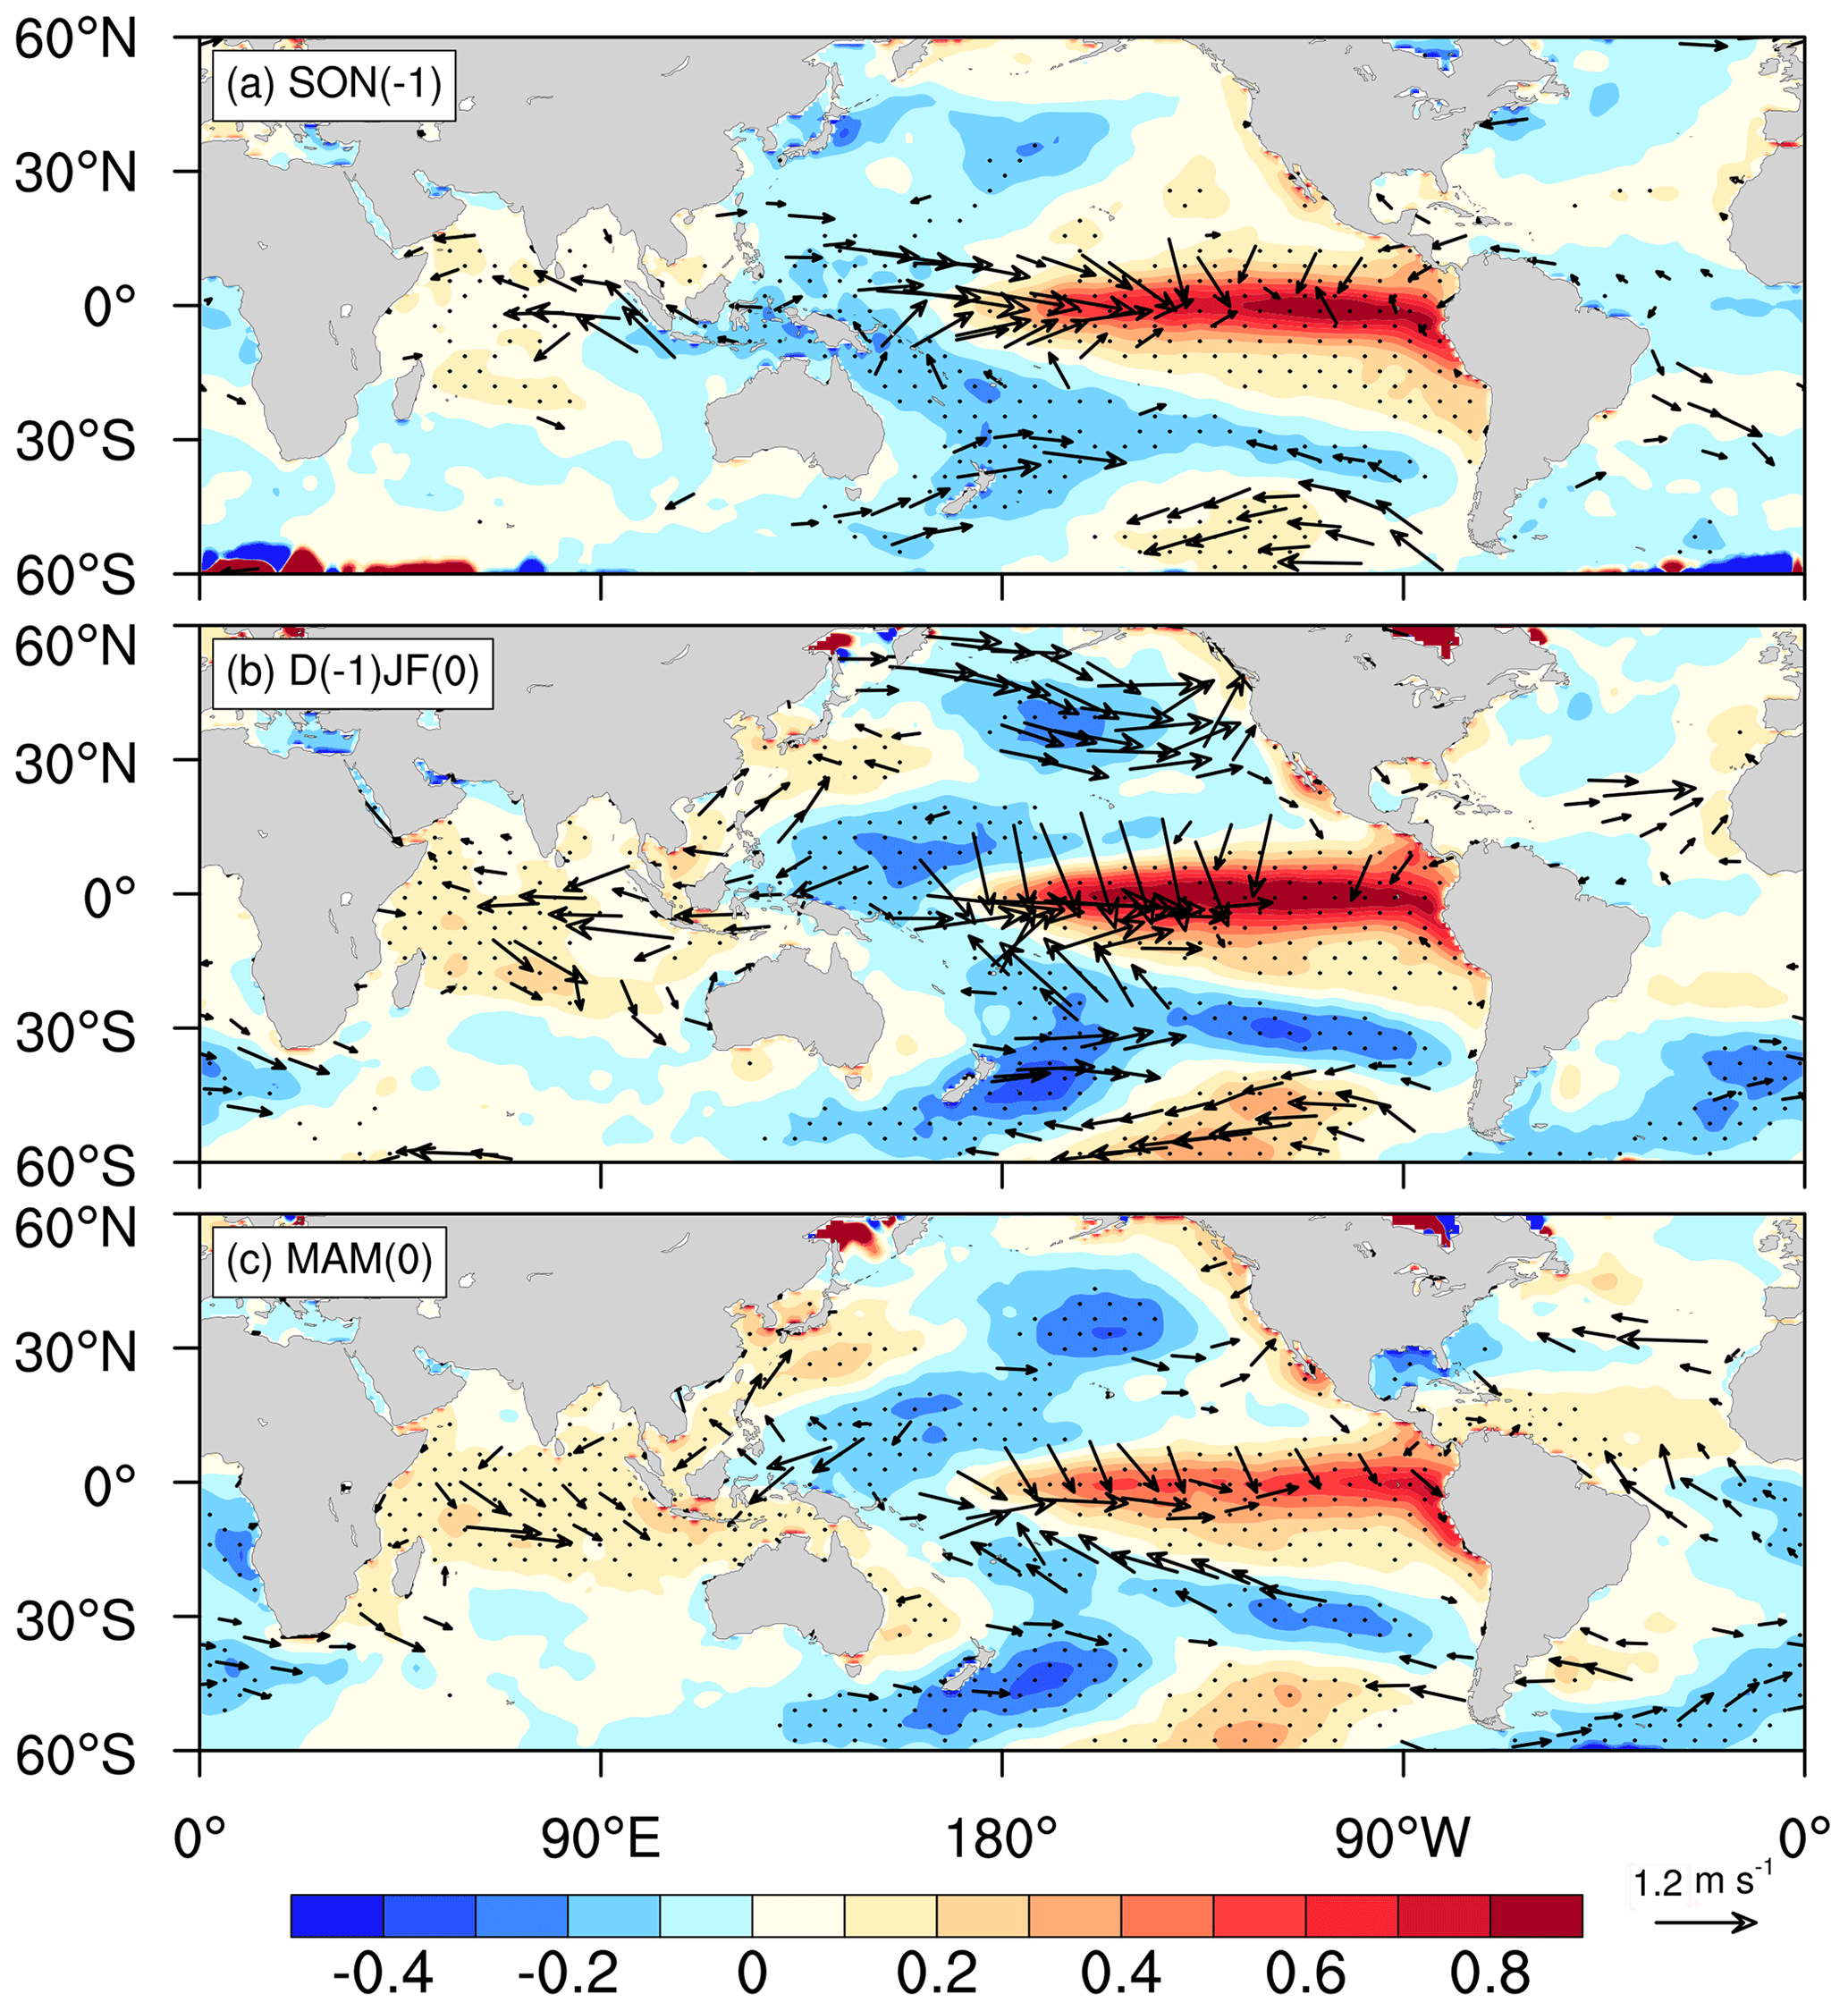
Figure 3Regressions of sea surface temperature (SST) anomalies (shading; ∘C) and 10 m surface wind anomalies (vector; m s−1) onto the standardized AODI_IA in the (a) preceding autumn (SON(−1)), (b) preceding winter (D(−1)JF(0)), and (c) simultaneous spring (MAM(0)). Stippling and vectors denoting the regressed SST and wind are statistically significant at the 95 % confidence level based on the Student's t test, respectively.
3.2 Interannual relationships between the AOD and ENSO
Figure 3 shows the regressed anomalies of SST and near-surface (10 m) wind upon the AODI_IA during the preceding autumn (SON(−1)) and winter (D(−1)JF(0)) and simultaneous spring (MAM(0)). During MAM(0) (Fig. 3c), anomalous SST exhibits a dipole structure in the tropical Pacific, with warmer anomalies in the central and eastern equatorial Pacific and colder anomalies in the western equatorial Pacific. Correspondingly, anomalous anticyclonic winds exist over the north-western Pacific (NWP) and westerly anomaly winds over the central and eastern equatorial Pacific. In the Indian Ocean, warmer SST anomalies can be observed almost across the whole basin, with anomalous north-easterly winds to the north of the Equator and anomalous north-westerly winds to the south. This El Niño-like SST anomaly pattern suggests that the East Asian aerosols in spring may be modulated by the preceding ENSO. Furthermore, these typical El Niño features can be found during the preceding autumn (Fig. 3a) and winter (Fig. 3b). The correlation of AODI_IA with Niño 3.4 SST reaches the maximum in the pre-winter (pre-autumn: 0.53; pre-winter: 0.6; spring: 0.58; all of them are statistically significant at the 95 % level). Thus, these coherent correlations clearly indicate that the interannual variation in East Asian aerosols is significantly correlated with the ENSO; i.e. the warm phase of ENSO (i.e. El Niño) is associated with higher aerosol concentrations in the following spring over East Asia, while the cold phase (i.e. La Niña) correlates with lower aerosol concentrations.
To further demonstrate the influence of ENSO on East Asian aerosol concentrations, the composite anomalies of the ensuing spring AOD of El Niño and La Niña events and their differences (El Niño minus La Niña) are shown in Fig. 4. During the El Niño events (Fig. 4a), positive AOD anomalies are seen over southern China, mainland South East Asia, and the equatorial Maritime Continent, which are at a maximum in northern mainland South East Asia, with a value of approximately 0.1, accounting for about 20 % of the climatological AOD mean (Fig. 1), while the La Niña events see the opposite (Fig. 4b), especially in northern mainland South East Asia, with the largest negative anomaly around −0.08 (accounting for ∼ 13 % of the climatological mean). Meanwhile, prominent positive AOD anomalies are observed over parts of north-western China and north-eastern Asia. This may be due to the deserts in north-western (Taklimakan Desert) and central (Badain Jaran Desert) China, which provide more dust aerosols in the troposphere in the ensuing spring of La Niña events (Gong et al., 2006). Significant positive AOD anomalies are also found over the Indo-Gangetic Plain and parts of the northern Indian Ocean as more dust aerosols can be transported to these regions from the deserts of the Middle East, West Asia, and north-western India during April–May of La Niña years (Kim et al., 2016). Generally, the amplitude of AOD anomalies during La Niña events is much smaller than that during El Niño events, suggesting that there is an asymmetry in the effects of ENSO on aerosols over East Asia during the ensuing spring. The asymmetric influences of the ENSO on East Asian aerosols can also be found in winter, as reported (Sun et al., 2018; Feng et al., 2019). The differences between El Niño and La Niña events exhibit pronounced positive AOD anomalies covering areas from south of Japan (30∘ N, 135∘ E) through southern China and mainland South East Asia to the coast of Sumatra (Fig. 4c). Note that Wu et al. (2013) pointed out that aerosols increased sharply over the Maritime Continent in the fall of El Niño-developing years during the period 2000–2010, while our results indicate that positive AOD anomalies can also be observed over the Maritime Continent during the spring following El Niño.
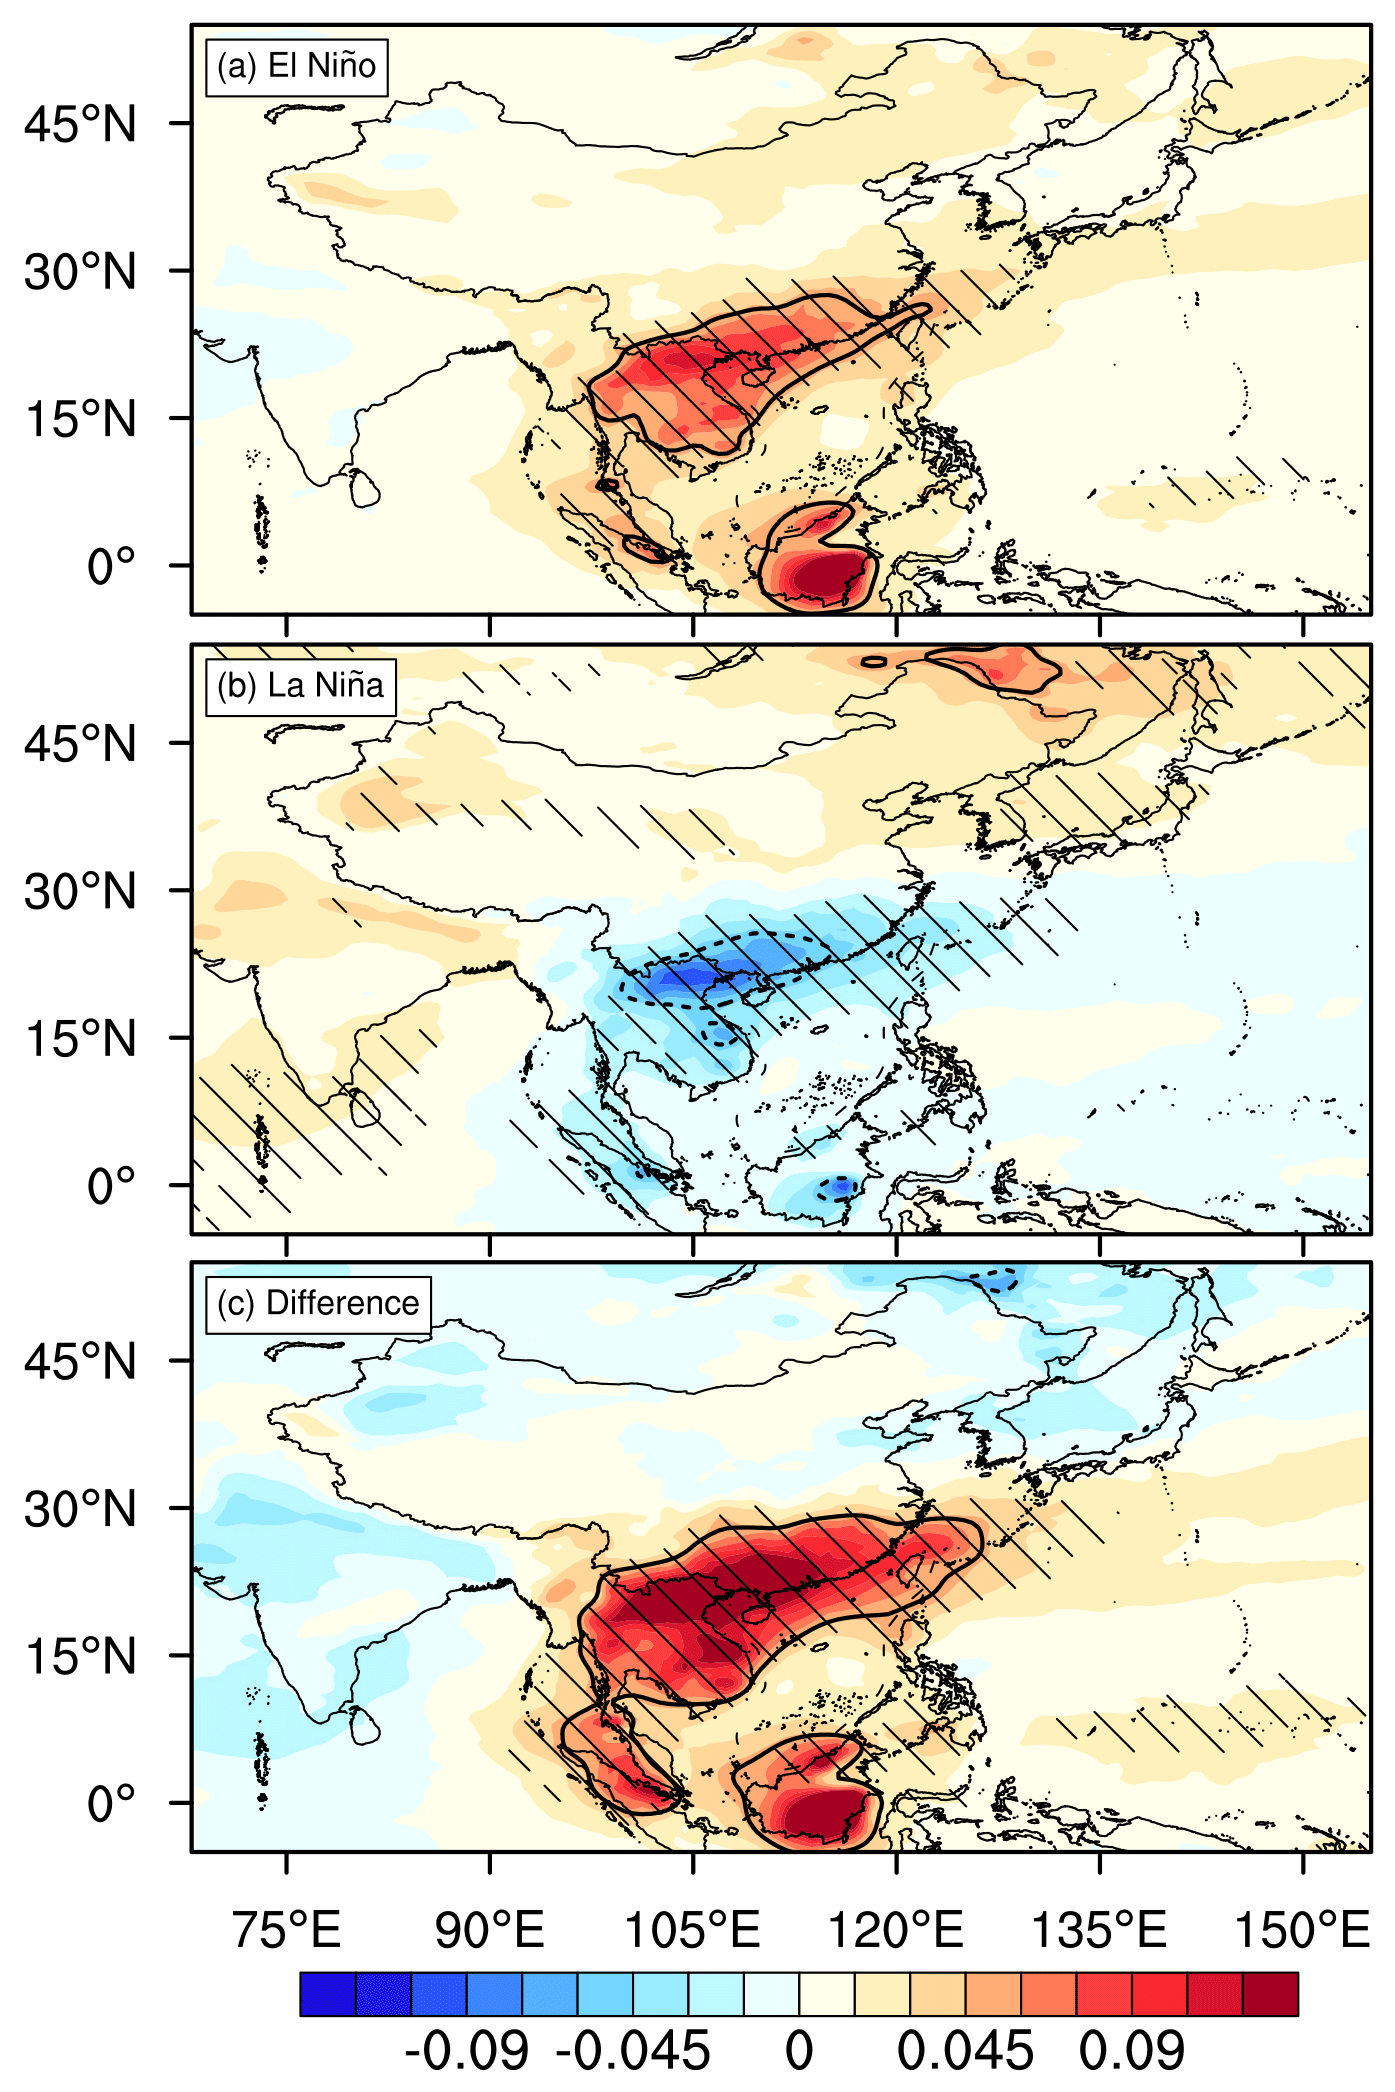
Figure 4Composite anomalies of spring AOD (shading) during (a) El Niño and (b) La Niña and (c) their differences (El Niño minus La Niña). Solid black (dashed) contours outline the areas where the AOD anomalies are larger (smaller) than 0.05 (−0.05). Hatching denotes the anomalies statistically significant at the 95 % confidence level based on the Student's t test.
In summary, the ENSO can significantly increase (decrease) the ensuing spring aerosol loading over mainland South East Asia, southern China, and the downstream regions during its warm (cold) phase, and an asymmetry exists between these two phases. However, Sun et al. (2018) found that ENSO exerts a significant influence on winter aerosols over northern China, while there is no significant signal over southern China. Clearly, different mechanisms may work for the different impacts of ENSO on aerosols in winter and ensuing spring. In the following section, we explore possible mechanisms through which the ENSO can impact the ensuing spring aerosols.
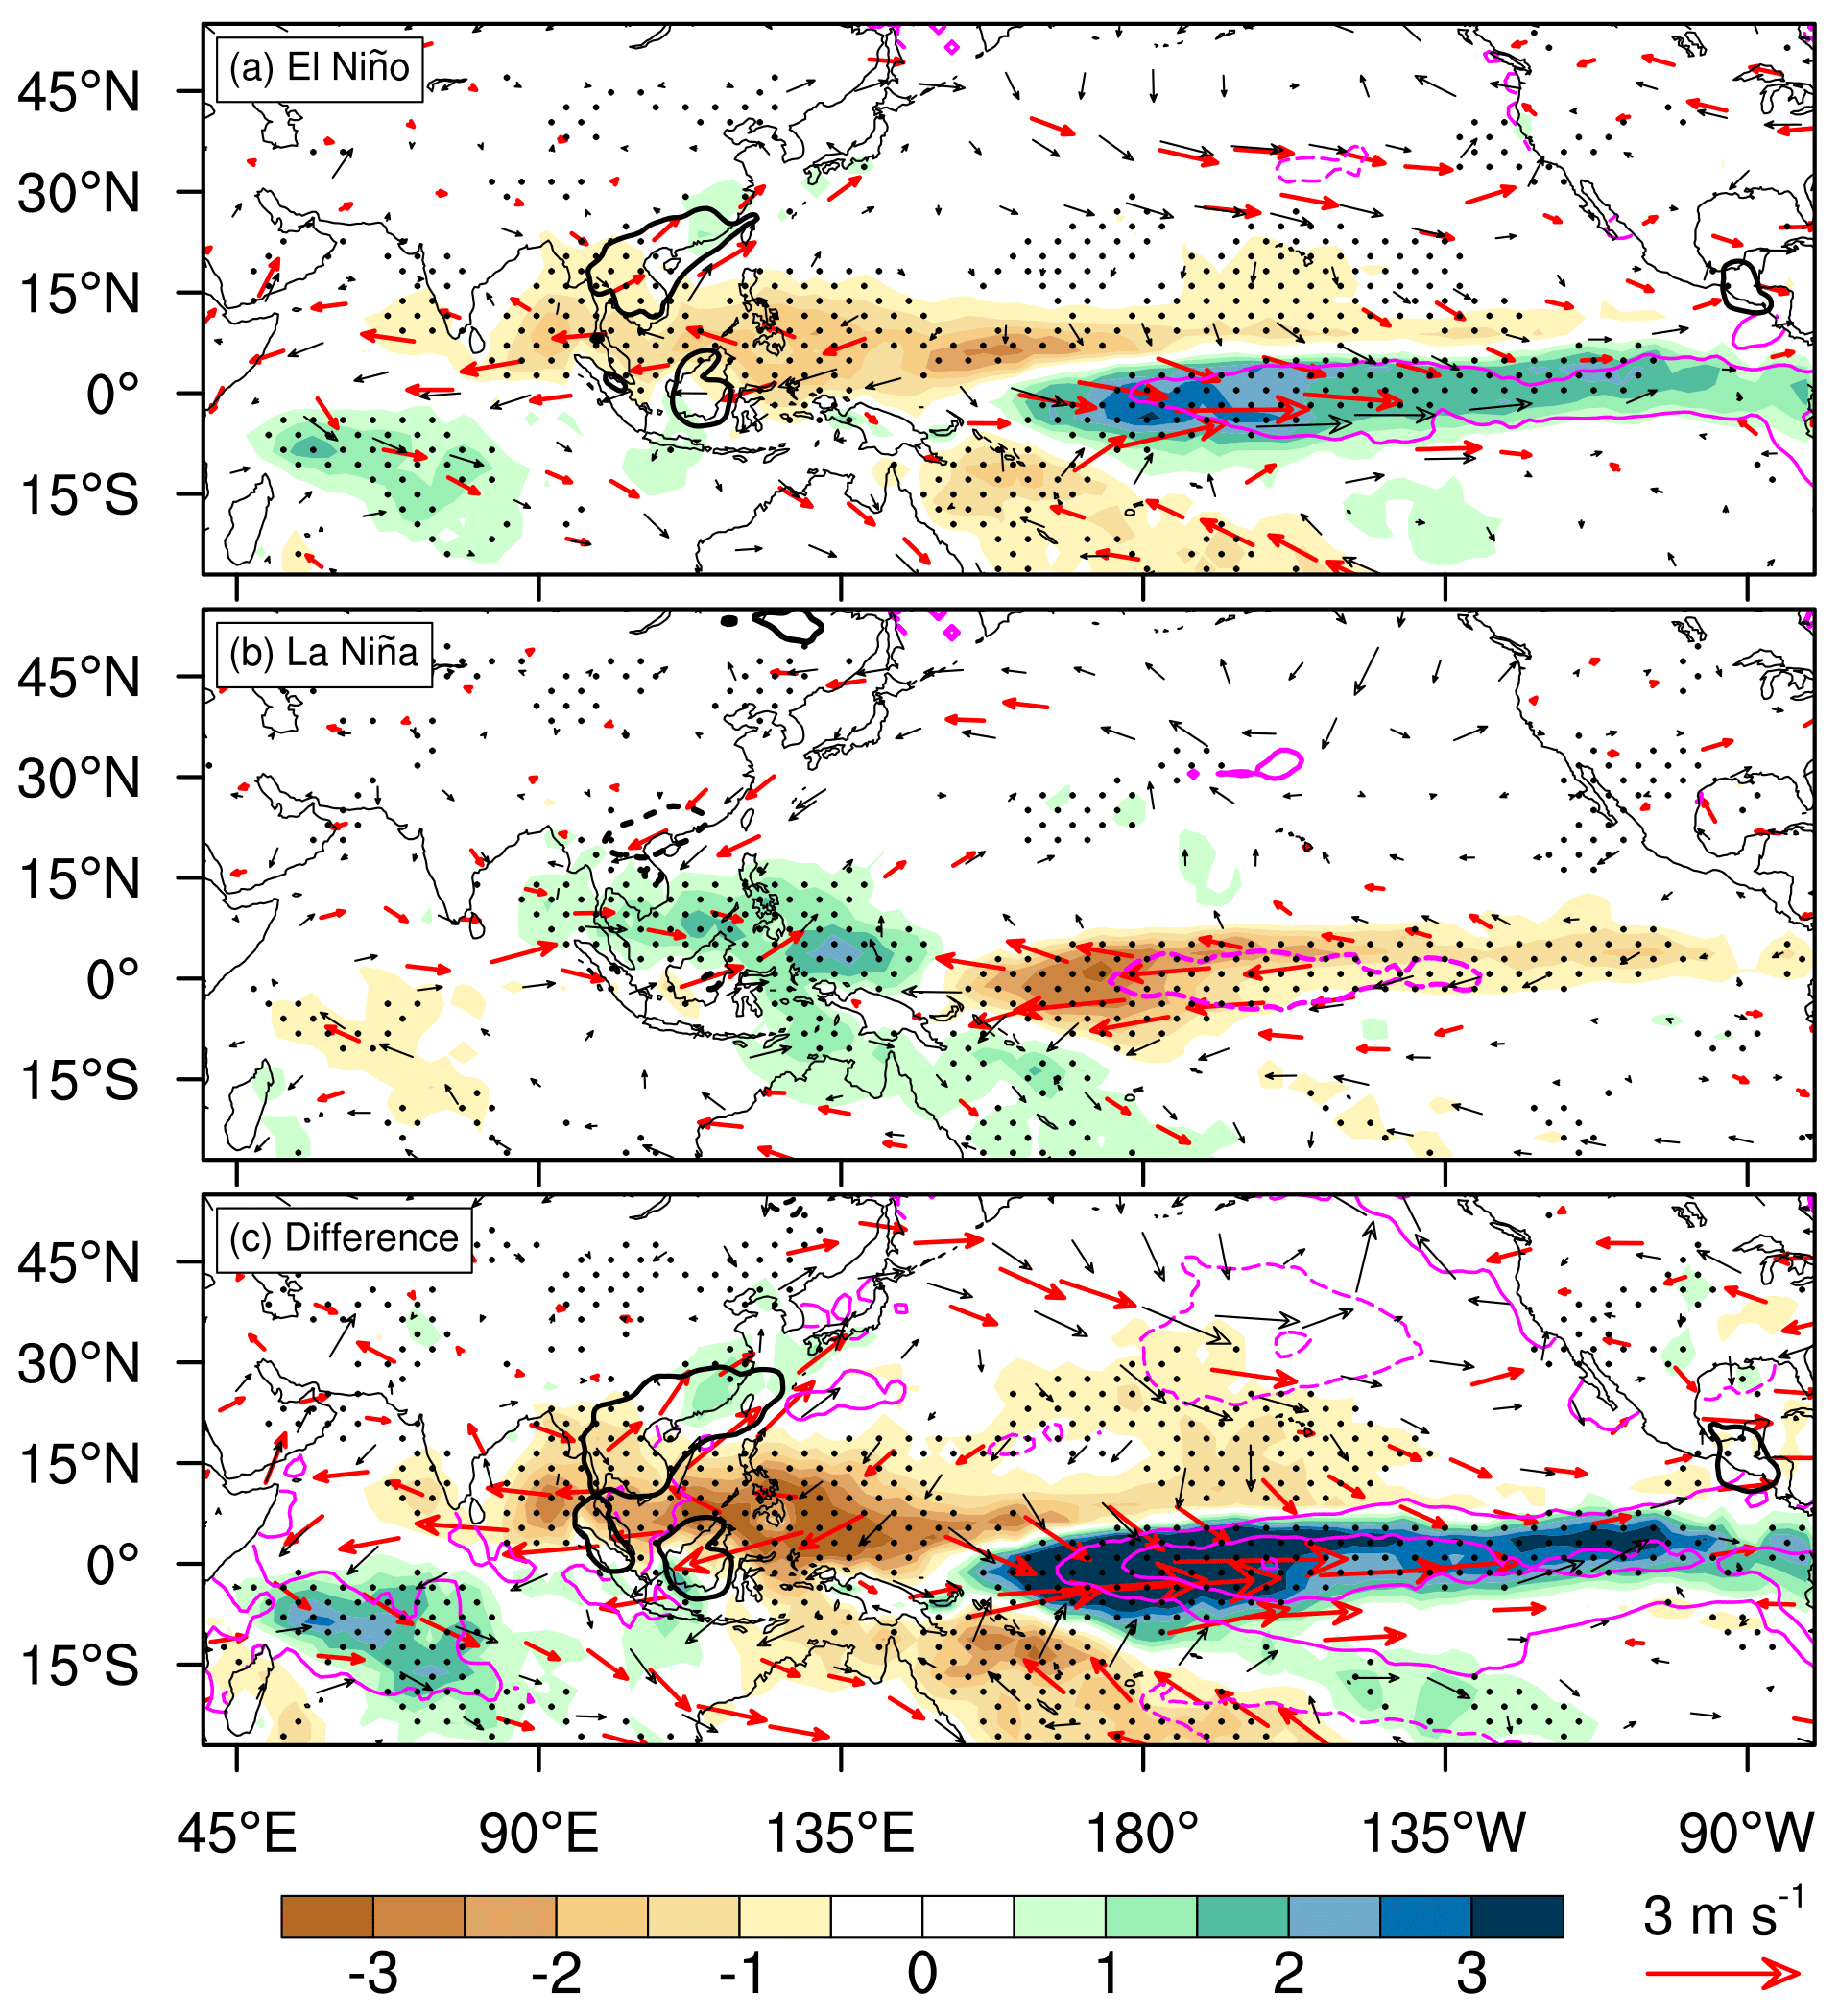
Figure 5Same as Fig. 4, except for SST anomalies (purple contours with interval of 0.05 ∘C; the dashed contours are for negative values, and the zero contour is omitted for clarity), precipitation anomalies (shading; mm d−1), and 850 hPa wind anomalies (black vector; m s−1). Black contours are the same as those in Fig. 4. Stippling and red vectors indicating the anomalies of precipitation and wind are statistically significant at the 95 % confidence level based on the Student's t test, respectively.
Large-scale atmospheric circulation and precipitation play crucial roles in the transport, diffusion, and removal of aerosols (e.g. Bao et al., 2009; Zhang et al., 2010a; Ning et al., 2018; Feng et al., 2019). Thus, to identify the underlying mechanisms associated with the effects of ENSO on the ensuing spring aerosols over East Asia, we show composite anomalies of SST, 850 hPa wind, and precipitation in the spring following ENSO events (Fig. 5). For the spring following the El Niño event (Fig. 5a), tropical Pacific SST anomalies (SSTAs) generally display a zonal dipole structure, with warm anomalies in the east-central equatorial Pacific and cold anomalies in the western equatorial Pacific. Note that some cold anomalies can also be seen on both sides of the warm anomalies. Meanwhile, a strong anomalous high surface pressure is located over the NWP (not shown), which is centred over the Philippine Sea. Thus, the anomalous anticyclone (AAC) over the NWP acts to bridge the east-central Pacific warming and East Asian climate (Harrison and Larkin, 1996; Wang et al., 2000). On the south-eastern flank of the NWP AAC, the anomalous wind there intensifies the prevailing north-easterly wind, which contributes to the SST cooling and the maintenance of the NWP AAC (Wang et al., 2000). On its north-western flank, the anomalous south-westerly wind acts to strengthen the climatological south-westerly wind in eastern mainland South East Asia and southern China (Fig. 5a). This provides a potential dynamic condition for aerosol transport from mainland South East Asia to the downstream regions. Therefore, significant, positive AOD anomalies are observed over southern China (Fig. 4a). This is consistent with the findings of Zhao et al. (2018), who suggested that the transport of aerosols from South and South East Asia to southern China was enhanced during El Niño winters. Meanwhile, positive SSTAs appear over the entire tropical Indian Ocean, which are caused by El Niño (Xie et al., 2009; Wu et al., 2009). Accordingly, the tropical Indian Ocean sees north-easterly (north-westerly) wind anomalies near the surface to the north (south) of the Equator. The anomalous north-easterly helps sustain the northern Indian Ocean warming (Du et al., 2009), which is also conducive to the maintaining of the NWP AAC (Xie et al., 2009; Song and Zhou, 2014a, b; Xie et al., 2016). Conversely, the cold phase of ENSO (Fig. 5b) sees a roughly opposite circulation anomaly pattern, with an anomalous cyclone over the NWP. Thus, the climatological south-westerly wind is weakened, suppressing aerosol transport from South East Asia to southern China. This may explain the AOD reduction in southern China (Fig. 4b). The differences between these two phases (El Niño minus La Niña) show similar anomalies to the warm phase but with a larger magnitude (Fig. 5c).
In addition to dynamic processes, the interannual aerosol variation may also be closely related to water vapour condition. For example, precipitation has a substantial effect on aerosol removal (e.g. Bao et al., 2009; Sanap and Pandithurai, 2015). It is shown that precipitation is largely suppressed over the western tropical Pacific (including mainland South East Asia) during the ensuing spring of El Niño (Fig. 5a). However, because of the enhanced water vapour transportation by the NWP AAC (Zhang et al., 1999), precipitation is significantly increased in southern China and south of Japan, where the AOD values are above normal (Fig. 4a). This indicates that the aerosol transport could overwhelm the effect of precipitation (Zhang et al., 2010a; Zhao et al., 2018), which is consistent with the finding of Feng et al. (2017), who reported that the role of wet deposition was observed to be limited during the ENSO events.
According to the above analysis, the ENSO acts to modulate East Asian aerosols during the following spring mainly by changing the long-range transport of aerosols from South East Asia to the downstream region through the anomalous south-westerly wind on the north-western flank of the NWP AAC. Presumably, mainland South East Asia is the main source of East Asian spring aerosols. In the climatological mean state, the biomass burning in mainland South East Asia produces heavy smog and haze aerosol pollution during the dry season (February–April), especially in the valley of northern mainland South East Asia (Kim Oanh and Leelasakultum, 2011). The biomass-burning-induced aerosols peak in March (Huang et al., 2016) and largely diminish after the monsoon onset in late April. During the dry season, the increasing aerosols can also affect the air quality in the downwind regions (Huang et al., 2016; Yadav et al., 2017; Zhang et al., 2018). It was reported that BC was the dominant emissions-driving factor, explaining 27.7 % of the AOD variance over South East Asia (Che et al., 2019).
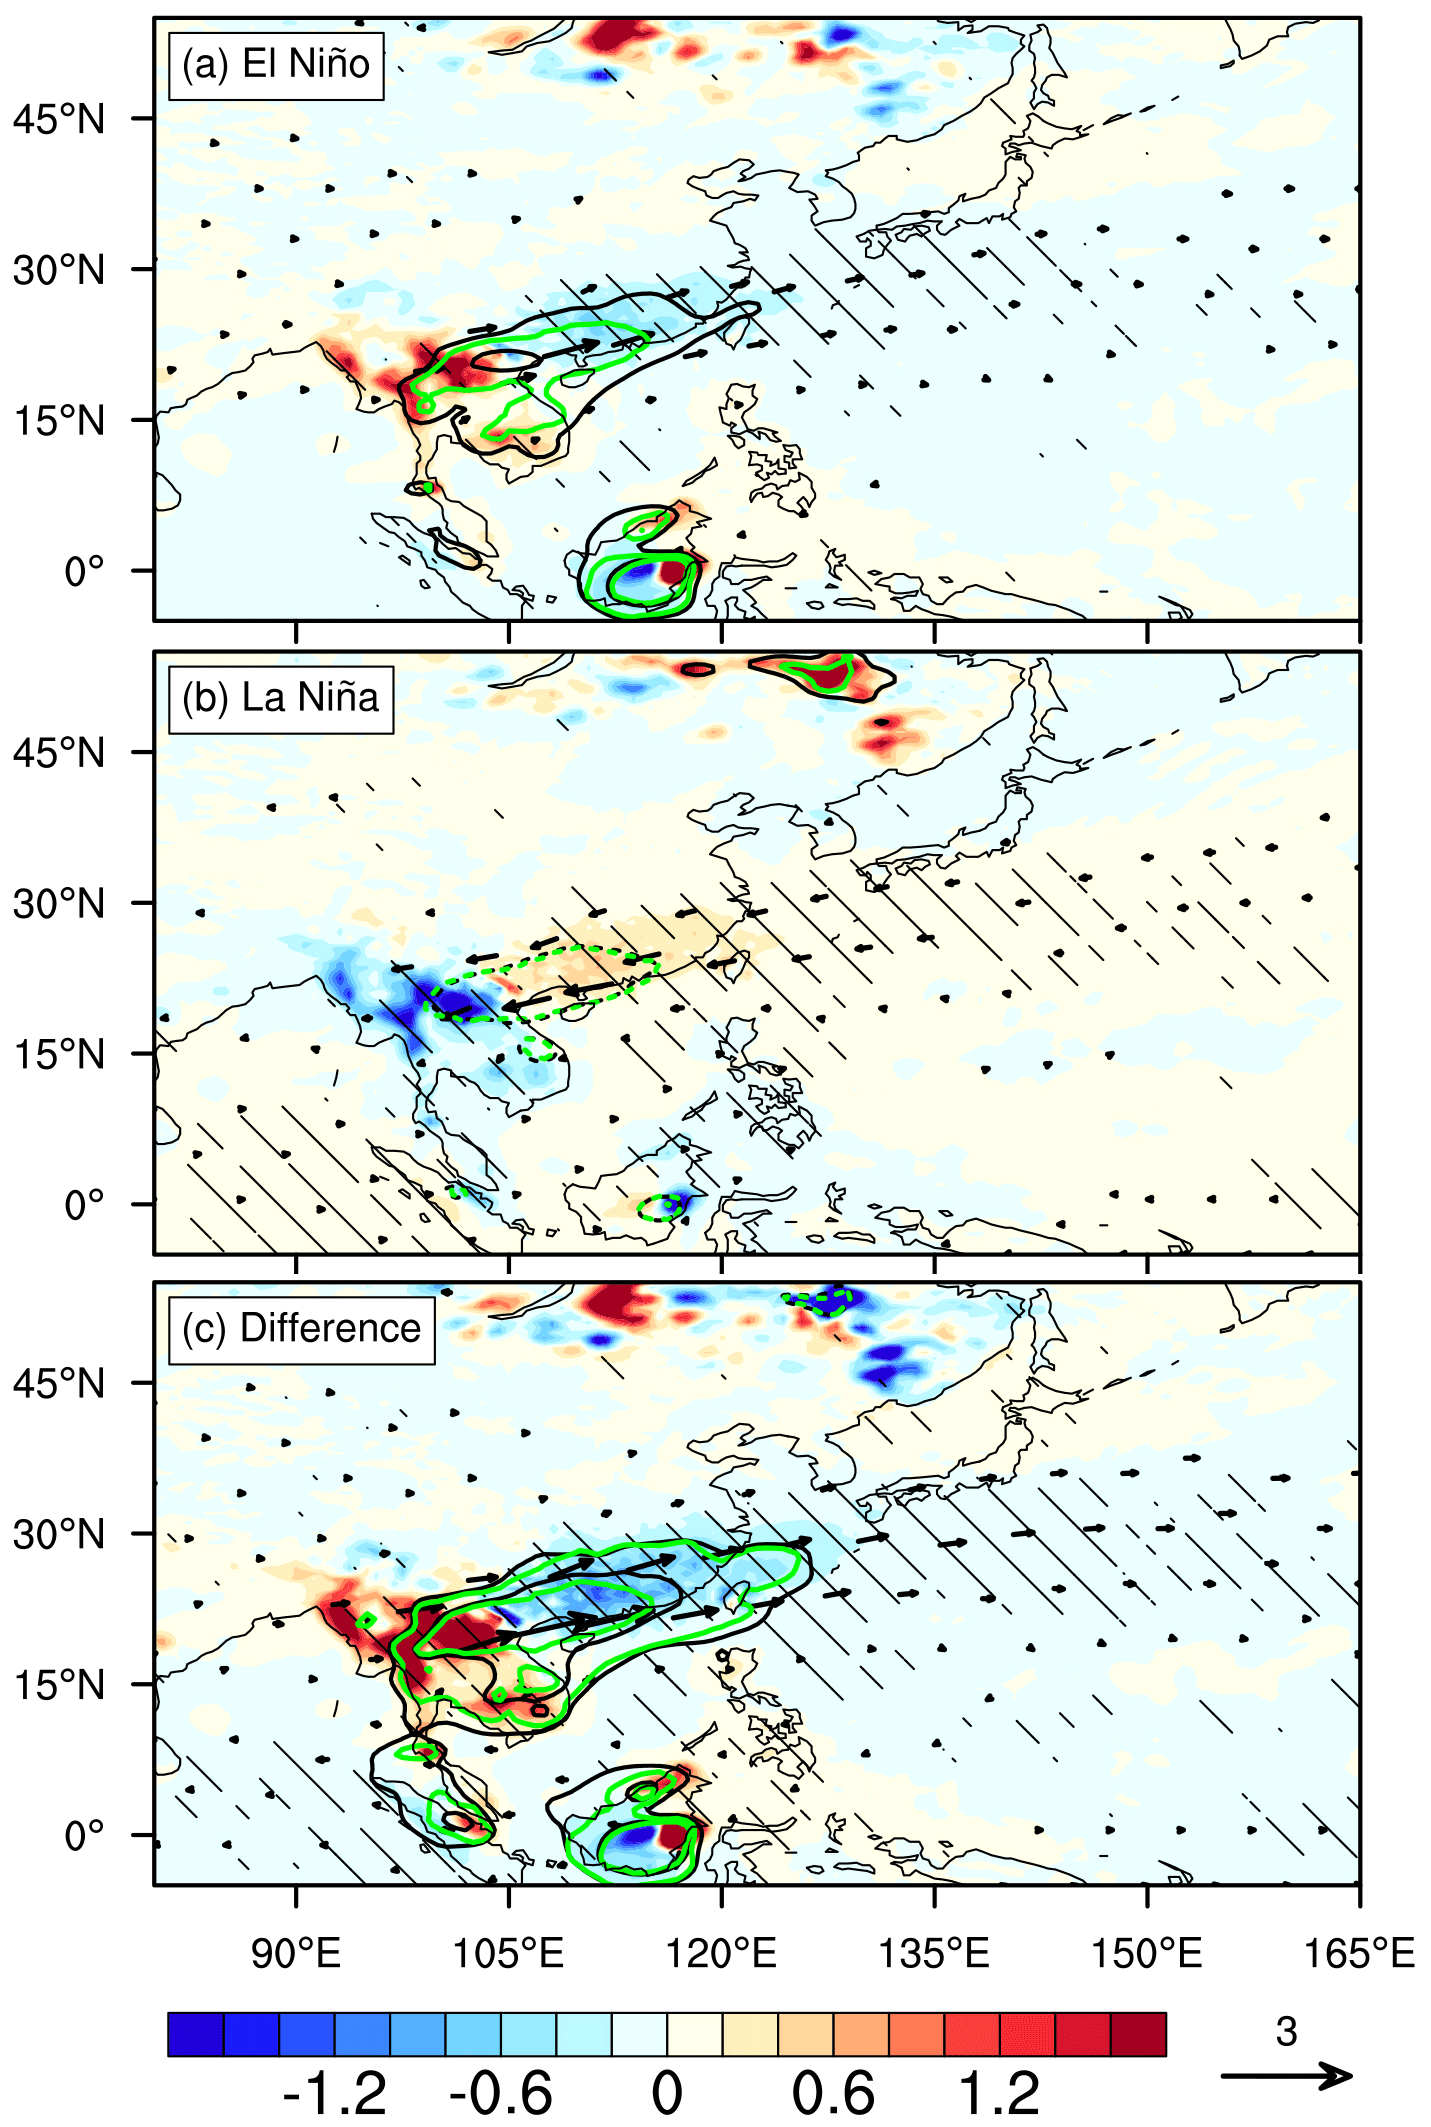
Figure 6Composite anomalies of total AOD (black contour), AOD of carbonaceous aerosols (CAs; green contours), and CA flux (vector; 10−1 g m−1 s−1) as well as its divergence (shading; 10−7 g m−2 s−1) during (a) El Niño and (b) La Niña and (c) their difference (El Niño minus La Niña) in spring. The contour interval is 0.05; the dashed contours are for negative values, and the zero contour is omitted for clarity. Hatching and black vectors representing the anomalies of CA flux and its divergence are statistically significant at the 95 % confidence level based on the Student's t test, respectively.
Moreover, studies have shown that the ENSO can modulate biomass burning activities over northern mainland South East Asia in spring (e.g. Sanap and Pandithurai, 2015; Huang et al., 2016). Huang et al. (2016) suggested that the ENSO signal in the preceding winter strengthens the India–Burma Trough via the South China Sea anticyclone. This would provide drier air mass transported into northern mainland South East Asia and thus promote local biomass burning activities. On the other hand, the aerosols generated by biomass burning could be affected by precipitation through the rainout and washout processes (Sanap and Pandithurai, 2015). CAs (including both BC and OC) are the main by-product emitted from biomass burning and wildfire activities, which is usually used as a tracer to diagnose aerosol transport. As shown in Fig. 6, the anomalous AOD for CAs is highly correlated with that for the total AOD during the ensuing spring of ENSO in terms of both spatial pattern and magnitude. This indicates that the aerosol anomalies are mainly contributed by CAs, especially for La Niña events, in which this contribution is nearly 100 % (Fig. 6b). The spatial distribution of anomalies in horizontal CA flux and its divergence further confirm that the ENSO can modulate the emission and transportation of CAs over East Asia. During the ensuing spring of El Niño, abundant CA anomalies are transported to southern China, the East China Sea, and the Kuroshio Extension region from mainland South East Asia, with strong divergence over northern mainland South East Asia and convergence over southern China (Fig. 6a), while the opposite is detected for the ensuing spring of La Niña (Fig. 6b).
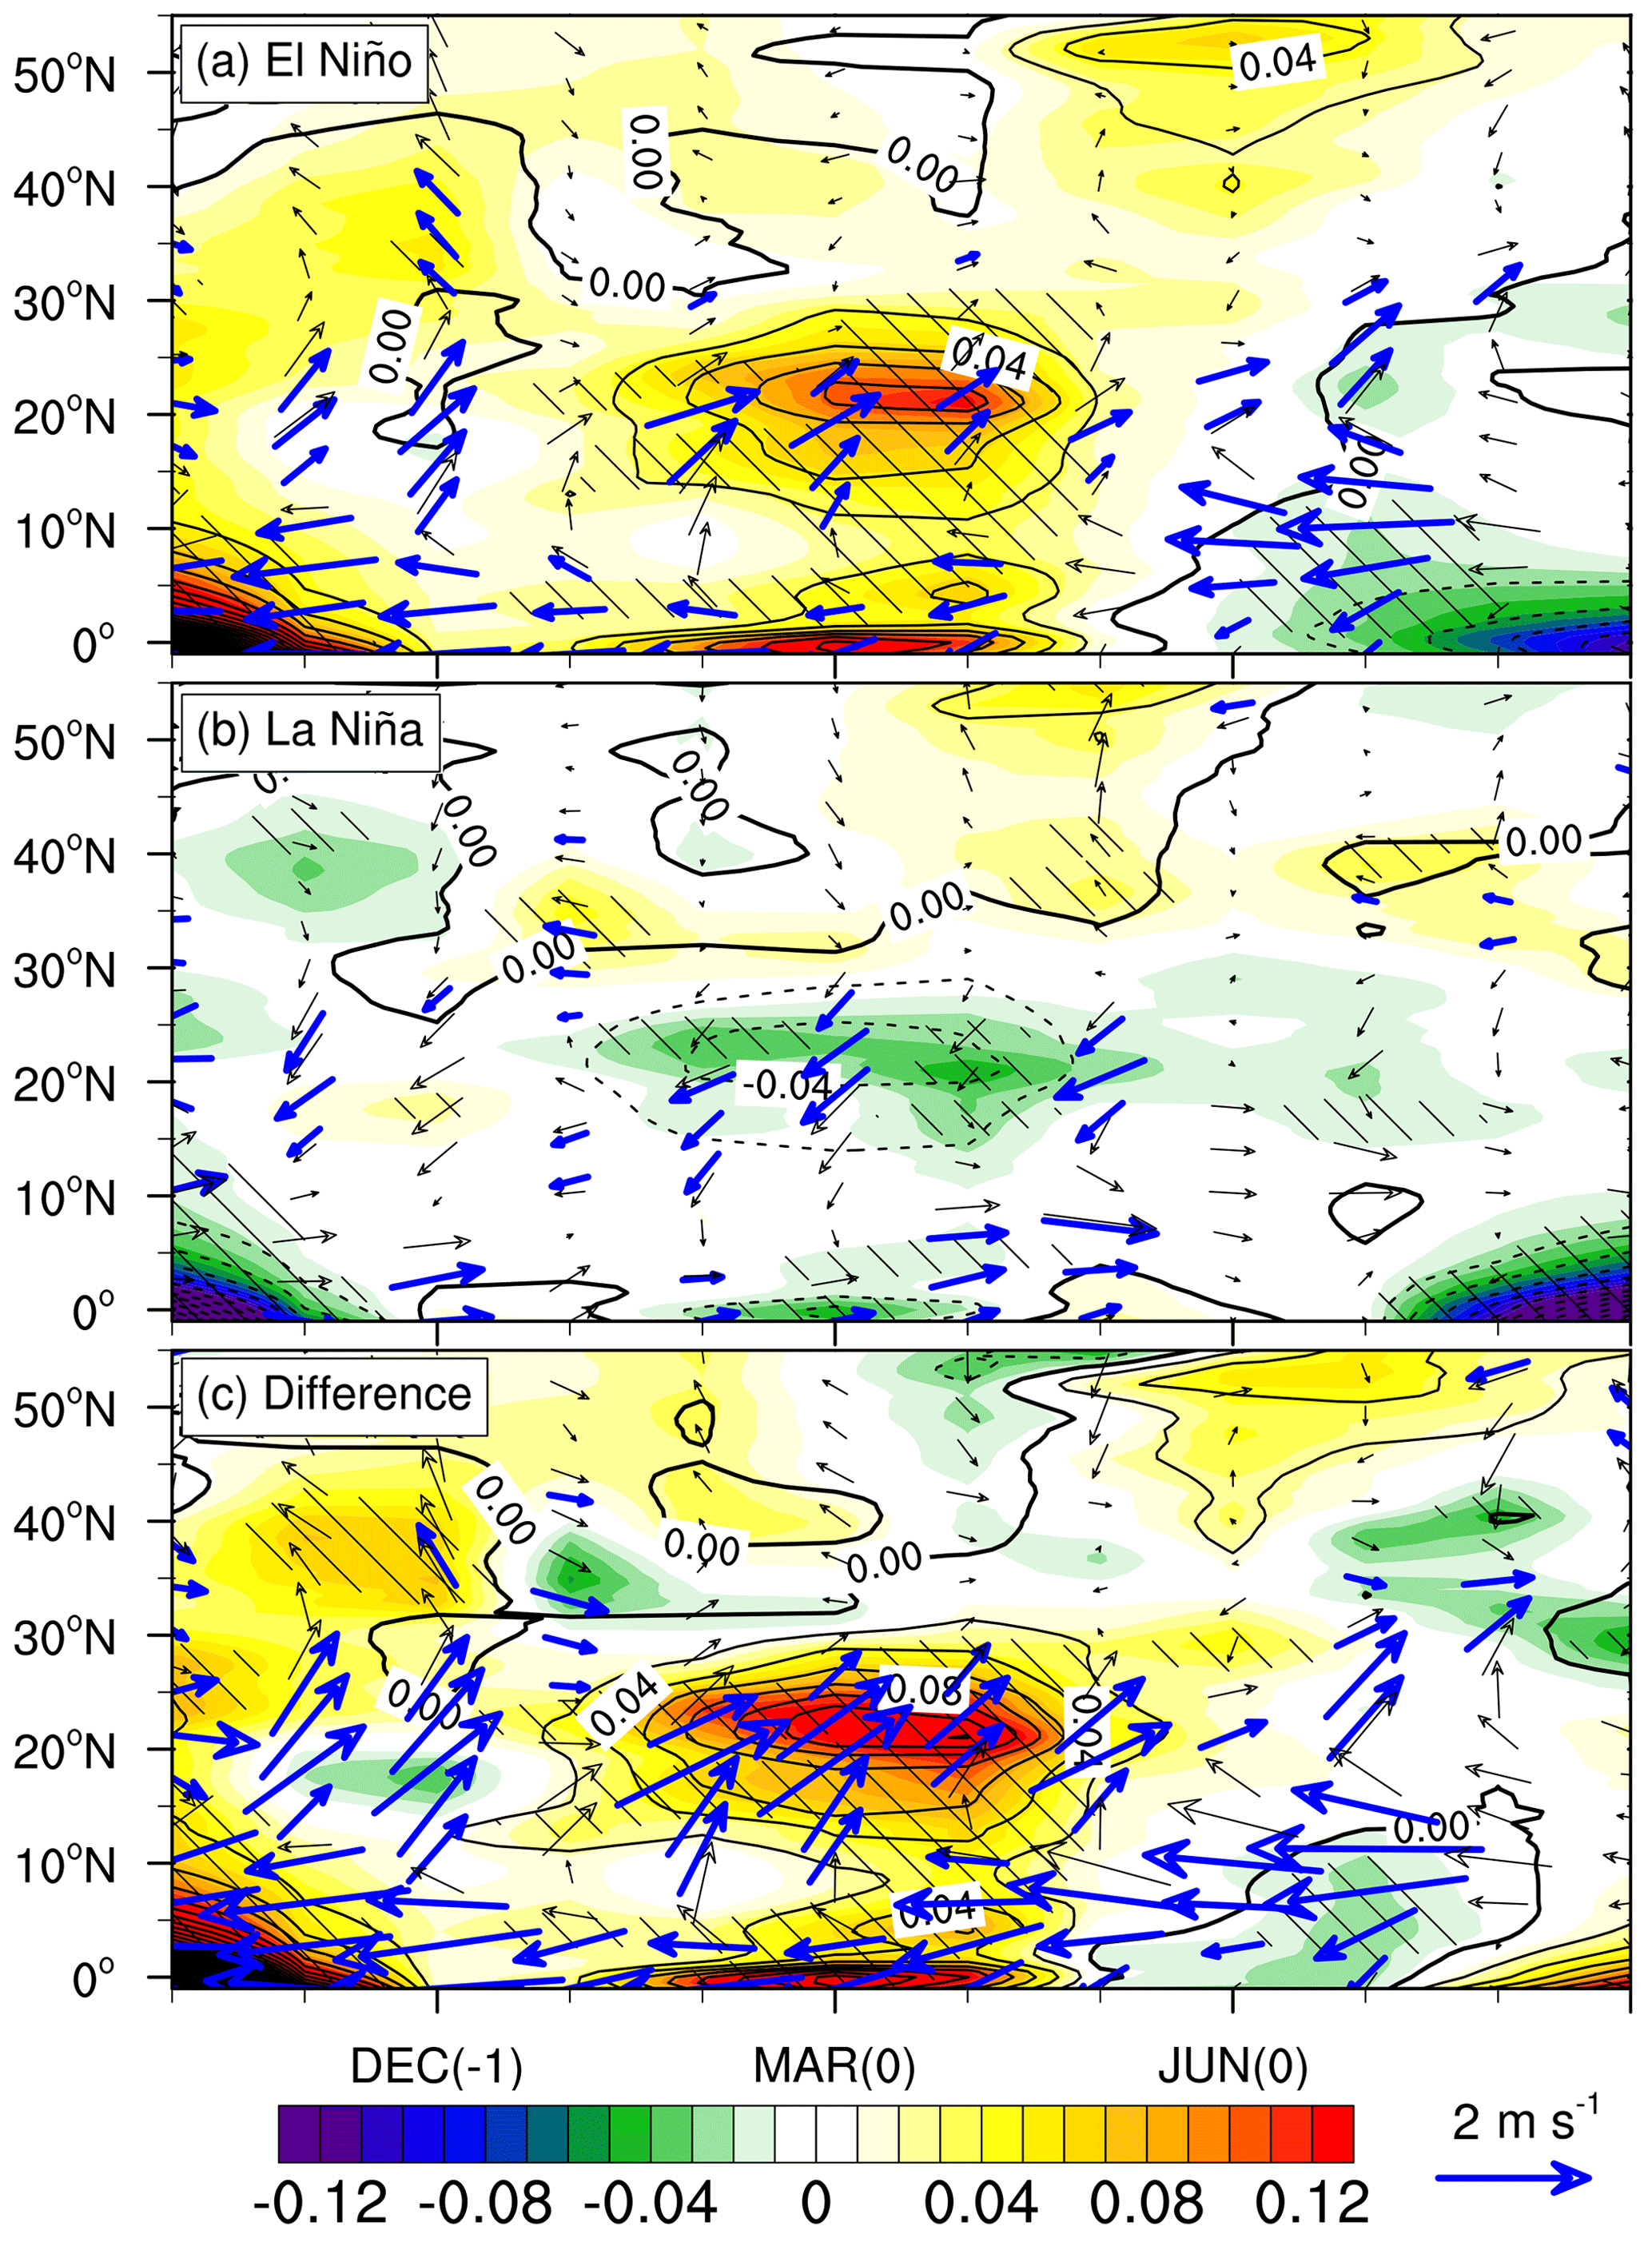
Figure 7Latitude–time cross-sections of composite anomalies of AOD (shading), AOD of CAs (black contour with interval of 0.02), and 850 hPa wind (vector; m s−1) during (a) El Niño and (b) La Niña and (c) their difference (El Niño minus La Niña) averaged over 100–120∘ E. Hatching and blue vectors indicating the anomalies of AOD and winds are statistically significant at the 95 % confidence level based on the Student's t test, respectively.
From the temporal perspective, it is obvious that the mechanisms associated with ENSO's effects on East Asian aerosols are significantly different between spring and winter. Figure 7 shows the latitude–time cross-sections of composite anomalies in total AOD, AOD of CAs, and 850 hPa wind averaged along 100–120∘ E for ENSO events. During the early winter (November(−1) to December(−1)) of the El Niño events, because El Niño-induced south-easterly anomalies act to weaken the EAWM, the AOD is increased over northern China between 35 and 45∘ N (Fig. 7a), mainly due to the suppressed local aerosol diffusion (Sun et al., 2018), while in the ensuing spring (MAM(0)), the significant, positive AOD anomalies appear south of 30∘ N as persistent anomalous south-westerly wind provides a favourable dynamic condition for aerosol transport. In other words, the ENSO mainly affects the diffusion process of the local aerosols over northern China in early winter, while it affects the long-range transport process of aerosols from mainland South East Asia to downstream in the ensuing spring. Besides, CAs are the dominant component of these transported aerosols in spring (MAM(0)), especially in early spring (MA(0)), because El Niño-induced, suppressed precipitation in northern mainland South East Asia acts to promote the CA emission. The anomalous CAs contribute more than 60 % and 80 % to the total AOD anomalies over northern mainland South East Asia and southern China in El Niño and La Niña spring, respectively (Fig. 7a–b).
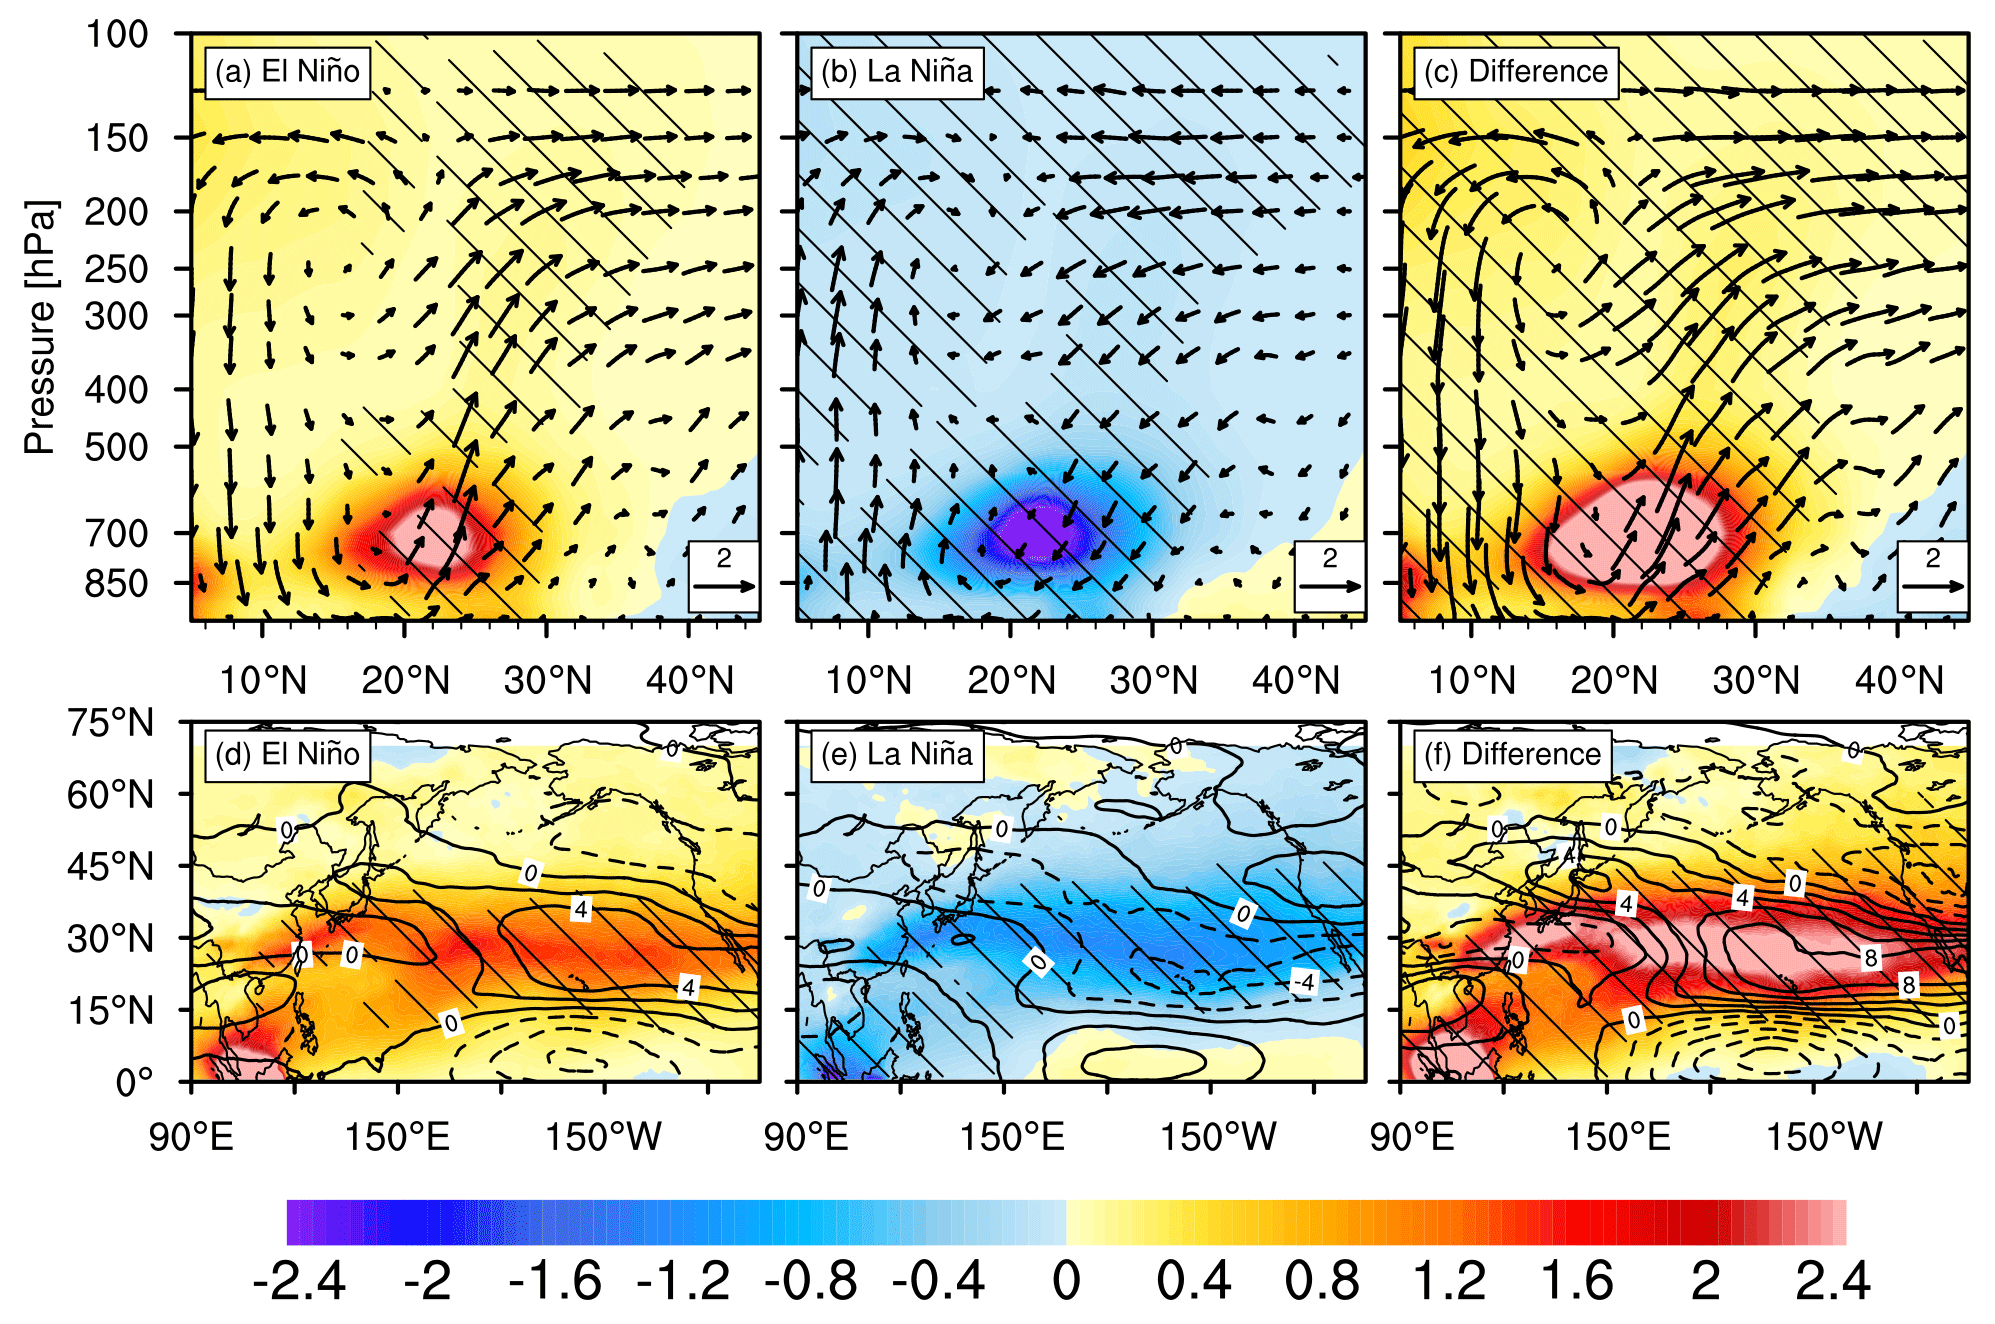
Figure 8(a–c) Vertical sections of composite anomalies of spring CA mass mixing ratio (shading; 10−6 g kg−1) and meridional and vertical velocities (vector; m s−1 and 10−2 m s−1, respectively) averaged over 110–125∘ E during (a) El Niño and (b) La Niña and (c) their difference (El Niño minus La Niña). (d–f) Same as Fig. 4, except for 300 hPa CA mass mixing ratio (shading; 10−7 g kg−1) and zonal wind (contour with interval of 4 m s−1). Hatching denotes the anomalies statistically significant at the 95 % confidence level based on the Student's t test.
As shown earlier, positive precipitation anomalies are observed over the downstream areas of aerosol transport during the ensuing spring of El Niño, i.e. southern China (Fig. 5a). It is reported that increased remote transport and uplifting above clouds by the deep convection would increase the mid-to-upper-tropospheric CA loading, even though the low-level CAs are simultaneously removed by the strong precipitation washout effect (Lau et al., 2018). Thus, the meridional cross-sections of spring CA mass mixing ratio (the sum of BC and OC mass mixing ratio) along 110–125∘ E are examined next (Fig. 8a–c). Larger CA anomalies are located around 700 hPa above northern mainland South East Asia (15–25∘ N), which is a main pathway of CA transport from South East Asia to southern China by the westerlies (e.g. Lin et al., 2009; Zhou et al., 2018). During the ensuing spring of El Niño (La Niña) (Fig. 8a–b), the enhanced (weakened) ascending motion is located to the north of 20∘ N, which corresponds to the enhanced (reduced) precipitation over southern China (Fig. 5a–b) and the increased (decreased) CA loading there from the surface to 150 hPa. This indicates that the CA mass can be lifted into the mid-upper troposphere by the enhanced vertical motion during the ensuing spring of El Niño, which is then diffused over the downstream regions by the upper-level jet stream over the North Pacific (Fig. 8d) and causes changes in extratropical atmospheric circulation due to BC absorption (Shen and Ming, 2018).
In recent decades, a number of studies demonstrated that the impacts of CP ENSO on the East Asian climate are distinct from those of EP ENSO (e.g. Ashok et al., 2007; Weng et al., 2009; Feng and Li, 2011; Feng et al., 2011). What are the different influences of the two types of ENSO on ensuing spring aerosols over East Asia? Figure 9 shows composite spring AOD anomalies associated with EP and CP ENSO events, respectively. The AOD anomaly pattern during EP ENSO (Fig. 9a, c, e) is similar to that during the ENSO (Fig. 4), except with much larger magnitude. During the ensuing spring of EP El Niño (Fig. 9a), the positive AOD anomaly centre exceeds 0.12 over north-eastern and central mainland South East Asia, while the largest negative anomaly is approximately −0.12 during the ensuing spring of EP La Niña (Fig. 9c). Thus, asymmetric effects are still obvious. The area coverage with significant positive AOD anomalies during the EP ENSO (Fig. 9e) is approximately as wide as that during the ENSO.
Compared with ENSO, the CP ENSO produces much smaller AOD anomalies (Fig. 9b, d, f). During the CP El Niño, positive anomalies occur over a band from mainland South East Asia across southern China to the Kuroshio Extension (Fig. 9b), while the opposite is seen during the CP La Niña, with negative but insignificant AOD anomalies over mainland South East Asia and southern China (Fig. 9d, f). This means the AOD anomalies in this region are unstable.
Clearly, as more typical conventional ENSO events, the EP ENSO tends to cause larger positive AOD anomalies over mainland South East Asia and southern China in spring, while the CP ENSO causes smaller and statistically insignificant AOD anomalies. The atmospheric-circulation anomalies of the two types of ENSO can explain this phenomenon. For the EP ENSO (Fig. 10a, c, e), the SSTAs exhibit a dipole pattern in the equatorial Pacific, which provides a favourable dynamic condition for aerosol transport through triggering the NWP AAC, while the CP ENSO is associated with a tripolar SST anomaly pattern (Ashok et al., 2007; also in Fig. 10b), and the AAC only occurs over southern China (Feng and Li, 2011). The anomalous south-westerly wind from mainland South East Asia to southern China is insignificant (Fig. 10f), likely resulting in the varying AOD anomalies (Fig. 9f).
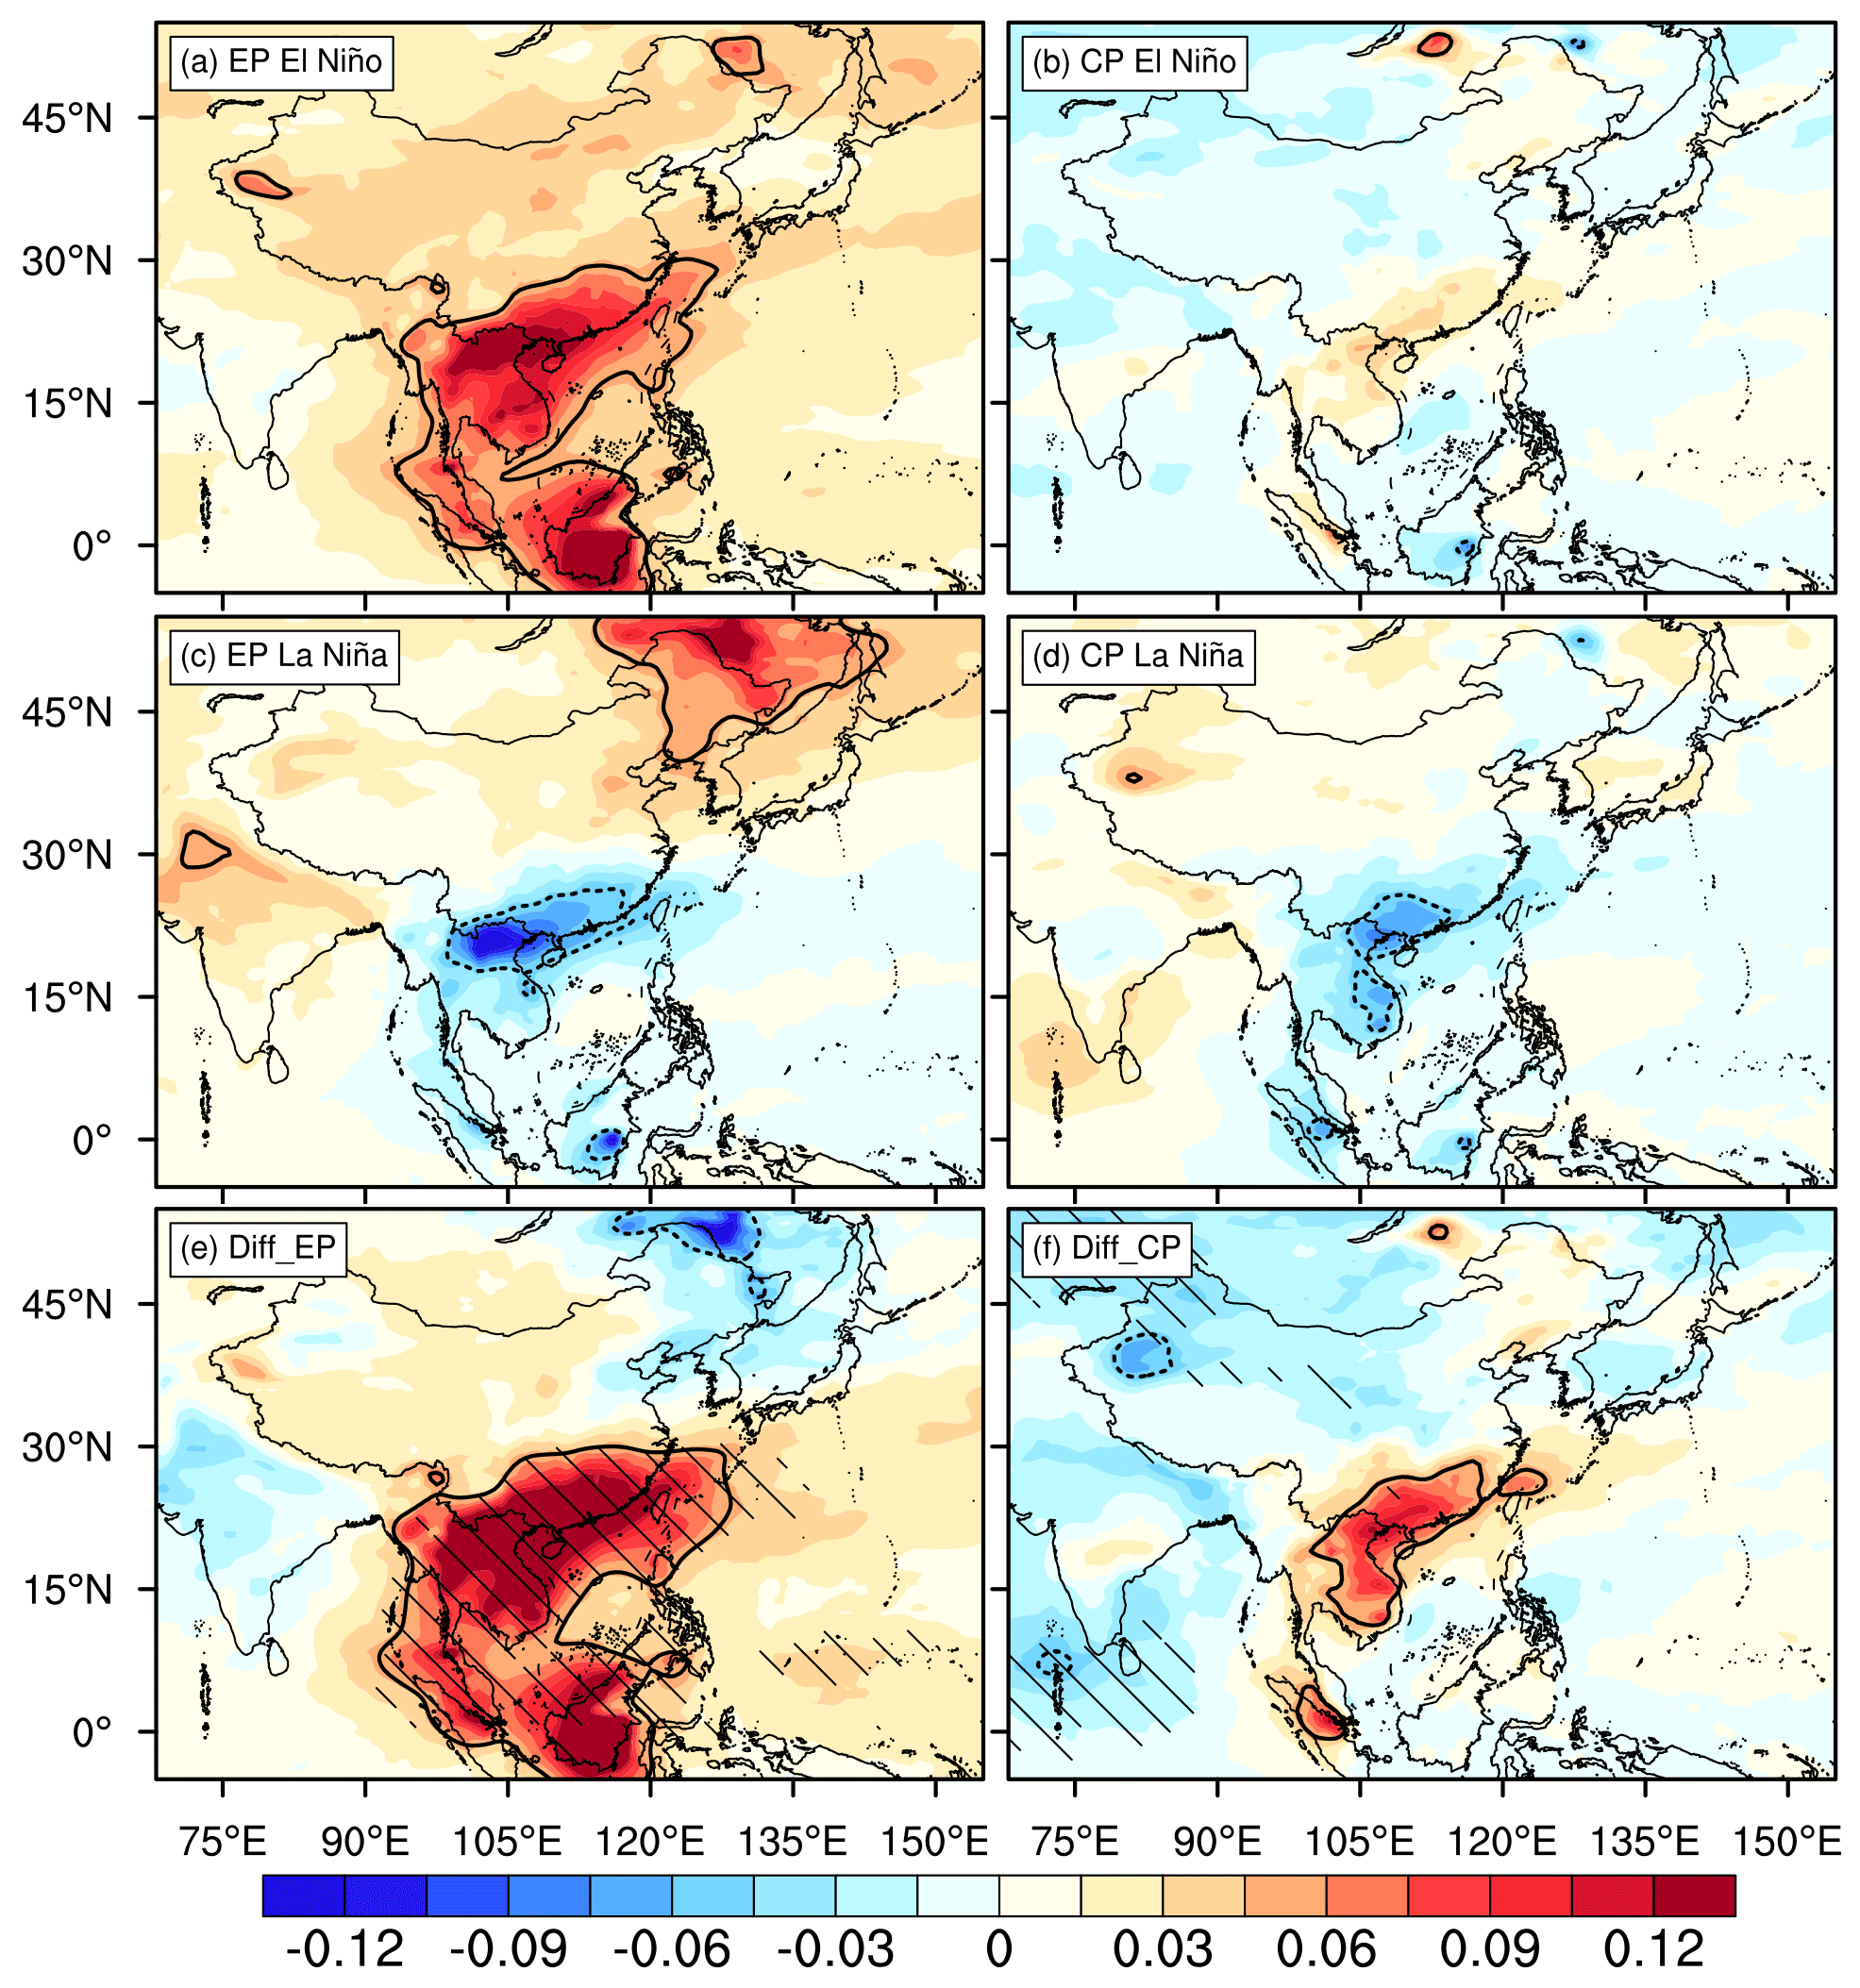
Figure 9Same as Fig. 4, except for (a, c, e) EP and (b, d, f) CP ENSO events.
To further investigate the relationship between spring East Asia aerosols and CP ENSO, Fig. 11 shows the scatter plot between standardized AOD_IA and preceding winter Niño 3.4 indices for all ENSO events. Overall, the EP El Niño (La Niña) events are associated with increasing (decreasing) AOD during the ensuing spring, indicative of a robust relationship between the two. However, no consistent relationships are found between AOD and CP ENSO events. For example, three CP El Niño events (2004/05, 2006/07, and 2009/10) correspond to higher AOD index, while two events (1994/95 and 2002/03) are associated with lower AOD index. In other words, these CP ENSO events can be divided into two groups: one associated with increasing AOD and the other associated with decreasing AOD during the ensuing spring. This is consistent with the previous studies (Feng et al., 2016a, 2017). Therefore, to better understand the impacts of CP ENSO on the springtime aerosols over East Asia, further investigations are needed on the basis of two different groups of CP ENSO events in future study.
In this study, we investigate the effects of ENSO on the ensuing spring aerosols over East Asia based on the NASA MERRA-2 aerosol reanalysis data during 1980–2019; we also discuss different effects of the two ENSO types. The East Asian AOD shows strong interannual variability in spring, which is coherently correlated with the SSTAs in the equatorial Pacific and Indian Ocean from the preceding autumn to concurrent spring. This implies that the interannual variability in East Asian spring aerosols may be modulated by the ENSO. Results from composite analyses reveal that the above-normal (below-normal) aerosols are found south of Japan as well as over southern China, mainland South East Asia, and the northern equatorial Maritime Continent during the ensuing spring of El Niño (La Niña). An obvious asymmetry is found in the AOD responses to the ENSO between the cold and warm phases.
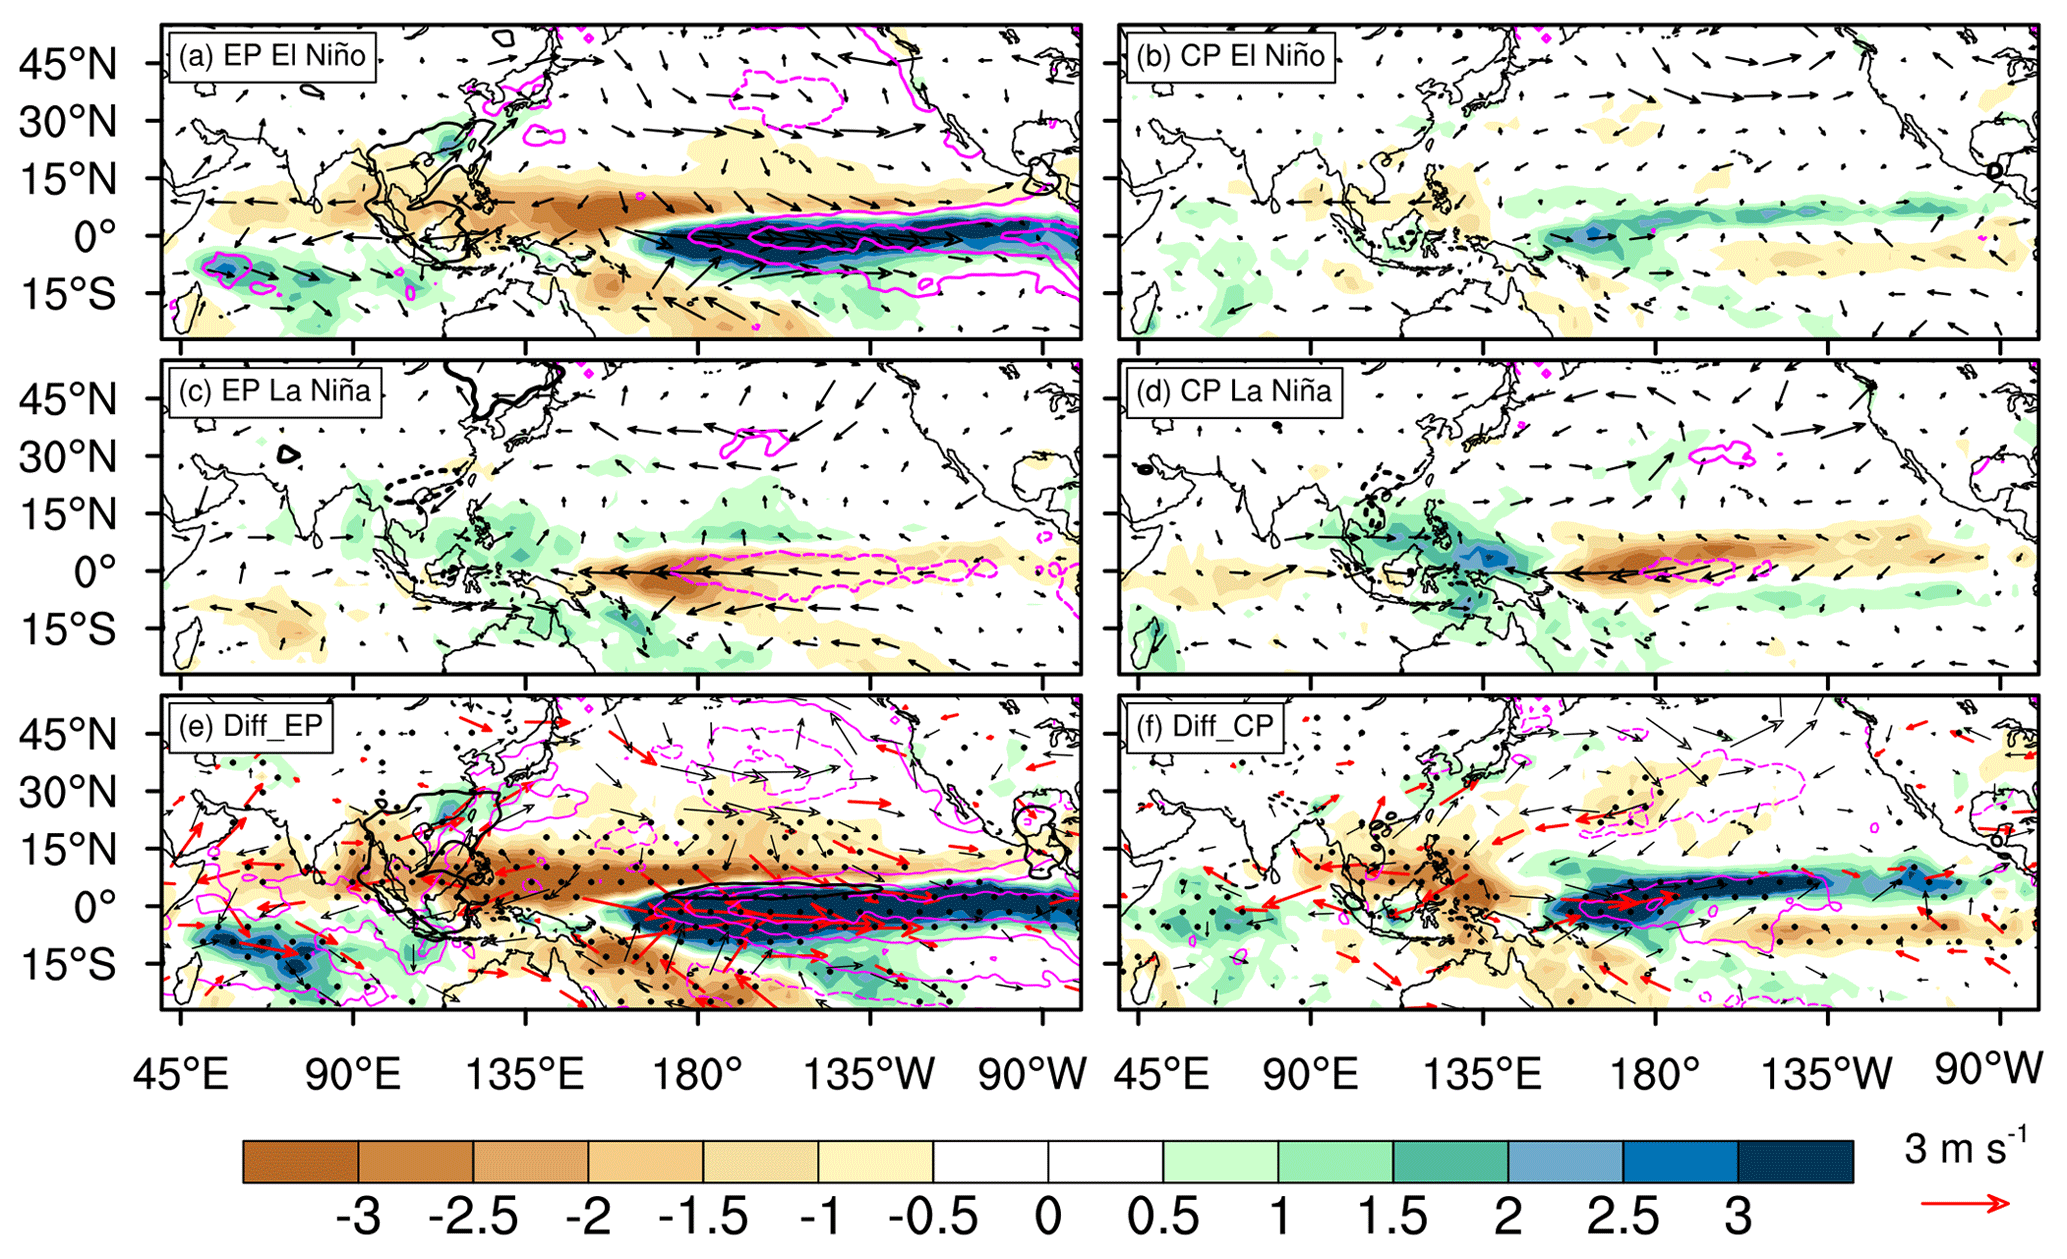
Figure 10Same as Fig. 5, except for (a, c, e) EP and (b, d, f) CP ENSO events.
During the ensuing spring, CAs largely contribute to the interannual variability in East Asian aerosols, generally exceeding 60 % for El Niño and exceeding 80 % for La Niña. The associated atmospheric conditions show that over the source region of northern mainland South East Asia, the drier air, due to the enhanced India–Burma Trough and less precipitation, acts to increase biomass burning probability that emits more CAs during the ensuing spring of El Niño (Huang et al., 2016). On the other hand, the low-level south-westerly wind from northern mainland South East Asia across southern China to southern Japan is strengthened by the NWP AAC associated with El Niño, which acts to transport aerosols to the downstream regions. This is quite different from the modulation of interannual aerosol variability by the ENSO in winter through influencing local diffusion. Meanwhile, anomalous precipitation only reduces the aerosols over the source region, and its washout effect is limited over the downstream regions. This is likely because the number of aerosols transported into these regions is much larger than that removed by precipitation, resulting in a net positive effect. Furthermore, the AOD anomaly patterns for both types of ENSO are similar to that of the ENSO, except for larger anomalies in the EP ENSO and smaller, insignificant anomalies in the CP ENSO because both AOD surplus and deficit can be seen during the warm phase of CP ENSO.
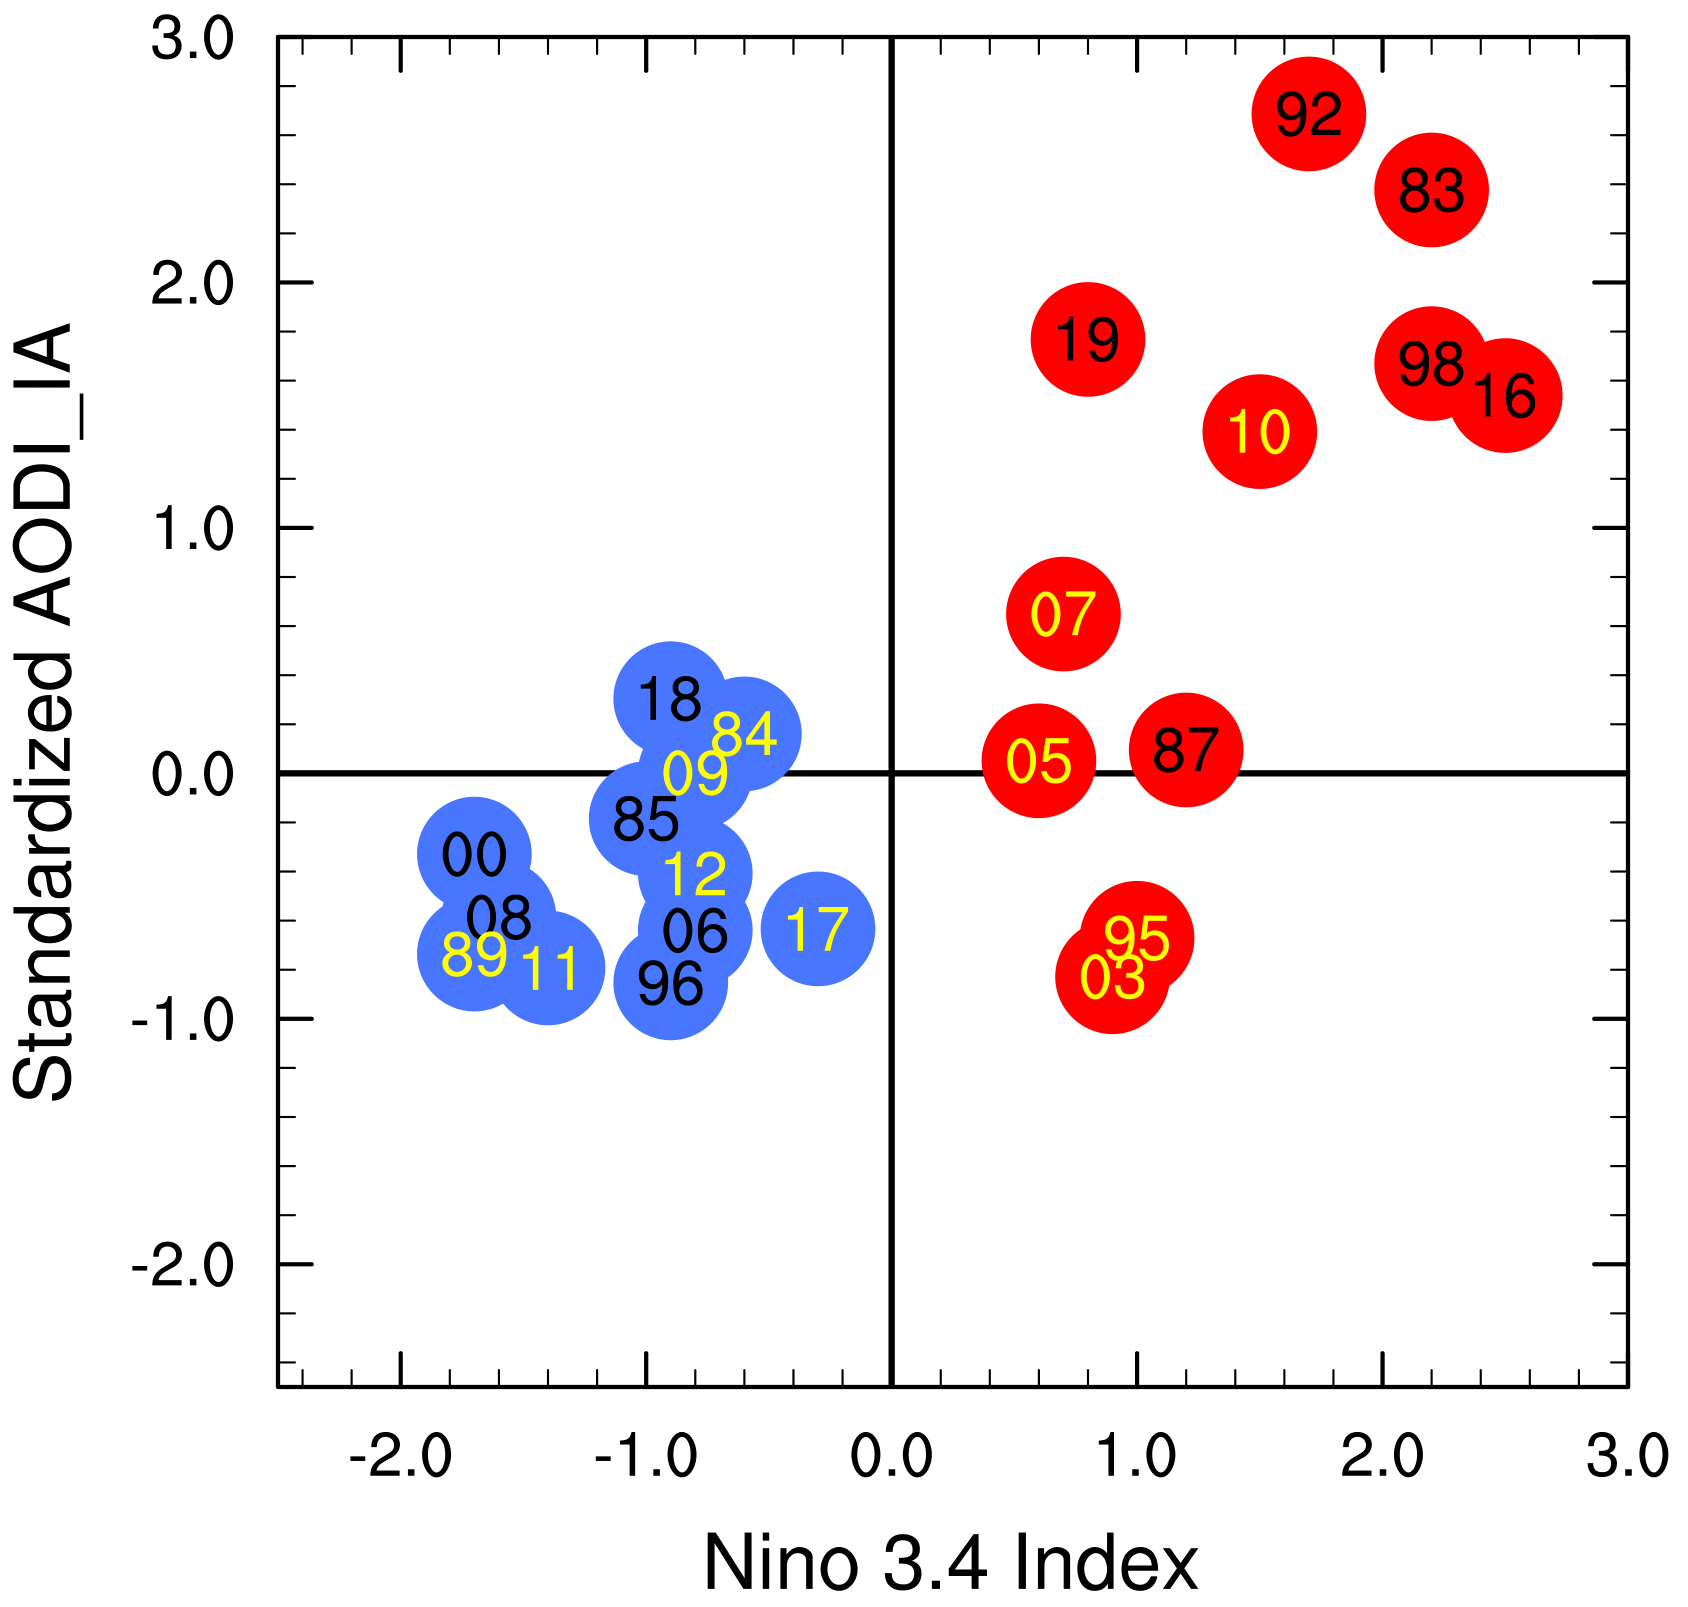
Figure 11Scatter plot between standardized AODI_IA and corresponding preceding winter (DJF) Niño 3.4 (∘C) indices for 23 ENSO events. A total of 11 El Niño and 12 La Niña events are indicated by red and blue circles, respectively. The number inside each circle denotes the calendar year, with black and yellow for EP and CP ENSO, respectively.
Note that the significant effects of ENSO on the ensuing spring aerosols are only confined to some regions of East Asia, i.e. southern China and mainland South East Asia. However, the AOD anomalies over other regions, such as northern China, are unstable, which is likely due to the coordinated influence of other climate systems, such as the Arctic Oscillation (Zhang et al., 2019) and North Atlantic Oscillation (Feng et al., 2019). Here, we only focus on the ENSO signal in the aerosols and do not take into account other climate signals. Additionally, although AOD has been widely used to explore the interactions between aerosols and climate systems in the literature (e.g. Wu et al., 2013; Yang et al., 2016; Lau et al., 2018; Sun et al., 2018; Che et al., 2019), it only represents the optical property of aerosols and could be also affected by other factors such as relative humidity, aerosol size distribution, and reflective index (Hänel, 1976; Horvath, 1996). Certain uncertainty might also exist in the data due to the limitation of the MERRA-2 aerosol species concentrations for interannual variability analysis. The changes in aerosol composition in the MERRA-2 system are simulated by the widely used chemical model of the Goddard Chemistry Aerosol Radiation and Transport (GOCART), and then the system adjusts the model simulation based on the total AOD retrieved from satellite measurements during assimilation without directly considering the speciated aerosol information obtained from the satellite data. This may introduce artefacts for the increase or decrease in individual aerosol mass or AOD (Chin et al., 2002). Besides, the aerosol species emission inventories for MERRA-2 have not been updated since the mid-2000s (Randles et al., 2017). These may also introduce some uncertainties in our analyses.
In addition, Lau et al. (2006) suggested that absorbing aerosols may lead to an advance of the rainy period and subsequently an intensification of the Indian summer monsoon (i.e. the “elevated heat pump” effect), thus amplifying the Indian summer monsoon response to ENSO forcing (Kim et al., 2016). As mentioned above, during the decaying spring of the EP El Niño year, a large number of absorbing aerosols produced in the source region (northern mainland South East Asia) are transported to the downstream regions and even lifted up into the mid and upper troposphere and then diffused to the North Pacific along with the westerly jets. Therefore, it would be interesting to explore the effects of absorbing aerosols on weather patterns or climate systems, including extratropical cyclones, the North Pacific storm track, and the EASM.
The ERA-5 Reanalysis data are available at https://cds.climate.copernicus.eu/#!/home (ECMWF, 2019; last access: 22 March 2021). MERRA-2 aerosol reanalysis data are available at https://disc.gsfc.nasa.gov/datasets (NASA Global Modeling and Assimilation Office (GMAO), 2015; last access: 22 March 2021). The CMAP precipitation data are available at https://psl.noaa.gov/ (NOAA Physical Sciences Laboratory, 1997; last access: 22 March 2021), and the SST data of the Met Office Hadley Centre are available at https://www.metoffice.gov.uk/hadobs/hadisst/ (Met Office Hadley Centre, 2003; last access: 22 March 2021).
HX and AZ designed the research. AZ performed the data analysis. SL contributed to the MERRA-2 data retrieval. HX, JD, and JM provided advice from the analysis perspective, and all authors wrote the manuscript.
The authors declare that they have no conflict of interest.
This work is jointly supported by the National Natural Science Foundation of China (grant nos. 41975106, 41705054, and 41805051). Jiechun Deng is also supported by the Natural Science Foundation of Jiangsu Province (grant no. BK20170942). Jing Ma is supported by the Startup Foundation for Introducing Talent of NUIST (grant no. 2017r057). We acknowledge the High Performance Computing Center of Nanjing University of Information Science & Technology for their support of this work. We are also thankful to the anonymous reviewers who provided valuable comments and suggestions.
This research has been supported by the National Natural Science Foundation of China (grant nos. 41975106, 41705054, and 41805051), the Natural Science Foundation of Jiangsu Province (grant no. BK20170942), and the Startup Foundation for Introducing Talent of Nanjing University of Information Science & Technology (grant no. 2017r057).
This paper was edited by Yun Qian and reviewed by two anonymous referees.
Allen, R. J., Sherwood, S. C., Norris, J. R., and Zender, C. S.: Recent Northern Hemisphere tropical expansion primarily driven by black carbon and tropospheric ozone, Nature, 485, 350, https://doi.org/10.1038/nature11097, 2012.
An, Z., Huang, R.-J., Zhang, R., Tie, X., Li, G., Cao, J., Zhou, W., Shi, Z., Han, Y., Gu, Z., and Ji, Y.: Severe haze in northern China: A synergy of anthropogenic emissions and atmospheric processes, P. Natl. Acad. Sci. USA, 116, 8657–8666, https://doi.org/10.1073/pnas.1900125116, 2019.
Ashok, K., Behera, S. K., Rao, S. A., Weng, H., and Yamagata, T.: El Niño Modoki and its possible teleconnection, J. Geophys. Res.-Oceans, 112, https://doi.org/10.1029/2006jc003798, 2007.
Awan, J. A. and Bae, D.-H.: Features and interdecadal variability of droughts in the homogeneous rainfall zones over the East Asian monsoon region, Int. J. Climatol., 36, 1943–1953, https://doi.org/10.1002/joc.4471, 2016.
Bao, Z., Wen, Z., and Wu, R.: Variability of aerosol optical depth over east Asia and its possible impacts, J. Geophys. Res.-Atmos., 114, D05203, https://doi.org/10.1029/2008jd010603, 2009.
Buchard, V., Randles, C. A., Silva, A. M. d., Darmenov, A., Colarco, P. R., Govindaraju, R., Ferrare, R., Hair, J., Beyersdorf, A. J., Ziemba, L. D., and Yu, H.: The MERRA-2 aerosol reanalysis, 1980 onward. Part II: Evaluation and case studies, J. Climate, 30, 6851–6872, https://doi.org/10.1175/jcli-d-16-0613.1, 2017.
Chan, C. K. and Yao, X.: Air pollution in mega cities in China, Atmos. Environ., 42, 1–42, https://doi.org/10.1016/j.atmosenv.2007.09.003, 2008.
Che, H., Gui, K., Xia, X., Wang, Y., Holben, B. N., Goloub, P., Cuevas-Agulló, E., Wang, H., Zheng, Y., Zhao, H., and Zhang, X.: Large contribution of meteorological factors to inter-decadal changes in regional aerosol optical depth, Atmos. Chem. Phys., 19, 10497–10523, https://doi.org/10.5194/acp-19-10497-2019, 2019.
Chin, M., Ginoux, P., Kinne, S., Torres, O., Holben, B. N., Duncan, B. N., Martin, R. V., Logan, J. A., Higurashi, A., and Nakajima, T.: Tropospheric aerosol optical thickness from the GOCART model and comparisons with satellite and Sun photometer measurements, J. Atmos. Sci., 59, 461–483, https://doi.org/10.1175/1520-0469(2002)059<0461:taotft>2.0.co;2, 2002.
Cohen, A. J., Brauer, M., Burnett, R., Anderson, H. R., Frostad, J., Estep, K., Balakrishnan, K., Brunekreef, B., Dandona, L., Dandona, R., Feigin, V., Freedman, G., Hubbell, B., Jobling, A., Kan, H., Knibbs, L., Liu, Y., Martin, R., Morawska, L., Pope, C. A., Shin, H., Straif, K., Shaddick, G., Thomas, M., van Dingenen, R., van Donkelaar, A., Vos, T., Murray, C. J. L., and Forouzanfar, M. H.: Estimates and 25-year trends of the global burden of disease attributable to ambient air pollution: an analysis of data from the Global Burden of Diseases Study 2015, The Lancet, 389, 1907–1918, https://doi.org/10.1016/S0140-6736(17)30505-6, 2017.
Deng, J., Dai, A., and Xu, H.: Nonlinear climate responses to increasing CO2 and anthropogenic aerosols simulated by CESM1, J. Climate, 33, 281–301, https://doi.org/10.1175/jcli-d-19-0195.1, 2020.
Dong, L. and Zhou, T.: The Indian Ocean Sea Surface Temperature Warming Simulated by CMIP5 Models during the Twentieth Century: Competing Forcing Roles of GHGs and Anthropogenic Aerosols, J. Climate, 27, 3348–3362, https://doi.org/10.1175/jcli-d-13-00396.1, 2014.
Du, Y., Xie, S.-P., Huang, G., and Hu, K.: Role of air-sea interaction in the long persistence of El Niño–induced north Indian Ocean warming, J. Climate, 22, 2023–2038, https://doi.org/10.1175/2008jcli2590.1, 2009.
ECWMF: Fifth generation of ECMWF atmospheric reanalyses of the global climate (ERA5), available at: https://cds.climate.copernicus.eu/#!/home, (last access: 22 March 2021), 2019.
Feng, J., Chen, W., Tam, C.-Y., and Zhou, W.: Different impacts of El Niño and El Niño Modoki on China rainfall in the decaying phases, Int. J. Climatol., 31, 2091–2101, https://doi.org/10.1002/joc.2217, 2011.
Feng, J. and Li, J.: Influence of El Niño Modoki on spring rainfall over south China, J. Geophys. Res.-Atmos., 116, D13102, https://doi.org/10.1029/2010jd015160, 2011.
Feng, J., Li, J., Zhu, J., and Liao, H.: Influences of El Niño Modoki event 1994/1995 on aerosol concentrations over southern China, J. Geophys. Res.-Atmos., 121, 1637–1651, https://doi.org/10.1002/2015jd023659, 2016a.
Feng, J., Zhu, J., and Li, Y.: Influences of El Niño on aerosol concentrations over eastern China, Atmos. Sci. Lett., 17, 422–430, https://doi.org/10.1002/asl.674, 2016b.
Feng, J., Li, J., Zhu, J., Liao, H., and Yang, Y.: Simulated contrasting influences of two La Niña Modoki events on aerosol concentrations over eastern China, J. Geophys. Res.-Atmos., 122, 2734–2749, https://doi.org/10.1002/2016jd026175, 2017.
Feng, J., Li, J., Liao, H., and Zhu, J.: Simulated coordinated impacts of the previous autumn North Atlantic Oscillation (NAO) and winter El Niño on winter aerosol concentrations over eastern China, Atmos. Chem. Phys., 19, 10787–10800, https://doi.org/10.5194/acp-19-10787-2019, 2019.
Forster, P., Ramaswamy, V., Artaxo, P., Berntsen, T., Betts, R., Fahey, D. W., Haywood, J., Lean, J., Lowe, D. C., Myhre, G., Nganga, J., Prinn, R., Raga, G., Schultz, M., and Van Dorland, R.: Changes in atmospheric constituents and in radiative forcing, Cambridge University Press, Cambridge, United Kingdom, 129–234, 2007.
Gao, H. and Li, X.: Influences of El Nino Southern Oscillation events on haze frequency in eastern China during boreal winters, Int. J. Climatol., 35, 2682–2688, https://doi.org/10.1002/joc.4133, 2015.
Gelaro, R., McCarty, W., Suárez, M. J., Todling, R., Molod, A., Takacs, L., Randles, C. A., Darmenov, A., Bosilovich, M. G., Reichle, R., Wargan, K., Coy, L., Cullather, R., Draper, C., Akella, S., Buchard, V., Conaty, A., Silva, A. M. d., Gu, W., Kim, G.-K., Koster, R., Lucchesi, R., Merkova, D., Nielsen, J. E., Partyka, G., Pawson, S., Putman, W., Rienecker, M., Schubert, S. D., Sienkiewicz, M., and Zhao, B.: The modern-era retrospective analysis for research and applications, version 2 (MERRA-2), J. Climate, 30, 5419–5454, https://doi.org/10.1175/jcli-d-16-0758.1, 2017.
Gong, S. L., Zhang, X. Y., Zhao, T. L., Zhang, X. B., Barrie, L. A., McKendry, I. G., and Zhao, C. S.: A simulated climatology of Asian dust aerosol and its trans-Pacific transport, Part II: Interannual variability and climate connections, J. Climate, 19, 104–122, https://doi.org/10.1175/jcli3606.1, 2006.
Hänel, G.: The properties of atmospheric aerosol particles as functions of the relative humidity at thermodynamic equilibrium with the surrounding moist air, in: Advances in Geophysics, edited by: Landsberg, H. E. and Mieghem, J. V., Elsevier, 73–188, 1976.
Harrison, D. E. and Larkin, N. K.: The COADS sea level pressure signal: A near-global El Niño composite and time series view, 1946–1993, J. Climate, 9, 3025–3055, https://doi.org/10.1175/1520-0442(1996)009<3025:tcslps>2.0.co;2, 1996.
Heidinger, A. K., Foster, M. J., Walther, A., and Zhao, X.: The pathfinder atmospheres–extended AVHRR climate dataset, B. Am. Meteorol. Soc., 95, 909–922, https://doi.org/10.1175/bams-d-12-00246.1, 2014.
Hersbach, H. and Dee, D.: ERA5 reanalysis is in production, ECMWF newsletter, 147, 5–6, 2016.
Holben, B. N., Eck, T. F., Slutsker, I., Tanré, D., Buis, J. P., Setzer, A., Vermote, E., Reagan, J. A., Kaufman, Y. J., Nakajima, T., Lavenu, F., Jankowiak, I., and Smirnov, A.: AERONET – A federated instrument network and data archive for aerosol characterization, Remote. Sens. Environ., 66, 1–16, https://doi.org/10.1016/S0034-4257(98)00031-5, 1998.
Horvath, H.: Spectral extinction coefficients of rural aerosol in southern italy-a case study of cause and effect of variability of atmospheric aerosol, J. Aerosol. Sci., 27, 437–453, https://doi.org/10.1016/0021-8502(95)00544-7, 1996.
Huang, W.-R., Wang, S.-H., Yen, M.-C., Lin, N.-H., and Promchote, P.: Interannual variation of springtime biomass burning in Indochina: Regional differences, associated atmospheric dynamical changes, and downwind impacts, J. Geophys. Res.-Atmos., 121, 10016–10028, https://doi.org/10.1002/2016jd025286, 2016.
Kahn, R. A., Gaitley, B. J., Martonchik, J. V., Diner, D. J., Crean, K. A., and Holben, B.: Multiangle Imaging Spectroradiometer (MISR) global aerosol optical depth validation based on 2 years of coincident Aerosol Robotic Network (AERONET) observations, J. Geophys. Res.-Atmos., 110, D10S04, https://doi.org/10.1029/2004jd004706, 2005.
Kim, M.-K., Lau, W. K. M., Kim, K.-M., Sang, J., Kim, Y.-H., and Lee, W.-S.: Amplification of ENSO effects on Indian summer monsoon by absorbing aerosols, Clim. Dynam., 46, 2657–2671, https://doi.org/10.1007/s00382-015-2722-y, 2016.
Kim Oanh, N. T. and Leelasakultum, K.: Analysis of meteorology and emission in haze episode prevalence over mountain-bounded region for early warning, Sci. Total Environ., 409, 2261–2271, https://doi.org/10.1016/j.scitotenv.2011.02.022, 2011.
Kim, S.-W., Yoon, S.-C., Kim, J., and Kim, S.-Y.: Seasonal and monthly variations of columnar aerosol optical properties over east Asia determined from multi-year MODIS, LIDAR, and AERONET Sun/sky radiometer measurements, Atmos. Environ., 41, 1634–1651, https://doi.org/10.1016/j.atmosenv.2006.10.044, 2007.
Lau, K. M., Kim, M. K., and Kim, K. M.: Asian summer monsoon anomalies induced by aerosol direct forcing: the role of the Tibetan Plateau, Clim. Dynam., 26, 855–864, https://doi.org/10.1007/s00382-006-0114-z, 2006.
Lau, W. K. M., Yuan, C., and Li, Z.: Origin, maintenance and variability of the Asian Tropopause Aerosol Layer (ATAL): the roles of monsoon dynamics, Sci. Rep., 8, 3960, https://doi.org/10.1038/s41598-018-22267-z, 2018.
Lelieveld, J., Klingmüller, K., Pozzer, A., Pöschl, U., Fnais, M., Daiber, A., and Münzel, T.: Cardiovascular disease burden from ambient air pollution in Europe reassessed using novel hazard ratio functions, Eur. Heart J., 40, 1590–1596, https://doi.org/10.1093/eurheartj/ehz135, 2019.
Levy, R. C., Remer, L. A., Kleidman, R. G., Mattoo, S., Ichoku, C., Kahn, R., and Eck, T. F.: Global evaluation of the Collection 5 MODIS dark-target aerosol products over land, Atmos. Chem. Phys., 10, 10399–10420, https://doi.org/10.5194/acp-10-10399-2010, 2010.
Li, Z., Niu, F., Fan, J., Liu, Y., Rosenfeld, D., and Ding, Y.: Long-term impacts of aerosols on the vertical development of clouds and precipitation, Nat. Geosci., 4, 888–894, https://doi.org/10.1038/ngeo1313, 2011.
Li, Z., Zhang, W., Stuecker, M. F., Xu, H., Jin, F.-F., and Liu, C.: Different effects of two ENSO types on Arctic surface temperature in boreal winter, J. Climate, 32, 4943–4961, https://doi.org/10.1175/jcli-d-18-0761.1, 2019.
Lin, C.-Y., Hsu, H.-m., Lee, Y. H., Kuo, C. H., Sheng, Y.-F., and Chu, D. A.: A new transport mechanism of biomass burning from Indochina as identified by modeling studies, Atmos. Chem. Phys., 9, 7901–7911, https://doi.org/10.5194/acp-9-7901-2009, 2009.
Liu, Y., Liu, J., and Tao, S.: Interannual variability of summertime aerosol optical depth over East Asia during 2000–2011: a potential influence from El Niño Southern Oscillation, Environ. Res. Lett., 8, 044034, https://doi.org/10.1088/1748-9326/8/4/044034, 2013.
Lou, S., Yang, Y., Wang, H., Lu, J., Smith, S. J., Liu, F., and Rasch, P. J.: Black carbon increases frequency of extreme ENSO events, J. Climate, 32, 8323–8333, https://doi.org/10.1175/jcli-d-19-0549.1, 2019.
Met Office: Hadley Centre Sea Ice and Sea Surface Temperature data set (HadISST), available at: https://www.metoffice.gov.uk/hadobs/hadisst/, (last access: 22 March 2021), 2003.
Myhre, G., Shindell, D., Bréon, F. M., Collins, W., Fuglestvedt, J., Huang, J., Koch, D., Lamarque, J. F., Lee, D., Mendoza, B., Nakajima, T., Robock, A., Stephens, G., Takemura, T., and Zhang, H.: Anthropogenic and natural radiative forcing, in: Climate Change 2013: The Physical Science Basis, Contribution of Working Group I to the Fifth Assessment Report of the Intergovernmental Panel on Climate Change, edited by: Stocker, T. F., Qin, D., Plattner, G. K., Tignor, M., Allen, S. K., Doschung, J., Nauels, A., Xia, Y., Bex, V., and Midgley, P. M., Cambridge University Press, Cambridge, UK, 659–740, 2013.
NASA: Modern Era Retrospective analysis for Research and Applications Version 2 (MERRA2) reanalysis aerosol data, available at: https://disc.gsfc.nasa.gov/datasets, (last access: 22 March 2021), 2015.
Ning, G., Wang, S., Yim, S. H. L., Li, J., Hu, Y., Shang, Z., Wang, J., and Wang, J.: Impact of low-pressure systems on winter heavy air pollution in the northwest Sichuan Basin, China, Atmos. Chem. Phys., 18, 13601–13615, https://doi.org/10.5194/acp-18-13601-2018, 2018.
Niu, F., Li, Z., Li, C., Lee, K.-H., and Wang, M.: Increase of wintertime fog in China: Potential impacts of weakening of the Eastern Asian monsoon circulation and increasing aerosol loading, J. Geophys. Res.-Atmos., 115, D00K20, https://doi.org/10.1029/2009jd013484, 2010.
NOAA: Climate Prediction Center Merged Analysis of Precipitation (CMAP) dataset, available at: https://psl.noaa.gov/, (last access: 22 March 2021), 1997.
Randles, C. A., Silva, A. M. d., Buchard, V., Colarco, P. R., Darmenov, A., Govindaraju, R., Smirnov, A., Holben, B., Ferrare, R., Hair, J., Shinozuka, Y., and Flynn, C. J.: The MERRA-2 aerosol reanalysis, 1980 onward. Part I: System description and data assimilation evaluation, J. Climate, 30, 6823–6850, https://doi.org/10.1175/jcli-d-16-0609.1, 2017.
Rayner, N. A., Parker, D. E., Horton, E. B., Folland, C. K., Alexander, L. V., Rowell, D. P., Kent, E. C., and Kaplan, A.: Global analyses of sea surface temperature, sea ice, and night marine air temperature since the late nineteenth century, J. Geophys. Res.-Atmos., 108, 4407, https://doi.org/10.1029/2002jd002670, 2003.
Ren, H.-L. and Jin, F.-F.: Niño indices for two types of ENSO, Geophys. Res. Lett., 38, L04704, https://doi.org/10.1029/2010gl046031, 2011.
Rosenfeld, D.: Suppression of rain and snow by urban and industrial air pollution, Science, 287, 1793–1796, 2000.
Rosenfeld, D., Lohmann, U., Raga, G. B., O'Dowd, C. D., Kulmala, M., Fuzzi, S., Reissell, A., and Andreae, M. O.: Flood or drought: How do aerosols affect precipitation?, Science, 321, 1309–1313, https://doi.org/10.1126/science.1160606, 2008.
Sanap, S. D. and Pandithurai, G.: The effect of absorbing aerosols on Indian monsoon circulation and rainfall: A review, Atmos. Res., 164, 318–327, https://doi.org/10.1016/j.atmosres.2015.06.002, 2015.
Shen, Z. and Ming, Y.: The influence of aerosol absorption on the extratropical circulation, J. Climate, 31, 5961–5975, https://doi.org/10.1175/jcli-d-17-0839.1, 2018.
Song, F. and Zhou, T.: Interannual variability of East Asian summer monsoon simulated by CMIP3 and CMIP5 AGCMs: Skill dependence on Indian Ocean–western Pacific anticyclone teleconnection, J. Climate, 27, 1679–1697, https://doi.org/10.1175/jcli-d-13-00248.1, 2014a.
Song, F. and Zhou, T.: The climatology and interannual variability of East Asian summer monsoon in CMIP5 coupled models: Does air–sea coupling improve the simulations?, J. Climate, 27, 8761–8777, https://doi.org/10.1175/jcli-d-14-00396.1, 2014b.
Song, F., Zhou, T., and Qian, Y.: Responses of East Asian summer monsoon to natural and anthropogenic forcings in the 17 latest CMIP5 models, Geophys. Res. Lett., 41, 596–603, https://doi.org/10.1002/2013GL058705, 2014.
Song, Z., Fu, D., Zhang, X., Wu, Y., Xia, X., He, J., Han, X., Zhang, R., and Che, H.: Diurnal and seasonal variability of PM2.5 and AOD in North China plain: Comparison of MERRA-2 products and ground measurements, Atmos. Environ., 191, 70–78, https://doi.org/10.1016/j.atmosenv.2018.08.012, 2018.
Streets, D. G. and Waldhoff, S. T.: Present and future emissions of air pollutants in China: SO2, NOx, and CO, Atmos. Environ., 34, 363–374, https://doi.org/10.1016/S1352-2310(99)00167-3, 2000.
Sun, E., Xu, X., Che, H., Tang, Z., Gui, K., An, L., Lu, C., and Shi, G.: Variation in MERRA-2 aerosol optical depth and absorption aerosol optical depth over China from 1980 to 2017, J. Atmos. Sol-Terr. Phy., 186, 8–19, https://doi.org/10.1016/j.jastp.2019.01.019, 2019.
Sun, J., Li, H., Zhang, W., Li, T., Zhao, W., Zuo, Z., Guo, S., Wu, D., and Fan, S.: Modulation of the ENSO on winter aerosol pollution in the Eastern Region of China, J. Geophys. Res.-Atmos., 123, 11952–11969, https://doi.org/10.1029/2018jd028534, 2018.
Tao, J., Zhang, L., Cao, J., and Zhang, R.: A review of current knowledge concerning PM2.5 chemical composition, aerosol optical properties and their relationships across China, Atmos. Chem. Phys., 17, 9485–9518, https://doi.org/10.5194/acp-17-9485-2017, 2017.
Wang, B., Wu, R., and Fu, X.: Pacific–East Asian teleconnection: how does ENSO affect East Asian climate?, J. Climate, 13, 1517–1536, https://doi.org/10.1175/1520-0442(2000)013<1517:peathd>2.0.co;2, 2000.
Wang, H.-J., Chen, H.-P., and Liu, J.: Arctic sea ice decline intensified haze pollution in eastern China, Atmos. Oceanic Sci. Lett., 8, 1–9, https://doi.org/10.3878/AOSL20140081, 2015.
Wang, H., Xie, S.-P., Kosaka, Y., Liu, Q., and Du, Y.: Dynamics of Asian aummer monsoon response to anthropogenic aerosol forcing, J. Climate, 32, 843–858, https://doi.org/10.1175/jcli-d-18-0386.1, 2019a.
Wang, X., Zhong, S., Bian, X., and Yu, L.: Impact of 2015–2016 El Niño and 2017–2018 La Niña on PM2.5 concentrations across China, Atmos. Environ., 208, 61–73, https://doi.org/10.1016/j.atmosenv.2019.03.035, 2019b.
Weng, H., Behera, S. K., and Yamagata, T.: Anomalous winter climate conditions in the Pacific rim during recent El Niño Modoki and El Niño events, Clim. Dynam., 32, 663–674, https://doi.org/10.1007/s00382-008-0394-6, 2009.
Werdell, P. J., Behrenfeld, M. J., Bontempi, P. S., Boss, E., Cairns, B., Davis, G. T., Franz, B. A., Gliese, U. B., Gorman, E. T., and Hasekamp, O.: The plankton, aerosol, cloud, ocean ecosystem mission: status, science, advances, B. Am. Meteorol. Soc., 100, 1775–1794, 2019.
Wu, B., Zhou, T., and Li, T.: Seasonally evolving dominant interannual variability modes of East Asian climate, J. Climate, 22, 2992–3005, https://doi.org/10.1175/2008jcli2710.1, 2009.
Wu, G., Li, Z., Fu, C., Zhang, X., Zhang, R., Zhang, R., Zhou, T., Li, J., Li, J., Zhou, D., Wu, L., Zhou, L., He, B., and Huang, R.: Advances in studying interactions between aerosols and monsoon in China, Sci. China Earth Sci., 59, 1–16, https://doi.org/10.1007/s11430-015-5198-z, 2016.
Wu, R., Wen, Z., and He, Z.: ENSO Contribution to Aerosol Variations over the Maritime Continent and the Western North Pacific during 2000–10, J. Climate, 26, 6541–6560, https://doi.org/10.1175/jcli-d-12-00253.1, 2013.
Xie, P. and Arkin, P. A.: Global precipitation: A 17-year monthly analysis based on gauge observations, satellite estimates, and numerical model outputs, B. Am. Meteorol. Soc., 78, 2539–2558, 1997.
Xie, S.-P., Hu, K., Hafner, J., Tokinaga, H., Du, Y., Huang, G., and Sampe, T.: Ocean capacitor effect on Indo–western Pacific climate during the summer following El Niño, J. Climate, 22, 730–747, https://doi.org/10.1175/2008jcli2544.1, 2009.
Xie, S.-P., Kosaka, Y., Du, Y., Hu, K., Chowdary, J. S., and Huang, G.: Indo-western Pacific Ocean capacitor and coherent climate anomalies in post-ENSO summer: A review, Adv. Atmos. Sci., 33, 411–432, https://doi.org/10.1007/s00376-015-5192-6, 2016.
Yadav, I. C., Linthoingambi Devi, N., Li, J., Syed, J. H., Zhang, G., and Watanabe, H.: Biomass burning in Indo-China Peninsula and its impacts on regional air quality and global climate change-a review, Environ. Pollut., 227, 414–427, https://doi.org/10.1016/j.envpol.2017.04.085, 2017.
Yang, Y., Russell, L. M., Lou, S., Lamjiri, M. A., Liu, Y., Singh, B., and Ghan, S. J.: Changes in sea salt emissions enhance ENSO variability, J. Climate, 29, 8575–8588, https://doi.org/10.1175/jcli-d-16-0237.1, 2016.
Yin, Z. and Wang, H.: Role of atmospheric circulations in haze pollution in December 2016, Atmos. Chem. Phys., 17, 11673–11681, https://doi.org/10.5194/acp-17-11673-2017, 2017.
Yu, X., Wang, Z., Zhang, H., and Zhao, S.: Impacts of different types and intensities of El Niño events on winter aerosols over China, Sci. Total Environ., 655, 766–780, https://doi.org/10.1016/j.scitotenv.2018.11.090, 2019.
Yuan, C., Lau, W. K. M., Li, Z., and Cribb, M.: Relationship between Asian monsoon strength and transport of surface aerosols to the Asian Tropopause Aerosol Layer (ATAL): interannual variability and decadal changes, Atmos. Chem. Phys., 19, 1901–1913, https://doi.org/10.5194/acp-19-1901-2019, 2019.
Yue, X., Unger, N., Harper, K., Xia, X., Liao, H., Zhu, T., Xiao, J., Feng, Z., and Li, J.: Ozone and haze pollution weakens net primary productivity in China, Atmos. Chem. Phys., 17, 6073–6089, https://doi.org/10.5194/acp-17-6073-2017, 2017.
Zhang, G., Gao, Y., Cai, W., Leung, L. R., Wang, S., Zhao, B., Wang, M., Shan, H., Yao, X., and Gao, H.: Seesaw haze pollution in North China modulated by the sub-seasonal variability of atmospheric circulation, Atmos. Chem. Phys., 19, 565–576, https://doi.org/10.5194/acp-19-565-2019, 2019.
Zhang, L., Liao, H., and Li, J.: Impacts of Asian summer monsoon on seasonal and interannual variations of aerosols over eastern China, J. Geophys. Res.-Atmos., 115, D00K05, https://doi.org/10.1029/2009jd012299, 2010a.
Zhang, L., Liao, H., and Li, J.: Impact of the Southeast Asian summer monsoon strength on the outflow of aerosols from South Asia, Ann. Geophys., 28, 277–287, https://doi.org/10.5194/angeo-28-277-2010, 2010b.
Zhang, M., Wang, Y., Ma, Y., Wang, L., Gong, W., and Liu, B.: Spatial distribution and temporal variation of aerosol optical depth and radiative effect in South China and its adjacent area, Atmos. Environ., 188, 120–128, https://doi.org/10.1016/j.atmosenv.2018.06.028, 2018.
Zhang, R., Sumi, A., and Kimoto, M.: A diagnostic study of the impact of El Niño on the precipitation in China, Adv. Atmos. Sci., 16, 229–241, https://doi.org/10.1007/BF02973084, 1999.
Zhang, R., Li, G., Fan, J., Wu, D. L., and Molina, M. J.: Intensification of Pacific storm track linked to Asian pollution, P. Natl. Acad. Sci. USA, 104, 5295–5299, https://doi.org/10.1073/pnas.0700618104, 2007.
Zhang, W., Jin, F.-F., Li, J., and Ren, H.-L.: Contrasting impacts of two-type El Niño over the western North Pacific during boreal autumn, J. Meteorol. Soc. Jpn. Ser. II, 89, 563–569, https://doi.org/10.2151/jmsj.2011-510, 2011.
Zhang, X., Sun, J., Wang, Y., Li, W., ZHang, Q., Wang, W., Quan, J., Cao, G., Wang, J., Yang, Y., and Zhang, Y.: Factors contributing to haze and fog in China, Chin. Sci. Bull., 58, 1178–1187, https://doi.org/10.1360/972013-150, 2013.
Zhao, S., Zhang, H., and Xie, B.: The effects of El Niño–Southern Oscillation on the winter haze pollution of China, Atmos. Chem. Phys., 18, 1863–1877, https://doi.org/10.5194/acp-18-1863-2018, 2018.
Zhou, D., Ding, K., Huang, X., Liu, L., Liu, Q., Xu, Z., Jiang, F., Fu, C., and Ding, A.: Transport, mixing and feedback of dust, biomass burning and anthropogenic pollutants in eastern Asia: a case study, Atmos. Chem. Phys., 18, 16345–16361, https://doi.org/10.5194/acp-18-16345-2018, 2018.
Zou, Y., Wang, Y., Zhang, Y., and Koo, J.-H.: Arctic sea ice, Eurasia snow, and extreme winter haze in China, Sci. Adv., 3, e1602751, https://doi.org/10.1126/sciadv.1602751, 2017.
- Abstract
- Introduction
- Data and methods
- Influences of ENSO on East Asian aerosols
- Possible mechanisms for ENSO impacts on the East Asian aerosols
- Different influences of the two types of ENSO
- Conclusions and discussion
- Data availability
- Author contributions
- Competing interests
- Acknowledgements
- Financial support
- Review statement
- References