the Creative Commons Attribution 4.0 License.
the Creative Commons Attribution 4.0 License.
 | 15 Jan 2021
Processes controlling the vertical aerosol distribution in marine stratocumulus regions – a sensitivity study using the climate model NorESM1-M
Lena Frey
Frida A.-M. Bender
Gunilla Svensson
The vertical distribution of aerosols plays an important role in determining the effective radiative forcing from aerosol–radiation and aerosol–cloud interactions. Here, a number of processes controlling the vertical distribution of aerosol in five subtropical marine stratocumulus regions in the climate model NorESM1-M are investigated, with a focus on the total aerosol extinction. A comparison with satellite lidar data (CALIOP, Cloud–Aerosol Lidar with Orthogonal Polarization) shows that the model underestimates aerosol extinction throughout the troposphere, especially elevated aerosol layers in the two regions where they are seen in observations. It is found that the shape of the vertical aerosol distribution is largely determined by the aerosol emission and removal processes in the model, primarily through the injection height, emitted particle size, and wet scavenging. In addition, the representation of vertical transport related to shallow convection and entrainment is found to be important, whereas alterations in aerosol optical properties and cloud microphysics parameterizations have smaller effects on the vertical aerosol extinction distribution. However, none of the alterations made are sufficient for reproducing the observed vertical distribution of aerosol extinction, neither in magnitude nor in shape. Interpolating the vertical levels of CALIOP to the corresponding model levels leads to better agreement in the boundary layer and highlights the importance of the vertical resolution.
- Article
(5122 KB) - Full-text XML
- BibTeX
- EndNote


Aerosol interactions with clouds and radiation constitute a major source of uncertainty in estimates of total radiative forcing. Aerosol particles can scatter and absorb solar radiation, causing a local cooling or heating. The altered temperature profile may in turn induce changes in cloud cover, whereby the so-called semi-direct effect describing dissipation of clouds in response to local heating is one of several possible adjustments (Hansen et al., 1997). The resulting radiative forcing, including the cloud adjustments to the altered temperature profile, is referred to as effective radiative forcing from aerosol–radiation interactions. Aerosols can further modify the cloud albedo since an increase in the number of aerosol particles leads to more numerous and smaller cloud droplets for a cloud with a given liquid water content. This enhancement in cloud reflectivity is known as the cloud albedo effect (Twomey, 1977). An increase in cloud droplet number concentration can further lead to suppression of precipitation since the formation of rain droplets is less efficient for a higher number concentration of smaller cloud droplets, and this rapid adjustment is referred to as the cloud lifetime effect (Albrecht, 1989). The cloud albedo and cloud lifetime effects are part of the effective radiative forcing from aerosol–cloud interactions. The overall effect of aerosol–radiation interactions, aerosol–cloud interactions, and the related rapid adjustments is estimated to be negative but with a substantial uncertainty (−0.9 (−1.9 to 0.1) Wm−2) (Myhre et al., 2013). The vertical distribution of aerosols is one important factor for determining the aerosol effect on the radiative budget for both aerosol interaction with clouds, which requires vertical colocation, and aerosol interaction with radiation.
Model intercomparisons and comparisons with observations have shown large disagreement in the vertical distribution of aerosols in general and absorbing aerosols in particular, with large regional variation (Yu et al., 2010; Koffi et al., 2012, 2016). Model diversity and uncertainty in radiative forcing from aerosol–radiation interactions have been found to be largely attributable to the vertical distribution of black carbon (BC), the main absorbing aerosol type (Samset and Myhre, 2011; Samset et al., 2013). Schwarz et al. (2010, 2013) found that models overestimate BC concentrations over the remote Pacific compared to aircraft observations, whereas the quantity of biomass burning aerosols above clouds has been found to be underestimated in models over the southeast Atlantic and often prescribed as too reflective (Peers et al., 2016). This is in agreement with Frey et al. (2017), who found that aerosols above the cloud layer occur in CMIP5 (Coupled Model Intercomparison Project phase 5) models without reducing the scene albedo.
Highlighting the diversity among climate models, Koffi et al. (2012) compared vertical profiles of aerosol extinction of AeroCom (Aerosol Comparisons between Observations and Models) phase I models with satellite observations, and Koffi et al. (2016) further investigated whether models from AeroCom phase II have improved compared to phase I models, focusing on regional and seasonal variability. Although the models were found able to reproduce the general features of the observed aerosol distribution, with a decrease in aerosol extinction from the surface up to 5 km, many models fail to capture the shape of the aerosol distribution in more detail.
The large model diversity and poor agreement with observations motivate further investigation of which processes are important for determining the vertical distribution of aerosols in global models. Kipling et al. (2016, 2013) accordingly investigated various factors affecting the vertical aerosol distribution in two models (HadGEM3-UKCA and ECHAM5-HAM2), pointing at the importance of removal processes, which is also supported by the findings from Vignati et al. (2010), who found a large sensitivity of BC lifetime to wet scavenging in a chemical transport model. Studying biomass burning aerosols in particular, Peers et al. (2016) rather point at injection height and vertical transport as the main reasons for discrepancies between their chemical transport model and satellite observations. In the present study, we add to the generalizability of these previous results by testing the sensitivity to several processes that can control the vertical distribution of aerosol in another climate model, NorESM1-M. The sensitivity experiments performed are classified into five categories, following Kipling et al. (2016): emissions, transport, microphysics, deposition, and aerosol optical properties. Although some of the sensitivity experiments target specific aerosol types, we focus the evaluation on total aerosol extinction and number concentration, without discriminating between absorbing and reflecting aerosols, to give a full description of the vertical aerosol distribution in the model and to facilitate a comparison with observational estimates of total extinction.
While the analysis by Kipling et al. (2016) is on global scale, we focus here on the regional scale and investigate five subtropical marine stratocumulus regions defined by Klein and Hartmann (1993). The radiative properties of the clouds in these regions, and their potential alteration by aerosol influence, remain a key challenge in climate models (Bony and Dufresne, 2005; Medeiros et al., 2008; Qu et al., 2014; Bender et al., 2016). Further, both absorbing and reflecting aerosols (BC, organics, and dust) located above the cloud layer have been identified in observations (Waquet et al., 2013; Winker et al., 2013; Chand et al., 2008; Devasthale and Thomas, 2011) of these regions, which display a variety of aerosol signatures in terms of types and column burdens. To evaluate the model performance against observations, we use the 5 km aerosol profile product of CALIOP (Cloud–Aerosol Lidar with Orthogonal Polarization) version 4.10. A description of the satellite data retrievals can be found in Sect. 2, while a description of the climate model NorESM1-M and the model simulations performed is provided in Sect. 3. The results and further discussion are presented in Sects. 4 and 5, respectively. We summarize the most important processes that control the vertical aerosol distribution in the climate model NorESM1-M in the given regions in Sect. 6 and thereby give guidance for evaluating and improving this and other state-of-the-art climate models.
CALIOP is onboard the CALIPSO (Cloud–Aerosol Lidar and Infrared Pathfinder Satellite Observations) satellite as part of the A-train constellation. The satellite was launched in the year 2006, and we used data for the time period 2007 to 2016. We used the Level 2, 5 km aerosol profile product, version 4.10, of CALIOP lidar data, which has shown better agreement with the aerosol optical depth (AOD) from observations compared to the previous CALIOP version (Kim et al., 2018).
CALIOP measures backscattered radiation at two wavelengths and derives the aerosol extinction with an algorithm including iterative adjustment of the lidar ratio, i.e., the ratio between the extinction cross section and 180∘ backscatter cross section. We use the 5 km aerosol profile product (Winker et al., 2013), which provides profiles of the total aerosol extinction coefficient. A detailed product and data processing algorithm description can be found in Winker et al. (2009) and Kim et al. (2018). Only wavelength 532 nm is considered here, as these measurements have a better signal-to-noise ratio than those at wavelength 1064 nm (Yu et al., 2010). Due to the higher detection sensitivity for aerosols in the night (Winker et al., 2009, 2010), we use only nighttime data, following Yu et al. (2010) and Koffi et al. (2012). We apply several additional data screening criteria, following Tackett et al. (2018). The cloud–aerosol discrimination (CAD) score distinguishes between clouds and aerosols, with a negative CAD score representing aerosol and a positive value representing cloud. We use a CAD score greater than −80 for a higher confidence in identifying aerosol (Liu et al., 2009, 2019). We also examine the quality of the extinction retrieval, represented by the extinction quality control (QC) filter, which stores information about the initial and final state of the lidar ratio at each layer. We use only cases in which the initial lidar ratio remains unchanged during the iterative solution process, referred to as an unconstrained retrieval (QC = 0), or use constrained retrievals (QC = 1) for which the initial lidar ratio was adjusted during the retrieval process by using measurements of a layer two-way transmittance, both with a higher confidence in the algorithm solution. Furthermore, we reject retrievals with a high extinction uncertainty of 99.9 km−1, thereby avoiding high biases in aerosol extinction.
Our analysis focuses on five regions of low marine stratocumulus clouds, following Klein and Hartmann (1993): Australian (25–35∘ S, 95–105∘ E), Californian (20–30∘ N, 120–130∘ W), Canarian (15–25∘ N, 25–35∘ W), Namibian (10–20∘ S, 0–10∘ E), and Peruvian (10–20∘ S, 80–90∘ W). The CALIPSO satellite overpasses the Equator twice per day. The temporal resolution of the lidar is 5 s, and the snapshots for each given satellite overpass are aggregated to a uniform 2∘ latitude by 5∘ longitude grid with a vertical resolution of 60 m so that each provided data file within each region contains multiple aerosol profiles. We average all profiles in the latitude and longitude range of each region to obtain a daily mean profile; a minimum number of 10 profiles at each vertical layer is thereby required to avoid high biases in aerosol extinction in the upper troposphere. In addition, to allow for a better comparison with the coarser model resolution of 26 vertical layers, we linearly interpolate the daily mean lidar profiles to the altitudes corresponding to the model levels. By choosing linear interpolation rather than averaging the vertical CALIOP levels, the original shape of the profile is still preserved. The daily mean profiles are further averaged over the whole 10-year period to obtain a climatological annual mean.
3.1 Model NorESM1-M
The atmospheric part of the climate model NorESM1-M (Kirkevåg et al., 2013) is based on the Community Atmosphere Model version 4 (CAM4; Gent et al., 2011) and coupled to the aerosol module CAM4-Oslo. The horizontal resolution is 1.9∘ for latitudes and 2.5∘ for longitudes, and the vertical is resolved with 26 levels from 1000 up to 0.1 hPa using hybrid sigma–pressure coordinates. Here an AMIP (Atmospheric Model Intercomparison Project) configuration of the uncoupled model version, with a prescribed sea surface temperature and sea ice climatology, was used.
Aerosol types represented in the model are mineral dust, sea salt, organic matter (OM), black carbon (BC), and sulfate. Mineral dust emissions are prescribed and inserted at the surface, while sea salt emissions are prognostic and wind-driven. Anthropogenic aerosol emissions of sulfate, primary OM, and BC from fossil fuel and biofuel combustion, as well as biomass burning, are in the default model configuration based on the IPCC AR5 data set (Lamarque et al., 2010). Biofuel and fossil fuel emissions are injected at the surface, whereas biomass burning emissions are distributed over the eight lowest model levels, which reach up to approximately 510 hPa on average. Emission heights follow the recommendations by Dentener et al. (2006).
Nucleation, condensation, coagulation, and aqueous chemistry processes are represented, and the emitted particles are tagged with one of these production mechanisms. The aerosol scheme in NorESM1-M is a sophisticated aerosol module, whereby all aerosol particles can be internally mixed; i.e., absorbing particles can become reflecting and active as cloud condensation nuclei (CCN). All aerosol types are mainly reflecting except BC, which is prescribed as fully absorbing. In terms of aerosol–cloud interactions, both the cloud albedo and cloud lifetime effects are represented. The cloud droplet effective radius (reff) is prognostically dependent on the cloud droplet number concentration (Nd), which is dependent on the aerosol number concentration and vertical velocity through supersaturation, based on the parameterization by Abdul-Razzak and Ghan (2000). Suppression of precipitation with increased aerosol number concentration (lifetime effect) is triggered by a threshold in the autoconversion scheme, a critical radius of 14 µm from which cloud droplets are converted to rain droplets. A second parameter, which controls the autoconversion process in the model, is a critical precipitation rate of 5.0 mm d−1. If the critical threshold is reached, collector drops are assumed to change the drop size and thereby enhance autoconversion. The autoconversion scheme is based on Tripoli and Cotton (1979) and modified by Rasch and Kristjánsson (1998). Mean aerosol size distributions and optical properties are calculated a posteriori using lookup tables. The aerosol mass concentration is tagged with one of the different production mechanisms and also calculated offline.
All aerosol particles can be removed by dry and wet deposition. For convective clouds an in-plume approach is used, which allows aerosols to be vertically transported, mixed between updrafts and downdrafts, and removed directly with wet scavenging (Kirkevåg et al., 2013). Mass fluxes for the updrafts and downdrafts are based on Zhang and McFarlane (1995). The boundary layer scheme is based on Holtslag and Boville (1993) using an updated representation of the boundary layer height; see Vogelezang and Holtslag (1996).
Further information on the model can be found in Kirkevåg et al. (2013).
3.2 Model setup and sensitivity experiments
All model simulations are run in an AMIP-type configuration; i.e., the model is constrained by a prescribed sea surface temperature and sea ice climatology representative of preindustrial conditions. Only anthropogenic aerosol emissions are increased to the present-day level, corresponding to the year 2000. Following Kipling et al. (2016) we use an on–off approach for analyzing the sensitivity to several processes, and in other cases use an observationally motivated parameter range. Sensitivity simulations with changes in processes influencing the vertical distribution of aerosol were performed, and a control simulation serves as a reference. This experiment setup isolates changes in aerosol distribution driven by the selected processes. We note here that changes in the sensitivity experiments are applied globally so that effects in the focus regions may also be driven by changes on the larger scale. The single-process approach taken here differs from methods of statistical sampling of a broad parameter space to identify key drivers of uncertainty, which has been demonstrated by, e.g., Lee et al. (2011, 2012, 2013) to be useful for investigating sources of uncertainty in model representation of CCN.
Our methods target specific processes relevant for the vertical aerosol distribution, and in combination with the limited geographical distribution and dynamical similarity of the focus regions, we can isolate factors for which there are physical reasons to expect an effect on the vertical distribution in the given areas. The on–off approach (see Kipling et al., 2016), rather than mimicking realistic variations, helps to identify processes controlling the vertical aerosol distribution and highlights the importance of basic physical processes and their representation in the model for the vertical distribution of aerosol. We note that the results of the sensitivity study are limited to the individual parameters and ranges chosen, and potential effects of interaction between processes and parameters cannot be uncovered; see Lee et al. (2011).
Table 1Summary and short description of control and sensitivity experiments.
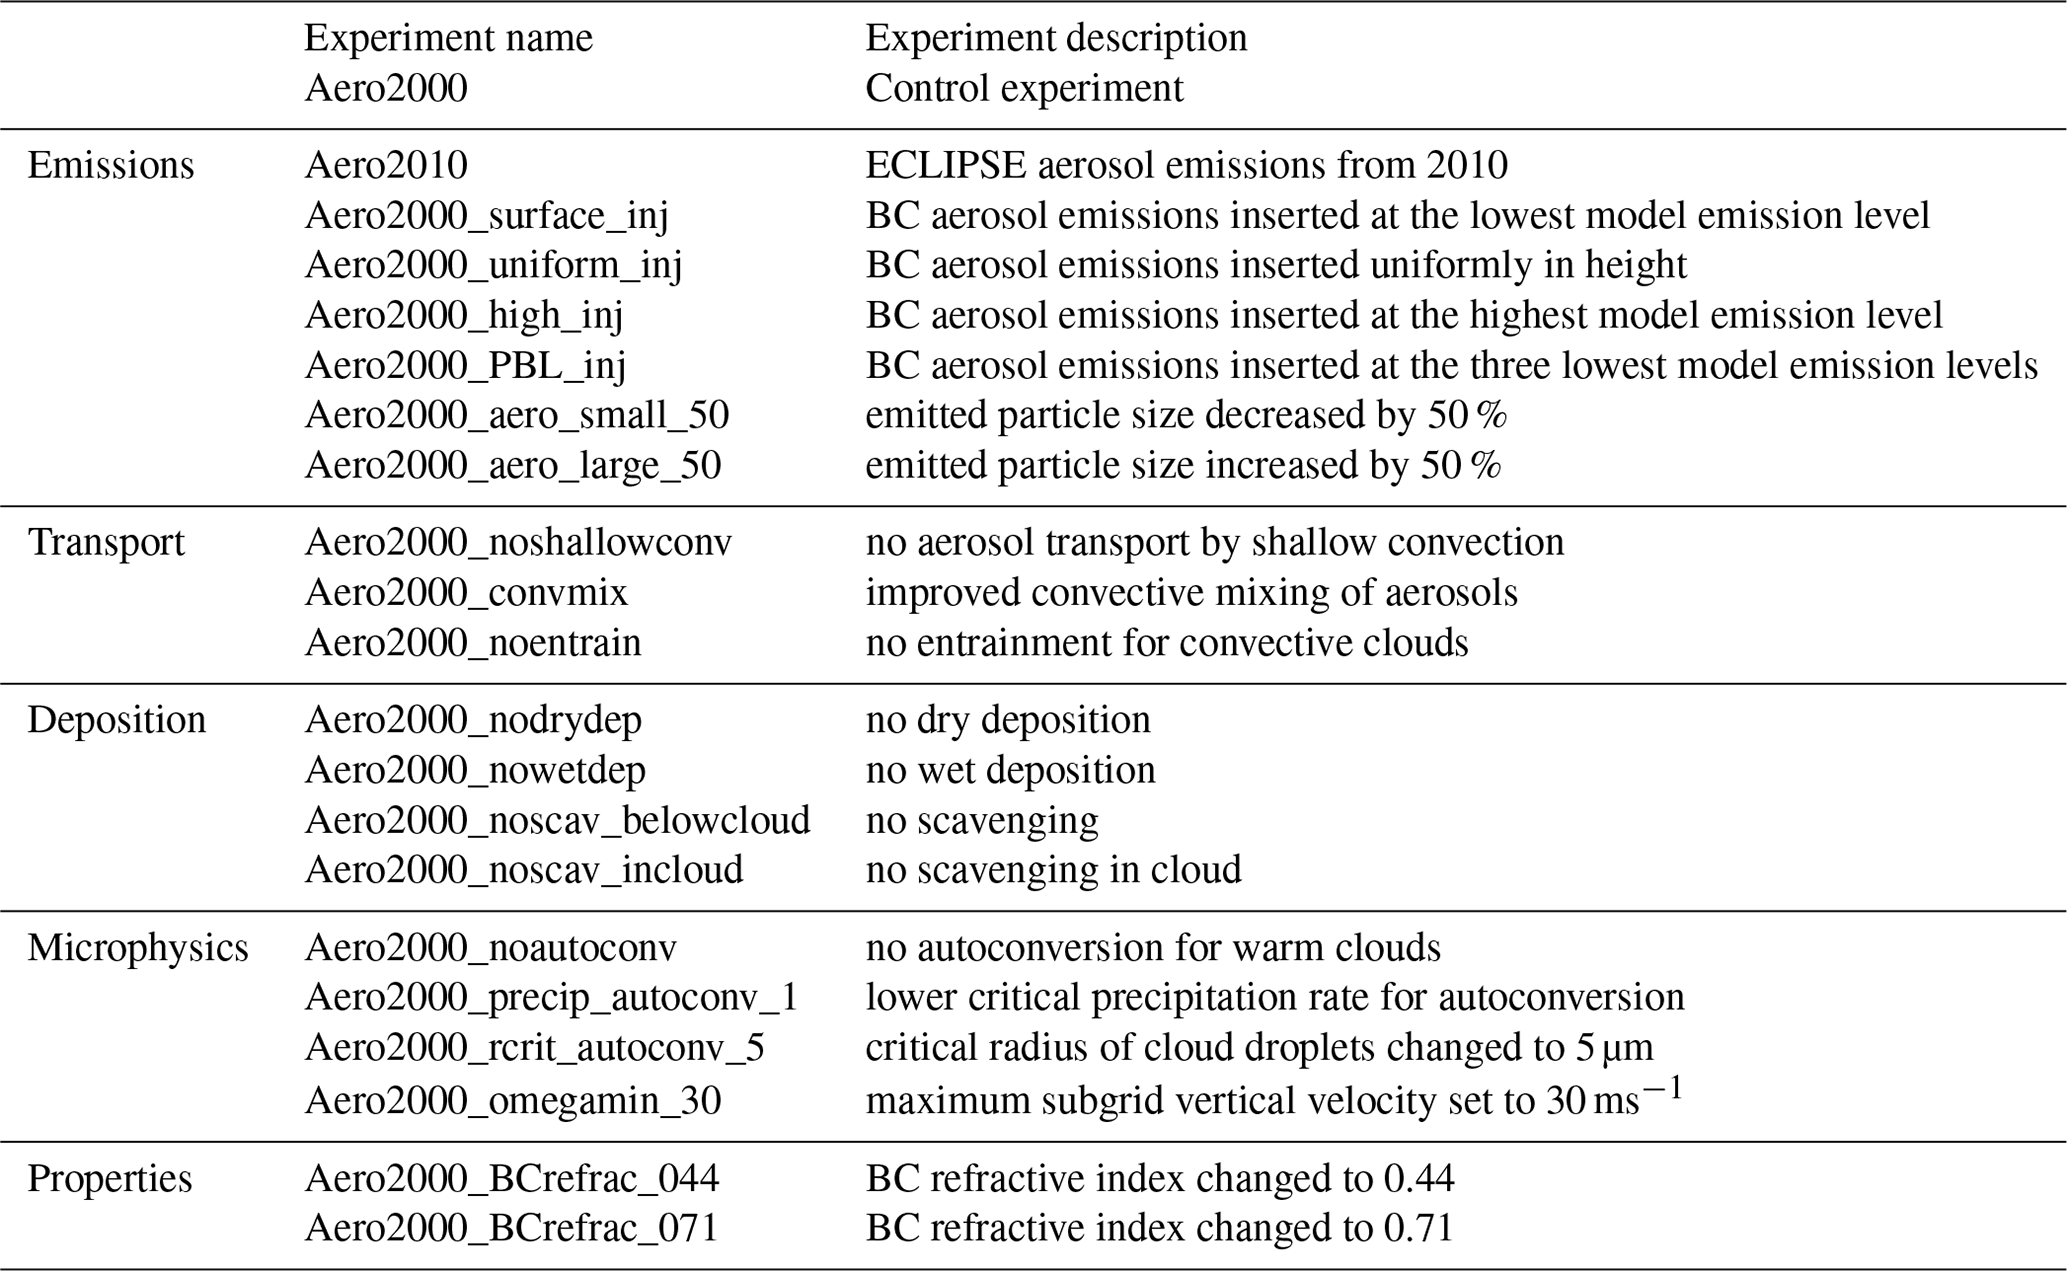
All model simulations were run for a simulation time of 10 years, following a 1-year spin-up period. A summary of all experiments can be found in Table 1, and a more detailed description of all experiments, divided into the categories of emissions, deposition, vertical transport, microphysics, and aerosol optical properties following Kipling et al. (2016), is presented in the following.
3.2.1 Emissions
The magnitude, altitude, and type of emissions, or anthropogenic aerosol sources, directly affect the distribution of aerosol. In this category of sensitivity experiments we vary the emission data set, emission height, and emitted particle size. For all cases except the altered emission data set, the total emitted aerosol mass is kept constant.
For the default model configuration, the IPCC AR5 emission data set (Lamarque et al., 2010) was used. Fire emissions in the default data set are based on the Global Fire Emissions Database (GFED) version 2, and aviation emissions are not included. An additional aerosol emission data set, combining emissions from the Evaluating the Climate and Air Quality Impacts of Short-Lived Pollutants (ECLIPSE) project (Stohl et al., 2015) version 3 and updated fire emissions from the GFED version 3.1 (van der Werf et al., 2010) as well as aviation emissions, representative of the year 2010 is implemented in the experiment Aero2010. As the altered emission data set represents a later emission year, differences between the default and alternative emission data set can encompass interannual variability besides differences in the data set construction. With this experiment, the model sensitivity to more recent aerosol emissions can be tested.
In NorESM1-M, biomass burning aerosols (consisting of BC and OM) are emitted at eight model levels. The sensitivity to the emission height of biomass burning aerosols is tested here using four experiments with varying emission height. For the first experiment all biomass burning emissions were inserted at the lowest predefined emission level (Aero2000_surface_inj), and in the second one all biomass burning emissions were inserted above the cloud layer at the highest predefined emission level at approximately 510 hPa on average (Aero2000_high_inj). The third experiment inserts biomass burning aerosols uniformly over all eight emission levels (Aero2000_uniform_inj), ranging from the surface up to approximately 510 hPa. Finally, all biomass burning aerosols were injected at the three lowest emission levels, which are within the boundary layer in these regions (Aero2000_PBL_inj), ranging from the surface to 930 hPa.
The size of primary emitted particles can influence the vertical distribution through changes in removal and transport processes. Due to the large variability in the control simulation (SD up to 76 %), we test the sensitivity to particle size by increasing and decreasing the radii of primary emitted particles by as much as ±50 % in two experiments (Aero2000_aero_small_50 and Aero200_aero_large_50, respectively).
3.2.2 Deposition
Deposition constitutes the main aerosol sink and is hence also of direct relevance to the aerosol distribution in the model. All aerosol types are affected by wet and dry deposition in the model, and here an on–off approach was used to study the sensitivity to these two main removal processes (Aero2000_nowetdep and Aero2000_nodrydep). Dry deposition takes the particle size into account and has an additional gravitational settling for coarse particles. Wet deposition represents in-cloud and below-cloud scavenging, whose impact was broken down into two separate experiments allowing only below-cloud (Aero2000_noscav_incloud) and only in-cloud scavenging (Aero2000_noscav_belowcloud). In-cloud scavenging refers to nucleation and impaction by cloud droplets, through which aerosols can enter cloud droplets, whereas below-cloud scavenging refers to aerosol removal by impaction of falling rain droplets. Aerosols can be liberated by evaporation of cloud droplets.
3.2.3 Vertical transport
For given sources and sinks, transport can further affect the vertical aerosol distribution in the model, and the vertical transport of aerosols is primarily controlled by convection. To test the sensitivity of the aerosol extinction profile to convective transport, the original convection scheme was replaced with a modified version that assumes full mixing of aerosols between updrafts and downdrafts in convective clouds (Aero2000_convmix); see Seland et al. (2008). Furthermore, in one experiment the shallow convection parameterization was switched off completely (Aero2000_noshallowconv), affecting not only the convective transport of aerosols, but also of heat, moisture, and momentum. As the model resolution is too coarse to resolve convection, it is an extreme scenario to turn off the shallow convection scheme, but it emphasizes the importance of shallow convective transport for the vertical distribution of aerosols. Aerosols are also vertically displaced by entrainment of dry air into the moist cloud layer. The sensitivity to entrainment was studied, again using an on–off approach (Aero2000_noentrain) and turning off entrainment for convective clouds.
3.2.4 Cloud microphysics
Activation of aerosols to form cloud droplets and conversion of cloud droplets to rain drops are microphysical processes that can affect the vertical distribution and properties of aerosols. In this category of experiments, we target microphysical parameterizations in the model.
We first vary the efficiency of the autoconversion, i.e., the transformation of cloud water into rainwater, which in turn controls removal of aerosol particles through wet deposition. In addition to the extreme scenario to switch off autoconversion in warm clouds (Aero2000_noautoconv), two more parameters that control the autoconversion rate in NorESM1-M were changed; the critical droplet radius for the onset of autoconversion was decreased from the default value of 14 to 5 µm (Aero2000_rcrit_autoconv_5), and the critical precipitation rate for an amplification of autoconversion was decreased from the default of 5.0 to 1.0 mm d−1 (Aero2000_precip_autoconv_1).
The activation of cloud droplets depends on the vertical velocity on the cloud scale. NorESM1-M uses a characteristic subgrid vertical velocity, which is parameterized through the turbulent diffusion coefficient and a constant characteristic mixing length (see Morrison and Gettelman, 2008); it represents the variability within one model grid box. Due to a high variability of the control simulation, the default value of 10 ms−1, based on Morrison and Gettelman (2008), was increased to an extreme value of 30 ms−1 in the sensitivity experiment Aero2000_omegamin_30. This is a very high velocity that may produce large supersaturations and activate smaller aerosols than a more realistic choice for stratocumulus clouds, but this extreme choice is made to illustrate the impact of vertical velocity on the aerosol distribution.
3.2.5 Aerosol optical properties
To address the fact that aerosols above clouds tend to be insufficiently absorbing in models (Peers et al., 2016), we also alter the aerosol optical properties in the model. Peers et al. (2016) found that climate models with a refractive index for BC of 0.71 show better agreement with satellite observations compared to models with a refractive index of 0.44. Here, BC is prescribed as fully absorbing with a default imaginary part of the refractive index of 1.00, but to test the sensitivity to this optical property we decreased it to 0.44 (Aero2000_BCrefrac_044) and 0.71 (Aero2000_BCrefrac_071), making the pure BC in the model more reflecting.
3.3 Model output and post-processing
To evaluate the effects of the sensitivity experiments on the vertical aerosol distribution, monthly mean model output was used, and profiles of the total aerosol extinction coefficient and aerosol number concentration were compared. The mean aerosol profiles were obtained by averaging all grid points in each of the focus regions at each vertical model level, following Koffi et al. (2012, 2016). As shown by Koffi et al. (2012), colocating the model grid to match CALIOP coordinates causes only little variation in averaged regional aerosol profiles, indicating that the regional coverage by CALIOP is sufficient for the averaging method used here. As the model output is represented as monthly means, the output cannot be extracted along the CALIPSO overpasses at the times of the overpasses. This lack of spatial and temporal colocation could induce sampling errors (Schutgens et al., 2016, 2017). In addition, the aerosol column burden, i.e., a mass measure of aerosols, is investigated. The monthly model output is averaged over the 10-year simulation period to obtain a climatological mean. To indicate the variability of the model control simulation, we use a ±1 SD (SD: standard deviation) range of the monthly model output, which is referred to as the uncertainty range in the subsequent analysis of the sensitivity experiments.
4.1 Regional characteristics
The focus regions are similar in regard to dynamical regime but differ in their aerosol signature (e.g., Frey et al., 2017). These subtropical marine stratocumulus regions are located in the subsiding branch of the Hadley cell, and the capping inversion limits the vertical cloud extent.
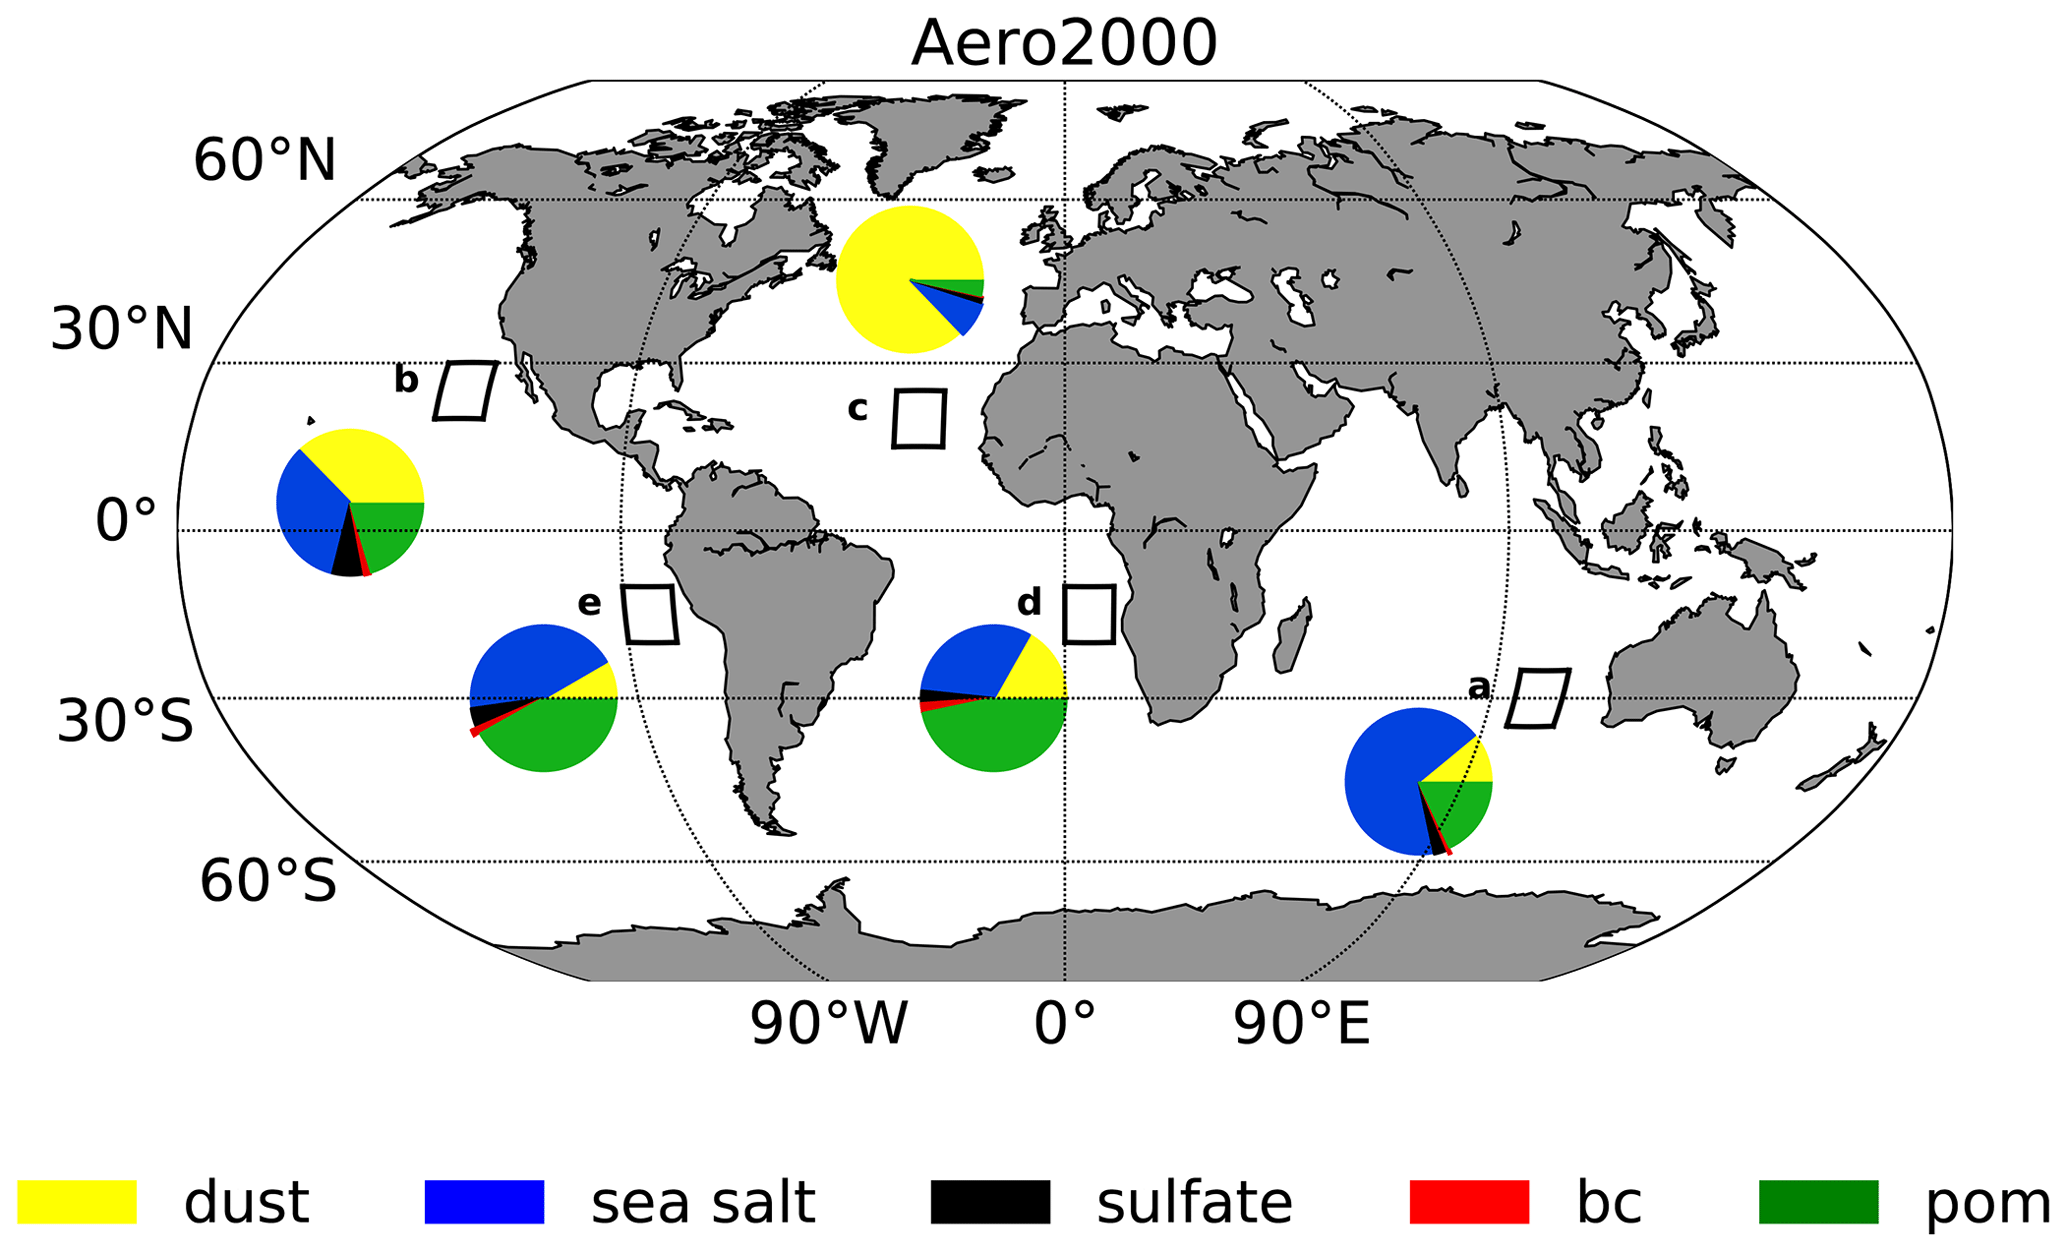
Figure 1The relative columnar burden contribution of each aerosol type to the total column burden in the control simulation in five regions of marine stratocumulus clouds. The boxes indicate the five regions of stratocumulus clouds – a: Australian, b: Californian, c: Canarian, d: Namibian, e: Peruvian.
Figure 1 shows the column burden of the five aerosol types represented in the model relative to the total column burden for the control simulation. In all regions, the largest contribution to the total column burden comes from dust and sea salt aerosols, in agreement with Textor et al. (2006), but in the Namibian and Peruvian regions biomass burning aerosols (including both BC and OM) account for almost 50 % of the total aerosol burden. The Canarian region, located downwind of the Sahara, is dust-dominated, and the Californian region has a high contribution of sulfate aerosols compared to other regions.
4.2 Observed vertical aerosol extinction distribution
Figure 2 shows the vertical distribution of the total aerosol extinction coefficient retrieved from CALIOP in comparison with the model control simulation for the five focus regions. The vertical resolution of CALIOP data is higher than the coarse model resolution, and CALIOP vertical levels were linearly interpolated to the equivalent model levels to facilitate comparison (see Sect. 2). Figure 2 shows both the original and the coarser-resolution versions of the CALIOP profiles.
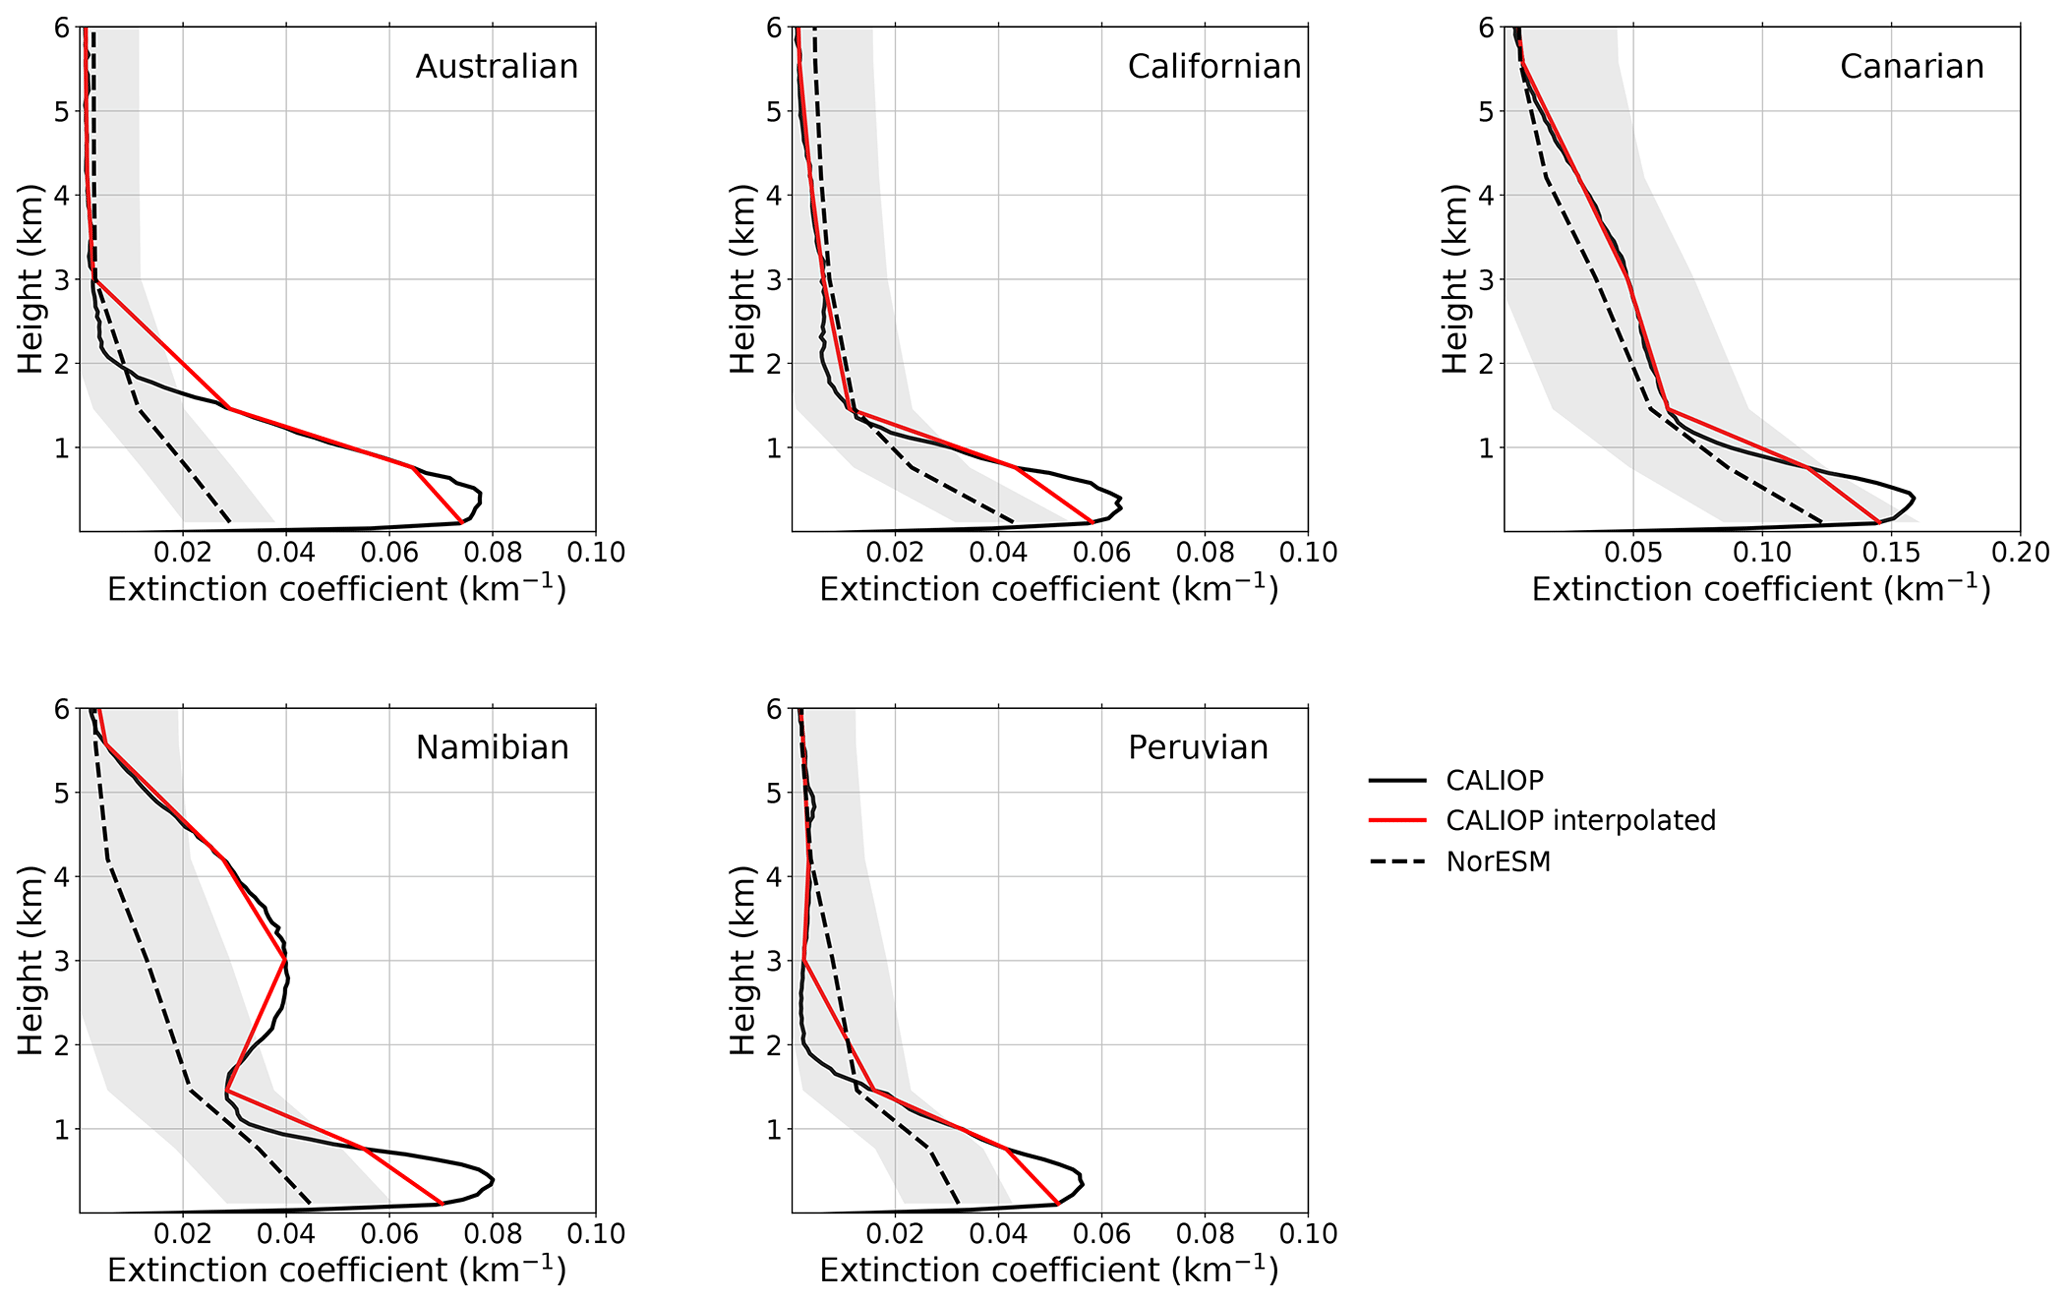
Figure 2Vertical distribution of the total aerosol extinction coefficient (km−1) for CALIOP data from 2007 to 2016 for the Australian, Californian, Canarian, Namibian, and Peruvian regions (solid black line). The CALIOP vertical levels were interpolated to the corresponding model levels (solid red line). In addition, the model control simulation averaged over 10 years is shown (dashed line) with the SD (grey shaded area).
The variability is greatest in the dust-dominated Canarian region, which is also the region where the magnitude of the extinction coefficient is highest for both observations and model output.
The original CALIOP distribution of aerosol extinction shows an increase in magnitude with height in the boundary layer and then a decrease throughout the troposphere, except in the Namibian and Canarian regions, where local maxima in aerosol extinction occur above the boundary layer. The interpolated CALIOP distribution does not show the maximum in the boundary layer seen in the original CALIOP distribution and shows instead a decrease from the surface throughout the boundary layer. With a few minor exceptions, the model underestimates the magnitude of the aerosol extinction for all regions and levels, and in addition the shape of the distribution in the vertical differs between the model and observations. If compared to the original CALIOP distribution, the model has difficulties representing the distinct observed maximum in aerosol extinction in the boundary layer, in agreement with the findings of Koffi et al. (2012). If compared to the interpolated CALIOP distribution, the model distribution shows better agreement in the boundary layer, with a decrease in extinction from the surface throughout the boundary layer. This indicates that the model resolution is too coarse to resolve relevant processes in the boundary layer. The elevated aerosol layers in the Canarian and Namibian regions, seen in both the original and the interpolated CALIOP distributions, are underestimated and not well represented in the model. This indicates that resolution is not the limiting factor for representing the above-cloud aerosol layer. However, even if an aerosol layer or plume can be instantaneously represented with the given resolution, it may be lost to diffusion too quickly.
4.3 Sensitivity experiments
The large regional variations and discrepancies between models and observations motivate the wide ranges used in the sensitivity tests, the results of which are shown in the following. For clarity, only a selected subset of experiments is visualized for each of the five experiment categories.
4.3.1 Emissions
The choice of an alternative aerosol emission data set (Aero2010) yields an increase in aerosol extinction and aerosol number concentration, mainly in the lower troposphere in the biomass burning regions (see Fig. 3), but only in the Peruvian region does the increase in aerosol number concentration fall outside the uncertainty range of the control simulation (±1 SD; based on monthly means for 10 years). A decrease in both aerosol extinction and number occurs in the other regions. The ECLIPSE emission data set for the year 2010 compared to the model's default IPCC AR5 data set for the year 2000 shows a higher total aerosol optical depth (AOD) and absorption aerosol optical depth (AAOD) in the biomass burning regions (see Fig. 4).
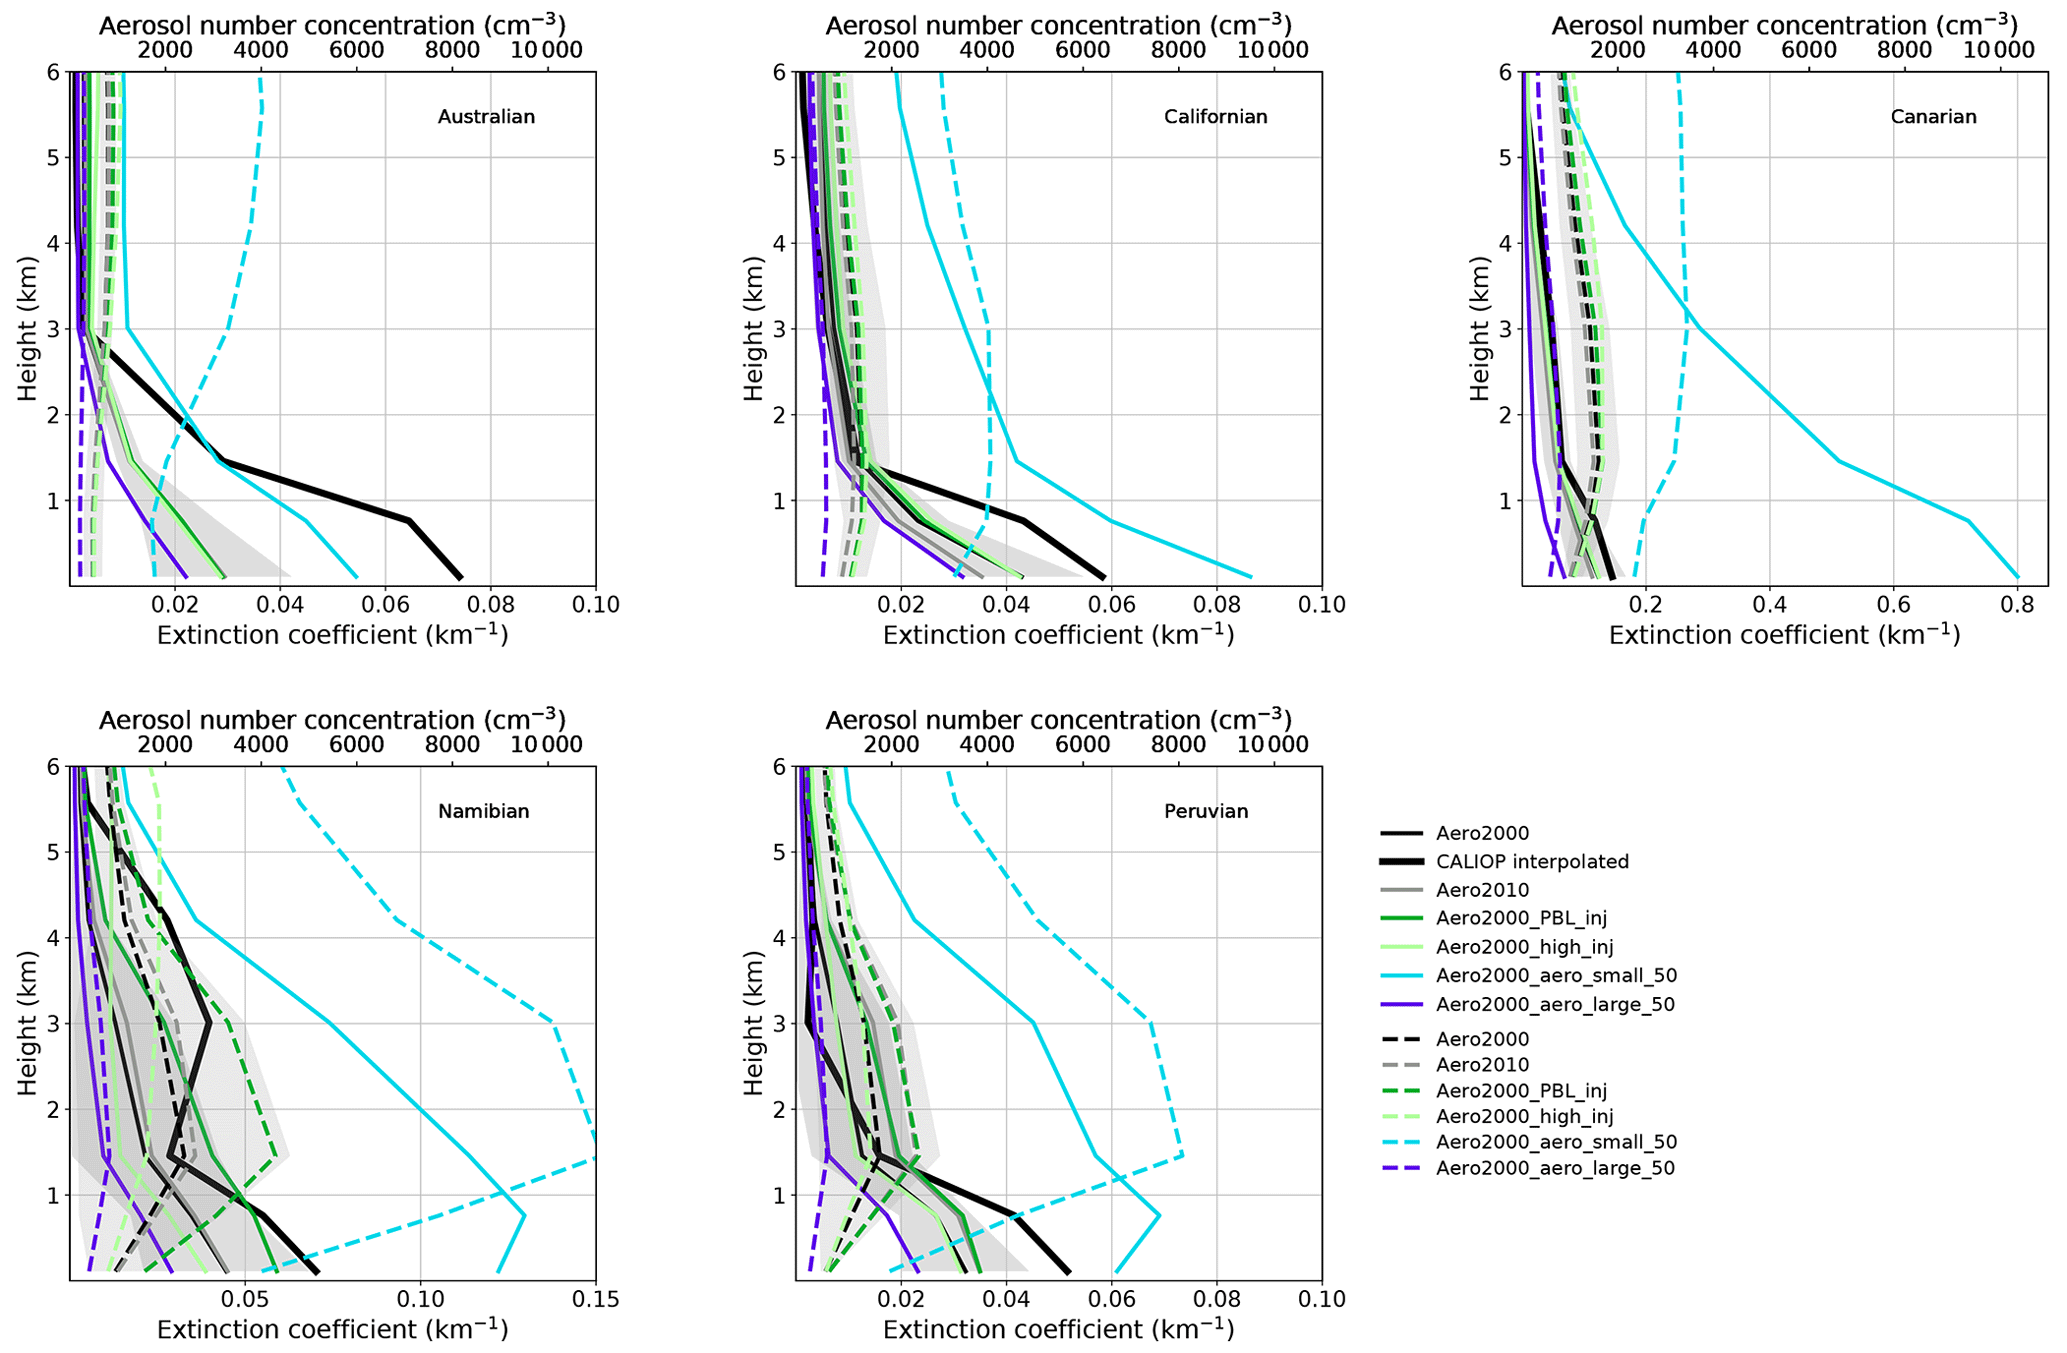
Figure 3Vertical distribution of the aerosol extinction coefficient (km−1; solid line) and aerosol number concentration (cm−3; dashed line) for the Australian, Californian, Canarian, Namibian, and Peruvian regions for the model control simulation and sensitivity experiments in the category emissions. The SD of the model control simulation is indicated as a grey shaded area.
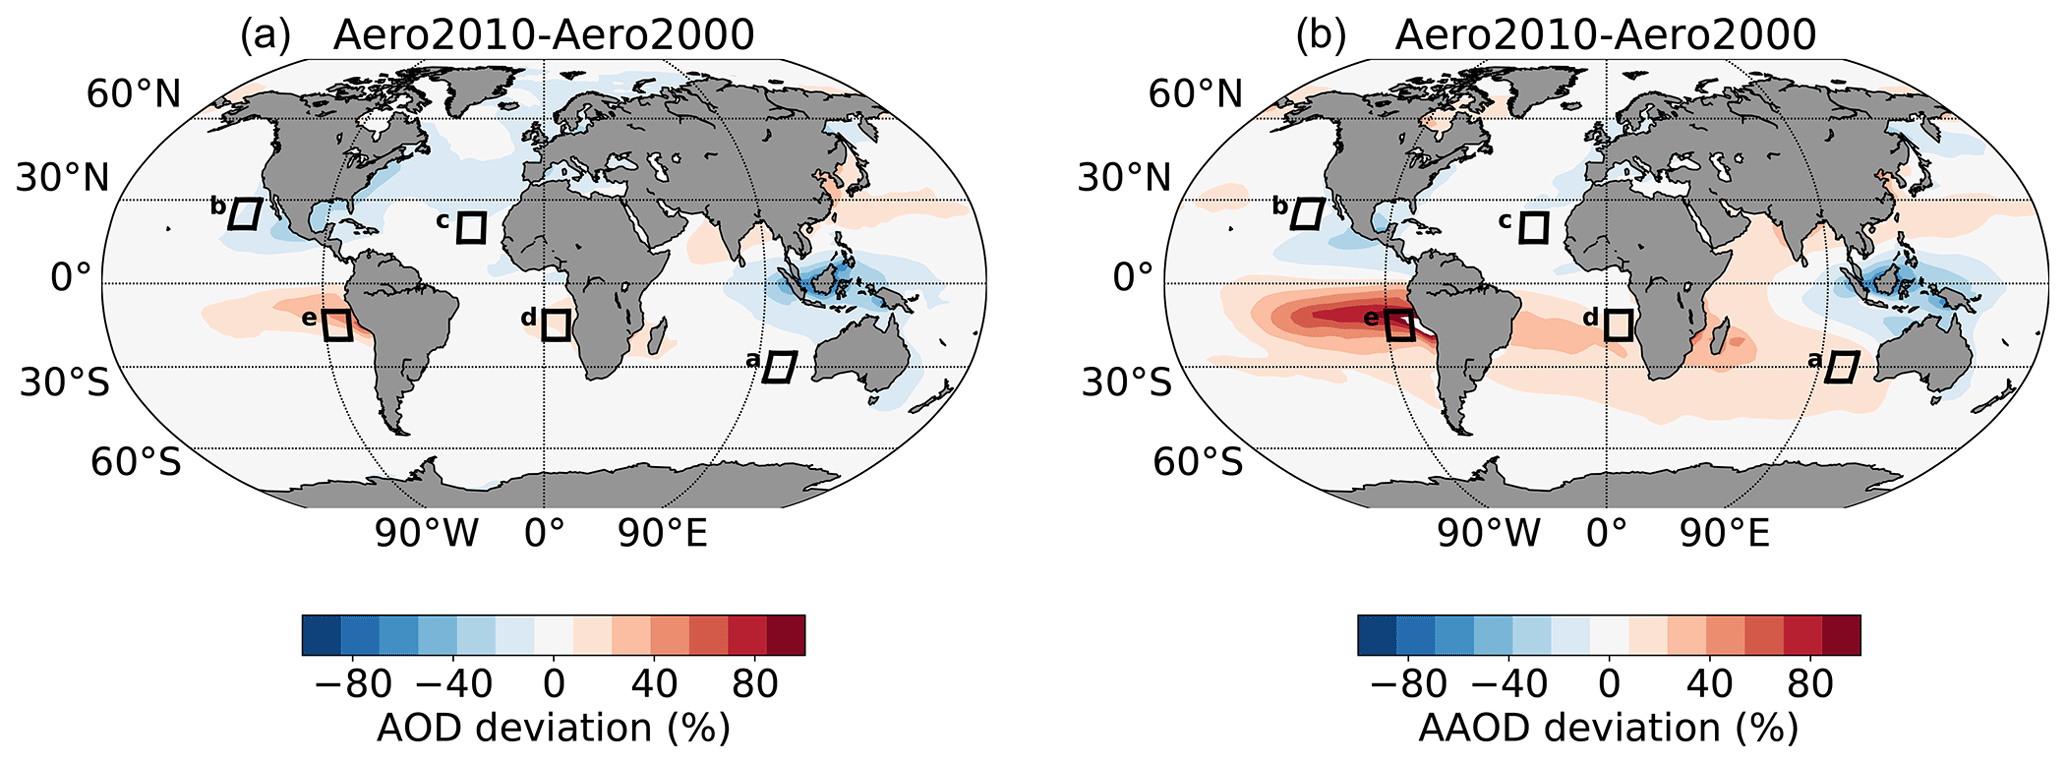
Figure 4Global distributions of differences in aerosol optical depth (a) and absorption aerosol optical depth (b) between the sensitivity simulation Aero2010 and the control simulation Aero2000. The boxes indicate the five regions of stratocumulus clouds – a: Australian, b: Californian, c: Canarian, d: Namibian, e: Peruvian.
The variation in injection height of biomass burning aerosols mainly affects, as expected, the two biomass burning regions, particularly the Namibian region. Inserting all biomass burning aerosols higher up in the free troposphere (Aero2000_high_inj) leads to a higher aerosol number concentration and extinction in the upper troposphere and a decrease in the lower troposphere (Fig. 3). Shifting the insertion to the surface (Aero2000_surface_inj) leads to a reduction in aerosol number and extinction throughout the troposphere (not shown). Choosing a uniform insertion over all emission levels (Aero2000_uniform_inj) leads to a similar distribution as in the control simulation, and only in the Canarian and Namibian regions does an increase in aerosol number and extinction occur above the boundary layer (not shown). Emitting all biomass burning aerosols in the boundary layer (Aero2000_PBL_inj) yields a significant increase in extinction throughout this layer and also above in the Namibian region, and it leads to an improved distribution compared to the observations. Nevertheless, the observed distribution with a local maximum extinction in the boundary layer cannot be reproduced by the model.
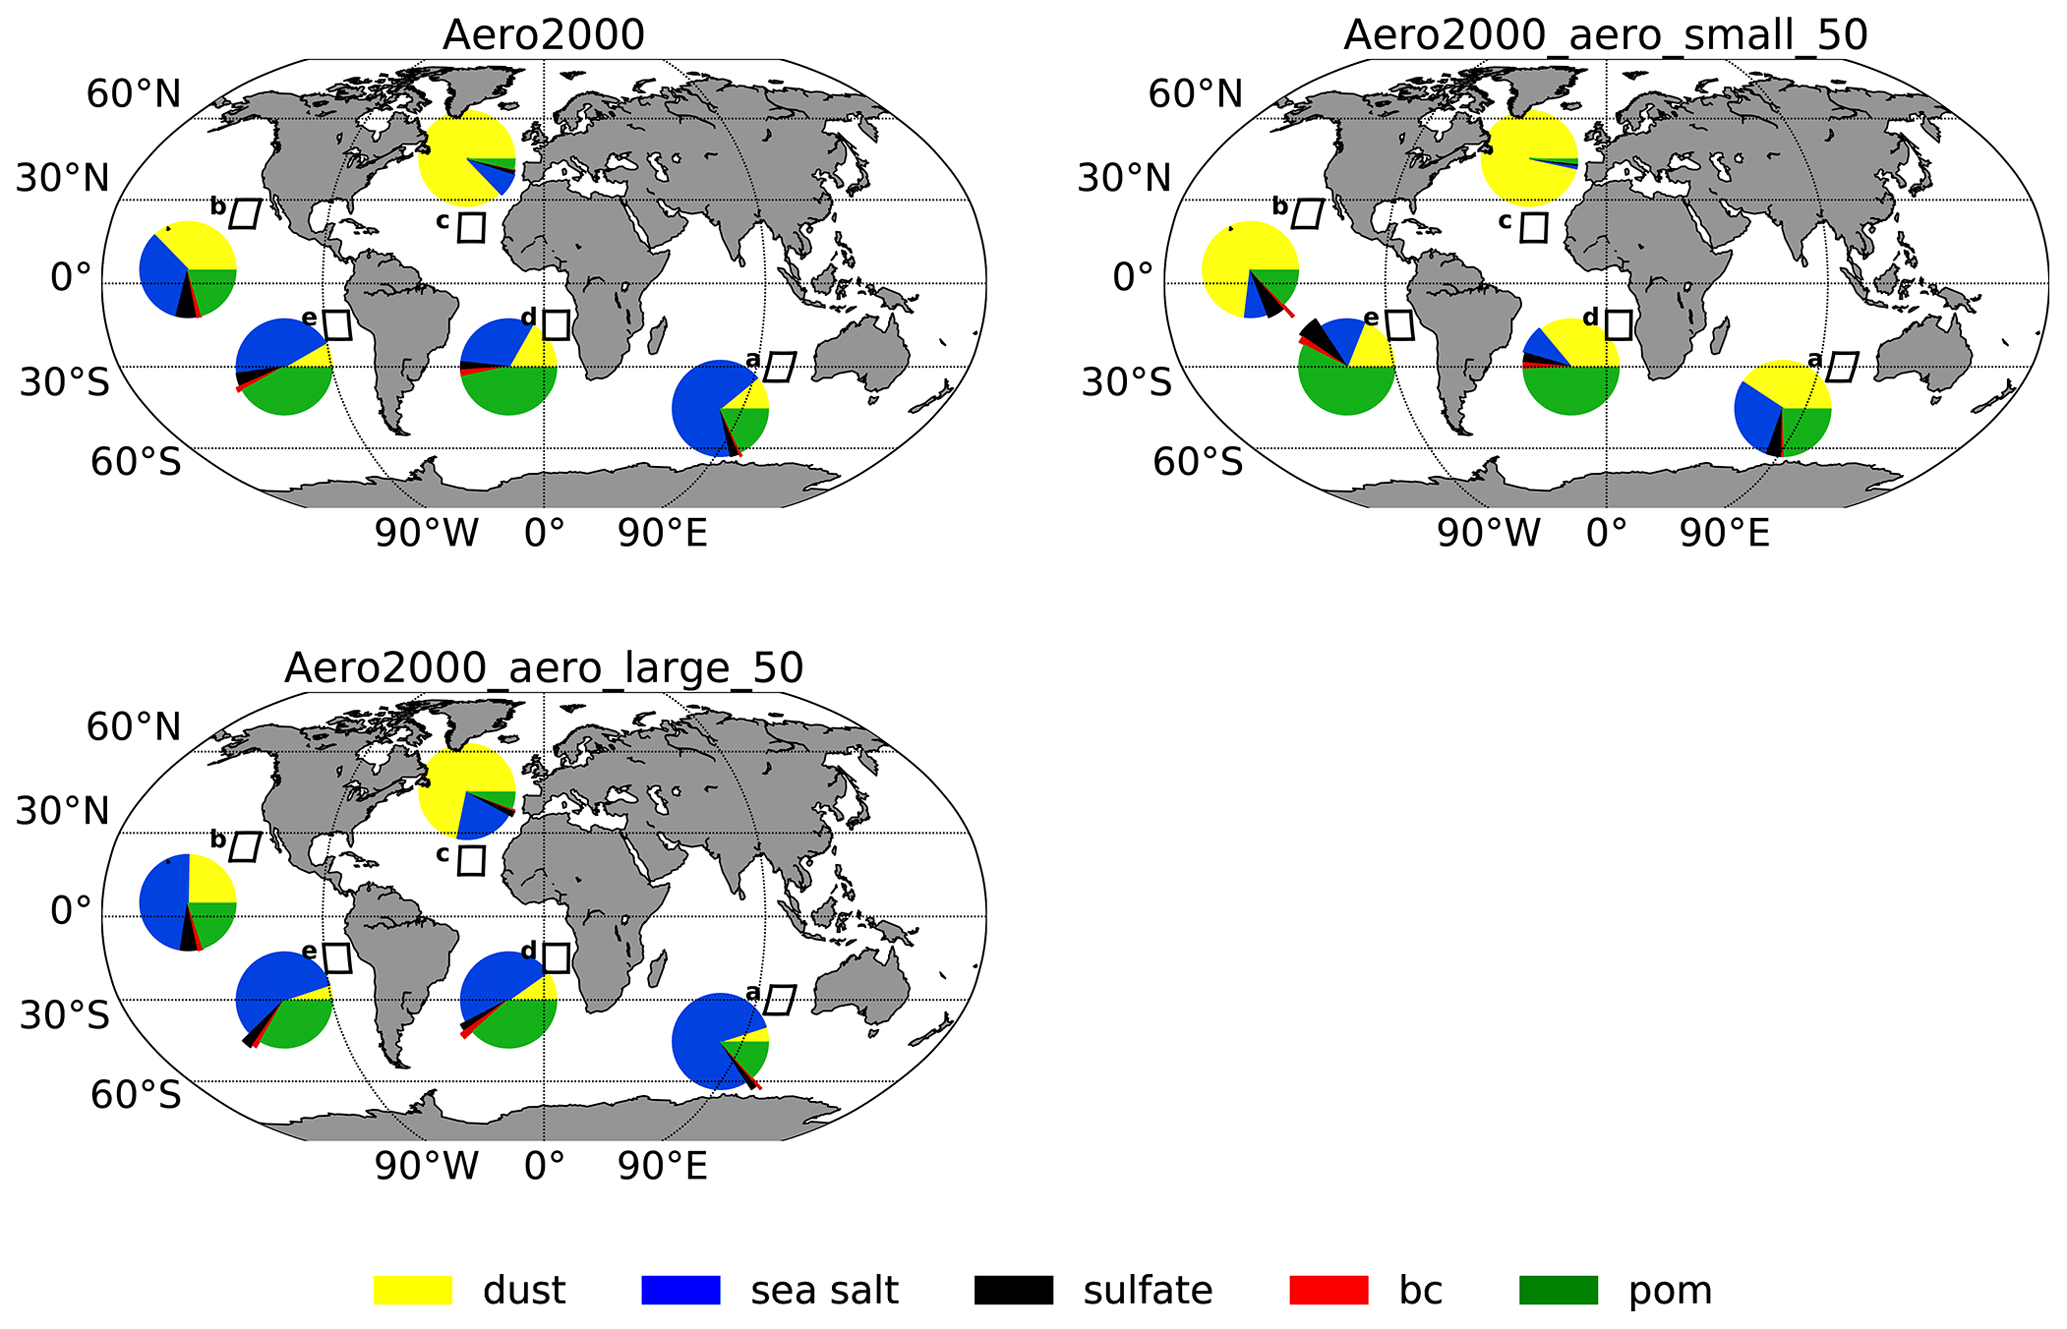
Figure 5The relative columnar burden contribution of each aerosol type to the total column burden in the simulations Aero2000, Aero2000_aero_large_50, and Aero2000_aero_small_50 in five regions of marine stratocumulus clouds. The boxes indicate the five regions of stratocumulus clouds – a: Australian, b: Californian, c: Canarian, d: Namibian, e: Peruvian. A shift in composition can be seen compared to the control simulation Aero2000.
All experiments, except the experiment with the use of an alternative emission data set (Aero2010), are mass-conservative; i.e., the same total aerosol mass was emitted. Hence, changing the size of primary emitted particles also leads to changes in aerosol numbers and the aerosol size distribution. Increasing the size (Aero2000_aero_large_50) shifts the distribution to larger but fewer particles and subsequently yields a decrease in aerosol extinction, with a strong response in the Canarian region. Decreasing the size of all particles (Aero2000_aero_small_50) leads to the opposite effect, with an increase in aerosol number concentration, especially in the Namibian and Peruvian regions, and an increased aerosol extinction up to 8 times higher than for the control simulation in the Canarian region (see Fig. 3). The increase in number concentration is more similar across regions and hence cannot explain the stronger increase in extinction in the Canarian region. As a consequence of the change in size distribution, the aerosol composition changes as well, as an effect of changes in the aerosol life cycle (e.g., removal processes). A comparison of the regional aerosol burden characteristic of the control experiment (Fig. 1) and the sensitivity experiments Aero2000_aero_small_50 and Aero2000_aero_large_50 (Fig. 5) shows an increase in the dust column burden in all regions subsequent to the decrease in size, since the smaller dust particles are less affected by gravitational settling. This increase in the dust column burden in turn yields an enhanced absorption and therefore higher extinction in the Canarian region. Furthermore, an increase in the column burden of biomass burning aerosols occurs in the Namibian and Peruvian regions. Similarly, increasing the size of particles shifts the composition towards a higher sea salt and lower dust burden in all regions (see Fig. 5).
In the Canarian, Peruvian, and Namibian regions a change in the shape of the vertical distribution can be noticed in response to the decrease in size, with a more pronounced maximum in aerosol extinction in the boundary layer.
4.3.2 Deposition
Turning off one of the removal processes leads in all cases to an increase in aerosol number concentration (see Fig. 6), but the effect is greatest when wet deposition is switched off (Aero2000_nowetdep). Changes in aerosol extinction and number due to turning off dry deposition are small and within the given uncertainty range of the control simulation (Aero2000_nodrydep). All aerosol species are affected by dry and wet deposition, but dry deposition is primarily important for particles in the coarse mode, like dust and sea salt. When dry deposition is reduced, the wet deposition increases in the model, and this shift between deposition mechanisms can explain the lack of sensitivity to turned-off dry deposition. Reduced wet deposition does not imply increased dry deposition due to the difference in aerosol sizes affected, and hence the sensitivity to turned-off wet deposition is greater.

Figure 6Vertical distribution of the aerosol extinction coefficient (km−1; solid line) and aerosol number concentration (cm−3; dashed line) for the Australian, Californian, Canarian, Namibian, and Peruvian regions for the model control simulation and sensitivity experiments in the category deposition. The SD of the model control simulation is indicated as a grey shaded area.
The dominant removal process of aerosols in the model is wet deposition, and in-cloud wet scavenging accounts for most of the total wet deposition (Aero2000_noscav_incloud). Hence, the experiments with no wet deposition and in-cloud scavenging give similar effects on the vertical aerosol distribution (see Fig. 6), while only little effect was found for switching off below-cloud scavenging (Aero2000_noscav_belowcloud, not shown). Altering the deposition influences not only the amount of aerosol, but also the shape of the vertical distribution. While the control simulation shows a steady decrease in aerosol extinction with height in the boundary layer, turning off wet deposition and in-cloud scavenging leads to an increase with height, with a maximum in the boundary layer similar to the observed distribution.
In the Californian region, the aerosol number concentration shows a small increase (within uncertainty) compared to the control simulation, and in the Canarian region a decrease in number in the boundary layer is even seen with no wet deposition, while the aerosol extinction shows a strong increase (see Fig. 6). This can be explained by a shift in aerosol composition and size resulting from alteration of the deposition sinks. Figure 7 shows the relative column burden contribution of the different aerosol types in the focus regions. The aerosol composition is shifted towards a higher burden of sulfate aerosol in all regions in response to switching off wet deposition. Furthermore, in the Australian, Namibian, and Peruvian regions the dust burden increases, while a decrease occurs in the Californian and Canarian regions. This shift in composition affects the extinction more than the changes in number concentration. Switching off dry deposition gives no significant shift in aerosol composition.
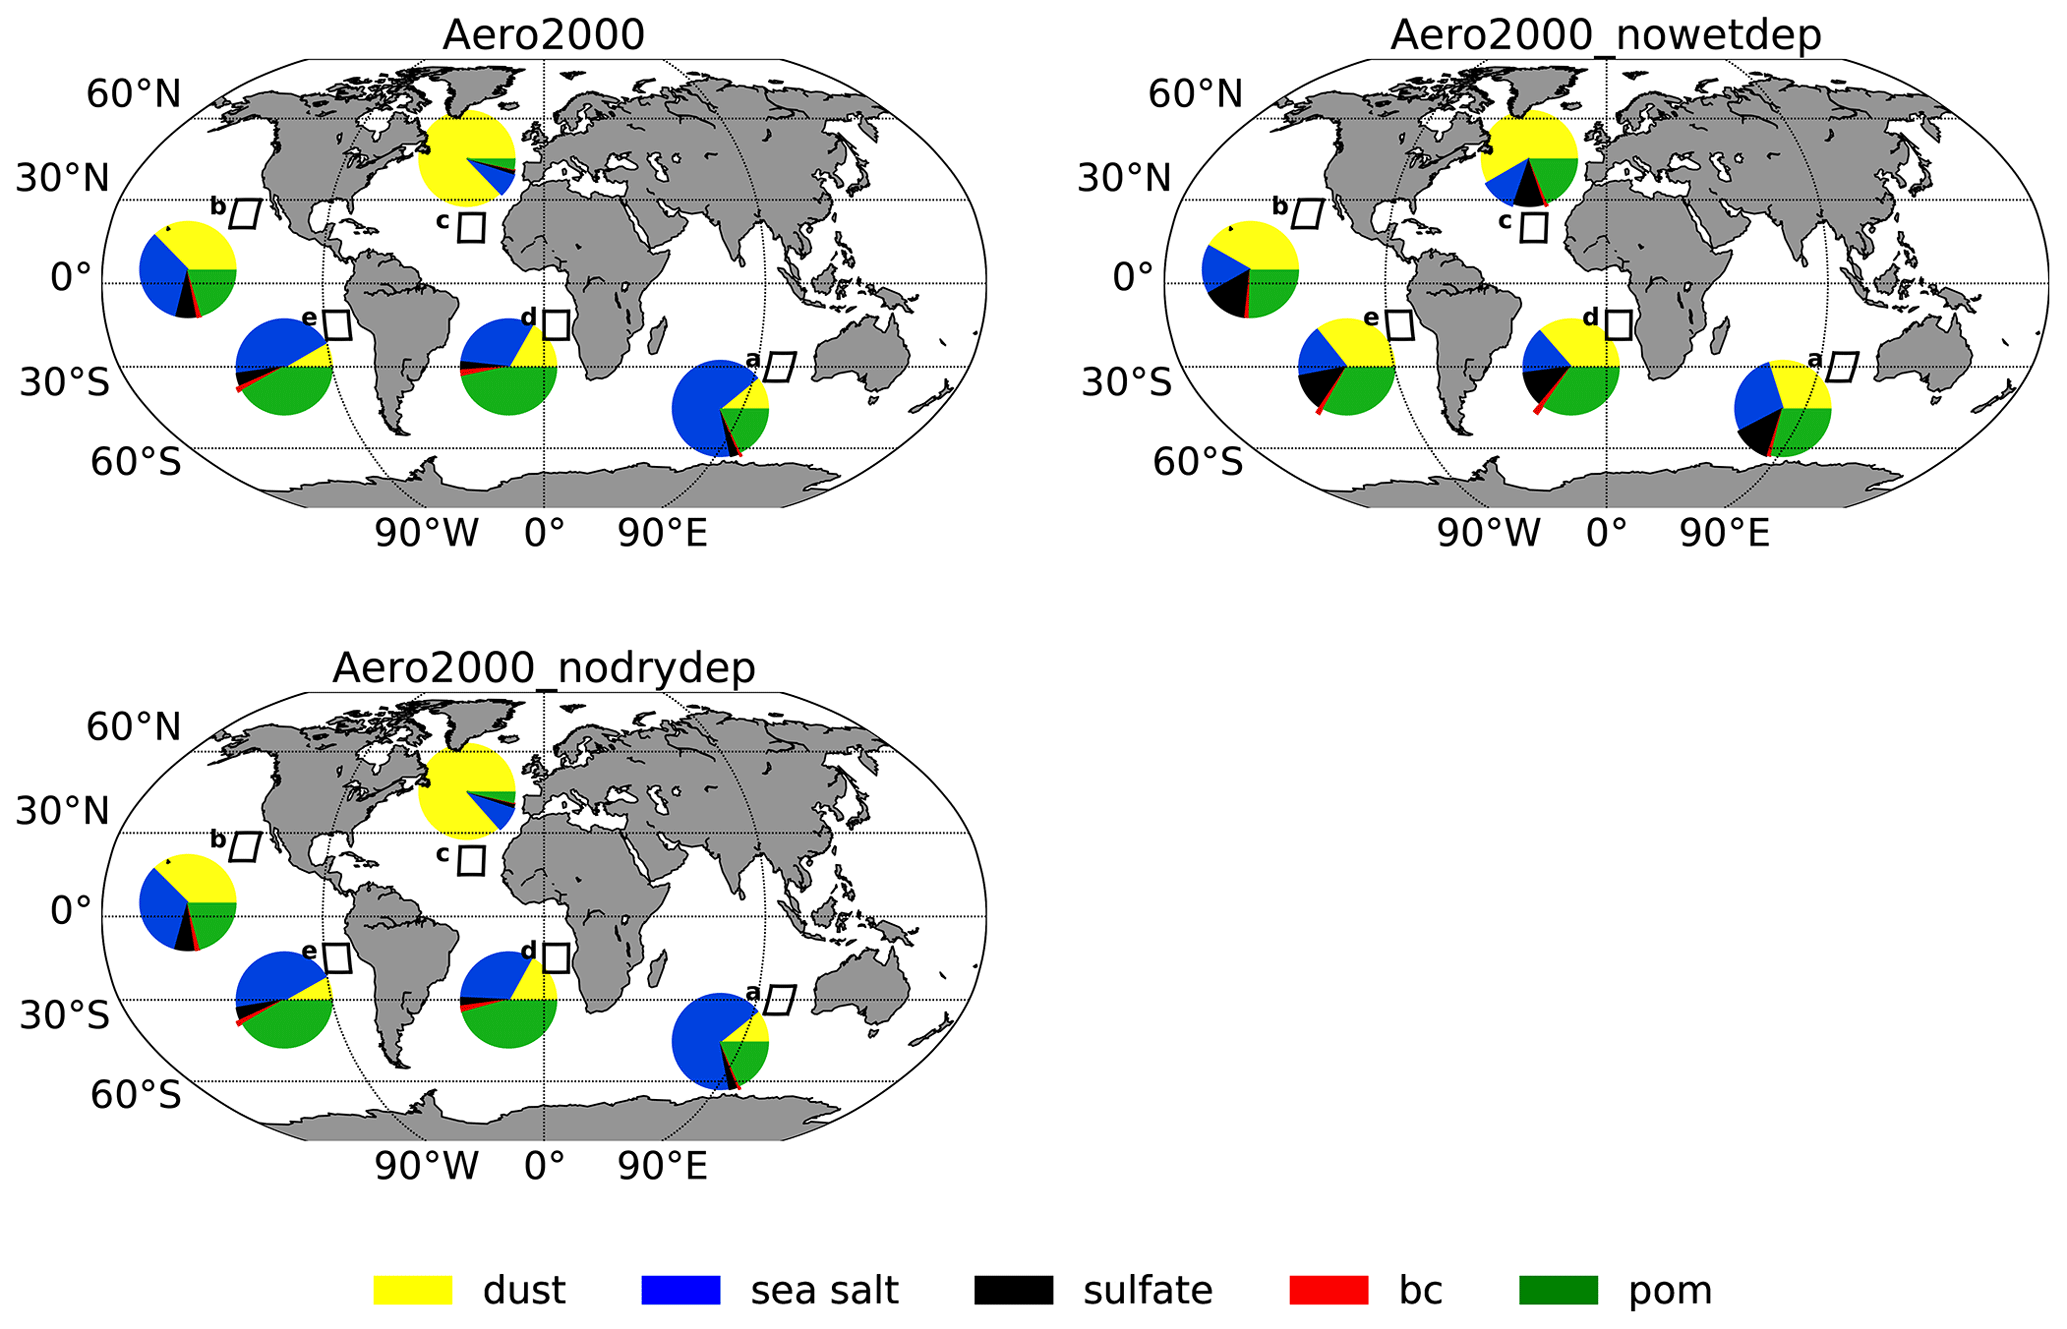
Figure 7The relative columnar burden contribution of each aerosol type to the total column burden in the simulations Aero2000, Aero2000_nodrydep, and Aero2000_nowetdep in five regions of marine stratocumulus clouds. The boxes indicate the five regions of stratocumulus clouds – a: Australian, b: Californian, c: Canarian, d: Namibian, e: Peruvian.
4.3.3 Vertical transport
The modified convective scheme (Aero2000_convmix) results in a small decrease in aerosol number concentration and extinction within the uncertainty throughout the troposphere in the focus regions (see Fig. 8).
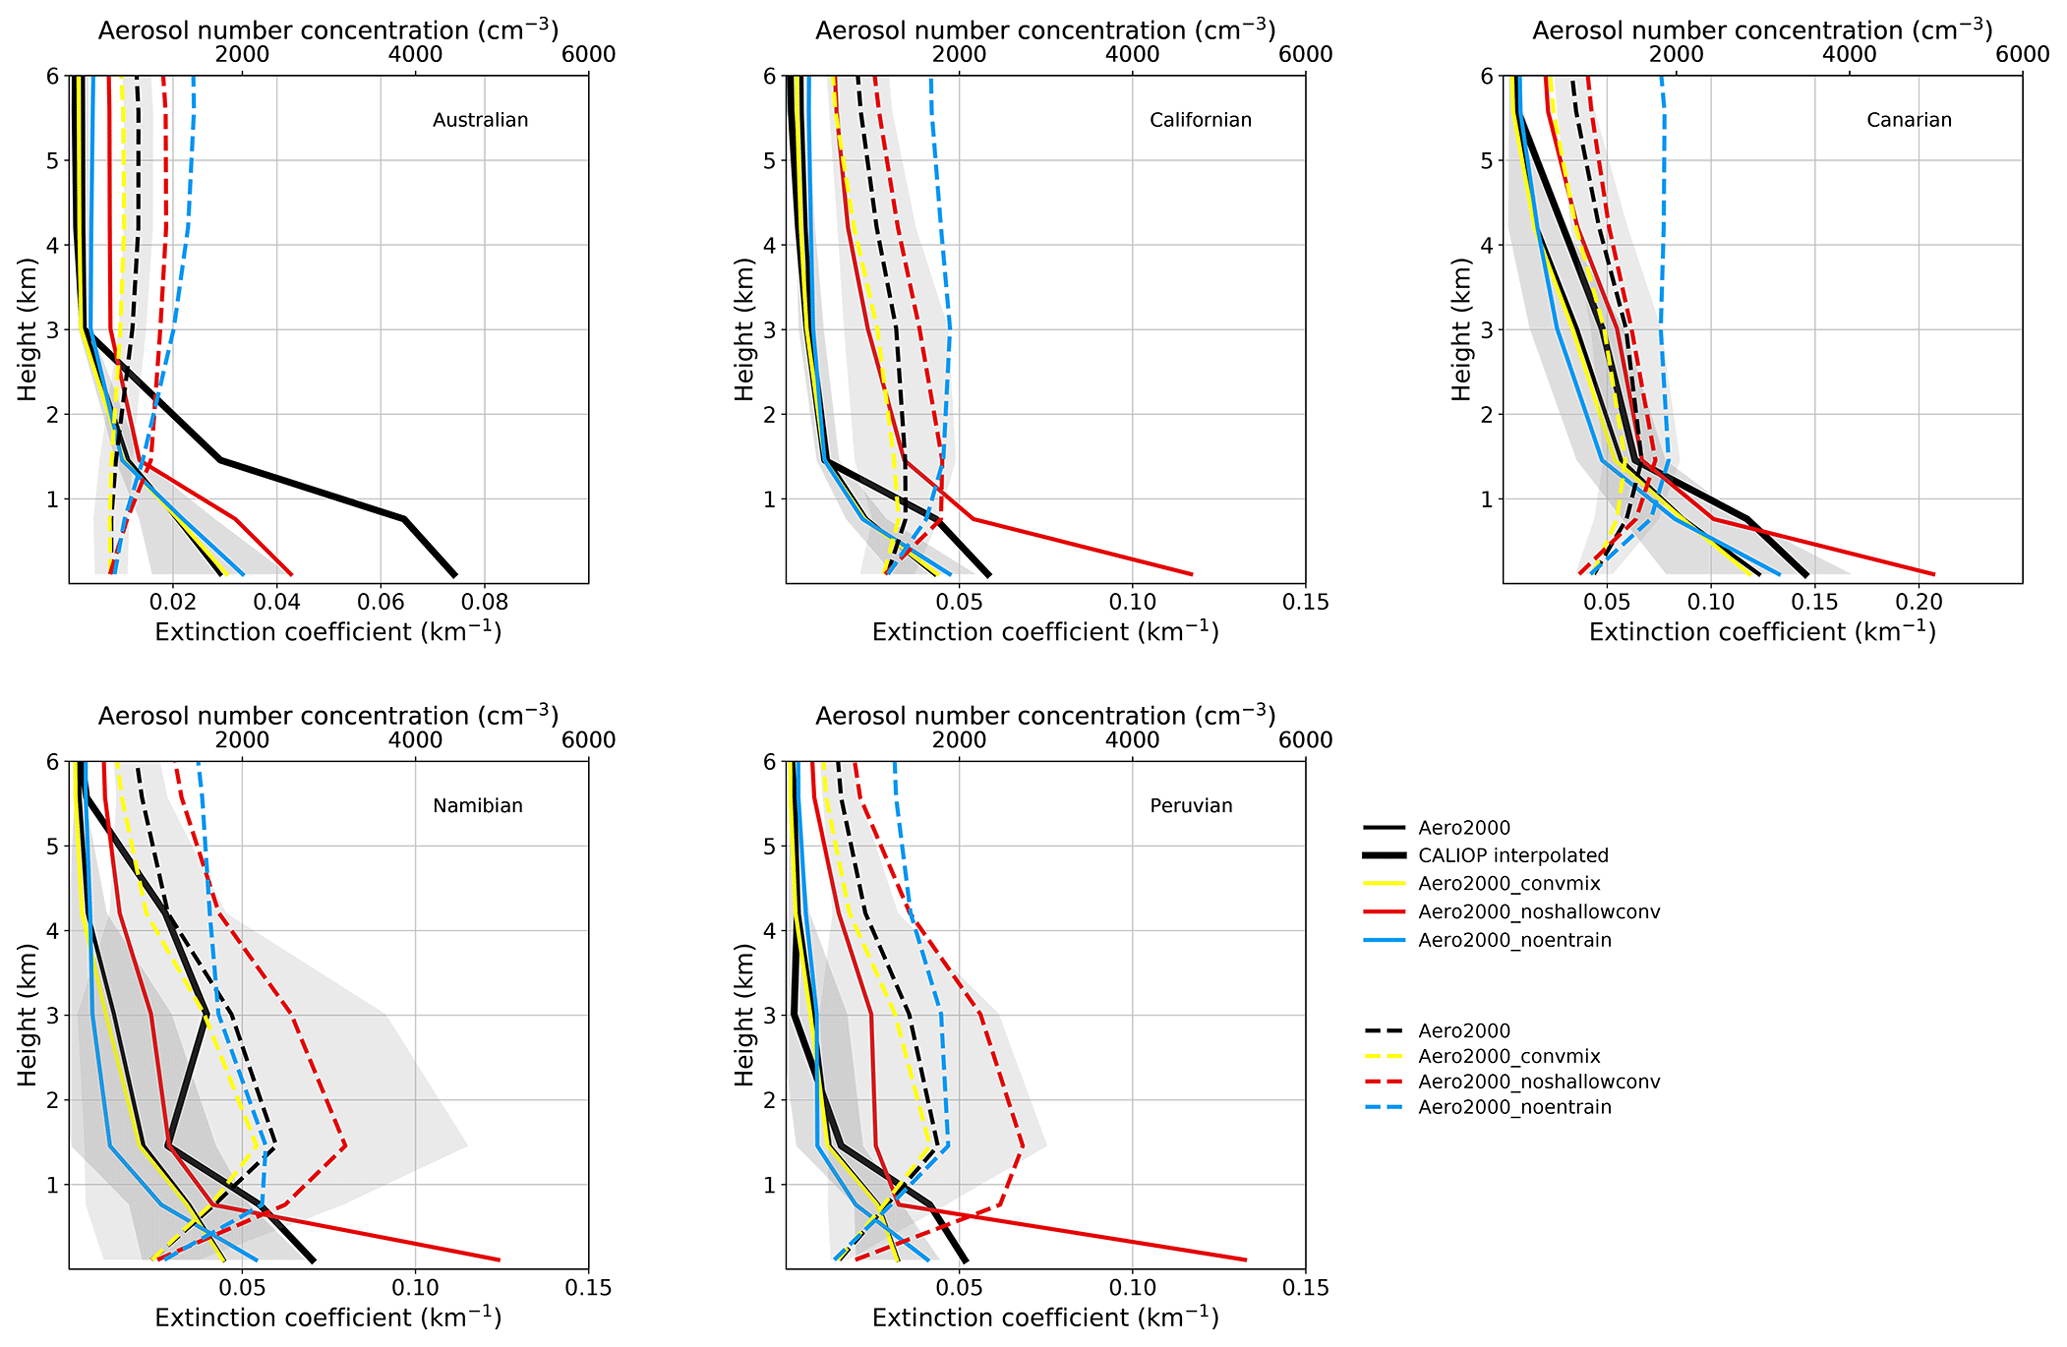
Figure 8Vertical distribution of the aerosol extinction coefficient (km−1; solid line) and aerosol number concentration (cm−3; dashed line) for the Australian, Californian, Canarian, Namibian, and Peruvian regions for the model control simulation and sensitivity experiments in the category transport. The SD of the model control simulation is indicated as a grey shaded area.
When turning off shallow convection, aerosols remain closer to the surface, leading to a strong increase in aerosol number and extinction in all regions at all heights compared to the control simulation (Aero2000_noshallowconv). Resulting changes in aerosol extinction are thereby beyond the ±1 SD uncertainty range of the control simulation in all regions (see Fig. 8).
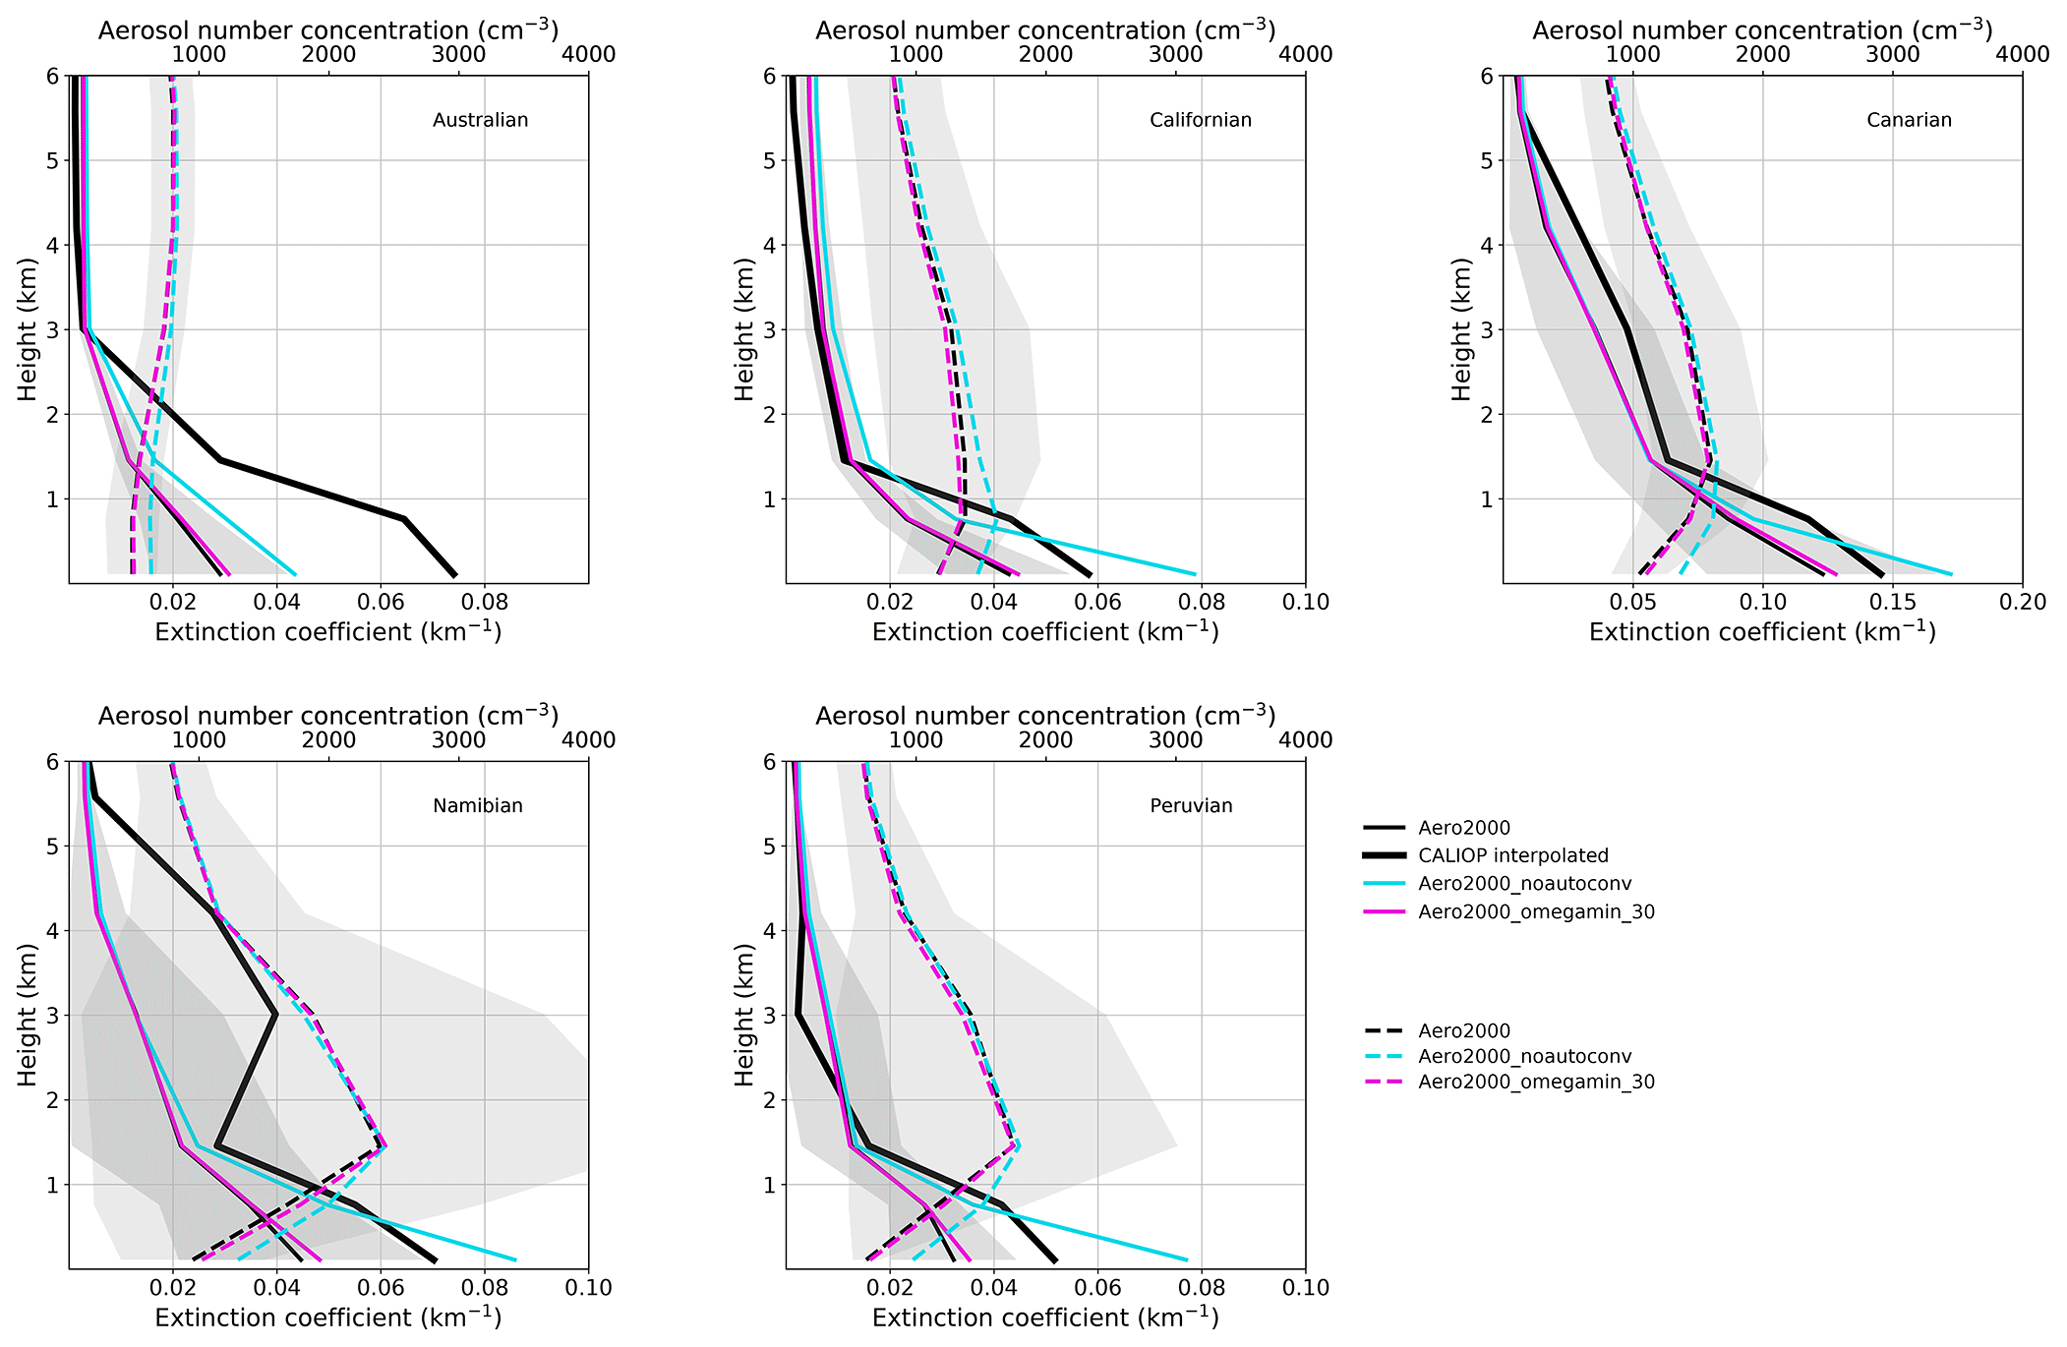
Figure 9Vertical distribution of the aerosol extinction coefficient (km−1; solid line) and aerosol number concentration (cm−3; dashed line) for the Australian, Californian, Canarian, Namibian, and Peruvian regions for the model control simulation and sensitivity experiments in the category microphysics. The SD of the model control simulation is indicated as a grey shaded area.
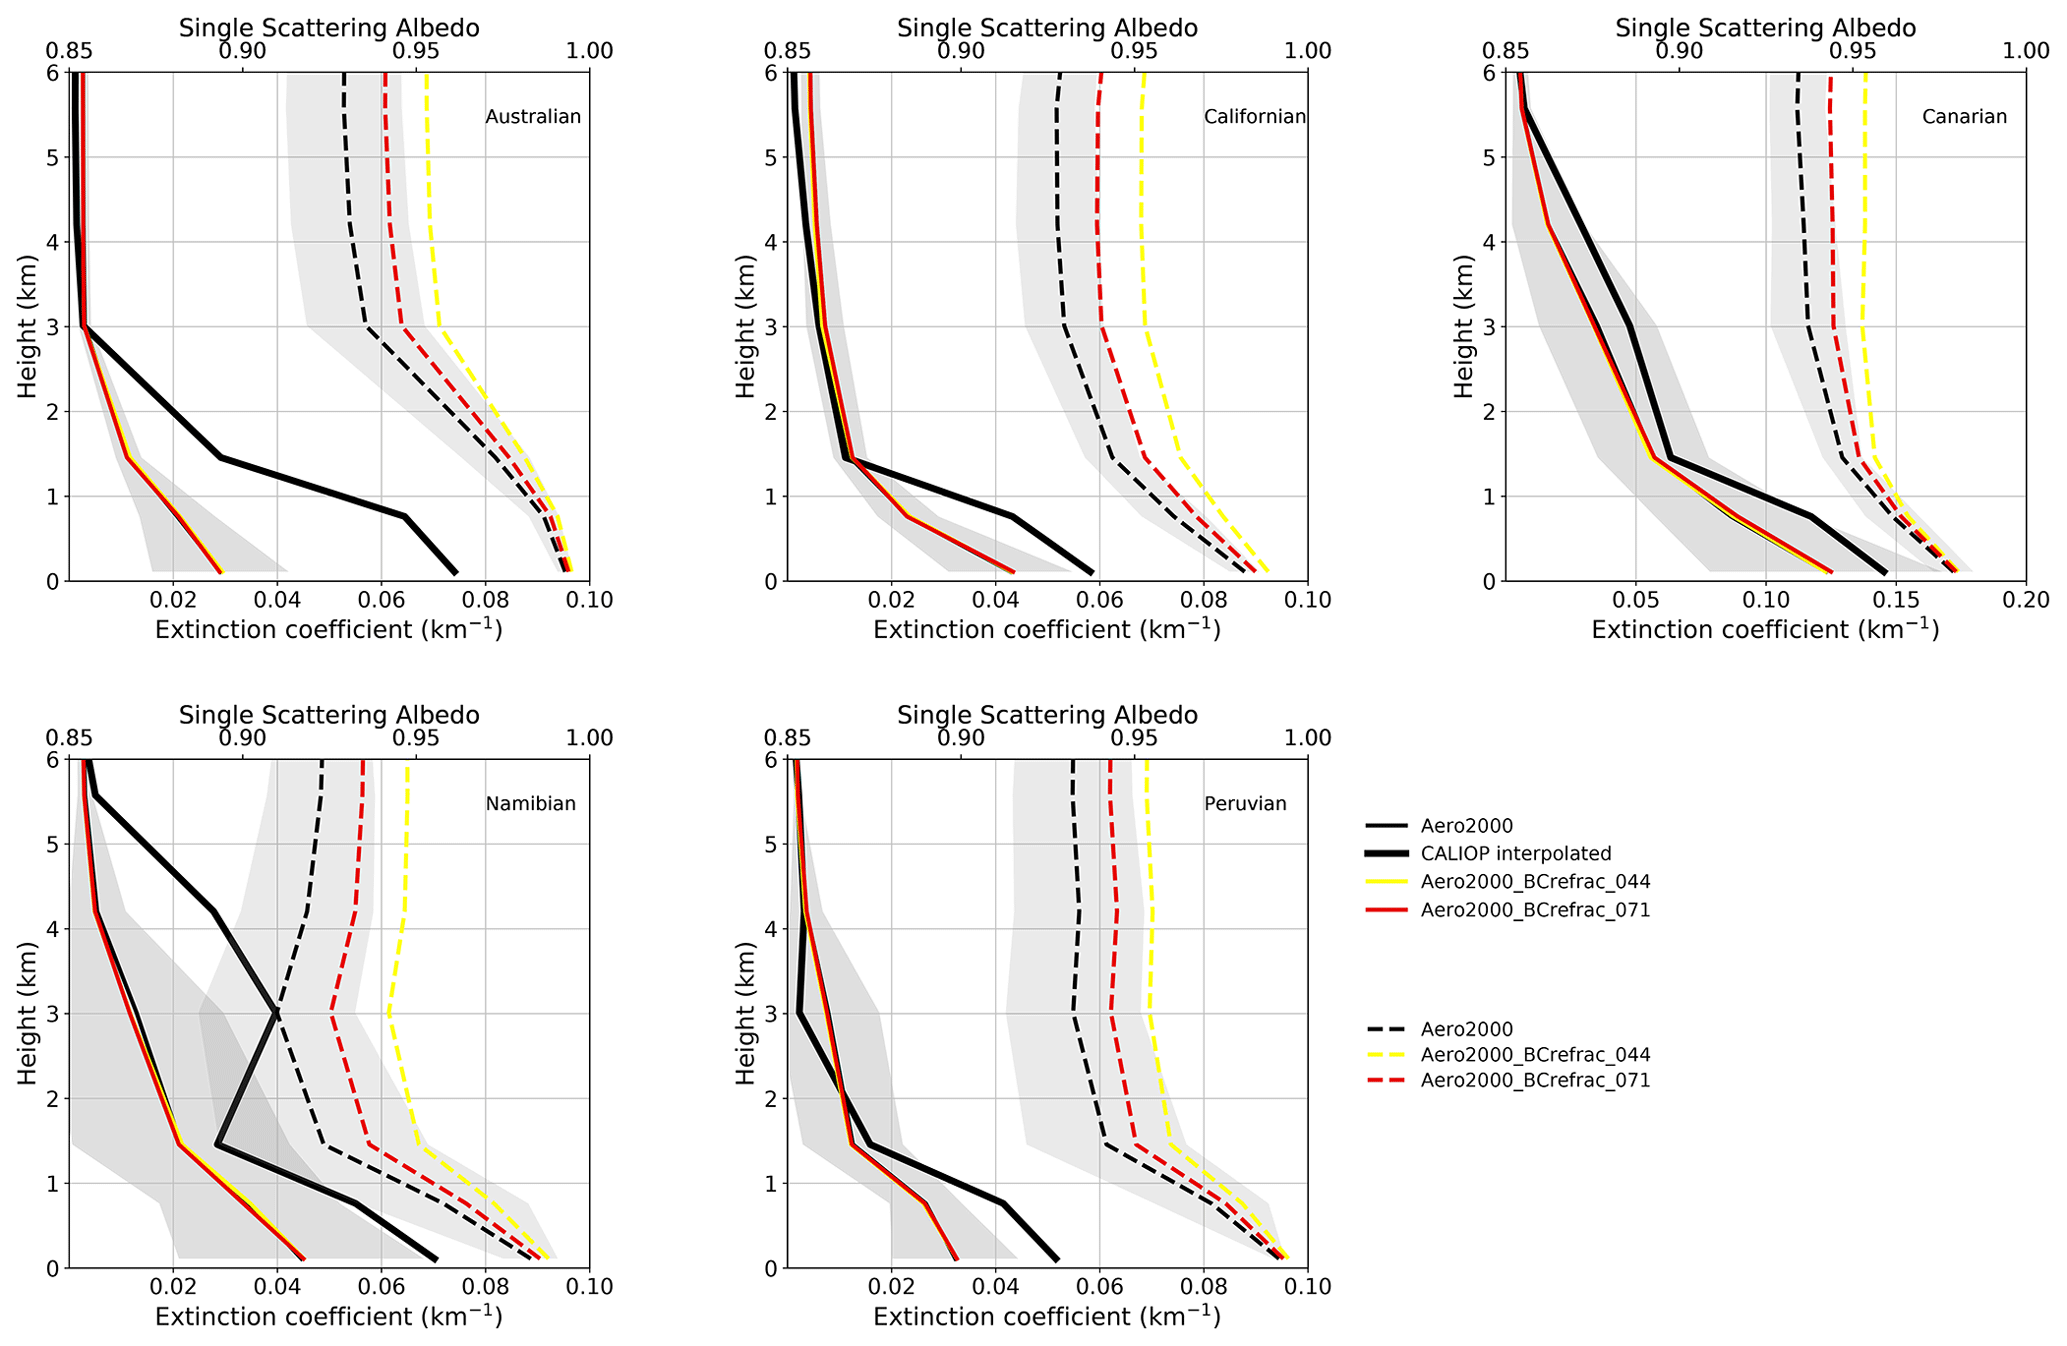
Figure 10Vertical distribution of the aerosol extinction coefficient (km−1; solid line) and single-scattering albedo (SSA; dashed line) for the Australian, Californian, Canarian, Namibian, and Peruvian regions for the model control simulation and sensitivity experiments in the category aerosol optical properties. The SD of the model control simulation is indicated as a grey shaded area.
Switching off entrainment for convective clouds (Aero2000_noentrain; see Fig. 8) leads to an increase in aerosol number but a decrease or no change in extinction, especially in the biomass burning regions.
4.3.4 Microphysics
The effect of varying several autoconversion-related parameters is shown in Fig. 10. The chosen processes on the microphysical scale have only a weak impact on aerosol extinction and number concentration, with changes within the uncertainties of the control simulation (not shown here are Aero2000_rcrit_autoconv_5 and Aero2000_precip_autoconv_1). Only the extreme scenario with no autoconversion in warm clouds (Aero2000_noautoconv), i.e., no precipitating warm clouds, leads to an increase in aerosol extinction that reaches beyond the given uncertainty range in the lower troposphere in all regions. The increase in extinction is due to a decrease in wet deposition of particles. The shape of the vertical distribution is not notably affected by the changes in this subset of microphysical processes (see Fig. 9).
4.3.5 Aerosol optical properties
Decreasing the default value of the imaginary part of the refractive index from 1.0 to values of 0.44 (Aero2000_BCrefrac_044) and 0.71 (Aero2000_BCrefrac_071) makes BC more reflecting. This does not affect the aerosol number concentration, and Fig. 10 shows the single-scattering albedo (SSA; i.e., the fraction of extinction that is due to scattering) together with the total extinction to illustrate the effects of the change in BC optical properties. The SSA shows an increase in both experiments, i.e., a higher fraction of reflection, as expected. The changes in aerosol extinction are, however, small and within the uncertainty of the control experiment. The change in BC reflectivity seems to have the same influence on the total aerosol extinction as the high BC absorptivity in the control simulation.
Discrepancies between the control simulation and CALIOP satellite data were found in all focus regions with regard to the total aerosol extinction and shape of the vertical distribution. In particular, the model underestimates the absolute values of aerosol extinction, showing a steady decrease from the surface, while observations indicate a maximum in the boundary layer. An adaptation of the CALIOP vertical resolution to the equivalent model resolution gives better agreement. The maximum in the boundary layer is not captured with a coarser, model-like vertical resolution for CALIOP. This emphasizes the importance of the vertical resolution to resolve mixing and transport processes in the lower troposphere. Also, increased model diffusion at lower model resolution might play a role. However, the model also underestimates aerosol extinction of elevated aerosol layers seen in two regions in the observations even if compared to the adapted CALIOP resolution.
It is also worth noting that while the observations are taken from the period 2007–2016, the emissions used in the model simulations (except in the Aero2010 experiment) are for the year 2000, and year-to-year variability in aerosol emissions may contribute to discrepancies between observed and modeled vertical profiles.
The sensitivity experiments performed suggest that the alterations that have the largest impact on the aerosol vertical profiles are found in the categories emissions, deposition, and vertical transport, whereas changes in the categories microphysics and aerosol optical properties have less of an effect. However, none of the chosen alterations of parameters and processes affecting the vertical distribution of aerosol extinction in the model are sufficient to reproduce the observed distribution. For instance, the emission height of biomass burning aerosols directly influences the aerosol vertical profile. This is despite the alterations in many cases going beyond what might be considered a realistic range, i.e., by turning processes off completely (e.g., in the case of wet deposition and autoconversion) or choosing extreme parameter values (e.g., in the case of vertical velocity). One example of a modification that does affect the vertical profile towards better agreement with observations in the Namibian region is the emission height of biomass burning. Inserting these absorbing aerosols above or within the boundary layer leads to increased aerosol extinction above the boundary layer, as expected. Biomass burning aerosol injection at the surface only, or uniformly in height, has less of an effect on the vertical profile, in agreement with Kipling et al. (2016).
The choice of the aerosol emission inventory was also found to be important for determining the magnitude of total vertically integrated aerosol extinction, in agreement with the findings of Kirkevåg et al. (2013). By choosing aerosol emissions for the year 2010 a higher extinction and subsequently a higher AOD was produced, especially in biomass-burning-dominated areas. Considering the small interannual variability in biomass burning aerosol emissions from the main burning regions found by Giglio et al. (2010), the differences between the two emission data sets are more likely related to differences in resolution and data collection than to interannual variability. As discussed in Giglio et al. (2010) and van der Werf et al. (2010), emissions in GFED3 have increased compared to GFED2 due to an improved mapping approach of burned areas using MODIS and a higher resolution of 0.5∘ compared to GFED2 with 1∘ resolution. Previous studies have also pointed at the importance of the spatial (Possner et al., 2016) and temporal resolution (Dentener et al., 2006) of aerosol emissions.
In terms of the vertical aerosol distribution, the updated emission data set leads to only a small change within the uncertainty range of the control simulation. Kipling et al. (2013) similarly showed that using GFED3 instead of GFED2 biomass burning emissions leads to only a moderate improvement of the vertical BC distribution compared to observations, without statistical significance.
Another important factor that can control the vertical distribution of aerosol is the size of emitted aerosol particles. The sensitivity experiments performed are mass-conservative, except the experiment with an alternative emission data set, meaning that changes in emission particle sizes lead to a shift in the entire size and number distribution. Here we find that the shape of the vertical distribution in the model is highly sensitive to the size of emitted particles. Decreasing the size results in more numerous smaller particles and produces a maximum in aerosol extinction in the boundary layer in the Canarian, Namibian, and Peruvian regions. This is not only an effect of changes in aerosol number concentration and size distribution, but also of the resulting shift in aerosol composition produced by the model in response to the change in size distribution.
Large responses were also seen in the sensitivity experiments focusing on removal processes, particularly for the cases of altered wet deposition. Dry deposition mainly affects larger particles, and cutting this sink off leads to a small decrease in extinction throughout the vertical column, except in the Peruvian region. An additional reason for the small effect of reducing dry deposition is that this shifts the aerosol removal to wet deposition, which increases accordingly. Hence, the small sensitivity of aerosol extinction and number to turned-off dry deposition is not necessarily an indication that this process is not relevant, but rather that changes are compensated for by other processes. Wet deposition, on the other hand, affects all particles and is the major removal process for aerosol particles in the model. Cutting off this removal pathway leads to a large increase in extinction and a modified shape of the vertical distribution. In-cloud scavenging contributes more than below-cloud scavenging to the total wet deposition, and hence turning off in-cloud scavenging has similar effects as turning off wet deposition completely, while turning off below-cloud scavenging has little effect, in agreement with Kipling et al. (2016) and Vignati et al. (2010). Hence, the representation of wet deposition is important for the vertical aerosol distribution in the model, in agreement with the findings of Vignati et al. (2010), Croft et al. (2009, 2010), and Kipling et al. (2013). Changes in the removal processes also affect the aerosol composition in the model. Inhibited wet deposition increases the amount of sulfate, BC, and OM, as this is the main removal process for these aerosol types, but decreases the relative amount of dust, which is less affected by this removal process. The smaller portion of wet deposition that is due to below-cloud scavenging also affects composition but is less efficient for Aitken- and accumulation-mode particles, a size range in which, e.g., BC is found.
Kipling et al. (2013) discussed the coupling between wet scavenging and convective transport as well as its importance for the representation of the vertical aerosol distribution by comparing HadGEM-UKCA with ECAHM5-HAM2 and with observations. The in-plume approach, with wet scavenging directly linked to the convective scheme, implemented in NorESM1-M is in line with the recommendations in Kipling et al. (2013).
Turning off either of the convective schemes, shallow or deep convection, does not switch off convective transport of aerosols completely; i.e., switching off shallow convection still allows deep convection and vice versa. However, the complete inhibition of the shallow convective scheme largely affects the aerosol distribution. Without the shallow convection scheme, i.e., allowing only deep convection, the shape of the vertical distribution changes, with a more pronounced increase close to the surface. Particles remain closer to the surface as they cannot be lifted higher, leading to an increase in aerosol number concentration and extinction, especially in the boundary layer. Hence, shallow convection in the model is essential for transporting aerosols to the middle troposphere in the focus regions, consistent with Kipling et al. (2016), who showed that vertical transport of aerosol on the global scale is dominated by convective processes on unresolved scales. Hoyle et al. (2011) further highlighted the importance of the parameterization of convective processes for tracers with a short lifetime. Another important transport process for aerosols is entrainment, and cutting off this mixing for convective clouds results in a decrease in extinction in the boundary layer and an increase in the upper troposphere in the biomass burning regions. However, the entrainment particularly controls the amount of aerosol above the boundary layer and is crucial for the formation of cloud droplets via provision of CCN. Entrainment can have a strong effect on the characteristics of parameterized convective clouds (see, e.g., Labbouz et al., 2018).
Microphysical processes, though linked to wet removal processes, have less of an impact on the vertical aerosol distribution. Altering the process of autoconversion results only in small changes in aerosol number and extinction, and only the extreme scenario of switching off autoconversion completely in warm clouds leads to a significant increase in aerosol number and extinction in the boundary layer. However, autoconversion and the subgrid vertical velocity are important processes in the model regarding cloud properties. Previous studies pointed at the importance of the autoconversion parameterization for aerosol indirect effects (e.g., Rotstayn and Liu, 2005; Golaz et al., 2011) and the representation of the cloud lifetime effect in models (Michibata and Takemura, 2015). White et al. (2017) further showed that the difference between microphysics schemes (and their autoconversion in particular) can be greater than the non-albedo aerosol indirect effects. Also, the importance of the subgrid variability of the vertical velocity when estimating aerosol indirect effects was highlighted (Golaz et al., 2011), and West et al. (2014) demonstrated the importance of subgrid vertical velocity variability in another model.
Finally, turning to optical properties, our results indicate that they have little impact on the vertical aerosol profile. Peers et al. (2016) point at aerosol above clouds in climate models as being underestimated in amount but too reflective. They found an improved representation of model output compared to satellite observations for climate models with an imaginary part of the refractive index of 0.71 compared to models with a lower value of 0.44. The refractive index was defined therein at a wavelength of 0.55 µm. NorESM1-M has a high default refractive index for pure BC with a value of 1.0 so that BC is prescribed as fully absorbing for the entire visible spectrum.
In contrast to other models, however, BC can be internally mixed and coated, thereby becoming more reflective. A decrease in the refractive index causes almost no change in the extinction coefficient. The SSA, on the other hand, is increased as expected. Hence, while Peers et al. (2016) found that climate models underestimate absorption by aerosol above clouds, primarily due to the properties of BC, our results indicate that for NorESM1-M it is the aerosol amount rather than the optical properties of pure BC that determines the aerosol extinction above clouds.
In this study the sensitivity of the climate model NorESM1-M to changes in processes affecting the vertical aerosol distribution was studied, focusing on five regions of subtropical marine stratocumulus clouds.
To evaluate the model performance, a control simulation was compared with satellite-borne lidar observations from CALIOP. The magnitude of aerosol extinction is underestimated in the model and displays a differently shaped vertical distribution. Discrepancies are of similar magnitude as those found for other models (see Koffi et al., 2016), and the main difference in shape is the lack of a local maximum in aerosol extinction in the boundary layer, which is also a common feature among many previously investigated models. The model also underestimates the aerosol extinction of elevated aerosol layers above the boundary layer, as seen in observations in two of the studied regions.
None of the alterations made here were sufficient for reproducing the observed aerosol extinction, but better agreement between observations and the model in terms of the shape of distribution in the boundary layer was found by interpolating the vertical resolution of observations to the model levels. This highlights the importance of the vertical model resolution to capture aerosol processes, especially in the boundary layer. Observed local extinction maxima above the boundary layer appear in observations with both original and reduced vertical resolution, indicating that the model resolution does not restrict the representation of aerosol layers above clouds.
Among the categories in which sensitivity experiments are performed, the largest impact on the vertical distribution of aerosol extinction is found to result from alterations to emissions, deposition, and vertical transport and less from microphysics and aerosol optical properties. In this sense, the presented results show general agreement with Kipling et al. (2016), who conducted similar sensitivity experiments using a different model and focusing on the global mean. In particular, for our model the parameters and processes found to have the greatest effect on the shape of the vertical aerosol distribution in the dynamical regime studied are the altitude of emissions and size of emitted particles, as well as the representation of shallow convection, entrainment, and wet scavenging.
By emitting all biomass burning aerosol at the highest injection level or within the boundary layer in the model, an increase in aerosol extinction above the boundary layer can be produced but is still underestimated compared to the local maxima seen in observations in two regions. Emitting aerosol at higher altitude or within the boundary layer is the most efficient way of increasing extinction above cloud level, which highlights the importance of mixing processes in the boundary layer.
The shallow convection scheme is also important for transporting aerosols up from the boundary layer, and by switching off shallow convection, the aerosol extinction increases in the boundary layer. However, the resulting profile has an increase in aerosol extinction towards the surface that is much too strong compared to observations and does not indicate improved agreement with the observed shape compared to the control experiment.
Turning off in-cloud scavenging leads to a maximum in aerosol extinction in the boundary layer, in qualitative agreement with observations. Similar changes in vertical aerosol distribution are seen when the size of emitted particles is reduced. This qualitative improvement of the modeled aerosol profile suggests that wet scavenging might be too efficient in the model and that the emission size distribution may be shifted towards particles that are too large.
With a focus on a specific dynamic regime, our sensitivity experiments indicate which processes have the greatest potential to influence the vertical distribution of aerosol in NorESM1-M, finding general agreement with previous studies based on other models. Our results support and give guidance for further improvement of the representation of aerosol distribution and thereby aerosol–cloud interactions in this and other state-of-the-art climate models.
The CALIPSO data are available at the Atmospheric Science Data Center (ASDC) https://asdc.larc.nasa.gov/ (last access: January 2021) (NASA, 2021).
Data produced with model simulations using the Norwegian climate model NorESM1-M and code for data analysis are available from the corresponding author upon request.
LF and FAMB developed the concept of the paper. LF designed and performed all model simulations and data analysis as well as writing the paper. FAMB and GS contributed to the design of experiments, interpretation of the results, and writing of the paper.
The authors declare that they have no conflict of interest.
Model simulations, data post-processing, and data analysis of model output were performed on resources provided by the Swedish National Infrastructure for Computing (SNIC) at the National Supercomputer Centre at Linköping University (NSC). We would like to thank the Evaluating the Climate and Air Quality Impacts of Short-Lived Pollutants (ECLIPSE) project (no. 282688) and the Global Fire Emissions Database (GFED) for providing the aerosol emission data sets and the NASA Langley Research Center Atmospheric Science Data Center for providing CALIOP data. We would like to thank Alf Kirkevåg and Øyvind Seland from the Norwegian Meteorological Institute in Oslo for providing model-specific information. Special thanks also to Abhay Devasthale, who gave advice about the CALIOP aerosol profile product.
Financial support has been provided by the
Vetenskapsrådet (project no. 2018-04274).
The article processing charges for this open-access publication were covered by Stockholm University.
This paper was edited by Rolf Müller and reviewed by two anonymous referees.
Abdul-Razzak, H. and Ghan, S. J.: A parameterization of aerosol activation: 2. Multiple aerosol types, J. Geophys. Res.-Atmos., 105, 6837–6844, https://doi.org/10.1029/1999JD901161, 2000. a
Albrecht, B. A.: Aerosols, Cloud Microphysics, and Fractional Cloudiness, Science, 245, 1227–1230, https://doi.org/10.1126/science.245.4923.1227, 1989. a
Bender, F. A.-M., Engström, A., and Karlsson, J.: Factors controlling cloud albedo in marine subtropical stratocumulus regions in climate models and satellite observations, J. Climate, 29, 3559–3587, https://doi.org/10.1175/JCLI-D-15-0095.1, 2016. a
Bony, S. and Dufresne, J.-L.: Marine boundary layer clouds at the heart of tropical cloud feedback uncertainties in climate models, Geophys. Res. Lett., 32, l20806, https://doi.org/10.1029/2005GL023851, 2005. a
Chand, D., Anderson, T. L., Wood, R., Charlson, R. J., Hu, Y., Liu, Z., and Vaughan, M.: Quantifying above-cloud aerosol using spaceborne lidar for improved understanding of cloudy-sky direct climate forcing, J. Geophys. Res.-Atmos., 113, d13206, https://doi.org/10.1029/2007JD009433, 2008. a
Croft, B., Lohmann, U., Martin, R. V., Stier, P., Wurzler, S., Feichter, J., Posselt, R., and Ferrachat, S.: Aerosol size-dependent below-cloud scavenging by rain and snow in the ECHAM5-HAM, Atmos. Chem. Phys., 9, 4653–4675, https://doi.org/10.5194/acp-9-4653-2009, 2009. a
Croft, B., Lohmann, U., Martin, R. V., Stier, P., Wurzler, S., Feichter, J., Hoose, C., Heikkilä, U., van Donkelaar, A., and Ferrachat, S.: Influences of in-cloud aerosol scavenging parameterizations on aerosol concentrations and wet deposition in ECHAM5-HAM, Atmos. Chem. Phys., 10, 1511–1543, https://doi.org/10.5194/acp-10-1511-2010, 2010. a
Dentener, F., Kinne, S., Bond, T., Boucher, O., Cofala, J., Generoso, S., Ginoux, P., Gong, S., Hoelzemann, J. J., Ito, A., Marelli, L., Penner, J. E., Putaud, J.-P., Textor, C., Schulz, M., van der Werf, G. R., and Wilson, J.: Emissions of primary aerosol and precursor gases in the years 2000 and 1750 prescribed data-sets for AeroCom, Atmos. Chem. Phys., 6, 4321–4344, https://doi.org/10.5194/acp-6-4321-2006, 2006. a, b
Devasthale, A. and Thomas, M. A.: A global survey of aerosol-liquid water cloud overlap based on four years of CALIPSO-CALIOP data, Atmos. Chem. Phys., 11, 1143–1154, https://doi.org/10.5194/acp-11-1143-2011, 2011. a
Frey, L., Bender, F. A.-M., and Svensson, G.: Cloud albedo changes in response to anthropogenic sulfate and non-sulfate aerosol forcings in CMIP5 models, Atmos. Chem. Phys., 17, 9145–9162, https://doi.org/10.5194/acp-17-9145-2017, 2017. a, b
Gent, P. R., Danabasoglu, G., Donner, L. J., Holland, M. M., Hunke, E. C., Jayne, S. R., Lawrence, D. M., Neale, R. B., Rasch, P. J., Vertenstein, M., Worley, P. H., Yang, Z.-L., and Zhang, M.: The Community Climate System Model Version 4, J. Climate, 24, 4973–4991, https://doi.org/10.1175/2011JCLI4083.1, 2011. a
Giglio, L., Randerson, J. T., van der Werf, G. R., Kasibhatla, P. S., Collatz, G. J., Morton, D. C., and DeFries, R. S.: Assessing variability and long-term trends in burned area by merging multiple satellite fire products, Biogeosciences, 7, 1171–1186, https://doi.org/10.5194/bg-7-1171-2010, 2010. a, b
Golaz, J.-C., Salzmann, M., Donner, L. J., Horowitz, L. W., Ming, Y., and Zhao, M.: Sensitivity of the Aerosol Indirect Effect to Subgrid Variability in the Cloud Parameterization of the GFDL Atmosphere General Circulation Model AM3, J. Climate, 24, 3145–3160, https://doi.org/10.1175/2010JCLI3945.1, 2011. a, b
Hansen, J., Sato, M., and Ruedy, R.: Radiative forcing and climate response, J. Geophys. Res.-Atmos., 102, 6831–6864, https://doi.org/10.1029/96JD03436, 1997. a
Holtslag, A. A. M. and Boville, B. A.: Local Versus Nonlocal Boundary-Layer Diffusion in a Global Climate Model, J. Climate, 6, 1825–1842, https://doi.org/10.1175/1520-0442(1993)006<1825:LVNBLD>2.0.CO;2, 1993. a
Hoyle, C. R., Marécal, V., Russo, M. R., Allen, G., Arteta, J., Chemel, C., Chipperfield, M. P., D'Amato, F., Dessens, O., Feng, W., Hamilton, J. F., Harris, N. R. P., Hosking, J. S., Lewis, A. C., Morgenstern, O., Peter, T., Pyle, J. A., Reddmann, T., Richards, N. A. D., Telford, P. J., Tian, W., Viciani, S., Volz-Thomas, A., Wild, O., Yang, X., and Zeng, G.: Representation of tropical deep convection in atmospheric models – Part 2: Tracer transport, Atmos. Chem. Phys., 11, 8103–8131, https://doi.org/10.5194/acp-11-8103-2011, 2011. a
Kim, M.-H., Omar, A. H., Tackett, J. L., Vaughan, M. A., Winker, D. M., Trepte, C. R., Hu, Y., Liu, Z., Poole, L. R., Pitts, M. C., Kar, J., and Magill, B. E.: The CALIPSO version 4 automated aerosol classification and lidar ratio selection algorithm, Atmos. Meas. Tech., 11, 6107–6135, https://doi.org/10.5194/amt-11-6107-2018, 2018. a, b
Kipling, Z., Stier, P., Schwarz, J. P., Perring, A. E., Spackman, J. R., Mann, G. W., Johnson, C. E., and Telford, P. J.: Constraints on aerosol processes in climate models from vertically-resolved aircraft observations of black carbon, Atmos. Chem. Phys., 13, 5969–5986, https://doi.org/10.5194/acp-13-5969-2013, 2013. a, b, c, d, e
Kipling, Z., Stier, P., Johnson, C. E., Mann, G. W., Bellouin, N., Bauer, S. E., Bergman, T., Chin, M., Diehl, T., Ghan, S. J., Iversen, T., Kirkevåg, A., Kokkola, H., Liu, X., Luo, G., van Noije, T., Pringle, K. J., von Salzen, K., Schulz, M., Seland, Ø., Skeie, R. B., Takemura, T., Tsigaridis, K., and Zhang, K.: What controls the vertical distribution of aerosol? Relationships between process sensitivity in HadGEM3–UKCA and inter-model variation from AeroCom Phase II, Atmos. Chem. Phys., 16, 2221–2241, https://doi.org/10.5194/acp-16-2221-2016, 2016. a, b, c, d, e, f, g, h, i, j
Kirkevåg, A., Iversen, T., Seland, Ø., Hoose, C., Kristjánsson, J. E., Struthers, H., Ekman, A. M. L., Ghan, S., Griesfeller, J., Nilsson, E. D., and Schulz, M.: Aerosol–climate interactions in the Norwegian Earth System Model – NorESM1-M, Geosci. Model Dev., 6, 207–244, https://doi.org/10.5194/gmd-6-207-2013, 2013. a, b, c, d
Klein, S. A. and Hartmann, D. L.: The Seasonal Cycle of Low Stratiform Clouds, J. Climate, 6, 1587–1606, https://doi.org/10.1175/1520-0442(1993)006<1587:TSCOLS>2.0.CO;2, 1993. a, b
Koffi, B., Schulz, M., Bréon, F., Griesfeller, J., Winker, D., Balkanski, Y., Bauer, S., Berntsen, T., Chin, M., Collins, W. D., Dentener, F., Diehl, T., Easter, R., Ghan, S., Ginoux, P., Gong, S., Horowitz, L. W., Iversen, T., Kirkevåg, A., Koch, D., Krol, M., Myhre, G., Stier, P., and Takemura, T.: Application of the CALIOP layer product to evaluate the vertical distribution of aerosols estimated by global models: AeroCom phase I results, J. Geophys. Res.-Atmos., 117, D10201, https://doi.org/10.1029/2011JD016858, 2012. a, b, c, d, e, f
Koffi, B., Schulz, M., Bréon, F., Dentener, F., Steensen, B. M., Griesfeller, J., Winker, D., Balkanski, Y., Bauer, S. E., Bellouin, N., Berntsen, T., Bian, H., Chin, M., Diehl, T., Easter, R., Ghan, S., Hauglustaine, D. A., Iversen, T., Kirkevåg, A., Liu, X., Lohmann, U., Myhre, G., Rasch, P., Seland, Ø., Skeie, R. B., Steenrod, S. D., Stier, P., Tackett, J., Takemura, T., Tsigaridis, K., Vuolo, M. R., Yoon, J., and Zhang, K.: Evaluation of the aerosol vertical distribution in global aerosol models through comparison against CALIOP measurements: AeroCom phase II results, J. Geophys. Res.-Atmos., 121, 7254–7283, https://doi.org/10.1002/2015JD024639, 2016. a, b, c, d
Labbouz, L., Kipling, Z., Stier, P., and Protat, A.: How Well Can We Represent the Spectrum of Convective Clouds in a Climate Model? Comparisons between Internal Parameterization Variables and Radar Observations, J. Atmos. Sci., 75, 1509–1524, https://doi.org/10.1175/JAS-D-17-0191.1, 2018. a
Lamarque, J.-F., Bond, T. C., Eyring, V., Granier, C., Heil, A., Klimont, Z., Lee, D., Liousse, C., Mieville, A., Owen, B., Schultz, M. G., Shindell, D., Smith, S. J., Stehfest, E., Van Aardenne, J., Cooper, O. R., Kainuma, M., Mahowald, N., McConnell, J. R., Naik, V., Riahi, K., and van Vuuren, D. P.: Historical (1850–2000) gridded anthropogenic and biomass burning emissions of reactive gases and aerosols: methodology and application, Atmos. Chem. Phys., 10, 7017–7039, https://doi.org/10.5194/acp-10-7017-2010, 2010. a, b
Lee, L. A., Carslaw, K. S., Pringle, K. J., Mann, G. W., and Spracklen, D. V.: Emulation of a complex global aerosol model to quantify sensitivity to uncertain parameters, Atmos. Chem. Phys., 11, 12253–12273, https://doi.org/10.5194/acp-11-12253-2011, 2011. a, b
Lee, L. A., Carslaw, K. S., Pringle, K. J., and Mann, G. W.: Mapping the uncertainty in global CCN using emulation, Atmos. Chem. Phys., 12, 9739–9751, https://doi.org/10.5194/acp-12-9739-2012, 2012. a
Lee, L. A., Pringle, K. J., Reddington, C. L., Mann, G. W., Stier, P., Spracklen, D. V., Pierce, J. R., and Carslaw, K. S.: The magnitude and causes of uncertainty in global model simulations of cloud condensation nuclei, Atmos. Chem. Phys., 13, 8879–8914, https://doi.org/10.5194/acp-13-8879-2013, 2013. a
Liu, Z., Vaughan, M., Winker, D., Kittaka, C., Getzewich, B., Kuehn, R., Omar, A., Powell, K., Trepte, C., and Hostetler, C.: The CALIPSO Lidar Cloud and Aerosol Discrimination: Version 2 Algorithm and Initial Assessment of Performance, J. Atmos. Ocean. Tech., 26, 1198–1213, https://doi.org/10.1175/2009JTECHA1229.1, 2009. a
Liu, Z., Kar, J., Zeng, S., Tackett, J., Vaughan, M., Avery, M., Pelon, J., Getzewich, B., Lee, K.-P., Magill, B., Omar, A., Lucker, P., Trepte, C., and Winker, D.: Discriminating between clouds and aerosols in the CALIOP version 4.1 data products, Atmos. Meas. Tech., 12, 703–734, https://doi.org/10.5194/amt-12-703-2019, 2019. a
Medeiros, B., Stevens, B., Held, I. M., Zhao, M., Williamson, D. L., Olson, J. G., and Bretherton, C. S.: Aquaplanets, Climate Sensitivity, and Low Clouds, J. Climate, 21, 4974–4991, https://doi.org/10.1175/2008JCLI1995.1, 2008. a
Michibata, T. and Takemura, T.: Evaluation of autoconversion schemes in a single model framework with satellite observations, J. Geophys. Res.-Atmos., 120, 9570–9590, https://doi.org/10.1002/2015JD023818, 2015. a
Morrison, H. and Gettelman, A.: A New Two-Moment Bulk Stratiform Cloud Microphysics Scheme in the Community Atmosphere Model, Version 3 (CAM3). Part I: Description and Numerical Tests, J. Climate, 21, 3642–3659, https://doi.org/10.1175/2008JCLI2105.1, 2008. a, b
Myhre, G., Shindell, D., Bréon, F.-M., Collins, W., Fuglestvedt, J., Huang, J., Koch, D., Lamarque, J.-F., Lee, D., Mendoza, B., Nakajima, T., Robock, A., Stephens, G., Takemura, T., and Zhang, H.: Anthropogenic and natural radiative forcing, in: Clim. Chang. 2013 Phys. Sci. basis. Contrib. Work. Gr. I to fifth Assess. Rep. Intergov. panel Clim. Chang., Cambridge University Press, Cambridge, 658–740, 2013. a
NASA: Atmospheric Science Data Center, available at: https://asdc.larc.nasa.gov/, last access: January 2021. a
Peers, F., Bellouin, N., Waquet, F., Ducos, F., Goloub, P., Mollard, J., Myhre, G., Skeie, R. B., Takemura, T., Tanré, D., Thieuleux, F., and Zhang, K.: Comparison of aerosol optical properties above clouds between POLDER and AeroCom models over the South East Atlantic Ocean during the fire season, Geophys. Res. Lett., 43, 3991–4000, https://doi.org/10.1002/2016GL068222, 2016. a, b, c, d, e, f
Possner, A., Zubler, E., Lohmann, U., and Schär, C.: The resolution dependence of cloud effects and ship-induced aerosol-cloud interactions in marine stratocumulus, J. Geophys. Res.-Atmos., 121, 4810–4829, https://doi.org/10.1002/2015JD024685, 2016. a
Qu, X., Hall, A., Klein, S. A., and Caldwell, P. M.: On the spread of changes in marine low cloud cover in climate model simulations of the 21st century, Clim. Dynam., 42, 2603–2626, https://doi.org/10.1007/s00382-013-1945-z, 2014. a
Rasch, P. J. and Kristjánsson, J. E.: A Comparison of the CCM3 Model Climate Using Diagnosed and Predicted Condensate Parameterizations, J. Climate, 11, 1587–1614, https://doi.org/10.1175/1520-0442(1998)011<1587:ACOTCM>2.0.CO;2, 1998. a
Rotstayn, L. D. and Liu, Y.: A smaller global estimate of the second indirect aerosol effect, Geophys. Res. Lett., 32, L05708, https://doi.org/10.1029/2004GL021922, 2005. a
Samset, B. H. and Myhre, G.: Vertical dependence of black carbon, sulphate and biomass burning aerosol radiative forcing, Geophys. Res. Lett., 38, L24802, https://doi.org/10.1029/2011GL049697, 2011. a
Samset, B. H., Myhre, G., Schulz, M., Balkanski, Y., Bauer, S., Berntsen, T. K., Bian, H., Bellouin, N., Diehl, T., Easter, R. C., Ghan, S. J., Iversen, T., Kinne, S., Kirkevåg, A., Lamarque, J.-F., Lin, G., Liu, X., Penner, J. E., Seland, Ø., Skeie, R. B., Stier, P., Takemura, T., Tsigaridis, K., and Zhang, K.: Black carbon vertical profiles strongly affect its radiative forcing uncertainty, Atmos. Chem. Phys., 13, 2423–2434, https://doi.org/10.5194/acp-13-2423-2013, 2013. a
Schutgens, N., Tsyro, S., Gryspeerdt, E., Goto, D., Weigum, N., Schulz, M., and Stier, P.: On the spatio-temporal representativeness of observations, Atmos. Chem. Phys., 17, 9761–9780, https://doi.org/10.5194/acp-17-9761-2017, 2017. a
Schutgens, N. A. J., Partridge, D. G., and Stier, P.: The importance of temporal collocation for the evaluation of aerosol models with observations, Atmos. Chem. Phys., 16, 1065–1079, https://doi.org/10.5194/acp-16-1065-2016, 2016. a
Schwarz, J. P., Spackman, J. R., Gao, R. S., Watts, L. A., Stier, P., Schulz, M., Davis, S. M., Wofsy, S. C., and Fahey, D. W.: Global-scale black carbon profiles observed in the remote atmosphere and compared to models, Geophys. Res. Lett., 37, L18812, https://doi.org/10.1029/2010GL044372, 2010. a
Schwarz, J. P., Samset, B. H., Perring, A. E., Spackman, J. R., Gao, R. S., Stier, P., Schulz, M., Moore, F. L., Ray, E. A., and Fahey, D. W.: Global-scale seasonally resolved black carbon vertical profiles over the Pacific, Geophys. Res. Lett., 40, 5542–5547, https://doi.org/10.1002/2013GL057775, 2013. a
Seland, Ø., Iversen, T., Kirkevåg, A., and Storelvmo, T.: Aerosol-climate interactions in the CAM-Oslo atmospheric GCM and investigation of associated basic shortcomings, Tellus A, 60, 459–491, https://doi.org/10.1111/j.1600-0870.2008.00318.x, 2008. a
Stohl, A., Aamaas, B., Amann, M., Baker, L. H., Bellouin, N., Berntsen, T. K., Boucher, O., Cherian, R., Collins, W., Daskalakis, N., Dusinska, M., Eckhardt, S., Fuglestvedt, J. S., Harju, M., Heyes, C., Hodnebrog, Ø., Hao, J., Im, U., Kanakidou, M., Klimont, Z., Kupiainen, K., Law, K. S., Lund, M. T., Maas, R., MacIntosh, C. R., Myhre, G., Myriokefalitakis, S., Olivié, D., Quaas, J., Quennehen, B., Raut, J.-C., Rumbold, S. T., Samset, B. H., Schulz, M., Seland, Ø., Shine, K. P., Skeie, R. B., Wang, S., Yttri, K. E., and Zhu, T.: Evaluating the climate and air quality impacts of short-lived pollutants, Atmos. Chem. Phys., 15, 10529–10566, https://doi.org/10.5194/acp-15-10529-2015, 2015. a
Tackett, J. L., Winker, D. M., Getzewich, B. J., Vaughan, M. A., Young, S. A., and Kar, J.: CALIPSO lidar level 3 aerosol profile product: version 3 algorithm design, Atmos. Meas. Tech., 11, 4129–4152, https://doi.org/10.5194/amt-11-4129-2018, 2018. a
Textor, C., Schulz, M., Guibert, S., Kinne, S., Balkanski, Y., Bauer, S., Berntsen, T., Berglen, T., Boucher, O., Chin, M., Dentener, F., Diehl, T., Easter, R., Feichter, H., Fillmore, D., Ghan, S., Ginoux, P., Gong, S., Grini, A., Hendricks, J., Horowitz, L., Huang, P., Isaksen, I., Iversen, I., Kloster, S., Koch, D., Kirkevåg, A., Kristjansson, J. E., Krol, M., Lauer, A., Lamarque, J. F., Liu, X., Montanaro, V., Myhre, G., Penner, J., Pitari, G., Reddy, S., Seland, Ø., Stier, P., Takemura, T., and Tie, X.: Analysis and quantification of the diversities of aerosol life cycles within AeroCom, Atmos. Chem. Phys., 6, 1777–1813, https://doi.org/10.5194/acp-6-1777-2006, 2006. a
Tripoli, G. J. and Cotton, W. R.: A Numerical Investigation of Several Factors Contributing to the Observed Variable Intensity of Deep Convection over South Florida, J. Appl. Meteorol. Clim., 19, 1037–1063, https://doi.org/10.1175/1520-0450(1980)019<1037:ANIOSF>2.0.CO;2, 1979. a
Twomey, S.: The Influence of Pollution on the Shortwave Albedo of Clouds, J. Atmos. Sci., 34, 1149–1152, https://doi.org/10.1175/1520-0469(1977)034<1149:TIOPOT>2.0.CO;2, 1977. a
van der Werf, G. R., Randerson, J. T., Giglio, L., Collatz, G. J., Mu, M., Kasibhatla, P. S., Morton, D. C., DeFries, R. S., Jin, Y., and van Leeuwen, T. T.: Global fire emissions and the contribution of deforestation, savanna, forest, agricultural, and peat fires (1997–2009), Atmos. Chem. Phys., 10, 11707–11735, https://doi.org/10.5194/acp-10-11707-2010, 2010. a, b
Vignati, E., Karl, M., Krol, M., Wilson, J., Stier, P., and Cavalli, F.: Sources of uncertainties in modelling black carbon at the global scale, Atmos. Chem. Phys., 10, 2595–2611, https://doi.org/10.5194/acp-10-2595-2010, 2010. a, b, c
Vogelezang, D. H. P. and Holtslag, A. A. M.: Evaluation and model impacts of alternative boundary-layer height formulations, Bound.-Lay. Meteorol., 81, 245–269, https://doi.org/10.1007/BF02430331, 1996. a
Waquet, F., Peers, F., Ducos, F., Goloub, P., Platnick, S., Riedi, J., Tanré, D., and Thieuleux, F.: Global analysis of aerosol properties above clouds, Geophys. Res. Lett., 40, 5809–5814, https://doi.org/10.1002/2013GL057482, 2013. a
West, R. E. L., Stier, P., Jones, A., Johnson, C. E., Mann, G. W., Bellouin, N., Partridge, D. G., and Kipling, Z.: The importance of vertical velocity variability for estimates of the indirect aerosol effects, Atmos. Chem. Phys., 14, 6369–6393, https://doi.org/10.5194/acp-14-6369-2014, 2014. a
White, B., Gryspeerdt, E., Stier, P., Morrison, H., Thompson, G., and Kipling, Z.: Uncertainty from the choice of microphysics scheme in convection-permitting models significantly exceeds aerosol effects, Atmos. Chem. Phys., 17, 12145–12175, https://doi.org/10.5194/acp-17-12145-2017, 2017. a
Winker, D. M., Vaughan, M. A., Omar, A., Hu, Y., Powell, K. A., Liu, Z., Hunt, W. H., and Young, S. A.: Overview of the CALIPSO Mission and CALIOP Data Processing Algorithms, J. Atmos. Ocean. Tech., 26, 2310–2323, https://doi.org/10.1175/2009JTECHA1281.1, 2009. a, b
Winker, D. M., Pelon, J., Coakley, J. A., Ackerman, S. A., Charlson, R. J., Colarco, P. R., Flamant, P., Fu, Q., Hoff, R. M., Kittaka, C., Kubar, T. L., Le Treut, H., Mccormick, M. P., Mégie, G., Poole, L., Powell, K., Trepte, C., Vaughan, M. A., and Wielicki, B. A.: The CALIPSO Mission: A Global 3D View of Aerosols and Clouds, B. Am. Meteorol. Soc., 91, 1211–1230, https://doi.org/10.1175/2010BAMS3009.1, 2010. a
Winker, D. M., Tackett, J. L., Getzewich, B. J., Liu, Z., Vaughan, M. A., and Rogers, R. R.: The global 3-D distribution of tropospheric aerosols as characterized by CALIOP, Atmos. Chem. Phys., 13, 3345–3361, https://doi.org/10.5194/acp-13-3345-2013, 2013. a, b
Yu, H., Chin, M., Winker, D. M., Omar, A. H., Liu, Z., Kittaka, C., and Diehl, T.: Global view of aerosol vertical distributions from CALIPSO lidar measurements and GOCART simulations: Regional and seasonal variations, J. Geophys. Res.-Atmos., 115, D00H30, https://doi.org/10.1029/2009JD013364, 2010. a, b, c
Zhang, G. J. and McFarlane, N. A.: Sensitivity of climate simulations to the parameterization of cumulus convection in the Canadian Climate Centre general circulation model, Atmos. Ocean, 33, 407–446, 1995. a