the Creative Commons Attribution 4.0 License.
the Creative Commons Attribution 4.0 License.
 | 14 Apr 2021
Uncertainties in the Emissions Database for Global Atmospheric Research (EDGAR) emission inventory of greenhouse gases
Efisio Solazzo
Monica Crippa
Diego Guizzardi
Marilena Muntean
Margarita Choulga
Greet Janssens-Maenhout
The Emissions Database for Global Atmospheric Research (EDGAR) estimates the human-induced emission rates on Earth. EDGAR collaborates with atmospheric modelling activities and aids policy in the design of mitigation strategies and in evaluating their effectiveness. In these applications, the uncertainty estimate is an essential component, as it quantifies the accuracy and qualifies the level of confidence in the emission.
This study complements the EDGAR emissions inventory by providing an estimation of the structural uncertainty stemming from its base components (activity data, AD, statistics and emission factors, EFs) by (i) associating uncertainty to each AD and EF characterizing the emissions of the three main greenhouse gases (GHGs), namely carbon dioxide (CO2), methane (CH4), and nitrous oxide (N2O); (ii) combining them; and (iii) making assumptions regarding the cross-country uncertainty aggregation of source categories.
It was deemed a natural choice to obtain the uncertainties in EFs and AD statistics from the Intergovernmental Panel on Climate Change (IPCC) guidelines issued in 2006 (with a few exceptions), as the EF and AD sources and methodological aspects used by EDGAR have been built over the years based on the IPCC recommendations, which assured consistency in time and comparability across countries. On the one hand, the homogeneity of the method is one of the key strengths of EDGAR, on the other hand, it facilitates the propagation of uncertainties when similar emission sources are aggregated. For this reason, this study aims primarily at addressing the aggregation of uncertainties' sectorial emissions across GHGs and countries.
Globally, we find that the anthropogenic emissions covered by EDGAR for the combined three main GHGs for the year 2015 are accurate within an interval of −15 % to +20 % (defining the 95 % confidence of a log-normal distribution). The most uncertain emissions are those related to N2O from waste and agriculture, while CO2 emissions, although responsible for 74 % of the total GHG emissions, account for approximately 11 % of global uncertainty share. The sensitivity to methodological choices is also discussed.
- Article
(5128 KB) - Full-text XML
-
Supplement
(189 KB) - BibTeX
- EndNote


According to the latest release of the Emissions Database for Global Atmospheric Research (EDGAR version 5; Crippa et al., 2019, 2020a), the global greenhouse gas (GHG) emissions of carbon dioxide (CO2), methane (CH4), and nitrous oxide (N2O) due to anthropogenic activities summed to 48.1 Gt CO2 eq.1 in the year 2015. In the same year, the share of global CO2 eq. from non-CO2 GHG emissions (i.e. CH4 and N2O) was approximately a quarter of this value. Measures put in place to attenuate temperature rise and to mitigate climate dynamics long-term changes have contributed to upholding the role of CH4 and N2O. Their high warming potential compared with CO2 and their relatively shorter life-time (on average CH4 persists in the atmosphere for approximately a decade, N2O for over a century, and CO2 for more than 1000 years; NCR, 2010; Ciais et al., 2013) allow for the shift from energy-related CO2 to other, more rapidly responsive, emission sources (Janssens-Maenhout et al., 2019; United Nations Environment Programme, 2019). At the same time, while the uncertainty regarding fossil fuel CO2 emissions is relatively small and, overall, well defined, the emission estimates for CH4 and N2O are significantly more uncertain. Hence, emission reduction measures issued by national plans highly depend on the degree of uncertainty of sectors that should contribute to reach a designed reduction target. As depicted in the example by Olivier (1998), a sector contributing 10 % to the national reduction target may contribute 5 % or 15 % if that sector's emission factor is ±50 % uncertain.
EDGAR aims to consolidate its position in supporting research and new data/approach implementation in operational modelling as well as to become an independent tool that can support policy makers with respect to monitoring and mitigation strategies. Therefore, a reliable quantification of the uncertainties should have the same degree of importance as the consistency and comparability of the emissions. This study evolves in this direction by adding the uncertainty dimension to the EDGAR database, thereby enhancing its value with much needed information on reliability and promoting its comparability with other datasets. Uncertainty reports are relevant, among other applications, for the following:
-
scientific purposes, such as assessing the robustness of long-term emission trends, providing an a priori state for comparison with independent top-down estimates (Bergamaschi et al., 2018), or aiding in network design (Super et al., 2020);
-
inter-comparison studies (Choulga et al., 2020; Petrescu et al., 2020);
-
assessing the feasible potential of mitigation strategies (e.g. Van Dingenen et al., 2018).
This study adds the uncertainty component to the EDGAR data by devising methods to propagate the uncertainty introduced by activity data (AD) and emission factors (EFs) to any combination/aggregation of sources, countries, and GHGs. Methods, aggregation strategies, and dependencies are presented and investigated. Analyses are conducted for the emission year 2015 for CO2, CH4, and N2O. The sensitivity to methodological choices is also discussed. The methodology presented here has already been applied to EDGAR and is discussed in the scientific literature in comparison to other methods (Choulga et al., 2020) and to other inventories (Petrescu et al., 2020), with respect to an assessment of the uncertainty of the EDGAR-FOOD inventory (Crippa et al., 2021), and regarding application to specific sectors (Muntean et al., 2021), trend analysis of global GHG emissions, and communication with the policy makers and the public (Crippa et al., 2019, 2020a).
EDGAR is a bottom-up model for estimating emissions, relying on a large spectrum of AD covering human activities with a high degree of detail. The AD are combined with EFs to yield the emission, per source, and country. For example, for combustion sources AD consist of fossil fuel consumption, whereas the EF is the amount of emission produced per unit of activity. In this case, the emission is typically obtained simply by multiplying the AD by the EF, whereas other sources (e.g. waste) require more sophisticated models.
AD are primarily retrieved from international statistics, complemented, when necessary, by information (e.g. trends) from other sources, such as scientific literature and national data. The quality, consistency, and comparability of AD through time and space are the essential features defining the quality of an emission database.
Default EFs compiled by IPCC Guidelines for National Greenhouse Gas Inventories (IPCC, 2006a, b, hereafter referred to as IPCC-06) are adopted by EDGAR for most sources and countries, supplemented with information from scientific literature, and other references for specific processes and/or countries. Janssens-Maenhout et al. (2019) produced a detailed description of data providers and methodological choices for the GHG emissions of EDGAR. Further information on the methodological aspects of data collection and sources are given by Crippa et al. (2020a).
This study addresses the uncertainty of the anthropogenic sources covered by EDGAR, which might not be exhaustive. Therefore, nothing can be said about the uncertainty stemming from source categories not currently encompassed by the inventory (e.g. fugitive CO2 from low-temperature oxidation of coal mines, fugitive CH4 from managed wetlands, and N2O from crab ponds as part of aquaculture). Uncertainty assessment of spatially distributed sources (emission grid maps) is outside the scope of this study.
2.1 Emissions and their uncertainties
The uncertainty in the AD (uAD) collected by international agencies or organizations (e.g. the Food and Agriculture Organization, FAO, and the International Energy Agency, IEA) is of a statistical nature, stemming from incompleteness, representativeness of sampling, the imputation of missing data, and extrapolation (e.g. projecting to future years; Rypdal and Winiwarter, 2001; Olivier, 2002; IPCC-06). Other aspects to take into consideration when compiling a global inventory are the degree of wealth of a country as well as the year under study. Less-developed countries and countries whose economy has fully developed in recent years are more likely to have not yet developed a reliable statistical system. Similarly, the AD of countries with transitional economies are expected to be more accurate for recent years (Janssens-Maenhout et al., 2019).
The uncertainty in the EF (uEF) has many sources – for instance, the degree of representativeness of the limited number of observations underlying the EF (for the activity that is addressed), including the under-representativity of operating conditions, the inaccuracy of assumptions and/or of source aggregation (e.g. assumption of constancy in time), bias, variability, and/or random errors. Due to the non-statistical nature of uEF, its quantification eludes a general methodological approach. The IPCC adopts a tiered approach for estimating uncertainty, accounting for different levels of sophistication (IPCC-06). Tier 1 uncertainties for default EFs are based on expert judgement, which often offers a range of uncertainties for a given process, source, and/or fuel. Higher tiers (up to Tier 3) offer more elaborate estimates, based on localized measurements/ad hoc experiments on specific emission factors and for specific processes. Further, the model used to build emission inventories based on activity statistics may be too simplified (e.g. based on linearization and/or linear regression due to factors such as a poor understanding or lack of data), and it may not fully capture the complexity of a given emission process. These “model” errors are difficult to assess in isolation from other sources of uncertainty and are generally attributed to uncertainties in EFs (Rypdal and Winiwarter, 2001; Cullen and Frey, 1999).
This study reflects the methodological approach of EDGAR adopting default EFs – associated with Tier 1 uncertainty estimates. The term “uncertainty”, in this study as in similar work (Rypdal and Winiwarter, 2001; Olivier, 2002; Janssens-Maenhout et al., 2019), is used in a rather broad sense, lumping together all mentioned sources of errors due to current limited knowledge with respect to distinguishing among them. After IPCC introduced quantitative uncertainty in GHG inventories, the inventory uncertainty is usually expressed as two standard deviations, approximately corresponding to 95 % confidence for a variable with a normal distribution (i.e. the uncertainty reflects the square root of the variance of the variable, multiplied by a coverage factor of 2 to provide a confidence interval of 95 %).
Finally, the uncertainty tackled here shall not be confused with the variability stemming from a range (or ensemble) of estimates. The variability is used as proxy of structural uncertainty in the faith that a range of models using diverse underlying assumptions would span the true uncertainty space. However, the estimates are seldom “diverse” as they stem from same data/assumptions (sometimes different versions of the same model are used), leading to overconfident estimates (Solazzo et al., 2018).
2.1.1 Uncertainty in activity data
Table 1 summarizes the uncertainty for AD. When two values are listed (e.g. ±5 %; ±10 %), the lower uncertainty value (i.e. ±5 %) is assigned to countries with a developed economy, whereas the larger value (i.e. ±10 %) is assigned to countries with a less-developed economy or with an economy in transition.
Table 1Activity data (AD) statistical uncertainty (upper and lower limits define the 95 % confidence intervals of a normal distribution). When two values are listed, the smaller range applies to industrialized countries, and the larger range applies to developing countries.
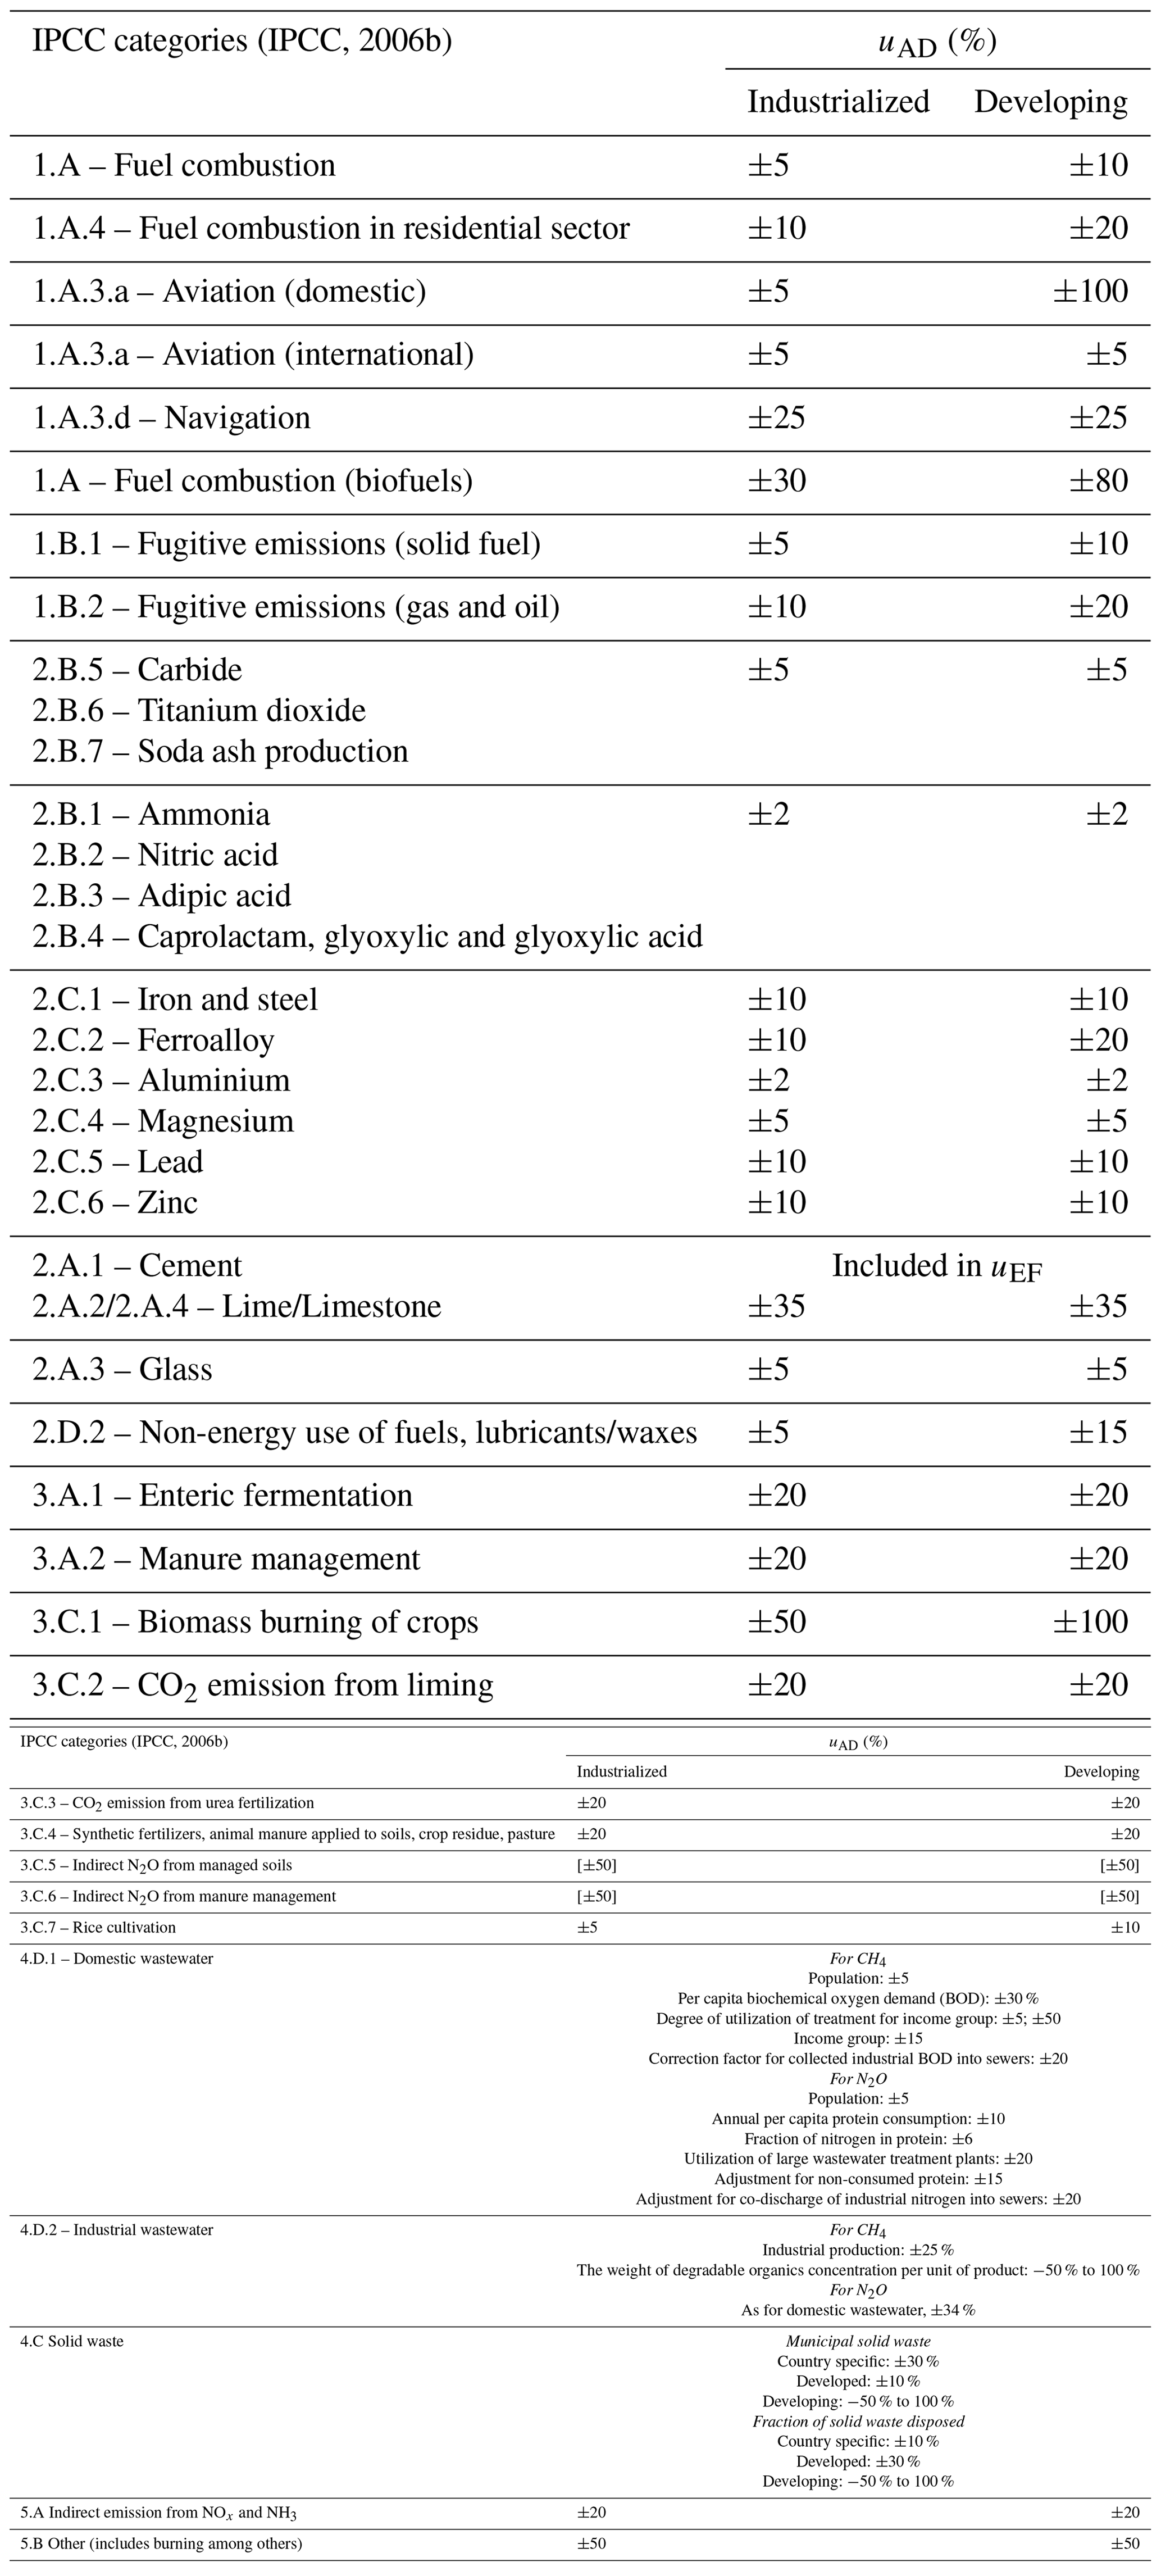
Source: IPCC (2000, 2006b) and elaborations by Olivier (2002). The values in square brackets are expert judgements (OJ).
According to IPCC-06, uAD values for fuel combustion activities (mostly derived from IEA statistics) are estimated with high confidence (5 % to 10 % uncertainty). The same uncertainty range is estimated for fugitive emissions (referring to venting and flaring during oil and gas production). uAD in the residential (10 % to 20 %) and in the aviation and navigation (5 % to 25 %) sectors are assumed to be more conservative in order to account for the under-representativeness of the sample and for the difficulty in distinguishing between domestic and international fuel consumption (IPCC-06). For combustion processes using biofuels, the statistics are less robust. Olivier (2002) suggests a uAD of 30 % for industrialized countries and 80 % for less-developed countries (based on IPCC-06 recommendations). Recent updates (Andreae, 2019) confirm these estimates.
Uncertainty for some chemistry production processes and waste is calculated on the total emission rather than on the AD and EF separately, and this is discussed later. The waste sector also utilizes a slightly more elaborate emission estimate model than the simple multiplication of AD and EF. It assumes that emissions are not instantly released into the atmosphere, but are accumulated and continue to emit even several years after their disposal. The model for the waste sector depends on several parameters and assumptions (detailed in Sect. 3.1.5).
2.1.2 Uncertainty of emissions factors
Tables 2 and 3 define the uncertainties of EFs for CO2 as well as for CH4 and N2O respectively. The uncertainty of EFs for CO2 is determined by the carbon content of the fuel and is relatively smaller and determined with a higher level of accuracy than the uncertainty of EFs for CH4 and N2O. Moreover, the uEF for CH4 and N2O lumps several sources of uncertainties together, as mentioned earlier.
Table 2CO2 uncertainty in the emission factors (EFs) by fuel type (from Table 3.2.1 of IPCC, 2006b).
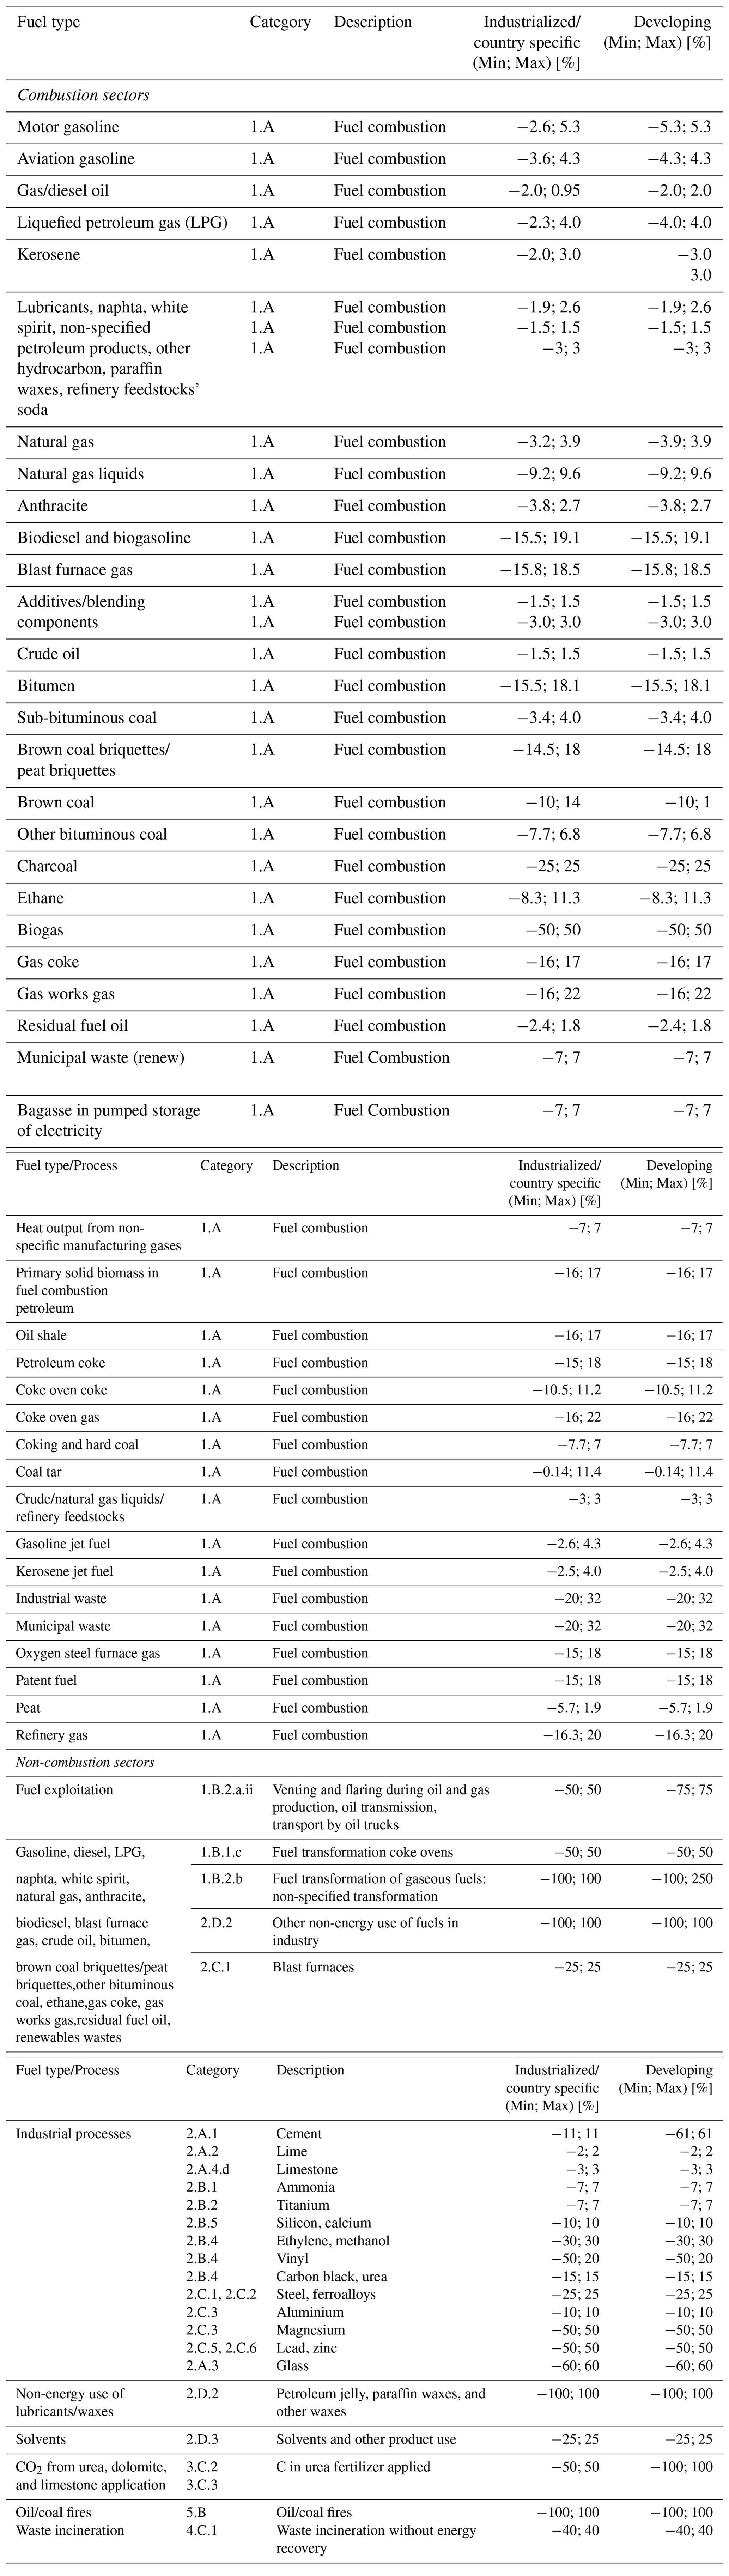
Table 3Uncertainty in emission factors (EFs) for CH4 and N2O defined by IPCC sectors and corresponding EDGAR sectors. OJ denotes expert judgement, Surf denotes surface, Und denotes underground, Abandon denotes abandoned, Prod denotes production, Trans denotes transmission, and MCF refers to the methane correction factor.
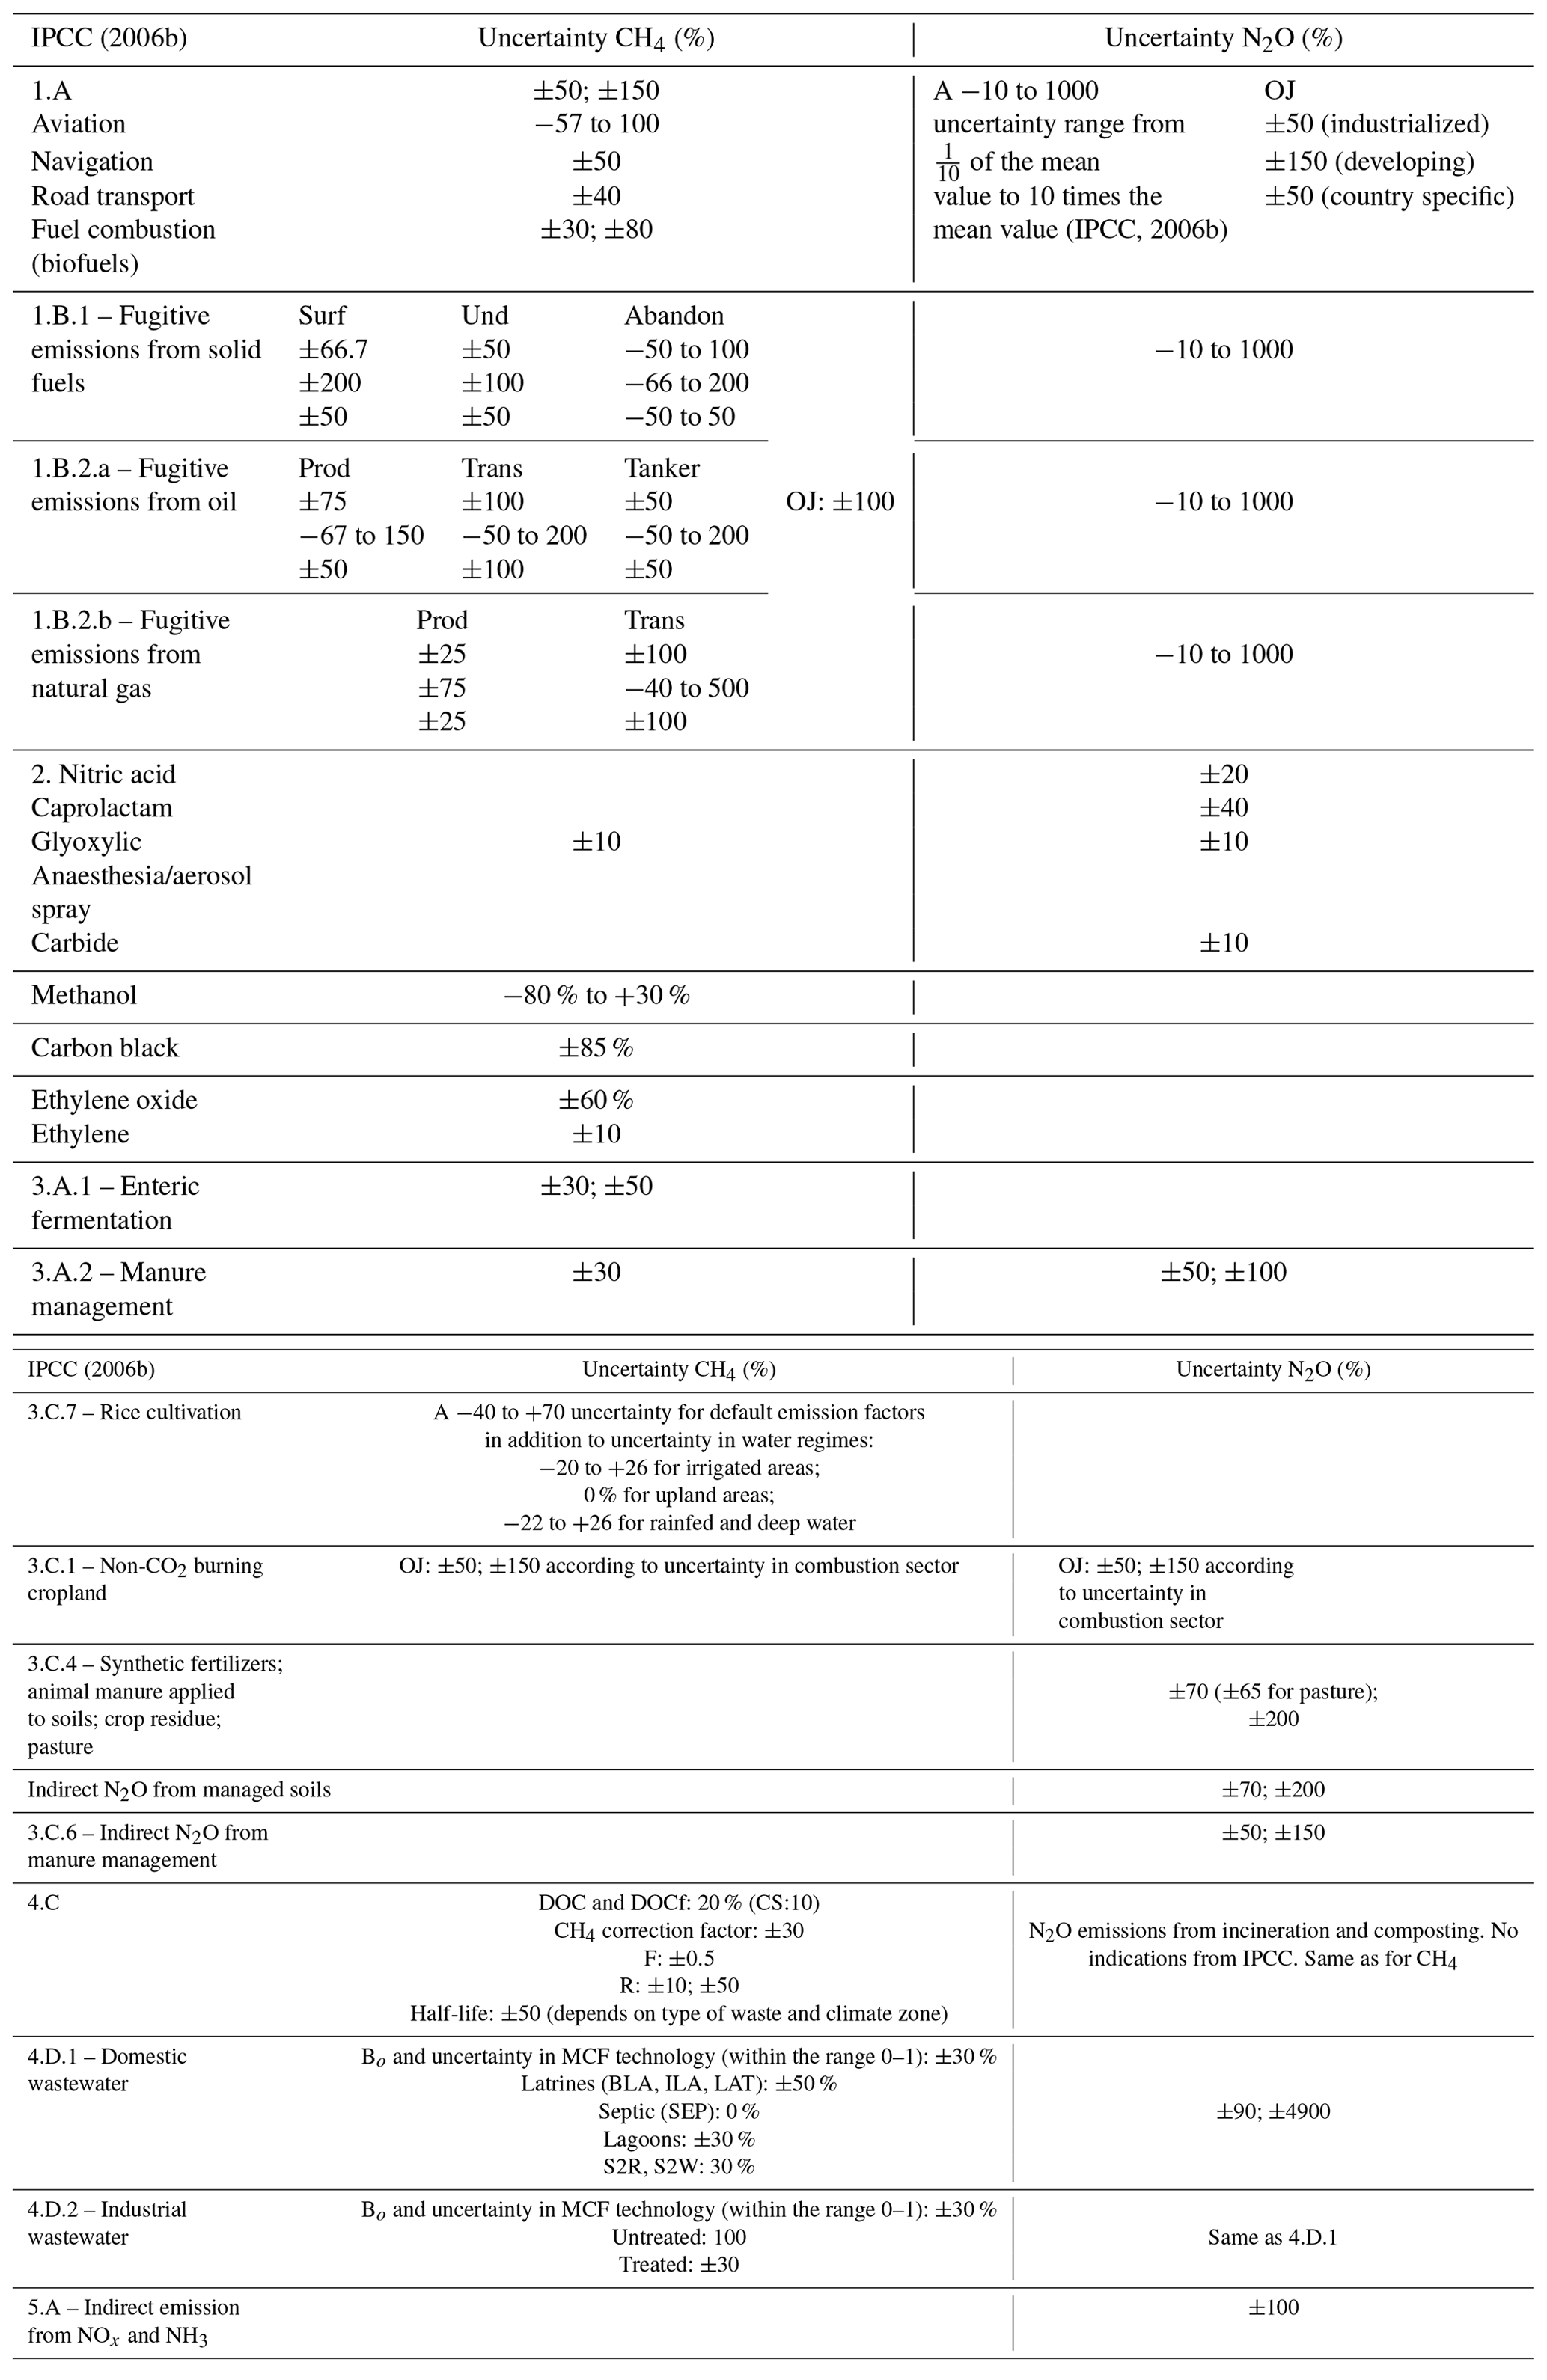
As previously stated, uEF values are founded on Tier 1 estimates from IPCC-06, which are based on expert judgements and, as such, vary over wide ranges to account for a variety of conditions. For instance, the uEF values for N2O (agriculture and energy sources in particular) clearly reflect the large temporal variability and spatial heterogeneity of these processes.
2.2 Emission aggregation and uncertainty propagation
The vast majority of EFs in EDGAR are based on IPCC Tier 1 estimates (especially for combustion sources) in order to ensure the following:
-
completeness, which is accomplished through the inclusion of all relevant sources for a given year;
-
consistency, implying that the same methodology is applied through years for a given source;
-
comparability, assuring that emissions are comparable across countries (e.g. source definitions, emission calculations, and emissions factors are the same across countries).
The adoption of comparable methods for source emissions and consistency implies that the uncertainties of the final emission estimates are interdependent, as they stem from the same methodology. When emissions are combined or aggregated, this lack of independence cannot be neglected, and the following assumptions are made:
- a.
the emission uncertainty (uEMI) is the sum of the squares of the uncertainty of AD (uAD) and the uncertainty of EF (uEF), see Eq. (1);
- b.
uncertainties of different source categories are uncorrelated (e.g. waste and agriculture);
- c.
subsectors of a given emission category for CH4 and N2O are fully correlated, and the uncertainty of the sum is, therefore, the sum of the uncertainties;
- d.
when dealing with CO2, full correlation is assumed for energy combustion sources sharing the same emission factor (fuel dependent);
- e.
aggregated emissions from same categories but different countries are assumed to be fully correlated, unless the emission factor is country-specific, or derived from higher tiers (i.e. emissions are not derived from a default EF defined by IPCC but are retrieved by other sources and are specific to that country or process);
- f.
when uncertainty is provided as a range (e.g. for the energy sector, IPCC-06 recommends that the CH4 EFs are treated with an uncertainty ranging from 50 % to 150 %), the upper bound of the range is assigned to countries with a less-developed statistical infrastructure and the lower one is assigned to countries with a more robust statistical infrastructure.
Conditions (a) and (b) match the suggestion of the uncertainty chapter of the IPCC guidelines (IPCC-06, chap. 3), whereas the latter two conditions are more cautious formulations of the error propagation to account for covariances. More explicitly, the uncertainty of the emission, uEMI, due to multiplying AD by EF is calculated as
The uncertainty of the emission, uEMI, due to adding emissions is calculated as
This basically equates to the squared sum of the uncertainty of each emission process normalized by the sum of emissions, which assumes that all emission sources are uncorrelated (IPCC-06). However, in general, the variance of the sum of any two terms x1 and x2 with variances of σ1 and σ2 is . As the covariance can be expressed as , where r is the coefficient of correlation, when r=1 (full correlation), the variance of the sum becomes the linear sum of the two variances:
Therefore, for fully correlated variables, the uncertainty of their sum is simply the sum of their uncertainties.
When uncertainties are larger than 100 %, Eq. (2) tends to underestimate the uncertainty and a correction factor FC is recommended (IPCC-06), so that the uncertainty in the emission is
where uEMI,C is the correction to be applied to the uncertainty estimated from error propagation. Eq. (4) is used for multiplicative or quotient terms in the range uEMI ∈ [100 %, 230 %] (Eq. 3.3, IPCC-06, Vol. 1, chap. 3). The effect of FC is to return larger uncertainties (see e.g. Choulga et al., 2020). The use of FC is based on the work by Frey (2003) to account for the error introduced in the approximation of the analytical method compared with a fully numerical one (based on Monte Carlo analysis). The error in the approximation increases with the uncertainty; thus, the correction factor FC is needed when dealing with large uncertainties (Frey, 2003). The analysis presented in this study takes the correction factor FC into account (unless specifically indicated), and for simplicity, the “C” is dropped in uEMI,C to yield uEMI.
This study assumes that uncertainties are normally distributed, unless specifically indicated by IPCC-06. The distribution is transformed to log-normal after the aggregation to avoid the emissions taking negative, unphysical values when uncertainty is large. Hence, the probability distribution function (PDF) is transformed to log-normal with the upper and lower uncertainty range defined according to IPCC-06:
where μg and σg are the respective geometric mean and geometric standard deviation about EMI, the mean emission.
According to IPCC-06, the contribution to variance (var shares) of a specific emission process (s) emitting (EMIs), to the uncertainty of the total emissions EMItot is calculated as
2.2.1 Additional remarks
The assumption of correlation between subcategories (or fuel for energy sectors emitting CO2) and between countries for the same category (or fuel for energy CO2) is introduced to ensure that the uncertainty of emitting sources sharing the same methodology for estimating the EF is propagated in the case of aggregation. If the same methodology is applied to estimate the emission for a given category and for a group of countries, the correlation is kept when calculating the total emission of that group of countries for that category. Similar assumptions were adopted by studies such as Bond et al. (2004) and Bergamaschi et al. (2015), although for different inventories. This is a direct implication of the consistency and cross-country comparability of EDGAR, which adopts Tier 1 EFs defined by IPCC-06 for most of the inventory. By contrast, if each country follows diverse methods to estimate the EFs for a given source category, uEF stemming from that methodology does not co-vary when calculating the total of that category – thus Eq. (2) holds. Some further considerations are as follows:
-
The assumption of the source or country correlation is the main difference between the uncertainty estimated in this study and the uncertainty reported by studies such as Petrescu et al. (2020) for EU27+UK (the 27 European countries and the UK), where no correlation was assumed, although not all countries developed independent methods to estimate EFs.
-
The choice of assuming “full” correlation (i.e. a correlation coefficient of one) is conservative in the sense that it returns the upper bound of uEMI; this choice is motivated by the fact that it simplifies the calculation (see Eq. 3) and that there are no indications that there is a better method for estimating r.
-
EDGAR does include country-specific EFs for some processes and countries. These are retrieved from the scientific literature or derived from technical collaborations and through the continuous updates over the last 2 decades (e.g. EFs for cement production are computed including information on country-specific clinker fractions; EFs for landfills consider the country-specific waste composition and recovery; EFs for the enteric fermentation of cattle include country- or region-specific information on milk yield, carcass weight, and many other parameters). These instances are flagged in our methodology, and the uEF is not propagated when aggregating these sources.
3.1 Emissions from CO2, CH4, and N2O
3.1.1 Power industry sector
IPCC sector 1.A includes the EDGAR categories related to combustion of fossil and biofuels for energy production (ENE), manufacturing (IND), energy for buildings (RCO), oil refineries and the transformation industry (REF and TRF respectively), aviation (TNR aviation), shipping (TNR ship), and road transport (TRO). Emissions from biofuel burning (e.g. wood) in sector 1.A are considered carbon neutral and are calculated for CH4 and N2O only.
EDGAR adopts AD statistics of fossil fuel combustion compiled by the IEA (IEA, 2017) for developed and developing countries, integrated with data from the US EIA (2018) for biofuels.
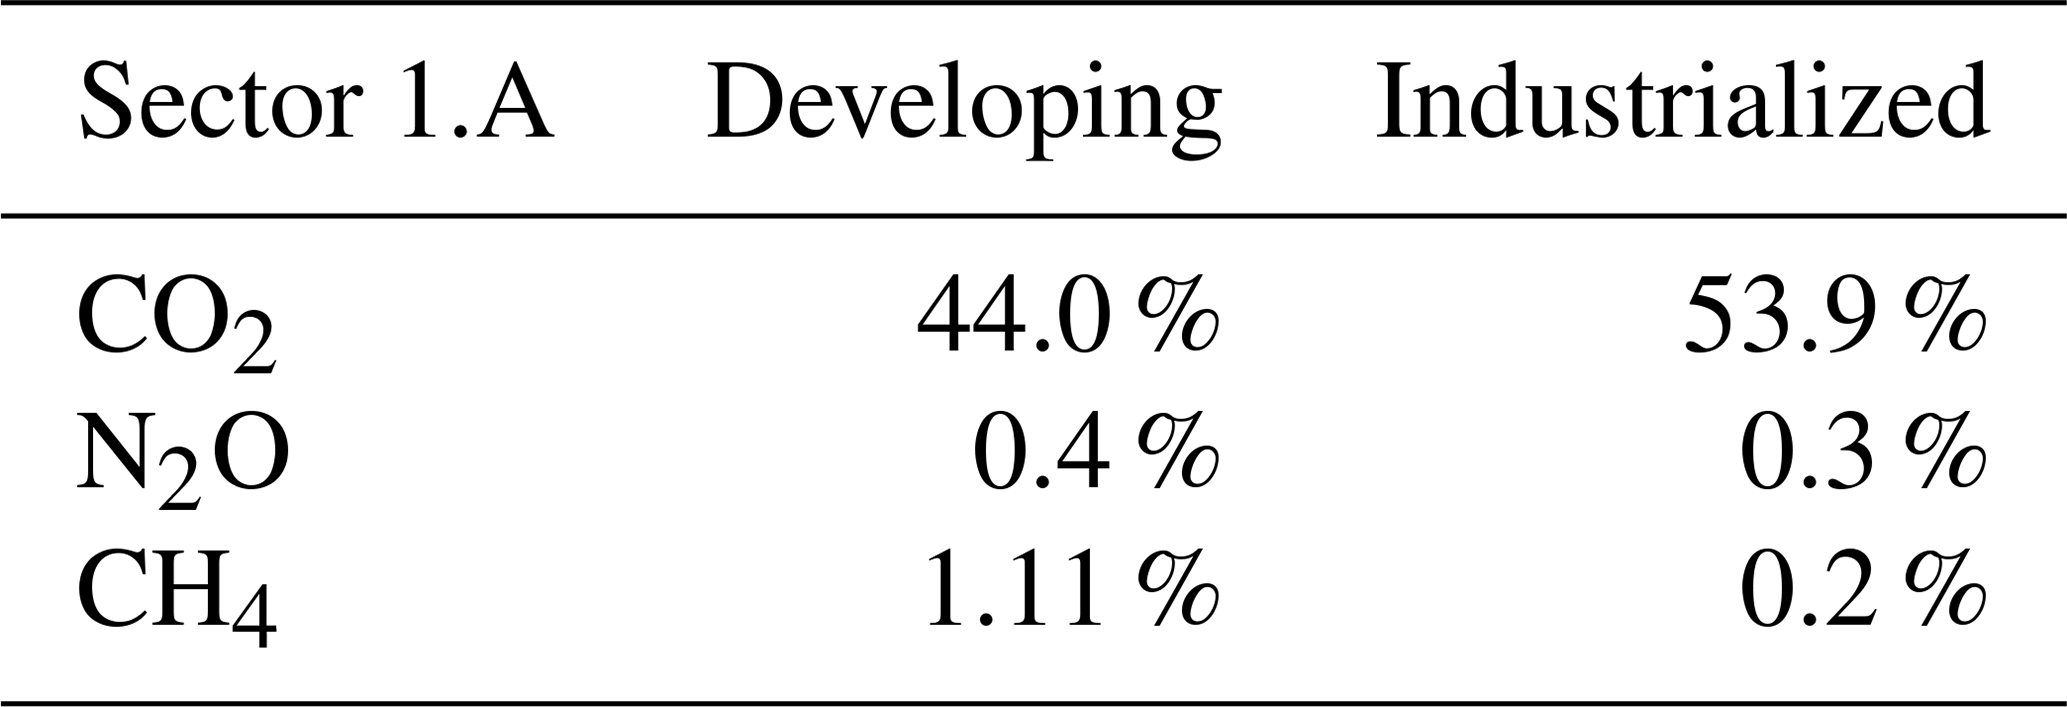
The share of GHG emissions from industrialized and developing countries is reported in Table 4 to aid later interpretation of the uncertainty shares. In fact, in countries with a developed economy (Table S1 in the Supplement) energy statistics are considered to have lower uncertainty than in countries under development (Olivier 2002). IPCC suggests a uAD for the power industry ranging between 5 % and 10 %. We have assigned 5 % to industrialized countries and 10 % uncertainty to developing countries to account for less robust census capability. IPCC-06 provides fuel-dependent uEF values for CO2 (Table 2), which have been mapped to match the fuels in each EDGAR emission category. The uEF values for CO2 are relatively small, as reflected by the (well-known) carbon content of the fuel.
Table 4Share of GHG emissions (derived from CO2, CH4, and N2O expressed in CO2 eq.) of developing and industrialized countries for sector 1.A based on EDGAR emissions for the year 2015.
For CH4 and N2O, EFs are more uncertain than for CO2. IPCC-06 suggests a wide range of uEF values for the whole energy sector, ranging between 50 % and 150 % for CH4 and between and 10 times the mean emission value for N2O. These estimates are provided by expert judgement based on the reliability of current estimates. The reasons for such high uncertainty have been mentioned previously (i.e. lack of understanding of emission processes and of relevant measurements, the uncertainty in measurements, and poor representativeness of the full range of operating conditions). EFs for biofuel combustion are highly uncertain, with the uncertainty estimated to range from 30 % (Andreae and Merlet, 2001) to 80 % (Olivier, 2002). Recently, Andreae (2019) reviewed uEF to less than 20 % (6 %–18 % for CH4 from the major burning categories, savannah, forests, and biofuel). The uncertainty of processes using biofuels is calculated separately and then combined with the fossil fuel uncertainty, assuming no correlation; see Eq. (2).
Emissions of CO2 account for over 90 % of world's total GHG emissions from fuel combustion and are assessed with high degree of confidence (Fig. 1a–c) due to the accuracy of uEF values reflecting the carbon content of the fuel. Thus, the share of emissions for each subcategory (manufacturing, transformation and power industry, oil refinery, residential heating, and road and non-road transport) is mirrored by the share each category contributes to the sector uncertainty (Fig. 2), although with some notable exceptions for non-road transport in Brazil (large share of highly uncertain domestic aviation and inland water shipping) and the transformation industry in Russia (share of emission and uncertainty of ∼10 % and ∼37 % respectively).
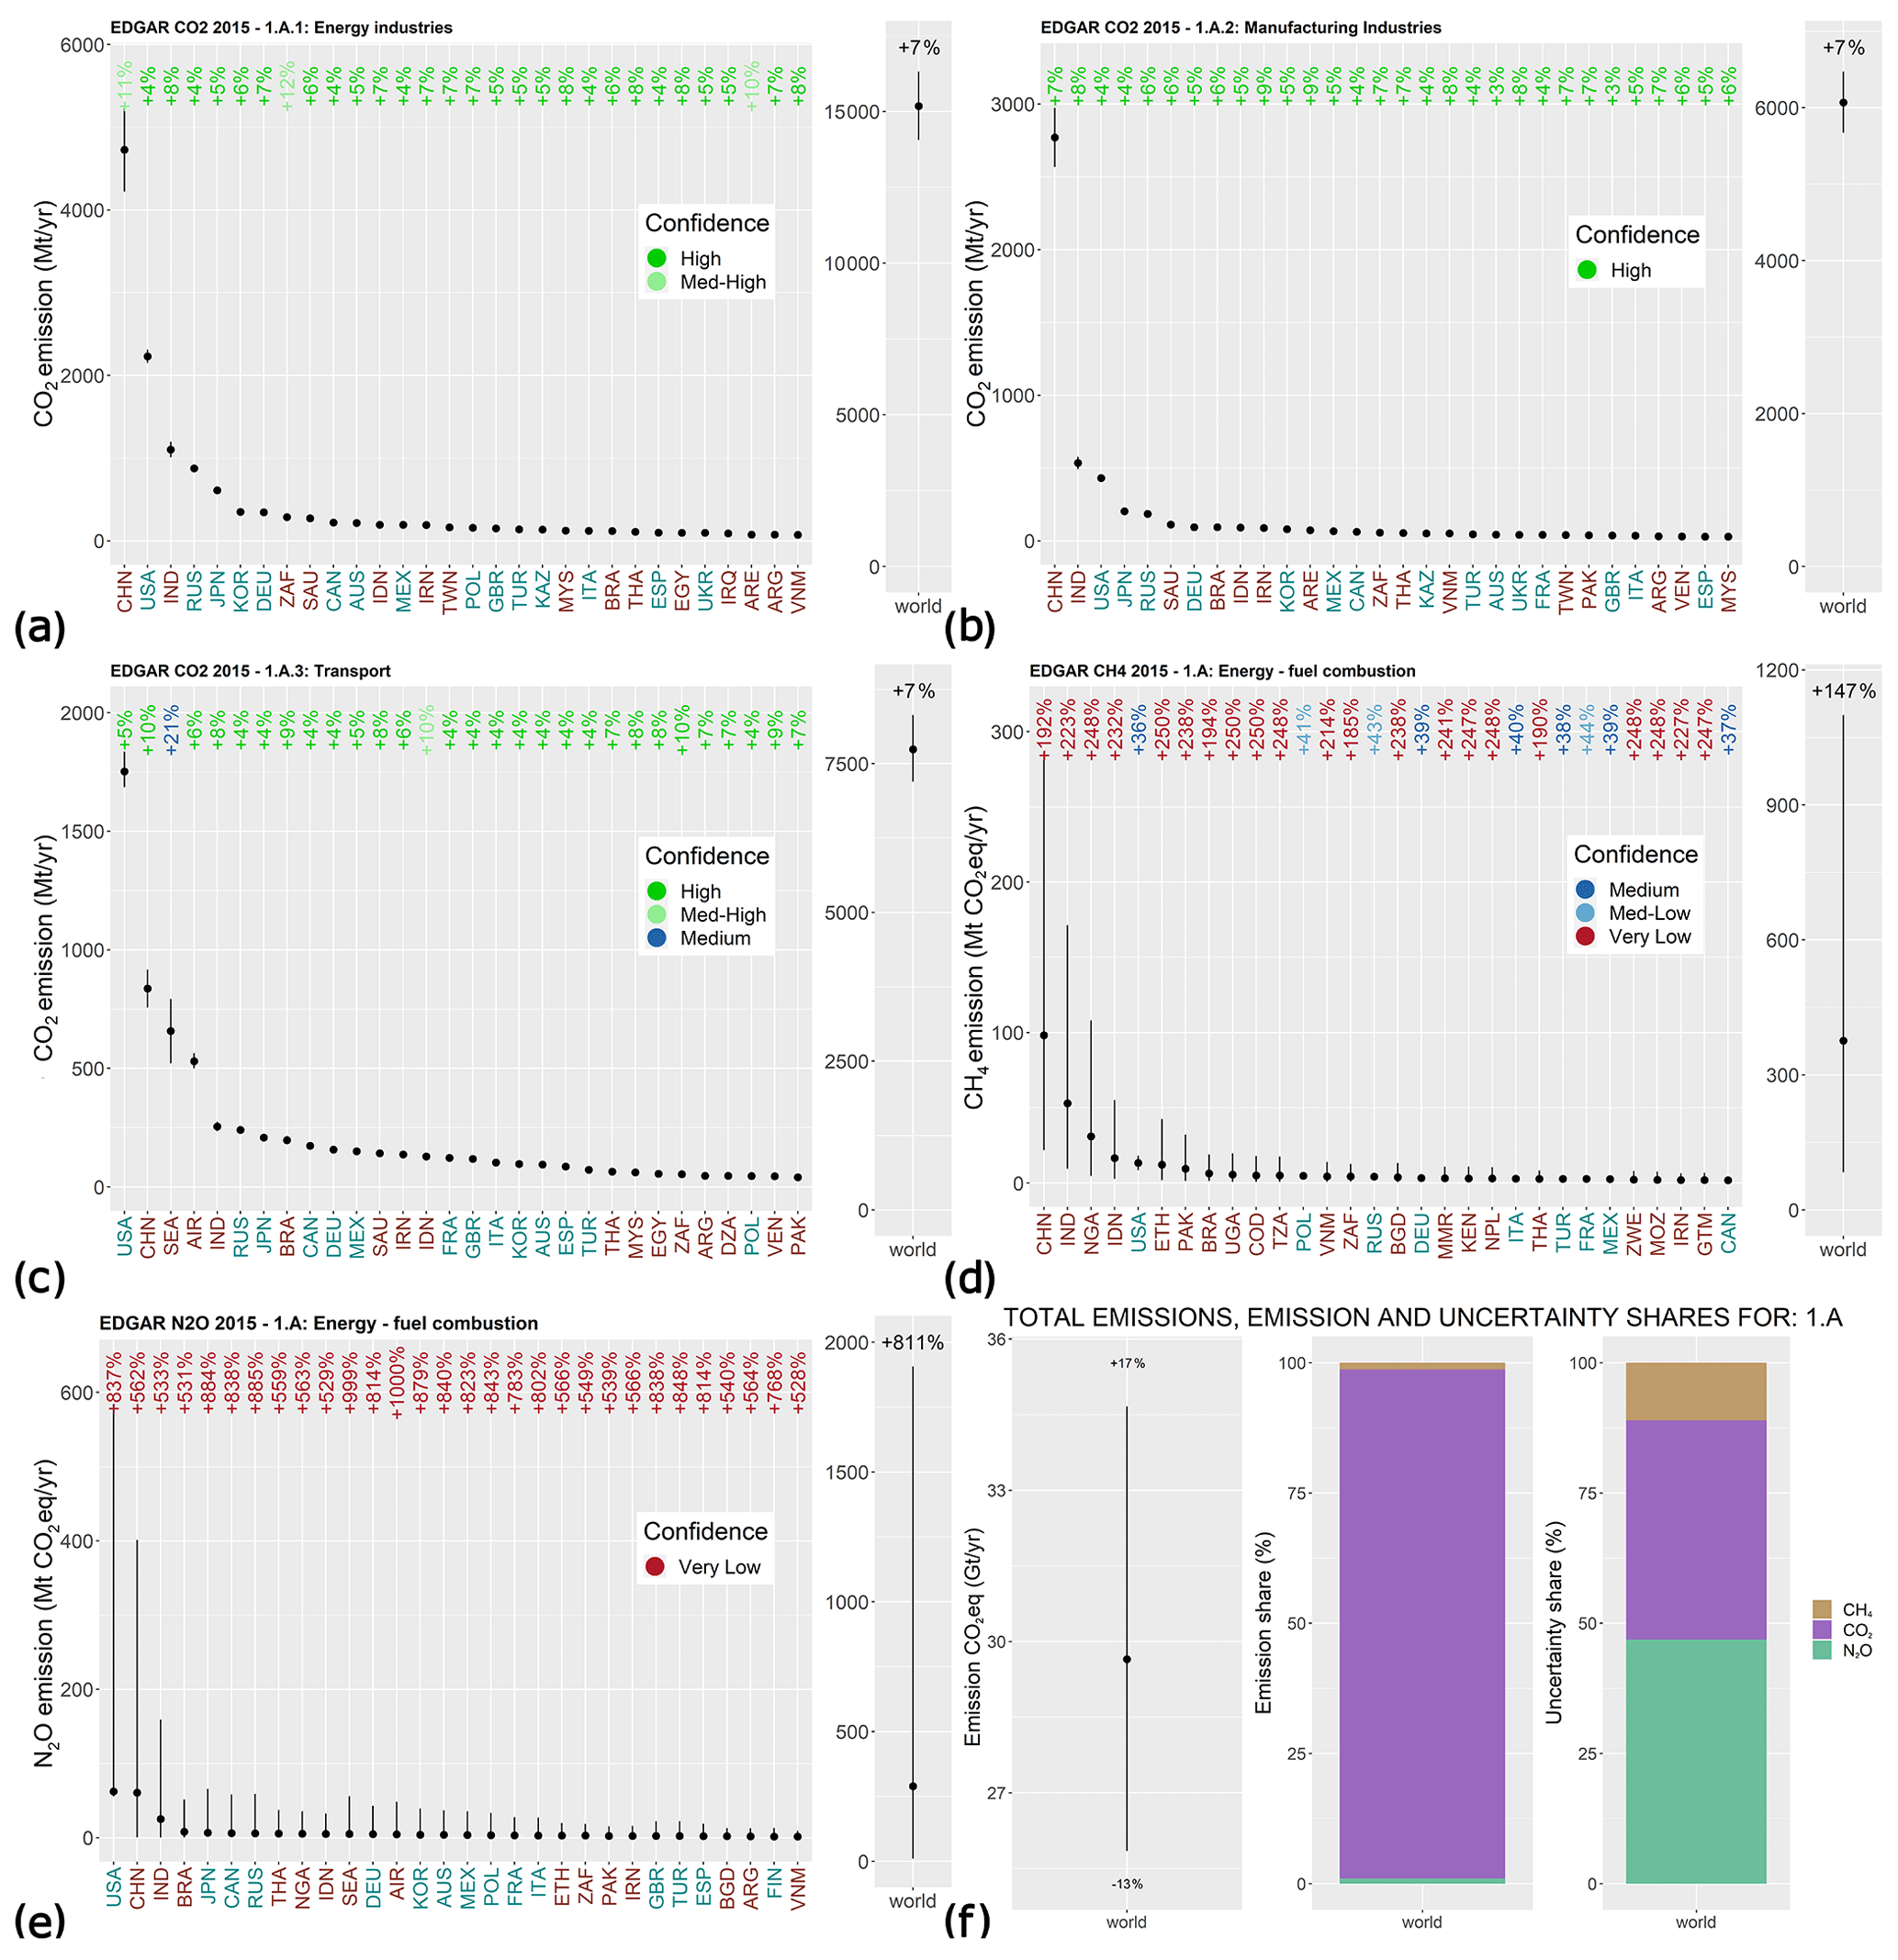
Figure 1GHG emissions from top emitters and the world for sector 1.A (energy from fuel combustion): (a) CO2 from energy industries; (b) CO2 from manufacturing industries; (c) CO2 from transport; (d) CH4 from fuel combustion; (e) N2O from fuel combustion; (f) the world total emission uncertainty and the world emission and uncertainty shares. The country names are colour-coded according to their classification (cyan denotes industrialized, and red denotes developing). Confidence levels are given in the following ranges: high (0 %, 10 %]; medium-high (10 %, 20 %]; medium (20 %, 40 %]; medium-low (40 %, 60 %]; low (60 %, 100 %]; and very low > 100 %. (Country codes are given in Table S1.)
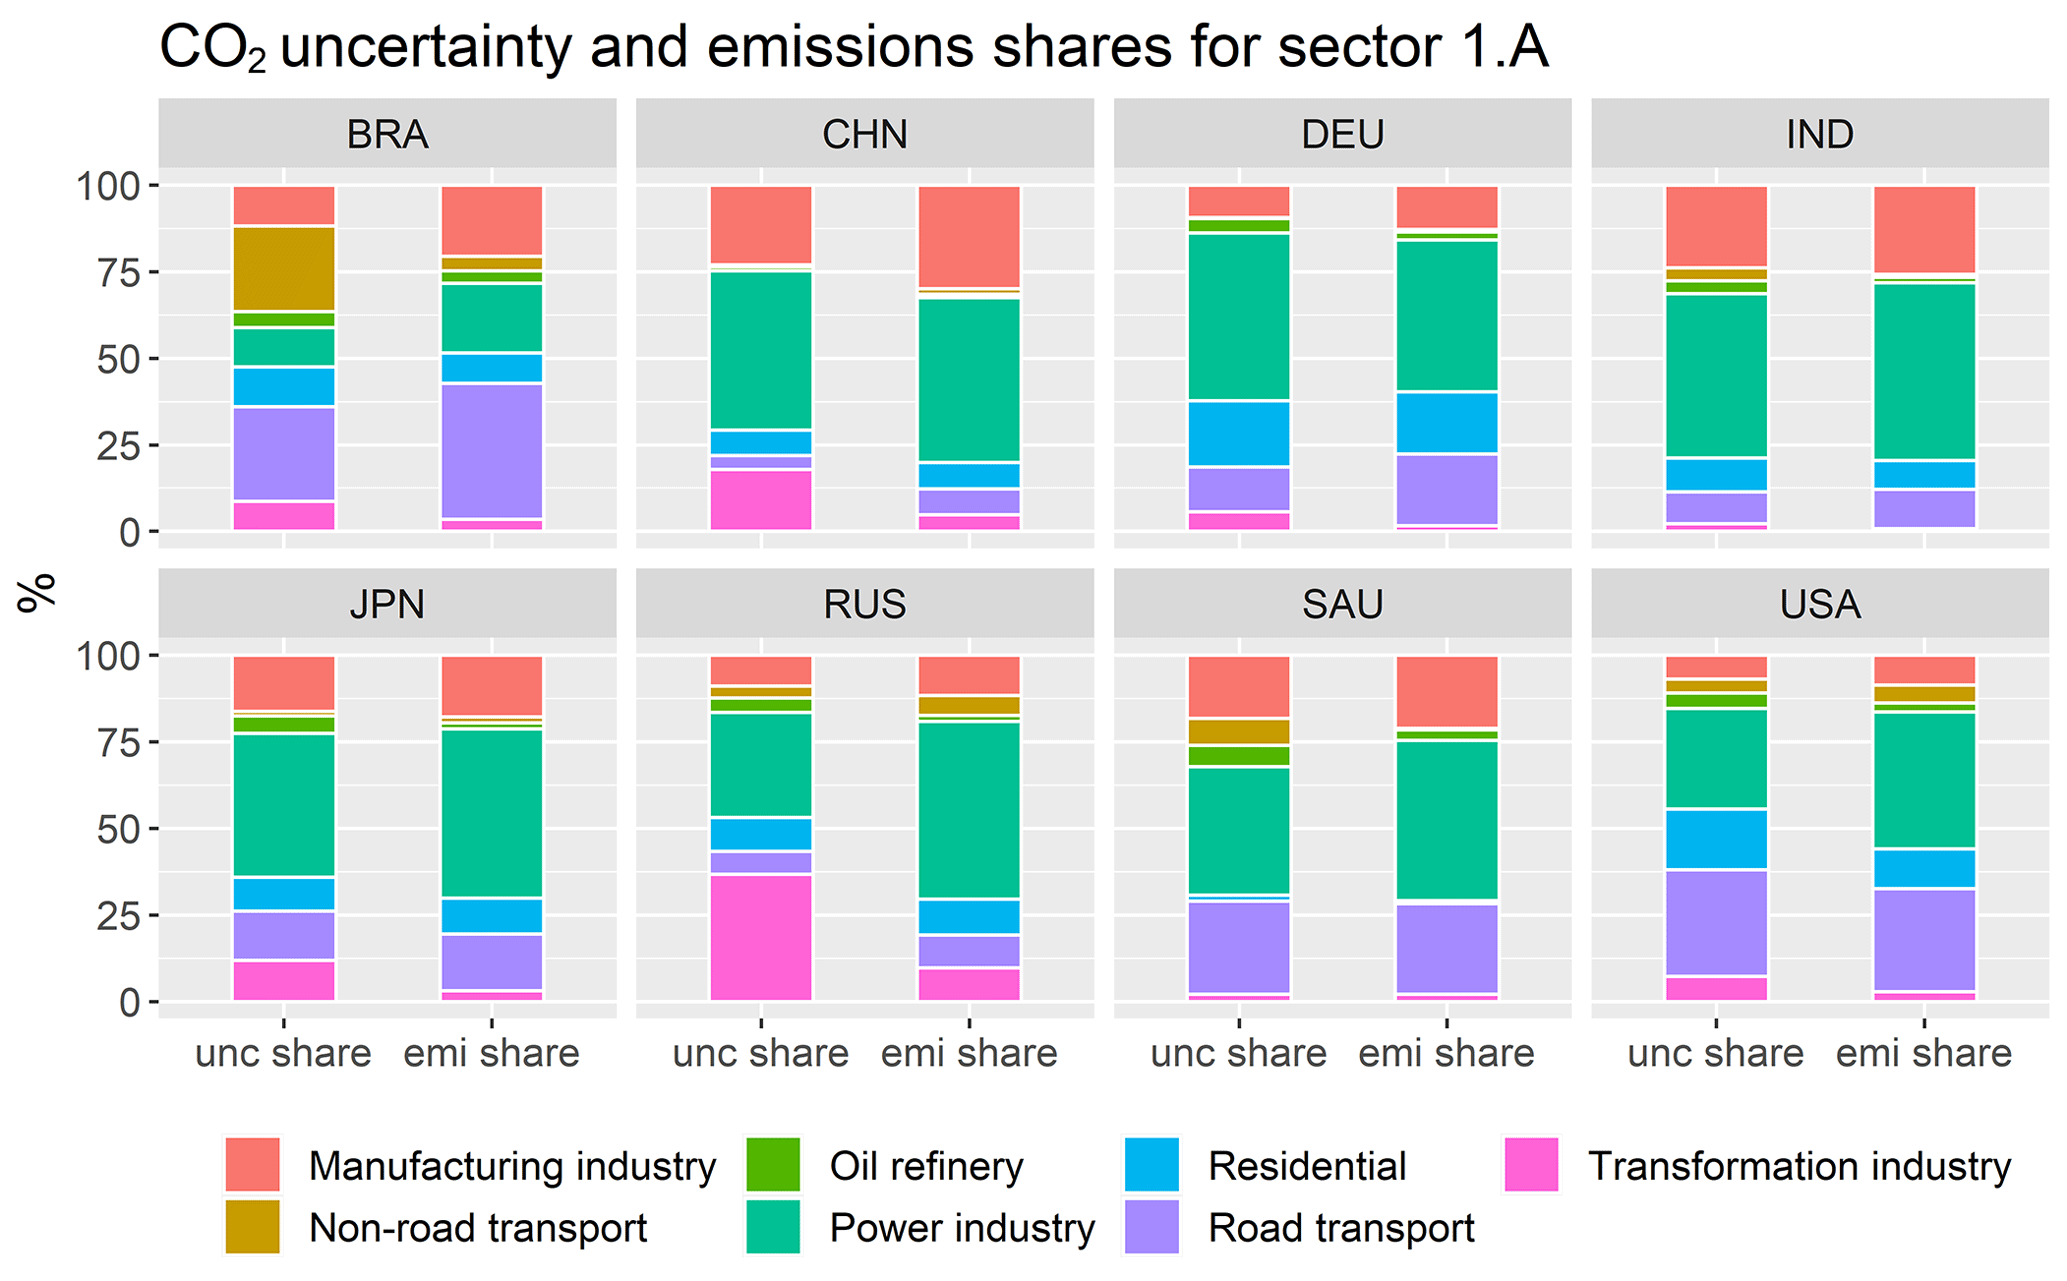
Figure 2The CO2 uncertainty and emission shares for EDGAR emission sectors under IPCC category 1.A for Brazil, China, Germany, India, Japan, Russia, Saudi Arabia, and the USA.
The very low confidence in N2O emissions is responsible for almost 50 % of world's total uncertainty (Fig. 1f), although N2O only accounts for a minor portion of total emissions in this sector (less than 1 %). According to studies such as Lee et al. (2013), the suggested IPCC-06 uncertainty for power plant emission of N2O might be too high (the authors report a range from −11.43 % to +12.86 % for a combined-cycle power plant in Korea). An alternative uEF estimation for N2O in the fossil fuel combustion sector is set in the range from ±50 % (developed countries) to ±150 % (countries with an economy under development). This choice also reflects a previous uncertainty estimation by Olivier (2002).
The N2O emission uncertainty and the N2O contribution to uncertainty in sector 1.A are shown in Fig. 3.
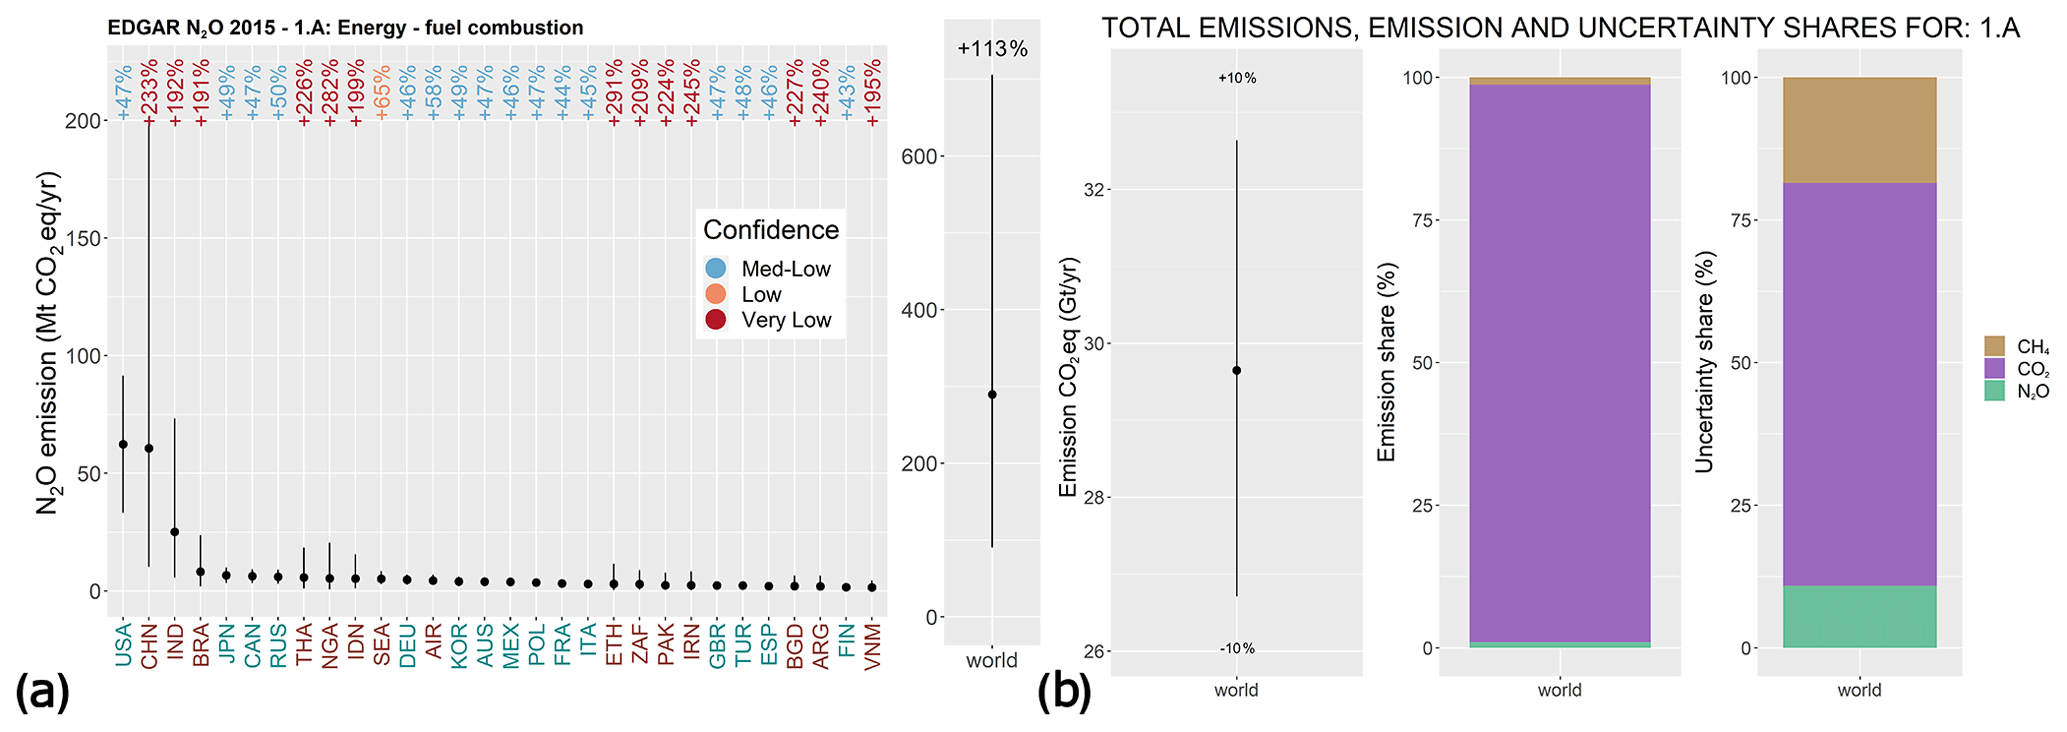
Figure 3(a) The N2O emissions from top emitters and the world for sector 1.A (energy from fuel combustion) when uncertainties are set in the range from ±50 % (industrialized countries) to 150 % (developing countries). (b) The world total emission uncertainty and the world emission and uncertainty shares. The country names are colour-coded according to their classification (cyan denotes industrialized, and red denotes developing). Confidence levels are given in the following ranges: high (0 %, 10 %]; medium-high (10 %, 20 %]; medium (20 %, 40 %]; medium-low (40 %, 60 %]; low (60 %, 100 %]; and very low > 100 %. (Country codes are given in Table S1.)
The uncertainty distribution (Fig. 3) and relative contribution reflect the weight of the component GHGs, and the world's total uncertainty (10 %) is only slightly larger than the uncertainty of CO2 (7 %; Fig. 1a–c). Adopting the uEF of 50 %–150 % for N2O in sector 1.A reflects the large uncertainty associated with this sector and allows comparability or aggregation with other gases (Fig. 3b).
3.1.2 Fugitive emissions from coal, oil, and natural gas
Fugitive emissions from solid fuels (mainly coal, 1.B.1) and from oil and natural gas (1.B.2) are covered by the REF, TRF, and PRO (fuel exploitation) EDGAR categories. As pointed out in IPCC-06, uncertainty in the fugitive emissions sector arises from applying the same EF to all countries (Tier 1 approach) and from uncertainty in the emission factors themselves.
The AD for coal statistics are a collection of the following products (the full details are provided by Janssens-Maenhout et al., 2019, and references therein): the IEA (2017) for the exploration of gas and oil; UNFCCC (2018) and CIA (2016) for transmission and distribution; and IEA (2017) for venting and flaring, complemented with data from GGFR/NOAA (2020) and Andres et al. (2014). According to Olivier (2002), the uAD for sector 1.B lies within the range from ±5 % to ±10 %, which is aligned with the estimates provided by IPCC-06.
Fugitive emissions from solid fuels (1.B.1) in EDGAR v4 and v5 are dealt with by considering emission factors from IPCC-06, supplemented with the EEA (2013) guidebook for coal and UNFCCC (2018). For oil and natural gas (1.B.2), we use information from the IPCC-06, supplemented with data from UNFCCC (2014). While gas transmission through large pipelines is characterized by the relatively small country-specific emission factors of Lelieveld et al. (2005), much larger and material-dependent leakage rates of IPCC-06 were assumed for gas distribution. For venting processes, the EFs for CH4 are based on country-specific UNFCCC (2014) data for reporting countries (and the average value as default for all other countries) (Janssens-Maenhout et al., 2019).
IPCC-06 provides a detailed synthesis of the uncertainty associated with EFs for sectors 1.B.1 and 1.B.2, distinguishing between developing and developed countries (Tables 4.2.4 and 4.2.5 of IPCC-06, chap. 4). The uEF is the same for CO2 and CH4, whereas it is larger for N2O. A summary of the uncertainty ranges is provided in Table 3.
Uncertainties in the 1.B.1 sector depend on the type of mining activity: surface (Surf), underground (Und), or abandoned (Abandon). The uEF values for these sectors can be rather large (>100 %), as detailed in Table 3, according to IPCC-06 and in line with Olivier (2002). For 1.B.2, the distinction is made between leakage during production (Prod), transmission and distribution (Trans), and venting/flaring (Vent). The uncertainty is estimated to be as large as 3 times the average emission value in some instances (Table 3) for CH4 and CO2 and up to 1000 % for flaring N2O emission. We note that while some AD are known or retrievable through various governmental agencies (e.g. the number of gas production wells, miles of pipelines, or the number of gas processing plants), other activity data (e.g. storage tank throughput, the number of various types of pneumatic controllers, and reciprocating engines) are more uncertain. As reported by the EPA (2017b), “petroleum and gas infrastructure consist of millions of distinct emission sources, making measurement of emissions from every source and component practically unfeasible”.
The fugitive emission sector is dominated by CH4 emissions, and this is reflected in the contribution to the total uncertainty of GHG emissions from sector 1.B (Fig. 4e). The upper world uncertainty estimate exceeds 110 %, almost entirely due to CH4 emissions. For the USA, the upper uncertainty estimate for oil and natural gas (Fig. 4c) of 23 % is slightly less than the EPA's upper estimate of 30 % for the natural gas system (EPA, 2017b) and the 29 % estimated by Littlefield et al. (2017), whereas the EPA's uncertainty for the petroleum system is much larger (149 %), possibly due to a higher uAD.
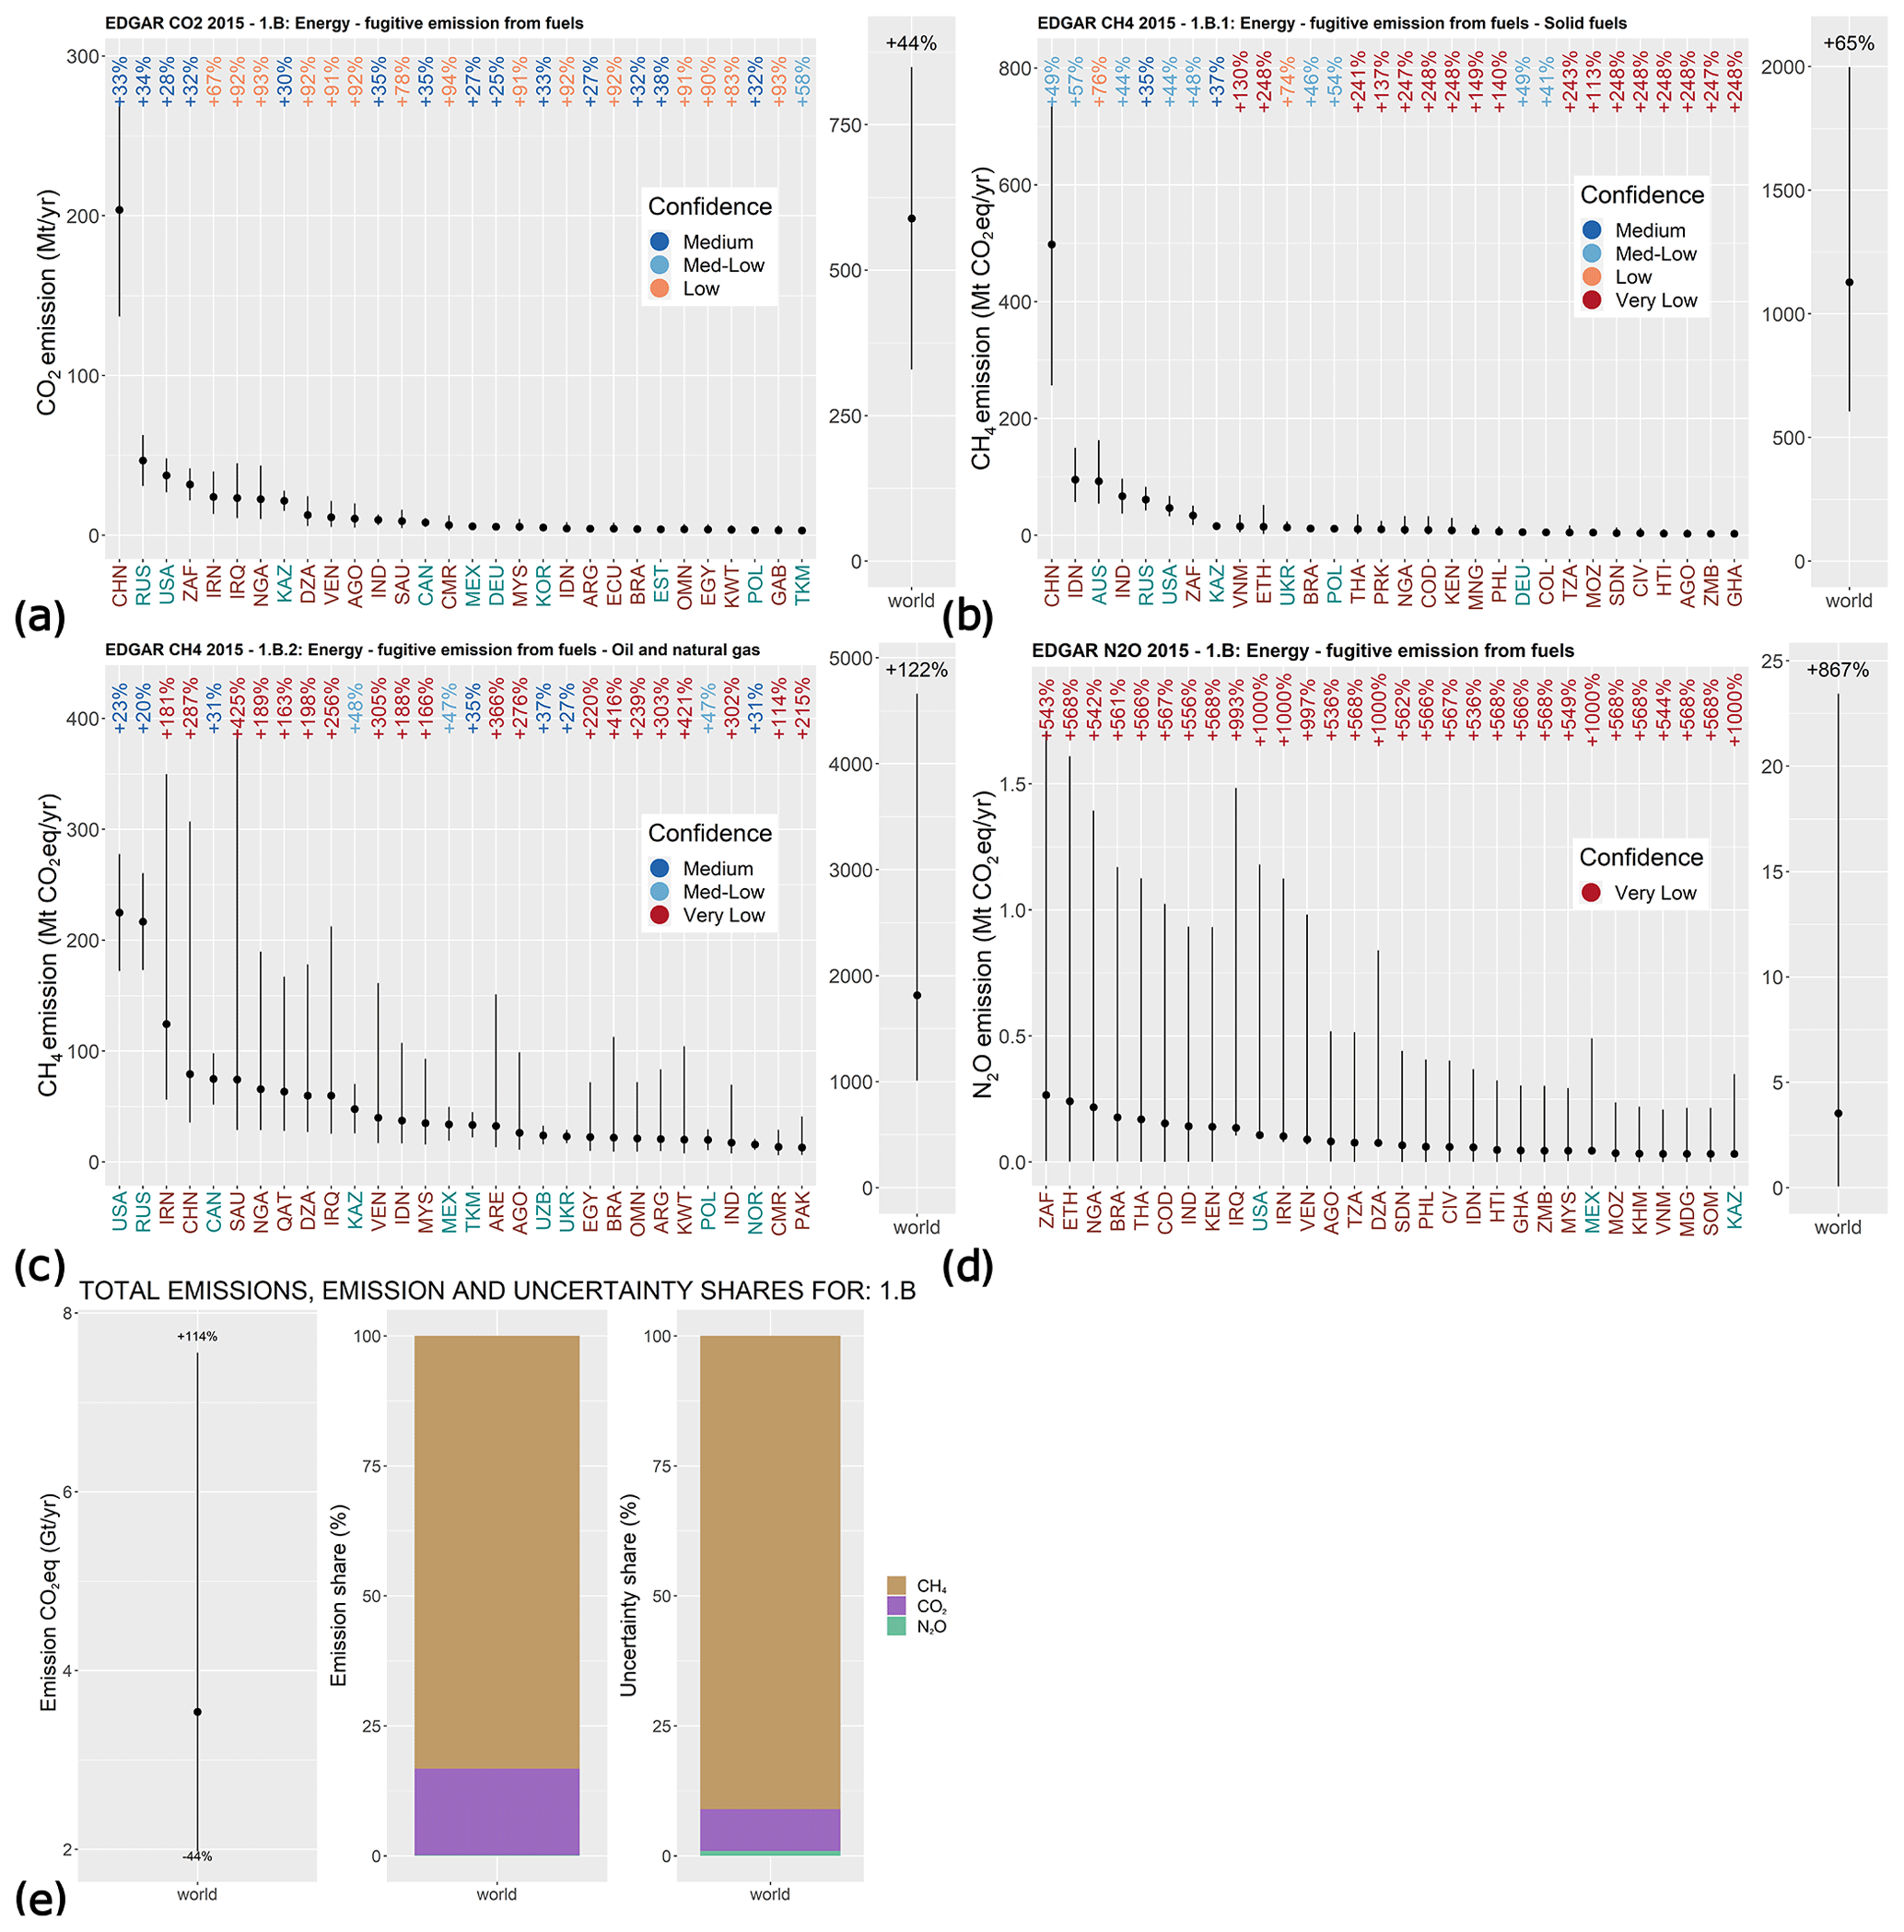
Figure 4GHG emissions from top emitters and the world for sector 1.B (energy – fugitive emissions): (a) CO2 from fugitive emissions from fuels; (b) CH4 from fugitive emissions from solid fuels; (c) CH4 from fugitive emissions from oil and natural gas; (d) N2O from fugitive emissions from fuels; (e) the world total emission uncertainty and the world emission and uncertainty shares. The country names are colour-coded according to their classification (cyan denotes industrialized, and red denotes developing). Confidence levels are given in the following ranges: high (0 %, 10 %]; medium-high (10 %, 20 %]; medium (20 %, 40 %]; medium-low (40 %, 60 %]; low (60 %, 100 %]; and very low > 100 %. (Country codes are given in Table S1.)
The uncertainty of individual countries mirrors the distinction made between developed and developing countries, which is mostly visible for fugitive emissions from oil and natural gas (Fig. 4c) but also in the detailed uEF provided by IPCC-06 for the various emitting stages of extraction, distribution, transport, and storage. The composition of emissions for the five top emitters in sector 1.B.2.b can be used to illustrate this aspect.
The USA and Russia have country-specific EFs that are defined for all stages of the fugitive emissions from natural gas; therefore, the accuracy is higher. Iran, Saudi Arabia, and China have a very large share of emissions due to the production stage of natural gas (approximately 85 %, 97 %, 76 % respectively; Table 5), to which 75 % applies, and a much lower share of emissions apportioned to the other stages (i.e. transmission and distribution), approximately 10 % due to gas distribution with an uncertainty of −40 % to +500 % (including the correction factor from Eq. 4); this contributes to the very low confidence in the emission estimates shown in Fig. 4e, compared with the medium confidence for USA and Russia, to which country-specific uEF values are applied (±25 %) (Table 3). The high uncertainty in the transmission and distribution sectors is the main cause for the difference in uncertainty apportionment.
Table 5Share of CH4 emissions in sector 1.B.2.b (fugitive emissions from natural gas) for the five top emitting counties.

The variability in bottom-up estimates of CH4 emissions from coal mining (−29 %, +43 %) and natural gas and oil systems (−16 %, +15 %), as recently reported by Saunois et al. (2020), stems from the methodologies and parameters used, including emission factors, “which are country- or even site-specific, and the few field measurements available often combine oil and gas activities and remain largely unknown” (Saunois et al., 2020). The authors reported examples of very large variability in EFs between inventories, which even reached 2 orders of magnitude for oil production and 1 order of magnitude for gas production. Moreover, large uncertainties in the emissions of CH4 from venting and flaring at oil and gas extraction facilities were reported by studies such as Peischl et al. (2015). The gas distribution stage is a further large source of uncertainty, in particular in countries with old gas distribution city networks using steel pipes now distributing dry rather than wet gas, with potentially more leakages (Janssens-Maenhout et al., 2019). Analysis based on inversion modelling by Turner et al. (2015) found an error variability of −43 % to 106 % for the North America region (with respect to the prior estimate based on EDGAR v4.2) that was attributed to emissions from oil and gas. Hence, the uncertainty in Fig. 4c might be too low for industrialized countries. For completeness, we show an alternative application of uncertainty ranges for sector 1.B.2 (oil and gas), as suggest by Olivier (2002), assigning and ±15 % (for industrialized and developing countries respectively) as well as 100 % to all countries and a uEF of 50 % to countries for which EFs are specifically estimated (Tier 3).
The resulting distribution (Fig. 5) reflects the comparable uncertainty of these emissions across countries. The global uEMI is approximately 100 % and, thus, slightly less than the uncertainty obtained by applying the IPCC-06 recommendations (122 %; Fig. 4e).
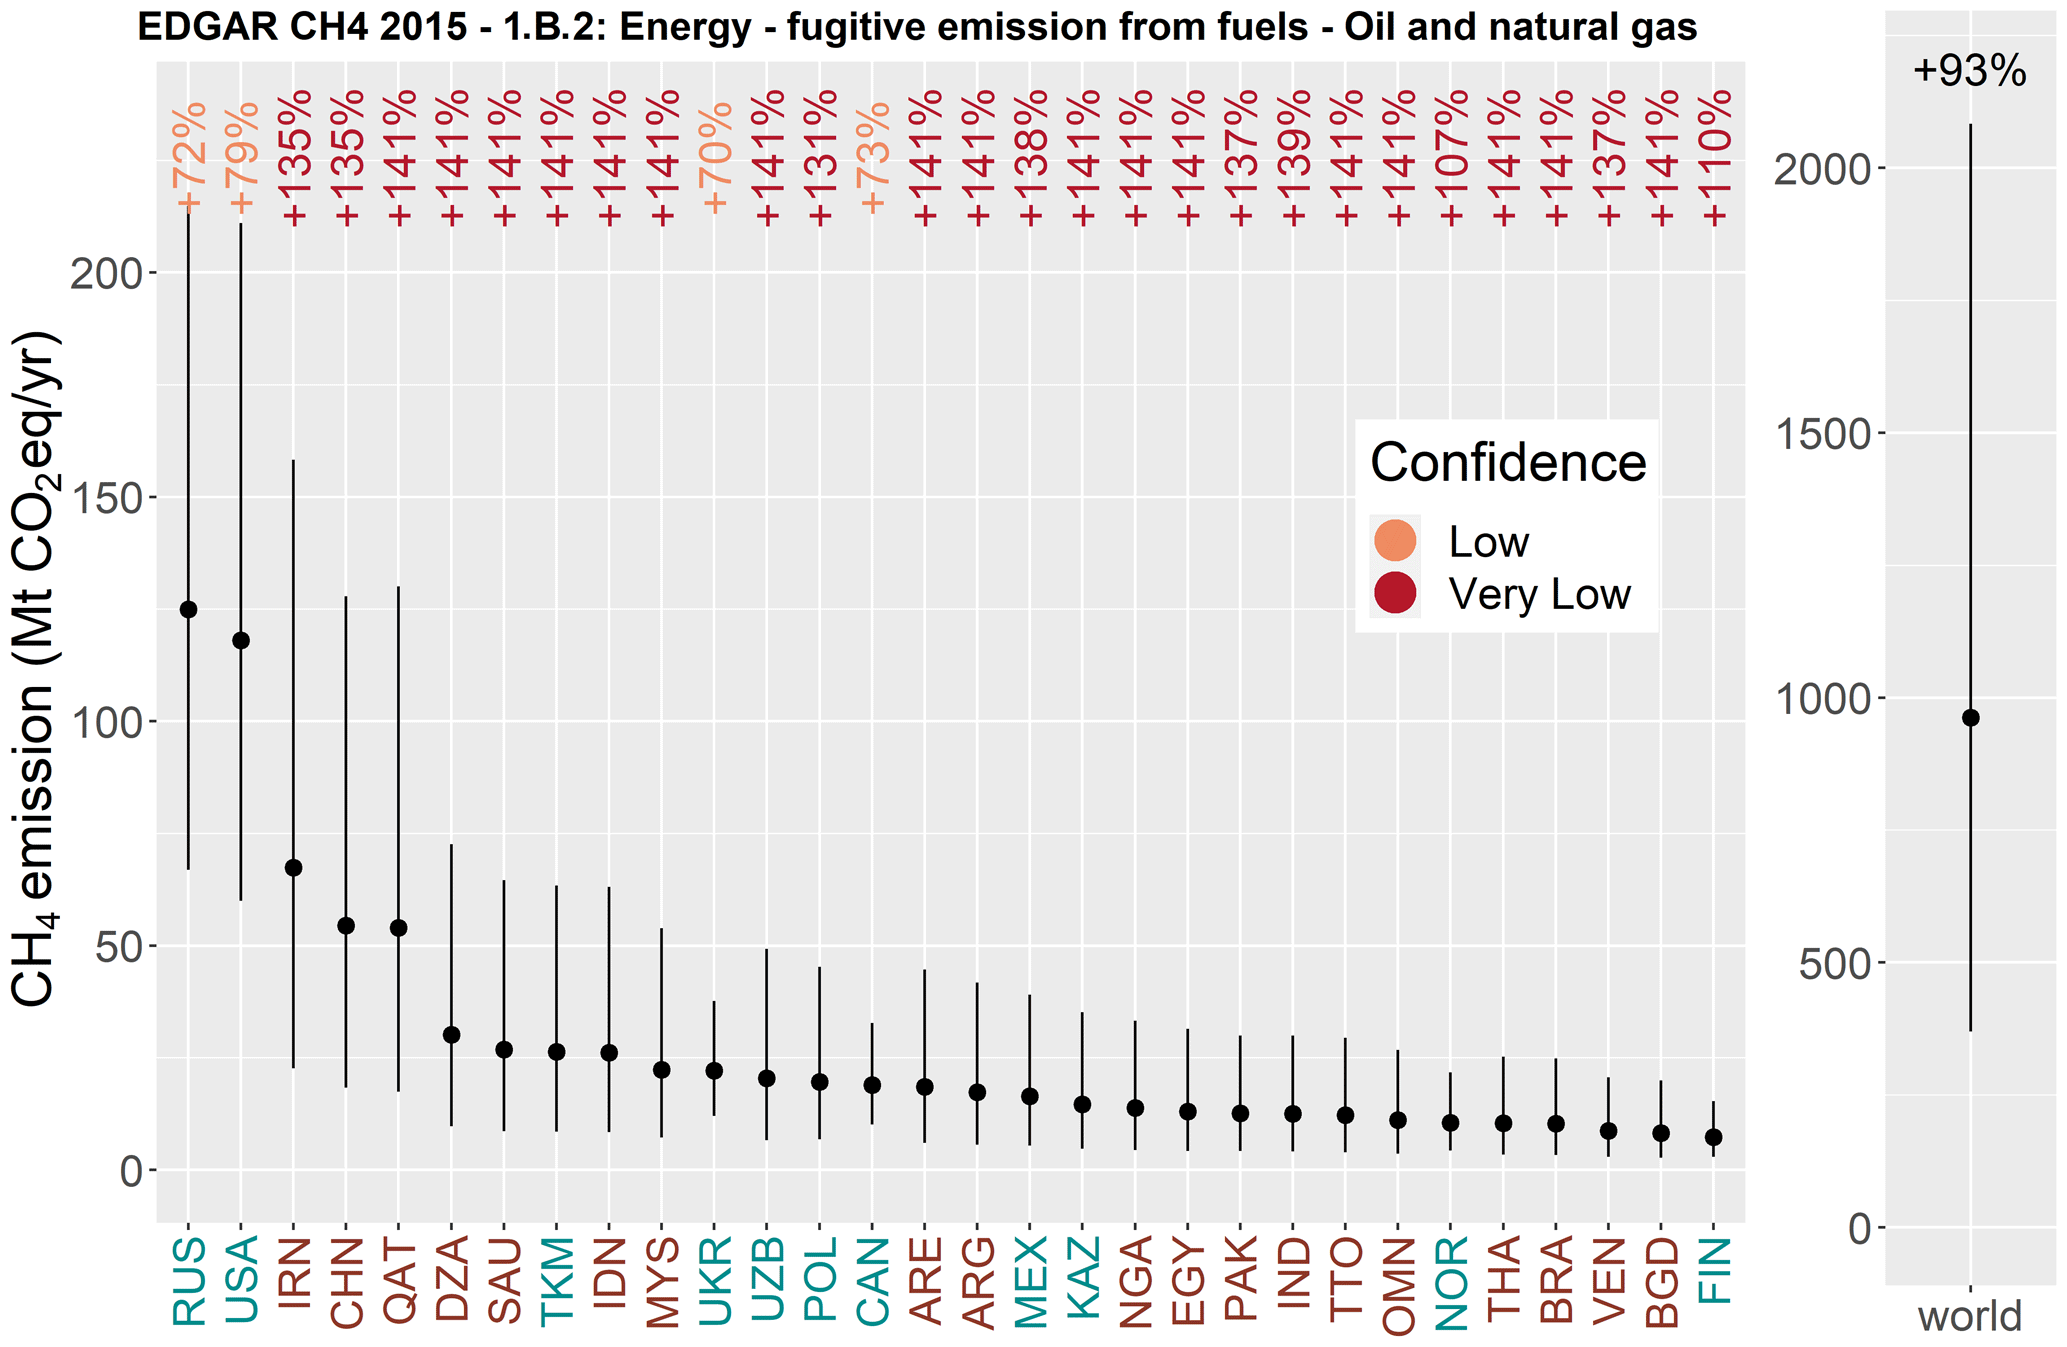
Figure 5Methane emissions from the top emitters and the world for sector 1.B.2 (energy – fugitive emissions from oil and natural gas) with a revised uEF and uAD (see text). Colour codes are the same as in Fig. 4.
3.1.3 Industrial processes and product use (IPPU)
IPCC category 2 covers non-combustion emissions from industrial production of cement, iron and steel, lime, soda ash, carbides, ammonia, methanol, ethylene, adipic and nitric acid and other chemicals, and the non-energy use of lubricants and waxes (Janssens-Maenhout et al., 2019). The EDGAR sectors CHE (production of chemicals), FOO (food production), PAP (paper and pulp production), IRO (iron and steel), non-energy use of fuels (NEU), non-ferrous metal production (NFE), and non-metallic minerals production (NMM) cover the industrial process emissions.
Activity statistics for industrial processes are retrieved from several reporting providers, as detailed by Janssens-Maenhout et al. (2019) and Crippa et al. (2019). For this class of processes uAD values are higher than uEF values due to the deficiency in or incompleteness of country-specific data and the reluctancy of companies to disclose production data. CO2 emissions in EDGAR are based on the Tier 1 EF for clinker production, whereas cement clinker production is calculated from cement production reported by USGS (2016). The fraction of clinker is based on data reported to the United Nations Framework Convention on Climate Change (UNFCCC) for European countries, to the China Cement Research Institute (http://cdi.cnki.net/Titles/SingleNJ?NJCode=N2011080334, last access: 12 April 2021) and the National Bureau of Statistics of China (for historic years) for China, and to “Getting the Numbers Right” for non-Annex I countries (https://gccassociation.org/gnr/, last access: 12 April 2021). According to IPCC-06, the uncertainty for cement production stems prevalently from the uAD and, to a lesser extent, from the uEF for clinker (IPCC-06, chap. 2). For Tier 1, the major uncertainty component is the clinker fraction of the cement(s) produced, and the uAD can be as high as 35 %. We assume a uEMI from 11 % to 60 % depending on the accuracy of clinker data.
As for cement, the uAD for lime outweighs the uEF due to the lack of country-specific data. We assume a uAD of ±35 % and %. For glass, glass production data are typically measured accurately, as reflected by % suggested by IPCC-06, whereas the suggested uEF for Tier 1 is ±60 %. The uEF for other carbonates (e.g. limestone) is due to the variability in composition and is very low (∼1 % to 5 %), whereas the uAD can be much larger due to poor-quality statistics and is assumed to be ±35 %.
The production of ammonia, nitric, and adipic acid as well as caprolactam and glyoxylic and glyoxylic acid is known with high degree of accuracy and the uAD for these processes can be estimated as ±2 %. The corresponding uEF is reported in Tables 2 and 3 and is derived from expert judgement and reported in IPCC-06 ( %; %; %). For petrochemical and carbon black production (methanol, ethylene, ethylene dichloride, vinyl, acrylonitrile, and carbon black), IPCC-06 provides reference values for the uEMI associated to these processes (IPCC-06, Vol. 3, chap. 3, Table 3.27), based on expert judgements. The values are reported in Table 3, ranging from ±10 % for CH4 emission for ethylene production to ±85 % for CH4 emission from carbon black production.
As summarized in Table 1, the AD for iron and steel (including furnace technologies) production are considered very accurate, with %; for ferroalloys, uAD is set to ±10 % for industrialized countries and % for developing countries, based on expert judgement (IPCC-06 suggests %). The data for iron production are updated monthly using data from the World Steel Association (WSA, 2019), whereas data for ferroalloys are extrapolated using trends from United States Geological Survey (USGS) commodity statistics (USGS, 2016). uEF is equal to ±25 %.
Production data for aluminium, magnesium, zinc, and lead are deemed accurate within 2 % to 10 % (Table 1). For aluminium, the reactions leading to CO2 emissions are well understood, the emissions are directly connected to the quantity of aluminium produced (IPCC-06), and the uEF is assumed to be within 10 %. The uEF associated with CO2 emitted from magnesium production is also well understood and is assumed to be within 5 %. Lead and zinc production have a higher uEF (50 %) associated with default emission factors (Tier 1), whereas they have a uEF of 15 % if country-specific data are adopted (Tier 2). CO2 emissions for the non-energy use of lubricants and waxes (like petroleum jelly, paraffin waxes, and other waxes, classified under IPCC sector 2.D.2 and corresponding to EDGAR sector NEU) are assumed to be highly uncertain (uEF of 100 %; uAD of 5 % to 15 %) due to the lack of accurate information and owing to country-specific operating conditions.
CO2 emissions in sector 2 are 1 and 2 orders of magnitude higher than N2O and CH4 emissions respectively (Fig. 6). Nearly 50 % of CO2 emissions in this sector originate from cement production. The accuracy ranges from medium-high to high for all top emitters, and the global uncertainty is 12 %. For N2O, the main source (∼85 %) is the production of nitric and adipic acid, which results in medium-high accuracy both country-wise and globally. Finally, the emission of CH4 is more uncertain due to the large uEF of carbon black and methanol production, which account for ∼52 % of global CH4 emissions in the IPPU sector.
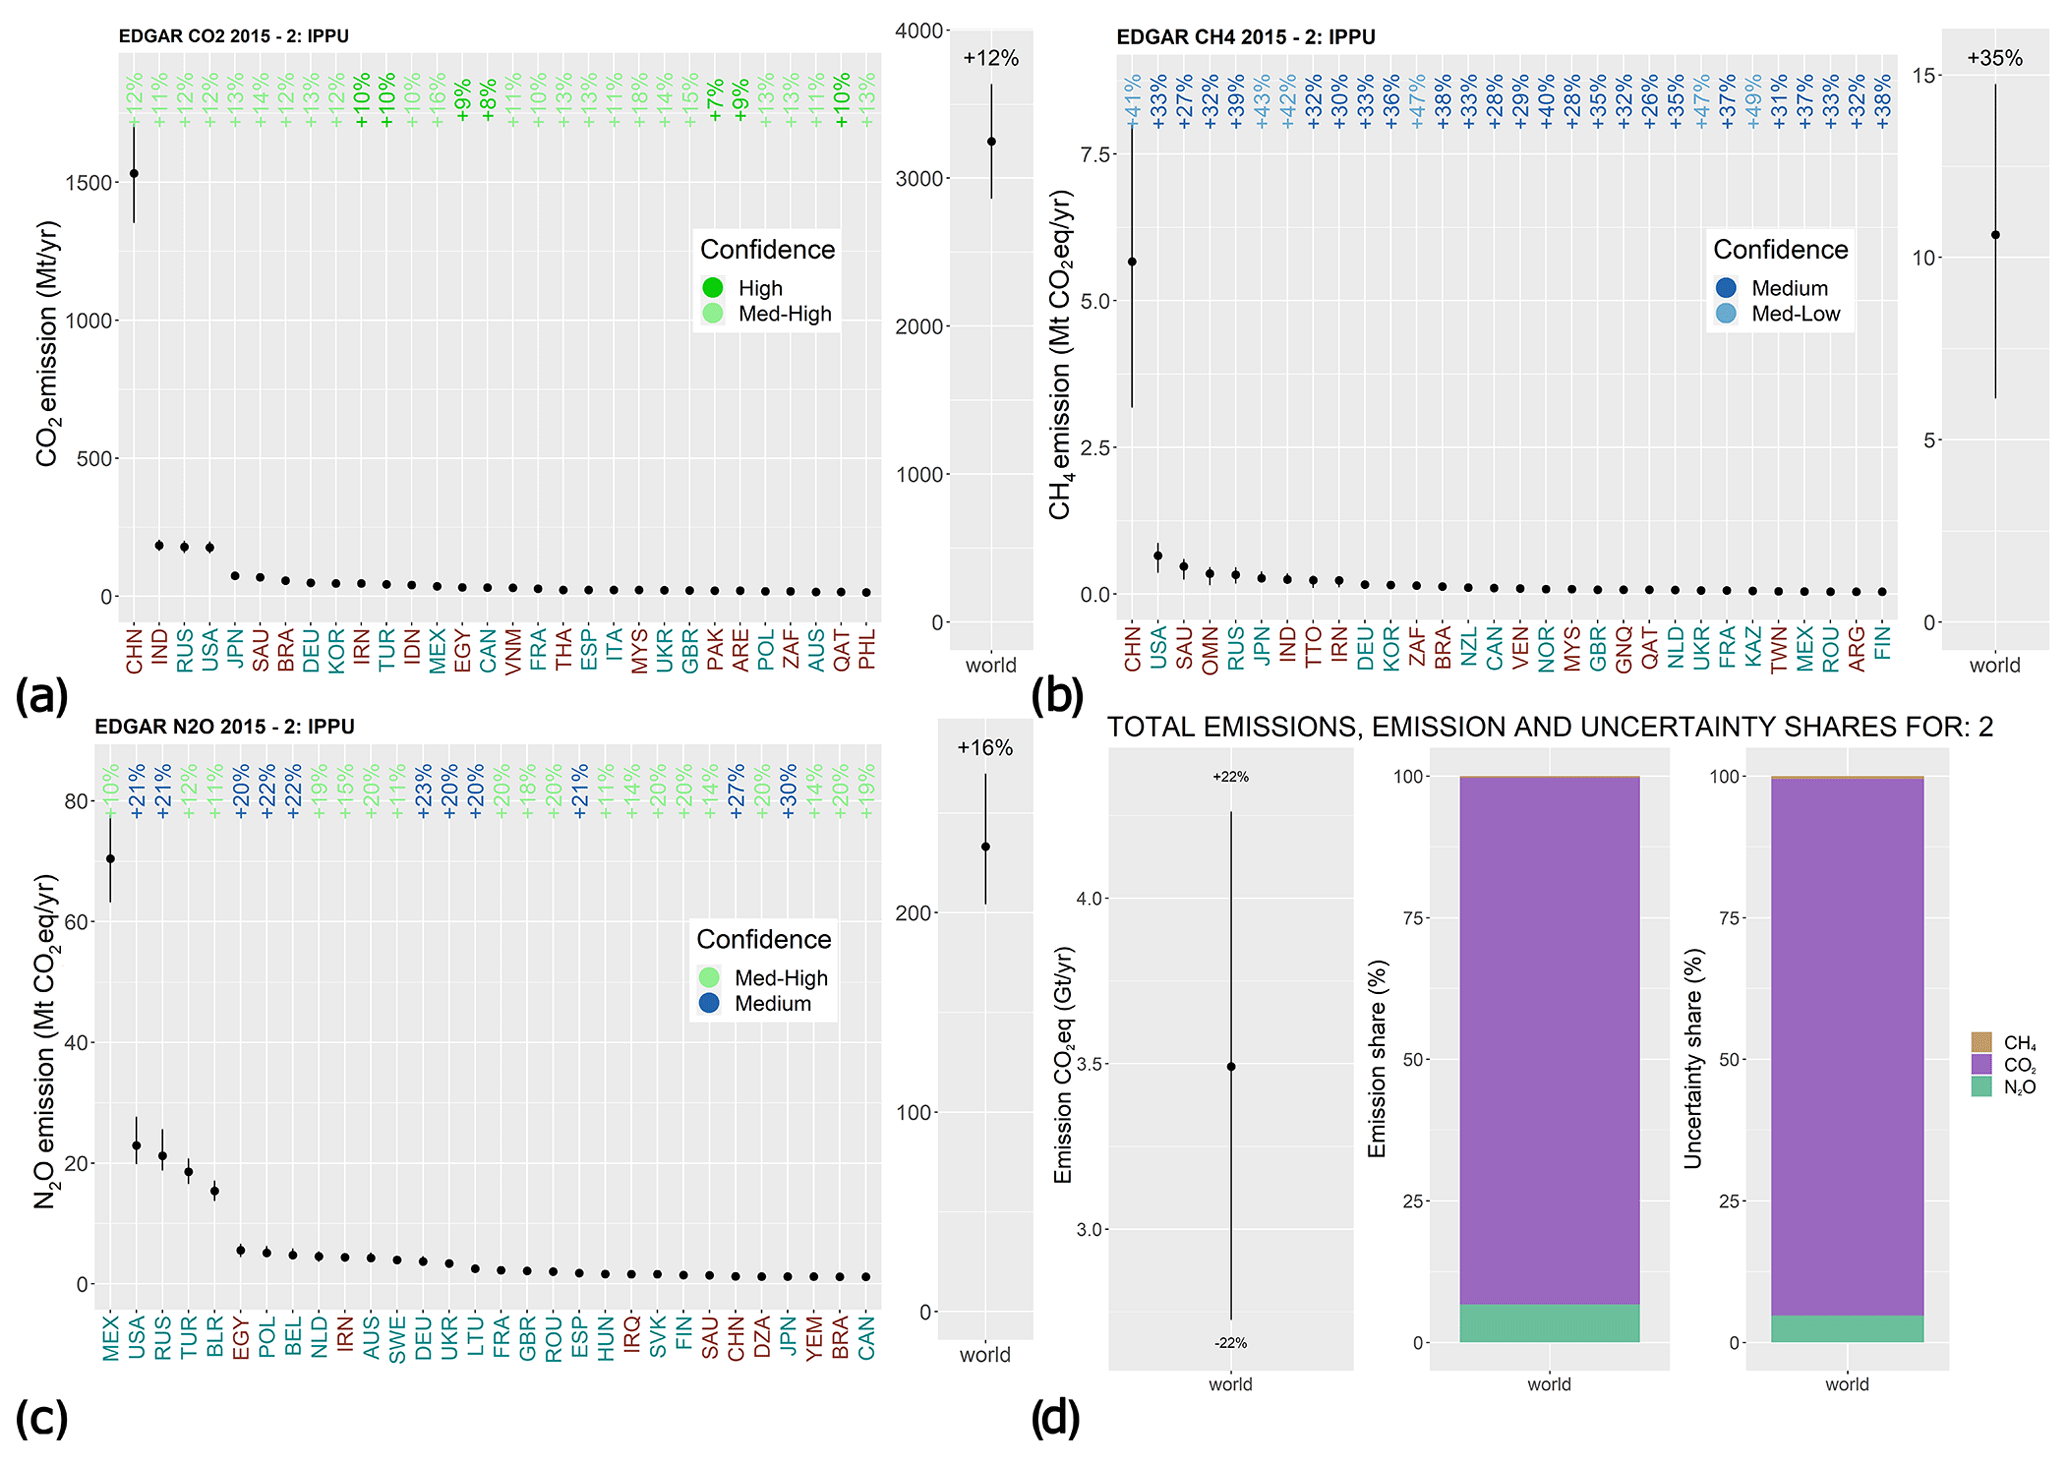
Figure 6GHG emissions from the top emitters and the world for sector 2 (industrial processes and product use): (a) CO2; (b) CH4; (c) N2O; (d) the world total emission uncertainty and the world emission and uncertainty shares. The country names are colour-coded according to their classification (cyan denotes industrialized, and red denotes developing). Confidence levels are given in the following ranges: high (0 %, 10 %]; medium-high (10 %, 20 %]; medium (20 %, 40 %]; medium-low (40 %, 60 %]; low (60 %, 100 %]; and very low > 100 %. (Country codes are given in Table S1.)
3.1.4 Agriculture
Agriculture-related activities in EDGAR partially cover the IPCC category 3 (agriculture, forestry, and land use), including enteric fermentation (ENF, corresponding to 3.A.1), manure management (MNM, corresponding to 3.A.2), waste burning of agricultural residues (AWB.CRP, corresponding to 3.C.1.b – biomass burning of cropland), direct N2O emissions from soil due to natural and synthetic fertilizer use (corresponding to 3.C.4), indirect N2O emissions from manure and soils (corresponding to 3.C.5 and 3.C.6 respectively), urea and agricultural lime (AGS.LMN and AGS.URE, corresponding to IPCC codes 3.C.2 and 3.C.3 respectively), and rice cultivation (AGS.RIC corresponding to 3.C.7). Forestry and land use are not covered. Data sources for AD covering the agriculture sector have been compiled by Janssens-Maenhout et al. (2019).
For the ENF and MNM sectors, EDGAR follows IPCC-06 for estimating emissions, with animal counting data from FAOSTAT (2018). For ENF, uncertainty in AD is due to cattle numbers, feed intake, and feed composition, whereas the distribution of manure (volatile solids) in different manure management systems is also a source of uncertainty for MNM. The uAD for these sectors is estimated at % to account for uncertainty in the manure management system usage and the lack of detailed characteristics on the livestock industry, information on how manure management is collected, and the lack of homogeneity in the animal counting systems (IPCC-06; Olivier, 2002). The estimate is slightly higher than the uAD from other US studies for ENF (EPA, 2017a; Hristov et al., 2017), whereas the uAD of ±20 % for MNM might be underestimated according to studies such as Hristov et al. (2017). EFs are calculated following the IPCC-06 methodology, using country-specific data of milk yield and carcass weight integrated with trends from FAOSTAT (2018) for cattle and using regional EFs for livestock. The Tier 1 uEF for ENF and MNM is estimated to be larger than ±50 % (with a minimum of 30 %) unless livestock characterization is known with great accuracy, in which case Tier 2 uncertainty can be % (IPCC-06).
AD for burning of agriculture waste (AWB.CRP) can be highly uncertain, especially in developing countries, due to several factors including the estimates of the area planted under each crop type for which residues are normally burnt and the fraction of the agricultural residue that is burnt in the field. EDGAR estimates the fraction of crop residues removed and/or burned using data from Yevich and Logan (2003) and from official country reporting. Uncertainty is deemed very high, in the range from % to 100 % (Olivier, 2002; Olivier et al., 1999a). EFs for this sector are obtained from the mass of fuel combusted, provided by IPCC-06 as default (Tier 1) EFs for stationary combustion in the agricultural categories, and are estimated with an uncertainty of % to +275 % for N2O and % to ±150 % for CH4, according to the uncertainty for combustion processes.
Emissions from rice cultivation are relevant to CH4. According to the last release of EDGAR, in 2015 almost 10 % of total CH4 emissions were due to rice cultivation. The default, baseline EF for rice cultivation has an uncertainty in the range from −40 % to +70 %, which has been substantially reviewed in the IPCC (2019) refinement, both in terms of EF value and uncertainty. The refinement also gives regionally dependent EF and uncertainty ranges, although these have not yet been implanted in EDGAR; therefore, we refer to the IPCC-06 guidelines. In EDGAR the baseline EF is multiplied by a set of scaling factors that account for the water regimes before and during the cultivation period: upland (UPL, never irrigated), irrigated (IRR), rain fed (RNF) and deep water (DWP). These scaling factors are assigned the following uncertainty (derived from IPCC-06): IRR ranges from −20 % to +26 %; UPL is 0 %; RNF and DWP range from −22 % to +26 %. Organic amendments and the soil type are not included. The AD consist of cultivation period and annual harvested area for each water regime, are derived from FAO (2011), and are complemented with data from IRRI (2007) and IIASA (2007). We assume a uAD from 5 % to 10 % (Olivier, 2002). All of these conditions together yield an uncertainty range from −0.45 % to +75 % for RNF, DWP, and IRR, and from −0.41 % to +70 % for UPL.
AD for sectors 3.C.2 (CO2 emissions from liming) and 3.C.3 (CO2 emissions from urea application) are derived from FAOSTAT (2018) as well as from official country reporting. The uncertainty of emissions of CO2 from lime (urea) fertilization stems from uncertainties in the amount of urea applied to soils and from uncertainties regarding the quantity of the carbonate application that is emitted as CO2. The uAD is assumed to be 20 % (Olivier et al., 1999a) to account for uncertainty in sales, import and export, and the usage data adopted to derive the AD. EFs are derived from IPCC-06 Tier 1, assuming that all C in urea is lost as CO2 in the atmosphere, which might give rise to systematic bias. The uEF is assumed to be between ±50 % and ±100 %.
Sectors 3.C.4, 3.C.5, and 3.C.6 cover direct and indirect N2O emissions from managed soils and manure management. AD are taken from FAOSTAT (2018) and UNFCCC (2018). Nitrogen from livestock data for developed countries is derived from the Common Agricultural Policy Regional Impact (CAPRI) model (Leip et al., 2011) and can be considered as Tier 3 level accuracy. Indirect N2O emissions are due to leaching and runoff of nitrate and are subject to various sources of uncertainty (both AD and EFs) due to natural variability and the volatilization and leaching factors; poor measurement coverage and under-sampling; incomplete, inaccurate, or missing information on the observance of laws and regulations related to handling and application of fertilizer and manure; and changing management practices in farming (IPCC-06). For these sectors, the uAD is estimated to be ±20 %, and the uEF is in the range from ±65 % to ±200 % (according to IPCC-06). Studies such as Philibert et al. (2012) and Berdanier and Conant (2012) suggest that the uncertainty in N2O emissions due to N fertilization can be up to a factor 5 lower.
The large variation of N2O emissions in time and space is well recognized (e.g. Stehfest and Bouwman, 2006). Spatial heterogeneity, in particular, is largely driven by soil properties, and the influence of soil properties changes with scale and is responsible for the large confidence intervals given for the IPCC EFs (Milne et al., 2014).
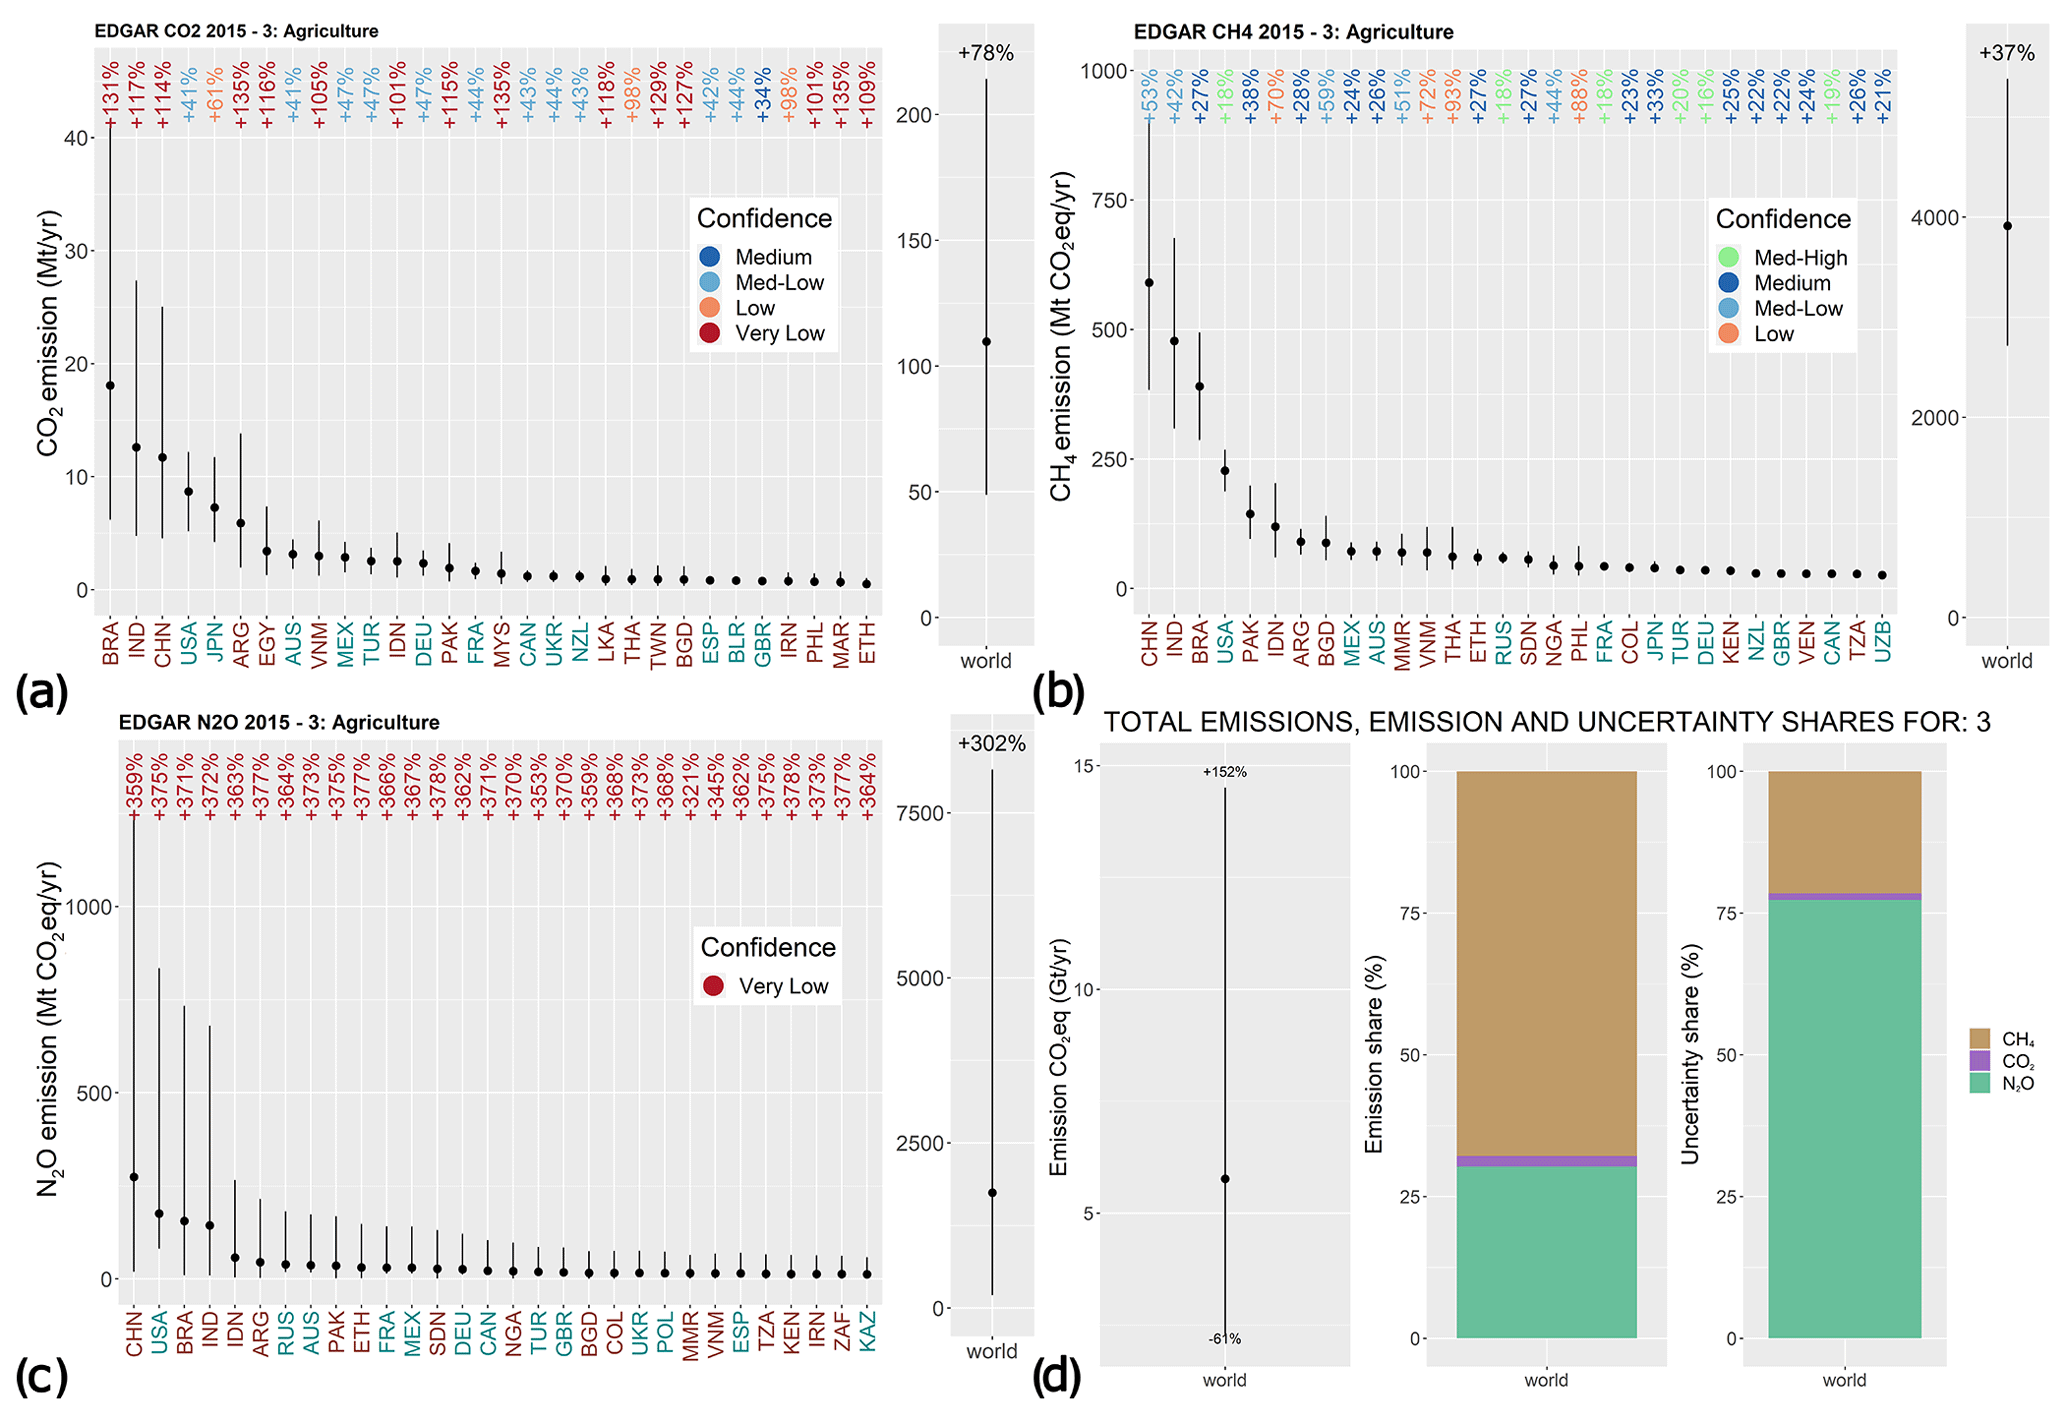
Figure 7GHG emissions from the top emitters and the world for sector 3 (agriculture), in CO2 eq.: (a) CO2; (b) CH4; (c) N2O; (d) the world total emission uncertainty and the world emission and uncertainty shares. The country names are colour-coded according to their classification (cyan denotes industrialized, and red denotes developing). Confidence levels are given in the following ranges: high (0 %, 10 %]; medium-high (10 %, 20 %]; medium (20 %, 40 %]; medium-low (40 %, 60 %]; low (60 %, 100 %]; and very low > 100 %. (Country codes are given in Table S1.)
With a few exceptions, the confidence in emission estimates from agriculture varies between medium and low for CO2 and CH4 (Fig. 7a, b) depending on the composition of the agricultural sources and on the accuracy assigned to the specific country (developing vs. industrialized). N2O (Fig. 7c) emissions are very uncertain (in excess of 300 %), which is reflected in the global share of uncertainty (over 90 %, although the share of global N2O emissions does not exceed 30 %; Fig. 7d).
For the UK, Milne et al. (2014) estimated a 95 % confidence interval of −56 % to +139 % and Brown et al. (2012) estimated a range from −93 % to +253 %, whereas Monni et al. (2007) estimated a range from −52 % to +70 % for Finland (but based on older and more conservative IPCC guidelines). Our uncertainty estimates for the UK for the 3.C.4, 3.C.5, and 3.C.6 sectors combined is from −74 % to 305 % (as a direct effect of assuming full correlation; in fact, if the three sectors were considered to be uncorrelated, the 95 % confidence interval for the UK would range from −59 % to +259 %, which is in line with the other estimates).
Uncertainties due to rice cultivation and enteric fermentation outweigh the uncertainty from other sources, being the dominant emission shares over the emissions from burning of crop residues (which have higher uncertainty but a lower impact on overall emissions; Fig. 8). Agricultural uncertainties in China are attributable to rice cultivation (∼80 %), whereas rice emission accounts for less than 60 % of the agriculture total. Similarly, the uncertainty due to enteric fermentation dominates the USA agriculture uncertainty (75 % share).
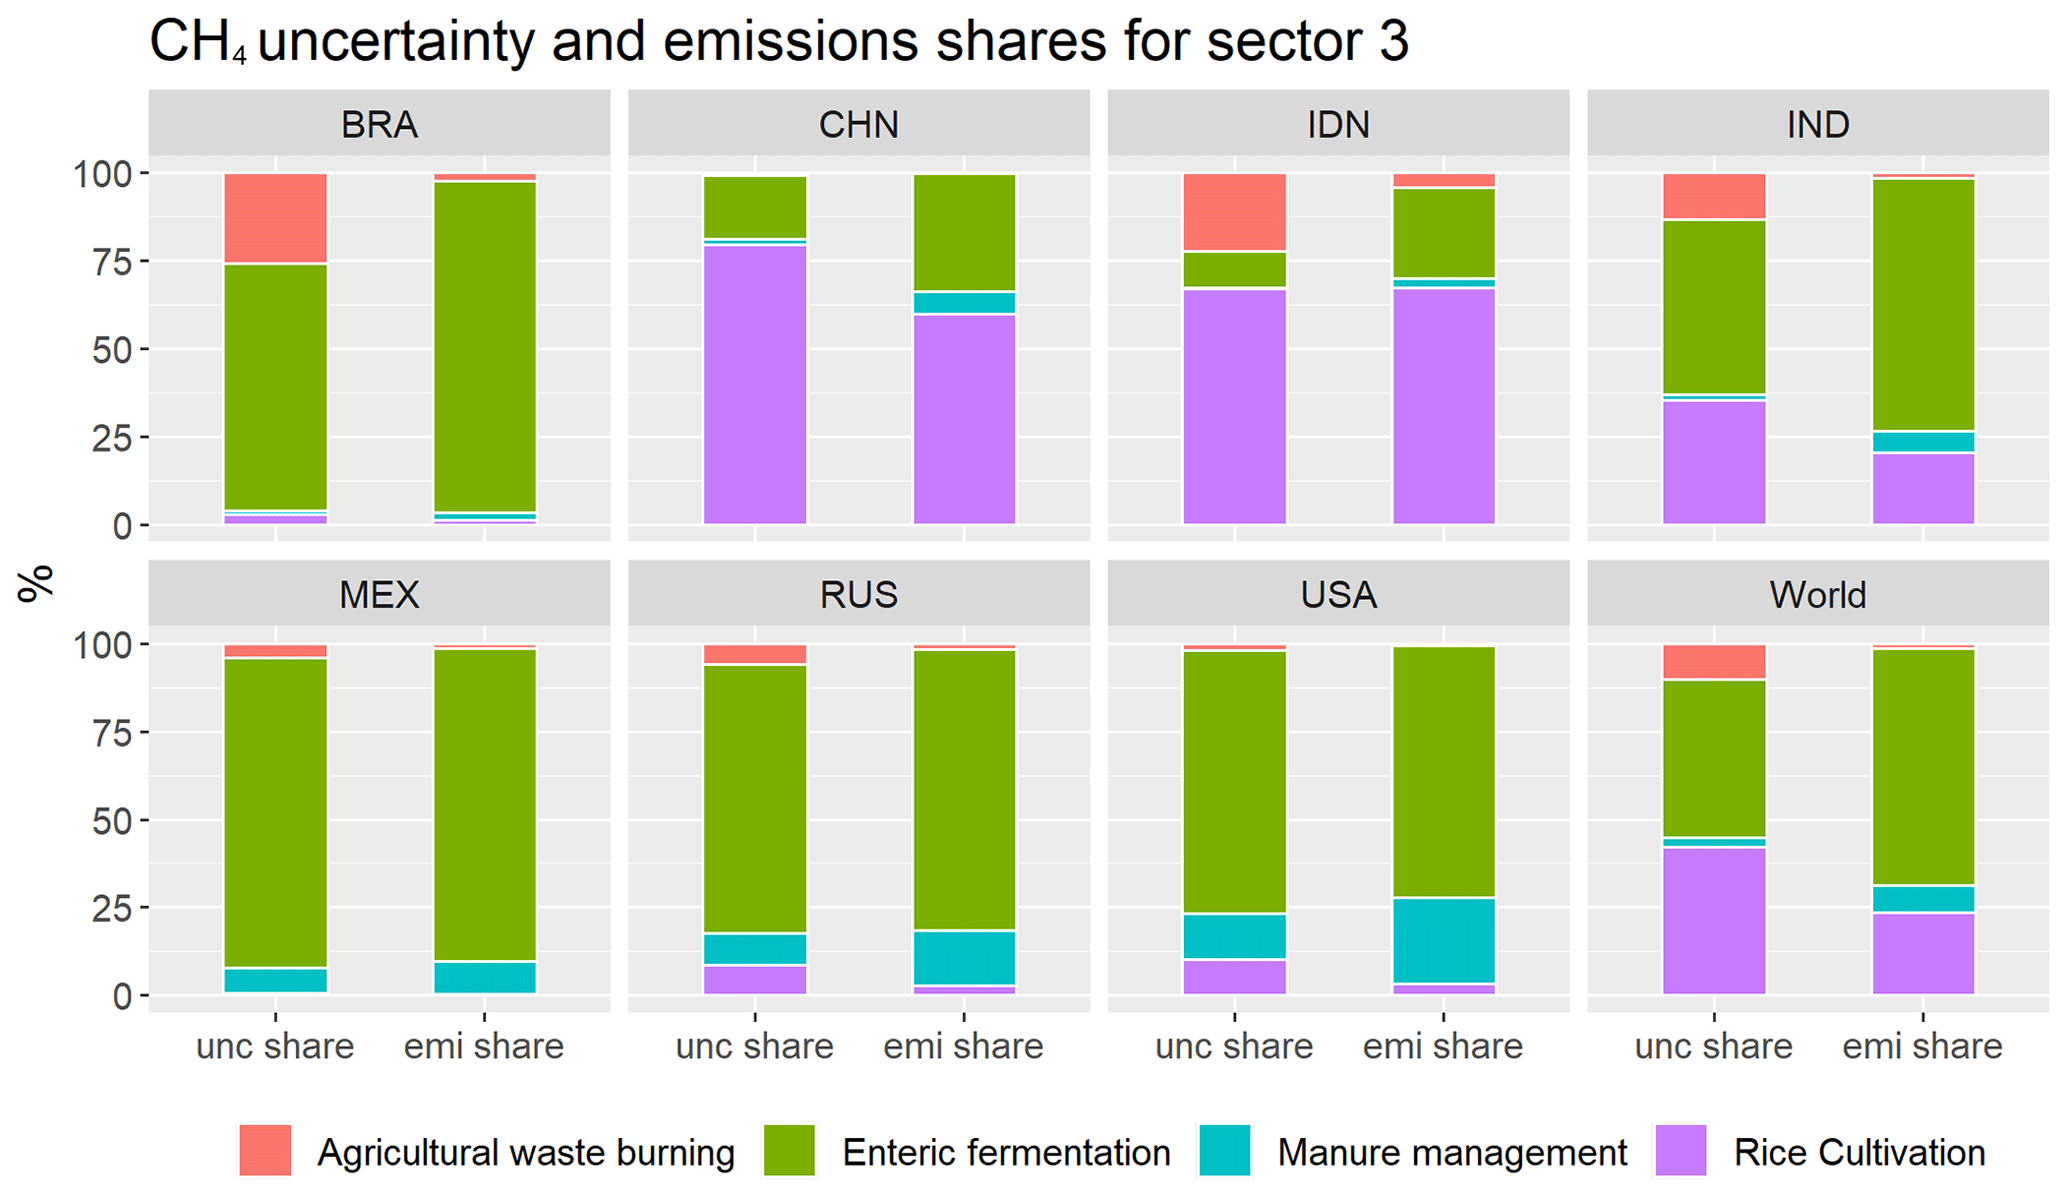
Figure 8CH4 uncertainty and emissions shares for EDGAR's emission sectors under IPCC category 3 for Brazil, China, Indonesia, India, Mexico, Russia, the USA, and the world.
3.1.5 Waste
The waste-related emissions in EDGAR correspond to IPCC category 4 (waste), including emissions from managed and non-managed landfills (SWD; solid waste disposal on land and incineration; categories 4.A, 4.B, and 4.C), wastewater handling (domestic WWT.DOM and industrial WWT.IND, categories 4.D.1 and 4.D.2, emitting CH4 and N2O), and waste incineration (emitting CH4, N2O, and also CO2). Globally, the waste sector accounts for 4.4 % of the total GHG anthropogenic emissions in 2015 and 21.5 % of the total anthropogenic CH4 emissions (Crippa et al., 2019).
In EDGAR, emissions are based on a combination of population and solid and liquid waste product statistics. CH4 emissions from landfills are calculated following the first-order decay model proposed by IPCC-06, which assumes that emissions do not occur instantaneously but are spread over several years. The model depends on several parameters (Tables 1, 3), and the main factor in determining the CH4 generation potential is the amount of degradable organic carbon (DOC) (IPCC-06; Olivier, 2002; Janssens-Maenhout et al., 2019). The average weight fraction of DOC under aerobic conditions is provided by the IPCC Waste Model for 19 regions, which has been used as the default for all countries. Moreover, the default parameters for the methane correction factor (MCF), constant (k), and the oxidation factor (OX) are adopted (the full details are given in Table 1 of Janssens-Maenhout et al., 2019). Each component of the waste model has been assigned a normal distribution using the 95 % confidence interval defined in Tables 1 and 3 and combined using a sample population of 10 000 elements. The range of overall uncertainty is between 35 % and 134 % for CH4 and between 10 % and 490 % for N2O.
For the incineration of waste, AD are derived from the UNFCCC National Inventory Report (NIR), IPCC-06, country reports, and scientific literature, extrapolated using population trends (e.g. for countries with scarce data on municipal solid waste), whereas data for composting (category “other”) are obtained from the UNFCCC NIR for Annex I countries and the scientific literature for developing countries and for India (Table 1 of Janssens-Maenhout et al., 2019, and references therein).
As detailed in Janssens-Maenhout et al. (2019), the IPCC-06 default values for wastewater generation and chemical oxygen demand (COD) are used to derive the total organically degradable material (TOW), differentiating by type of industry (meat, sugar, pulp, organic chemicals, and ethyl alcohol). The population from UN-HABITAT statistics (UN-HABITAT, 2016) is used to derive the country-specific percentages of the population residing in urban and rural areas mid-year, with low and high income, for calculating domestic wastewater. Different wastewater treatments are specified with technology-specific CH4 emission factors. For domestic wastewater, sewer to wastewater treatment plants (WWTP), sewer to raw discharge, bucket latrines, improved latrines, public or open pits, and septic tanks are distinguished. The uncertainty of domestic wastewater depends on the technology (sewer to raw discharge, bucket latrine, or improved latrine), as specified in Tables 1 and 3, and is composed of uncertainty in the AD (population data %) and uncertainty in the EF (−33 % to 78 %).
Uncertainty in the AD for industrial wastewater data ranges between −56 % and 103 %, estimated using the IPCC-06 suggested values, which are in line with the range of −50 % to 100 % provided by Olivier (2002). Uncertainty in the EF includes 30 % uncertainty for the maximum CH4 producing capacity (parameter B0) and uncertainty in the CH4 correction fraction of −50 % to 100 % (based on the range of default values for the MCF provided by IPCC-06 in Table 6.8 of Vol. 5).
Emissions of CH4 from the waste sector are 1 order of magnitude higher than N2O and 2 orders higher than CO2 (Fig. 9a–c); although N2O emissions are more uncertain, the share of uncertainty still reflects the share of emissions (Fig. 9d). The confidence in the emission estimates varies from medium to medium-low for CO2 (depending on the developmental status of the country), from medium to very low for CH4 (depending on the developmental status of the country and on the composition of the waste sector, as discussed below), and is very low for N2O (due to high uEF in wastewater).

Figure 9GHG emissions from the top emitters and the world for sector 4 (waste): (a) CO2; (b) CH4; (c) N2O; (d) the world total emission uncertainty and the emission and uncertainty shares. The country names are colour-coded according to their classification (cyan denotes industrialized, and red denotes developing). Confidence levels are given in the following ranges: high (0,10 %]; medium-high (10 %, 20 %]; medium (20 %, 40 %]; medium-low (40 %, 60 %]; low (60 %, 100 %]; and very low > 100 %. (Country codes are given in Table S1.)
The composition of the waste sector for CH4 (Fig. 10) shows that there is a strong correspondence between the emissions share and the uncertainty share. For the USA, landfill emissions account for ∼73 % of waste emissions, and the uncertainty due to landfills is ∼90 %. In India, domestic wastewater accounts for over 85 % of waste emissions, driving the overall uncertainty with 97 %.
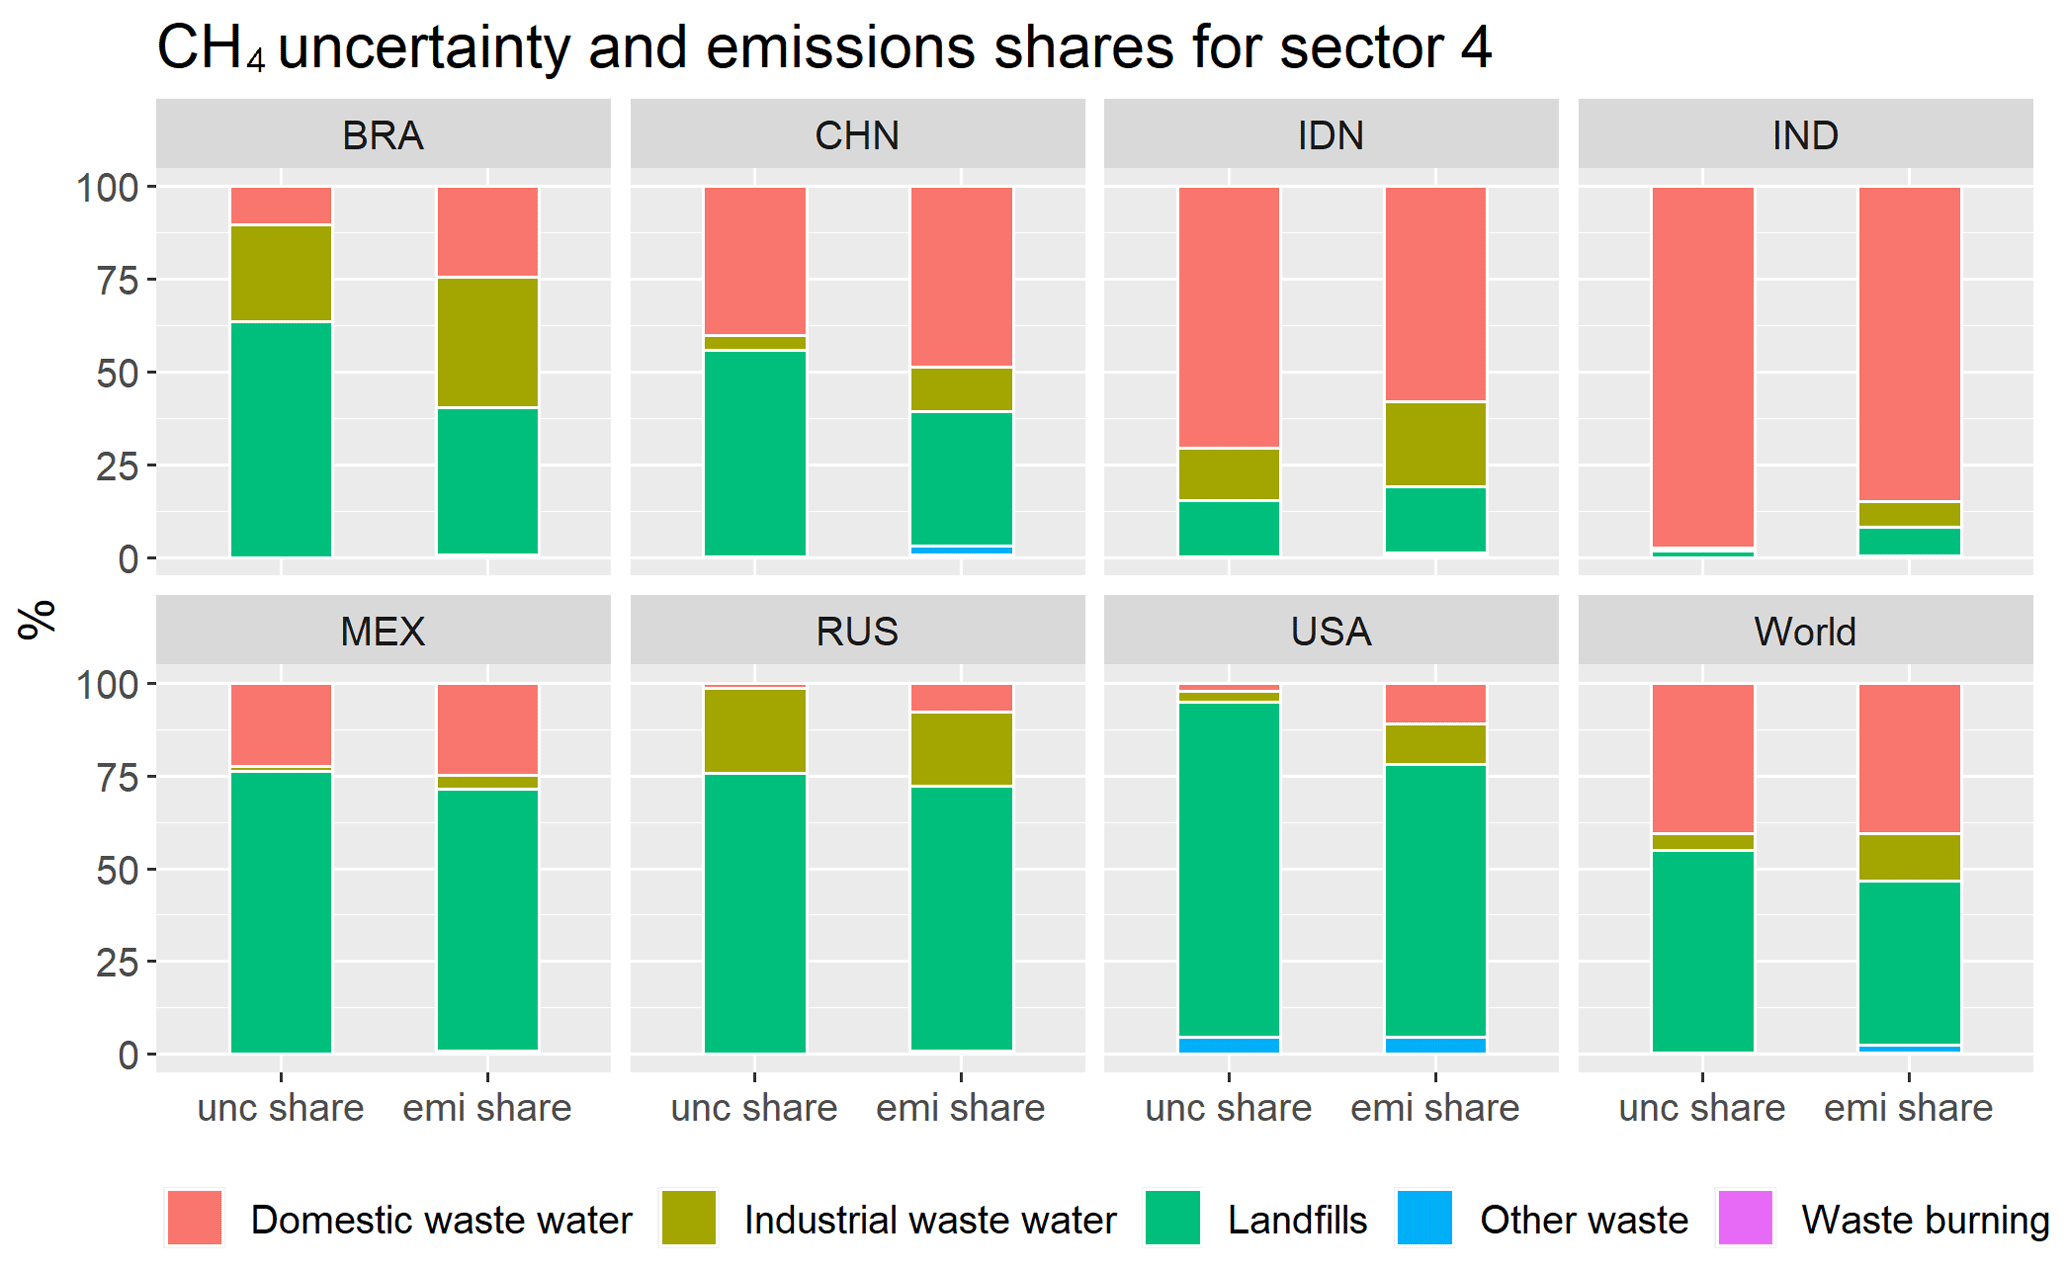
Figure 10CH4 uncertainty and emissions shares for EDGAR's emission sectors under IPCC category 4 for Brazil, China, Indonesia, India, Mexico, Russia, the USA, and the world.
Worldwide, the CH4 emission shares from landfills and domestic wastewater are approximately equivalent (∼44 % and ∼41 % respectively), whereas landfills have a relatively larger weight in the global uncertainty share (∼55 % and ∼41 % respectively).
3.2 The global and European picture
The values in Table 6 summarize the global uncertainty ranges. The uncertainties are first given for each sector and gas individually; they are then given for the sum of the three GHGs for each sector; finally, they are provided for the sum of the three GHGs and for all of the sectors combined. Thus, the last row of Table 6 is the overall EDGAR uncertainty in the worldwide GHG emissions.
Table 6Global uncertainty ranges defining the 95 % confidence intervals of a log-normal distribution. IPPU stands for industrial processes and product use, and GHG stands for greenhouse gas.

Globally, while CO2 is by far the largest emitted GHG (in excess of 75 %), followed by CH4 (19 %), the main source of uncertainty (∼50 %) is N2O (Fig. 11a), followed by CH4 (∼29 %). Agriculture alone accounts for 39 % of the global uncertainty (Fig. 11b), and this is almost entirely due to N2O, as discussed earlier (Fig. 8d); energy accounts for 44 % (almost half of the uncertainty for energy is due to N2O; Fig. 1f); and waste accounts for 11 % of the global uncertainty (driven by CH4 emissions; Fig. 9d).
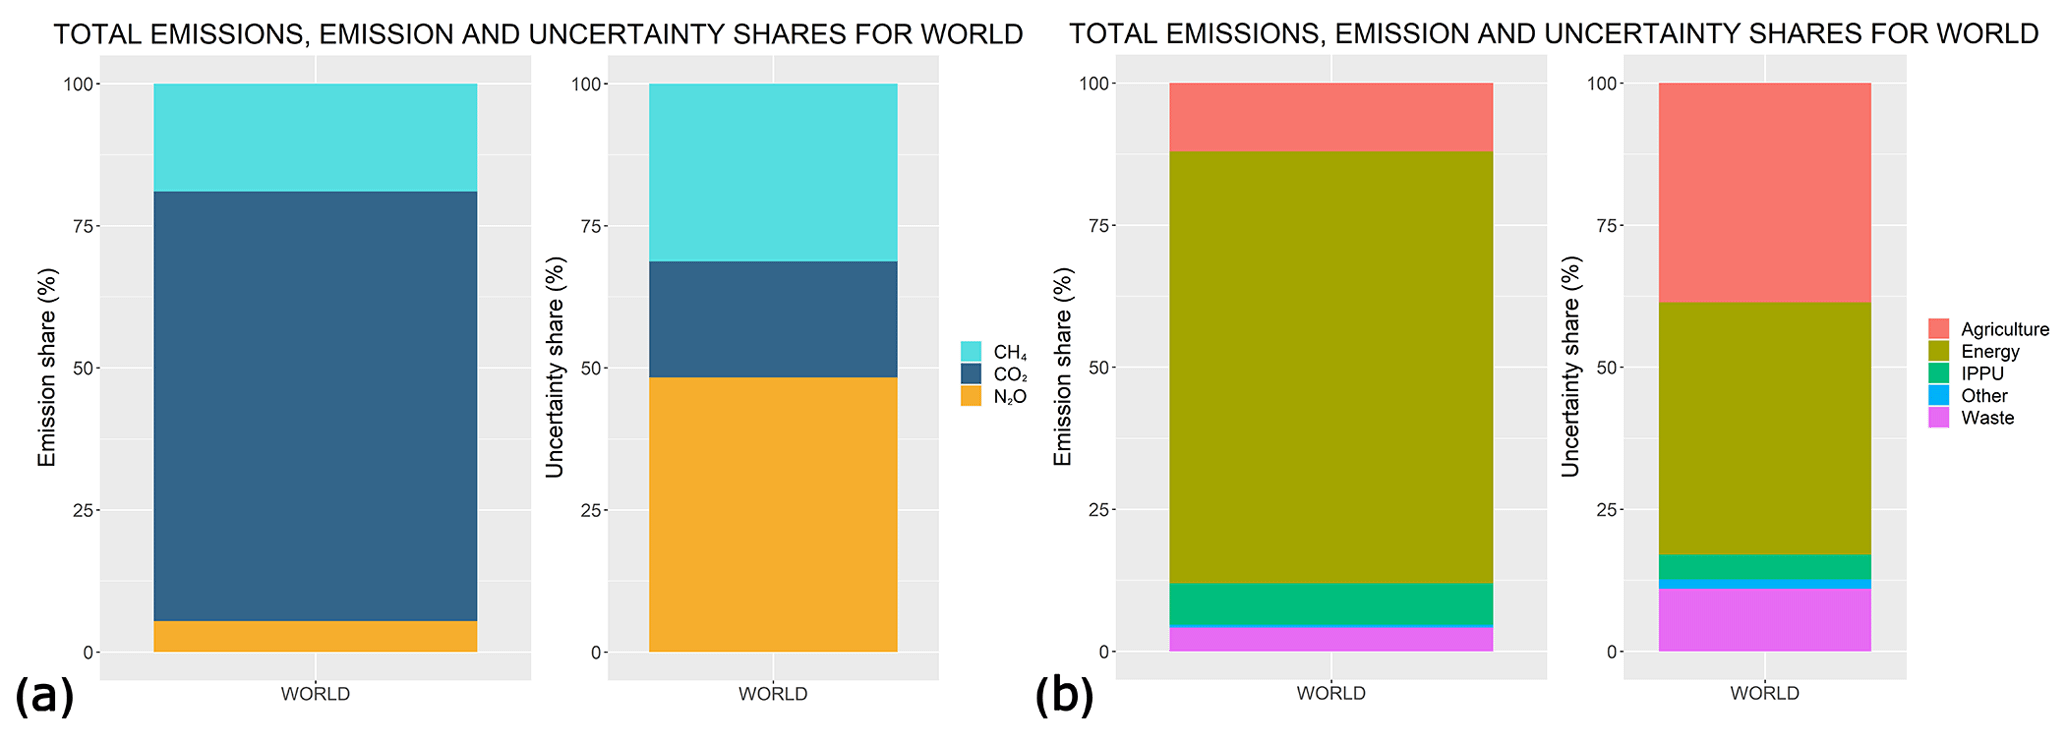
Figure 11Global share of emissions and uncertainty by (a) gas and (b) category. IPPU stands for industrial processes and product use.
The picture is quite similar for EU27+UK (Fig. 12), with the main difference being the larger uncertainty share of N2O (∼70 %) due to the higher level of accuracy associated with CO2 and CH4.
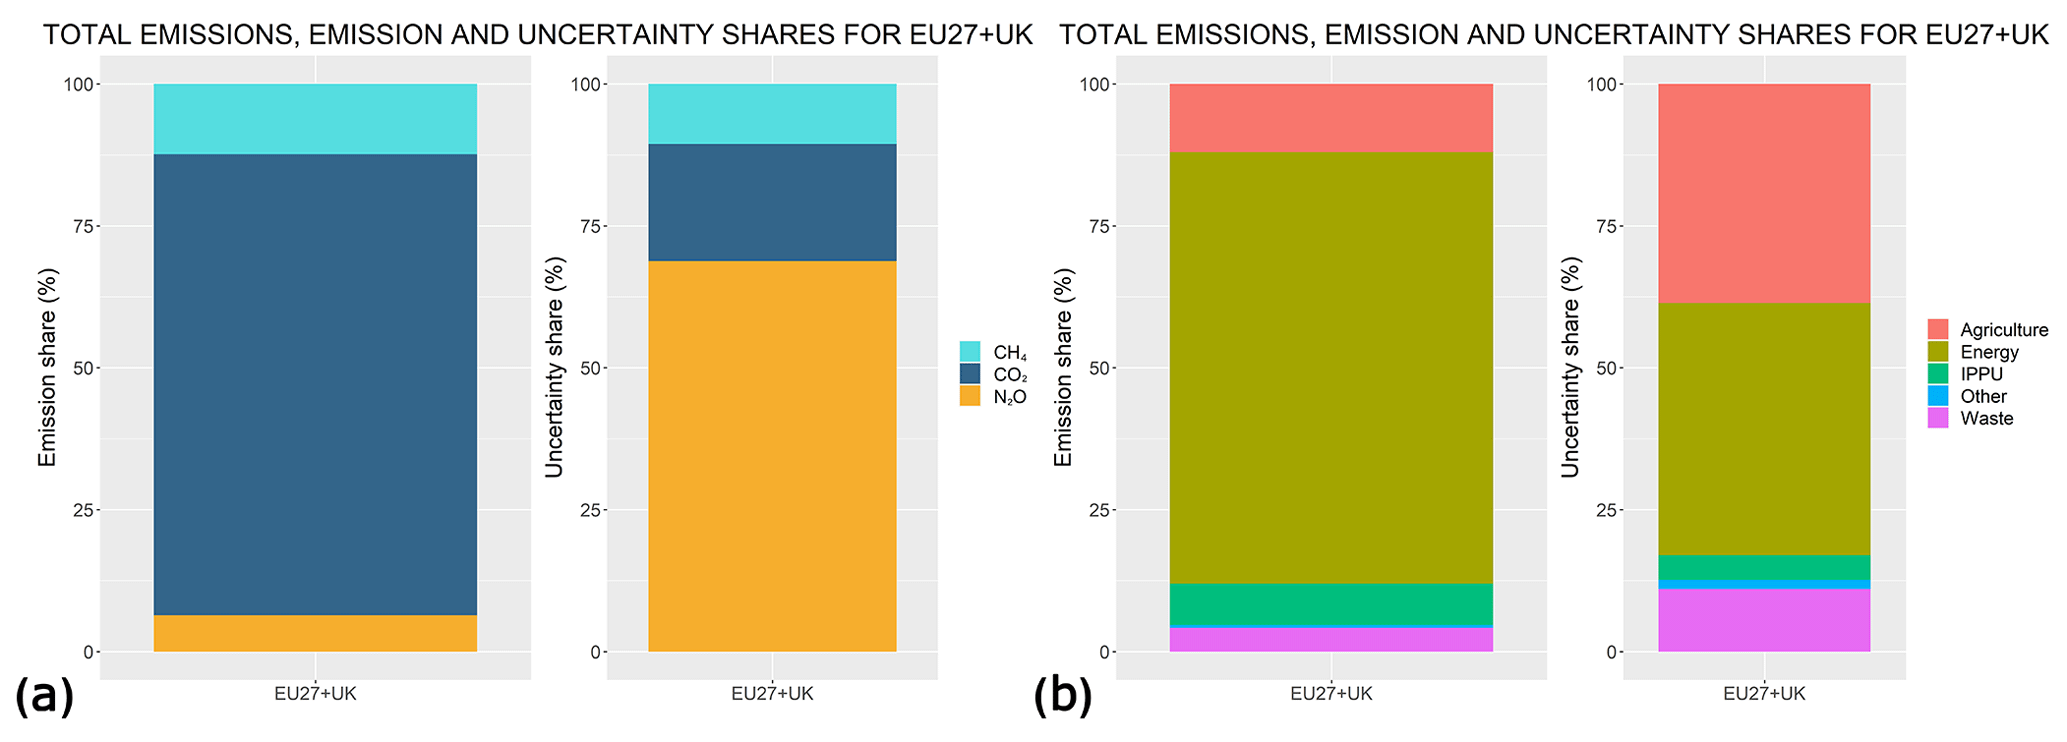
Figure 12EU27 + UK share of emissions and uncertainty by (a) gas and (b) category. IPPU stands for industrial processes and product use.
The considerable number of degrees of freedom influencing the uncertainty of an emission inventory such as EDGAR is itself a source of uncertainty originating from different methodological assumptions. As such, the structural uncertainty of emissions tackled in the previous section is subject to variability due to the sets of assumptions, methods, and choices adopted for its quantification. It originates from lack of agreement or incomplete knowledge of the processes governing the emission sources and their representativeness. Such methodological uncertainty reflects the judgement of the uncertainty emission compiler and can give rise to a significant share of the overall uncertainty estimate. For instance, two experts could suggest two different probabilistic models for the value of a certain emission source, leading to a certain degree of variability in the PDFs of that source. Thus, methodological uncertainty may arise from the assumptions' adopted assessment, particularly when there are no clear guidelines or reference cases regarding methodological choices that allow comparability between evaluations.
One of the most impactful assumptions of this study is the correlation between subcategories or fuels and, for the same respective category or fuel, between countries. This has a profound impact on the uncertainty estimate – for example, in inter-comparison studies where EDGAR's uncertainties are shown next to other inventories whose uncertainty estimates do not account for correlation (e.g. Petrescu et al., 2020; Choulga et al., 2020).
The global weight of the correlation is reflected in the total of Fig. 13, where the uncertainty ranges from 4 % (no correlation) to above 20 % for the correlated cases. The impact of assuming correlation of the uncertainties when aggregating the emissions of several countries outweighs any other assumptions. For instance, the assumption that the N2O uncertainty for energy should be constrained in the range from ±50 % to ±150 % has, globally, a much lower impact over the total uncertainty (23 % rather than 20 %).

Figure 13Variability in the world emission uncertainty introduced by methodological choices. “Tier 1 + Correl” (in red) is the base case and assumes correlation among subsectors and among sectors across countries and default Tier 1 IPCC-06 uncertainty; “Tier1 + OJ + Correl” (in green) only differs from the base case for the N2O uncertainty in sector 1.A (±100 % to ±150 %) (green); Tier1 + OJ + Uncorrel (in blue) differs from the base case as it assumes no correlation as well as N2O uncertainty in sector 1.A in the range from ±100 % to ±150 %.
As shown in Fig. 14 for EU27 + UK, the effect of correlation on the variability in the uncertainty is considerable. Emissions from the energy sector are estimated to be accurate, as the 95 % confidence interval lies within 2 % of mean value when no correlation is assumed across countries and within 7 % when the correlation is set to one. The uncertainty of 13 % for the Tier 1 “default case” reflects the high share of uncertainty due to N2O, as the only difference between the “T1 default” and “T1 + OJ N2O” for energy is the upper limit of the N2O uncertainty, which ranges from ±50 % to ±150 % (OJ stands for own judgement). The same argument applies to the other sectors, most notably to agriculture (130 % vs. 36 %, with or without correlation respectively), and is reflected in the total GHG emissions (15 % vs. 4 %, with or without correlation respectively).
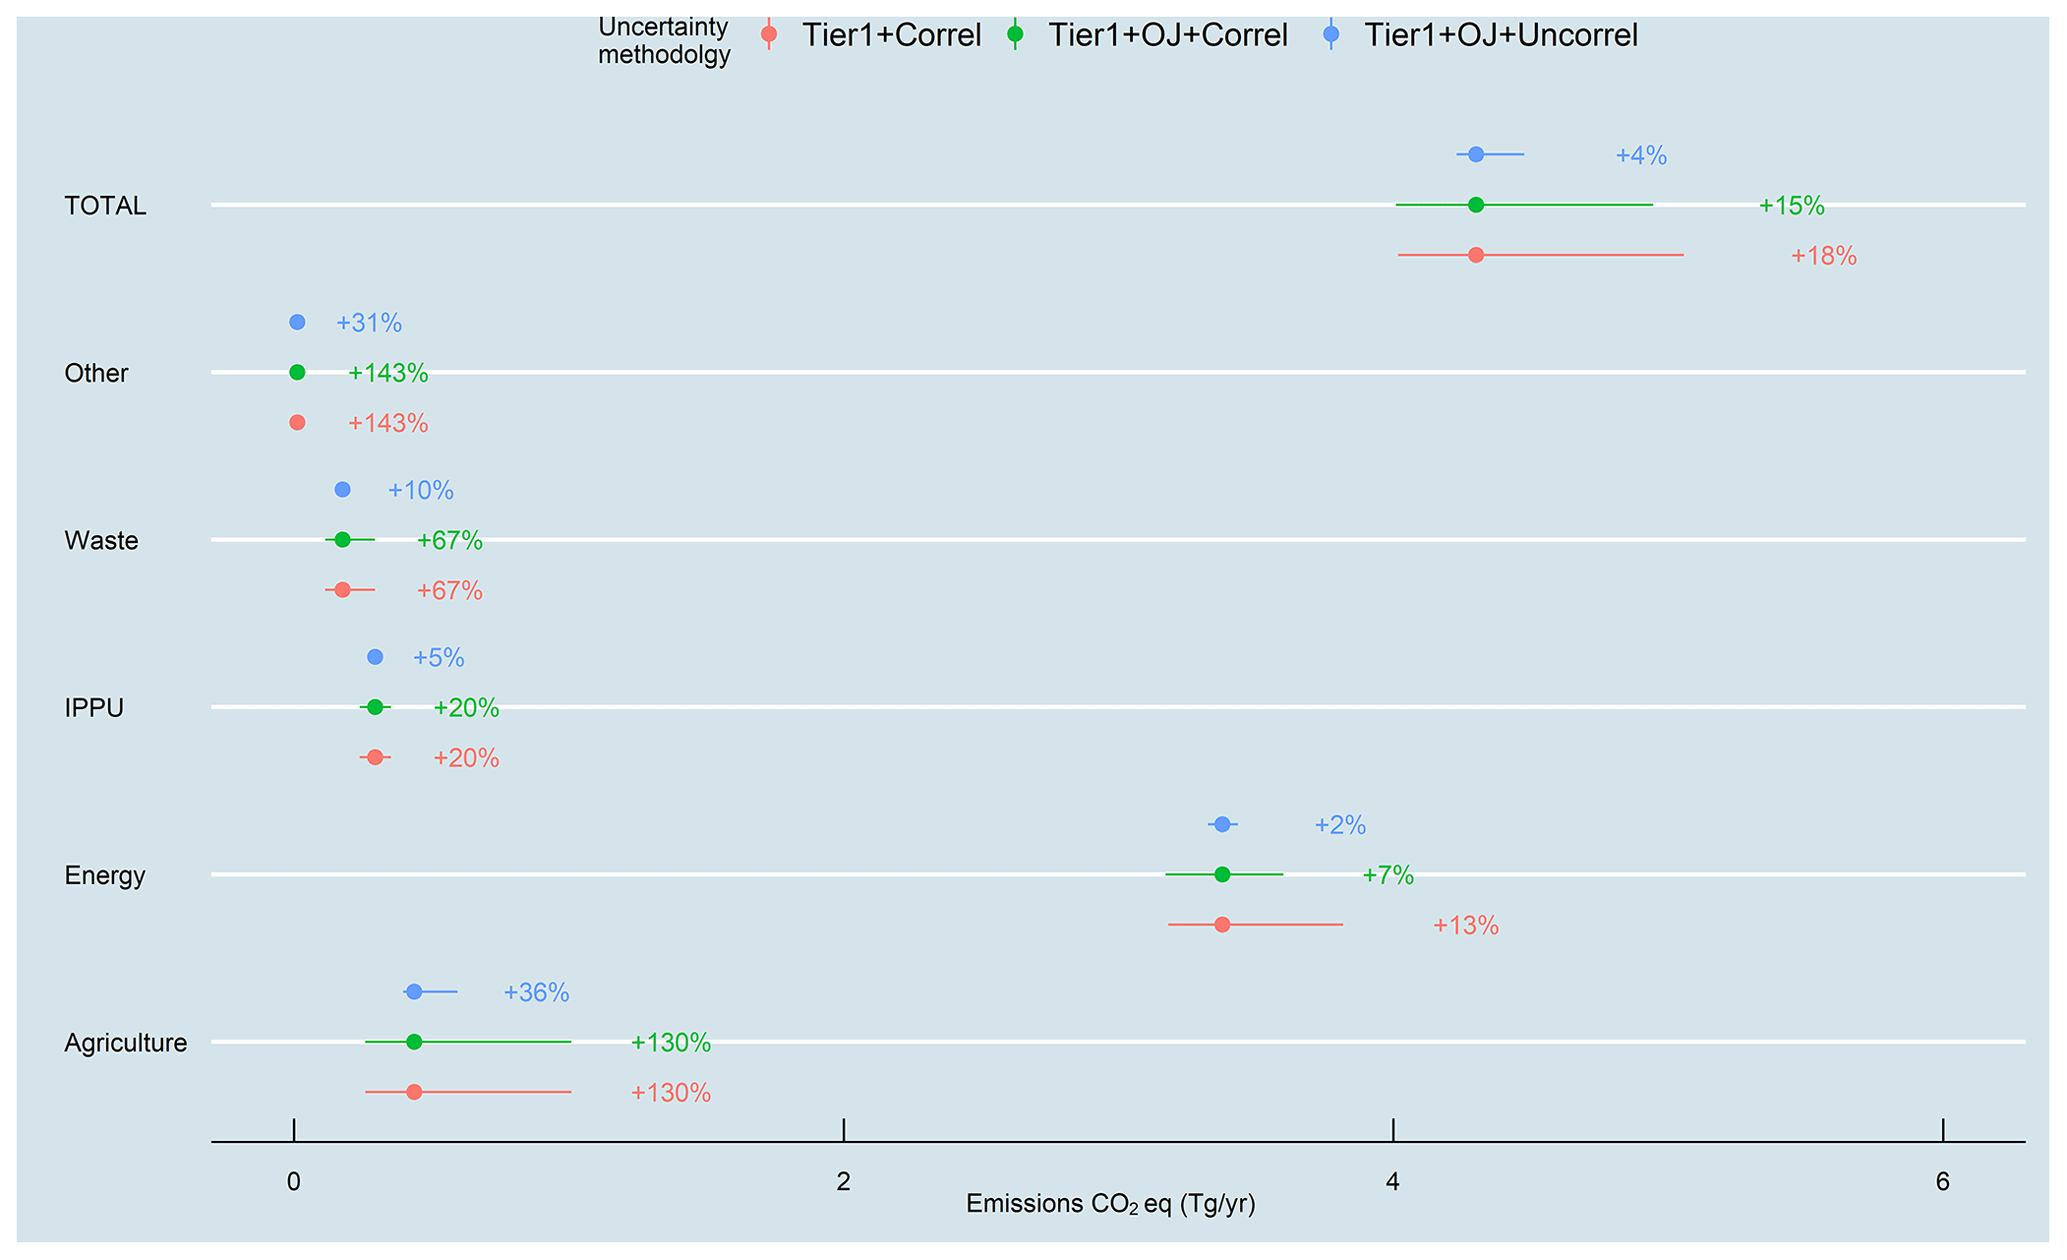
Figure 14Variability in EU27 + UK emission uncertainty introduced by methodological choices. “Tier 1 + Correl” (in red) is the base case and assumes correlation among subsectors and among sectors across countries and default Tier 1 IPCC-06 uncertainty; “Tier1 + OJ + Correl” (in green) only differs from the base case for the N2O uncertainty in sector 1.A (±100 % to ±150 %) (green); Tier1 + OJ + Uncorrel (in blue) differs from the base case as it assumes no correlation as well as N2O uncertainty in sector 1.A in the range from ±100 % to ±150 %.
It is important to notice that if EU27 + UK report emissions as a single party, even Tier 1 propagation methods would return an accuracy comparable to the combination of independent estimates (i.e. as if all EU parties used independent Tier 2 or 3 estimates of their emissions).
The comparison between the “default” uncertainty ranges and “EDGAR in-house expert judgement” for N2O shows the impact of choices regarding the quantification of the uncertainty, contributing to enhance the uncertainty variability. Using the case of energy in Fig. 14 is an example, the default uncertainty of 13 % can vary as much as 46 % (down to 7 %) due to different judgements in estimating uEF.
This study quantifies the structural uncertainty of the EDGAR inventory of GHGs. Given the widespread applications of EDGAR in many areas – modelling, policy, evaluation, and planning – the qualification of its accuracy and the quantification of its uncertainty are essential added values.
EDGAR is a consistent database based, predominantly, on Tier 1 methods to quantify emission from anthropogenic sources (on a three-tiered level of sophistication, Tier 1 is the simplest). As such, the uncertainty analysis presented here follows the corresponding Tier 1 approach for uncertainties, also suggested by IPCC (2006a, 2019) to assist in country reporting. Some additional assumptions have been put forward to allow for the simple Tier 1 uncertainty method to integrate with the EDGAR global database.
The global, comparable nature of EDGAR is one of its main drawcards. Zooming in on individual countries, the accuracy of EDGAR cannot, in general terms, match that of the country's inventory reporting panel, who might adopt higher tiers for estimating emissions and uncertainties. Hence, it is when looking at cross-sector, gas, and country aggregation that the analysis presented in this study shows its benefits.
For the aggregation of emission sources sharing the same underlying methodology, we assumed that the uncertainty is amplified and that the aggregation must, therefore, account for their correlation. The correlation is also maintained when aggregating the same sectors across countries and when aggregating subcategories, with some exceptions and caveats detailed in the main text.
The main conclusions of the study can be summarized as follows:
-
Global CO2 emitted from the energy sector alone (IPCC sector 1) accounts for 96 % of global GHG emissions and is accurate within 7 % (generally with high confidence levels for top emitters).
-
When adding CH4 and N2O, the accuracy of the energy sector decreases to an uncertainty of −12.8 % to +15.9 %.
-
The uncertainty of N2O for the power industry sector (factor of 10 suggested by IPCC-06) indicates a very poor accuracy. This high value reflects the paucity of accurate estimates, although some studies suggest lower uncertainty values (Lee et al., 2013; Olivier et al., 1999b). For N2O in sector 1.A, we set a uEF value of ±50 % to ±150 % (for industrialized and developing countries respectively) to yield a global uncertainty of ∼112 %; CH4 emitted by oil and gas extraction facilities is highly uncertain, although the guidelines provide detailed uncertainties for all stages (extraction, storage, distribution, and transmission) and differentiated by the level of development of the country. Due to the discrepancies with the scientific literature and the number of parameters and components of this sector, we tested a more conservative estimate of and ±15 % (for industrialized and developing countries respectively) and % for all countries (uEF of 50 % for the country-specific EF) when considering the aggregation of sectors or countries that yield a global CH4 uncertainty of −55 %; +93 %.
-
Agriculture emissions are dominated by CH4 and N2O, with the uncertainty of the latter (over 300 % on a global average) outweighing that of CH4 due to large uncertainty in EFs. At the global scale, CH4 uncertainty is driven by rice cultivation and enteric fermentation.
-
Waste is also a sector dominated by CH4 emissions, followed by N2O. The uncertainty of the latter is very high (often exceeding 400 %). For CH4 emissions, the share from landfills and domestic wastewater is approximately equivalent (∼44 % and ∼41 % respectively), although landfills have a relatively larger weight in the global uncertainty share (∼55 % and ∼41 % respectively).
The strongest assumption of this study, which has also been made in previous studies, is the full correlation of subcategories and countries; this assumption introduces a further source of uncertainty – methodological uncertainty – that is very impactful. Uncertainty around methodological choices arises when there are different views about what constitutes the “correct” approach for optimum decision-making. This form of uncertainty might be dealt with by agreeing on a “reference case” or on a list of methodological choices to allow comparability between different inventories.
The choice of methods can have a profound impact on the overall uncertainty assessment and needs to be taken into consideration when comparing inventories. For EU27 + UK, for example, the choice of assuming correlation among countries (or not) can result in a ∼4-fold variability in the uncertainty (4 % vs. 15 %).
The database underlying the analysis is EDGAR v5.0 Greenhouse Gas Emissions; it is an open-access database available at https://data.europa.eu/doi/10.2904/JRC_DATASET_EDGAR (last access: 12 April 2020) (Crippa et al., 2020b).
The supplement related to this article is available online at: https://doi.org/10.5194/acp-21-5655-2021-supplement.
ES designed the study, carried out the analysis, and wrote the paper. MCr, DG, and MM developed the emission database. MCh aided with the uncertainty analysis for CO2. GJM developed the emission database and designed the study.
The authors declare that they have no conflict of interest.
The authors are thankful to Peter Bergamaschi (JRC) for his insightful suggestions and critical review.
This research has been supported by the European Commission, Horizon 2020 framework programme (VERIFY, grant no. 776810). Margarita Choulga was funded by the CO2 Human Emissions (CHE) project, which received funding from the European Union's Horizon 2020 Research and Innovation programme under grant agreement no. 776186.
This paper was edited by Thomas Röckmann and reviewed by Antoon Visschedijk and one anonymous referee.
Andreae, M. O.: Emission of trace gases and aerosols from biomass burning – an updated assessment, Atmos. Chem. Phys., 19, 8523–8546, https://doi.org/10.5194/acp-19-8523-2019, 2019.
Andreae, M. O. and Merlet, P.: Emission of trace gases and aerosols from biomass burning, Global Biogeochem. Cy., 15, 955–966, 2001.
Andres, R. J., Boden, T. A., and Highdon, D.: A new evaluation of the uncertainty associated with CDIAC estimates of fossil fuel carbon dioxide emission, Tellus B, 66, 1–15, https://doi.org/10.3402/tellusb.v66.23616, 2014.
Bergamaschi, P., Corazza, M., Karstens, U., Athanassiadou, M., Thompson, R. L., Pison, I., Manning, A. J., Bousquet, P., Segers, A., Vermeulen, A. T., Janssens-Maenhout, G., Schmidt, M., Ramonet, M., Meinhardt, F., Aalto, T., Haszpra, L., Moncrieff, J., Popa, M. E., Lowry, D., Steinbacher, M., Jordan, A., O'Doherty, S., Piacentino, S., and Dlugokencky, E.: Top-down estimates of European CH4 and N2O emissions based on four different inverse models, Atmos. Chem. Phys., 15, 715–736, https://doi.org/10.5194/acp-15-715-2015, 2015.
Bergamaschi, P., Danila, A., Weiss, R. F., Ciais, P., Thompson, R. L., Brunner, D., Levin, I., Meijer, Y., Chevallier, F., Janssens-Maenhout, G., Bovensmann, H., Crisp, D., Basu, S., Dlugokencky, E., Engelen, R., Gerbig, C., Günther, D., Hammer, S., Henne, S., Houweling, S., Karstens, U., Kort, E., Maione, M., Manning, A. J., Miller, J., Montzka, S., Pandey, S., Peters, W., Peylin, P., Pinty, B., Ramonet, M., Reimann, S., Röckmann, T., Schmidt, M., Strogies, M., Sussams, J., Tarasova, O., van Aardenne, J., Vermeulen, A. T., and Vogel, F.: Atmospheric monitoring and inverse modelling for verification of greenhouse gas inventories, EUR 29276 EN, Publications Office of the European Union, Luxembourg, JRC111789, https://doi.org/10.2760/759928, ISBN 978-92-79-88938-7, 2018.
Bernadier, A. B. and Conant, R. T.: Regionally differentiated estimates of croplands N2O emission reduce uncertainty in global calculations, Global Change Biol., 18, 928–935, 2012.
Bond, T. C., Streets, D. G., Yarber, K. F., Nelson, S. M., Woo, J.-H., and Klimont, Z.: A technology-based global inventory of black and organic carbon emissions from combustion, J. Geophys. Res., 109, D14203, https://doi.org/10.1029/2003JD003697, 2004.
Brown, J. R., Blankinship, J. C., Niboyet, A., van Groenigen, K. J., Dijkstra, P., Le Roux, X., Leadley, P. W., and Hungate, B. A.: Effects of multiple global change treatments on soil N2O fluxes, Biogeochemistry, 109, 85–100, https://doi.org/10.1007/s10533-011-9655-2, 2012.
Brown, K., Cardenas, L., MacCarthy, J., Murrells, T., Pang, Y., Passant, N., Thistlethwaite, G., Thomson, A., and Webb, N.: UK Greenhouse Gas Inventory, 1990 to 2010: Annual Report for Submission Under the Framework Convention on Climate Change, available at: https://uk-air.defra.gov.uk/assets/documents/reports/cat07/1204251149_ukghgi-90-10_main_chapters_issue2_print_v1.pdf (last access: 12 April 2020), 2012.
Choulga, M., Janssens-Maenhout, G., Super, I., Agusti-Panareda, A., Balsamo, G., Bousserez, N., Crippa, M., Denier van der Gon, H., Engelen, R., Guizzardi, D., Kuenen, J., McNorton, J., Oreggioni, G., Solazzo, E., and Visschedijk, A.: Global anthropogenic CO2 emissions and uncertainties as prior for Earth system modelling and data assimilation, Earth Syst. Sci. Data Discuss. [preprint], https://doi.org/10.5194/essd-2020-68, in review, 2020.
CIA – Central Intelligence Agency: The World Fact Book, Washington DC, available at: http://www.cia.gov/library/publications/the-world-factbook (last access: October 2020), 2016.
Ciais, P., Sabine, C., Bala, G., Bopp, L., Brovkin, V., Canadell, J., Chhabra, A., DeFries, R., Galloway, J., Heimann, M., Jones, C., Le Quéré, C., Myneni, R. B., Piao, S., and Thornton, P.: Carbon and Other Biogeochemical Cycles, in: Climate Change 2013: The Physical Science Basis. Contribution of Working Group I to the Fifth Assessment Report of the Intergovernmental Panel on Climate, Cambridge University Press, Cambridge, UK and New York, NY, USA, 2013.
Crippa, M., Oreggioni, G., Guizzardi, D., Muntean, M., Schaaf, E., Lo Vullo, E., Solazzo, E., Monforti-Ferrario, F., Olivier, J. G. J., and Vignati, E.: Fossil CO2 and GHG emissions of all world countries – 2019 Report, EUR 29849 EN, Publications Office of the European Union, Luxembourg, JRC117610, https://doi.org/10.2760/687800, ISBN 978-92-76-11100-9, 2019.
Crippa, M., Solazzo, E., Huang, G., Guizzardi, D., Koffi, E., Muntena, M., Schieberle, C., Friedrick, R., and Janssens-Maenhout, G.: High resolution temporal profiles in the Emissions Database for Global Atmospheric Research, Sci. Data, 7, 121, https://doi.org/10.1038/s41597-020-0462-2, 2020a.
Crippa, M., Oreggioni, G., Guizzardi, D., Muntean, M., Schaaf, E., Lo Vullo, E., Solazzo, E., Monforti-Ferrario, F., Olivier, J. G. J., and Vignati, E.: EDGAR v5.0 Greenhouse Gas Emissions, available at: https://data.europa.eu/doi/10.2904/JRC_DATASET_EDGAR (last access: 12 April 2020), 2020b.
Crippa, M, Solazzo, E., Guizzardi, D., Monforti-Ferrario, F., Tubiello, F. N., and Leip, A.: Food systems are responsible for a third of global anthropogenic GHG emissions, Nat. Food, 2, 198–209, https://doi.org/10.1038/s43016-021-00225-9, 2021.
Cullen, A. C. and Frey, H. C.: Probabilistic Techniques in Exposure Assessment: A Handbook for Dealing with Variability and Uncertainty in Models and Inputs, in: Introduction to the concepts and methods of uncertainty analysis, Plenum Press, New York, available at: https://www.researchgate.net/publication/230693199_Introduction_to_the_concepts_and_methods_of_uncertainty_analysis (last access: 6 April 2021), 1999.
EEA: EMEP-EEA emission inventory guidebook, European Environment Agency, available at: https://www.eea.europa.eu/publications/emep-eea-guidebook-2013 (last access: 8 June 2020), 2013.
EPA: Inventory of U.S. Greenhouse Gas Emissions and Sinks 1990–2015: Revisions to Natural Gas Systems Processing Segment Emissions, Washington, D.C., US Environmental Protection Agency, 9 April 2017, (Memo), available at: https://www?.epa.gov/sites?/production/files?/2017-04/documents/2017_ng_processing?.pdf (last access: September 2020), 2017a.
EPA: Inventory of U.S. Greenhouse Gas Emissions and Sinks: 1990–2015. Washington, D.C., US Environmental Protection Agency, 26 July 2017, available at: https://www?.epa.gov/ghgemissions?/inventory-us-greenhouse-gas-emissions-and-sinks.EPA 430-P-17-001 (last access: September 2020), 2017b.
FAO Geonetwork: Digital Soil Map of the world and Digital Climate Map of the world, Food and Agriculture Organisation of the UN, available at: http://www.fao.org/geonetwork/srv/en/main.home (last access: January 2018), 2011.
Frey, H. C.: Evaluation of an Approximate Analytical Procedure for Calculating Uncertainty in the Greenhouse Gas Version of the Multi-Scale Motor Vehicle and Equipment Emissions System, Prepared for Office of Transportation and Air Quality, US Environmental Protection Agency, Ann Arbor, MI, 30 May 2003.
GGFR/NOAA: Global Gas Flaring Tracker Report 2020, available at: https://pubdocs.worldbank.org/en/503141595343850009/WB-GGFR-Report-July2020.pdf (last access: 12 April 2021), 2020.
Hristov, A. N., Harper, M., Meinen, R., Day, R., Lopes, J., Ott, T., Venkatesh, A., and Randles, C. A.: Discrepancies and uncertainties in bottom-up gridded inventories of livestock methane emissions for the contiguous United States, Environ. Sci. Technol., 51, 13668–13688, 2017.
IEA: Energy balance statistics for 1970–2015, available at: http://www.iea.org/ (last access: 12 April 2021), 2017.
IIASA: GAINS model, Greenhouse Gas – Air Pollution Interactions and Synergies, International Institute for Applied Systems Analysis, available at: http://gains.iiasa.ac.at/models/index.html (last access: January 2018), 2007.
IPCC: Good Practice Guidance and Uncertainty Management in National Greenhouse Gas Inventories, IPCC-TSU NGGIP, Japan, 2000.
IPCC: Uncertainties, chap. 3, in: 2006 IPCC Guidelines for National Greenhouse Gas Inventories, available at: https://www.ipcc-nggip.iges.or.jp/public/2006gl/pdf/1_Volume1/V1_3_Ch3_Uncertainties.pdf (last access: December 2019), 2006a.
IPCC: Guidelines for National Greenhouse Gas Inventories (NGHGI), available at: https://www.ipcc-nggip.iges.or.jp/public/2006gl/ (last access: October 2020), 2006b.
IPCC: AR4, Climate Change 2007: The Physical Science Basis in: Contribution of Working Group I to the Fourth Assessment Report of the Intergovernmental Panel on Climate Change, edited by: Solomon, S., Qin, D., Manning, M., Chen, Z., Marquis, M., Averyt, K. B., Tignor, M., and Miller, H. L., chap. 2, Changes in Atmospheric Constituents and in Radiative Forcing, edited by: Foster, P., Ramasamy, V., Artaxo, T., Berntsen, T., Betts, R., Fahey, D. W., Haywood, J., Lean, J., Lowe, D. C., Myhre, G., Nganga, J., Prinn, R., Raga, G., Schulz, M., and Van Dorland, R., Cambridge University Press, Cambridge, UK, 2007.
IPCC: Refinement to the 2006 IPCC Guidelines for National Greenhouse Gas Inventories, available at: https://www.ipcc.ch/report/2019-refinement-to-the-2006-ipcc-guidelines-for-national (last access: 5 October 2020), 2019.
IRRI: World Rice statistics. Distribution of rice crop area by environment, International Rice Research Institute, available at: https://www.irri.org/resources-and-tools/publications (last access: January 2018), 2007.
Janssens-Maenhout, G., Crippa, M., Guizzardi, D., Muntean, M., Schaaf, E., Dentener, F., Bergamaschi, P., Pagliari, V., Olivier, J. G. J., Peters, J. A. H. W., van Aardenne, J. A., Monni, S., Doering, U., Petrescu, A. M. R., Solazzo, E., and Oreggioni, G. D.: EDGAR v4.3.2 Global Atlas of the three major greenhouse gas emissions for the period 1970–2012, Earth Syst. Sci. Data, 11, 959–1002, https://doi.org/10.5194/essd-11-959-2019, 2019.
Lee, S., Kim, J., Lee, J., Lee, S., and Jeon, E.-C.: A study on the evaluations of emission factors and uncertainty ranges for methane and nitrous oxide from combined-cycle power plant in Korea, Environ Sci. Pollut. Res., 20, 461–468, https://doi.org/10.1007/s11356-012-1144-1, 2013.
Leip, A., Britz, W., Weiss, F., and de Vries, W.: Farm, land, and soil nitrogen budgets for agriculture in Europe calculated with CAPRI, Environ. Pollut., 159, 3243–3253, https://doi.org/10.1016/j.envpol.2011.01.040, 2011.
Lelieveld, J. A., Lechtenbohmer, S., Assonov, S. S., Brenninkmeijer, C. A. M., Dienst, C., Fischedick, M., and Hanke, T.: Greenhouse gases: Low methane leakage from gas pipelines, Nature, 434, 841–842, https://doi.org/10.1038/434841a, 2005.
Littlefield, J. A., Marriott, J., Schivley, G. A., and Skone, T. J.: Synthesis of recent ground-level methane emission measurements from the US natural gas supply chain, J. Clean. Prod., 148, 118–126, https://doi.org/10.1016/j.jclepro.2017.01.101, 2017.
Milne, A. E., Glendining, M. J., Bellamy, P., Misselbrook, T. H., Gilhespy, S. L., Rivas Casado, M., Hulin, A., Van Oijen, M., and Whitmore, A. P.: Analysis of uncertainties in the estimates of nitrous oxide and methane emissions in the UK's greenhouse gas inventory for agriculture, Atmos. Environ., 82, 94–105, https://doi.org/10.1016/j.atmosenv.2013.10.012, 2014.
Monni, S., Perälä, P., and Regina, K.: Uncertainty in Agricultural CH4 AND N2O Emissions from Finland – Possibilities to Increase Accuracy in Emission Estimates, Mitig. Adapt. Strat. Glob. Change, 12, 545–571, https://doi.org/10.1007/s11027-006-4584-4, 2007.
Muntean, M., Crippa, M., Guizzardi, D., Schaaf, E., Oreggioni, G., Solazzo, E., Olivier, J., Van Dingenen, R., Belis, C., Guion, A., Djatkov, D., and Geletukha, G.: The health and climate benefits of a fuel and technology shift in small combustion: the biomass dilemma, Nat. Commun., in review, 2021.
NRC: Advancing the Science of Climate Change, National Research Council, The National Academies Press, Washington, D.C., USA, 2010.
Olivier, J. G. J.: Layered approach and reporting format for estimating and eva uating uncertainty in emission inventories, Prepared for the lPCC/OECD/lEA Scoping Meeting on Managing Uncertainty in National Greenhouse Gas lnventories, 13–15 October 1998, Paris, 1998.
Olivier, J. G. J.: On the quality of global emission inventories. Approached, methodologies and uncertainty, Wilco BV Amersfoort, the Netherlands, ISBN 90-393-3103-0, 58–88, 2002.
Olivier, J. G. J., Bloos, J. P. J., Berdowski, J. J. M., Visschedijk, A. J. H., and Bouwman, A. F.: A 1990 global emission inventory of anthropogenic sources of carbon monoxide on 1×1 degree developed in the framework of EDGAR/GEIA, Chemosphere, 1, 1–17, 1999a.
Olivier, J. G. J., Bouwman, A. F., Berdowsk, J. J. M., Veldt, C., Bloos, J. P. J., Visschedijk, A. J. H., van der Maas, C. W. M., and Zandveld, P. Y. J.: Sectoral emission inventories of greenhouse gases for 1990 on a per country basis as well as on 1∘ × 1∘, Environ. Sci. Policy, 2, 241–264, https://doi.org/10.1016/S1462-9011(99)00027-1, 1999b.
Peischl, J., Ryerson, T. B., Aikin, K. C., De Gouw, J. A., Gilman, J. B., Holloway, J. S., Lerner, B. M., Nadkarni, R., Neuman, J. A., Nowak, J. B., Trainer, M., Warneke, C., and Parrish, D. D.: Quantifying atmospheric methane emissions from the Haynesville, Fayetteville, and northeastern Marcellus shale gas production regions, J. Geophys. Res.-Atmos., 120, 2119–2139, https://doi.org/10.1002/2014JD022697, 2015.
Petrescu, A. M. R., Peters, G. P., Janssens-Maenhout, G., Ciais, P., Tubiello, F. N., Grassi, G., Nabuurs, G.-J., Leip, A., Carmona-Garcia, G., Winiwarter, W., Höglund-Isaksson, L., Günther, D., Solazzo, E., Kiesow, A., Bastos, A., Pongratz, J., Nabel, J. E. M. S., Conchedda, G., Pilli, R., Andrew, R. M., Schelhaas, M.-J., and Dolman, A. J.: European anthropogenic AFOLU greenhouse gas emissions: a review and benchmark data, Earth Syst. Sci. Data, 12, 961–1001, https://doi.org/10.5194/essd-12-961-2020, 2020.
Philibert, A., Loyce, C., and Makowski, D.: Quantifying Uncertainties in N2O Emission Due to N Fertilizer Application in Cultivated Areas, PLoS ONE, 7, e50950, https://doi.org/10.1371/journal.pone.0050950, 2012.
Rypdal, K. and Winiwarter, W.: Uncertainties in greenhouse gas emission inventories – evaluation, comparability and implications, Environ. Sci. and Policy, 4, 107–116, 2001.
Saunois, M., Stavert, A. R., Poulter, B., Bousquet, P., Canadell, J. G., Jackson, R. B., Raymond, P. A., Dlugokencky, E. J., Houweling, S., Patra, P. K., Ciais, P., Arora, V. K., Bastviken, D., Bergamaschi, P., Blake, D. R., Brailsford, G., Bruhwiler, L., Carlson, K. M., Carrol, M., Castaldi, S., Chandra, N., Crevoisier, C., Crill, P. M., Covey, K., Curry, C. L., Etiope, G., Frankenberg, C., Gedney, N., Hegglin, M. I., Höglund-Isaksson, L., Hugelius, G., Ishizawa, M., Ito, A., Janssens-Maenhout, G., Jensen, K. M., Joos, F., Kleinen, T., Krummel, P. B., Langenfelds, R. L., Laruelle, G. G., Liu, L., Machida, T., Maksyutov, S., McDonald, K. C., McNorton, J., Miller, P. A., Melton, J. R., Morino, I., Müller, J., Murguia-Flores, F., Naik, V., Niwa, Y., Noce, S., O'Doherty, S., Parker, R. J., Peng, C., Peng, S., Peters, G. P., Prigent, C., Prinn, R., Ramonet, M., Regnier, P., Riley, W. J., Rosentreter, J. A., Segers, A., Simpson, I. J., Shi, H., Smith, S. J., Steele, L. P., Thornton, B. F., Tian, H., Tohjima, Y., Tubiello, F. N., Tsuruta, A., Viovy, N., Voulgarakis, A., Weber, T. S., van Weele, M., van der Werf, G. R., Weiss, R. F., Worthy, D., Wunch, D., Yin, Y., Yoshida, Y., Zhang, W., Zhang, Z., Zhao, Y., Zheng, B., Zhu, Q., Zhu, Q., and Zhuang, Q.: The Global Methane Budget 2000–2017, Earth Syst. Sci. Data, 12, 1561–1623, https://doi.org/10.5194/essd-12-1561-2020, 2020.
Solazzo, E., Riccio, A., Van Dingenen, R., Valentini, L., and Galmarini, S.: Evaluation and uncertainty estimation of the impact of air quality modelling on crop yields and premature deaths using a multi-model ensemble, Sci. Total Environ., 633, 1437–1452, https://doi.org/10.1016/j.scitotenv.2018.03.317, 2018.
Stehfest, E. and Bouwman, L.: N2O and NO emission from agricultural fields and soils under natural vegetation: summarizing available measurement data and modeling of global annual emissions, Nutr. Cycl. Agroecosys., 74, 207–228, https://doi.org/10.1007/s10705-006-9000-7, 2006.
Super, I., Dellaert, S. N. C., Visschedijk, A. J. H., and Denier van der Gon, H. A. C.: Uncertainty analysis of a European high-resolution emission inventory of CO2 and CO to support inverse modelling and network design, Atmos. Chem. Phys., 20, 1795–1816, https://doi.org/10.5194/acp-20-1795-2020, 2020.
Turner, A. J., Jacob, D. J., Wecht, K. J., Maasakkers, J. D., Lundgren, E., Andrews, A. E., Biraud, S. C., Boesch, H., Bowman, K. W., Deutscher, N. M., Dubey, M. K., Griffith, D. W. T., Hase, F., Kuze, A., Notholt, J., Ohyama, H., Parker, R., Payne, V. H., Sussmann, R., Sweeney, C., Velazco, V. A., Warneke, T., Wennberg, P. O., and Wunch, D.: Estimating global and North American methane emissions with high spatial resolution using GOSAT satellite data, Atmos. Chem. Phys., 15, 7049–7069, https://doi.org/10.5194/acp-15-7049-2015, 2015.
UNFCCC: National Inventory Report, submissions of the greenhouse gas inventories for Annex I countries, available at: http://unfccc.int/national_reports/annex_i_ghg_inventories/national_inventories_submissions/items/7383.php (last access: 30 October 2020), 2014.
UNFCCC: National Inventory Submissions 2018, available at: https://unfccc.int/process-and-meetings/transparency-and-reporting/reporting-and-review-under-the-convention/greenhouse-gas-inventories-annex-i-parties/national-inventory-submissions-2018 (last access: October 2020), 2018.
UN HABITAT: UN Human Settlements Programme, Global Urban Indicators database, Nairobi, info on population in slums (% of urban population), available at: https://unhabitat.org/global-urban-indicators-database (last access: 18 August 2020), 2016.
United Nations Environment Programme: Emissions Gap Report 2019, Chapter 2, UNEP, Nairobi, available at: https://wedocs.unep.org/bitstream/handle/20.500.11822/30797/EGR2019.pdf (last access: 5 October 2020), 2019.
US EIA: Energy Information Administration (of the U.S.), data interface, available at: https://www.eia.gov/beta/international/ (last access: 12 April 2021), 2018.
USGS: US Geological Survey Minerals Yearbook, US Geological Survey, Reston, Virginia, available at: https://www.usgs.gov/centers/nmic/ferroalloys-statistics-and-information?qt-science_support_page_related_con=0# (last access: 5 October 2020), 2016.
Van Dingenen, R., Crippa, M., Maenhout, G., Guizzardi, D., and Dentener, F.: Global trends of methane emissions and their impacts on ozone concentrations, EUR 29394 EN, Publications Office of the European Union, Luxembourg, JRC113210, https://doi.org/10.2760/820175, ISBN 978-92-79-96550-0, 2018.
WSA: World Steel Association, Steel statistics, available at: https://www.worldsteel.org/steel-by-topic/statistics/steel-statistical-yearbook.html (last access: 5 October 2020), 2019.
Yevich, R. and Logan, J.: An assessment of biofuel use and burning of agricultural waste in the developing world, Global Biogeochem. Cy., 17, 1095, https://doi.org/10.1029/2002GB001952, 2003.
CO2 eq. denotes CO2 equivalent emissions, which are computed using the Global Warming Potential values from the Fourth Assessment Report (AR4) of the Intergovernmental Panel on Climate Change (IPCC, 2007).