the Creative Commons Attribution 4.0 License.
the Creative Commons Attribution 4.0 License.
 | 09 Apr 2021
Structure, dynamics, and trace gas variability within the Asian summer monsoon anticyclone in the extreme El Niño of 2015–2016
Saginela Ravindra Babu
Madineni Venkat Ratnam
Ghouse Basha
Shantanu Kumar Pani
Neng-Huei Lin
A weak El Niño during 2014–2015 boreal winter developed as a strong boreal summer event in 2015 which continued and even enhanced during the following winter. In this work, the detailed changes in the structure, dynamics, and trace gases within the Asian summer monsoon anticyclone (ASMA) during the extreme El Niño of 2015–2016 is delineated by using Aura Microwave Limb Sounder (MLS) measurements, COSMIC radio occultation (RO) temperature, and National Centers for Environmental Prediction (NCEP) reanalysis products. Our analysis concentrates only on the summer months of July and August 2015 when the Niño 3.4 index started to exceed values of 1.5. The results show that the ASMA structure was quite different in summer 2015 as compared to the long-term (2005–2014) mean. In July, the spatial extension of the ASMA is greater than the long-term mean in all the regions except over northeastern Asia, where it exhibits a strong southward shift in its position. The ASMA splits into two, and the western Pacific mode is evident in August. Interestingly, the subtropical westerly jet (STJ) shifted southward from its normal position over northeastern Asia, and as a result midlatitude air moved southward in 2015. Intense Rossby wave breaking events along with STJ are also found in July 2015. Due to these dynamical changes in the ASMA, pronounced changes in the ASMA tracers are noticed in 2015 compared to the long-term mean. A 30 % (20 %) decrease in carbon monoxide (water vapor) at 100 hPa is observed in July over most of the ASMA region, whereas in August the drop is strongly concentrated at the edges of the ASMA. A prominent increase in O3 (> 40 %) at 100 hPa is clearly evident within the ASMA in July, whereas in August the increase is strongly located (even at 121 hPa) over the western edges of the ASMA. Further, the temperature around the tropopause shows significant positive anomalies (∼ 5 K) within the ASMA in 2015. The present results clearly reveal the El-Niño-induced dynamical changes caused significant changes in the trace gases within the ASMA in summer 2015.
- Article
(2605 KB) - Full-text XML
- BibTeX
- EndNote


The Asian summer monsoon anticyclone (ASMA) is a distinct circulation system in the upper troposphere and lower stratosphere (UTLS) during Northern Hemisphere boreal summer centered at ∼ 25∘ N and extending roughly between 15 to 40∘ N (Park et al., 2004; Randel et al., 2010). It is encircled by the subtropical westerly jet stream to the north and by the equatorial easterly jet to the south (Randel and Park, 2006). It is well recognized that the ASMA circulation is a prominent transport pathway for troposphere pollutants to enter the stratosphere (Randel et al., 2010). Previous studies have concluded that deep convection during the summer monsoon can effectively transport the pollutants, aerosols, and tropospheric tracers from the boundary layer into the UTLS region (Vogel et al., 2016; Santee et al., 2017). These transported pollutants, tracers and aerosols become confined in the ASMA and, consequently, affect the trace gas composition in the UTLS region (Randel et al., 2010; Hossaini et al., 2015). It is clearly evident from the previous studies that the ASMA has higher concentrations of tropospheric tracers such as carbon monoxide (CO), hydrogen cyanide (HCN), and methane (CH4) and lower concentrations of stratospheric tracers including ozone (O3) and nitric acid (HNO3) (Park et al., 2004, 2008; Li et al., 2005; Randel et al., 2010; Vernier et al., 2015, 2018; Yan and Bian, 2015; Yu et al., 2017; Santee et al., 2017). The comprehensive study on the climatological composition within the ASMA can be found in Santee et al. (2017). The Asian summer monsoon (ASM) convection and orographic lifting are the primary mechanisms for the higher concentrations of the tropospheric tracers in the ASMA (Li et al., 2005; Park et al., 2009; Santee et al., 2017). Apart from these trace gases a strong persistent tropopause-level aerosol layer called the “Asian Tropopause Aerosol Layer” (ATAL) also existed between 12 to 18 km within the ASMA, and it was first detected from the CALIPSO measurements (Vernier et al., 2011).
Similarly, higher concentrations of water vapor (WV) within the ASMA during the summer monsoon is well documented in the literature (Gettelman et al., 2004; Park et al., 2007; Randel et al., 2010; Bian et al., 2012; Xu et al., 2014; Jiang et al., 2015; Das and Suneeth, 2020). It is well known that most of the WV enters the stratosphere through the tropical tropopause (Fueglistaler et al., 2009), and the temperature present at the tropical tropopause strongly controls the WV entering the lower stratosphere (LS). It is also well documented that several processes such as convection, the strength of the Brewer–Dobson circulation, El Niño–Southern Oscillation (ENSO), and quasi-biennial oscillation (QBO) are responsible for the WV transport to the UTLS region (Holton et al., 1995; Dessler et al., 2014; Jiang et al., 2015). Other factors such as gravity waves and horizontal advection can also influence the WV transport in the UTLS region. For example, Khan and Jin (2016) studied the effect of gravity waves on the tropopause and WV over the Tibetan Plateau and reported that the gravity wave is the source for the WV transport from the lower to higher altitudes. Recently, Das and Suneeth (2020) reported about the distributions of WV in the UTLS over the ASMA during summer using 13 years of Aura Microwave Limb Sounder (MLS) observations. They concluded that WV in the UTLS region inside the central part of ASMA is mostly controlled by horizontal advection and much less by the local process and tropopause temperature in both summer and winter.
Convection during the summer monsoon is one of the major sources to transport the boundary layer pollutants into the UTLS region (Randel et al., 2010). It is a well established fact that the ENSO has a strong influence on convection and circulation changes over the Asian monsoon region (Kumar et al., 1999; Wang et al., 2015; Gadgil and Francis, 2016). Enhanced (suppressed) convection over the Asian monsoon region is generally observed in the cold phase of ENSO (warm phase of ENSO) known as La Niña (El Niño). Few studies exist to date on the impact of ENSO on the ASMA trace gas composition changes and its dynamical changes. For example, Yan et al. (2018) reported the influence of ENSO on the ASMA with a major focus on how the ENSO winter signal propagates into the following seasons. They showed the weaker O3 transport into the tropics during the onset of the ASMA after boreal winter El Niño events, but the difference between El Niño and La Niña composites becomes insignificant in the summer. In another study, Tweedy et al. (2018) demonstrated the impact of boreal summer ENSO events on O3 composition within the ASMA in different phases of ENSO events. They reported that the ASMA forms earlier and stronger in the La Niña period that leads to greater equatorward transport of O3-rich air from the extratropics into the northern tropics than during El Niño periods. Recently, Fadnavis et al. (2019) reported higher concentrations of aerosol layers observed in the ATAL region during the El Niño period over the northern part of South Asia. However, the above-mentioned studies are mainly focused on changes in the ASMA with respect to ENSO on seasonal scales or the mature stage of the monsoon (combined mean of July and August).
Based on the above-mentioned studies, it can be concluded that the ENSO also has a strong influence on the ASMA structure and its composition. The recent 2015–2016 El Niño event was recorded as an extreme and long-lasting event in the 21st century (Avery et al., 2017). It started as a weak El Niño during 2014–2015 boreal winter, and it developed as a strong boreal summer El Niño event in 2015 (Tweedy et al., 2018). Further, this strong boreal summer event continued and was significantly enhanced until the boreal winter of 2015–2016. In this event, several unusual changes occurred in the tropical UTLS region including the strong enhancement in the lower stratosphere WV (higher positive tropopause temperature anomalies) over the Southeast Asian and western Pacific regions (Avery et al., 2017) and anomalous distribution of trace gases in the UTLS region (Diallo et al., 2018; Ravindra Babu et al., 2019a). In a similar way, the response of different trace gases (O3, HCl, WV) to the disrupted 2015–2016 quasi-biennial oscillation (QBO) associated with the 2015–2016 El Niño event is also reported by Tweedy et al. (2017). Dunkerton (2016) discussed the possible role of the unusually warm ENSO event in 2015–2016 to the QBO disruption by triggering the extratropical planetary waves. Therefore, in the present study, we investigated the detailed changes observed in the ASMA 2015 particularly by focusing on the structure, dynamics, and trace gas variability within the ASMA in July and August 2015 by using satellite observations and reanalysis products. The present research article is organized as follows. The database and methodology adopted in this study are discussed in Sect. 2. The results and discussions are illustrated in Sect. 3. Finally, the summary and conclusions obtained from the present study are summarized in Sect. 4.
2.1 Microwave Limb Sounder measurements
In the present study, version 4.2 of Aura MLS measurements of CO, O3, and WV are utilized. The MLS data of July and August in each year from 2005 to 2015 are considered. The vertical resolution for CO is in the range of 3.5–5 km from the upper troposphere to the lower mesosphere and the useful range is 215–0.0046 hPa. The horizontal resolution for CO is about 460 km at 100 hPa and 690 km at 215 hPa. For WV, the vertical resolution is in the range of 2.0–3.7 km from 316 to 0.22 hPa, and the along-track horizontal resolution varies from 210 to 360 km for pressure greater than 4.6 hPa. For O3, the vertical resolution is ∼ 2.5 km, and the along-track horizontal resolution varies between 300 and 450 km. The precision (systematic uncertainty) for WV is ∼ 10 %–40 % (∼ 10 %–25 %), for O3 ∼ 0.02–0.04 (∼ 0.02–0.05) ppmv, and for CO ∼ 19 ppbv (30 %). More details about the MLS version 4 level 2 data can be found in Livesey et al. (2018).
2.2 COSMIC radio occultation measurements
To see the changes in the tropopause temperature and height within the ASMA, we used high-resolution, post-processed products of level 2 dry temperature profiles obtained from Constellation Observing System for Meteorology, Ionosphere, and Climate (COSMIC) radio occultation (RO). Each month of July and August from 2006 to 2015 is considered. The data are downloaded from the COSMIC Data Analysis and Archive Center (CDAAC) website. We used 200 m vertical resolution temperature profiles in the study. Details of the temperature retrieval from the bending angle and refractivity profiles obtained from the RO sounding are represented well in the literature (Kursinski et al., 1997; Anthes et al., 2008). The COSMIC temperature have a precision of 0.1 % between 8 and 25 km (Kishore et al., 2009; Kim and Son, 2012). The temperature accuracy in the UTLS is better than 0.5 K for individual profiles and ∼ 0.1 K for averaged profiles (Hajj et al., 2004). It is noted that for individual RO temperature profiles, the observational uncertainty estimate is 0.7 K in the tropopause region, slightly decreasing into the troposphere, and gradually increasing into the stratosphere (Scherllin-Pirscher et al., 2011a). For monthly zonal-averaged temperature fields, the total uncertainty estimate is smaller than 0.15 K in the UTLS (Scherllin-Pirscher et al., 2011b). Overall, the uncertainties of RO climatological fields are small compared to any other UTLS observing system for thermodynamic atmospheric variables. Note that these data are compared with a variety of techniques including GPS radiosonde data and had a good correlation particularly in the UTLS region (Rao et al., 2009; Kishore et al., 2009). The COSMIC RO profiles have been widely used for studying the tropopause changes and its variabilities (Kim and Son, 2012; Ravindra Babu et al., 2015; Ravindra Babu and Liou, 2021).
2.3 National Centers for Environmental Prediction (NCEP) reanalysis data
We also utilized monthly mean geopotential height (GPH) and wind vectors (zonal and meridional wind speed) from the NCEP-DOE Reanalysis 2 (Kanamitsu et al., 2002), covering the same time period as the MLS observations (2005–2015). NCEP-DOE Reanalysis 2 is an improved version of the NCEP Reanalysis 1 model that fixed errors and updated parametrizations of physical processes. The horizontal resolution of NCEP-DOE Reanalysis 2 is 2.5∘ × 2.5∘.
Apart from the above-mentioned data sets, we also used European Centre for Medium-Range Weather Forecasts (ECMWF) interim reanalysis potential vorticity (PV) data particularly at the 350 K isentropic surface in July and August 2015 (ERA-Interim; Uppala et al., 2005; Dee et al., 2011).
2.4 Methodology
Daily available MLS profiles of O3, CO, and WV in each month are constructed and gridded by averaging the profiles inside bins with a resolution of 5∘ latitude × 5∘ longitude. The following equation is used to estimate the relative change in percentage.
where xi represents the monthly mean of July and August in 2015, and is the corresponding monthly long-term mean which is calculated by using the data from 2005 to 2014.
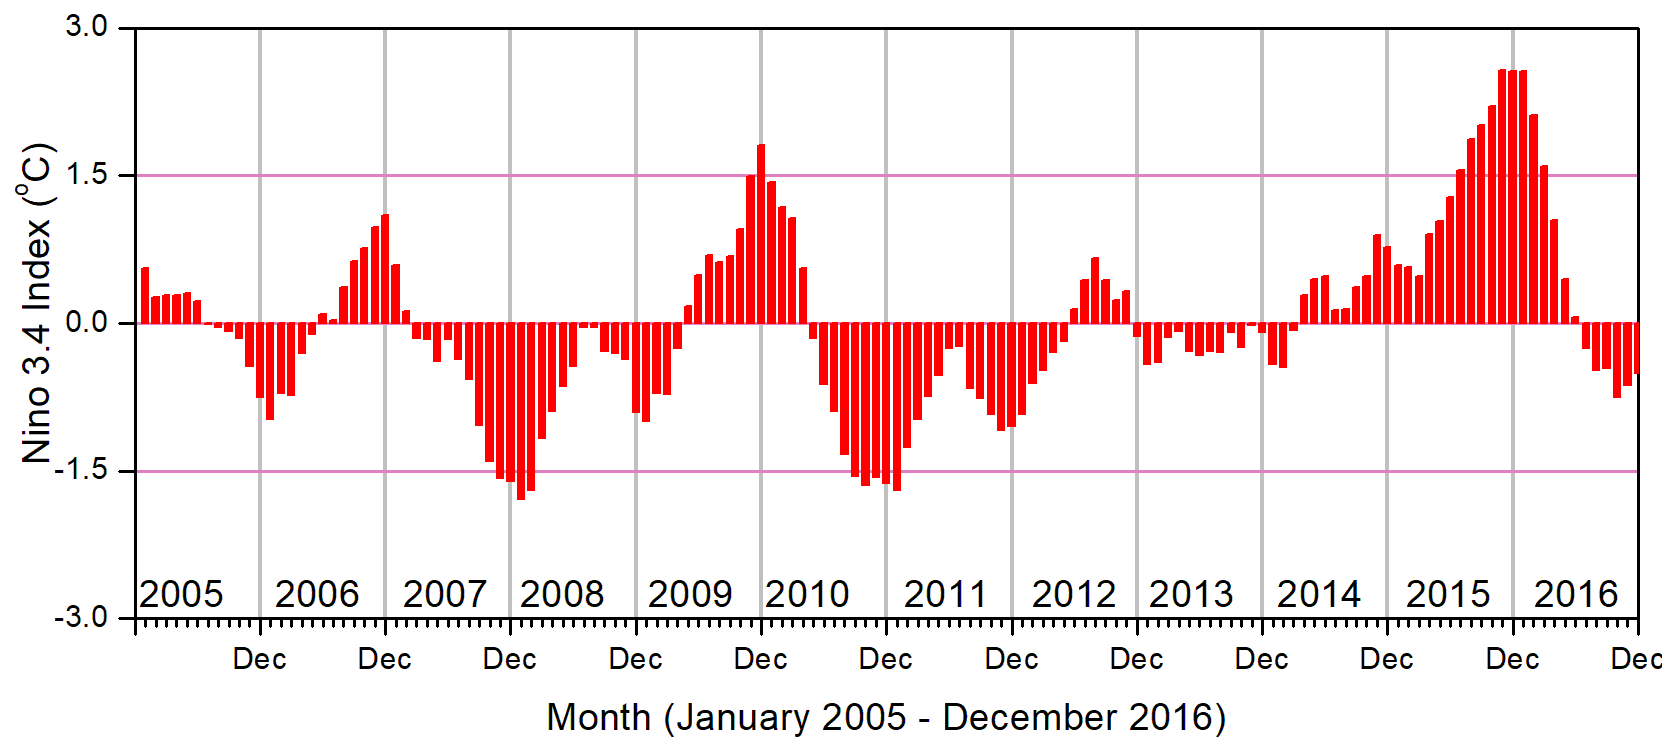
Figure 1Temporal evolution of observed Niño 3.4 index data from January 2005 to December 2016.
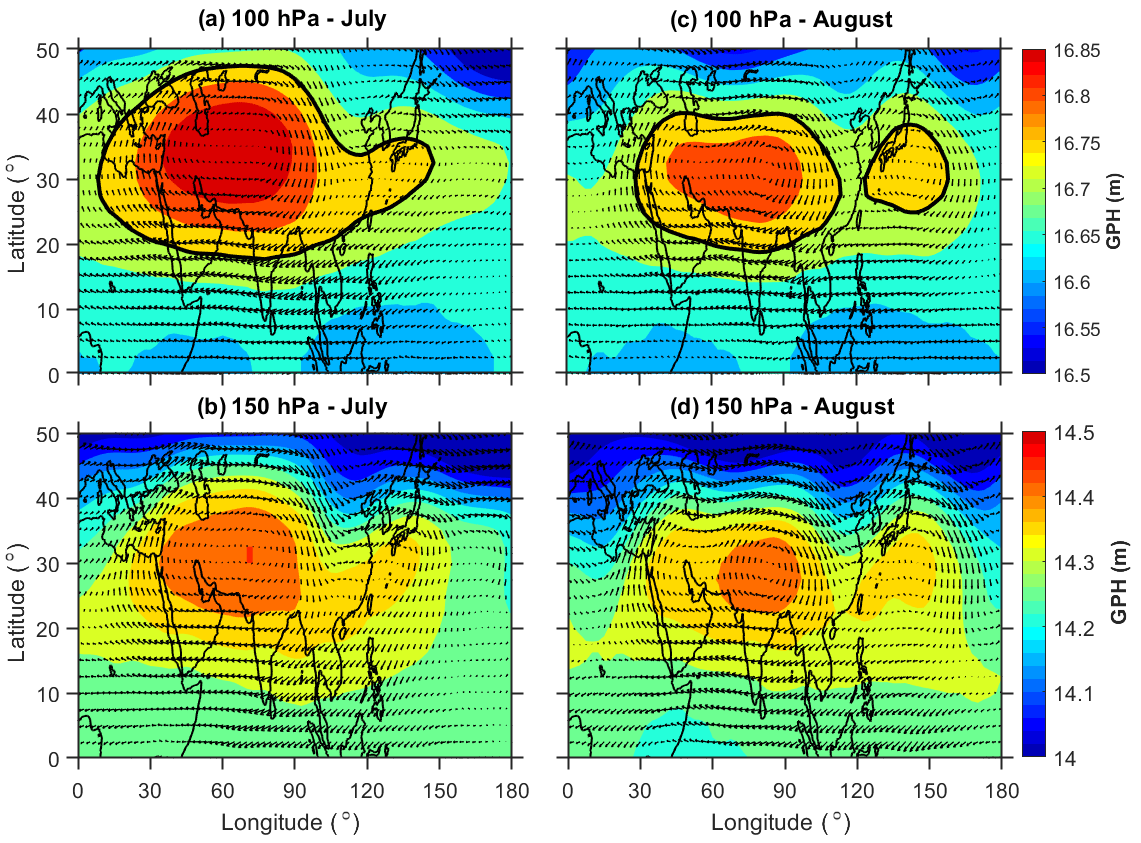
Figure 2Spatial distribution of geopotential height obtained from NCEP-DOE Reanalysis 2 data during July 2015 at (a) 100 hPa and (b) 150 hPa superimposed with wind vectors at the respective corresponding levels. Subplots of (c) and (d) are the same as (a) and (b) but for the month of August. The solid black contour lines represent the ASMA region at 100 hPa (16.75 km GPH contour).
It is well reported that the ASMA is highly dynamic in nature with respect to its position and shape. It also varies at different timescales, i.e., day-to-day, weekly, and monthly scales, caused by internal dynamical variability (Randel and Park, 2006; Garny and Randel, 2013; Pan et al., 2016; Nützel et al., 2016; Santee et al., 2017). The intensity and spatial extension of the ASMA are prominent in July and August when the monsoon was in the mature phase (Santee et al., 2017; Basha et al., 2020). It can be noticed that the 2015–2016 El Niño event was one of the strongest boreal summer events that occurred in the entire MLS data record (Tweedy et al., 2018). In this event, the Niño 3.4 data exceeded +1.5 in July and +1.8 in August (Fig. 1). Therefore, in the present study, we mainly focused on ASMA behavior and trace gas changes within the ASMA on monthly scales particularly in July and August 2015 which represent strong El Niño.
3.1 Structure and dynamical changes in ASMA during 2015
In general, in the studies looking at monthly or seasonal timescales related to the thermodynamical features in the ASMA, the anticyclone region is mostly defined from the simple constant GPH contours at different pressure levels (Randel and Park, 2006; Yan et al., 2011; Bergman et al., 2013; Basha et al., 2020). Previous researchers used different GPH contours at 100 hPa to define the anticyclone region. For example, Yan et al. (2011) used 16.7 km, Bergman et al. (2013) used 16.77 km, and recently Basha et al. (2020) used 16.75 km GPH contours as the anticyclone region. In a similar manner, we also defined the ASMA region based on GPHs obtained from NCEP-DOE Reanalysis 2 at 100 hPa and considered the 16.75 km GPH contour as the anticyclone region.
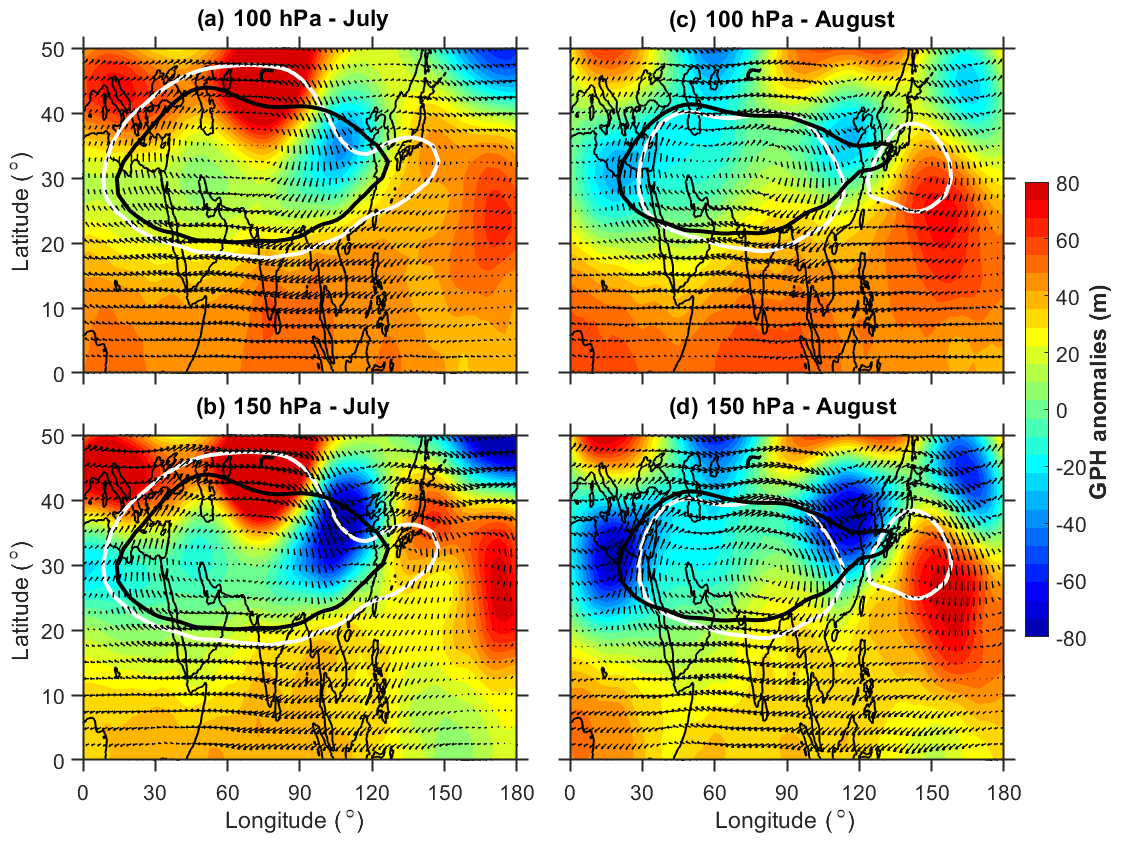
Figure 3Spatial distribution of geopotential height anomalies obtained from NCEP-DOE Reanalysis 2 data during July 2015 (a) at 100 hPa and (b) 150 hPa superimposed with wind vectors at the respective corresponding levels. Subplots of (c) and (d) same as (a) and (b) but for the month of August. The solid white contour lines represent the ASMA region at 100 hPa (16.75 km GPH contour) observed in 2015 whereas the black color lines represent the mean of 2005–2014.
The spatial distribution of GPH at 100 and 150 hPa for the month of July (August) is shown in Fig. 2a and b (Fig. 2c and d). The corresponding monthly mean winds at respective pressure levels are also shown in Fig. 2. The solid black line represents the ASMA region at 100 hPa based on 16.75 km GPH contour. The GPH distribution in Fig. 2 shows clear distinct variability in the ASMA spatial structure between July and August at both pressure levels. For example, at 100 hPa, the maximum GPH center was located over the western side in July, whereas it was located near to the Tibetan region in August. Interestingly the ASMA itself separated into two anticyclones (16.75 km GPH contour; solid black line in the figure) in August compared to July. The center of the small anticyclone was located over the northwestern Pacific near 140∘ E with the closed circulation indicated by the wind arrows.
Further, we compared the ASMA structure in 2015 with the referenced long-term mean. For this, we obtained the GPH anomalies by subtracting the background long-term mean (2005–2014) from 2015. Figure 3 shows the latitudinal–longitudinal distribution of GPH anomalies (shaded color) along with wind vectors depicting the circulation pattern at 100 hPa, as well as at 150 hPa during July and August. The white (black) color contour represents 16.75 km GPH at 100 hPa for the corresponding month in 2015 (long-term mean). The GPH anomalies at both pressure levels show quite different features in July and August. A clear wave-like structure can be observed from the GPH anomalies. In July, the GPH anomalies exhibit strong negative maxima over 25–40∘ N, 90–120∘ E and positive maxima over 40–50∘ N, 60–80∘ E regions. The 16.75 km GPH contour lines in the ASMA region exhibit higher extensions in all the directions except over the northeastern edges of the ASMA in July compared to the long-term mean. At the same location (northeastern edges), the ASMA exhibits a pronounced southward extension in July. Distinct features of GPH anomalies are noticed in August as compared to July. In August, the strong negative GPH anomalies are situated over the west and northeastern edges of the ASMA.

Figure 4Spatial distribution of monthly mean zonal winds obtained from NCEP-DOE Reanalysis 2 data at 200 hPa in July during (a) 2005–2014 and (b) 2015. Subplots of (c) and (d) same as (a) and (b) but for the month of August. The solid white contour lines represent the ASMA region at 100 hPa (16.75 km GPH contour).
It is well known that the subtropical westerly jet is an important characteristic feature of the ASMA (Ramaswamy, 1958), and thus its changes during 2015 are also investigated. As the peak intensity of the westerly jet was located at 200 hPa (Chiang et al., 2015), we focused mainly on 200 hPa zonal wind changes in July and August. Figure 4a and c (Fig. 4b and d) show the spatial distribution of the long-term (2015) monthly mean zonal wind at 200 hPa during July and August. In general, the subtropical westerlies are located near to ∼ 40∘ N latitude during the mature phase of the monsoon period (Chiang et al., 2015). Compared to the long-term mean, a significant weakening of the subtropical westerlies is noticed in 2015. Further, a strong southward shift in the westerlies is observed over the northeastern Asia region. This southward shift is moved even up to 30∘ N in both months. From zonal wind at 200 hPa (Fig. 4) and wind vectors at 100 and 150 hPa (Fig. 2), it is clear that anomalous changes have occurred in the subtropical westerlies over the northeastern parts of the ASMA around 30–40∘ N, 90–120∘ E during July and August 2015. The southward shift in the westerlies is strongly associated with the southward extension of the ASMA over the northeastern side of the ASMA (Fig. 2). This is strongly supported by the previous findings of Lin and Lu (2005) for which they showed the southward extension of the South Asian high could lead to the southward shift of the westerlies.
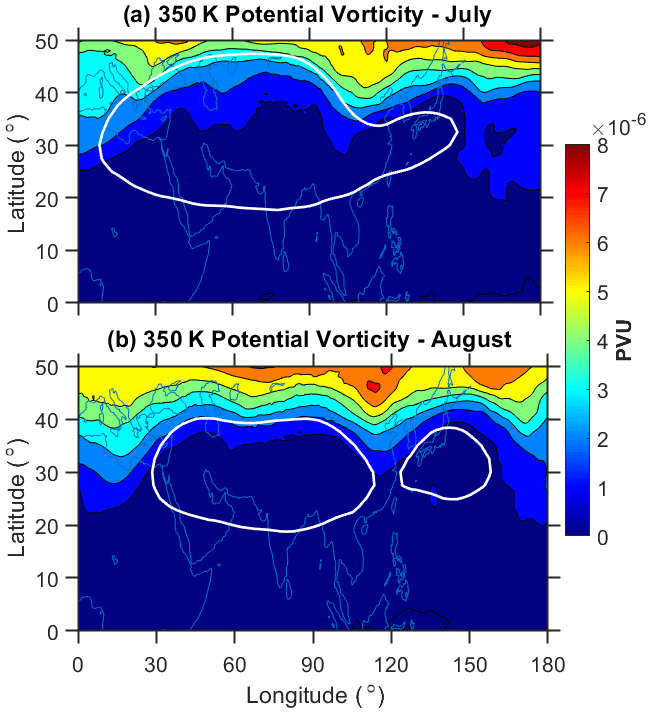
Figure 5ERA-Interim-observed spatial distribution of potential vorticity (PV) on a 350 K isentropic surface in potential vorticity units (PVUs; 1 PVU = 10−6 K m2 kg−1 s−1): (a) monthly mean of July and (b) monthly mean of August 2015. The solid white contour lines represent the ASMA region at 100 hPa (16.75 km GPH contour).
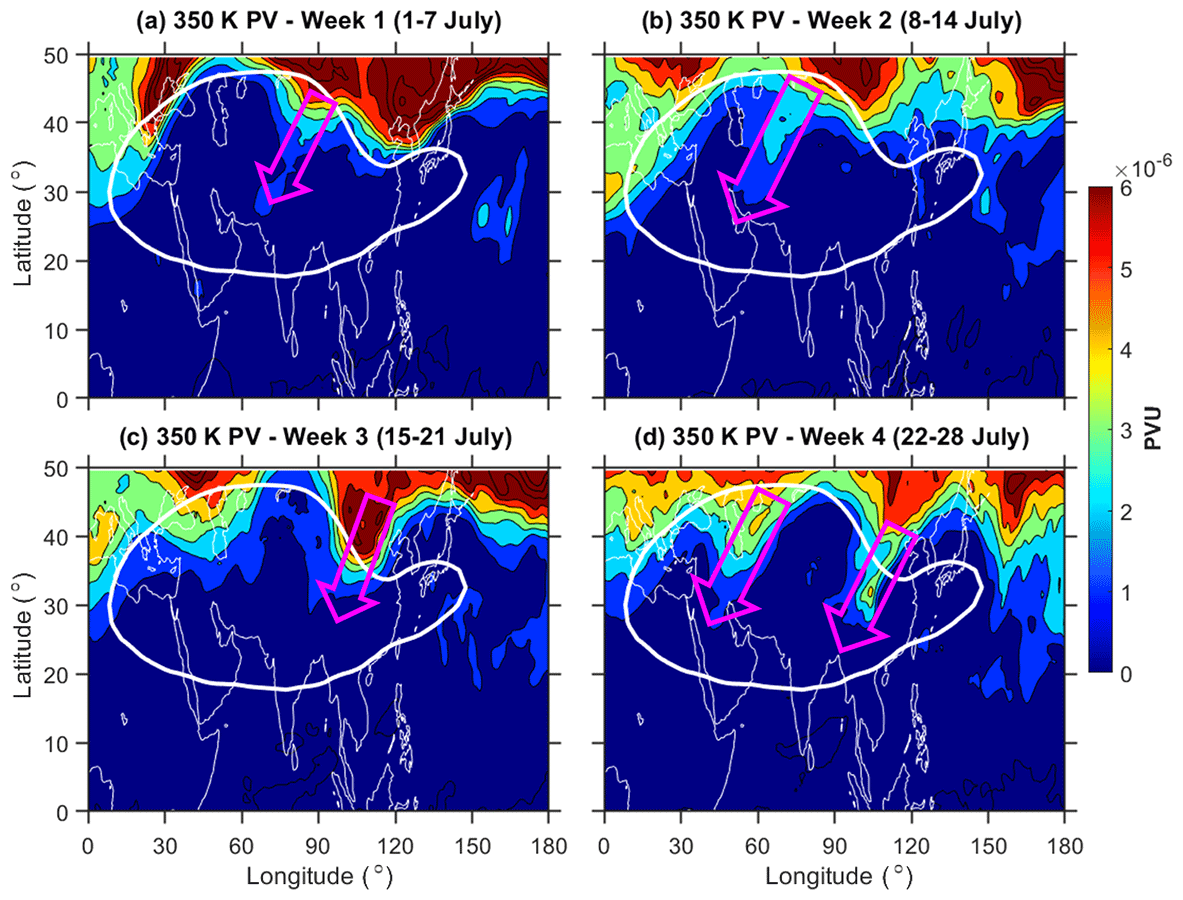
Figure 6Same as Fig. 5 but for the weekly distribution of PV in July 2015. Magenta colored arrows indicate the regions of RWB.
From the GPH and winds observations, it is clear that pronounced changes are evident in the dynamical structure of the ASMA in 2015, and also relatively different features are noticed between July and August. Interestingly the ASMA itself separated into two anticyclones during August 2015, and the separation exactly coincided with the strong negative GPH anomalies and southward meandering of subtropical westerlies over the northeastern side of the ASMA. The West Pacific (WP) mode of the anticyclone is visible in August. The split of the anticyclone and the formation of the WP mode are in agreement with previous studies reported by a few researchers earlier (e.g., Honomichl and Pan, 2020). The presence of the WP mode may be due to the eastward eddy shedding of the ASMA system in the process of its sub-seasonal zonal oscillation (Honomichl and Pan, 2020) or Rossby wave breaking (RWB) in the subtropical westerly jet (Fadnavis and Chattopadhyay, 2017). Fadnavis and Chattopadhyay (2017) also identified the split of ASMA into two anticyclones: one over Iran and another over the Tibetan region due to the RWB in the June 2014 monsoon period. To see any signatures of these RWBs in 2015, we further analyzed the RWBs through the ERA interim reanalysis potential vorticity (PV) data. Based on previous studies, it is reported that RWBs can be identified from the PV distribution at a 350 K isentropic surface (Samanta et al., 2016; Fadnavis and Chattopadhyay, 2017). We used 350 K isentropic surface PV data in July and August 2015 in the present analysis.
Figure 5a and b show the distribution of ERA interim monthly mean PV at the 350 K isentropic surface during July and August 2015. It can be seen that, during July and August 2015, clear RWB signatures are evident near 100∘ E. It is noted that the equatorial advection of high PV values with a steep gradient and the southward movement of PV from the westerly jet are the basic features of the RWB (Vellore et al., 2016; Samanta et al. 2016). These features are clearly exhibited in Fig. 5 with higher PV values extending up to ∼ 30∘ N in both months over the 100∘ E region. The location of this RWB is significantly correlated with a southward meandering of westerlies and strong negative GPH anomalies. However, the observed RWB signatures in both months are from monthly mean PV data. Further, to see the clear signatures of these RWBs, we made weekly based analyses for the month of July. For this we considered 1–7 July as week 1 and 8–14 July as week 2 so on. The weekly mean distribution of 350 K isentropic surface PV during July is shown in Fig. 6. The magenta colored arrows which are shown in Fig. 6 represent the RWB events during July 2015. A clear signature of air with high values of PV traverses from the extratropics to ASMA as is evident in Fig. 6. At weekly scales, clear RWB signatures are observed over the anticyclone region. For example, in week 1 and week 2, the RWB signatures are evident over the northern region of the ASMA. However, in week 3 and week 4, these RWB signatures are very clear over northeastern Asia even in week 5 (29 July–4 August), and we noticed RWB signatures in PV data (figure not shown). This clearly shows that the RWB splits the ASMA into two anticyclones: one over the Tibetan region and another over the WP region. It is clear that the equatorward penetration of extratropical forcing through the subtropical westerly jet started in July and was further amplified by the splitting of the ASMA into two during August.
It is well known that the RWB is an important mechanism for horizontal transport between the extratropical lower stratosphere to the tropical UTLS region. These RWBs can act as an agent for the transport of extratropical stratospheric cold, dry, and O3-rich air into the ASMA during the summer monsoon. Overall, it is concluded that the combination of the RWBs and strong southward meandering of the subtropical westerly jet in 2015 causes significant dynamical and structural changes in the ASMA. These changes in the ASMA dynamical structure in 2015 can influence the concentrations of the different trace gases within the ASMA. Further, we quantified the changes in O3, CO, and WV concentrations within the ASMA during 2015 caused by the dynamical effects. The changes that occurred in the O3, CO, and WV are discussed in the following sections.
3.2 Trace gases anomalies observed within the ASMA in 2015
It is well documented that the ASMA contains low (high) concentrations of stratospheric tracers such as O3 (tropospheric tracers such as CO, WV, etc.) and higher tropopause height compared to the region outside the ASMA during boreal summer (Park et al., 2007; Randel et al., 2010; Santee et al., 2017; Basha et al., 2020). Differences of the trace gases within and outside of the ASMA are attributed to the strong winds and closed streamlines associated with the ASMA, which act to isolate the air (Randel and Park, 2006; Park et al., 2007). To see the changes in the trace gases during 2015, we generated the background long-term mean of CO, O3, and WV by using 10 years of MLS trace gas data from 2005 to 2014. Here the results are discussed mainly based on the percentage changes relative to the respective long-term monthly mean trace gases using Eq. (1).
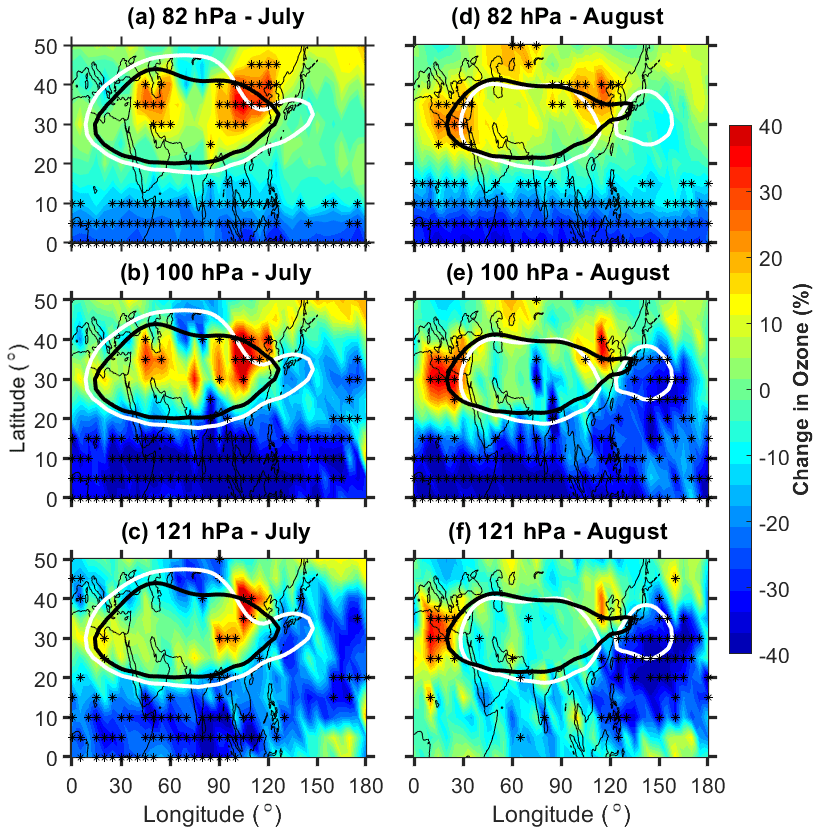
Figure 7Ozone relative percentage change in July 2015 with respect to background climatological monthly mean observed at (a) 82 hPa, (b) 100 hPa, and (c) 121 hPa. Subplots of (d)–(f) same as (a)–(c) but for the month of August. The white (black) color contour represents 16.75 km geopotential height at 100 hPa for the corresponding month in 2015 (mean of 2005–2014). The star symbols (black) shown in the figure represent the anomalies greater than the ±2σ standard deviation of the long-term mean. The results are obtained from MLS measurements.
Figure 7a to c (Fig. 7d–f) show the distribution of the relative percentage change in the O3 concentrations within the ASMA at 82, 100, and 121 hPa during July (August) 2015. The anomalies larger than ±2σ standard deviation of the long-term mean are highlighted with star symbols in the respective figures. The spatial distribution of changes in the O3 (Fig. 7) shows a clear increase in the O3 mixing ratios (> 40 %) within the ASMA in 2015. The observed increase within the ASMA is quite distinct between July and August. In July, the O3 shows a pronounced increase within the ASMA at all the pressure levels. Note that the observed increase was statistically significant with a long-term mean with a standard deviation larger than 2σ (see the star symbols). This increase is quite significant over the northeastern edges of the ASMA and quite high at 100 hPa compared to 82 and 121 hPa. In August, the O3 shows quite different features compared to July (Fig. 7d–f). A strong increase in the O3 is observed over the western and eastern edges of the ASMA at all the pressure levels. The increase is quite significant at 100 hPa and even at 121 hPa. The increase in O3 is still appearing over the northeastern edges of the ASMA in August as observed in July. Overall, a significant enhancement of O3 within the ASMA is clear evidence in July and August 2015.
The significant increase in O3 within the ASMA in 2015 might be due to the transport from the midlatitudes through the subtropical westerly jet (STJ) and also due to the stratosphere to the troposphere transport. For example, the strong enhancement of O3 within the ASMA at 100 hPa in July was strongly matched with the observed high values of PV at a 350 K isentropic surface (Fig. 6). This is further supported by the strong southward meandering of STJ in July (Fig. 3). Thus, a clear transport of midlatitude air with high PV and high O3 is evident during 2015. At the same time, the enhancement of O3 was clearly observed at all the pressure levels from 82 to 121 hPa, which is further support for the stratosphere to the troposphere transport. Note that 82 hPa can represent the lower stratosphere and 121 hPa the upper troposphere (Das et al., 2020). It can be noticed that the ASMA is strongly associated with troposphere–stratosphere transport, as well as stratosphere–troposphere transport (Garny and Randel, 2016; Fan et al., 2017). Also, it is well reported that the northern part of the ASMA is an active region for stratosphere–troposphere transport processes (Sprenger et al., 2003; Škerlak et al., 2014).
Similarly, significant lowering of O3, particularly at 100 and 82 hPa is clearly noticed over the tropics (Fig. 7). This is quite expected due to the enhanced tropical upwelling (bringing O3-poor air from troposphere) caused by the strong El Niño conditions in July and August 2015. As mentioned in the previous sections, strong El Niño conditions are clearly evident in July and August 2015 (Fig. 1). The observed strongly negative O3 anomalies over the tropics from the present study are well matched with the previous studies (Randel et al., 2009; Diallo et al., 2018). From the present results, it is very clear that there is a significant decrease over the tropics and increase over the midlatitudes in 2015. These changes observed in the O3 (decrease and increase) are attributed to the strengthening of the tropical upwelling and enhanced downwelling from the shallow branch of the Brewer–Dobson circulation in the midlatitudes due to the strong El Niño conditions in 2015. Overall, it is concluded that initially, during July, the O3 is transported into the anticyclone from the northeastern edges of the ASMA region through the subtropical westerlies, and then it is isolated within the ASMA region. This is further supported by the southward meandering of the westerly jet and southward shift of the ASMA (negative GPH anomalies) over the same region in July (Fig. 3). Also, a significant transport of midlatitude dry air is clear from Fig. 6. Thus, it is clear from the results that the stratosphere to troposphere transport and horizontal advection along with the subtropical jet caused the strong enhancement of the O3 within the ASMA in 2015.

Figure 8Carbon monoxide relative percentage change during July 2015 with respect to climatological monthly mean observed at (a) 100 hPa and (b) 146 hPa. Subplots of (c) and (d) same as (a) and (b) but for the month of August. The white (black) color contour represents the 16.75 km geopotential height at 100 hPa for the corresponding month in 2015 (mean of 2005–2014). The star symbols (black) shown in the figure represent the anomalies greater than the ±2σ standard deviation of the long-term mean. The results are obtained from MLS measurements.
Figure 8a and b (Fig. 8c–d) show the spatial distribution of CO relative percentage change at 100 and 146 hPa observed during July (August) 2015. The white (black) color contour represents 16.75 km GPH at 100 hPa for the corresponding month in 2015 (climatological mean). The observed changes in the CO clearly exhibit quite distinct features between July and August as observed in the O3. A significant decrease (∼ 30 %) is noticed in the CO concentrations over most of the ASMA in July. The maximum decrease in CO is noticed over the northeastern edges of the ASMA, located in the ∼ 30–45∘ N, 90–120∘ E region, whereas in August, the decrease in CO is more concentrated over the eastern and western edges of the ASMA at both the pressure levels. Overall, the MLS-observed CO was ∼ 30 % below average (percentage decrease) compared to the climatological monthly mean within the ASMA in July and edges of the ASMA in August 2015. It is noted that there is a considerable year-to-year variability in the CO sources over the ASM region (Santee et al., 2017). The major sources of the CO over the ASM region are from biomass burning and industrial emissions. The observed decreased CO within the ASMA in 2015 might be due to the year-to-year variability in the CO sources and the weaker vertical transport due to the El Niño conditions in 2015.
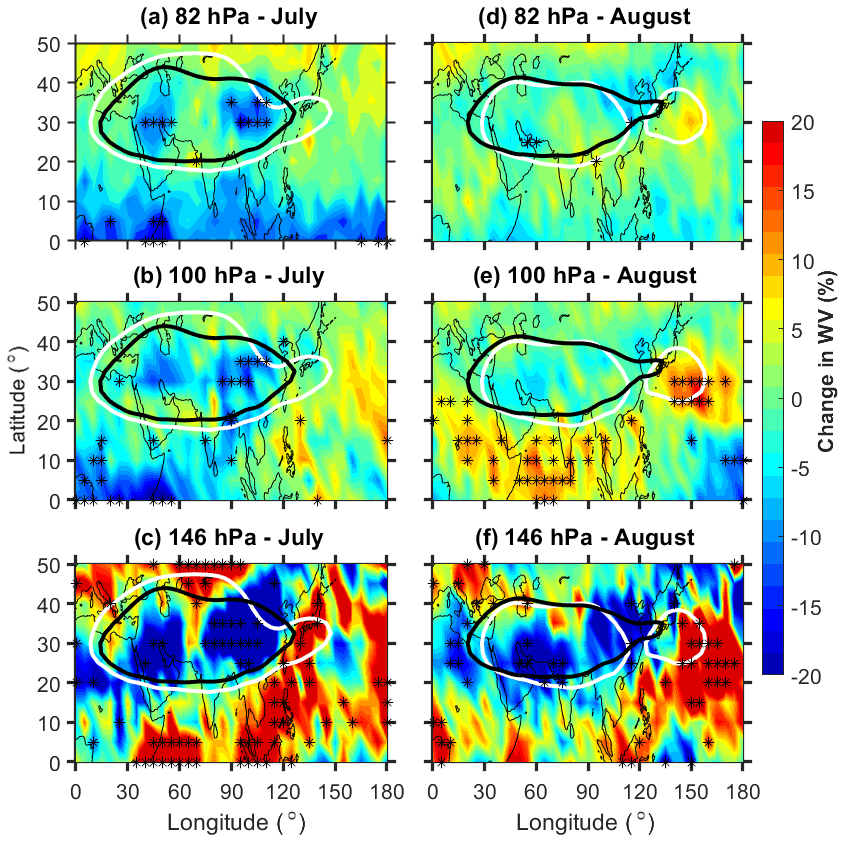
Figure 9Water vapor relative percentage change in July 2015 with respect to background climatological monthly mean observed at (a) 82 hPa, (b) 100 hPa, and (c) 146 hPa. Subplots of (d)–(f) same as (a)–(c) but for the month of August. The white (black) color contour represents the 16.75 km geopotential height at 100 hPa for the corresponding month in 2015 (mean of 2005–2014). The star symbols (black) shown in the figure represent the anomalies greater than the ±2σ standard deviation of the long-term mean. The results are obtained from MLS measurements.
Similarly, the WV relative percentage change at 82, 100, and 146 hPa in July (August) 2015 are shown in Fig. 9a–c (Fig. 9d–f). The WV shows quite different changes at all the pressure levels in July and August. At 146 hPa, the WV exhibits a strong decrease (> 20 %) within the ASMA in July, as well as in August. However, at 100 and 82 hPa, the WV shows a relatively significant decrease within the ASMA in July compared to August. From the WV observations, it is concluded that the WV is strongly decreased at 146 hPa in both months, whereas at 100 and 82 hPa, the decrease in WV is quite high in July compared to August. It is also observed from Fig. 9 that there is a significant enhancement of WV over the tropics at 146 hPa in both months. But the WV enhancement is quite significant at 100 hPa, particularly during August compared to July. This enhancement in the WV around the tropical tropopause region in August is quite expected due to the El Niño conditions (Randel et al., 2009; Konopka et al., 2016). Overall, the tropospheric tracers (CO and WV) significantly decreased (∼ 30 % and 20 %) within the ASMA during July and August 2015. These changes in the tropospheric tracers might be due to the weaker vertical motions during the 2015 monsoon. A weaker vertical transport from the boundary layer to the UTLS is generally observed over the ASM region during El Niño periods (Fadnavis et al., 2019). The El Niño conditions will suppress the monsoon convection and cause weaker vertical transport during monsoons. It is also reported that the summer monsoon in 2015 was weaker due to the strongest El Niño conditions existing in 2015 (Tweedy et al., 2018; Yuan et al., 2019; Fadnavis et al., 2019).
From these results, it is clear that the enhancement of O3 and lowering of CO and WV is evident in July and August 2015 compared to the long-term monthly mean. The observed high O3 and low WV within the ASMA from the present study are consistent and well matched with the previous study reported by Li et al. (2018). They demonstrated the importance of the large-scale atmospheric dynamics and the stratospheric intrusions for high O3 and low WV over Lhasa within the ASMA by using in situ balloon-borne measurements. The O3 and WV changes strongly influence the background temperature structure within the UTLS region (Venkat Ratnam et al., 2016; Ravindra Babu et al., 2019b). Further, we investigated the tropopause temperature changes within the ASMA by using COSMIC RO data. The results are presented in the following section.
3.3 Tropopause temperature anomalies in 2015
It is well known that the tropopause plays a crucial role in the exchange of WV, O3, and other chemical species between the troposphere and the stratosphere. Most of these exchanges (WV to the lower stratosphere and O3 to the upper troposphere) known as stratosphere–troposphere exchange (STE) take place around the tropopause region (Fueglistaler et al., 2009; Venkat Ratnam et al., 2016; Ravindra Babu et al., 2019b). It is well reported that the tropopause within the ASMA is higher than the outside regions at the same latitude (Randel et al., 2010; Santee et al., 2017). In the present study, we mainly focused on changes in the cold-point tropopause temperature (CPT) and lapse rate tropopause temperature (LRT) within the ASMA in July and August 2015. The July and August 2015 monthly mean tropopause parameters are removed from the respective climatological monthly mean which is calculated by using COSMIC RO data from 2006 to 2014. One can note that we have strictly restricted our analysis within the 40∘ N region for the cold-point tropopause. Figure 10a and b (Fig. 10c–d) show the CPT and LRT anomalies observed in July (August) 2015. The tropopause temperature anomalies (CPT and LRT) also exhibit a distinct pattern in July and August as observed in O3 (Fig. 7). In July, the CPT and LRT show strong positive anomalies (∼ 5 K) in most of the ASMA region. High positive CPT and LRT anomalies are also noticed over the northwestern Pacific (NWP) region particularly below 20∘ N. These CPT and LRT anomalies observed over the NWP region might be due to the El-Niño-induced changes in the Walker circulation and convective activity. Previous studies also observed significant warm tropopause temperature anomalies over the WP and maritime continent during the El Niño period (Gettelman et al., 2001). In August, the strong positive CPT and LRT anomalies (∼ 5 K) are concentrated over the northeastern edges of the anticyclone where the WP mode of the anticyclone was separated from the ASMA. The temperature anomalies at 1 km above and below the CPH also show similar behavior as seen in the CPT and LRT during August 2015 (figures not shown). Overall, the tropopause temperature anomalies in July and August 2015 within the ASMA are well correlated with the strong enhancement in the O3 as shown in Fig. 7. However, the enhanced O3 anomalies (heating due to the O3) themselves cannot explain the observed positive tropopause temperature anomalies within the ASMA in 2015. This might be due to the El-Niño-induced changes in the convective activity and the circulation. It is well known that the reversal of walker circulation and the shifting of the convective activity (suppressed convective activity over the ASM region) are generally observed during the warm phase of ENSO. It can be noticed that apart from the convection, other factors such as stratospheric QBO and atmospheric waves (gravity waves and Kelvin waves) also strongly influenced the tropopause temperatures.
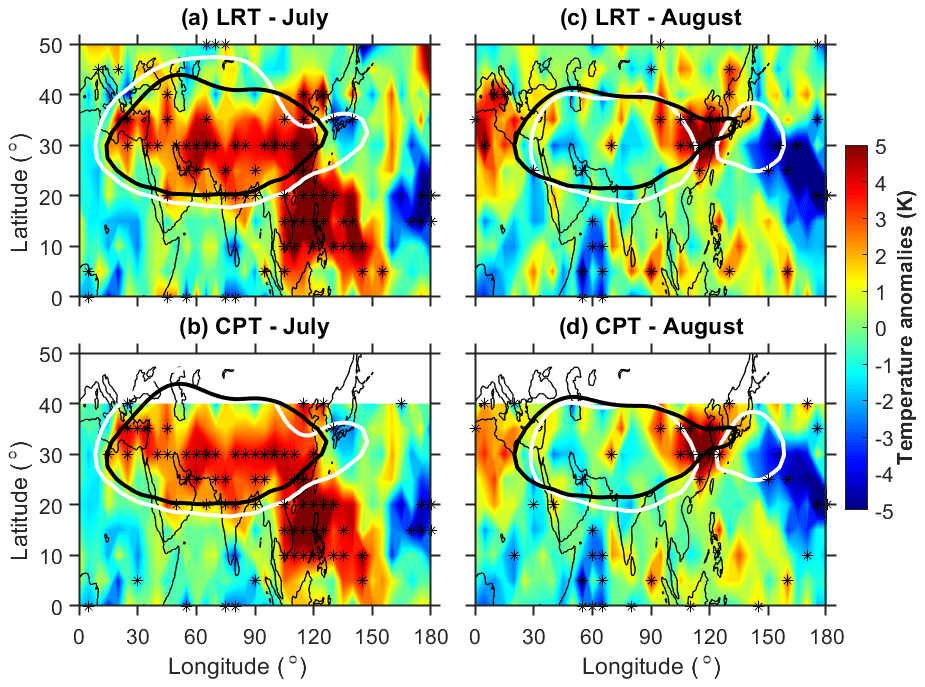
Figure 10Spatial distribution of (a) lapse rate tropopause temperature (LRT) and (b) cold-point tropopause temperature (CPT) anomalies during July 2015. Subplots of (c) and (d) same as (a) and (b) but for the month of August 2015. The white (black) color contour represents the 16.75 km geopotential height at 100 hPa for the corresponding month in 2015 (mean of 2005–2014). The star symbols (black) shown in the figure represent the anomalies greater than the ±2σ standard deviation of the long-term mean.
In this study, we investigated the detailed changes observed in the structure, dynamics, and trace gas (ozone, water vapor, carbon monoxide) variability within the ASMA in 2015 by using reanalysis products and satellite observations. The tropopause temperature (CPT and LRT) on monthly scales particularly during July and August 2015 was also discussed. To quantify the changes that happened within the ASMA region, 11 years (2005–2015) of O3, WV, and CO observations from the Aura-MLS data and 10 years (2006–2015) of tropopause temperature data from the COSMIC RO temperature profiles are used. The winds observed by NCEP-DOE Reanalysis 2 and GPH data from 2005 to 2015 are also utilized. The results are obtained by comparing the trace gas quantities in July and August 2015 with corresponding long-term monthly mean quantities.
The trace gases within the ASMA exhibit substantial anomalous behavior in July and August 2015. During July and August 2015, we observed an enhancement of O3 and the lowering of CO and WV over most of the ASMA region. The decrease in the tropospheric tracers (CO and WV) is quite expected due to the weaker upward motions from the weak monsoon in 2015. This is supported by a recent study reported by Fadnavis et al. (2019). It showed weaker upward motions and deficient rainfall in the 2015 monsoon due to the strong El Niño conditions. However, the strong enhancement in the stratospheric tracer (O3) within the ASMA particularly over the northeastern edges of the ASMA during July is quite interesting. This might be due to the stratospheric intrusions, as well as transport from the midlatitudes. Based on Fishman and Seiler (1983), it was stated that the positive correlation between CO and O3 indicates that the O3 is produced in situ in the troposphere, whereas when the correlation is negative, it means the O3 originates from the stratosphere. We noticed a strong negative correlation between CO and O3 in the present study with increased O3 and decreased CO from the MLS measurements. This clearly reveals that the observed increased O3 within the ASMA during 2015 is of stratospheric origin. This is further supported by higher negative GPH anomalies associated with a southward meandering of the subtropical westerly jet over northeastern Asia in July (Figs. 3 and 4). Further, the increased O3 at 100 and 121 hPa over western edges of the ASMA during August clearly indicates the transport of the O3 towards outer regions through the outflow of the ASMA (Fig. 7e–f). Interestingly, the tropopause temperature obtained from the COSMIC RO data in July 2015 shows strong positive temperature anomalies (∼ 5 K) over the entire ASMA region. These warm tropopause temperatures again supported the increased O3 within the ASMA during 2015. The major findings obtained from the present study are summarized in the following.
-
The spatial extension of the ASMA region shows a mean higher than the long-term mean except over northeastern Asia where it exhibits a strong southward shift in July, whereas in August, the ASMA further separated into two anticyclones, and the western Pacific mode anticyclone is clearly evident in August.
-
The combination of Rossby wave breaking and pronounced southward meandering of subtropical westerlies plays a crucial role in the dynamical and structural changes in the ASMA in 2015.
-
The strong enhancement in O3 at 100 hPa (> 40 %) is clearly evident within the ASMA and particularly higher over the northeastern edges of the ASMA in July. The enhanced O3 is strongly associated with a dominant southward meandering of the subtropical westerlies. In August, the increased O3 is significantly located over the western edges of the ASMA. This clearly indicates the transport from the ASMA to the edges through its outflow.
-
A significant lowering of CO and WV within the ASMA is noticed during summer 2015. The lowering of WV is higher at 146 hPa than 100 hPa.
-
Significantly positive tropopause temperature anomalies (∼ 5 K) are observed in the entire ASMA region in July, whereas in August, the strong positive anomalies are concentrated over the northeastern side of the ASMA.
The changes in the O3 concentrations (increase or decrease) within the ASMA are one of the possible mechanisms strengthening or weakening the ASMA (Braesicke et al., 2011). By using idealized climate model experiments, Braesicke et al. (2011) clearly demonstrated that the strengthening (weakening) of the ASMA occurred when the O3 is decreased (increased) within the ASMA. The increased O3 within the ASMA warms the entire anticyclone region and weakens the ASMA (Braesicke et al., 2011). Our results from the present study are also in agreement with the results of Braesicke et al. (2011). We also observed a pronounced increase in O3 within the ASMA associated with the significant warming of the tropopause, as well as above and below the tropopause region, in 2015. By using precipitation index, wind data, and stream functions, previous studies reported that the ASMA circulation in 2015 was weaker than the normal (Tweedy et al., 2018; Yuan et al., 2019). Based on our present results, the strongly enhanced O3 within the ASMA also might be one of the plausible reasons for weakening of the ASMA in 2015.
All the data used in the present study are available freely from the respective websites. MLS version 4.2 level 2 data can be downloaded from https://acdisc.gesdisc.eosdis.nasa.gov/data/Aura_MLS_Level2/ (NASA, 2021, last access: 15 January 2021). The COSMIC RO data can be downloaded from the CDAAC UCAR website https://cdaac-www.cosmic.ucar.edu/cdaac/products.html (CDAAC, 2021, last access: 15 January 2021). The NCEP Reanalysis 2 data were downloaded from NOAA/OAR/ESRL PSL, Boulder, Colorado, USA, from their website http://www.cpc.ncep.noaa.gov/products/wesley/reanalysis2/kana/reanl2-1.html (NCEP-DOE, 2021, last access: 15 January 2021). ERA-Interim reanalysis data were obtained from the European Centre for Medium-Range Weather Forecasts (ECMWF) from http://apps.ecmwf.int/datasets/data/interim-full-daily/levtype=pl/ (ECMWF, 2021, last access: 15 January). The monthly Niño 3.4 index data were downloaded from the Climate Prediction Center website http://www.cpc.ncep.noaa.gov (last access: 15 January 2021).
SRB designed the study and conducted research. SRB, GB and SKP performed data analysis. SRB wrote the first manuscript draft. MVR and NHL provided useful comments and revised the paper. SRB edited the final manuscript.
The authors declare that they have no conflict of interest.
Aura MLS observations obtained from the GES DISC through their FTP site (https://mls.jpl.nasa.gov/index-eos-mls.php, last access: 15 January 2021) are duly acknowledged. We thank the COSMIC Data Analysis and Archive Center (CDAAC) for providing RO data used in the present study through their FTP site (http://cdaac-www.cosmic.ucar.edu/cdaac/products.html, last access: 15 January 2021). We also thank NCEP/NCAR reanalysis for providing geopotential and wind data. We thank ECMWF for providing ERA Interim reanalysis data.
This paper was edited by Rolf Müller and reviewed by Paul Konopka, Dan Li, and one anonymous referee.
Anthes, R., Bernhardt, P., Chen, Y., Cucurull, L., Dymond, K., Ector, D., Healy, S., Ho, S., Hunt, D., Kuo, Y., Liu, H., Manning, K., Mccormick, C., Meehan, T., Randel, W., Rocken, C., Schreiner, W., Sokolovskiy, S., Syndergaard, S., Thompson, D., Trenberth, K., Wee, T., Yen, N., and Zeng, Z.: The COSMIC/FORMOSAT-3 – Mission early results, B. Am. Meteorol. Soc., 89, 313–333, 2008.
Avery, M. A., Davis, S. M., Rosenlof, K. H., Ye, H., and Dessler, A. E.: Large anomalies in lower stratospheric water vapour and ice during the 2015–2016 El Niño, Nat. Geosci., 10, 405–409, https://doi.org/10.1038/ngeo2961, 2017.
Basha, G., Ratnam, M. V., and Kishore, P.: Asian summer monsoon anticyclone: trends and variability, Atmos. Chem. Phys., 20, 6789–6801, https://doi.org/10.5194/acp-20-6789-2020, 2020.
Bergman, J. W., Fierli, F., Jensen, E. J., Honomichl, S., and Pan, L. L.: Boundary layer sources for the Asian anticyclone: Regional contributions to a vertical conduit, J. Geophys. Res.-Atmos., 118, 2560–2575, https://doi.org/10.1002/jgrd.50142, 2013.
Bian, J. C., Pan, L. L., Paulik, L., Vömel, H., and Chen, H. B.: In situ water vapor and ozone measurements in Lhasa and Kunming during the Asian summer monsoon, Geophys. Res. Lett., 39, L19808, https://doi.org/10.1029/2012GL052996, 2012.
Braesicke, P., Smith, O. J., Telford, P., and Pyle, J. A.: Ozone concentration changes in the Asian summer monsoon anticyclone and lower stratospheric water vapour: An idealised model study, Geophys. Res. Lett., 38, L03810, https://doi.org/10.1029/2010GL046228, 2011.
CDAAC (COSMIC Data Analysis and Archive Center): CDAAC Data Products, available at: http://cdaac-www.cosmic.ucar.edu/cdaac/products.html, last access: 15 January 2021.
Chiang, J. C. H., Fung, I. Y., Wu, C. H., Cai, Y. J., Edman, J. P., Liu, Y. W., Day, J. A., Bhattacharya, T., Mondal, Y., and Labrousse, C. A.: Role of seasonal transitions and westerly jets in East Asian paleoclimate, Quaternary Sci. Rev., 108, 111–129, https://doi.org/10.1016/j.quascirev.2014.11.009, 2015.
Dee, D. P., Uppala, S. M., Simmons, A. J., Berrisford, P., Poli, P., Kobayashi, S., Andrae, U., Balmaseda, M. A., Balsamo, G., Bauer, P., Bechtold, P., Beljaars, A. C. M., van de Berg, I., Biblot, J., Bormann, N., Delsol, C., Dragani, R., Fuentes, M., Greer, A. J., Haimberger, L., Healy, S. B., Hersbach, H., Holm, E. V., Isaksen, L., Kallberg, P., Kohler, M., Matricardi, M., McNally, A. P., Mong-Sanz, B. M., Morcette, J.-J., Park, B.-K., Peubey, C., de Rosnay, P., Tavolato, C., Thepaut, J. N., and Vitart, F.: The ERA-Interim reanalysis: Configuration and performance of the data assimilation system, Q. J. Roy. Meteorol. Soc., 137, 553–597, https://doi.org/10.1002/qj.828, 2011.
Diallo, M., Riese, M., Birner, T., Konopka, P., Müller, R., Hegglin, M. I., Santee, M. L., Baldwin, M., Legras, B., and Ploeger, F.: Response of stratospheric water vapor and ozone to the unusual timing of El Niño and the QBO disruption in 2015–2016, Atmos. Chem. Phys., 18, 13055–13073, https://doi.org/10.5194/acp-18-13055-2018, 2018.
Das, S. S., Suneeth, K. V., Ratnam, M. V., Girach, I. A., and Das, S. K.: Upper tropospheric ozone transport from the sub-tropics to tropics over the Indian region during Asian summer monsoon, Clim Dynam., 52, 4567, https://doi.org/10.1007/s00382-018-4418-6, 2019.
Das, S. and Suneeth, K. V.: Seasonal and interannual variations of water vapor in the upper troposphere and lower stratosphere over the Asian Summer Monsoon region – in perspective of the tropopause and ocean-atmosphere interactions, J. Atmos. Sol.-Terr. Phy., 201, 105244, https://doi.org/10.1016/j.jastp.2020.105244, 2020.
Dessler, A. E., Schoeberl, M. R., Wang, T., Davis, S. M., Rosenlof, K. H., and Vernier, J. P.: Variations of stratospheric water vapor over the past three decades, J. Geophys. Res.-Atmos., 119, 12588–12598, https://doi.org/10.1002/2014JD021712, 2014.
Dunkerton, T. J.: The quasi-biennial oscillation of 2015–2016: Hiccup or death spiral?, Geophys. Res. Lett., 43, 10547–10552, https://doi.org/10.1002/2016GL070921, 2016.
ECMWF (European Centre for Medium-Range Weather Forecasts): ERA Interim, available at: http://apps.ecmwf.int/datasets/data/interim-full-daily/levtype=pl/, last access: 15 January 2021.
Fadnavis, S. and Chattopadhyay, R.: Linkages of subtropical stratospheric intraseasonal intrusions with Indian summer monsoon deficit rainfall, J. Climate, 30, 5083–5095, https://doi.org/10.1175/JCLI-D-16-0463.1, 2017.
Fadnavis, S., Sabin, T. P., Roy, C., Rowlinson, M., Rap, A., Vernier, J.-P., and Sioris, C. E.: Elevated aerosol layer over South Asia worsens the Indian droughts, Sci. Rep., 9, 10268, https://doi.org/10.1038/s41598-019-46704-9, 2019.
Fan, Q., Bian, J., and Pan, L. L.: Stratospheric entry point for upper-tropospheric air within the Asian summer monsoon anticyclone, Sci. China Earth Sci., 60, 1685–1693, https://doi.org/10.1007/s11430-016-9073-5, 2017.
Fishman, J. and Seiler, W.: Correlative nature of ozone and carbon monoxide in the troposphere – Implications for the tropospheric ozone budget, J. Geophys. Res. 88, 3662–3670, https://doi.org/10.1029/JC088iC06p03662, 1983.
Fueglistaler, S., Dessler, A. E., Dunkerton, T. J., Folkins, I., Fu, Q., and Mote, P. W.: Tropical Tropopause Layer, Rev. Geophys., 47, G1004, https://doi.org/10.1029/2008RG000267, 2009.
Gadgil, S. and Francis, P. A.: El Niño and the Indian rainfall in June, Curr. Sci., 110, 1010–1022, 2016.
Garny, H. and Randel, W. J.: Transport pathways from the Asian monsoon anticyclone to the stratosphere, Atmos. Chem. Phys., 16, 2703–2718, https://doi.org/10.5194/acp-16-2703-2016, 2016.
Gettelman, A., Randel, W. J., Massie, S., and Wu, F.: El Niño as a natural experiment for studying the tropical tropopause region, J. Clim., 14, 3375–3392, 2001.
Gettelman, A., Kinnison, D. E., Dunkerton, T. J., and Brasseur, G. P.: Impact of monsoon circulations on the upper troposphere and lower stratosphere, J. Geophys. Res.-Atmos., 109, D22101, https://doi.org/10.1029/2004JD004878, 2004.
Hajj, G. A., Ao, C. O., Iijima, B. A., Kuang, D., Kursinski, E. R., Mannucci, A. J., Meehan, T. K., Romans, L. J., de la Torre Juarez, M., and Yunck, T. P.: CHAMP and SAC-C atmospheric occultation results and inter comparisons, J. Geophys. Res.-Atmos., 109, D06109, https://doi.org/10.1029/2003JD003909, 2004.
Holton, J. R., Haynes, P. H., McIntyre, M. E., Douglass, A. R., Rood, R. B., and Pfister, L.: Stratosphere Troposphere exchange, Rev. Geophys., 33, 403–439, https://doi.org/10.1029/95RG02097, 1995.
Honomichl, S. B. and Pan, L. L.: Transport from the Asian summer monsoon anticyclone over the western Pacific, J. Geophys. Res.-Atmos., 125, e2019JD032094, https://doi.org/10.1029/2019JD032094, 2020.
Hossaini, R., Chipperfield, M., Montzka, M. P., Rap, S. A., Dhomse, S., and Feng, W.: Efficiency of short-lived halogens at influencing climate through depletion of stratopsheric ozone, Nat. Geosci., 8, 186–190, https://doi.org/10.1038/ngeo2363, 2015.
Jiang, J. H., Su, H., Zhai, C., Wu, L., Minschwaner, K., Molod, A. M., and Tompkins, A. M.: An assessment of upper troposphere and lower stratosphere water vapor in MERRA, MERRA2, and ECMWF reanalyses using Aura MLS observations, J. Geophys. Res.-Atmos., 120, 11468–11485, https://doi.org/10.1002/2015JD023752, 2015.
Kanamitsu, M., Ebisuzaki, W., Woollen, J., Yang, S.-K., Hnilo, J. J., Fiorino, M., and Potter, G. L.: NCEP-DOE AMIP-II Renalalysys (R-2), B. Am. Meteorol. Soc., 83, 1631–1643, https://doi.org/10.1175/BAMS-83-11-1631, 2002.
Khan, A. and Jin, S.: Effect of gravity waves on the tropopause temperature, altitude and water vapor in Tibet from COSMIC GPS Radio Occultation observations, J. Atmos. Sol.-Terr. Phy., 138–139, 23–31, https://doi.org/10.1016/j.jastp.2015.12.001, 2016.
Kim, J. and Son, S.-W.: Tropical Cold-Point Tropopause: Climatology, Seasonal Cycle, and Intraseasonal Variability Derived from COSMIC GPS Radio Occultation Measurements, J. Climate, 25, 5343–5360, https://doi.org/10.1175/JCLI-D-11-00554.1, 2012.
Kumar, K. K., Rajagopalan, B., and Cane, M. A.: On the weakening relationship between the Indian monsoon and ENSO, Science, 287, 2156–2159, 1999.
Kursinski, E. R., Hajj, G. A., Schofield, J. T., Linfield, R. P., and Hardy, K. R.: Observing Earth's atmosphere with radio occultation measurements using the Global Positioning System, J. Geophys. Res., 102, 23429–23465, 1997.
Konopka, P., Ploeger, F., Tao, M., and Riese, M.: Zonally resolved impact of ENSO on the stratospheric circulation and water vapor entry values, J. Geophys. Res.-Atmos., 121, 11486–11501, https://doi.org/10.1002/2015JD024698, 2016.
Li, Q., Jiang, J. H., Wu, D. L., Read, W. G., Livesey, N. J., Waters, J. W., Zhang, Y., Wang, B., Filipiak, M. J., Davis, C. P., Turquety, S., Wu, S., Park, R. J., Yantosca, R. M., and Jacob, D. J.: Convective outflow of South Asian pollution: A global CTM simulation compared with EOS MLS observations, Geophys. Res. Lett., 32, L14826, https://doi.org/10.1029/2005GL022762, 2005.
Li, D., Vogel, B., Müller, R., Bian, J., Günther, G., Li, Q., Zhang, J., Bai, Z., Vömel, H., and Riese, M.: High tropospheric ozone in Lhasa within the Asian summer monsoon anticyclone in 2013: influence of convective transport and stratospheric intrusions, Atmos. Chem. Phys., 18, 17979–17994, https://doi.org/10.5194/acp-18-17979-2018, 2018.
Lin, Z., and Lu, R.: Inter annual meridional displacement of the East Asian upper tropospheric jet stream in summer. Adv. Atmos. Sci., 22, 199–211, https://doi.org/10.1007/BF02918509, 2005.
Livesey, N. J., Read, W. G., Wagner, P. A., Froidevaux, L., Lambert, A., Manney, G. L., Valle, L. F. M., Pumphrey, H. C., Santee, M. L., Schwartz, M. J., Wang, S., Fuller, R. A., Jarnot, R. F., Knosp, B. W., and Martinez, E.: Version 4.2x Level 2 data quality and description document, available at: https://mls.jpl.nasa.gov/data/v4-2_data_quality_document.pdf (last access: 15 January 2021), 2018.
Kishore, P., Namboothiri, S. P., Jiang, J. H., Sivakumar, V., and Igarashi,K.: Global temperature estimates in the troposphere and stratosphere: a validation study of COSMIC/FORMOSAT-3 measurements, Atmos. Chem. Phys., 9, 897–908, https://doi.org/10.5194/acp-9-897-2009, 2009.
NASA: NASA GES DISK Aura MLS level 2 data, available at: https://acdisc.gesdisc.eosdis.nasa.gov/data/Aura_MLS_Level2/, last access: 15 January 2021.
NCEP-DOE (National Centers for Environmental Prediction/National Weather Service/NOAA/U.S. Department of Commerce): NCEP/DOE Reanalysis 2, available at: http://www.cpc.ncep.noaa.gov/products/wesley/reanalysis2/kana/reanl2-1.html, last access: 15 January 2021.
Nützel, M., Dameris, M., and Garny, H.: Movement, drivers and bimodality of the South Asian High, Atmos. Chem. Phys., 16, 14755–14774, https://doi.org/10.5194/acp-16-14755-2016, 2016.
Pan, L. L., Honomichl, S. B., Kinnison, D. E., Abalos, M., Randel, W. J., Bergman, J. W., and Bian, J. C.: Transport of chemical tracers from the boundary layer to stratosphere associated with the dynamics of the Asian summer monsoon, J. Geophys. Res.-Atmos., 121, 14159–14174, https://doi.org/10.1002/2016JD025616, 2016.
Park, M., Randel, W. J., Kinnison, D. E., Garcia, R. R., and Choi, W.: Seasonal variation of methane, water vapor, and nitrogen oxides near the tropopause: Satellite observations and model simulations, J. Geophys. Res.-Atmos., 109, D03302, https://doi.org/10.1029/2003jd003706, 2004.
Park, M., Randel, W. J., Gettelman, A., Massie, S. T., and Jiang, J. H.: Transport above the Asian summer monsoon anticyclone inferred from Aura MLS tracers, J. Geophys. Res., 112, D16309, https://doi.org/10.1029/2006JD008294, 2007.
Park, M., Randel, W. J., Emmons, L. K., Bernath, P. F., Walker, K. A., and Boone, C. D.: Chemical isolation in the Asian monsoon anticyclone observed in Atmospheric Chemistry Experiment (ACE-FTS) data, Atmos. Chem. Phys., 8, 757–764, https://doi.org/10.5194/acp-8-757-2008, 2008.
Park, M., Randel, W. J., Emmons, L. K., and Livesey, N. J.: Transport pathways of carbon monoxide in the Asian summer monsoon diagnosed from Model of Ozone and Related Tracers (MOZART), J. Geophys. Res., 114, D08303, https://doi.org/10.1029/2008JD010621, 2009.
Ramaswamy, C.: A preliminary study of the behavior of the Indian southwest monsoon in relation to the westerly jet-stream, Special Palmen No. Geophysica, 6, 455–476, 1958.
Randel, W. J. and Park, M.: Deep convective influence on the Asian summer monsoon anticyclone and associated tracer variability observed with Atmospheric Infrared Sounder (AIRS), J. Geophys. Res., 111, D12314, https://doi.org/10.1029/2005jd006490, 2006.
Randel, W. J., Garcia, R. R., Calvo, N., and Marsh, D.: ENSO influence on zonal mean temperature and ozone in the tropical lower stratosphere, Geophys. Res. Lett., 36, L15822, https://doi.org/10.1029/2009GL039343, 2009.
Randel, W. J., Park, M., Emmons, L., Kinnison, D., Bernath, P., Walker, K. A., Boone, C., and Pumphrey, H.: Asian Monsoon Transport of Pollution to the Stratosphere, Science, 328, 611–613, https://doi.org/10.1126/science.1182274, 2010.
Rao, D. N., Ratnam, M. V., Mehta, S., Nath, D., Ghouse Basha, S., Jagannadha Rao, V. V. M., Krishna Murthy, B. V., Tsuda, T., and Nakamura, K.: Validation of the COSMIC radio occultation data over gadanki (13. 48∘ N, 79.2∘ E): A tropical region, Terr. J. Atmos. Ocean. Sci., 20, 59–70, https://doi.org/10.3319/TAO.2008.01.23.01(F3C), 2009.
Ravindra Babu, S. and Liou, Y. A.: Tropical tropopause layer evolution during 2015–16 El Niño event inferred from COSMIC RO measurements, J. Atmos. Sol.-Terr. Phy., 212, 105507, https://doi.org/10.1016/j.jastp.2020.105507, 2021.
Ravindra Babu, S., Venkat Ratnam, M., Basha, G., Krishnamurthy, B. V., and Venkateswararao, B.: Effect of tropical cyclones on the tropical tropopause parameters observed using COSMIC GPS RO data, Atmos. Chem. Phys., 15, 10239–10249, https://doi.org/10.5194/acp-15-10239-2015, 2015.
Ravindra Babu, S., VenkataRatnam, M., Basha, G., Liou, Y.-A., and Narendra Reddy, N.: Large Anomalies in the Tropical Upper Troposphere Lower Stratosphere (UTLS) Trace Gases Observed during the Extreme 2015–16 El Niño Event by Using Satellite Measurements, Remote Sensing, 11, 687, https://doi.org/10.3390/rs11060687, 2019a.
Ravindra Babu, S., Venkat Ratnam, M., Basha, G., and Krishnamurthy, B. V.: Indian summer monsoon onset signatures on the tropical tropopause layer, Atmos. Sci. Lett., 20, e884, https://doi.org/10.1002/asl.884, 2019b.
Samanta, D., Dash, M. K., Goswami, B. N., and Pandey, P. C.: Extratropical anticyclonic Rossby wave breaking and Indian summer monsoon failure, Climate Dyn., 46, 1547–1562, https://doi.org/10.1007/s00382-015-2661-7, 2016.
Santee, M. L., Manney, G. L., Livesey, N. J., Schwartz, M. J., Neu, J. L., and Read, W. G.: A comprehensive overview of the climatological composition of the Asian summer monsoon anticyclone based on 10 years of Aura Microwave Limb Sounder measurements, J. Geophys. Res.-Atmos., 122, 5491–5514, https://doi.org/10.1002/2016jd026408, 2017.
Scherllin-Pirscher, B., Kirchengast, G., Steiner, A. K., Kuo, Y.-H., and Foelsche, U.: Quantifying uncertainty in climatological fields from GPS radio occultation: an empirical-analytical error model, Atmos. Meas. Tech., 4, 2019–2034, https://doi.org/10.5194/amt-4-2019-2011, 2011a.
Scherllin-Pirscher, B., Steiner, A. K., Kirchengast, G., Kuo, Y.-H., and Foelsche, U.: Empirical analysis and modeling of errors of atmospheric profiles from GPS radio occultation, Atmos. Meas. Tech., 4, 1875–1890, https://doi.org/10.5194/amt-4-1875-2011, 2011b.
Sprenger, M., Maspoli, M. C., and Wernli, H.: Tropopause folds and cross-tropopause exchange: A global investigation based upon ECMWF analyses for the time period March 2000 to February 2001, J. Geophys. Res., 108, 8518, https://doi.org/10.1029/2002JD002587, 2003.
Škerlak, B., Sprenger, M., and Wernli, H.: A global climatology of stratosphere–troposphere exchange using the ERA-Interim data set from 1979 to 2011, Atmos. Chem. Phys., 14, 913–937, https://doi.org/10.5194/acp-14-913-2014, 2014.
Tweedy, O. V., Waugh, D. W., Randel, W. J., Abalos, M., Oman, L. D., and Kinnison, D. E.: The Impact of Boreal Summer ENSO Events on Tropical Lower Stratospheric Ozone, J. Geophys. Res.-Atmos., 123, 9843–9857, https://doi.org/10.1029/2018JD029020, 2018.
Uppala, S. M., Kållberg, P. W., Simmons, A. J., Andrae, U., Da Costa Bechtold, V., Fiorino, M., Gibson, J.K., Haseler, J., Her- nandez, A., Kelly, G. A., Li, X., Onogi, K., Saarinen, S., Sokka, N., Allan, R. P., Anderson, E., Arpe, K., Balmaseda, M. A., Beljaars, A. C. M., Van De Berg, L., Bidlot, J., Bormann, N., Caires, S., Chevallier, F., Dethof, A., Dragosavac, M., Fisher, M., Fuentes, M., Hagemann, S., Hólm, E., Hoskins, B. J., Isaksen, L., Janssen, P. A. E. M., Jenne, R., Mcnally, A. P., Mahfouf, J.-F., Morcrette, J.-J., Rayner, N. A., Saunders, R. W., Simon, P., Sterl, A., Trenbreth, K. E., Untch, A., Vasiljevic, D., Viterbo, P., and Woollen, J.: The ERA-40 re-analysis, Q. J. Roy. Meteor. Soc., 131, 2961–3012, https://doi.org/10.1256/qj.04.176, 2005.
Vellore, R. K., Kaplan, M. L., John, R. K., Sabade, S., Deshpande, N., and Singh, B. B.: Monsoon-extratropical circulation interactions in Himalayan extreme rainfall, Clim. Dyn., 46, 3517, https://doi.org/10.1007/s00382-015-2784-x, 2016.
Venkat Ratnam, M., Ravindra Babu, S., Das, S. S., Basha, G., Krishnamurthy, B. V., and Venkateswararao, B.: Effect of tropical cyclones on the stratosphere–troposphere exchange observed using satellite observations over the north Indian Ocean, Atmos. Chem. Phys., 16, 8581–8591, https://doi.org/10.5194/acp-16-8581-2016, 2016.
Vernier, J.-P., Thomason, L. W., and Kar, J.: CALIPSO detection of an Asian tropopause aerosol layer, Geophys. Res. Lett., 38, L07804, https://doi.org/10.1029/2010GL046614, 2011.
Vernier, J. P., Fairlie, T. D., Natarajan, M., Wienhold, F. G., Bian, J., Martinsson, B. G., Crumeyrolle, S., Thomason, L. W., and Bedka, K. M.: Increase in upper tropospheric and lower stratospheric aerosol levels and its potential connection with Asian pollution, J. Geophys. Res., 120, 1608–1619, https://doi.org/10.1002/2014JD022372, 2015.
Vernier, J.-P., Fairlie, T. D., Deshler, T., Ratnam, M. V., Gadhavi, H., Kumar, B. S., Natarajan, M., Pandit, A. K., Raj, S. T. A., Kumar, A. H., Jayaraman, A., Singh, A. K., Rastogi, N., Sinha, P. R., Kumar, S., Tiwari, S., Wegner, T., Baker, N., Vignelles, D., Stenchikov, G., Shevchenko, I., Smith, J., Bedka, K., Kesarkar, A., Singh, V., Bhate, J., Ravikiran, V., Rao, M. D., Ravindrababu, S., Patel, A., Vernier, H., Wienhold, F. G., Liu, H., Knepp, T. N., Thomason, L., Crawford, J., Ziemba, L., Moore, J., Crumeyrolle, S., Williamson, M., Berthet, G., Jégou, F., and Renard, J.-B.: BATAL: The balloon measurement campaigns of the Asian tropopause aerosol layer, B. Am. Meteorol. Soc., 99, 955–973, https://doi.org/10.1175/BAMS-D-17-0014.1, 2018.
Vogel, B., Günther, G., Müller, R., Grooß, J.-U., Afchine, A., Bozem, H., Hoor, P., Krämer, M., Müller, S., Riese, M., Rolf, C., Spelten, N., Stiller, G. P., Ungermann, J., and Zahn, A.: Long-range transport pathways of tropospheric source gases originating in Asia into the northern lower stratosphere during the Asian monsoon season 2012, Atmos. Chem. Phys., 16, 15301–15325, https://doi.org/10.5194/acp-16-15301-2016, 2016.
Wang, B., Xiang, B., Li, J., Webster, P. J., Rajeevan, M. N., Liu, J., and Ha, K.-J.: Rethinking Indian monsoon rainfall prediction in the context of recent global warming, Nat. Commun., 6, 7154, https://doi.org/10.1038/ncomms8154, 2015.
Xu, X., Zhao, T., Lu, C., Guo, Y., Chen, B., Liu, R., Li, Y., and Shi, X.: An important mechanism sustaining the atmospheric “water tower” over the Tibetan Plateau, Atmos. Chem. Phys., 14, 11287–11295, https://doi.org/10.5194/acp-14-11287-2014, 2014.
Yan, R.-C., Bian, J.-C., and Fan, Q.-J.: The Impact of the South Asia High Bimodality on the Chemical Composition of the Upper Troposphere and Lower Stratosphere, Atmos. Ocean. Sc. Lett., 4, 229–234, 2011.
Yan, R. C. and Bian, J. C.: Tracing the boundary layer sources of carbon monoxide in the Asian summer monsoon anticyclone using WRF–Chem, Adv. Atmos. Sci., 32, 943–951, https://doi.org/10.1007/s00376-014-4130-3, 2015.
Yan, X., Konopka, P., Ploeger, F., Tao, M., Müller, R., Santee, M. L., Bian, J., and Riese, M.: El Niño Southern Oscillation influence on the Asian summer monsoon anticyclone, Atmos. Chem. Phys., 18, 8079–8096, https://doi.org/10.5194/acp-18-8079-2018, 2018.
Yu, P., Rosenlof, K. H., Liu, S., Telg, H., Thornberry, T. D., Rollins, A. W., Portmann, R. W., Bai, Z., Ray, E. A., Duan, Y., Pan, L. L., Toon, O. B., Bian, J., and Gao, R.-S.: Efficient transport of tropospheric aerosol into the stratosphere via the Asian summer monsoon anticyclone, P. Natl. Acad. Sci. USA, 114, 6972–6977, https://doi.org/10.1073/pnas.1701170114, 2017.
Yuan, C., Lau, W. K. M., Li, Z., and Cribb, M.: Relationship between Asian monsoon strength and transport of surface aerosols to the Asian Tropopause Aerosol Layer (ATAL): interannual variability and decadal changes, Atmos. Chem. Phys., 19, 1901–1913, https://doi.org/10.5194/acp-19-1901-2019, 2019.