the Creative Commons Attribution 4.0 License.
the Creative Commons Attribution 4.0 License.
 | 08 Apr 2021
Lagrangian matches between observations from aircraft, lidar and radar in a warm conveyor belt crossing orography
Maxi Boettcher
Andreas Schäfler
Michael Sprenger
Harald Sodemann
Stefan Kaufmann
Christiane Voigt
Hans Schlager
Donato Summa
Paolo Di Girolamo
Daniele Nerini
Urs Germann
Heini Wernli
Warm conveyor belts (WCBs) are important airstreams in extratropical cyclones, often leading to the formation of intense precipitation and the amplification of upper-level ridges. This study presents a case study that involves aircraft, lidar and radar observations in a WCB ascending from western Europe towards the Baltic Sea during the Hydrological Cycle in the Mediterranean Experiment (HyMeX) and T-NAWDEX-Falcon in October 2012, a preparatory campaign for the THORPEX North Atlantic Waveguide and Downstream Impact Experiment (T-NAWDEX).
Trajectories were used to link different observations along the WCB, that is, to establish so-called Lagrangian matches between observations. To this aim, an ensemble of wind fields from the global analyses produced by the European Centre for Medium-Range Weather Forecasts (ECMWF) Ensemble of Data Assimilations (EDA) system were used, which allowed for a probabilistic quantification of the WCB occurrence and the Lagrangian matches. Despite severe air traffic limitations for performing research flights over Europe, the German Aerospace Center (DLR) Falcon successfully sampled WCB air masses during different phases of the WCB ascent. The WCB trajectories revealed measurements in two distinct WCB branches: one branch ascended from the eastern North Atlantic over southwestern France, while the other had its inflow in the western Mediterranean. Both branches passed across the Alps, and for both branches Lagrangian matches coincidentally occurred between lidar water vapour measurements in the inflow of the WCB south of the Alps, radar measurements during the ascent at the Alps and in situ aircraft measurements by Falcon in the WCB outflow north of the Alps. An airborne release experiment with an inert tracer could confirm the long pathway of the WCB from the inflow in the Mediterranean boundary layer to the outflow in the upper troposphere near the Baltic Sea several hours later.
The comparison of observations and ensemble analyses reveals a moist bias in the analyses in parts of the WCB inflow but a good agreement of cloud water species in the WCB during ascent. In between these two observations, a precipitation radar measured strongly precipitating WCB air located directly above the melting layer while ascending at the southern slopes of the Alps. The trajectories illustrate the complexity of a continental and orographically influenced WCB, which leads to (i) WCB moisture sources from both the Atlantic and Mediterranean, (ii) different pathways of WCB ascent affected by orography, and (iii) locally steep WCB ascent with high radar reflectivity values that might result in enhanced precipitation where the WCB flows over the Alps. The linkage of observational data by ensemble-based WCB trajectory calculations, the confirmation of the WCB transport by an inert tracer and the model evaluation using the multi-platform observations are the central elements of this study and reveal important aspects of orographically modified WCBs.
- Article
(8202 KB) - Full-text XML
- BibTeX
- EndNote


The warm conveyor belt (WCB) is one of the three coherent airstreams described by, e.g., Carlson (1980) and Browning (1990) in the so-called conveyor belt model of extratropical cyclones. The WCB is the airstream that ascends the most, rising from the boundary layer in the cyclone's warm sector to the upper troposphere downstream of the cyclone within about 1 d (e.g. Browning, 1986; Wernli, 1997). Climatologically, WCBs are most frequent in the winter season and they preferentially occur in the main oceanic storm track regions in both hemispheres (Madonna et al., 2014b). WCBs transport heat, moisture and atmospheric pollutants typically poleward (e.g. Methven et al., 2006; Sinclair et al., 2008). They are, due to the intense formation of clouds in the ascending airstream, among the strongest precipitating weather systems at the mid-latitudes (Eckhardt et al., 2004; Pfahl et al., 2014; Catto et al., 2015). Early studies about WCBs focused on clouds and precipitation structure (Browning, 1971; Harrold, 1973). They mainly relied on cyclone-relative isentropic flow analysis, satellite images and radar observations to identify the WCB, which appear as hammer-shaped cloud bands that are characteristic for extratropical cyclones (e.g. Carlson, 1980; Browning, 1986; Young et al., 1987). The recent study by Joos (2019) investigated the substantial radiative forcing exerted by the extended cloud shields associated with WCBs. Observational studies (e.g. Muhlbauer et al., 2014; Krämer et al., 2016; Luebke et al., 2016; Voigt et al., 2017) revealed the differing microphysical properties of WCB cirrus compared to other types of cirrus and highlighted their potential importance for radiation and climate.
This brief summary of general characteristics of WCBs emphasises their importance for mid-latitude weather including heavy precipitation (e.g. Pfahl et al., 2014). For numerical weather prediction (NWP), WCBs still constitute one of the most challenging weather elements (Rodwell et al., 2018) due to their troposphere-deep motion accompanied by cloud thermodynamical processes from typically +20 to −50 ∘C. The presented study investigates a special case of an orographically influenced WCB over central Europe in autumn 2012 using a sequence of measurements taken during the Hydrological Cycle in the Mediterranean Experiment (HyMeX) and T-NAWDEX-Falcon, a preparatory field campaign for the THORPEX North Atlantic Waveguide and Downstream Impact Experiment (T-NAWDEX). This sequence of measurements that are physically related to each other by air parcel trajectories is referred to as Lagrangian matches (Methven et al., 2006). To the best of our knowledge, this is the first successful study that describes Lagrangian matches between ground-based and aircraft observations in a WCB, confirmed by a tracer release experiment with a large horizontal and vertical separation between release and intercept. The unique airborne tracer release experiment was performed as part of T-NAWDEX-Falcon to provide direct experimental evidence for the long-range transport by the WCB. The measurements mainly portray the evolution of moisture along the WCB ascent, which is, on the one hand, one of the most important characteristics of the WCB and, on the other hand, still seen as an obstacle for accurate weather forecasts (e.g. Joos and Forbes, 2016; Rodwell et al., 2018). The following paragraphs will further discuss (i) why moisture in the WCB inflow is critical for the WCB ascent, (ii) why the evolution of moisture and related diabatic processes along the WCB ascent is important, and (iii) why observations of moisture in WCBs are a valuable supplement to model studies.
Moisture and moist processes, which we address by our measurements, are essential characteristics of the WCB. The cloud formation in the WCB can modify the dynamics of the governing weather system, and the associated latent heat release is essential to achieve the troposphere-deep moist isentropic ascent of WCBs (Wernli, 1997; Schemm et al., 2013). In addition, latent heat release feeds back on the flow dynamics by modifying potential vorticity (PV) (e.g. Hoskins et al., 1985; Wernli and Davies, 1997). To first order, latent heat release due to condensation of water vapour in the ascending WCB leads to positive and negative PV changes below and above the level of maximum condensation, respectively (Wernli and Davies, 1997). For instance, the diabatically produced low-level positive PV anomaly during WCB ascent can have an impact on the intensity of the surface cyclone (Binder et al., 2016; Attinger et al., 2019), while the negative PV anomaly in the WCB outflow can interact with the upper-tropospheric waveguide, leading to wave amplification, Rossby wave breaking and the formation of PV streamers (e.g. Stoelinga, 1996; Massacand et al., 2001; Grams et al., 2011; Davies and Didone, 2013; Madonna et al., 2014a).
The simple concept of a diabatically produced PV dipole during the WCB ascent introduced by Wernli and Davies (1997) has been refined in the last decade in at least two important ways. First, it became clear that the microphysical processes within WCBs are more complex, and, second, convection was found to potentially occur embedded within the large-scale cloud band of the WCB. Considering microphysics, Joos and Wernli (2012) were the first to study the detailed cloud structure of a WCB in a regional NWP model. The water species in a WCB evolve along the ascent from low-level water vapour via condensation to liquid clouds and via freezing to mixed-phase clouds and then cirrus near the tropopause. Phase transitions also occur beneath the strongly ascending WCB air parcels due to sedimenting and potentially sublimating or melting hydrometeors (e.g. Crezee et al., 2017). Governed by such a variety of microphysical processes, this leads to a complex pattern of latent heating in the WCB and regions with latent cooling beneath. The modelling study by Joos and Forbes (2016) showed that the vertical cloud structure of a WCB is affected by seemingly small changes in the implementation of the microphysics, with direct implications for the detailed shape and amplitude of the upper-tropospheric ridge influenced by the WCB outflow. More recently, Binder et al. (2020) systematically compared the vertical structure of WCB-related clouds in the latest European Centre for Medium-Range Weather Forecasts (ECMWF) reanalysis dataset, ERA5 (Hersbach et al., 2020), with profiles derived from satellite-based lidar and radar observations and concluded that the model reproduces the overall cloud structure quite well but underestimates ice and snow water content in the mixed-phase layer in WCBs above the melting layer. Such weaknesses in models might arise from various assumptions made in microphysical parameterisations that account for the subgrid-scale nature of the cloud processes and often lead to uncertainties in NWP (Illingworth et al., 2007; Rodwell et al., 2018). The phenomenon of WCB-embedded convection was already pointed out in very early observational WCB studies (e.g. Browning, 1971) and then brought up again by Neiman et al. (1993). Recently, Flaounas et al. (2016) and Oertel et al. (2019) confirmed the presence of convection embedded in WCBs with radar observations. Oertel et al. (2020) and Oertel et al. (2021) showed that WCB-embedded convection can result in locally enhanced precipitation and that diabatic heating by convection can influence the upper-level jet by the formation of PV dipole bands.
This brief summary reveals the importance of WCBs for understanding precipitation in and the dynamics of extratropical cyclones, but it also indicates the complexity of their ascent behaviour and the involved microphysical processes. It is conceivable that the detailed properties of a WCB strongly depend on the humidity in its inflow. For numerical weather prediction, the correct representation of humidity, particularly in strongly cloudy situations as in WCBs, is still one of the main challenges (Rodwell et al., 2018). However, most of the climatological investigations (e.g. Eckhardt et al., 2004; Madonna et al., 2014b) and case studies of WCBs (e.g. Joos and Wernli, 2012; Martínez-Alvarado et al., 2016) have been based on reanalyses or model simulations only. Comparatively few studies used observations to evaluate the humidity in WCBs. Schäfler et al. (2011) investigated airborne lidar measurements of humidity in the low-level inflow of a WCB over Spain and found an overestimation of humidity in ECMWF analyses. A similar result was found by Schäfler and Harnisch (2015) for the inflow of a marine WCB over the eastern North Pacific. Their sensitivity experiments with the ECMWF forecast model revealed that with the corrected low-level moisture in the initial conditions the WCB outflow would have occurred at a lower potential temperature level and produced a less developed upper-level ridge. The humidity in the WCB inflow, however, is not only determined by boundary layer ventilation (Boutle et al., 2011; Pfahl et al., 2014). It can also be affected by a recycling of moisture within the WCB, which occurs, e.g., when raindrops from an elevated layer of the WCB fall into a sub-saturated lower layer of the WCB inflow where they evaporate (Crezee et al., 2017; Attinger et al., 2019; Spreitzer, 2020).
Most observational studies of WCBs so far, e.g. based on surface radar measurements (Browning, 1971) or more recently on aircraft and satellite data (Oertel et al., 2019; Binder et al., 2020), provide limited information about the variability of the WCB characteristics along the ascent, which typically covers spatial and temporal dimensions of >1000 km and 1 d, respectively. To better address the Lagrangian nature of these airstreams, a few pioneering field campaign studies attempted to follow the pathway of a WCB with an aircraft and to measure the same WCB air parcels multiple times (e.g. Stohl et al., 2003; Methven et al., 2006). In principle, such Lagrangian matches enable investigating the material evolution of thermodynamic variables along a WCB. A major challenge of such experiments is the planning of the Lagrangian matches realised by aircraft. In contrast to the boundary layer experiment ASTEX in 1992, where additional balloons were used to follow the mainly two-dimensional movement of trade wind clouds (e.g. Bretherton and Pincus, 1995; Sigg and Svensson, 2004), the prediction of the ascending WCB relies on air parcel trajectories using three-dimensional wind fields from forecasts, which are inherently uncertain. To cope with this uncertainty, the planning of Lagrangian matches is best done with data from ensemble forecasts (Schäfler et al., 2014, 2018). An interesting observational approach to identifying Lagrangian matches is the use of a physical tracer that is measured at consecutive times to experimentally corroborate the pathway of air parcels. Former experiments have proven that naturally occurring boundary layer trace gases and pollutants can effectively be transported by the WCB to upper levels of the free troposphere (Bethan et al., 1998; Purvis et al., 2003). Using this property, an experiment in 2004 described in Methven et al. (2006) aimed at realising Lagrangian matches between airborne measurements in the free troposphere to study intercontinental transport of pollutants. One case of the campaign involved a WCB, for which the natural occurrence of a physical tracer was used to mark air parcels. Another extensive experiment over Europe in 1994 simulated an emergency situation by the release of perfluorocarbon (PFC) tracers in the planetary boundary layer (Van Dop et al., 1998). Their second tracer release, lasting 12 h, involved a WCB-like situation of a cold front passage, and it was reported that an aircraft sampled the tracer 700–800 km away from the source (Nodop et al., 1998). The results of these upper air samples, however, do not appear in the literature and most likely failed. The approach in our study is, for the first time, to specifically focus on studying the transport along a WCB by the release and re-sampling of a synthetic inert tracer (Ren et al., 2015). For completeness, we briefly note that Lagrangian matches have also been applied in research on stratospheric chemistry, for instance, by Rex et al. (1998) to infer ozone loss rates in the Arctic stratosphere from ozonesonde measurements and by Fueglistaler et al. (2002) to study the Lagrangian evolution of polar stratospheric clouds from consecutive airborne lidar observations.
Since the majority of the WCBs occur over ocean (e.g. Madonna et al., 2014b), not many studies exist about continental WCBs and the potential effects when they rise over mountains. In their climatological study, Pfahl et al. (2014) found precipitation maxima in regions with orographically enhanced WCB ascent. For the European area, a hotspot for WCB ascent and increased precipitation is found along the Mediterranean side of the Alps. There, over 10 % of total precipitation is related to WCBs, and they contribute up to 60 % of extreme precipitation events (Pfahl et al., 2014). In a case study, Buzzi et al. (1998) investigated the flood in the Piedmont region south of the Alps in November 1994, which was associated with a WCB. Using numerical experiments with flattened orography, they could show that the WCB-related precipitation was distinctly enhanced by orography. But so far, no study has investigated how the pathway of WCB trajectories is affected by the interaction with orography.
In October 2012, a team from the German Aerospace Center (DLR) in Oberpfaffenhofen and ETH Zurich organised a small aircraft research campaign, devoted to obtaining in situ measurements of moisture and thermodynamic parameters in different phases of WCBs over Europe (Schäfler et al., 2014). This campaign was termed T-NAWDEX-Falcon and occurred in parallel to the comprehensive HyMeX Special Observation Period 1 (SOP1) (Ducrocq et al., 2014). The WCB presented in this study occurred during T-NAWDEX-Falcon's Intensive Observation Period 2 (IOP2), and it ascended from the western Mediterranean across the Alps towards the Baltic Sea. The WCB was successfully sampled by two Falcon flights. The analysis of the airborne observations benefits from additional surface lidar observations made in the framework of HyMeX and from operational radar observations by MeteoSwiss.
In addition, a tracer experiment with the physical release of a passive tracer by a small aircraft in the inflow of the WCB was conducted as part of the T-NAWDEX-Falcon IOP2. The main objective was to “label” WCB air in the inflow and then later “catch” the same air during its ascent by the Falcon aircraft. However, such an experiment can only be successful (i) if a tracer gas is released that otherwise does not exist in the atmosphere or has a very low atmospheric background concentration like PFCs, such that any observation of the tracer can be uniquely associated with the release experiment; (ii) if a suitable and highly sensitive airborne sampling and analysis technique is available, which allows measuring potentially low concentrations after long-range transport and dilution; (iii) if the forecast is exact enough to reproduce a fairly realistic picture of the actual flow situation that serves as the basis for the flight planning; and (iv) if the flight planning method is appropriate such that the tracer is indeed released in the WCB inflow and that the subsequent Falcon flights targeting the ascending WCB air have a chance of sampling the tracer. In this study we report to what degree we were successful with this challenging experiment.
As shown in detail below, the campaign successfully collected valuable observations in the WCB and benefited from overall good ECMWF forecasts and from the sophisticated multi-stage flight planning procedure (Schäfler et al., 2014). This set of observations will enable us to address the following specific questions related to this orographic WCB case study:
-
How can ensemble analyses be used to provide probabilistic information about the location of WCBs and about Lagrangian matches between observations?
-
How well do the humidity and cloud structure of the WCB in the ECMWF analyses agree with observations from aircraft, lidar and radar?
-
How closely does the transport in WCBs as given by trajectory calculations with ECMWF analyses correspond to the dispersion of an actually emitted passive tracer?
-
How does the orography of the Alps modify the characteristics of the investigated central European WCB?
-
What is the overall novel insight about WCBs that can be obtained from such a multi-faceted and observation-based case study?
The paper will continue by introducing the measurements and the analysis products, as well as the procedure to identify Lagrangian matches in Sect. 2. The synoptic situation is described in Sect. 3 before the results from airborne observations are first discussed in Sect. 4.1. Lagrangian matches with further observations are described in Sect. 4.2, and the tracer experiment in Sect. 4.3. Conclusions, including (partial) answers to the questions posed above, are given in Sect. 5.
This study uses observations from in situ aircraft measurements, from ground-based lidar and radar, and from a tracer release experiment. The observational datasets are briefly introduced in the following subsections. Then a special diagnostic method, based on ECMWF ensemble analysis data, is introduced that serves to identify WCBs and Lagrangian matches between measurements.
2.1 T-NAWDEX-Falcon humidity measurements
For the T-NAWDEX-Falcon campaign in October 2012 the German DLR Falcon aircraft was operated from the base at DLR in Oberpfaffenhofen, near Munich (Schäfler et al., 2014). The Falcon flights on 15 October 2012 were conducted from 07:34 to 10:52 UTC for flight IOP2b and from 13:04 to 16:03 UTC for flight IOP2c. In this study in situ measurements of specific humidity are used that were taken from the basic instrumentation of the aircraft and from the tuneable diode laser system WARAN (WAter vapoR ANalyzer; Kaufmann et al., 2014, 2018). The Falcon basic measurements for water vapour result from a composite of three instruments, where emphasis is placed on the Lyman-alpha absorption instrument1. For flight IOP2b, WARAN was installed with a forward-facing inlet so that it collected water of all phases and hence resulted in observations of total water. For flight IOP2c, the inlet was reversed such that no total water measurements were possible during this flight (Voigt et al., 2014; Kaufmann et al., 2016). For IOP2b, the cloud water content was calculated assuming saturation with respect to liquid water for ∘C and ice for ∘C. Particle enhancement at the inlet is corrected assuming a mean particle radius of 20 µm (Krämer and Afchine, 2004). The sampling efficiency of much larger particles like raindrops or snow cannot be quantified directly and thus imposes an additional uncertainty on the measured cloud water content. The 2 s in situ measurements of WARAN are smoothed with a 5 min running mean, which corresponds to about the time the aircraft needs to intersect a horizontal grid box of 0.5∘ (about 50 km) in the model. The same is applied to the 1 s water vapour observations. Since the measurements are taken as water vapour mixing ratio and total water mixing ratio per volume, they are converted to specific humidity Qv and cloud water content Qc, respectively, for comparison with model data.
2.2 HyMeX Raman lidar
Data collected during HyMeX SOP1 (Ducrocq et al., 2014) by the Raman lidar system BASIL (University of BASILicata Raman lidar system; Di Girolamo et al., 2009) are used. The instrument was positioned at the HyMeX “supersite” in Candillargues, near Montpellier (43.61∘ N, 4.07∘ E) on the French Mediterranean coast. BASIL provides profiles of water vapour starting from 60 m above the ground up to the lower stratosphere in steps of 30 m. A vertical 300 m running average is applied to each profile as well as a 1-hourly time running mean to account for comparison with the coarser resolved model data. Considering an integration time of 1 h and a vertical resolution of 300 m, the statistical uncertainty affecting daytime water vapour mixing ratio measurements is found to be smaller than 0.5 g kg−1 (or 10 %) up to 2.5 km and smaller than 3 g kg−1 (or 40 %) up to 4 km. Night-time performance is characterised by much smaller uncertainties, with a random error affecting vapour mixing ratio measurements not exceeding 0.01 g kg−1 (or 0.5 %) at 4 km and of 0.035 g kg−1 (or 7 %) at 10 km. The procedure applied to calibrate water vapour mixing ratio profile measurements by BASIL was described in detail by Di Girolamo et al. (2016). During HyMeX SOP1, BASIL was calibrated based on the comparison with radiosondes launched from the lidar site, with the launching facility being approximately 100–150 m away from the lidar system (Di Girolamo et al., 2016). More specifically, the mean calibration coefficients were estimated by comparing BASIL with the radiosonde data at all times when both systems were simultaneously operated (for a total of approximately 50 comparisons). The uncertainty affecting the calibration constant is estimated to be 3 %. Only data outgoing from the instrument upward until a relative error of 100 % is reached are used, that is, up to 5–6 km in daytime and up to the tropopause at night. For the purpose of this research effort, profiles up to an altitude of about 3000 m, or 700 hPa, are considered. BASIL measured continuously between 21:44 UTC on 13 October until 19:03 UTC on 14 October (Di Girolamo et al., 2016).
2.3 Monte Lema radar
The Monte Lema radar is part of the Swiss network of C-band (5.5 GHz) Doppler weather radars operated by MeteoSwiss, and it is located on the southern slopes of the Alps at 46.04∘ N, 8.83∘ E, and 1626 m altitude. Monte Lema was upgraded in 2011 to dual polarisation, which, together with other technical enhancements, provided increased data quality (Germann et al., 2015; Gabella et al., 2017). The volume scan geometry comprises 20 elevations from −0.2 to 40∘ with a maximum range of about 18 km vertically and 246 km horizontally, while the interleaved scan strategy provides a new full volume scan every 5 min. The methods for reading and processing of the raw polar data from Monte Lema radar can be read in Figueras i Ventura et al. (2020).
2.4 Tracer experiment
A tracer experiment was performed using the perfluorocarbon tracer system PERTRAS. This instrument was newly designed for studying Lagrangian long-range transport and related dispersion of chemical species, e.g. in the Asian monsoon system (Ren et al., 2015). Perfluoromethylcyclopentane (PMCP C6F12) has very low background concentrations in the atmosphere of 6–7 ppqv in Europe (Watson et al., 2007) and is thus very well suited for a tracer experiment. For the T-NAWDEX-Falcon campaign, the release unit of PERTRAS for the inert tracer gas was installed on board the light aircraft Partenavia P68 operated by enviscope (http://www.enviscope.de/enviscope_new/operation/airborne-platforms/partenavia-p68, last access: 30 March 2021). The sampling unit of PERTRAS, on the other hand, was installed on board the Falcon. The intention to separate the release unit from the sampling unit was to exclude possible contamination throughout the re-sampling of the tracer and to meet the logistic demands given by the relatively fast transport of air masses between the WCB inflow and outflow stage. The Falcon installation allowed probes of air to be collected at an interval of about 5 min, yielding a spatial resolution of 50 km. Such an experiment could be conducted only once during the T-NAWDEX-Falcon campaign and had to be carefully planned based on the operational ECMWF forecasts (Schäfler et al., 2014). During IOP2 on 14 October 2012 suitable conditions were given; the Partenavia was therefore transferred to southern France and released in the morning hours between 09:09 and 09:39 UTC 9.2 L of the tracer in the target region. The liquid PMCP tracer was dispersed using a spray nozzle connected to the tracer reservoir and mounted outside the window of the Partenavia. PMCP droplets with diameters less than 20 mm were released, which evaporated readily. A day later, on 15 October, two Falcon flights (24 and 30 h after the release) above Germany were devoted to re-sampling the tracer in the ascending air masses. For the tracer sampling, 64 adsorption tubes were used where the PMCP molecules were trapped and concentrated. The samples were analysed after the flights in the laboratory using a gas-chromatic method described in Ren et al. (2014). Unfortunately, a technical issue concerning the manual time adjustment of the device may have occurred during the first sampling flight, IOP2b.
2.5 Model data
For the calculation of WCB trajectories, we use the Ensemble of Data Assimilations (EDA) dataset from the European Centre for Medium-Range Weather Forecasts. The EDA represents the best possible estimate of the state of the atmosphere considering uncertainties associated with observations and the ECMWF data assimilation system. It became operational in 2010, and in 2012 it became available as a set of 11 analyses that primarily serves to improve the initial conditions of the ensemble prediction system (Isaksen et al., 2010), with 1 control analysis (CTL) and 10 perturbed members. The slightly differing analyses are obtained by perturbing atmospheric observations, sea surface temperature fields and model physics in the 4D-Var data assimilation cycle. The original resolution of the EDA of T399L91 in 2012 is interpolated to a 0.5∘ horizontal grid on the original 91 model levels. In addition to the 6-hourly standard EDA times, the intermediate products at 03:00, 09:00, 15:00 and 21:00 UTC are also used to increase the time resolution.
2.6 Trajectories and WCB probabilities
Kinematic offline trajectories are calculated using the Lagrangian analysis tool LAGRANTO (Wernli and Davies, 1997; Sprenger and Wernli, 2015). Here, we use trajectories to detect WCBs as well as matches between measurements in each member of the EDA, and they are therefore a central part of this study.
To know where WCB air masses ascend during the IOP, trajectories are started from the grid points between 1025 and 700 hPa with vertical steps of 25 hPa between 1000 and 100 hPa. They are initialised every 3 h over several days and calculated 48 h forward in time with trajectory positions saved every 1 h. To identify WCB trajectories, only the ones are selected that ascend at least 600 hPa in 48 h (Madonna et al., 2014b). WCB probabilities are calculated using the WCB trajectories calculated for all 11 EDA members based on the method that has been adopted from Schäfler et al. (2014) and Rautenhaus et al. (2015). More specifically, the trajectories are disassembled into individual air parcel positions and then, for a given time, sorted into grid boxes with a horizontal dimension of 0.5∘ in the horizontal and 50 hPa in the vertical. For each grid box, the WCB probability (in per cent) then corresponds to the relative number of EDA members that have at least one WCB trajectory in the box. The method results in a time sequence of Eulerian three-dimensional fields of WCB probabilities.
EDA-based trajectories are also used to identify Lagrangian matches between aircraft measurements at one time and any type of measurements at an earlier or later time. To this end, forward and backward trajectories are calculated in each member of the EDA, starting every minute from the respective flight route (coloured example trajectories in Fig. 1). The time range of the trajectories is backward to 12:00 UTC on 13 October and forward to 12:00 UTC on 16 October to cover all measurements and the entire WCB ascent. In this set of trajectories, those that fulfil the ascent criterion described above are labelled as WCB trajectories. Similar to the method to obtain WCB probabilities, the positions of the EDA trajectories at a time of interest are assigned to grid boxes (grey boxes in Fig. 1). Trajectory positions are hence available as a time sequence of Eulerian three-dimensional probability fields (number of contributing EDA members; boxes with different grey shadings in Fig. 1). Matches between measurements along the aircraft track from which the trajectories were started and any other measurements occur when the trajectory probability (calculated with trajectories that started from the flight track) in the grid box that corresponds to the time and location of the other measurement is larger than zero (the observing instrument in Fig. 1 which, in the example shown, diagnoses differing matching probabilities with altitude). Hence, this procedure to identify matches accounts for the exact time (of the measurement) but with a tolerance in space, represented by the 0.5∘ grid box around the exact trajectory position. If the trajectory probability is high, then the Lagrangian match between the measurements can be regarded as more “certain”. If a matching trajectory also fulfils the WCB criterion, then we refer to this as a WCB match, i.e. then we know that two measurements at different times and locations were sampling the same air parcel and that this air parcel was actually part of a WCB. These WCB matches are of particular interest for our study.

Figure 1Schematic of the matching method: backward trajectories from the aircraft calculated in different EDA members (coloured trajectories), grid boxes with contributions from different numbers of EDA members (grey boxes; corresponding to match probabilities of 0–18 % in this example, 18 % because 2 out of 11 ensemble members indicate a match) and a remote sensing instrument observing the match probability at that certain time step (black icon at the bottom).
The 2 d IOP2 of the T-NAWDEX-Falcon campaign was planned to take measurements along a WCB ascending from the western Mediterranean over the Alps towards the Baltic Sea. The WCB was induced by a low-pressure system that originated in the central North Atlantic before 13 October 2012. WCB air masses start from the warm sector already during this earlier phase of the cyclone while it moves eastward, steered at the southern flank of a complex upper-level PV cutoff (Fig. 2a, b; the cyclone is marked by a red “L” in a). Downstream of the cyclone a zonal wind direction prevails at low levels over France at 18:00 UTC on 13 October (Fig. 2a). North of the Pyrenees and further east over the Mediterranean, the low-level flow is orographically influenced and arrives with increased wind speed and reduced humidity at the northwestern Mediterranean, as reflected by low equivalent potential temperature values. This local wind, called “Tramontane”, is the subject of a case study by Di Girolamo et al. (2016) as part of the HyMeX campaign. They use observations of the HyMeX lidar that started operating at 21:44 UTC on 13 October (see westernmost red marker for the lidar in Fig. 2). Within the westerly flow, WCB trajectories originating over the Atlantic are embedded and start to ascend prior to passing the lidar (Fig. 2b). At the same time, another WCB branch north of the one from the Atlantic starts to rise over France. These two northern WCB branches with inflow from the Atlantic are directly steered by the surface cyclone that enters France from the Bay of Biscay at 06:00 UTC on 14 October (not shown). The cloud band related to this ascending part of the WCB is visible east and north of the cyclone centre a few hours later in the satellite image (Fig. 2d and black dots at 12:00 UTC on 14 October in Fig. 2b).
The cold front of the cyclone is located over the northwestern part of the Iberian Peninsula and western France at 12:00 UTC on 14 October, when the wind direction over the northwestern Mediterranean turned to a moist southwesterly flow onshore (Fig. 2c). In this flow, ahead of the surface cold front, another WCB branch is discernible at low levels (Fig. 2b) while this region is covered by heavy convective clouds in the satellite image (Fig. 2b, d; see also Duffourg et al., 2018, about the associated heavy convective precipitation event). The inflow of this Mediterranean WCB branch passes the HyMeX lidar just southeast (Fig. 2b). On a smaller scale, after 15:00 UTC on 14 October a secondary lee cyclone occurs east of the Maritime Alps in the Italian Piedmont region (red “L2” for the mature lee cyclone in Fig. 3b).

Figure 2Synoptic development during the T-NAWDEX-Falcon IOP2: (a) EDA mean equivalent potential temperature at 850 hPa (colours, K), sea level pressure (SLP, black contours every 1 hPa), wind arrows at 850 hPa (black) and PV at 315 K (white line of 1.5 and 2 PVU) at 18:00 UTC on 13 October 2012. Red asterisks mark the measurement stations of the HyMeX lidar, the Monte Lema radar and the airbase of Falcon. (b) WCB trajectories of the EDA's CTL starting at 00:00 UTC on 14 October 2012 (coloured by pressure, hPa) and SLP (black lines every 2 hPa valid at 12:00 UTC on 14 October), with trajectory markers (black dots) for 12:00 UTC on 14 October. Panel (c) shows the same as panel (a) but for 12:00 UTC on 14 October. (d) Meteosat infrared image at 12:00 UTC on 14 October. The red “L” in panels (a), (c) and (d) marks the location of the surface cyclone.
The preceding upper-level PV cutoff forms a streamer-like structure during the development of the main cyclone L and subsequently extends southward over the western Mediterranean (Fig. 3b). The low-level lee cyclone L2 intensifies due to the interaction with the upper-level PV streamer. The Mediterranean WCB branch shown in Fig. 2b moves northeastward ahead of the PV streamer. Between 00:00 and 06:00 UTC on 15 October, the WCB branch passes cyclone L2 (Fig. 3b) and impinges upon the Alps, where it is forced to ascend. There the WCB air stream crosses the Monte Lema radar in the early phase of the ascent (red marker in Fig. 3b). Within the next 6 h, the Mediterranean WCB air parcels reach the middle troposphere and proceed with a moderate ascent rate over Germany towards the Baltic Sea, where it approaches the Atlantic WCB branch. Along with the WCB, the cold front of the main cyclone L proceeds into central Europe. Together they form the stratiform and scattered cloud band that is visible in the satellite image at 06:00 UTC on 15 October (Fig. 3a). The research flight IOP2b was designed to climb stepwise along the WCB ascent towards northeast Germany and then to cross the outflow in the area of northern Germany, Poland and the Baltic Sea approximately in an east–west direction (red/violet flight route in Fig. 3b). In the northernmost part, the flight route traverses the centre of the surface cyclone. As with flight IOP2b, flight IOP2c (blue flight route in Fig. 3b) also occurs in the region of the WCB and the cold front, which is crossed several times.
South of the Alps the upper-level PV streamer cuts off, and the former lee cyclone L2 evolves into a wide cyclone below the PV cutoff (not shown). The initial cyclone L, however, weakens over the Baltic Sea and re-intensifies later below a newly formed short-wave trough in the hours after the research flights. In the upper levels, the WCB outflow is directed northeastward by the short-wave trough (not shown).
4.1 Aircraft measurements
The two Falcon flights of the T-NAWDEX-Falcon IOP2 north of the Alps on 15 October 2012 are presented in the following two subsections. They form the starting points for investigating Lagrangian matches with further observations of this WCB in a later section. Here we elaborate where WCB air was transected by the flights, and we compare the airborne in situ observations of water vapour and cloud condensate with the EDA.
4.1.1 Flight IOP2b
The morning flight IOP2b on 15 October was intended to follow the gradual mid-level to upper-level ascent of the WCB from southern Germany towards the Baltic Sea as indicated by the WCB’s cloud band in Fig. 3a. The aircraft took off in overcast conditions and ascended immediately towards mid-level WCB air between 700 and 500 hPa. Before entering this layer, where WCB probabilities reaches values up to 100 % (Fig. 4a), snow water content (SWC) peaks with negligible liquid water content (LWC) and cloud cover in the EDA at 07:36 UTC (Fig. 4b, red curve in e), which indicates snow falling from the WCB into a subsaturated region (not shown), where it likely sublimates. Exactly there, water vapour in the EDA is distinctly lower than the measured value, as shown by a downward deflection of the relative error of the EDA's moisture with respect to the measured values (Fig. 4d, red curve).
Subsequently, where the aircraft intersected the WCB with the maximum probability at 07:42 UTC at an altitude of 560 hPa, the EDA consistently shows a peak of 100 % cloud cover (Fig. 4a, c, red line in e). The EDA cloud condensate along the WCB consists of high values of SWC, LWC and also ice water content (IWC, Fig. 4b). LWC and IWC peak at the time of 100 % cloud cover. The in situ measurements of water vapour and cloud condensate Qc confirm the moist and cloudy conditions in this early flight period, with mean observations in the range of the interpolated values from the EDA (compare black and grey lines in Fig. 4d, e). A distinctly greater peak of Qc is visible at the native resolution of measured Qc that coincided with the highest WCB probability and the peak in cloud cover. Note that, for fair comparison, cloud condensate Qc in the EDA is here calculated from the non-sedimenting cloud species LWC and IWC alone (i.e. without SWC) since the Waran instrument most likely did not efficiently collect sedimenting snow particles. According to the slope of the 0 ∘C isotherm (black line in Fig. 4a), the aircraft ascends from behind the surface cold front into the warm sector of the cyclone in the mid-troposphere, which is a typical region for WCB ascent.
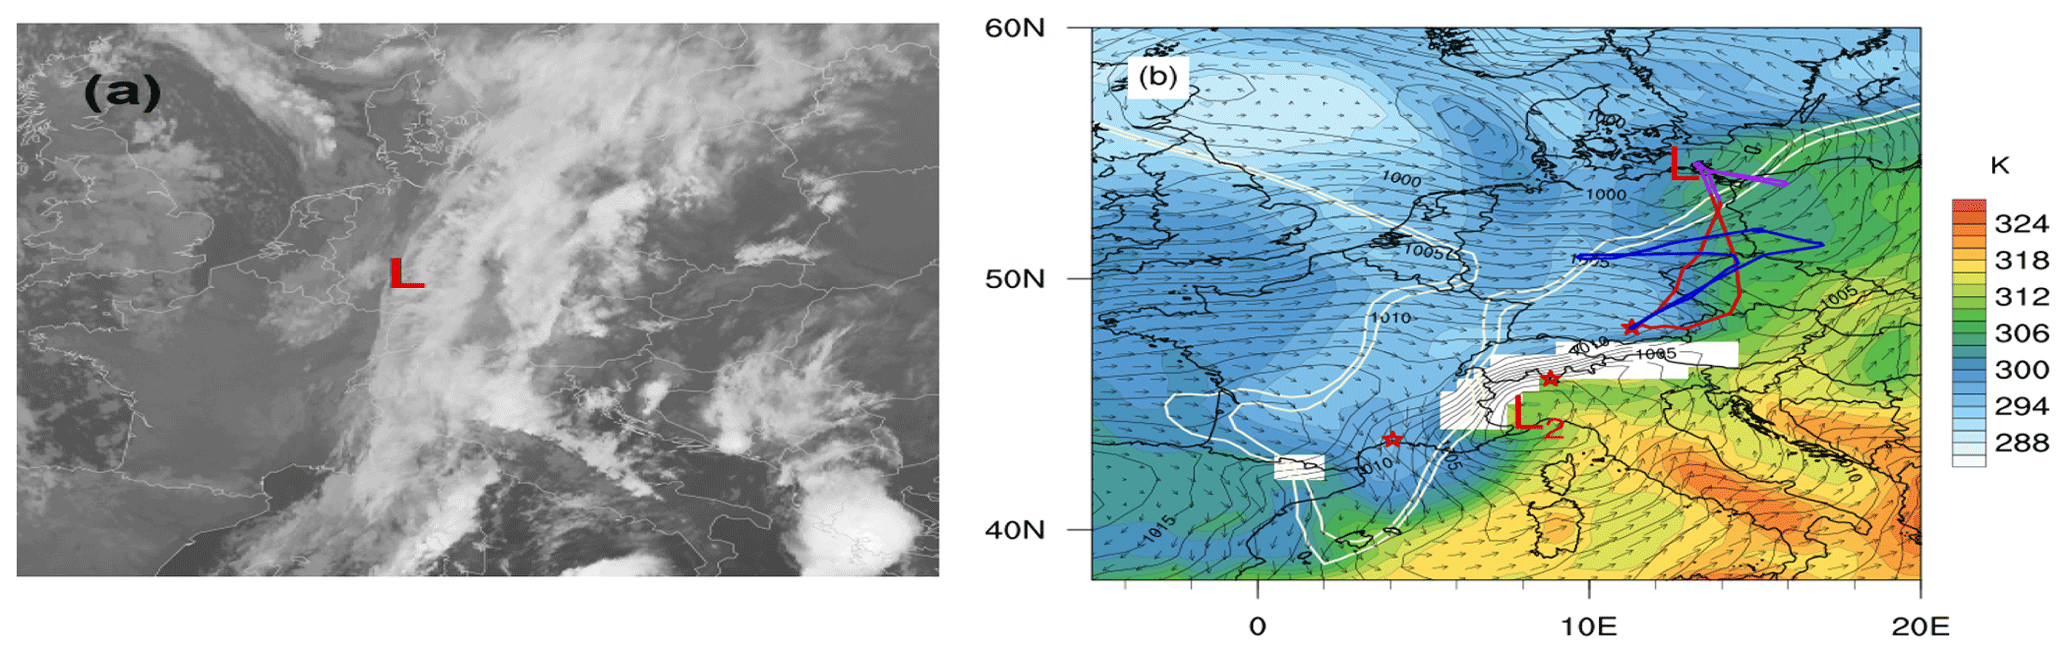
Figure 3Continuation of the synoptic situation: (a) Meteosat IR image at 06:00 UTC on 15 October 2012, (b) same as in Fig. 2a but for 09:00 UTC on 15 October. In panel (b) flight IOP2b is shown in red with the violet part from 08:30 to 09:30 UTC, flight IOP2c is shown in blue and the red “L2” marks the position of the secondary cyclone.
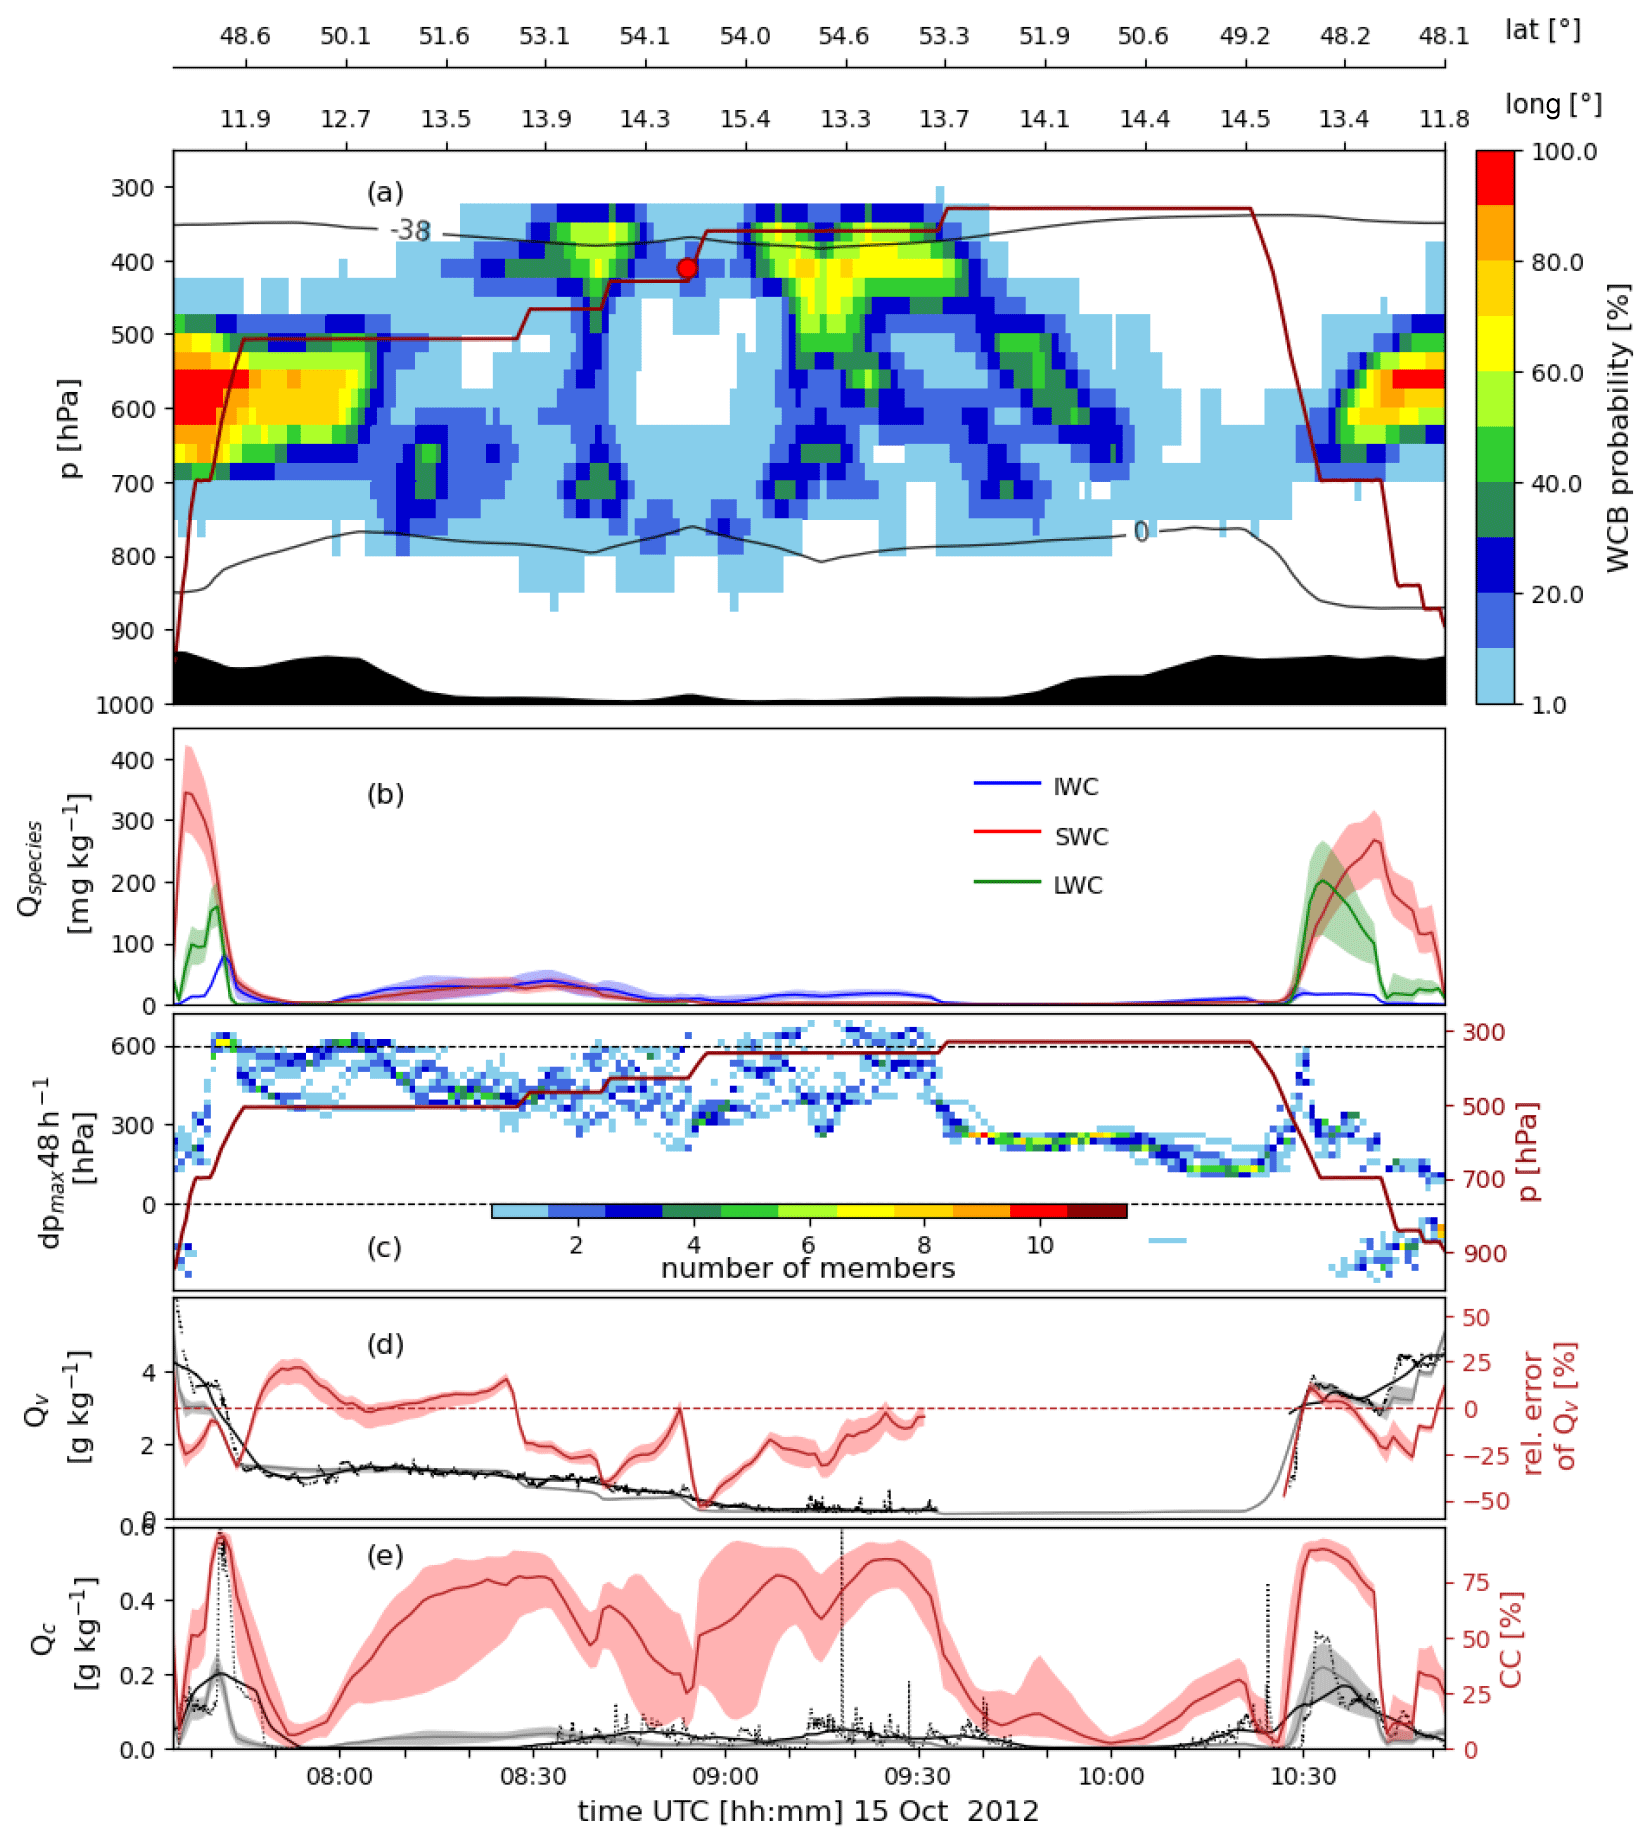
Figure 4Time series of measurements and interpolated EDA fields along the Falcon flight IOP2b from 07:34 to 10:52 UTC on 15 October 2012. (a) WCB probabilities (colours, in %) in the vertical column along the flight track, pressure of the aircraft altitude (dark red line, in hPa) and EDA mean temperature (0 and −38 ∘C, black lines); (b) EDA cloud species (see legend, in mg kg−1); (c) maximum pressure decrease (ascent) within 48 h of the air parcels that were measured during the flight, calculated for each EDA member (left y axis) and, as in panel (a), flight altitude (in hPa, right y axis); (d) specific humidity Qv (in g kg−1) from in situ measurements (black line for 5 min running mean and native resolution as dots) and from EDA (grey line for mean and shading between minimum and maximum EDA values), with relative error of the EDA members compared to the measurements (red line and shading, right y axis); and (e) cloud condensate Qc (in g kg−1) from in situ measurements (black line and dots as in panel d) and EDA consisting of liquid and ice water content (grey), and EDA cloud cover (red, right y axis).
After the initial climb, the aircraft continued with a 35 min quasi-horizontal leg at 500 hPa (from about 07:45 to 08:30 UTC). According to most of the EDA members, the flight is first located along the upper edge of the WCB and then outside (Fig. 4a). For these air masses, the maximum 48 h ascent varies between more than 600 and 300 hPa (Fig. 4c). Specific humidity agrees fairly well between EDA and observations in this period (Fig. 4d). The concentration of the cloud species in the EDA are much lower than before when crossing the WCB (Fig. 4b). The measurements reveal that Qc goes down to (near) zero during this period, while the EDA values show small but elevated condensate of IWC and some SWC (Fig. 4b, e).
The subsequent stepwise ascent of the aircraft leads to intersections with the WCB outflow between 450 and 350 hPa, where WCB probabilities reach up to 70 % at 08:40 UTC and from 09:00 to 09:45 UTC (Fig. 4a). There, the aircraft is on its northernmost leg and crosses the WCB first eastward and later westward (Fig. 3b) with the turning point at 09:15 UTC. Near that time, increased WCB probabilities extend vertically from 850 to 350 hPa. At the level of the aircraft the maximum ascent of the observed air mass is highly uncertain and varies between 300 and 700 hPa in 48 h (Fig. 4c). There, the flight crosses the cold front once again, and deep convection just ahead of the cold frontal cloud band near the Baltic Sea coast is visible in the satellite image (Fig. 3a). Cloud condensate values in EDA are rather low (Fig. 4b) and smaller than those measured. This is similar for water vapour, where EDA values are also lower than the ones observed (Fig. 4d, e).
After a high-altitude southward transfer, the aircraft started to descend at about 10:25 UTC to 700 hPa while crossing again to the cold side of the surface front at 10:30 UTC. Thereafter, WCB probabilities reach up to 30 % and EDA show high values of LWC and SWC, indicating supercooled liquid water in the mixed-phase cloud at the lower edge of the WCB (Fig. 4a, b). This is very similar to the intersection of the lower edge of the WCB in the beginning of the flight at around the same pressure level. Again, the EDA values of cloud condensate are larger than in any other flight period, but here they are slightly higher than the observations (Fig. 4e). For water vapour the agreement is better (Fig. 4d) but again shows reduced values in the EDA, where high SWC coincides with low LWC and cloud cover below the WCB between 10:43 and 10:47 UTC.
In summary, Falcon flight IOP2b intersected the WCB with a high probability in the mid-troposphere during the ascent and at its outflow level. However, two horizontal legs (before 08:00 and after 10:30 UTC) just missed the centre of the WCB as they were slightly too high and too low, respectively. In all clouds within or near the WCB the observed cloud condensate agrees well with the EDA values. According to the EDA, the lower part of the WCB contains supercooled liquid water at temperatures between −5 and −10 ∘C. As found by radar observations in Gehring et al. (2020), the formation of supercooled liquid water in the phase of strongest WCB ascent facilitates riming, which, together with aggregation due to strong wind shear and turbulence below the WCB, would provide ideal conditions for rapid precipitation growth.
4.1.2 Flight IOP2c
The flight in the afternoon of 15 October again went towards the Baltic Sea (see blue line in Fig. 3b) and crossed the cold front with WCB probabilities up to 40 % at around 550 hPa (Fig. 5a). As for the previous flight, the ascent across the WCB leads to peaks of first SWC (at the lower edge of the WCB) and then LWC and IWC (within the WCB) according to the EDA (Fig. 5b). Here, water vapour is underestimated in EDA compared with the measurements and shows a local minimum (Fig. 5d) where snow is likely to sublimate below the WCB as already seen in the flight before.
The subsequent flight leg at 350 hPa is located just above an extended region with high WCB probabilities. The observed air ascended by 300 hPa within 48 h according to Fig. 5c. The measured specific humidity in EDA is again too low (Fig. 5d). Given the moderate ascent of this air and its location just above the WCB, it is plausible that this cloud layer corresponds to a so-called in situ cirrus, which often tops the liquid-origin cirrus produced by the strongly ascending WCB (Wernli et al., 2016).
Shortly before 15:00 UTC, the aircraft descended to 500 hPa and, according to the EDA, intersected a region with WCB probabilities up to 100 % (Fig. 5a). Along this flight leg between 15:00 and 15:25 UTC, SWC and IWC are elevated in EDA (Fig. 5b). The observed water vapour is still higher than in the EDA, but with a smaller deviation than before. The bump of the 0 ∘C isotherm below the aircraft in Fig. 5a indicates that the aircraft crossed the surface cold front and entered the warm sector at 15:20 UTC before crossing the cold front again in the reverse direction at 15:35 UTC.
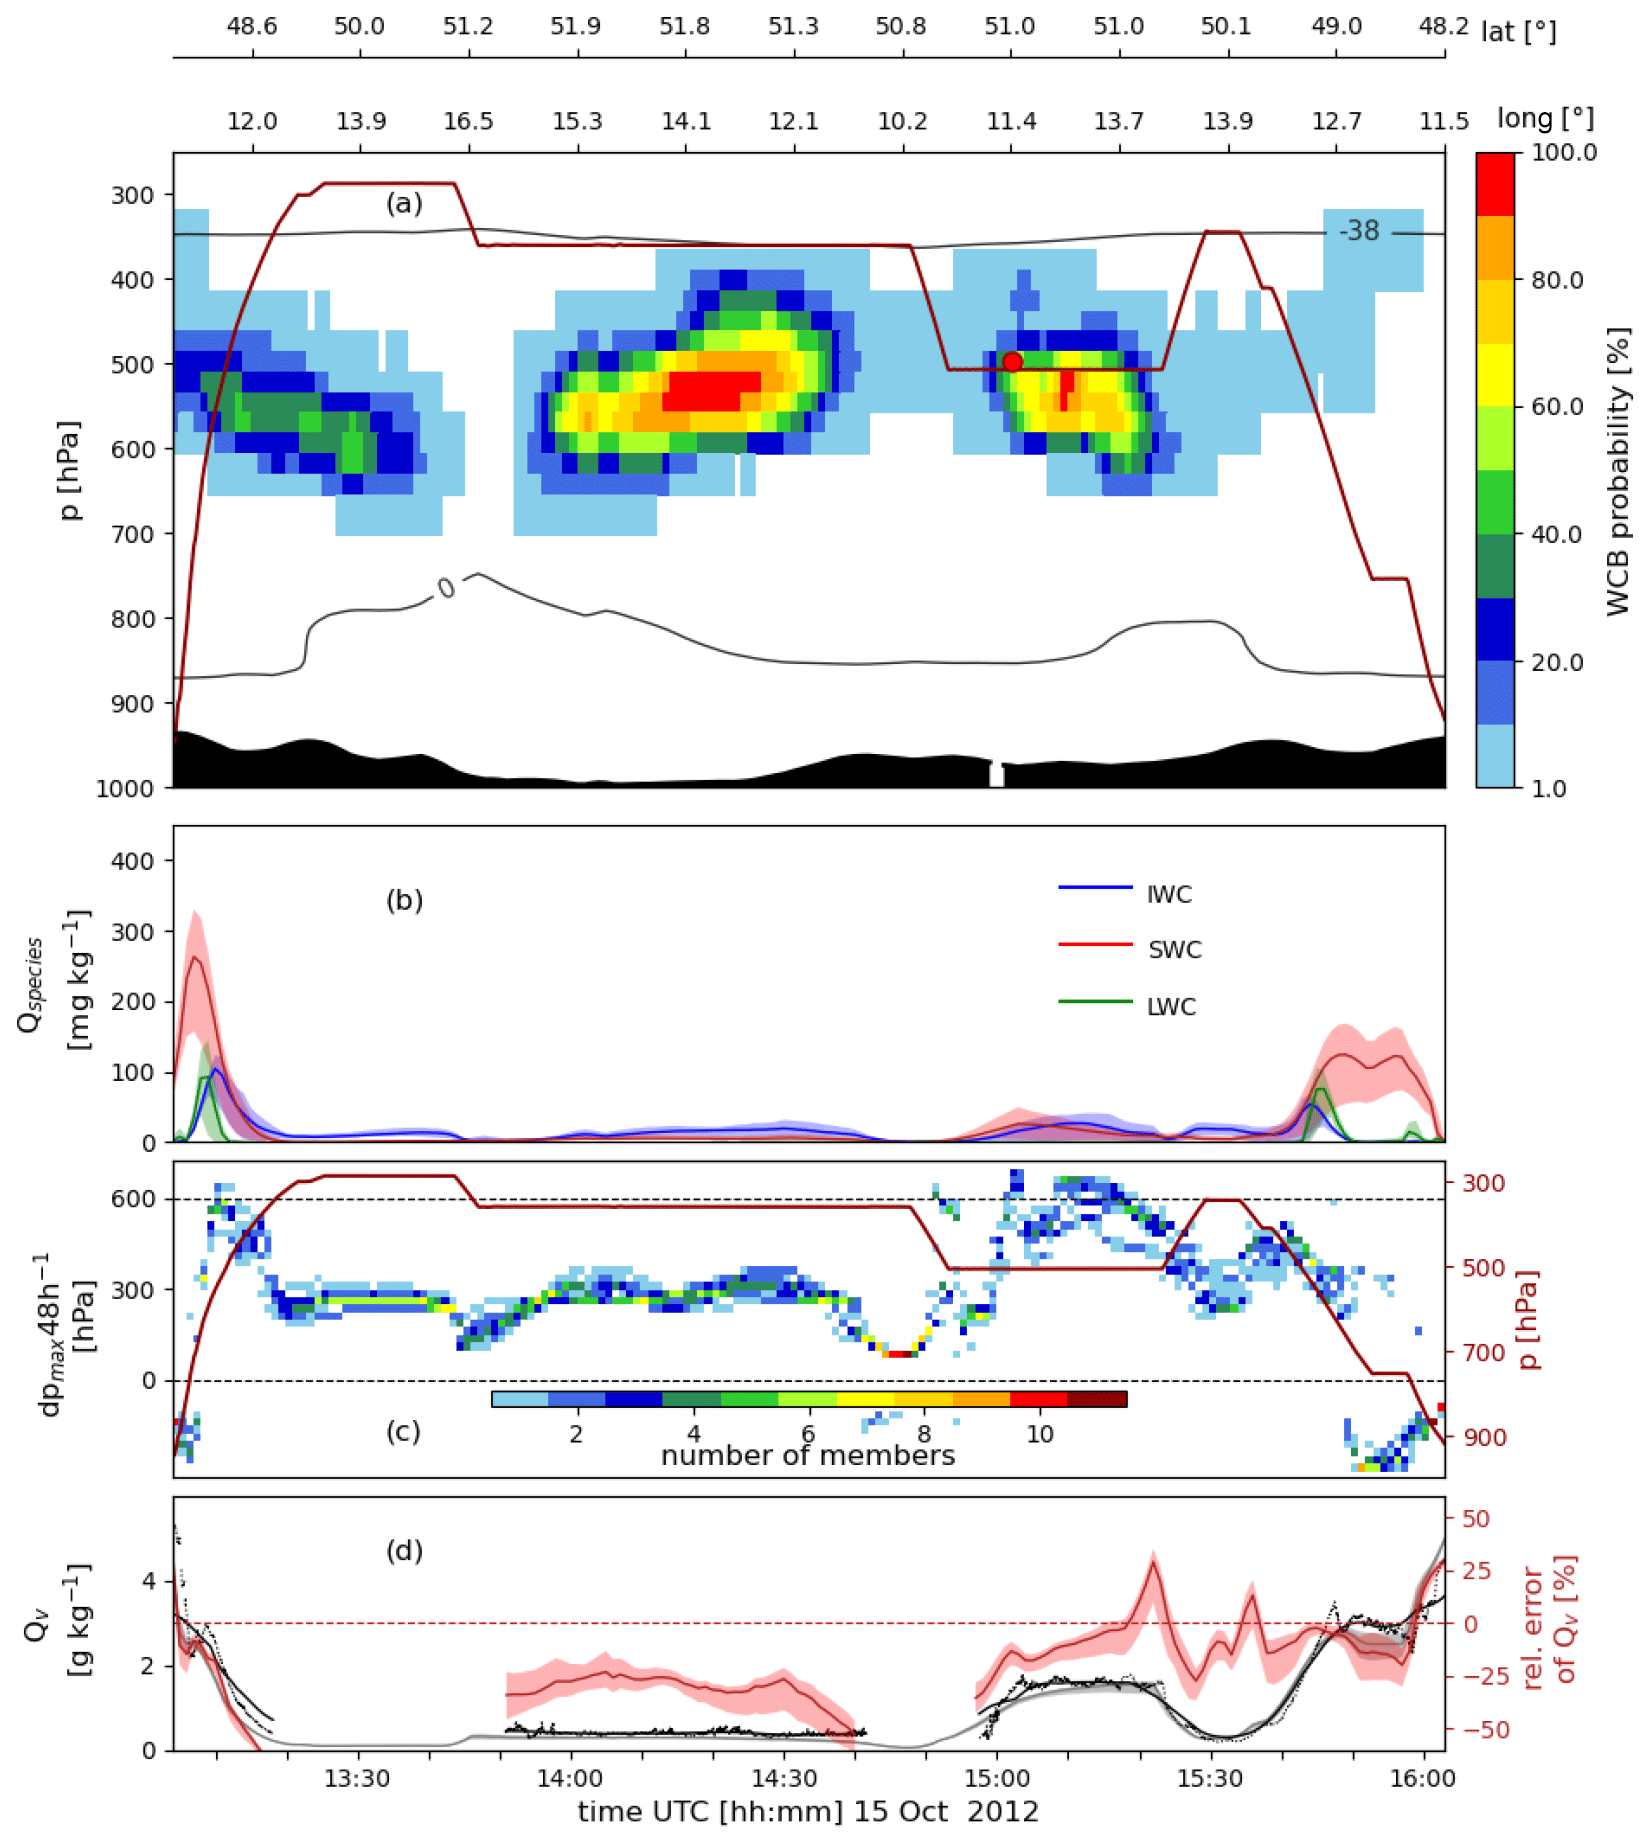
Taking both flights (IOP2b and 2c) together, the aircraft sampled WCB air with high probability during the ascent and outflow of the WCB on several legs of the flights. Whenever high WCB probability was intersected, specific humidity and cloud condensate in EDA are increased. The magnitude and structure of cloud condensate are well represented in the EDA compared with the observations. Water vapour is often underestimated, in particular below increased WCB probability, where precipitation is likely to sublimate or evaporate. Short periods with overestimated water vapour in EDA occurred near regions with large gradients of WCB probabilities, i.e. where the aircraft encountered regions with lower probability of WCB occurrence in the EDA and where, in reality, most likely large gradients in humidity occurred.
4.2 Lagrangian matches of the aircraft-probed WCB air masses with ground-based measurements
In this section, the pathway of the aircraft-observed WCB air, i.e. of WCB trajectories that intersected the flight route, is considered in more detail. In addition, where possible, ground-based water vapour lidar and precipitation radar measurements south of the Alps are considered, which, unplanned, sampled some of the WCB air masses during the inflow and ascent phase.
Both Falcon flights presented in the previous section encountered different WCB branches, which originated either from the North Atlantic or the Mediterranean (Fig. 6). The two WCB intersections during IOP2b in the mid and upper troposphere, respectively, are related to these two branches, as shown in Fig. 6a, for the WCB trajectories that were sampled by the Falcon flight. The branch with inflow from the North Atlantic starts ascending towards the east over the Pyrenees, passes the HyMeX lidar station at the Mediterranean coast (southernmost green dot in Fig. 6a), enters the domain of the Monte Lema radar at the southern slope of the Alps (green dot further northeast in Fig. 6a), and is eventually observed by the Falcon during the northernmost leg of flight IOP2b from 08:30 to 09:30 UTC at 350 hPa (northernmost green dots in Figs. 6a, 4a). The Mediterranean WCB branch, however, crosses the HyMeX lidar at very low levels during its inflow period (at least some of its trajectories) and then starts ascending south of the Alps where it is observed by the Monte Lema radar. After crossing the Alps, this WCB branch is then sampled by the Falcon in the mid-troposphere at 650–500 hPa (see green dots in Fig. 6a over southern Germany). The ascent of this branch occurred more steadily and the outflow reached further north, compared to the North Atlantic branch.
The WCB observations during IOP2c are dominated by the Mediterranean branch (Fig. 6b) with an ascent comparable to the one described before. Also this branch was (partially) observed by both ground-based instruments before being sampled by the Falcon between 600 and 500 hPa (Figs. 6b, 5a). During this flight, only few WCB trajectories with inflow from the Bay of Biscay were observed by the Falcon. However, a small bundle of WCB trajectories from this region ascended much further northwest compared to the rest of the WCB, presumably mainly lifted by the cold front and without an orographic influence. These trajectories were measured by the aircraft at the westernmost tip of the flight at 500 hPa at 14:50 UTC.
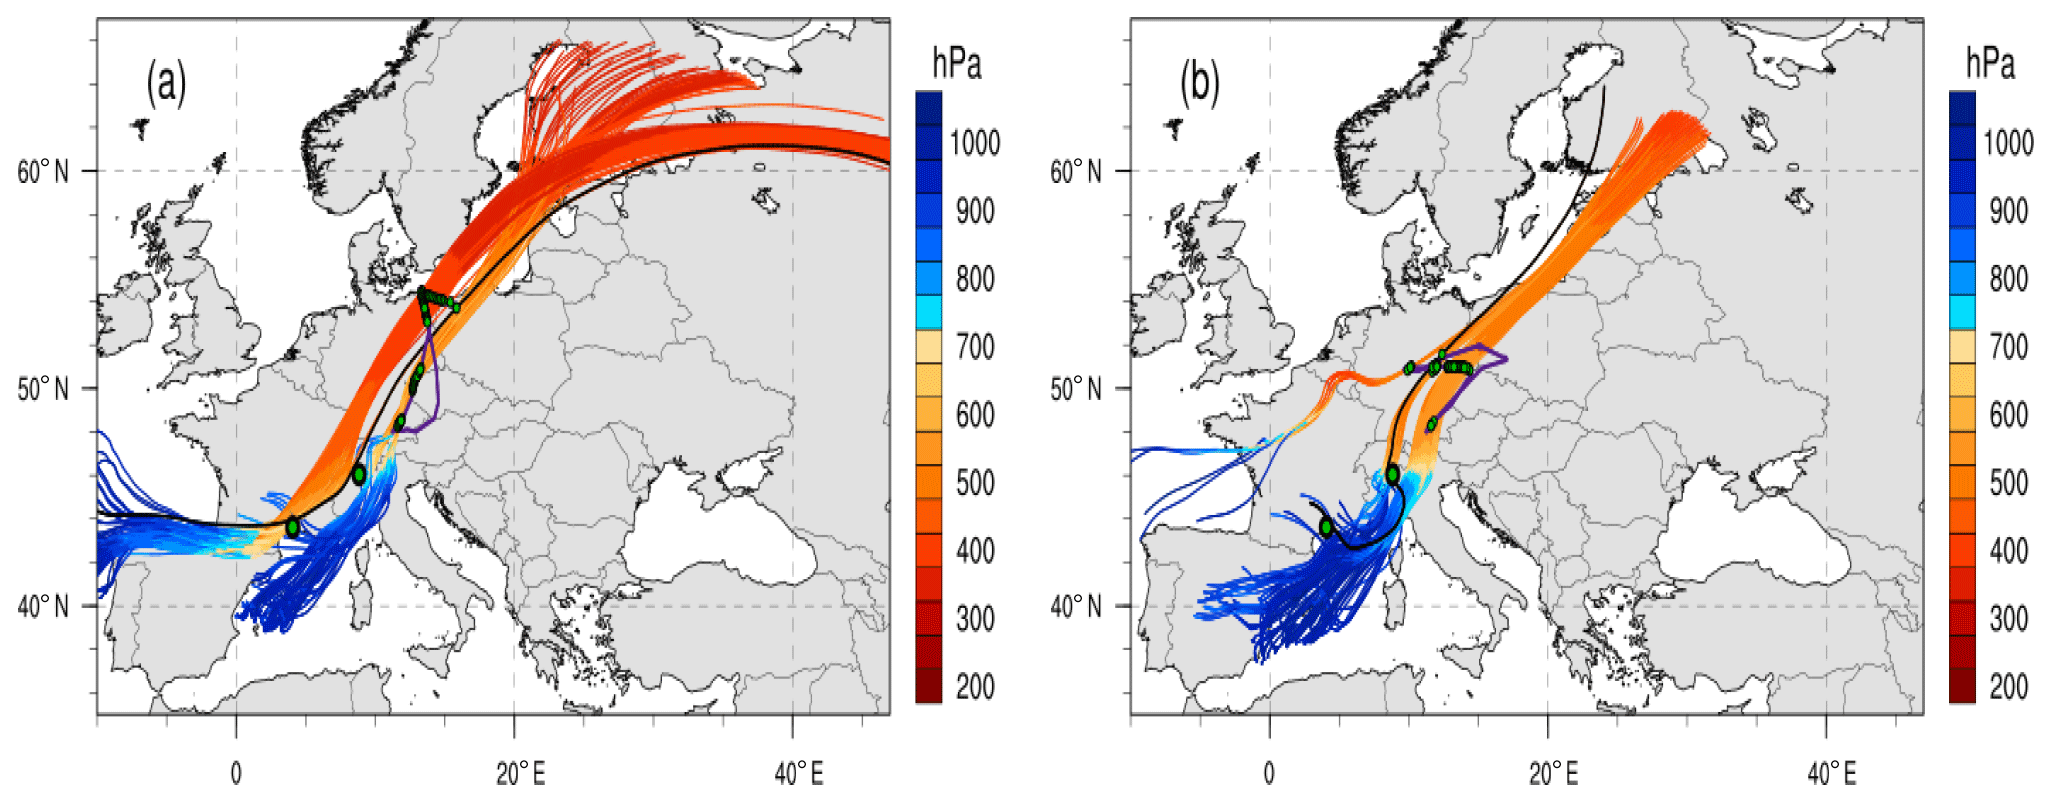
Figure 6(a) Forward and backward trajectories from all EDA members started from the IOP2b flight route (purple line) which fulfil the WCB criterion (coloured with pressure, in hPa); locations where the WCB trajectories were observed are shown by green markers (see text for details). (b) Same for IOP2c. Trajectories are shown for the time interval 12:00 UTC on 13 October to 06:00 UTC on 16 October. In each panel, the black trajectory marks the one discussed in detail in Fig. 7.
From the WCB trajectories that “matched” with the lidar and radar, i.e. intersected the vertical column above both ground-based instruments before being sampled by the aircraft, two are selected as exemplary WCB trajectories and referred to as trajectory T1 and T2. T1 represents the WCB branch with inflow from the North Atlantic that was sampled during flight IOP2b, and T2 the WCB branch with inflow from the Mediterranean sampled during flight IOP2c (black trajectories in Fig. 6a and b, respectively). We emphasise that these triple Lagrangian matches along the WCB trajectories between lidar water vapour, radar reflectivity and aircraft in situ measurements provide a rare opportunity to compare the evolution of humidity and clouds along a WCB in analysis data with independent observations. In the following two subsections, the ascent behaviour and cloud evolution along the selected North Atlantic and Mediterranean trajectories T1 and T2 are discussed.
4.2.1 WCB ascent from the North Atlantic
Trajectory T1 with inflow over the North Atlantic started to ascend gradually in the late hours of 13 October to the west of continental Europe (Fig. 7a). The initial ascent goes along with the formation of liquid cloud water and later rain as the lifting continues north of the Pyrenees at about 06:00 UTC on 14 October (Fig. 7a). After 09:00 UTC on 14 October, when the trajectory rises from 800 to 700 hPa, snow falls from the vertically deep cloud to the height of the trajectory, which still experiences temperatures above the freezing level. Just after 12:00 UTC, the trajectory crosses the 0 ∘C isotherm, and melting of snow leads to intense rain beneath the WCB, which at that time crosses the western part of the French Cévennes mountains. The trajectory T1 is at 630 hPa when it passes the location of the lidar near Montpellier in southern France at 16:00 UTC (left grey bar in the middle panel of Fig. 7a). Until that time, the trajectory has lost about 75 % of its initial water vapour of 12 g kg−1 due to cloud condensation. Because of the clouds associated with the ascending WCB trajectory, the lidar could only provide reliable water vapour profiles below the level of the WCB. In this layer from the surface to about 700 hPa, characterised by southerly flow, the lidar reveals a relatively uniform moist layer with specific humidities of 5–6 g kg−1 (Fig. 8a, between 16:00–19:00 UTC). The comparison with EDA shows that the analyses are too moist in the lower part of this layer and too dry in the upper part, each by about 1 g kg−1. In fact, during this period with the overrunning WCB (shown by black contours for WCB probability and yellow hatching for matches with IOP2b in Fig. 8a), most likely the humidity profile in this layer is strongly influenced by below-cloud evaporation of rain. Underestimation of evaporation of the precipitation in the model could explain the negative humidity bias in the 150 hPa thick layer just beneath the WCB.
In the evening of 14 October, T1 further ascends over the western Alpine range and, after a short break of the continuous ascent, rises even more steeply above southern Switzerland, where it is observed by the Mont Lema radar at about 00:00 UTC on 15 October (green dot in Fig. 6a, middle grey bar in Fig. 7a). According to the EDA, the WCB at the position of T1 at 470 hPa still contains some supercooled liquid water, ice and snow (lower panel in Fig. 7a). In the radar measurements, the intersection point of the trajectory is shown by the red dot at about 8.4∘ E in Fig. 8b at the upper edge of the layer with increased WCB probabilities (the layer above 700 hPa is mainly composed of WCB trajectories with inflow from the Atlantic; not shown). Near the location of T1, i.e. where the cloud consists mainly of snow and ice according to EDA, radar reflectivities are between 0–10 dBZ. According to the radar, the precipitating cloud extends up to about 400 hPa. This uppermost part of the precipitating cloud is likely produced by air that is lifted on top of the WCB and does not meet the WCB ascent criterion. Below the position of T1, reflectivities increase markedly in the layer with high WCB probabilities between 900–600 hPa caused by WCB with inflow over the Mediterranean. There is an indication of a bright band due to snow melting near 750 hPa with moderate-to-high reflectivity values exceeding 30 dBZ. This points to intense rainfall associated with the WCB crossing the Alps. In contrast, most of the non-WCB air that was later measured by the Falcon (blue asterisks in Fig. 8b) appears to be drier and intersects the radar scan where radar reflectivity shows a local minimum. East of the mid-level dry region in the radar scan, precipitating cloud is again measured that moves ahead of the WCB from the Atlantic and ascends less. As shown by the vertical cross section along the trajectory in Fig. 7a, the cloud in EDA is particularly deep when it passes the high mountains near the radar, extending from the surface to about 300 hPa. Thereafter, the trajectory continues to ascend gently, and comparatively thin clouds are still present when it is measured by the aircraft at 08:54 UTC on 15 October at the 400 hPa level near the northeasternmost point of the flight (Fig. 6a, right grey bar in Fig. 7a, red dot in Fig. 4a). The trajectory then slowly approaches the tropopause, about 48 h after the start of the ascent (Fig. 7a).
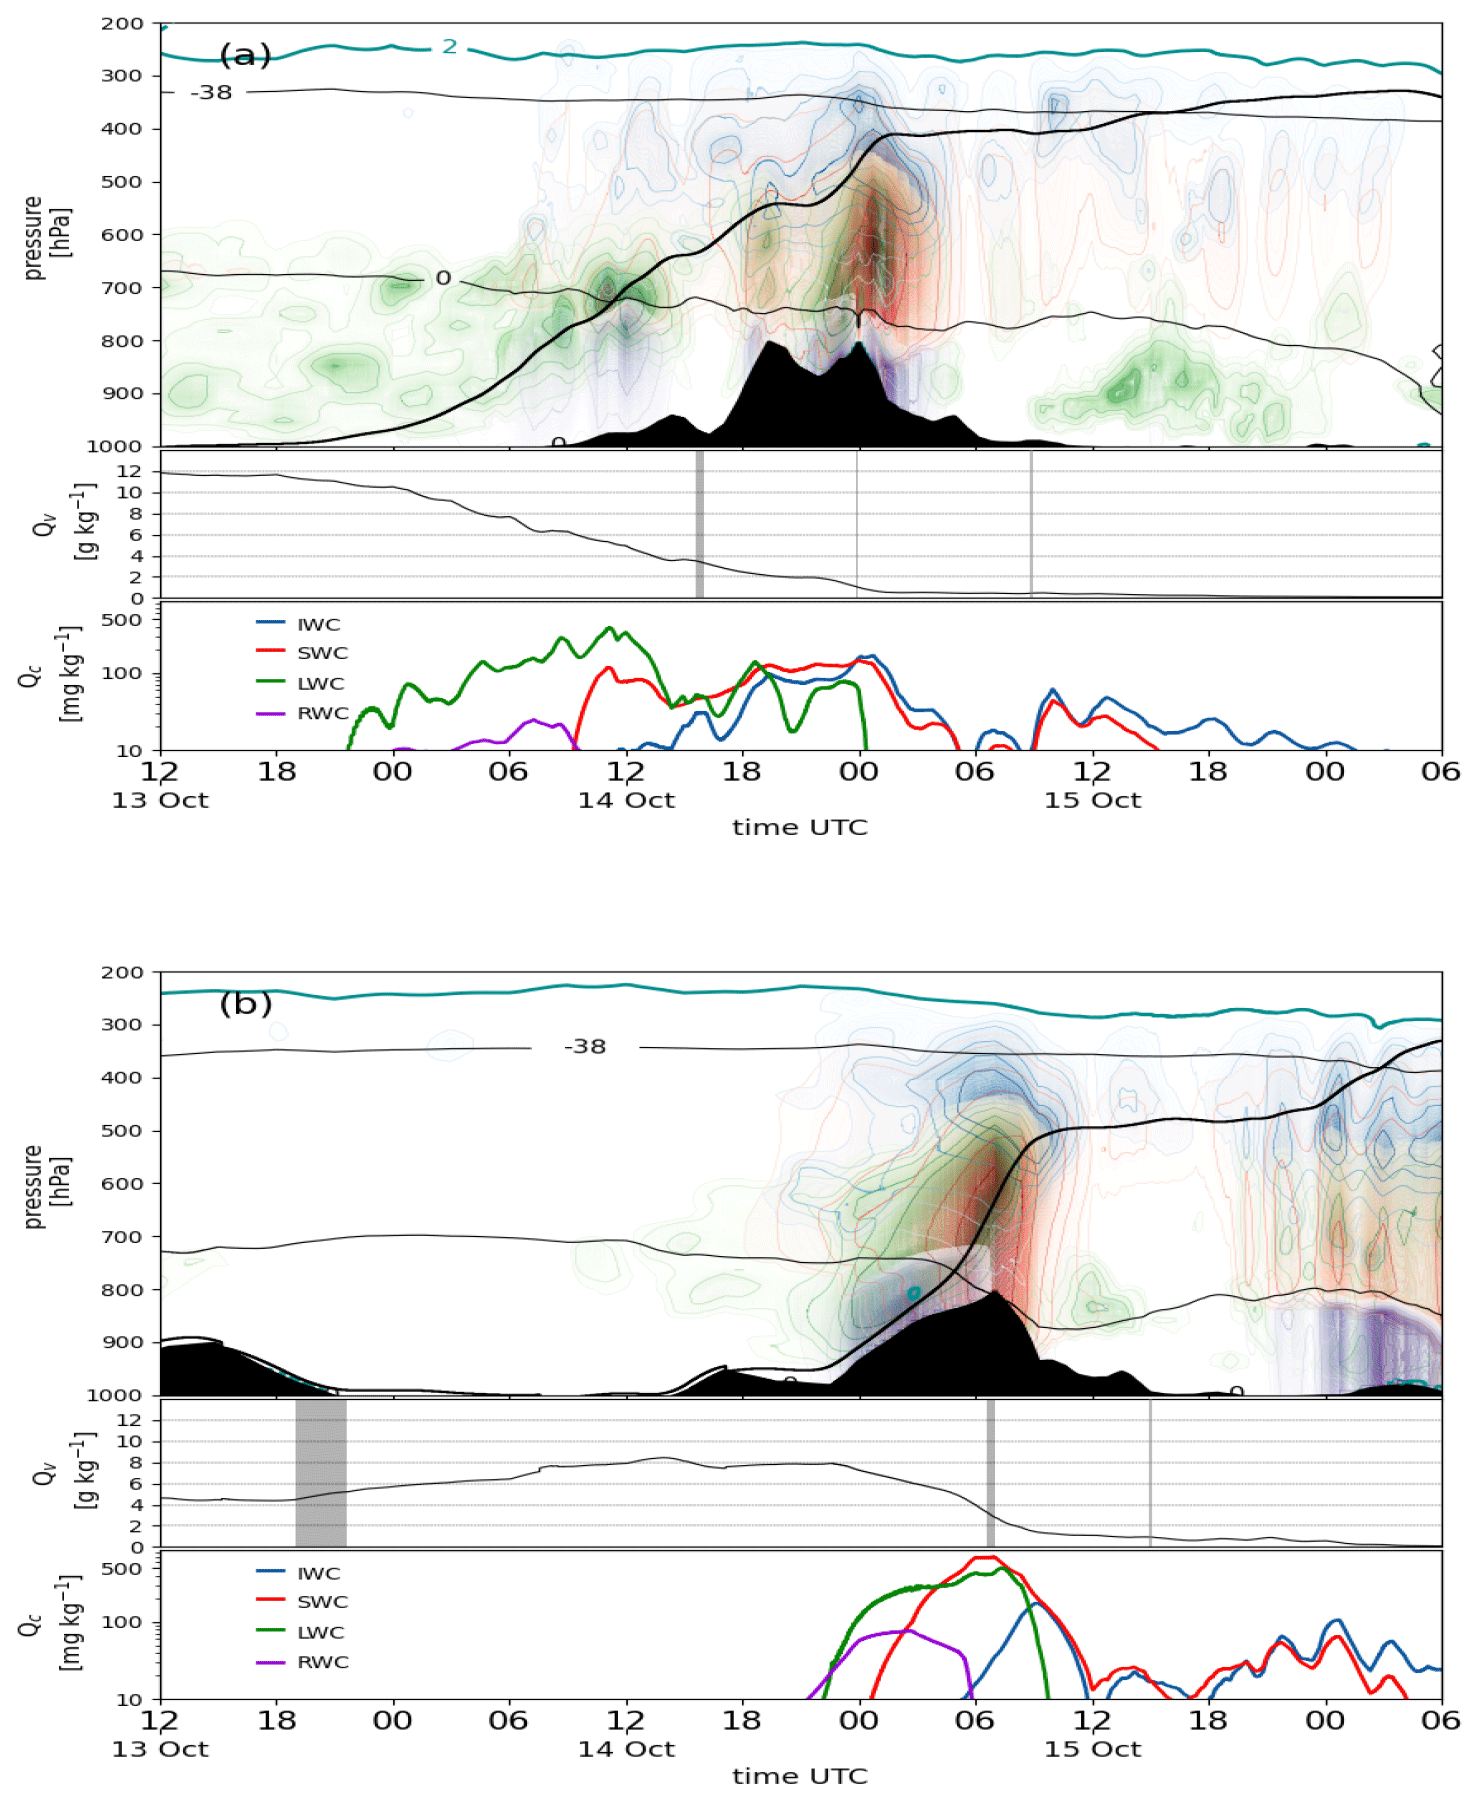
Figure 7Vertical profiles along trajectories (a) T1 and (b) T2 (black lines in Fig. 6). In the upper portions of panels (a) and (b) are shown the height of the trajectory (thick black line), cloud species from EDA (rain water content (RWC) in purple with contours between 10–100 mg kg−1, LWC in green with contours between 10–300 mg kg−1, SWC in red with contours between 10–100 mg kg−1 and IWC in blue with contours between 10–100 mg kg−1), temperature (thin black lines for 0 and −38 ∘C), the 2 PVU tropopause (cyan line) and orography (black areas). The middle portions of the panels show specific humidity Qv along the trajectories, and grey vertical bars indicate where measurements were taken. The lower portions of the panels show cloud species along the trajectories (see legend for colours).
4.2.2 WCB ascent from the Mediterranean across the Alps
The air parcels of trajectory T2, which is later measured during flight IOP2c, initially moves over the Massif Central towards the Mediterranean (Fig. 6b). Just before reaching the coast, the low-level trajectory is sampled by the lidar near Montpellier after 21:00 UTC on 13 October (left grey bar in the middle panel of Fig. 7b), which corresponds to the beginning of the lidar measurements on this day (red dot at 990 hPa in Fig. 8a). According to the lidar, T2 arrives with relatively low specific humidity values of about 4 g kg−1, which is distinctly drier than the southerly flow some hours later. The EDA has a relatively large moist bias in the near-surface layer close to the WCB trajectory T2 (see yellow circles in Fig. 8a) of about 2 g kg−1. This low-level surplus of moisture in EDA persists for most of the 24 h measurement period with only a short interruption during another episode with elevated WCB probabilities at 12:00 UTC on 14 October. The moist bias in EDA does not seem to depend on the large-scale flow direction.
After crossing the coast, the humidity along T2 increases (Fig. 7b) while the trajectory makes a long turn over the northwestern Mediterranean until 16:00 UTC on 14 October (Fig. 6b). It moistens markedly due to ocean evaporation, reaching a maximum of 8 g kg−1, which is, however, still much drier than the initial humidity of T1 (Fig. 7a, b). According to the study by Rainaud et al. (2016) as part of HyMeX, the fuelling of the WCB with sea moisture coincided with an evaporation event that was dominated by strong low-level wind and to a lesser degree by the low-level gradients of temperature and humidity.
At about 21:00 UTC on 14 October, T2 reaches the southern slopes of the Alps, where strong orographic lifting goes along with the formation of very dense clouds. Values of cloud condensate at the trajectory's position, in particular SWC, are distinctly larger than at any time during the ascent of T1.
Close to the time when peak values of SWC occur in EDA, i.e. shortly after 06:00 UTC on 15 October, the trajectory passes through the vertical cross section of the Monte Lema radar reflectivity shown in Fig. 6b at 8.5∘ E and an altitude of 650 hPa (red dot in Fig. 8c). T2 is located right above the well-defined melting layer. The radar reflectivity at the location of T2 is about 25 dBZ, consistent with the high values of precipitating snow (>500 mg kg−1 in EDA). The trajectory is passing through a region of high WCB probabilities, and it is also accompanied by other WCB and non-WCB air that will later be measured by the Falcon (red and blue asterisks in Fig. 8c).
Compared to the time when trajectory T1 passed the radar about 7 h earlier, the reflectivities are slightly higher and horizontally homogeneous during the crossing of T2. This might be related to the now more coherent flow of WCB air from the Mediterranean towards the Alps compared to the more complex flow situation during the passage of T1 (Fig. 6). For T2, cloud formation and rainout occur entirely at the Alps, and no previous dynamical lifting reduced the load of water as in the case of T1 (Fig. 7).
The steep drop of the height of the 0 ∘C isotherm in Fig. 7b at the time of maximum ascent of T2 indicates that the orographic lifting coincided most likely with enhanced dynamical forcing for ascent and was associated with the passage of the cold front. Again, supercooled liquid water exists in EDA up to about 500 hPa. After reaching this level, cloud condensate values decrease strongly and the ascent becomes very weak for more than 12 h. During this period, the Falcon flight intersects T2 at 15:00 UTC, when the aircraft enters the region of high WCB probabilities (red dot in Fig. 5a). Later on 15 October, the air parcel of the trajectory is lifted further by another cold front near the Baltic Sea, discernible by deep clouds and the lowering of the 0 ∘C isotherm in Fig. 7b. It reaches the tropopause about 30 h after the start of its ascent.
This detailed analysis of two prototype WCB trajectories reveals the complexity of this orographically influenced WCB, which originates from both the eastern North Atlantic and western Mediterranean and exhibits high variability in its ascent behaviour with a gradual slantwise, dynamically driven ascent for T1 and a more stepwise and mixed orographically and dynamically driven ascent for T2. For the latter, the very steep ascent when the cold front crosses the Alps almost reaches the threshold of 320 hPa in 3 h. Such rapid ascent has been used to identify embedded convection in WCBs by Oertel et al. (2020). It is during this period when the radar observes the largest near-surface values up to 40 dBZ, but here the rather uniform structures in the radar reflectivity do not hint at embedded convection (Oertel et al., 2019).
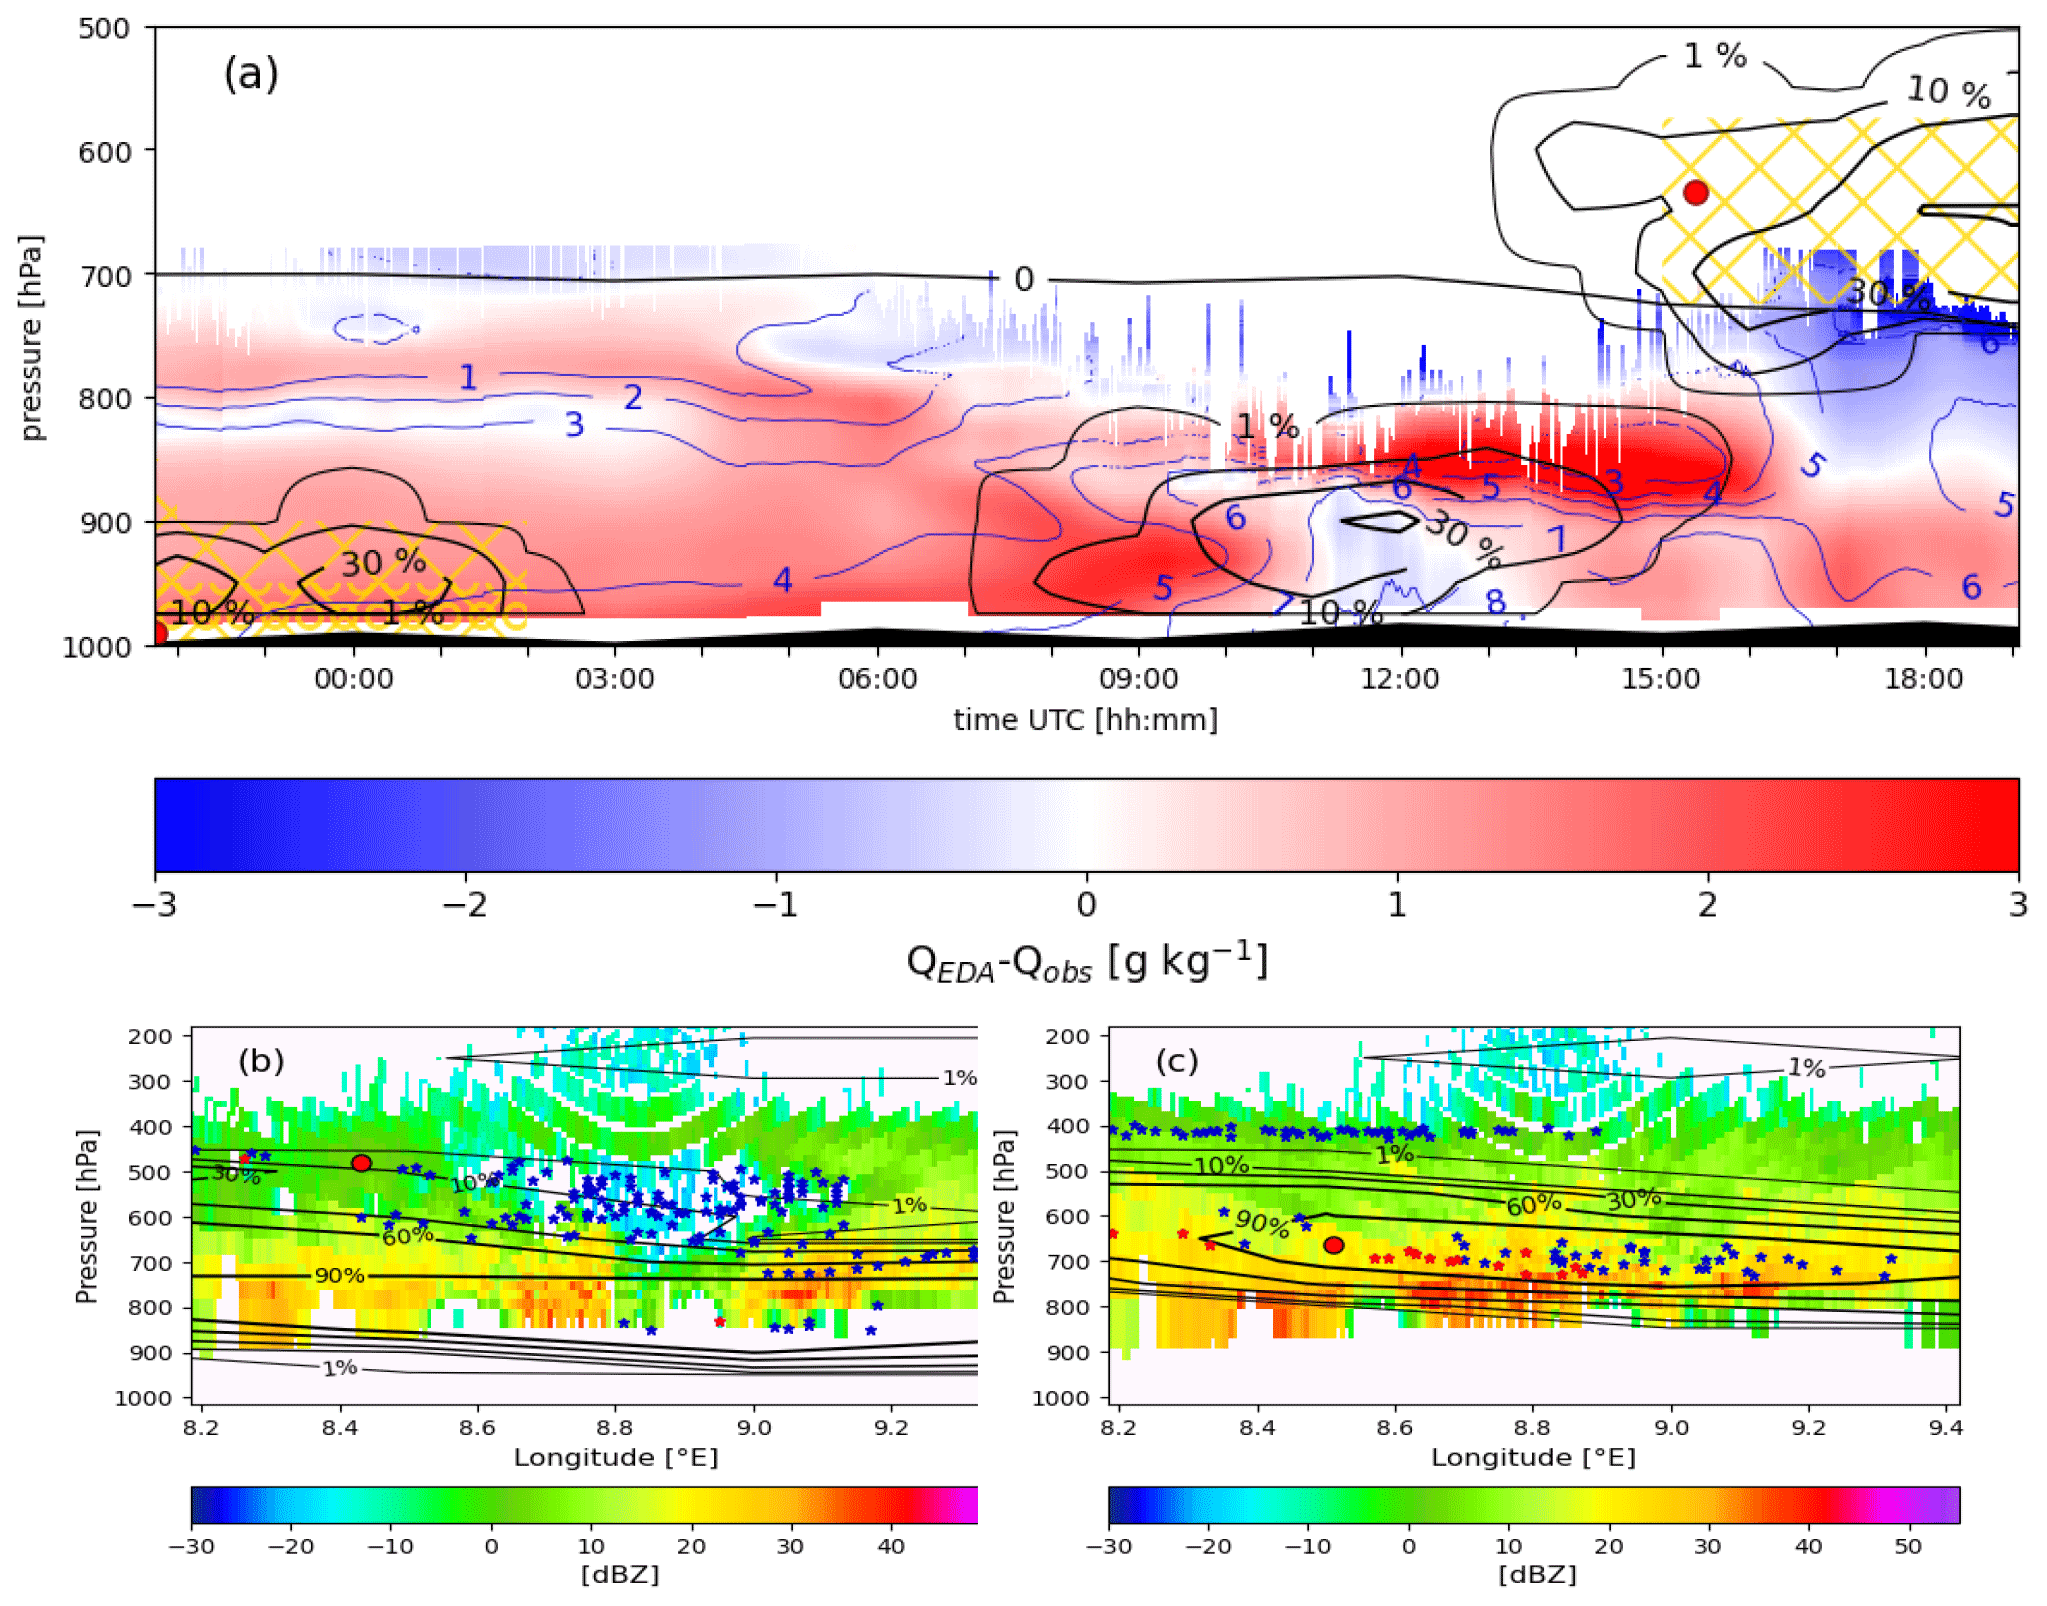
Figure 8Time–height plots of measurements from (a) the water vapour lidar near Montpellier and (b) and (c) the Monte Lema radar. Panel (a) shows the difference of specific humidity between the EDA mean and the lidar observations (colours, in g kg−1), lidar-observed specific humidity (blue contours, in g kg−1), the EDA mean 0 ∘C isotherm (thin black contour), WCB probability (thicker black contours for 1, 10, 30, 60 and 90 %) and intersections of air parcels that were later sampled by the Falcon (yellow hatching, crosses for flight IOP2b and circles for IOP2c) from 21:44 UTC on 13 October to 19:03 UTC on 14 October 2012. The intersections of trajectories T1 and T2 are highlighted with a red dot. Panels (b) and (c) present vertical cross sections of radar reflectivity from the Monte Lema radar (colours, dBZ) at 46.15∘ N, which is 12 km north of the radar; WCB probabilities (black contours, as above); and intersection points of Falcon-probed trajectories (blue) and Falcon-probed WCB trajectories (red) at (b) 23:40 UTC on 14 October with Lagrangian matches with flight IOP2b and the intersection of T1 as a red dot and (c) 06:35 UTC on 15 October 2012 with Lagrangian matches with flight IOP2c and T2 as a red dot.
4.3 Tracer experiment
An experiment with the physical release of a passive tracer by a small aircraft in the inflow of the WCB was conducted as part of the campaign. The main objective was to experimentally confirm the WCB ascent as determined by the model data. The use of a passive tracer enables, in principle, validation of whether the air observed at a later time by the Falcon actually had its origin in the labelled WCB inflow region. Here we report about the outcome of this challenging experiment, which essentially relies on exact forecasts and effective flight planning.
The release flight of the tracer gas occurred between 09:00 and 10:00 UTC on 14 October off the Mediterranean coast near Marseille (light red marker in Fig. 9b near 6∘ E). The small aircraft Partenavia (see Sect. 2.4) flew through the near-surface air with WCB probabilities exceeding 70 % at about 950 hPa (Fig. 9a). After a short transfer the release of the tracer started at 09:09 UTC at a level of 970 hPa (marked by the thick red line in Fig. 9a). Then the aircraft ascended continuously while spraying. It left the WCB inflow after about 15 min and continued to release tracer gas for another 15 min in air that was about to ascend by more than 400 hPa within the next 48 h (lower panel in Fig. 9a). The release ended at 09:39 UTC on 750 hPa.
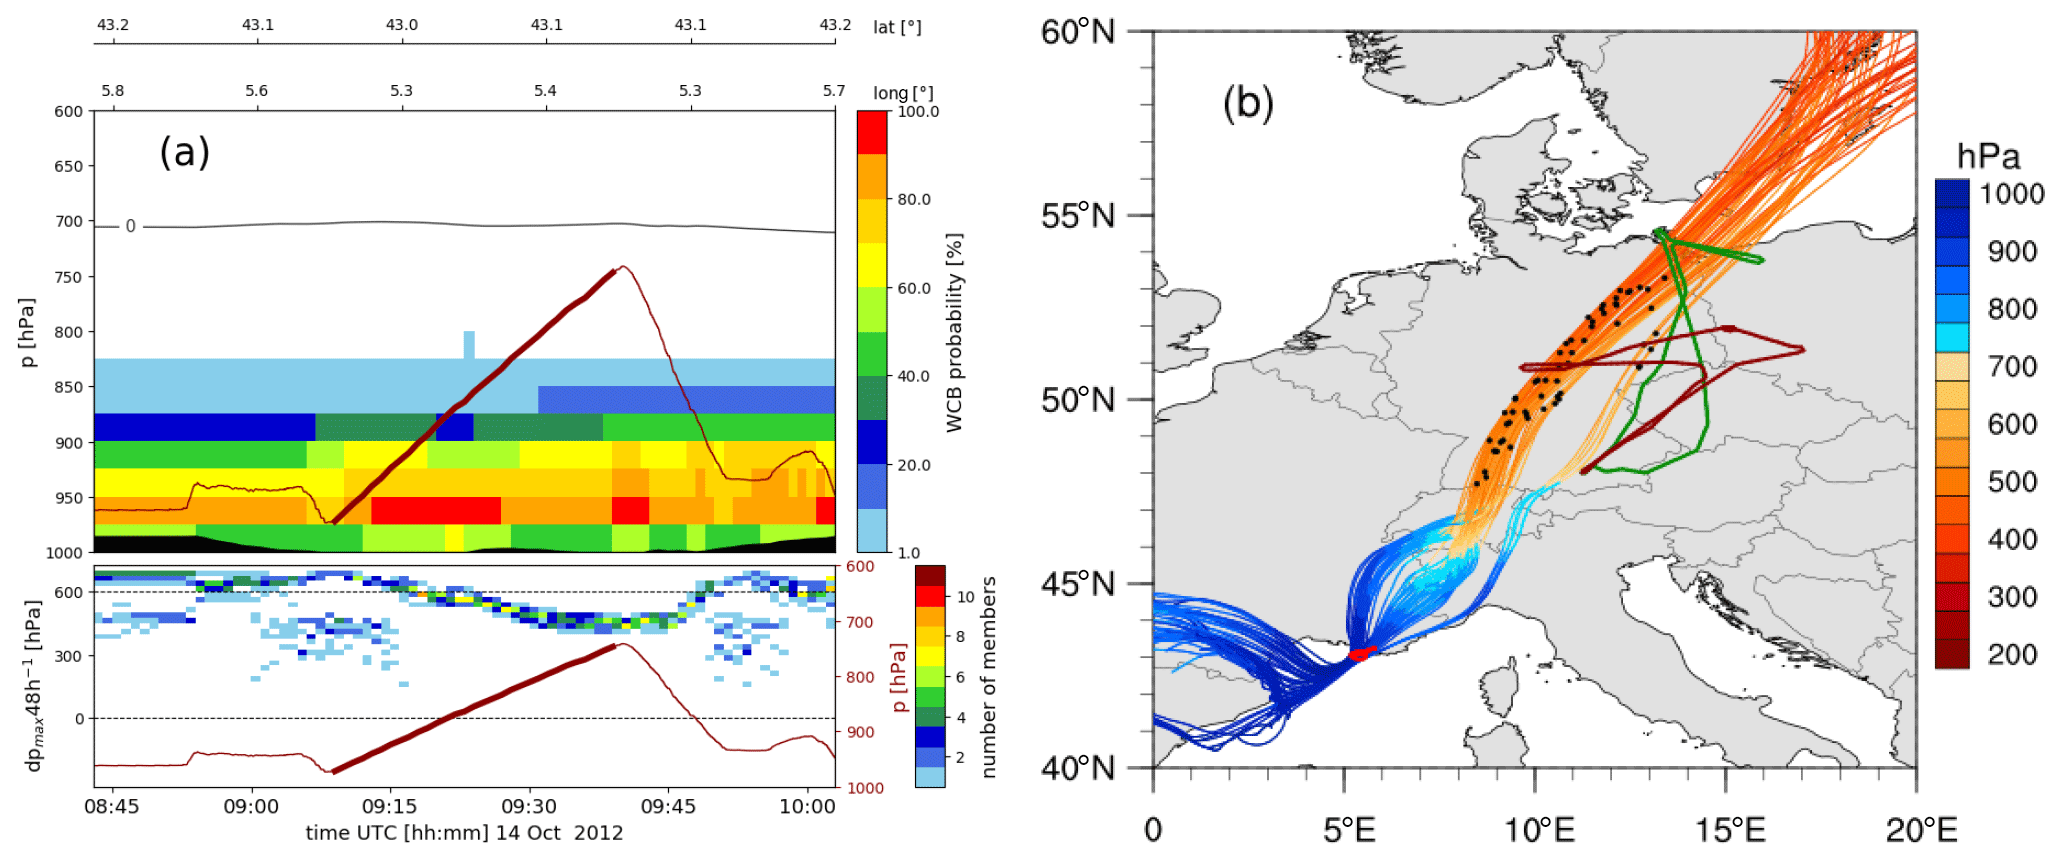
Figure 9(a) Vertical cross section along the tracer release flight: WCB probability (colours), flight altitude (red line), tracer release (thick part of the red line) and temperature (black line, 0 ∘C). The lower portion of the panel shows the same as Fig. 4c, albeit here for the tracer release flight. (b) WCB trajectories started from the tracer release section (thick red line in panel a), with trajectories coloured according to pressure, tracer release flight route (bright red), Falcon flight IOP2b (green), Falcon flight IOP2c (dark red) and position of the trajectories at 09:00 UTC on 15 October (black dots).
Trajectories are calculated from the tracer release section of the flight in all EDA members, and the subset of these that fulfil the WCB criterion is also selected. We applied the same method as for the WCB probabilities (Sect. 2.6) to obtain probabilities for the occurrence of the tracer air mass, which we refer to as tracer probability. As shown in Fig. 9b, the WCB trajectories containing tracer gas move similarly across the Alps and have a comparable life cycle to that of the Mediterranean trajectory T2 discussed before (see Fig. 7b). In the evening of 14 October, WCB with tracer passes the radar below the Atlantic trajectory T1 at 700–600 hPa according to the model trajectories (not shown in Fig. 8b). In the following hours, the Falcon observations were conducted, with one of the goals being to take samples of the tracer gas.
The position of the WCB trajectories carrying the tracer at 09:00 UTC on 15 October, i.e. at the time of flight IOP2b, is indicated by the black markers in Fig. 9b (flight route in green). Their positions hint at the proximity of the tracer and the flight route. Note that only WCB trajectories are displayed in the figure and that these are surrounded by more tracer-carrying air masses that ascend less strongly than the WCB. A vertical cross section along the Falcon flight reveals that the aircraft is at this time and during the previous hour at the upper edge of the tracer plume, indicated by relatively high tracer probability of up to 40 % in Fig. 10a. Hatching shows where tracer-carrying WCB trajectories intersect the flight curtain (however, with a low probability; not shown). The lower panel in this figure shows increased values of the tracer concentration measured in situ during the Falcon flight in the early part of the flight leg at 500 hPa. Comparison with Fig. 4a shows that the tracer-carrying air in Fig. 10a, which mainly does not fulfil the WCB criterion, fills the gap in the high WCB probability between 08:00 and 08:30 UTC there. When comparing the path of the tracer WCB trajectories and their positions at 09:00 UTC in Fig. 9b, it becomes clear that the flight route failed in meeting the main tracer path, which was actually further west. In addition, the main tracer plume must have reached the northernmost east–west flight leg shortly after 09:00 UTC and hence slightly too late for our flight. Still, the flight later crosses low tracer probabilities until 09:30 UTC. The measurements corroborate the presence of tracer gas with concentrations of up to 150 ppbv over a longer section along the flight. Exactly there, the maximum ascent of the trajectories started from the flight track was highly uncertain (Fig. 4c), and the satellite image indicates deep convection near the frontal cloud band (Fig. 3a). The measurements, however, do not exactly agree in time with the proposed peaks in the tracer probabilities from the trajectories. The matching (and estimated tracer transport) based on kinematic trajectories comes with some uncertainties – for instance, mixing processes that (e.g., by deep convection in the WCB inflow and later over the Baltic Sea; see Figs. 2d, 3a) might have led to significant dispersion and possibly to a slight shift of the long-range transport in the atmosphere compared to the trajectories, which do not contain the effects of local-scale dispersion. Also, a technical issue concerning the manual time adjustment of the device cannot be completely excluded. When a roughly estimated time shift of 20 minutes is taken into account, the tracer measurements and the probabilities show a better agreement. A time shift cannot be observed for the subsequent Falcon flight IOP2c in the afternoon of the same day. High concentrations of measured tracer gas of 170 ppbv do exactly coincide with the only flight segment at 15:00 UTC (Fig. 10b) where tracer probabilities point to a long-range tracer transport to the flight track. On this flight we will most likely have sampled the tail of the tracer-carrying WCB plume shown in Fig. 9b. The increased tracer probability also agrees with the increased WCB probability seen in Fig. 5 and clearly points to a transport of the tracer gas within the WCB. This confirms that we successfully sampled a tracer, which was released in the boundary layer over the Mediterranean Sea, 30 h later and 1000 km further north at an altitude of 500 hPa. This long-range transport occurred with the Mediterranean WCB air mass close to the evolution of the example trajectory T2 described in Sect. 4.2.2, which realised triple Lagrangian matches with observations.
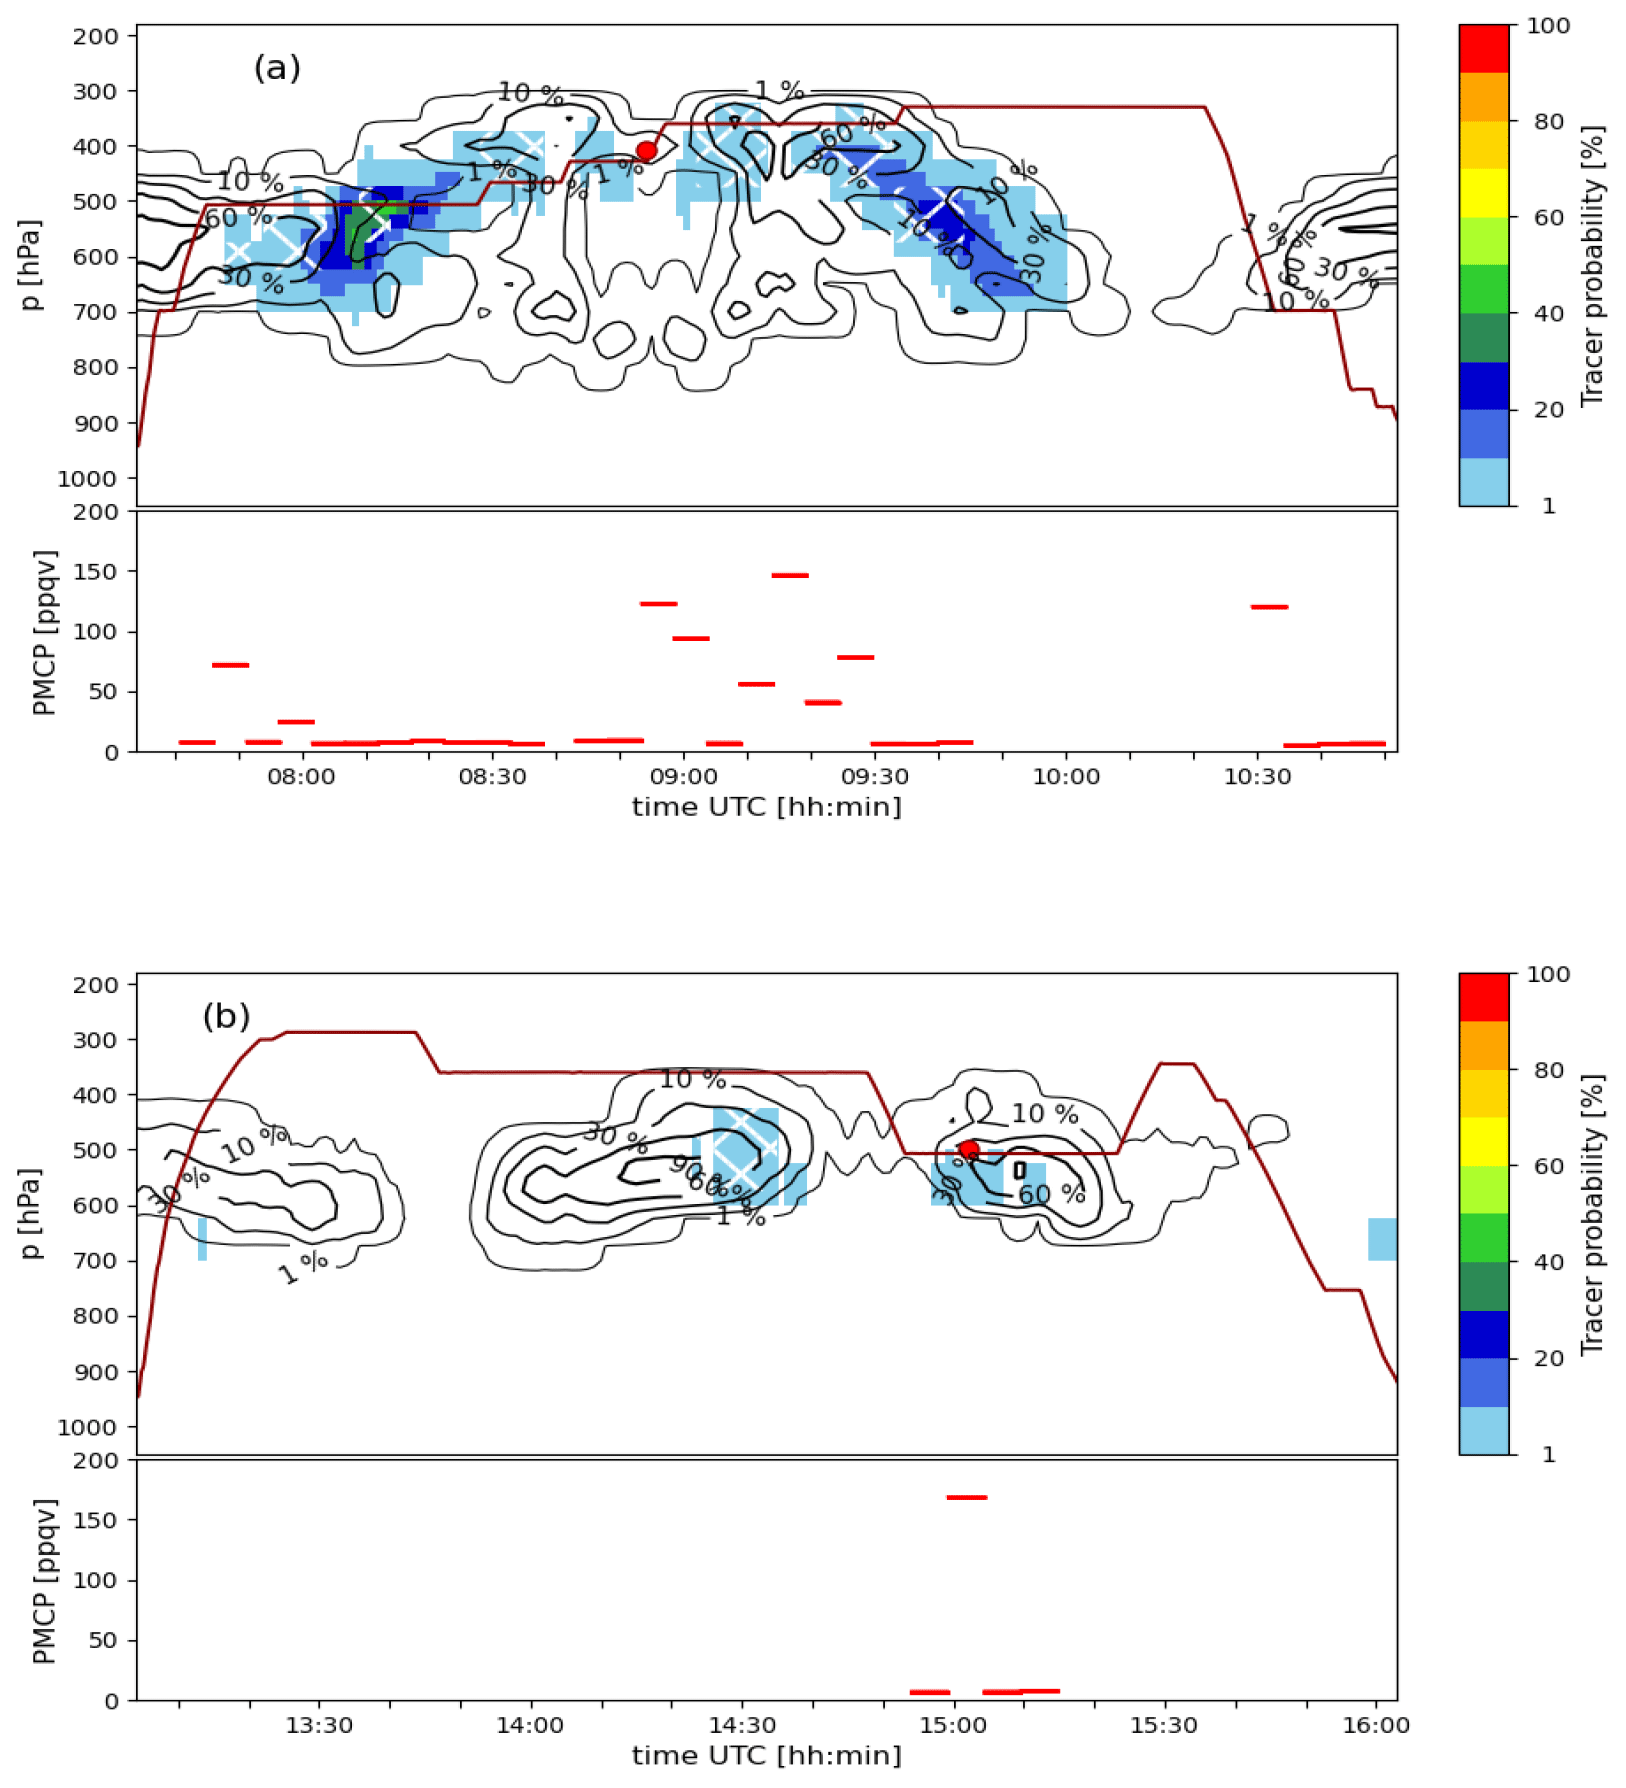
Figure 10Tracer probability along the Falcon flights (a) IOP2b and (b) IOP2c. Upper portions of panels show tracer probabilities (colours for all trajectories, white hatching for WCB trajectories), flight altitude (dark red line) and WCB probabilities (black contours for 1, 10, 30, 60 and 90 %); the lower portions of panels show the tracer concentrations sampled on board the Falcon. The intersections of trajectories T1 with flight IOP2b in panel (a) and T2 with flight IOP2c in panel (b) are highlighted by a red dot.
This detailed WCB case study revolves around a unique set of airborne in situ observations taken during the T-NAWDEX-Falcon field experiment, which happened in parallel to the HyMeX SOP1 in autumn 2012. The key object of this study is an orographically influenced WCB ascending with two inflow branches across the Alps towards the Baltic Sea. The WCB shows a rather complex flow behaviour in the vicinity of the Alpine mountains. There is low-level inflow of air into the WCB from both the North Atlantic and the Mediterranean, where the former mainly ascends ahead and the latter rises above the Alps, with some of the lifting being clearly due to mechanically forced orographic ascent at the southern Alpine slopes. This is so far the most detailed WCB case study near complex topography, illustrating that dynamic and orographic lifting can interact in the formation and evolution of a WCB. Assessing the generality of this finding for other WCBs near mountains is left for further research. Two inflow branches with moisture sources in the North Atlantic and the Mediterranean were also found in studies of heavy precipitation events on the south side of the Alps (Winschall et al., 2012), which emphasises the potential of WCBs in contributing to severe weather in this region (Buzzi et al., 1998). North of the Alps, where the two branches of the WCB further ascend towards the Baltic Sea, two research flights intersected both branches, one at mid-level during ascent and the other later in the outflow.
In order to clearly attribute certain periods of the in situ aircraft observations to the WCB, we used a sophisticated trajectory approach. Kinematic air parcel trajectories are subject to uncertainties in the wind field and to numerical errors in the trajectory computation. To address these uncertainties and to provide more confidence about the identification of the WCB, we determined the WCB probabilistically by calculating trajectories in each of the 11 members of the ECMWF's EDA – an operational dataset that quantifies uncertainties in the representation of the state of the atmosphere.
Observational evidence for the long-range transport in the WCB was obtained from an airborne tracer release experiment. The experiment involved the release of an inert tracer gas in the WCB inflow region in the western Mediterranean by a small aircraft and the sampling of the tracer by the Falcon aircraft 30 h later and 1000 km further north over Germany. The setup of this experiment was unique as previous releases of the same passive tracer were conducted in smaller-scale convective flow systems and included a much smaller spatial and temporal separation of the release and sampling. Before we summarise the results, we need to consider that such an experiment requires (i) a tracer gas with very low natural atmospheric concentrations, (ii) a suitable and highly sensitive airborne sampling and analysis technique, (iii) accurate forecasts for reliable flight planning, and (iv) a sophisticated flight planning method. We can report that increased values of the collected tracer gas coincided with sections of the Falcon flights where trajectory calculations suggested increased probabilities for the tracer air mass. However, the locations of the sampled tracer were characterised by rather low probabilities (i.e. they were not confirmed by many EDA members), and the tracer sampling just occurred at the edge of the WCB. What we cannot evaluate by using trajectories is dispersion or dilution of the tracer gas that possibly occurred by convective mixing in the WCB inflow and at the sampling location near the Baltic Sea for IOP2b and also by turbulence due to wind shear along the cold front. These processes may have occurred in reality, potentially leading to a more widespread tracer plume as shown by our trajectories. Since we regard our technical setup for the experiment and the flight planning as sophisticated (Schäfler et al., 2014), we attribute the relatively low tracer probabilities at the edge of the WCB – instead of the targeted higher tracer probability in the core of the WCB – to a non-perfect forecast as mentioned in (iii) above, to obviously substantial uncertainties in the EDA due to strong wind shear in the region of the WCB and finally to the limited area where the tracer gas was released into the WCB. The fact, however, that the observed transport of the tracer qualitatively agrees well with the WCB pathway as indicated by EDA trajectories provides highly valuable evidence that WCBs, identified on the basis of trajectory calculations in many studies in the last 25 years, are meaningful Lagrangian flow features in the atmosphere.
WCB probabilities were also used to link the Falcon in situ measurements in space and time with earlier observations in the WCB, which we refer to as Lagrangian matches. This approach revealed that part of the WCB inflow was already observed at low levels by a HyMeX lidar near Montpellier and later at the southern slope of the Alps as the WCB passed a MeteoSwiss radar. These Lagrangian matches between in situ airborne and ground-based observations occurred within the WCB air as confirmed by the tracer. The Lagrangian matches were not planned beforehand but were beneficially included later during the analysis of this WCB. EDA members are also used for evaluating humidity and cloud properties with the measurements and to characterise the evolution of the moisture in the model. The key findings from this evaluation can be summarised as follows:
-
Lidar humidity measurements sampled both branches of the WCB inflow from the Atlantic and Mediterranean during a time period of almost 1 d. Irrespective of the changing wind direction due to the approaching cyclone and the local wind circulation (Di Girolamo et al., 2009), the observations reveal an almost continuously too-moist boundary layer in the ECMWF analyses. This highlights the difficulty of correctly representing moisture in this complicated flow situation of the WCB inflow, which was influenced by multi-scale processes. Our results agree with earlier observations by Schäfler et al. (2011) and Schäfler and Harnisch (2015), who also found a too-humid boundary layer in WCB inflows in analysis data.
-
While the North Atlantic WCB branch already started to ascend, the Mediterranean branch moved further east, taking up moisture along the coast before impinging upon the Alps. There, the MeteoSwiss radar observed intense surface rainfall and mid-level snow associated with the WCB. The particular WCB air parcels that were previously observed by the lidar and subsequently sampled by the Falcon are part of this precipitating cloud close to the melting layer. A few hours earlier, the radar observed WCB air from both the Mediterranean and the Atlantic branches, and the two branches were vertically separated. Comparing the moisture and cloud formation along the WCB trajectories, the drier Mediterranean branch almost instantaneously formed dense high-reaching clouds when it was forced to ascend at the Alps, while the clouds of the Atlantic branch developed more gradually and were less deep. The radar-observed WCB cloud in our case is rather stratiform and does not exhibit characteristics of embedded convection, as observed in other (non-orographic) WCB cases.
-
Later during the further ascent of the WCB north of the Alps, the Falcon measured in situ water vapour and condensate in the mid- and upper troposphere, including Lagrangian matches with the earlier observations. Several successful WCB intersections showed that water vapour in the cloudy WCB is often lower in the EDA compared with the measurements. In regions below the WCB, where according to the EDA snow falls out of the WCB and presumably sublimates, water vapour seems to be distinctly underestimated in the model. Cloud condensate in the WCB was found to be of similar magnitude in the EDA compared to observed cloud condensate in the mid-troposphere (mixed-phase cloud) and slightly underestimated further above (ice cloud). To our knowledge, these are the first reported in situ measurements of cloud condensate in a WCB, repeated 2 years later as part of the ML-CIRRUS aircraft campaign (Voigt et al., 2017).
Apart from these appealing results, it is important to emphasise the limitations of this campaign-driven study. The limitations of the study are related to the fact that, even with sophisticated flight planning, perfect flight routes in terms of maximising WCB encounters and Lagrangian matches have not been possible for several reasons. As an effect, the number of Lagrangian matches between flights and the duration of in situ observations within the WCB are limited. We think that this is the price to pay for such a challenging observational study that essentially relies on flight planning, which in turn was based on non-perfect forecasts. However, we think that this multi-faceted study reveals a range of interesting and, for some of them, unique features of WCBs. This study presented the first case of a WCB with measurements following the Lagrangian ascent and describing the moisture and cloud evolution along the flow. The limited number of observations, however, only allowed to analyse a limited set of processes contributing to the total moisture budget of this WCB. We expect that repeating these kinds of Lagrangian measurements in a WCB with a more complete instrumental package will be rewarding. In addition, the theme of orographic WCBs definitively deserves further attention as an orographically induced change in updraught velocities may modify the dynamics and the water partitioning within the WCB.
The data are available from the authors upon request.
MB designed this study, performed the trajectory calculations and analysed the data. AS directed the aircraft campaign, and MB, HarS, CV and HW contributed to the flight planning. SK and CV provided the measurements of water vapour and total water; HanS led the passive tracer experiment, DS and PDG led the lidar observations, DN and UG led the radar observations, and MS provided expertise about Alpine flow dynamics. MB and HW wrote the paper with input from all co-authors.
The authors declare that they have no conflict of interest.
We are most grateful for the scientific and financial support from Ulrich Schumann and Andreas Dörnbrack (both DLR), which made the T-NAWDEX-Falcon campaign possible. We also thank all colleagues who contributed to the success of campaign. We especially wish to thank the colleagues who were involved in discussions about this project and helped to develop the study through the years. In addition, we acknowledge MeteoSwiss and the ECMWF for providing access to the model data. Finally, we highly appreciate the two reviewer's positive and constructive feedback on our paper.
Heini Wernli acknowledges funding from ETH Zurich that supported the campaign. Maxi Boettcher acknowledges funding by the Swiss National Science Foundation (grant no. 165941) and the European Research Council 485 (ERC) under the European Union's Horizon 2020 research and innovation programme (project INTEXseas, grant agreement no. 787652). Christiane Voigt and Stefan Kaufmann acknowledge funding by the Helmholtz Association under contract W2/W3-60 and by the German Research Foundation within DFG-SPP 1294 HALO (Vo1504/4-1) and DFG-SPP 2115 PROM (Vo1504/5-1). Hans Schlager acknowledges funding of the tracer work by the German Science Foundation (DFG) through the priority programme SPP1294, project SCHL1857/1-2.
This paper was edited by Farahnaz Khosrawi and reviewed by Josué Gehring and one anonymous referee.
Attinger, R., Spreitzer, E., Boettcher, M., Forbes, R., Wernli, H., and Joos, H.: Quantifying the role of individual diabatic processes for the formation of PV anomalies in a North Pacific cyclone, Q. J. Roy. Meteor. Soc., 145, 2454–2476, 2019. a, b
Bethan, S., Vaughan, G., Gerbig, C., Volz-Thomas, A., Richer, H., and Tiddeman, D. A.: Chemical air mass differences near fronts, J. Geophys. Res.-Atmos., 103, 13413–13434, 1998. a
Binder, H., Boettcher, M., Joos, H., and Wernli, H.: The role of warm conveyor belts for the intensification of extratropical cyclones in Northern Hemisphere winter, J. Atmos. Sci., 73, 3997–4020, 2016. a
Binder, H., Boettcher, M., Joos, H., Sprenger, M., and Wernli, H.: Vertical cloud structure of warm conveyor belts – a comparison and evaluation of ERA5 reanalysis, CloudSat and CALIPSO data, Weather Clim. Dynam., 1, 577–595, https://doi.org/10.5194/wcd-1-577-2020, 2020. a, b
Boutle, I. A., Belcher, S. E., and Plant, R. S.: Moisture transport in midlatitude cyclones, Q. J. Roy. Meteor. Soc., 137, 360–373, 2011. a
Bretherton, C. S. and Pincus, R.: Cloudiness and Marine Boundary Layer Dynamics in the ASTEX Lagrangian Experiments, Part I: Synoptic Setting and Vertical Structure, J. Atmos. Sci., 52, 2707–2723, 1995. a
Browning, K. A.: Radar measurements of air motion near fronts, Weather, 26, 320–340, 1971. a, b, c
Browning, K. A.: Conceptual models of precipitation systems, Weather Forecast., 1, 23–41, 1986. a, b
Browning, K. A.: Organization of clouds and precipitation in extratropical cyclones, in: Extratropical Cyclones: The Erik Palmén Memorial Volume, edited by: Newton, C. W. and Holopainen, E. O., American Meteorological Society, Boston, Massachusetts, USA, 129–153, 1990. a
Buzzi, A., Tartaglione, N., and Malguzzi, P.: Numerical Simulations of the 1994 Piedmont Flood: Role of Orography and Moist Processes, Mon. Weather Rev., 126, 2369–2383, 1998. a, b
Carlson, T. N.: Airflow through midlatitude cyclones and the comma cloud pattern, Mon. Weather Rev., 108, 1498–1509, 1980. a, b
Catto, J. L., Madonna, E., Joos, H., Rudeva, I., and Simmonds, I.: Global relationship between fronts and warm conveyor belts and the impact on extreme precipitation, J. Climate, 28, 8411–8429, 2015. a
Crezee, B., Joos, H., and Wernli, H.: The microphysical building blocks of low-level potential vorticity anomalies in an idealized extratropical cyclone, J. Atmos. Sci., 74, 1403–1416, 2017. a, b
Davies, H. C. and Didone, M.: Diagnosis and dynamics of forecast error growth, Mon. Weather Rev., 141, 2483–2501, 2013. a
Di Girolamo, P., Summa, D., and Ferretti, R.: Multiparameter Raman lidar measurements for the characterization of a dry stratospheric intrusion event, J. Atmos. Ocean. Tech., 26, 1742–1762, 2009. a, b
Di Girolamo, P., Flamant, C., Cacciani, M., Richard, E., Ducrocq, V., Summa, D., Stelitano, D., Fourrié, N., and Saïd, F.: Observation of low-level wind reversals in the Gulf of Lion area and their impact on the water vapour variability, Q. J. Roy. Meteor. Soc., 142, 153–172, 2016. a, b, c, d
Ducrocq, V., Braud, I., Davolio, S., Ferretti, R., Flamant, C., Jansa, A., Kalthoff, N., Richard, E., Taupier-Letage, I., Ayral, P.-A., Belamari, S., Berne, A., Borga, M., Boudevillain, B., Bock, O., Boichard, J.-L., Bouin, M.-N., Bousquet, O., Bouvier, C., Chiggiato, J., Cimini, D., Corsmeier, U., Coppola, L., Cocquerez, P., Defer, E., Delanoë, J., Di Girolamo, P., Doerenbecher, A., Drobinski, P., Dufournet, Y., Fourrié, N., Gourley, J. J., Labatut, L., Lambert, D., Le Coz, J., Marzano, F. S., Molinié, G., Montani, A., Nord, G., Nuret, M., Ramage, K., Rison, W., Roussot, O., Said, F., Schwarzenboeck, A., Testor, P., Van Baelen, J., Vincendon, B., Aran, M., and Tamayo, J.: HyMeX-SOP1: The Field Campaign Dedicated to Heavy Precipitation and Flash Flooding in the Northwestern Mediterranean, B. Am. Meteorol. Soc., 95, 1083–1100, 2014. a, b
Duffourg, F., Lee, K.-O., Ducrocq, V., Flamant, C., Chazette, P., and Di Girolamo, P.: Role of moisture patterns in the backbuilding formation of HyMeX IOP13 heavy precipitation systems, Q. J. Roy. Meteor. Soc., 144, 291–303, 2018. a
Eckhardt, S., Stohl, A., Wernli, H., James, P., Forster, C., and Spichtinger, N.: A 15-year climatology of warm conveyor belts, J. Climate, 17, 218–237, 2004. a, b
Figueras i Ventura, J., Lainer, M., Schauwecker, Z., Grazioli, J., and Germann, U.: Pyrad: A Real-Time Weather Radar Data Processing Framework Based on Py-ART, J. Open Res. Softw., 8, 28, https://doi.org/10.5334/jors.330, 2020. a
Flaounas, E., Lagouvardos, K., Kotroni, V., Claud, C., Delanoë, J., Flamant, C., Madonna, E., and Wernli, H.: Processes leading to heavy precipitation associated with two Mediterranean cyclones observed during the HyMeX SOP1, Q. J. Roy. Meteor. Soc., 142, 275–286, 2016. a
Fueglistaler, S., Luo, B. P., Buss, S., Wernli, H., Voigt, C., Müller, M., Neuber, R., Hostetler, C. A., Poole, L. R., Flentje, H., Fahey, D. W., Northway, M. J., and Peter, T.: Large NAT particle formation by mother clouds: Analysis of SOLVE/THESEO-2000 observations, Geophys. Res. Lett., 29, 1–4, https://doi.org/10.1029/2001GL014548, 2002. a
Gabella, M., Speirs, P., Hamann, U., Germann, U., and Berne, A.: Measurement of precipitation in the Alps using dual-polarization C-band ground-based radars, the GPM spaceborne Ku-band radar, and rain gauges, Remote Sens.-Basel, 9, 1147, https://doi.org/10.3390/rs9111147, 2017. a
Gehring, J., Oertel, A., Vignon, É., Jullien, N., Besic, N., and Berne, A.: Microphysics and dynamics of snowfall associated with a warm conveyor belt over Korea, Atmos. Chem. Phys., 20, 7373–7392, https://doi.org/10.5194/acp-20-7373-2020, 2020. a
Germann, U., Boscacci, M., Gabella, M., and Sartori, M.: Peak performance – radar design for prediction in the Swiss Alps, Meteorol. Technol. Int., 42–45, available at: https://www.meteoschweiz.admin.ch/content/dam/ (last access: 30 March 2021), 2015. a
Grams, C. M., Wernli, H., Boettcher, M., Čampa, J., Corsmeier, U., Jones, S. C., Keller, J. H., Lenz, C.-J., and Wiegand, L.: The key role of diabatic processes in modifying the upper-tropospheric wave guide: a North Atlantic case-study, Q. J. Roy. Meteor. Soc., 137, 2174–2193, 2011. a
Harrold, T. W.: Mechanisms influencing the distribution of precipitation within baroclinic disturbances, Q. J. Roy. Meteor. Soc., 99, 232–251, 1973. a
Hersbach, H., Bell, B., Berrisford, P., Hirahara, S., Horányi, A., Muñoz-Sabater, J., Nicolas, J., Peubey, C., Radu, R., Schepers, D., Simmons, A., Soci, C., Abdalla, S., Abellan, X., Balsamo, G., Bechtold, P., Biavati, G., Bidlot, J., Bonavita, M., De Chiara, G., Dahlgren, P., Dee, D., Diamantakis, M., Dragani, R., Flemming, J., Forbes, R., Fuentes, M., Geer, A., Haimberger, L., Healy, S., Hogan, R. J., Hólm, E., Janisková, M., Keeley, S., Laloyaux, P., Lopez, P., Lupu, C., Radnoti, G., de Rosnay, P., Rozum, I., Vamborg, F., Villaume, S., and Thépaut, J.-N.: The ERA5 global reanalysis, Q. J. Roy. Meteor. Soc., 146, 1999–2049, 2020. a
Hoskins, B. J., McIntyre, M. E., and Robertson, A. W.: On the use and significance of isentropic potential vorticity maps, Q. J. Roy. Meteor. Soc., 111, 877–946, 1985. a
Illingworth, A. J., Hogan, R. J., O'Connor, E., Bouniol, D., Brooks, M. E., Delanoé, J., Donovan, D. P., Eastment, J. D., Gaussiat, N., Goddard, J. W. F., Haeffelin, M., Baltink, H. K., Krasnov, O. A., Pelon, J., Piriou, J.-M., Protat, A., Russchenberg, H. W. J., Seifert, A., Tompkins, A. M., van Zadelhoff, G.-J., Vinit, F., Willén, U., Wilson, D. R., and Wrench, C. L.: Cloudnet: Continuous evaluation of cloud profiles in seven operational models using ground-based observations, B. Am. Meteorol. Soc., 88, 883–898, 2007. a
Isaksen, L., Bonavita, M., Buizza, R., Fisher, M., Haseler, J., Leutbecher, M., and Raynaud, L.: Ensemble of data assimilations at ECMWF, Tech. Rep., European Centre for Medium-Range Weather Forecasts (ECMWF), 45, https://doi.org/10.21957/obke4k60, 2010. a
Joos, H.: Warm Conveyor Belts and their role for cloud radiative forcing in the extratropical storm tracks, J. Climate, 32, 5325–5343, 2019. a
Joos, H. and Forbes, R.: Impact of different IFS microphysics on a warm conveyor belt and the downstream flow evolution, Q. J. Roy. Meteor. Soc., 142, 2727–2739, 2016. a, b
Joos, H. and Wernli, H.: Influence of microphysical processes on the potential vorticity development in a warm conveyor belt: a case-study with the limited-area model COSMO, Q. J. Roy. Meteor. Soc., 138, 407–418, 2012. a, b
Kaufmann, S., Voigt, C., Jeßberger, P., Jurkat, T., Schlager, H., Schwarzenboeck, A., Klingebiel, M., and Thornberry, T.: In situ measurements of ice saturation in young contrails, Geophys. Res. Lett., 41, 702–709, https://doi.org/10.1002/2013GL058276, 2014. a
Kaufmann, S., Voigt, C., Jurkat, T., Thornberry, T., Fahey, D. W., Gao, R.-S., Schlage, R., Schäuble, D., and Zöger, M.: The airborne mass spectrometer AIMS – Part 1: AIMS-H2O for UTLS water vapor measurements, Atmos. Meas. Tech., 9, 939–953, https://doi.org/10.5194/amt-9-939-2016, 2016. a
Kaufmann, S., Voigt, C., Heller, R., Jurkat-Witschas, T., Krämer, M., Rolf, C., Zöger, M., Giez, A., Buchholz, B., Ebert, V., Thornberry, T., and Schumann, U.: Intercomparison of midlatitude tropospheric and lower-stratospheric water vapor measurements and comparison to ECMWF humidity data, Atmos. Chem. Phys., 18, 16729–16745, https://doi.org/10.5194/acp-18-16729-2018, 2018. a
Krämer, M. and Afchine, A.: Sampling characteristics of inlets operated at low UU0 ratios: new insights from computational fluid dynamics (CFX) modeling, J. Aerosol Sci., 35, 683–694, 2004. a
Krämer, M., Rolf, C., Luebke, A., Afchine, A., Spelten, N., Costa, A., Meyer, J., Zöger, M., Smith, J., Herman, R. L., Buchholz, B., Ebert, V., Baumgardner, D., Borrmann, S., Klingebiel, M., and Avallone, L.: A microphysics guide to cirrus clouds – Part 1: Cirrus types, Atmos. Chem. Phys., 16, 3463–3483, https://doi.org/10.5194/acp-16-3463-2016, 2016. a
Luebke, A. E., Afchine, A., Costa, A., Grooß, J.-U., Meyer, J., Rolf, C., Spelten, N., Avallone, L. M., Baumgardner, D., and Krämer, M.: The origin of midlatitude ice clouds and the resulting influence on their microphysical properties, Atmos. Chem. Phys., 16, 5793–5809, https://doi.org/10.5194/acp-16-5793-2016, 2016. a
Madonna, E., Limbach, S., Aebi, C., Joos, H., Wernli, H., and Martius, O.: On the co-occurrence of warm conveyor belt outflows and PV streamers, J. Atmos. Sci., 71, 3668–3673, 2014a. a
Madonna, E., Wernli, H., Joos, H., and Martius, O.: Warm conveyor belts in the ERA-Interim dataset (1979–2010) – Part I: Climatology and potential vorticity evolution, J. Climate, 27, 3–26, 2014b. a, b, c, d
Martínez-Alvarado, O., Madonna, E., Gray, S. L., and Joos, H.: A route to systematic error in forecasts of Rossby waves, Q. J. Roy. Meteor. Soc., 142, 196–210, 2016. a
Massacand, A. C., Wernli, H., and Davies, H. C.: Influence of upstream diabatic heating upon an Alpine event of heavy precipitation, Mon. Weather Rev., 129, 2822–2828, 2001. a
Methven, J., Arnold, S. R., Stohl, A., Evans, M. J., Avery, M., Law, K., Lewis, A. C., Monks, P. S., Parrish, D. D., Reeves, C. E., Schlager, H., Atlas, E., Blake, D. R., Coe, H., Crosier, J., Flocke, F. M., Holloway, J. S., Hopkins, J. R., McQuaid, J., Purvis, R., Rappenglück, B., Singh, H. B., Watson, N. M., Whalley, L. K., and Williams, P. I.: Establishing Lagrangian connections between observations within air masses crossing the Atlantic during the International Consortium for Atmospheric Research on Transport and Transformation experiment, J. Geophys. Res., 111, D23, https://doi.org/10.1029/2006JD007540, 2006. a, b, c, d
Muhlbauer, A., Ackerman, T. P., Comstock, J. M., Diskin, G. S., Evans, S. M., Lawson, R. P., and Marchand, R. T.: Impact of large-scale dynamics on the microphysical properties of midlatitude cirrus, J. Geophys. Res., 119, 3976–3996, https://doi.org/10.1002/2013JD020035, 2014. a
Neiman, P. J., Shapiro, M. A., and Fedor, L. S.: The life cycle of an extratropical marine cyclone – Part II: Mesoscale structure and diagnostics, Mon. Weather Rev., 121, 2177–2199, 1993. a
Nodop, K., Connolly, R., and Girardi, F.: The field campaigns of the European Tracer Experiment (ETEX): overview and results, Atmos. Environ., 32, 4095–4108, 1998. a
Oertel, A., Boettcher, M., Joos, H., Sprenger, M., Konow, H., Hagen, M., and Wernli, H.: Convective activity in an extratropical cyclone and its warm conveyor belt – a case-study combining observations and a convection-permitting model simulation, Q. J. Roy. Meteor. Soc., 145, 1406–1426, 2019. a, b, c
Oertel, A., Boettcher, M., Joos, H., Sprenger, M., and Wernli, H.: Potential vorticity structure of embedded convection in a warm conveyor belt and its relevance for large-scale dynamics, Weather Clim. Dynam., 1, 127–153, https://doi.org/10.5194/wcd-1-127-2020, 2020. a, b
Oertel, A., Sprenger, M., Joos, H., Boettcher, M., Konow, H., Hagen, M., and Wernli, H.: Observations and simulation of intense convection embedded in a warm conveyor belt – how ambient vertical wind shear determines the dynamical impact, Weather Clim. Dynam., 2, 89–110, https://doi.org/10.5194/wcd-2-89-2021, 2021. a
Pfahl, S., Madonna, E., Boettcher, M., Joos, H., and Wernli, H.: Warm conveyor belts in the ERA-Interim dataset (1979–2010) – Part II: Moisture origin and relevance for precipitation, J. Climate, 27, 27–40, 2014. a, b, c, d, e
Purvis, R. M., Lewis, A. C., Carney, R. A., McQuaid, J. B., Arnold, S. R., Methven, J., Barjat, H., Dewey, K., Kent, J., Monks, P. S., Carpenter, L. J., Brough, N., Penkett, S. A., and Reeves, C. E.: Rapid uplift of nonmethane hydrocarbons in a cold front over central Europe, J. Geophys. Res.-Atmos., 108, 4224, https://doi.org/10.1029/2002JD002521, 2003. a
Rainaud, R., Lebeaupin Brossier, C., Ducrocq, V., Giordani, H., Nuret, M., Fourrié, N., Bouin, M.-N., Taupier-Letage, I., and Legain, D.: Characterization of air-sea exchanges over the Western Mediterranean Sea during HyMeX SOP1 using the AROME-WMED model, Q. J. Roy. Meteor. Soc., 142, 173–187, 2016. a
Rautenhaus, M., Grams, C. M., Schäfler, A., and Westermann, R.: Three-dimensional visualization of ensemble weather forecasts – Part 2: Forecasting warm conveyor belt situations for aircraft-based field campaigns, Geosci. Model Dev., 8, 2355–2377, https://doi.org/10.5194/gmd-8-2355-2015, 2015. a
Ren, Y., Schlager, H., and Martin, D.: The application of TD/GC/NICI-MS with an Al2O3-PLOT-S column for the determination of perfluoroalkylcycloalkanes in the atmosphere, Chromatographia, 77, 309–316, https://doi.org/10.1007/s10337-013-2584-6, 2014. a
Ren, Y., Baumann, R., and Schlager, H.: An airborne perfluorocarbon tracer system and its first application for a Lagrangian experiment, Atmos. Meas. Tech., 8, 69–80, https://doi.org/10.5194/amt-8-69-2015, 2015. a, b
Rex, M., von der Gathen, P., Harris, N. R. P., Lucic, D., Knudsen, B. M., Braathen, G. O., Reid, S. J., De Backer, H., Claude, H., Fabian, R., Fast, H., Gil, M., Kyrö, E., Mikkelsen, I. S., Rummukainen, M., Smit, H. G., Stähelin, J., Varotsos, C., and Zaitcev, I.: In situ measurements of stratospheric ozone depletion rates in the Arctic winter 1991/1992: A Lagrangian approach, J. Geophys. Res., 103, 5843–5853, https://doi.org/10.1029/97JD03127, 1998. a
Rodwell, M., Forbes, R., and Wernli, H.: Why warm conveyor belts matter in NWP, European Centre for Medium-Range Weather Forecasts (ECMWF) newsletter, 154, 21–28, available at: https://www.ecmwf.int/node/18203 (last access: 30 March 2021), 2018. a, b, c, d
Schäfler, A. and Harnisch, F.: Impact of the inflow moisture on the evolution of a warm conveyor belt, Q. J. Roy. Meteor. Soc., 141, 299–310, 2015. a, b
Schäfler, A., Dörnbrack, A., Wernli, H., Kiemle, C., and Pfahl, S.: Airborne lidar observations in the inflow region of a warm conveyor belt, Q. J. Roy. Meteor. Soc., 137, 1257–1272, 2011. a, b
Schäfler, A., Boettcher, M., Grams, C. M., Rautenhaus, M., Sodemann, H., and Wernli, H.: Planning aircraft measurements within a warm conveyor belt, Weather, 69, 161–166, 2014. a, b, c, d, e, f, g
Schäfler, A., Craig, C., Wernli, H., Arbogast, P., Doyle, J. D., McTaggart-Cowan, R., Methven, J., Rivière, G., Ament, F., Boettcher, M., Bramberger, M., Cazenave, Q., Cotton, R., Crewell, S., Delanoë, J., Dörnbrack, A., Ehrlich, A., Ewald, F., Fix, A., Grams, C. M., Gray, . S. L., Grob, H., Groß, S., Hagen, M., Harvey, B., Hirsch, L., Jacob, M., Kölling, T., Konow, H., Lemmerz, C., Lux, O., Magnusson, L., Mayer, B., Mech, M., Moore, R., Pelon, J., Quinting, J., Rahm, S., Rapp, M., Rautenhaus, M., Reitebuch, O., Reynolds, C. A., Sodemann, H., Spengler, T., Vaughan, G., Wendisch, M., Wirth, M., Witschas, B., Wolf, K., and Zinner, T.: The North Atlantic Waveguide and Downstream Impact Experiment, B. Am. Meteorol. Soc., 99, 1607–1637, 2018. a
Schemm, S., Wernli, H., and Papritz, L.: Warm conveyor belts in idealized moist baroclinic wave simulations, J. Atmos. Sci., 70, 627–652, 2013. a
Sigg, R. and Svensson, G.: Three-dimensional simulation of the ASTEX Lagrangian 1 field experiment with a regional numerical weather prediction model, Q. J. Roy. Meteor. Soc., 130, 707–724, 2004. a
Sinclair, V. A., Gray, S. L., and Belcher, S. E.: Boundary-layer ventilation by baroclinic life cycles, Q. J. Roy. Meteor. Soc., 134, 1409–1424, 2008. a
Spreitzer, E.: Diabatic processes in mid-latitude weather systems – a study with the ECMWF model, Ph.D. thesis, ETH Zurich, Zurich, Switzerland, 2020. a
Sprenger, M. and Wernli, H.: The LAGRANTO Lagrangian analysis tool – version 2.0, Geosci. Model Dev., 8, 2569–2586, https://doi.org/10.5194/gmd-8-2569-2015, 2015. a
Stoelinga, M. T.: A potential vorticity-based study of the role of diabatic heating and friction in a numerically simulated baroclinic byclone, Mon. Weather Rev., 124, 849–874, 1996. a
Stohl, A., Forster, C., Eckhardt, S., Spichtinger, N., Huntrieser, H., Heland, J., Schlager, H., Wilhelm, S., Arnold, F., and Cooper, O.: A backward modeling study of intercontinental pollution transport using aircraft measurements, J. Geophys. Res., 108, D12, https://doi.org/10.1029/2002JD002862, 2003. a
Van Dop, H., Addis, R., Fraser, G., Girardi, F., Graziani, G., Inoue, Y., Kelly, N., Klug, W., Kulmala, A., Nodop, K., and Pretel, J.: ETEX: A European tracer experiment, observations, dispersion modelling and emergency response, Atmos. Environ., 32, 4089–4094, 1998. a
Voigt, C., Jessberger, P., Jurkat, T., Kaufmann, S., Baumann, R., Schlager, H., Bobrowski, N., Giuffrida, G., and Salerno, G.: Evolution of CO2, SO2, HCl, and HNO3 in the volcanic plumes from Etna, Geophys. Res. Lett., 41, 2196–2203, https://doi.org/10.1002/2013GL058974, 2014. a
Voigt, C., Schumann, U., Minikin, A., Abdelmonem, A., Afchine, A., Borrmann, S., Boettcher, M., Buchholz, B., Bugliaro, L., Costa, A., Curtius, J., Dollner, M., Dörnbrack, A., Dreiling, V., Ebert, V., Ehrlich, A., Fix, A., Forster, L., Frank, F., Fütterer, D., Giez, A., Graf, K., Grooß, J.-U., Groß, S., Heimerl, K., Heinold, B., Hüneke, T., Järvinen, E., Jurkat, T., Kaufmann, S., Kenntner, M., Klingebiel, M., Klimach, T., Kohl, R., Krämer, M., Krisna, T. C., Luebke, A., Mayer, B., Mertes, S., Molleker, S., Petzold, A., Pfeilsticker, K., Port, M., Rapp, M., Reutter, P., Rolf, C., Rose, D., Sauer, D., Schäfler, A., Schlage, R., Schnaiter, M., Schneider, J., Spelten, N., Spichtinger, P., Stock, P., Walser, A., Weigel, R., Weinzierl, B., Wendisch, M., Werner, F., Wernli, H., Wirth, M., Zahn, A., Ziereis, H., and Zöger, M.: ML-CIRRUS: The airborne experiment on natural cirrus and contrail cirrus with the high-altitude long-range research aircraft HALO, B. Am. Meteorol. Soc., 98, 271–288, 2017. a, b
Watson, T. B., Wilke, R., Dietz, R., Heiser, J., and Kalb, P.: The atmospheric background of perfluorocarbon compounds used as tracers, Environ. Sci. Technol., 41, 6909–6913, 2007. a
Wernli, H.: A Lagrangian-based analysis of extratropical cyclones – II: A detailed case-study, Q. J. Roy. Meteor. Soc., 123, 1677–1706, 1997. a, b
Wernli, H. and Davies, H. C.: A Lagrangian-based analysis of extratropical cyclones – I: The method and some applications, Q. J. Roy. Meteor. Soc., 123, 467–489, 1997. a, b, c, d
Wernli, H., Boettcher, M., Joos, H., Miltenberger, A. K., and Spichtinger, P.: A trajectory-based classification of ERA-Interim ice clouds in the region of the North Atlantic storm track, Geophys. Res. Lett., 43, 6657–6664, https://doi.org/10.1002/2016GL068922, 2016. a
Winschall, A., Pfahl, S., Sodemann, H., and Wernli, H.: Impact of North Atlantic evaporation hot spots on southern Alpine heavy precipitation events, Q. J. Roy. Meteor. Soc., 138, 1245–1258, 2012. a
Young, M. V., Monk, G. A., and Browning, K. A.: Interpretation of satellite imagery of a rapidly deepening cyclone, Q. J. Roy. Meteor. Soc., 113, 1089–1115, 1987. a
Information obtained at https://www.dlr.de/fb/en/desktopdefault.aspx/tabid-3718/5796_read-8410/, last access: 19 June 2020.