the Creative Commons Attribution 4.0 License.
the Creative Commons Attribution 4.0 License.
 | 06 Apr 2021
Evaluation of the LOTOS-EUROS NO2 simulations using ground-based measurements and S5P/TROPOMI observations over Greece
Maria-Elissavet Koukouli
Astrid Manders
Arjo Segers
Dimitris Karagkiozidis
Myrto Gratsea
Dimitris Balis
Alkiviadis Bais
Evangelos Gerasopoulos
Trisevgeni Stavrakou
Jos van Geffen
Henk Eskes
Andreas Richter
The evaluation of chemical transport models, CTMs, is essential for the assessment of their performance regarding the physical and chemical parameterizations used. While regional CTMs have been widely used and evaluated over Europe, their validation over Greece is limited. In this study, we investigate the performance of the Long Term Ozone Simulation European Operational Smog (LOTOS-EUROS) v2.2.001 regional chemical transport model in simulating nitrogen dioxide, NO2, over Greece from June to December 2018. In situ NO2 measurements obtained from 14 stations of the National Air Pollution Monitoring Network are compared with surface simulations over the two major cities of Greece, Athens and Thessaloniki. Overall the LOTOS-EUROS NO2 surface simulations compare very well to the in situ measurements showing a mild underestimation of the measurements with a mean relative bias of %, a high spatial correlation coefficient of 0.86 and an average temporal correlation of 0.52. The CTM underestimates the NO2 surface concentrations during daytime by ± 15 %, while it slightly overestimates during night-time ∼ 10 ± 35 %. Furthermore, the LOTOS-EUROS tropospheric NO2 columns are evaluated against ground-based multi-axis differential optical absorption spectroscopy (MAX-DOAS) NO2 measurements in Athens and Thessaloniki. We report that the CTM tropospheric NO2 column simulations over both urban and rural locations represent the diurnal patterns and hourly levels for both summer and winter seasons satisfactorily. The relative biases range between ∼ −2 % and −35 %, depending on season and relative NO2 load observed. Finally, the CTM was assessed also against space-borne Sentinel-5 Precursor (S5P) carrying the Tropospheric Monitoring Instrument (TROPOMI) tropospheric NO2 observations. We conclude that LOTOS-EUROS simulates extremely well the tropospheric NO2 patterns over the region with very high spatial correlation of 0.82 on average, ranging between 0.66 and 0.95, with negative biases in the summer and positive in the winter. Updated emissions for the simulations and model improvements when extreme values of boundary layer height are encountered are further suggested.
- Article
(7120 KB) - Full-text XML
-
Supplement
(2365 KB) - BibTeX
- EndNote


Nitrogen oxides (NO) adversely affect human health, the environment and the ecosystems. Exposure to NO2 is linked with high mortality rates and premature deaths (Crouse et al., 2015). NO2 dominates the formation of ozone and inorganic aerosols in the troposphere (Seinfeld and Pandis, 1998) with detrimental effects on the climate and human health. The deposition of nitrogen leads to eutrophication and acidification (Bouwman et al., 2002). While NOx sources can be either natural (soils, wildfires and lightning) or anthropogenic (fossil fuel combustion, industrial emissions, and emissions from road and non-road transport) (Miyazaki et al., 2017), it is estimated that human activities are responsible for 65 % of the global annual NOx flux (Müller and Stavrakou, 2005).
Chemical transport models, CTMs, play an important role in air pollution assessment by providing interpretation and forecasting on air quality, based on emission inventories and atmospheric processes. CTMs are widely used serving distinct purposes, for instance the study of regional air quality or transboundary pollution (Terrenoire et al., 2015) and the estimation of updated emissions (Müller and Stavrakou, 2005). The evaluation of CTMs is critical in order to assess the quality of the model predictions. This is achieved by comparing the model with different measurement datasets, including ground-based in situ measurements of pollutants (Verstraeten et al., 2018) and space-borne observations (Huijnen et al., 2010).
To date, most European air quality modelling studies have focused on western and central European countries, while very few research efforts addressed Eastern Europe. Greece is located in south-eastern Europe, at the tip of the Balkan Peninsula, bordering the east Mediterranean Sea. Athens is the largest city in Greece and belongs to the administrative division of Attica that has around 3.8 million of inhabitants (EL.STAT, 2012). Air pollution in Athens is caused by the combination of high anthropogenic emissions in this densely populated area (Pateraki et al., 2013) and the particular meteorological conditions characterized by strong winter temperature inversions and sea breeze circulation in the summer (Kallos et al., 1993). Furthermore, the city is surrounded by mountains in the north (Parnitha, Penteli), east (Hymettos) and west (Egaleo), and the Saronic Gulf in the south limits the dispersion of air masses above the basin (Grivas et al., 2008); see Fig. 1, left. Major NOx emission sources in the area are the large number of vehicles in circulation, the industrial area of Thriassion Plain to the west of the basin and the Mesogia Plain to the east (Fameli and Assimakopoulos, 2016), shipping, and aviation. The largest airport in Greece, Athens International Airport Eleftherios Venizelos (airport), is also situated in the east of the basin and also forms a local source of NOx emissions (Koulidis et al., 2020). Furthermore, the city of Piraeus in the south hosts one of the largest freight and passenger ports in Europe (Fameli and Assimakopoulos, 2016).
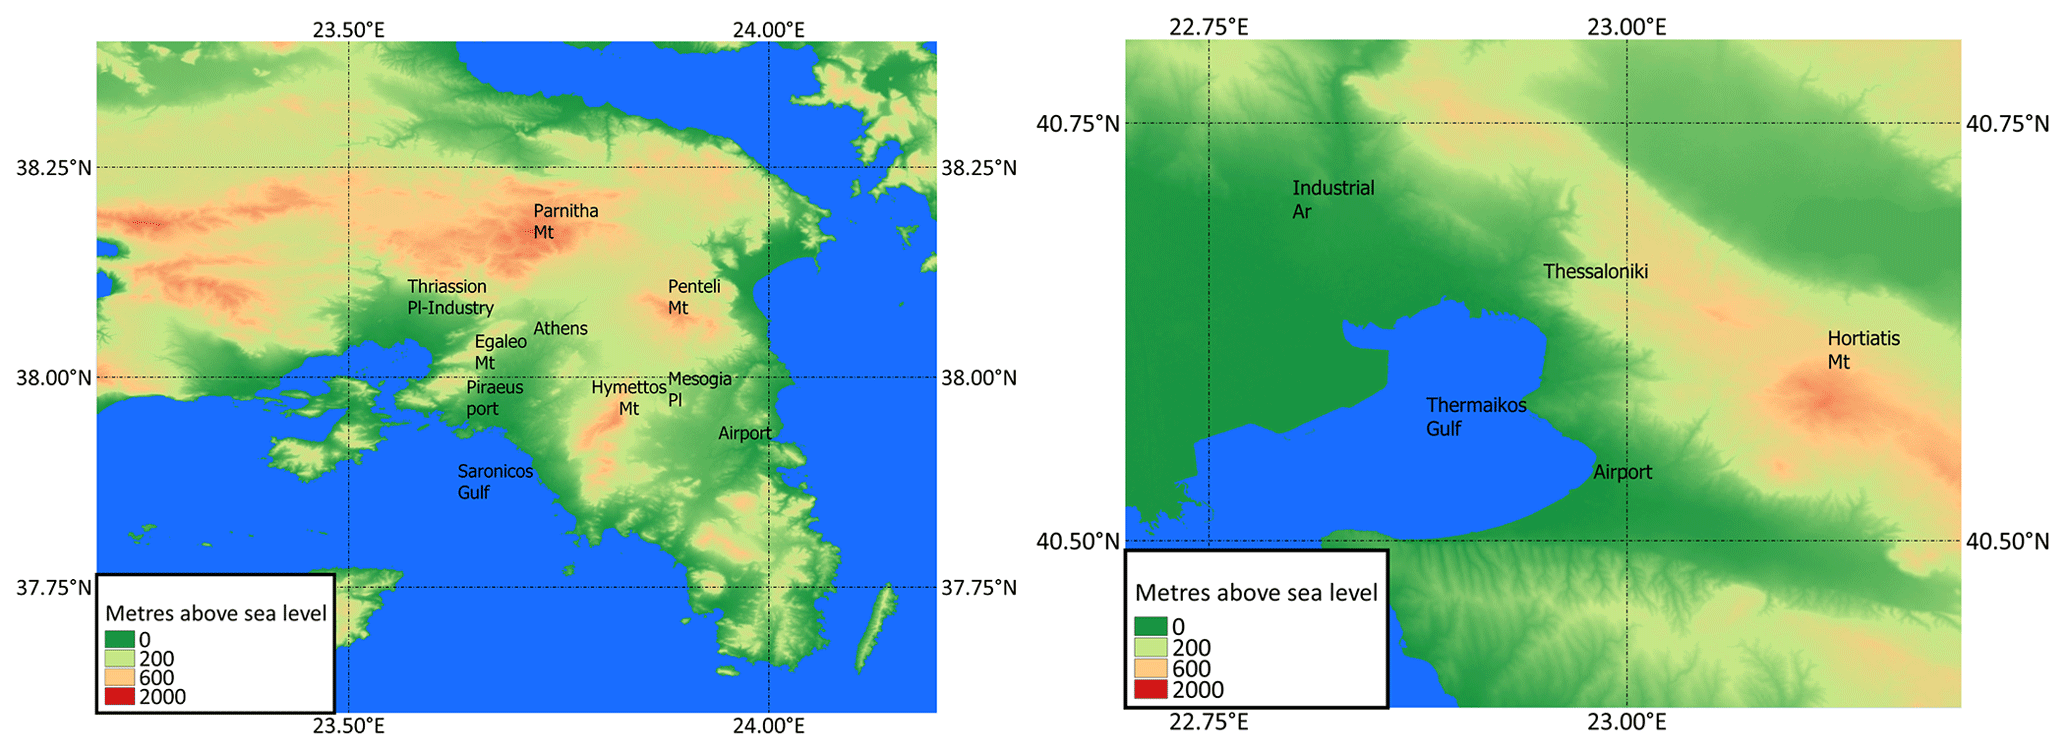
Figure 1The topographic features that affect air pollution as well as the areas of known NOx sources in Athens (left) and Thessaloniki (right); Mt refers to mountain, Pl to plain and Ar to area (created using https://land.copernicus.eu/imagery-in-situ/eu-dem/eu-dem-v1.1 (last access: 24 March 2021) and QGIS software).
Thessaloniki is the second largest city of Greece, with more than 1 million inhabitants in the metropolitan area (EL.STAT, 2012), and is situated in the northern part of the country. The topography of Thessaloniki comprises of coastal (the gulf or Thermaic Gulf) and mountainous areas (Mt Hortiatis); see Fig. 1, right. Similarly to Athens, particular meteorological features such as sea and land breeze and valley mountain winds affect the air quality of the city (Moussiopoulos et al., 2009). According to Poupkou et al. (2011), road transport and industrial emissions are the two main sources of NOx emissions at the greater area of Thessaloniki, while the majority of industrial activity is concentrated in the west and north-west part of the city (industrial area). Furthermore, in the east of the city, the second largest airport of Greece, Macedonia International Airport (airport), is situated.
In this work, the NO2 simulations of the Long Term Ozone Simulation European Operational Smog (LOTOS-EUROS) CTM are evaluated over Greece through detailed comparisons with ground-based measurements and space-borne observations. To our knowledge, the performance of the LOTOS-EUROS model has not been evaluated over Greece before. In situ NO2 surface measurements over Athens and Thessaloniki are obtained for the time period between June and December 2018 and are compared against the surface simulations of the model. The availability of the measurements before June is sparse, and so the study is conducted for the period between June and December. Additionally, NO2 tropospheric columns simulated by the model are compared with NO2 columns retrieved from multi-axis differential optical absorption spectroscopy (MAX-DOAS) systems as well as satellite retrievals from the Sentinel-5 Precursor (S5P) carrying the Tropospheric Monitoring Instrument (TROPOMI) in Athens and Thessaloniki. This study is structured as follows: in Sect. 2.1 the model and the adopted setup are described, and in Sect. 2.2 and 2.3 the datasets used for the evaluation are presented. In Sect. 3 we discuss the comparisons of the simulations with the aforementioned datasets. In Sect. 3.1 the simulations are compared against in situ measurements, Sect. 3.2 presents the results of the MAX-DOAS and LOTOS-EUROS column comparisons, and in Sect. 3.3 the S5P/TROPOMI retrievals are used to further evaluate the NO2 simulated columns. A short summary of all comparisons is given in Sect. 3.4 with conclusions being presented in Sect. 4.
The performance of the LOTOS-EUROS model is studied over Greece and its surrounding neighbouring countries, as well as in more detail around the two largest cities in Greece, namely Athens (37.9838∘ N, 23.7275∘ E) and Thessaloniki (40.7369∘ N, 22.9202∘ E). For this study Athens refers to the Attica basin, which includes the city of Piraeus and the suburbs, while Thessaloniki refers to the whole metropolitan area of Thessaloniki.
2.1 The LOTOS-EUROS CTM
In this study we used the open-source CTM LOTOS-EUROS v2.2.001 (Manders et al., 2017, https://lotos-euros.tno.nl/, last access: 24 March 2021). The model can simulate distinct components (i.e. oxidants, secondary inorganic aerosols, primary aerosol and heavy metals) in the troposphere (Schaap et al., 2008). It has been extensively used in the past for air quality studies and forecasting. LOTOS-EUROS constitutes one of the state-of-the-art atmospheric chemistry models used by the Copernicus Atmosphere Monitoring Service (CAMS, http://www.copernicus-atmosphere.eu, last access: 24 March 2021) to provide daily forecasts of the main air pollutants (i.e. ozone, NO2 and PM10). With respect to its overall evaluation, a good agreement was reported between NO2 LOTOS-EUROS simulations and MAX-DOAS observations in the Netherlands (Vlemmix et al., 2015). Schaap et al. (2013) used the NO2 model results to study the sensitivity of the retrieved NO2 columns from the OMI/Aura satellite instrument to anthropogenic emissions, pointing out the need of model simulations along with satellite observations in order to assess emission trends. Curier et al. (2014) used NO2 retrieved from OMI and LOTOS-EUROS to determine the NO2 trends from 2005 to 2010 over Europe and found significant decreases in industrialized areas. Simulations by the CTM have recently been used in an effort to quantify the effects of the lockdown due to the COVID-19 pandemic over Greece as observed by S5P/TROPOMI (Koukouli et al., 2021).
In this study we performed two model simulations. The first one, the outer area, includes central and southern Europe (15∘ W to 45∘ E and 30–60∘ N) with a horizontal resolution of 0.25∘ × 0.25∘ for the year 2018 (referred to hereafter as the European domain); see Fig. S1 in the Supplement. The second run consists of an inner area of the coarser European domain and covers the period between June and December of 2018. The smaller domain in this case spans from 33 to 46∘ N and 18 to 29∘ E, with a grid resolution following the resolution of the emission inventory used for our setup (0.1∘ longitude × 0.05∘ latitude), referred to hereafter as the Greek domain. Both simulations were driven by the operational meteorological data from the European Centre for Medium-Range Weather Forecasts (ECMWF) with a horizontal resolution of 7 km × 7 km and a temporal resolution of 1 h for the surface variables and 3 h for the multi-level parameters (Flemming et al., 2009). The 10 vertical levels used for the simulations of the atmospheric components were defined as a coarsening of the meteorological model levels and span the troposphere from the surface to a top around 175 hPa (about 12 km), while they coarsen upward. The model uses a combination of the 137 hybrid sigma-pressure layer ECMWF definition. Depending on the input meteorological data LOTOS-EUROS defines layer interfaces as pressures or heights above the surface. The anthropogenic emission inventory used is the CAMS-REG (CAMS regional European emissions) version 2 for the year 2015 at 0.1∘ × 0.05∘ (Kuenen et al., 2014). Biogenic emissions (isoprene) are calculated online using the meteorology and a detailed land use and tree species database that contains 115 tree species and their biomass density and emission factors for terpene and isoprene, which allows the emission calculation per tree species type. Soil NO emissions are taken from a parameterization depending on soil type and soil temperature (Novak and Pierce, 1993), while NOx production from lightning is not included in the model. The aggregated total NO emissions from anthropogenic and biogenic sources used from June to December 2018 are shown in the left panel of Fig. S2, while the biogenic NO emissions for the same period are shown in the right panel. Biogenic NO emissions constitute 11 % of the total NO emissions in the area as seen in Fig. S2, which shows Greece, southern Albania, the southern Republic of North Macedonia, southern Bulgaria and western Turkey, while in the LOTOS-EUROS model 97 % of the NOx emissions are emitted as NO and the rest as NO2.
The initial and boundary conditions for the European domain are obtained from the Copernicus Atmosphere Monitoring Service (CAMS, https://atmosphere.copernicus.eu/, last access: 24 March 2021). The CAMS global near-real-time (NRT) product is used for the gas and aerosol concentrations with a spatial resolution of 35 km × 35 km and a temporal resolution of 3 h. The initial and boundary conditions used in the case of the Greek domain are provided from the outputs of the coarser European domain, while the top boundary conditions used in both domains are obtained from the CAMS-NRT as well. The gas phase chemistry of the model is described using a modified version of the Carbon Bond Mechanism IV (CBM-IV) scheme (Gery et al., 1989), while the aerosol chemistry is represented by the ISORROPIA II (Fountoukis and Nenes, 2007). More details on the chemistry module of LOTOS-EUROS can be found in Manders et al. (2017). For the biomass burning emissions and wildfires, the Global Fire Assimilation System (GFAS), which assimilates fire radiative power (FRP) observations from satellite-based sensors (Kaiser et al., 2012), is used in the LOTOS-EUROS simulations. In the Greek domain and during the period of study some artificial fires were detected in the GFAS database, while no big wildfires were recorded in the area. As a result the GFAS inventory was not taken into account in the nested simulation.
2.2 Ground-based measurements
In order to validate the NO2 simulations derived from LOTOS-EUROS over Greece we compare model-derived surface concentrations with in situ air quality measurements performed in Athens and Thessaloniki. Furthermore, the simulated NO2 tropospheric columns over the Greek domains are compared against MAX-DOAS NO2 columns, also situated in Athens and Thessaloniki.
2.2.1 In situ NO2 surface measurements
Hourly in situ measurements of NO2 concentrations over Greece were obtained from the National Air Pollution Monitoring Network (http://www.ypeka.gr/, last access: 24 March 2021) from June to December 2018. The aforementioned data are routinely reported to the European Environmental Agency Air Quality database. A chemiluminescence measurement method, which is based on the reaction of ozone with nitric oxide to form excited NO2 (Dunlea et al., 2007), is used for the measurement of nitrogen oxides. The in situ stations in Athens are operated by the Department of Air Quality, while those for Thessaloniki are operated by the regional administrations. The stations used for the evaluation of the model were carefully selected in order to be well distributed and to be representative of the local emission sources. The locations of the stations are given in Fig. 2 for Thessaloniki (top) and Athens (bottom). The marked colours over the stations refer to the average NO2 measured at each station between June and December 2018. We should acknowledge possible representativity errors when comparing the measurements from urban traffic stations with the mean value of a model grid cell (0.1∘ × 0.05∘) (Liu et al., 2018). For this reason, stations characterized as urban traffic stations, localized close to busy traffic roads of the city and showing extremely high concentrations were excluded from the validation, based on local knowledge of their actual locations. As a result, we include in our analysis stations that are officially characterized as “traffic stations” (e.g. Marousi station, Athens) but which are not placed directly over the major thoroughfares. As a result, out of a total of 24 stations reporting to the repository, 5 and 9 stations for the region of Thessaloniki and Athens, respectively, are retained for the model evaluation. When more than one in situ station is located at one grid pixel, their average value is considered; as a result in the case of Thessaloniki the mean values of the urban background stations Malakopi and AUTH are calculated as well as in the case of the urban industrial stations Kordelio and Sindos. Measurements from these stations have been used in the past to investigate the NOx trends in Athens (Mavroidis and Ilia, 2012), to assess the impact of the economic crisis in Greece after 2008 (Vrekoussis et al., 2013) and to reveal how the surface NO2 concentrations are reflected on the OMI/Aura retrieval (Zyrichidou et al., 2013).
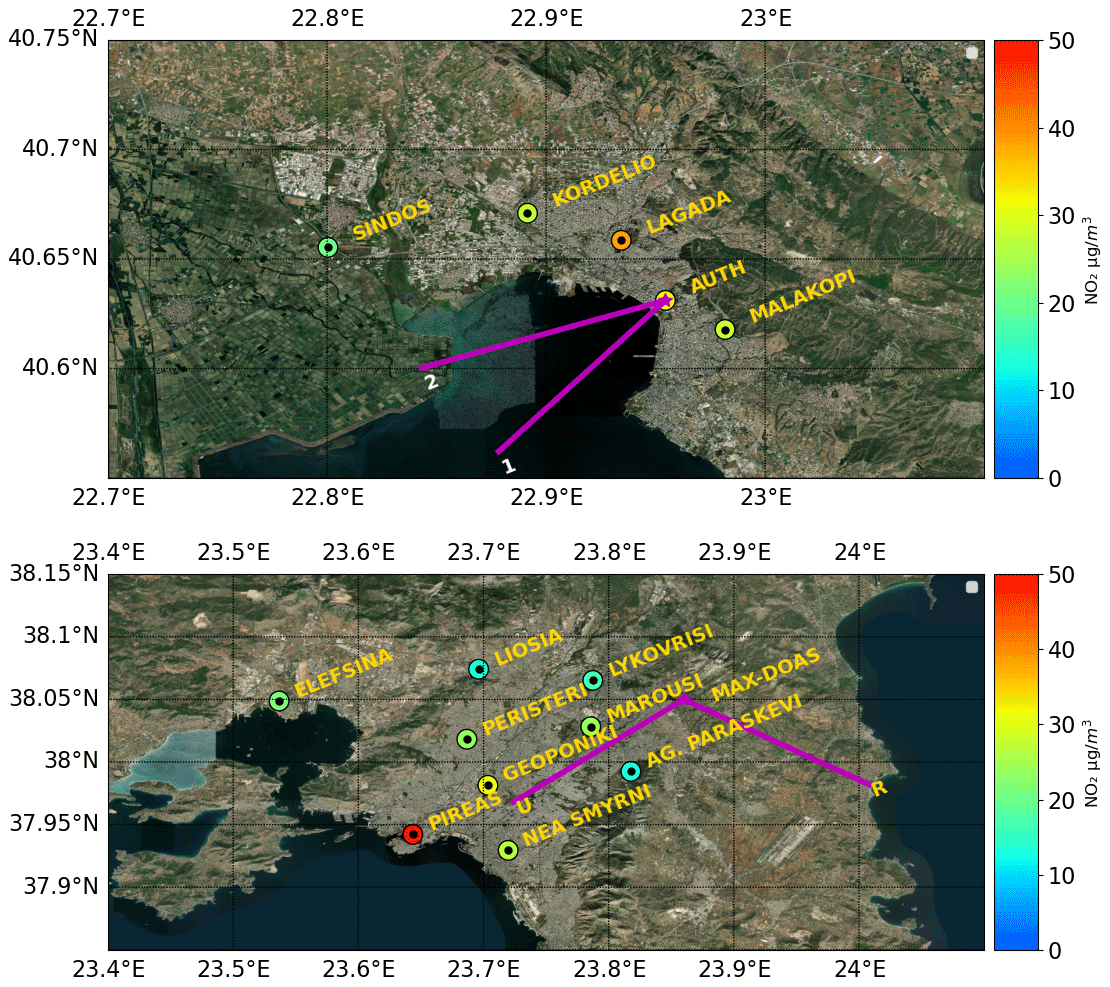
Figure 2In situ air quality measurements in the region of Thessaloniki (top) and the region of Attica (bottom). The points represent the stations, while the colour bar denotes the average NO2 measurements over June–December 2018. The purple lines represent the direction of the MAX-DOAS measurements in the area (created using background from ArcGIS service).
2.2.2 MAX-DOAS tropospheric NO2 measurements
Tropospheric NO2 columnar measurements from multi-axis differential optical absorption spectroscopy (MAX-DOAS) systems located in Thessaloniki and Athens are compared with LOTOS-EUROS-simulated columns for July and December 2018. For the region of Thessaloniki, Phaethon, a miniature spectrometer ground-based MAX-DOAS system, is used. The system was developed in 2006 at the Laboratory of Atmospheric Physics (LAP) in Thessaloniki, Greece (Kouremeti et al., 2008). This system operates regularly on the roof of the Physics Department of the Aristotle University campus which is located in the centre of Thessaloniki (Drosoglou et al., 2017). At the same location, an air quality measuring station, labelled AUTH in Fig. 2, is in operation by the region of central Macedonia. For this study, we used the average value of the two azimuth angles: 220 and 255∘ designated in Fig. 2 by the purple lines 1 and 2, respectively. In these viewing directions the MAX-DOAS system probes air over the centre of the city and the gulf of Thessaloniki, an area which is usually supplied by air from the western part and the industrial area of the city, i.e. directly from the urban environment. During a campaign period, which took place in late autumn to spring, when the height of boundary layer is low, Drosoglou et al. (2017) found that only 2 % of the data exceed the 2 km horizontal distance. Consecutively, in our analysis the simulation grid cell where the MAX-DOAS is situated is considered as the most appropriate to compare with the observations. The average tropospheric columns from the two azimuth angles were calculated since both directions fall into the same grid pixel of the model simulations. The retrievals are based on geometrically approximated air mass factor (AMF) (Wagner et al., 2010). In the study of Drosoglou et al. (2017), the tropospheric NO2 values derived from MAX-DOAS instruments positioned at three different locations around Thessaloniki and the OMI/Aura satellite were compared during a 6-month campaign, showing good agreement over the rural and the suburban areas, with a mean bias of −1.63 and −0.17 molec cm−2 respectively. In Fig. 2 (bottom) the location of the MAX-DOAS instrument used for the comparisons of the NO2 tropospheric column in Athens is marked. The MAX-DOAS instrument is installed in the north-east of Athens, at Penteli mountain (527 m above sea level), and is a scientific instrument that belongs to the BREDOM network (Bremian DOAS network for atmospheric measurements; https://www.iup.uni-bremen.de/doas/, last access: 24 March 2021) (Gratsea et al., 2016). Two azimuthal viewing angles are selected in this case as well, at 120 and at 232.5∘, and are represented by the purple lines in Fig. 2. The first one, marked with “R”, is characterized as a rural unobstructed direction, while the other one is named “U” and views towards an urban direction, and as a result the simulations of the closest grid cells that are in the U and R directions and are representative of urban and rural areas respectively are selected for the comparisons. The horizontal representativeness of the instrument is estimated to be ∼ 2 km, while comparisons with in situ NO2 measurements have shown that areas close to the instrument are better represented, though this premise has not yet been quantified.
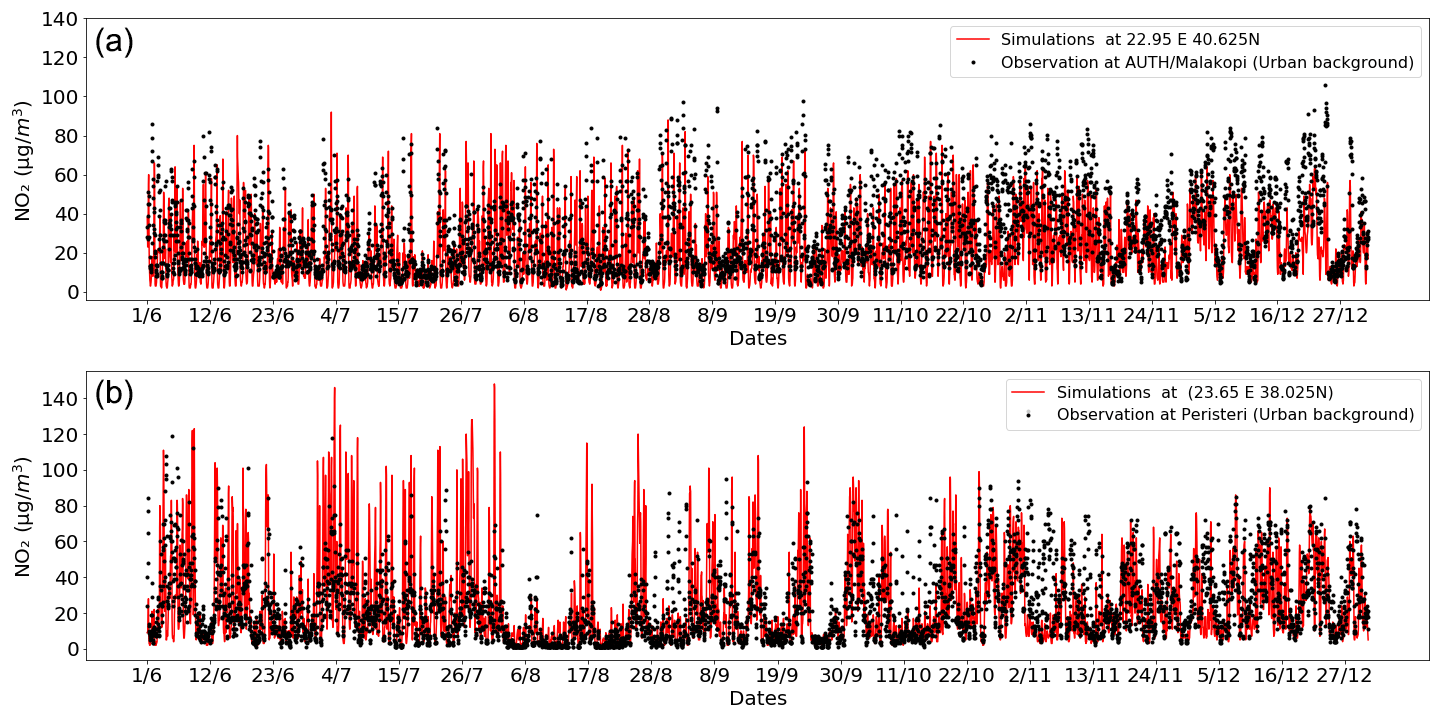
Figure 3Time series of the hourly in situ measurements at two stations (black points) and the simulations of the model in the corresponding pixel (red lines) between June and December 2018. The urban background AUTH/Malakopi stations in Thessaloniki (a) and the urban background Peristeri station in Athens (b) are shown.
The Athens MAX-DOAS tropospheric NO2 vertical columns were derived, as in the case of the Thessaloniki instrument, using the geometric approximation. The evaluation of the magnitude of the differences introduced by using the geometric AMF instead of a full AMF calculation is ongoing for both of these instruments. We mention here the work of Shaiganfar et al. (2011), who reported that tropospheric NO2 columns deviate by approximately ±20 % for NO2 layer heights ≤ 500 m and a moderate aerosol optical depth, when using the geometric approximation instead of a full AMF calculation.
For this study, MAX-DOAS observations at 15∘ elevation angle are analysed in both sites in order to avoid uncertainties introduced due to aerosols at lower elevation angles (Sinreich et al., 2005), to obtain a stronger signal-to-noise ratio and, since this elevation angle probes air closer to location of the emissions, to ensure a stronger signal overall.
2.3 S5P/TROPOMI tropospheric NO2 observations
The Sentinel-5 Precursor, S5P, satellite was launched on 13 October 2017, carrying the TROPOspheric Monitoring Instrument, TROPOMI (Veefkind et al., 2012). The satellite flies in a near-polar, sun-synchronous orbit at an altitude of 824 km with an equatorial crossing at 13:30 local solar time (LST). TROPOMI is a passive, nadir-viewing spectrometer measuring wavelengths between the ultraviolet and the shortwave infrared. The swath width of TROPOMI in the Earth's surface is approximately 2600 km, and the ground pixel of the instrument at nadir is 7×3.5 km2, 5.5×3.5 km2 since August 2019, achieving near-global coverage in 1 d. The wavelength range used for the NO2 column retrieval algorithm is between 405 and 465 nm, while detailed information on the algorithm and the data can be found in the TROPOMI NO2 Algorithm Theoretical Basis Document (van Geffen et al., 2019, 2020). The data are constantly validated by the Mission Performance Center Validation Data Analysis Facility, VDAF, http://mpc-vdaf.tropomi.eu/ (last access: 24 March 2021), as well as through several TROPOMI NO2 validation papers that have been recently submitted (for e.g. Ialongo et al., 2020; Judd et al., 2020; Verhoelst et al., 2021; Zhao et al., 2020). Compared with globally deployed ground-based remote sensing MAX-DOAS instruments, the TROPOMI tropospheric NO2 shows on average 30 % lower levels (S5P MPC Routine Operations Consolidated Validation Report #9, 2020). The report demonstrates the high correlation of the TROPOMI tropospheric NO2 with the independent observations and a nearly linear scaling of the error with the tropospheric column amount. Part of the reported bias is attributed to retrieval inputs, in particular cloud pressure retrievals and the surface albedo used as well as the a priori NO2 profile, which is available globally at a resolution of 1×1∘. This resolution is not high enough to resolve the NO2 profiles near point sources and over cities. As a result the tropospheric column is often underestimated at the hotspots (and somewhat underestimated in rural regions). Note however that because the averaging kernels are used in our case, discussed further below, the comparison of TROPOMI observations with LOTOS-EUROS is not influenced by the retrieval a priori and as a result is independent of the a priori profile shapes of TM5-MP (Eskes and Boersma, 2003). Therefore, we expect a TROPOMI low bias of the order of 10 %–20 % to remain, influencing the comparisons.
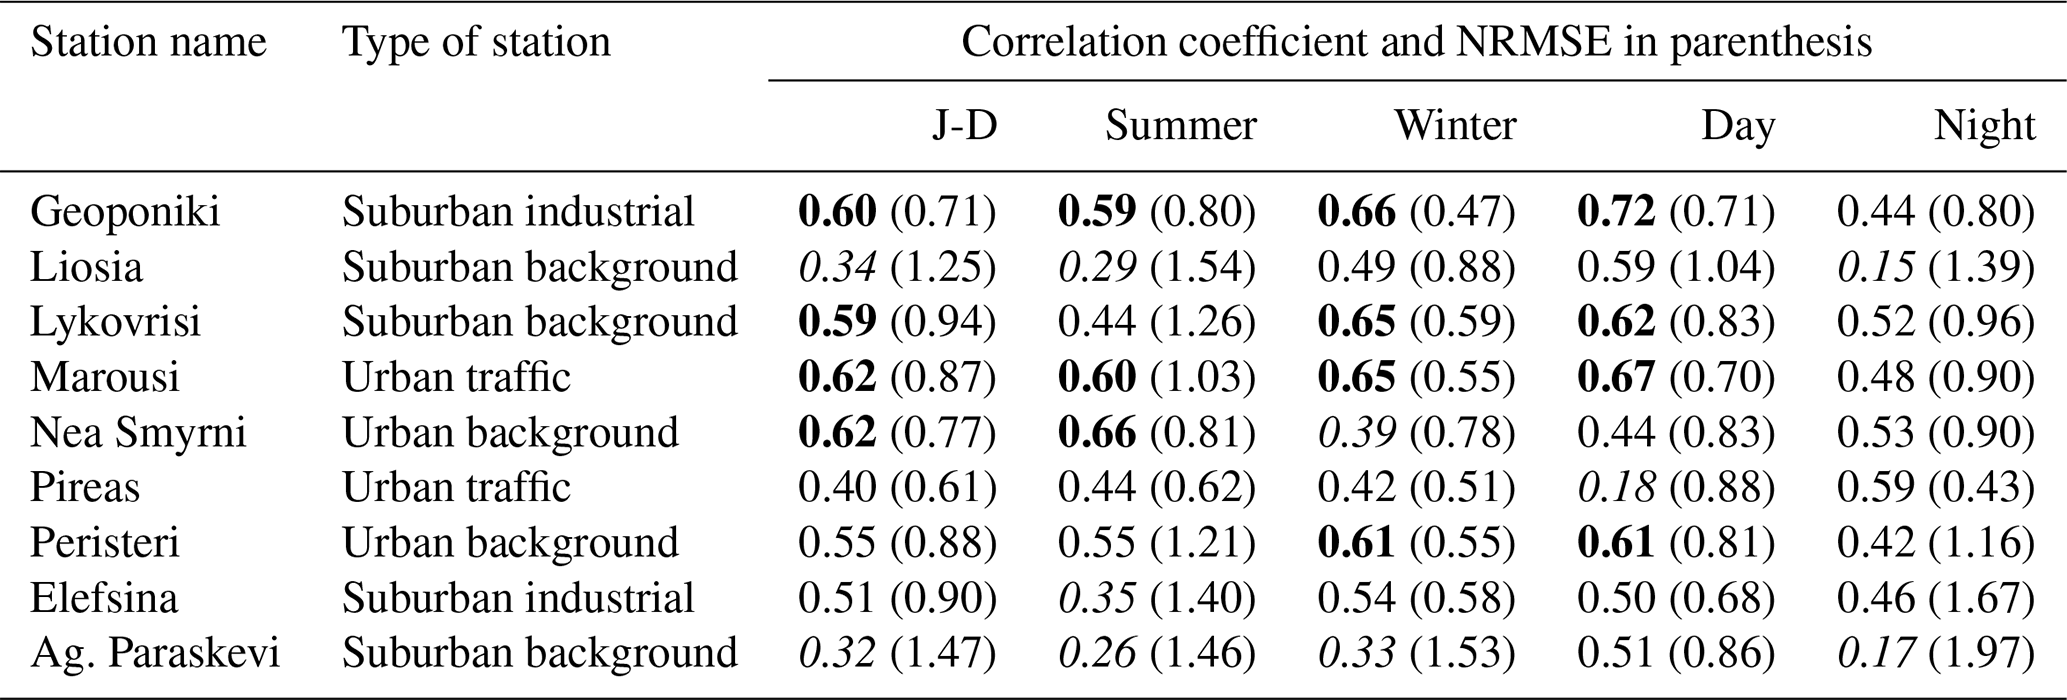
Table 1Correlations and normalized root mean square error (NRMSE) values (in parenthesis) between the NO2 surface observations at the in situ stations in Thessaloniki and the surface concentrations calculated at the corresponding model grid cell. Correlations higher than 0.6 are marked in bold, while the correlations lower than 0.4 are marked in italic. All correlation coefficients are statistically significant at the 95 % level.

Table 2As Table 1 but for air quality stations in Athens. All correlation coefficients are statistically significant at the 95 % level.
In this study we used the reprocessed daily TROPOMI data, RPRO, version 01.02.02 TROPOMI for July and the offline data, OFFL, for December 2018, which can be obtained via the Copernicus Open Data Access Hub (https://s5phub.copernicus.eu/, last access: 24 March 2021). The data are filtered with a quality assurance value qa_value>0.75, ensuring mostly cloud-free observations, and gridded onto the LOTOS-EUROS grid at 0.1∘ × 0.05∘ using a module that converts the TROPOMI data into a format suitable for LOTOS-EUROS to process. The TROPOMI tropospheric vertical column is compared with the simulated NO2 column derived from the LOTOS-EUROS after the averaging kernel of the TROPOMI vertical columns is applied to the simulations in order to ensure a consistent comparison between the modelled and measured columns (Eskes and Boersma, 2003). The TROPOMI averaging kernels are applied onto the LOTOS-EUROS profiles using an online module of LOTOS-EUROS. After regridding the TROPOMI data onto LOTOS-EUROS gridding, the module maps the model profile to the retrieval a priori layers, while in order to cover the atmosphere above the model's vertical levels boundary conditions are added from the CAMS NRT product. The averaging kernels are applied to the simulations made at the closest time of the observations. The entire process is fully automated within the LOTOS-EUROS post-processing analysis tools.
3.1 LOTOS-EUROS and in situ measurements
In the following, we compare the hourly modelled surface NO2 concentrations from the lowest layer of the simulations with hourly in situ measurements. As example of this process, we present time series of hourly NO2 concentrations at the urban background representative stations AUTH/Malakopi in Thessaloniki (upper) and Peristeri in Athens (lower) panels of Fig. 3, where the simulations are shown in red and the in situ observations in black for the period June to December 2018. For both stations, the LOTOS-EUROS simulations follow the diurnal patterns, as well as general patterns, revealed by the measurements satisfactorily. During some periods the CTM NO2 simulations are low compared to the measurements, and this in most cases coincides with a daytime underestimation of the model, discussed further later on (see Fig. 4). This occurs, for instance, at the AUTH/Malakopi station (upper panel) during the period of 1 June to 15 July and at the Peristeri station in early June. On the other hand, there are some days for which much higher NO2 levels are simulated than observed, mainly during night-time, as seen for example during July at the Peristeri station (lower panel).
Tables 1 and 2 summarize the direct comparisons of LOTOS-EUROS NO2 surface concentrations to NO2 concentrations measured at five stations in Thessaloniki and nine in Athens, respectively. The stations are characterized by their official designated type – namely, traffic, urban background, urban industrial, suburban background and suburban industrial. The correlation coefficients based on the hourly values are calculated for five different time periods: the whole period from June to December 2018, the winter period where measurements from December are only taken into account, the summer period that includes July, the day period that includes only the daytime data between 12:00 and 15:00 local time during the whole period, and finally the night period that refers only to the hours between 00:00 and 03:00 local time during the whole period. The distinct periods are selected in order to study the seasonal (summer and winter) and diurnal (day and night) performance of the model when different parameters may affect the simulations. The comparisons are made only for collocated measurements, while the correlation coefficients are found to be statistically significant (p<0.05) for all stations and temporal choices.
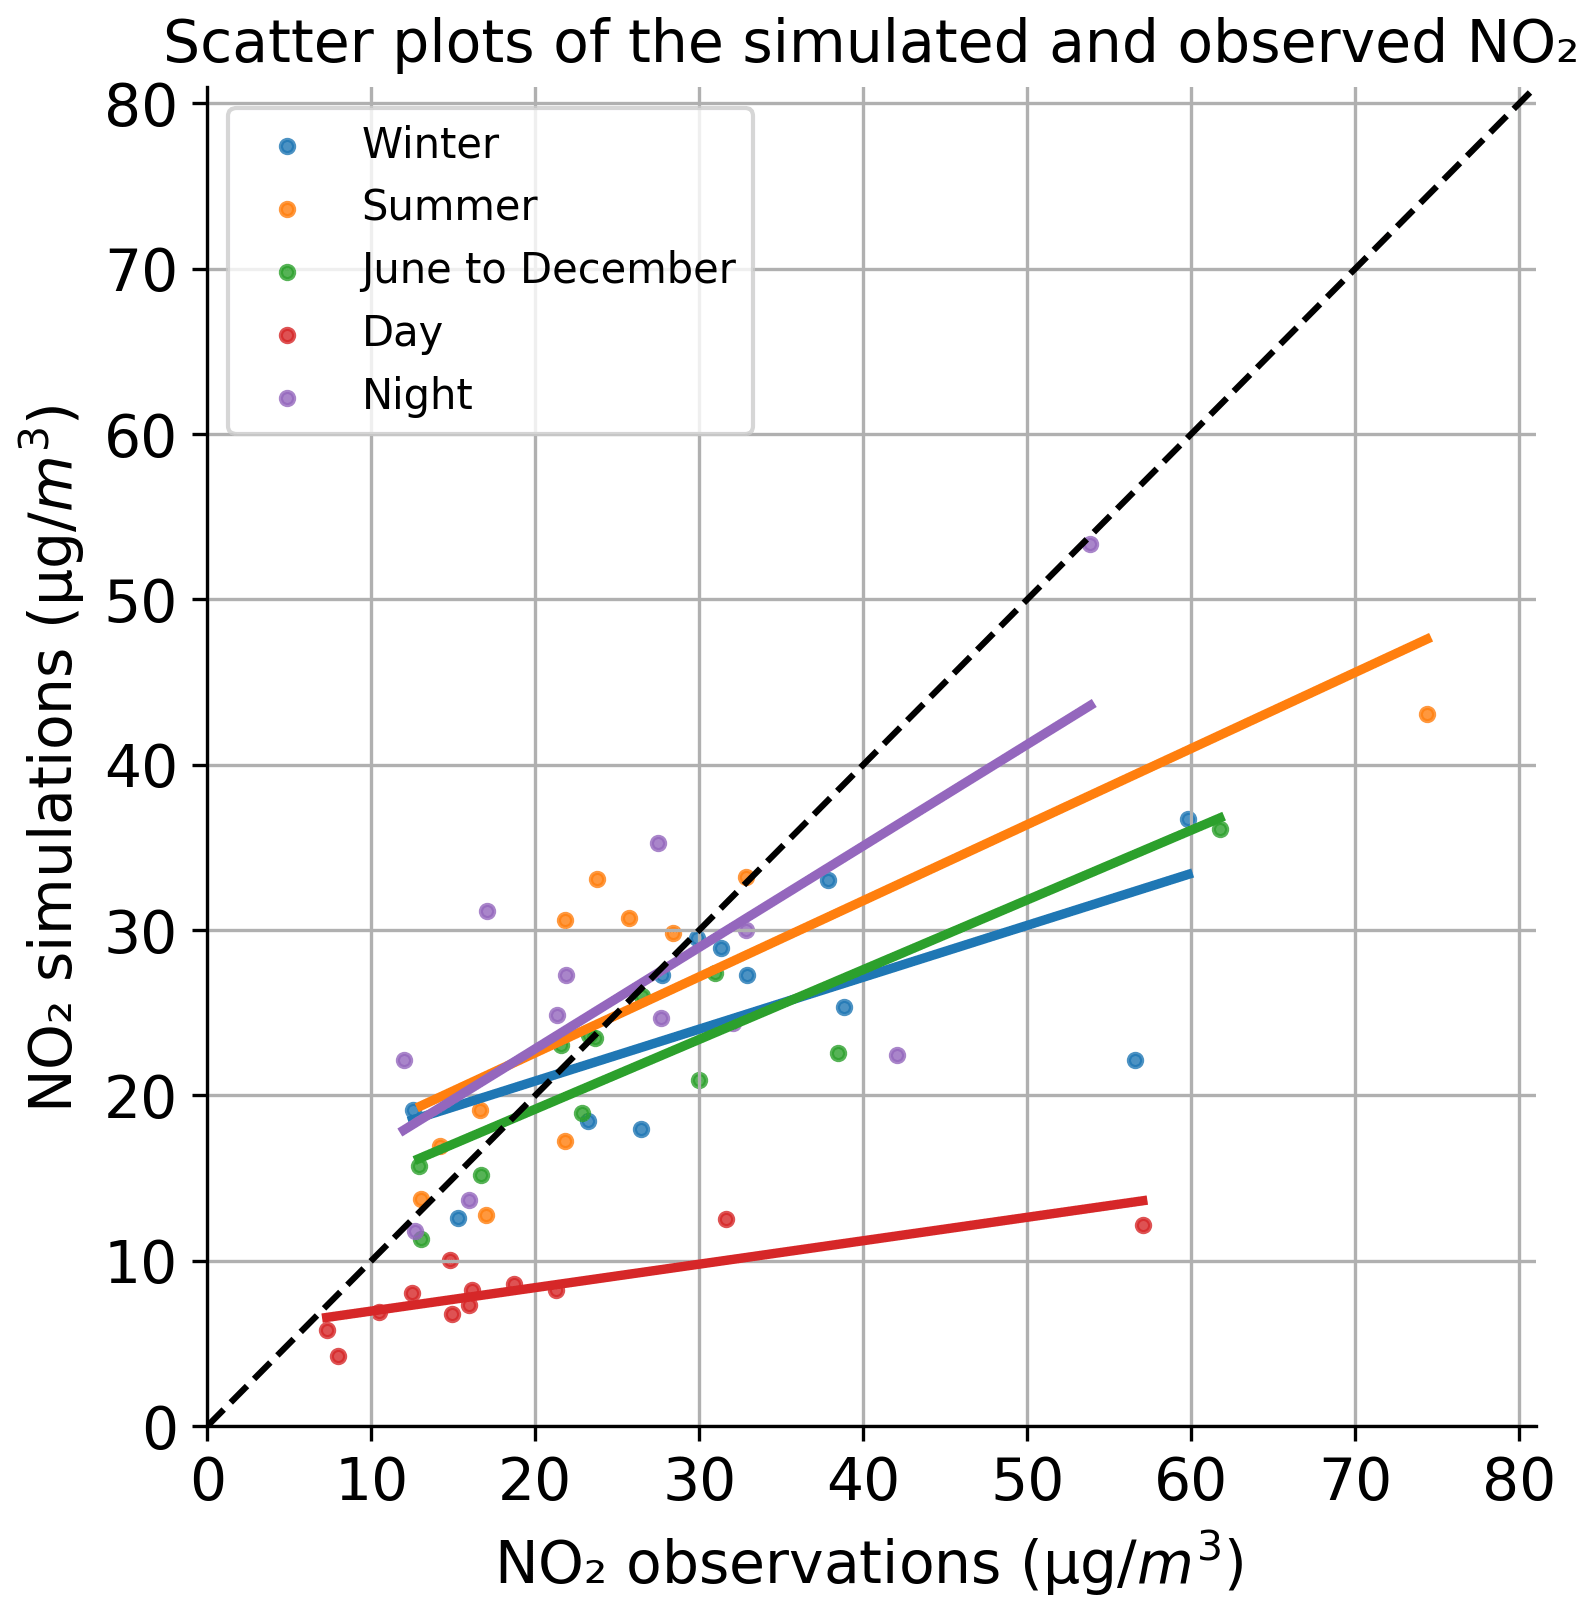
Figure 4Scatter plot of the simulated and observed NO2 concentrations for the 14 stations used for the validation at the different periods. Winter is the December month (blue line), summer is July (orange line), June to December includes measurements for the whole period of study (green line), day represents the daily hours (between 12:00 and 15:00 local time) during the whole period (red line) and night represents the night hours (between 00:00 and 03:00 local time) during the whole period (purple line).
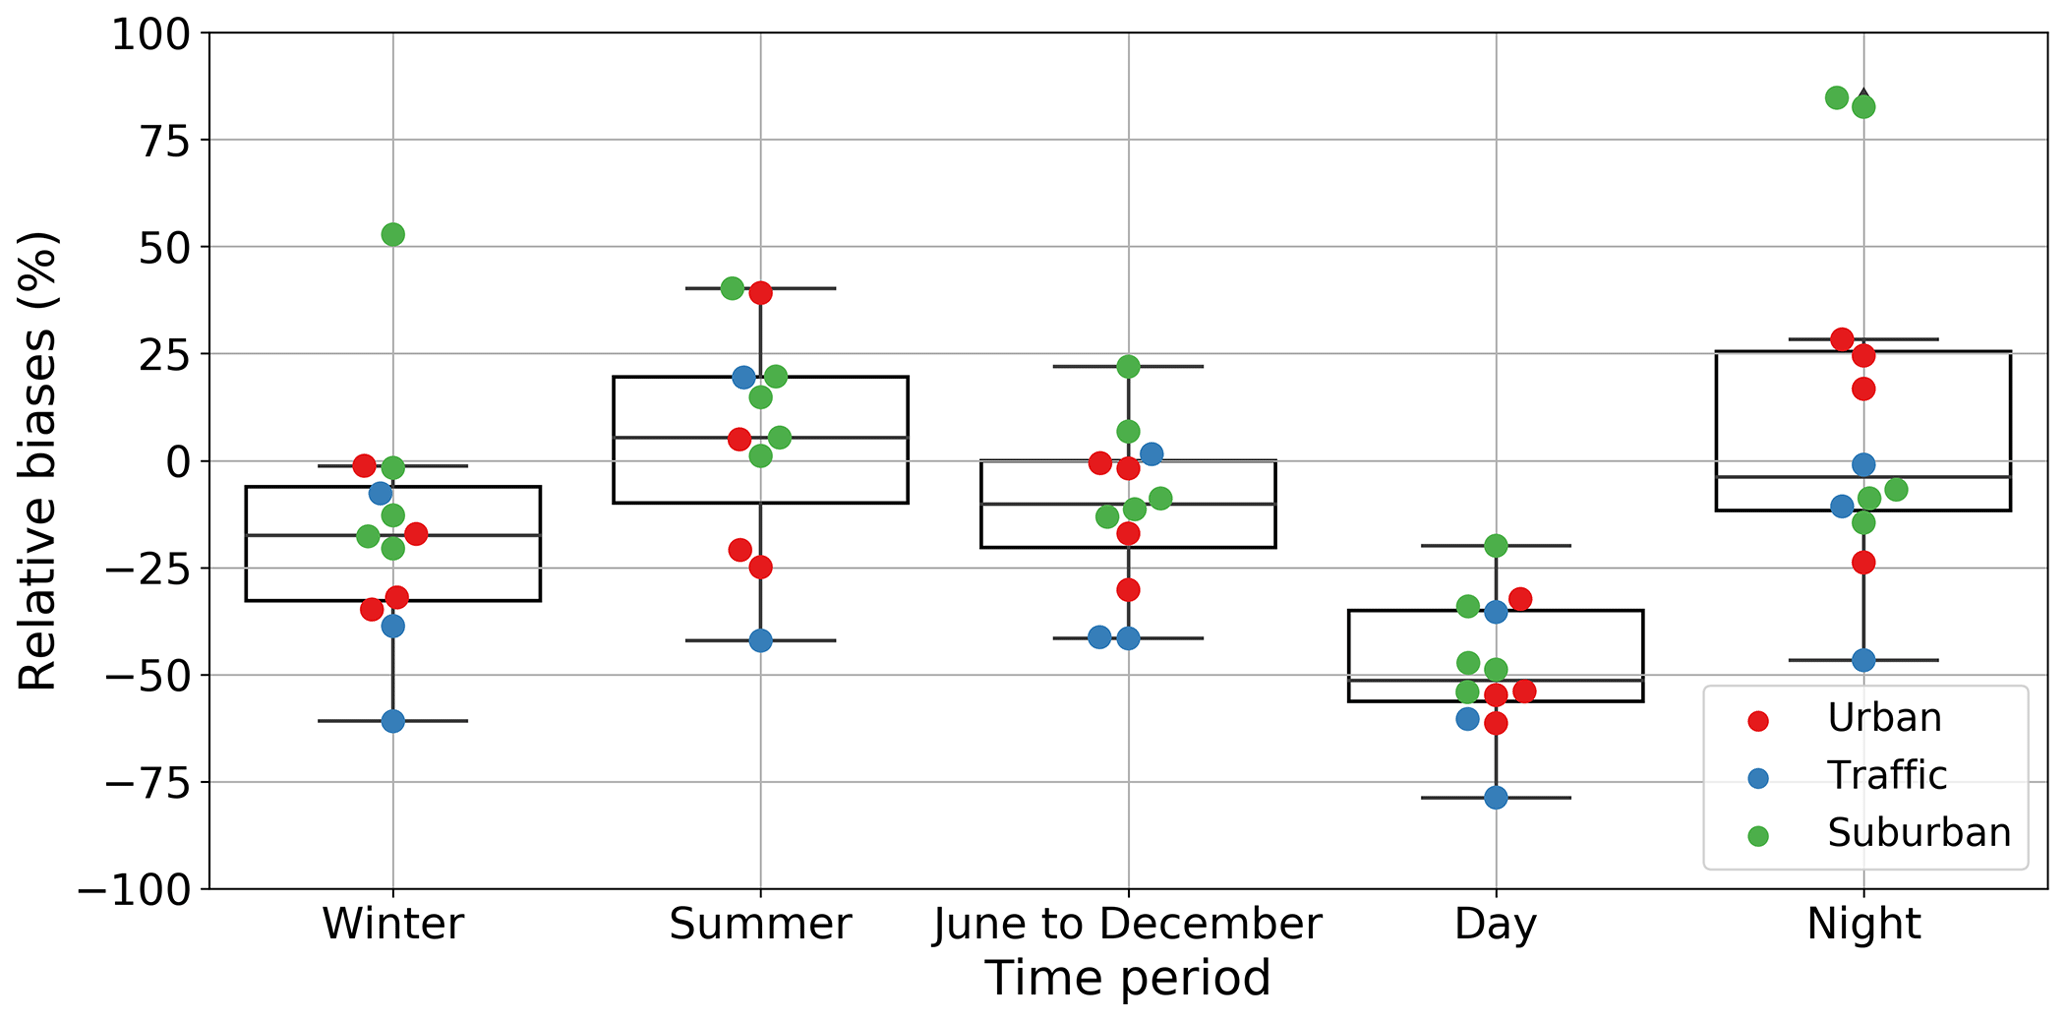
Figure 5Box-and-whisker plot of the relative biases between the simulated and observed NO2 concentrations for the 14 stations used for the validation during the five different periods, from left to right: winter, summer, June to December, daytime and night-time. The different colours of the markers represent distinct types of air quality stations, namely urban (in red), traffic (in blue) and suburban (in green). The boxes extend from the lower to upper quartile values of the biases, while the horizontal line in each box represents the median. The whiskers extend from the box to show the range of the data and outliers past the end of the whiskers. The relative biases are calculated according to (simulations – observations)/observations.
In more detail, for Thessaloniki (Table 1) the correlation coefficients calculated for the entire period range from r=0.49 to r=0.58. Overall, the mean correlation in summer is slightly lower (0.55) than in winter (0.63), while it should be mentioned that significant gaps in the summertime measurements of the traffic station were found. During daytime, the correlation generally increases by 18 % on average for the traffic station and the urban background stations, while it decreases by 36 % on average during night in comparison to the whole period. In the case of the cluster of the two urban background stations, AUTH/Malakopi, the correlation is found to be best (r=0.68 and r=0.72) during daytime and winter respectively.
For the city of Athens (Table 2) the average correlation for the June to December period is ∼ 0.5, with two suburban background stations (Ag. Paraskevi and Liosia) showing the lowest correlations (r=0.32 and r=0.34 respectively), while the urban background/traffic stations (N. Smyrni and Marousi) show the highest ones (r=0.62). As for Thessaloniki, in the case of Athens as well, the model shows improved correlations during the winter period than in summer, with an average correlation of 0.53 and 0.46 respectively. On the other hand, when limiting the analysis to the day time period, the majority of the correlations are improved compared to the June–December period and increased by about 5 %–55 % and 70 % for the suburban background station Liosia. The urban background station Nea Smyrni and the urban traffic station near the port of Piraeus exhibit decreased correlations during the day period in comparison with the June to December period (−29 % and −55 % respectively). Finally, the correlations worsen during night-time (decreased by about 9 %–56 % compared to the whole period) in Athens except for the Piraeus urban traffic station, which is located in the city port (Table 2). The correlation at the suburban industrial station Geoponiki during daytime reaches 0.72, compared to 0.44 for the night-time period.

Figure 6Time series of LOTOS-EUROS (red) and MAX-DOAS (green) NO2 columns over AUTH for July (a) and December (b) 2018.
Table 3Statistics between the MAX-DOAS observations and the LOTOS-EUROS simulations for July and December in Thessaloniki.

The diurnal NO2 variability of both the LOTOS-EUROS simulations (in red) and the corresponding measurements for three air quality stations (in black) are presented in Fig. S3, where it is shown that the model simulates very well the expected highs and lows of the NO2 concentrations during the day, with some differences in the absolute levels, whose possible origins are discussed in Sect. “Discussion on the validation of surface NO2 concentrations”.
In Fig. 4, the mean NO2 simulations for each temporal period chosen are compared against the NO2 measurements for all 14 stations. Each period is marked with a different colour: winter in blue, summer in orange, daytime in red, night-time in purple and June-to-December in green. Overall, and irrespective of the temporal choice, the simulations are found to underestimate the in situ measurements, as shown by the linear regression slopes, coloured in tandem with the datasets. The model behaves similarly in winter as in summer, while the spatial variability is better reproduced in summer when the spatial correlation coefficient is 0.79. The difference between day and night comparisons, shown in Tables 1 and 2, is evident, whereas the strong model underestimation in daytime merits further analysis, even though the spatial correlations are similar (0.80 and 0.72 for day and night respectively). During the night period, the model overestimates the low NO2 measurements and underestimates the higher concentrations.
The relative biases between the simulated and measured values of the each periods are shown in the box-and-whisker plot in Fig. 5, where different colours denote three different kind of stations; urban, suburban and traffic. The period over June to December (middle box) shows a range of biases between −40 % and 23 %, showing an underestimation of the measurements in most cases and a median bias of −10 %. The relative biases in winter (first box) range between −60 % and −1 %, showing a clear underestimation of the measurements. In summer, a reverse behaviour is observed, where the median relative bias is 5 % and the model mostly overestimates the measurements. The strong underestimations of the measured NO2 during day hours are depicted by the high negative biases at the daytime period (fourth box) and the absence of positive biases. The night simulations (fifth box) show very high overestimation at the suburban industrial and urban stations, while traffic stations are underestimated.
Discussion on the validation of surface NO2 concentrations
From the comparison with measurements by air quality stations in Athens and Thessaloniki, we found that overall the LOTOS-EUROS NO2 surface simulations compare very well to the in situ measurements over the two major cities of Greece between June and December 2018, showing a mild underestimation of the measurements with a mean relative bias of −11 %, a median relative bias of −10 %, a high spatial correlation coefficient equal to 0.86 and an average temporal correlation of 0.52. However, the separate evaluation during distinct temporal intervals periods shows that the model simulations have different behaviours depending on season and time of day. Namely, the CTM underestimates the NO2 surface concentrations during daytime, between 12:00 and 15:00 pm local time, ± 15 %, while it slightly overestimates them during night-time, (between 00:00 and 03:00 local time), ∼ 10 ± 35 %.
During summertime, the CTM agrees very well with the in situ measurements, at ∼ 5 ± 25 %, while in wintertime, a slight underestimation was calculated, at ± 25 %. These evaluations permit us to discuss which physical parameterizations or input datasets within the model might be responsible for these differences, focusing mainly on the daytime comparisons where most of the discrepancies were found.
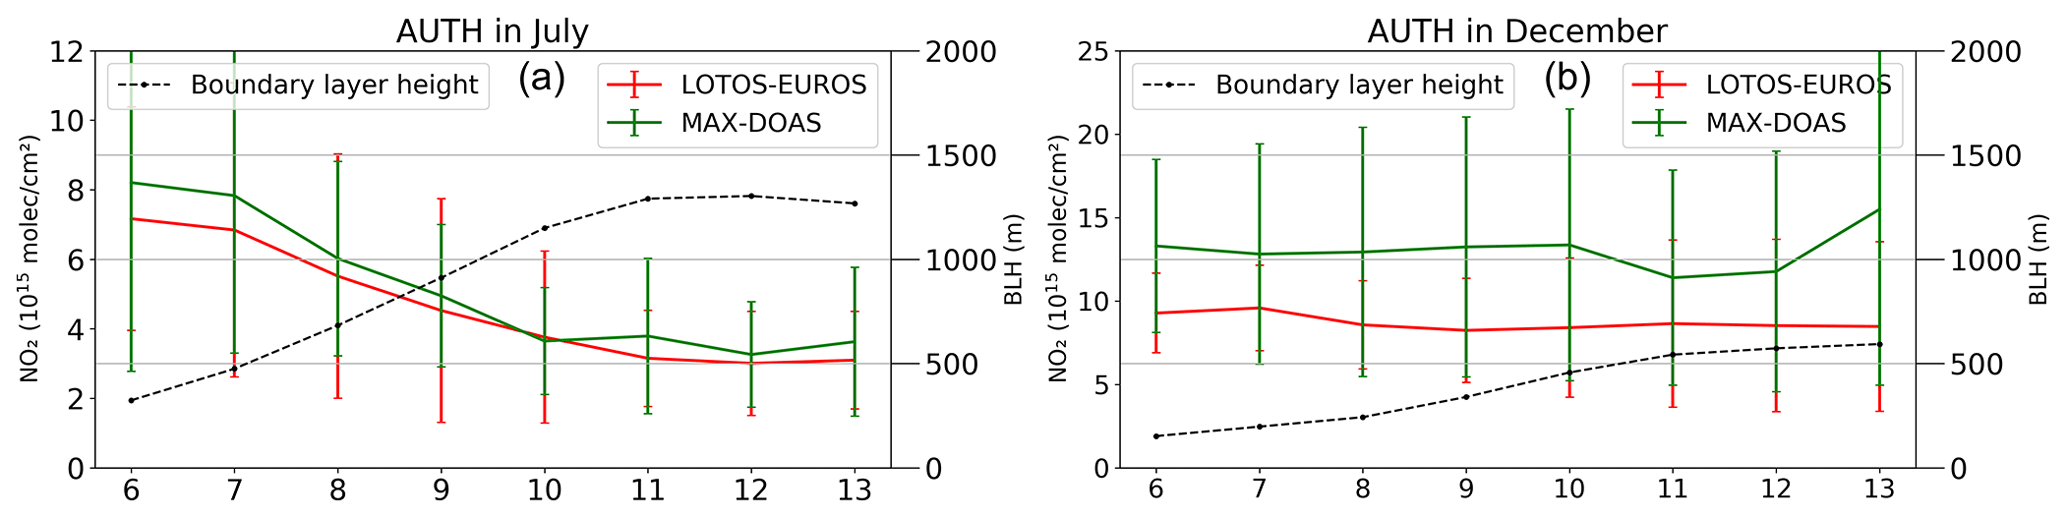
Figure 7Average diurnal cycle of the MAX-DOAS (green line), LOTOS-EUROS (red line) NO2 columns and boundary layer height (black dashed line) during July (a) and December (b) in Thessaloniki. The error bars refer to the standard deviations of the averaged measurements and simulations

Figure 8Time series of LOTOS-EUROS (red) and MAX-DOAS (green) NO2 columns over Athens for July (a) and December (b) 2018 in the urban direction.
A major source of uncertainty, according to the extensive work of Huijnen et al. (2010), who compared numerous CTMs, as well as their ensemble, with ground and space-borne observations, appears to be the calculation, and subsequent mixing, of the boundary layer height. The boundary layer height in LOTOS-EUROS is taken from the ECMWF operational weather analysis data and is based on the bulk Richardson number following the conclusions of the Seidel et al. (2012) review. Should the daytime boundary layer height provided be too high, this would result in low NO2 surface concentrations, as we see in this work. Lampe (2009) further showed that during night the urban heat island can cause a larger boundary layer height and a stronger mixing that leads to the decrease in surface pollutants levels, an effect that may well roll over into our daytime comparisons as well. A first investigation on this issue is shown further on in Sect. 3.2.2.
Another possible source of uncertainty would be partly due to representation issues related to the location of the stations, which lie near urban city centres and industrial areas, which cannot be well resolved by the model at 0.10∘ × 0.05∘ resolution, as in the case of Piraeus station near the port in Athens. This is an issue already identified by Liu et al. (2018), who compared numerous in situ measurements with CTM simulations over China. In our case as well, the spatial mismatch between the simulations and the measurements is found to be more significant during night-time when the model strongly overestimates in some cases the surface observations, and the resulting spatial correlation coefficient is lower than during daytime (0.80 during day and 0.72 during night).
Finally, we note that these alternating negative and positive biases can be further explained by the underestimation, or the overestimation, of the anthropogenic NOx emissions used in the model, as they refer to the year 2015. In our simulations, the default time profiles of the emissions are used, which can cause representativeness issues for the case of Greece and which are an issue of current further study.
Table 4Statistics between the MAX-DOAS observations and the LOTOS-EUROS simulations for July and December in Athens at the urban and rural azimuthal directions.
a Statistically significant at the 95 % level. b Statistically insignificant at the 95 % level.
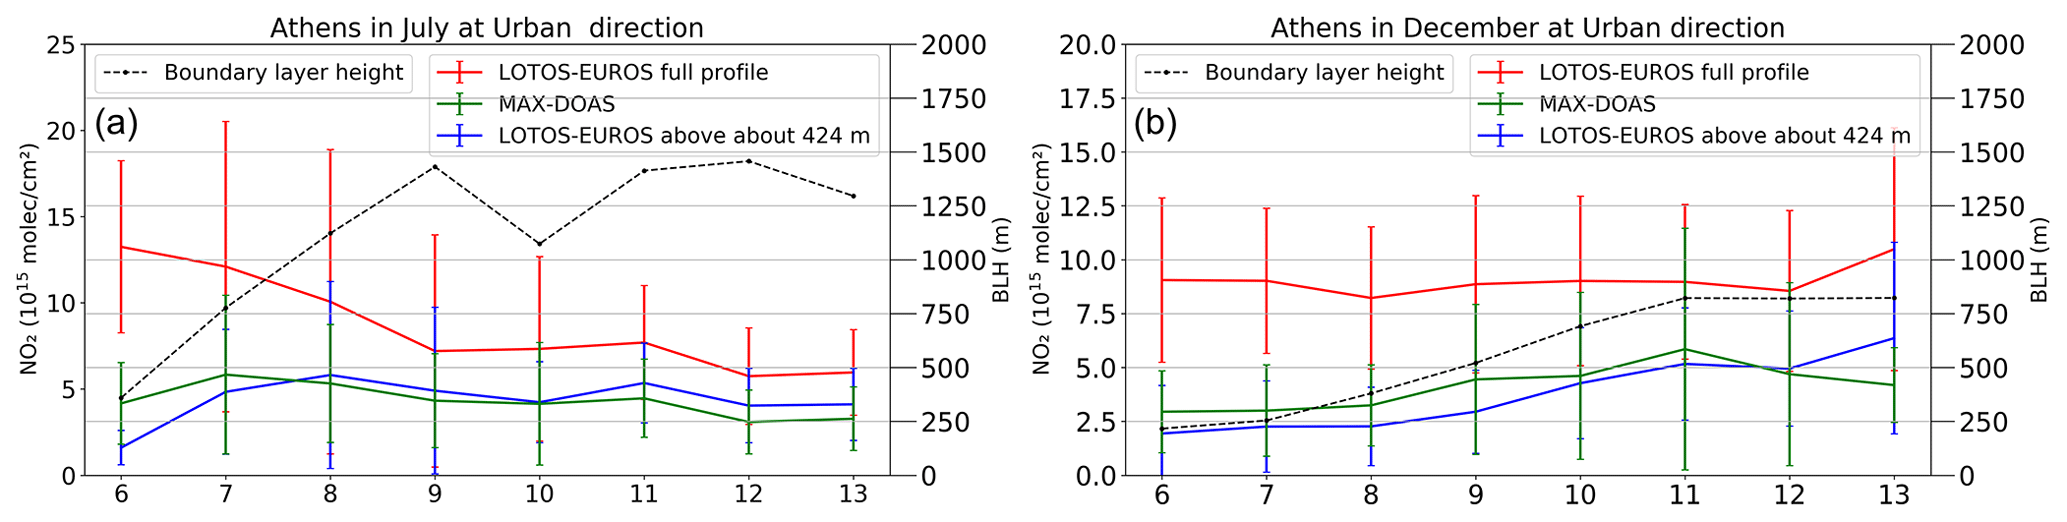
Figure 9Average diurnal cycle of the MAX-DOAS in Athens (green line), LOTOS-EUROS full-profile (red line) NO2 columns, LOTOS-EUROS partial NO2 columns (blue line) and boundary layer height (black line) during July (a) and December (b) for urban direction. The error bars refer to the standard deviations of the averaged measurements and simulations.
3.2 LOTOS-EUROS and MAX-DOAS observations
In the following section, the tropospheric NO2 columns simulated by the LOTOS-EUROS CTM are compared to the MAX-DOAS systems of Thessaloniki (Sect. 3.2.1) and Athens (Sect. 3.2.2). Common findings are discussed in Sect. 3.2.3.
3.2.1 Validation against the Thessaloniki MAX-DOAS observations
Collocated MAX-DOAS tropospheric NO2 observations for the daytime hours of July and December 2018, for solar zenith angles less than 75∘, were compared against the equivalent ones simulated by the LOTOS-EUROS CTM for the Thessaloniki MAX-DOAS system. Figure 6 shows the time series of the tropospheric NO2 vertical column densities from the MAX-DOAS system in the Aristotle University of Thessaloniki (AUTH) and the simulated NO2 tropospheric column from LOTOS-EUROS for July (left) and December (right). Due to the solar zenith angle restriction, slightly fewer collocated measurements were found in December (229) than in July (251). The MAX-DOAS, located in the centre of Thessaloniki, observes high-NO2 columns during the winter month and lower levels during the summertime, similar to the observations shown in Drosoglou et al. (2017) for the period 2014–2015. In July (hours between 06:00 and 13:00 UTC), the measured and simulated columns show a good agreement, while in winter (hours between 06:00 and 13:00 UTC) the measured columns are in many cases higher than the simulated ones. The mean NO2 observations in July and December are 5.15 ± 3.55 and 12.99 ± 7.56 × 10¹⁵ molec cm−2, respectively, while the mean model column over the same periods are 4.61 ± 3.18 and 8.70 ± 3.92×10¹⁵ molec cm−2 (Table 3). In both seasons the relative bias, calculated as (simulations – observations)/observations, is negative – higher in December, %, and lower in July, 10 %.
In order to investigate possible systematic temporal patterns, comparisons of the average diurnal cycles for July (left) and December (right) are shown in Fig. 7. Overall, LOTOS-EUROS (red line) reproduces very well the diurnal cycle over Thessaloniki in July, with the highest values between 06:00 and 07:00 UTC in the morning, as expected. The modelled NO2 levels in December are about ∼ 30 % lower than the MAX-DOAS columns (green line), with no discernible diurnal pattern for either model or observations. As expected, the NO2 measurements are higher in winter than in summer (note the different ranges in the y axes) because of higher household emissions in winter and the strong photochemical loss of NO2 in summer (Boersma et al., 2009). The associated boundary layer height is also shown (black dotted line.) Scatter plots of the daily average NO2 columns from the MAX-DOAS against the LOTOS-EUROS simulations for July (left) and December (right) are shown in Fig. S4. Overall, the comparisons perform well, with correlations of 0.5 and 0.63 for the two seasons. For both July and December the regression analysis shows that the model overestimates the low and underestimates the high values of NO2 columns, which is more pronounced during December.
3.2.2 Validation against the Athens MAX-DOAS observations
The same procedure followed for the case of Thessaloniki is also followed for the MAX-DOAS in Athens; the two distinct azimuthal angles have been selected – the azimuthal viewing angle towards the urban area (U) and the azimuthal viewing angle towards rural area (R). All rural comparisons can be viewed in the Supplement. The MAX-DOAS instrument in Athens is located in a mountainous area around 500 m above sea level. In order to succeed consistently in the comparison between the measurements and the simulations, we integrated the modelled NO2 columns above the model altitude of ∼ 420 m. Figure 8 shows the time series of the tropospheric NO2 vertical column density from the MAX-DOAS in Athens and the simulated NO2 tropospheric columns from LOTOS-EUROS (above 424 m) at the corresponding model grid cells for July (left) and December (right) between 06:00 and 13:00 in the urban direction. The model performs very well in simulating the urban viewing direction in Athens for both seasons, similar to the findings for summertime in Thessaloniki, and shows stronger relative bias differences at the rural direction (Fig. S5), which are not dependent on strong absolute biases since the NO2 levels over the rural direction are quite low, especially during summertime.
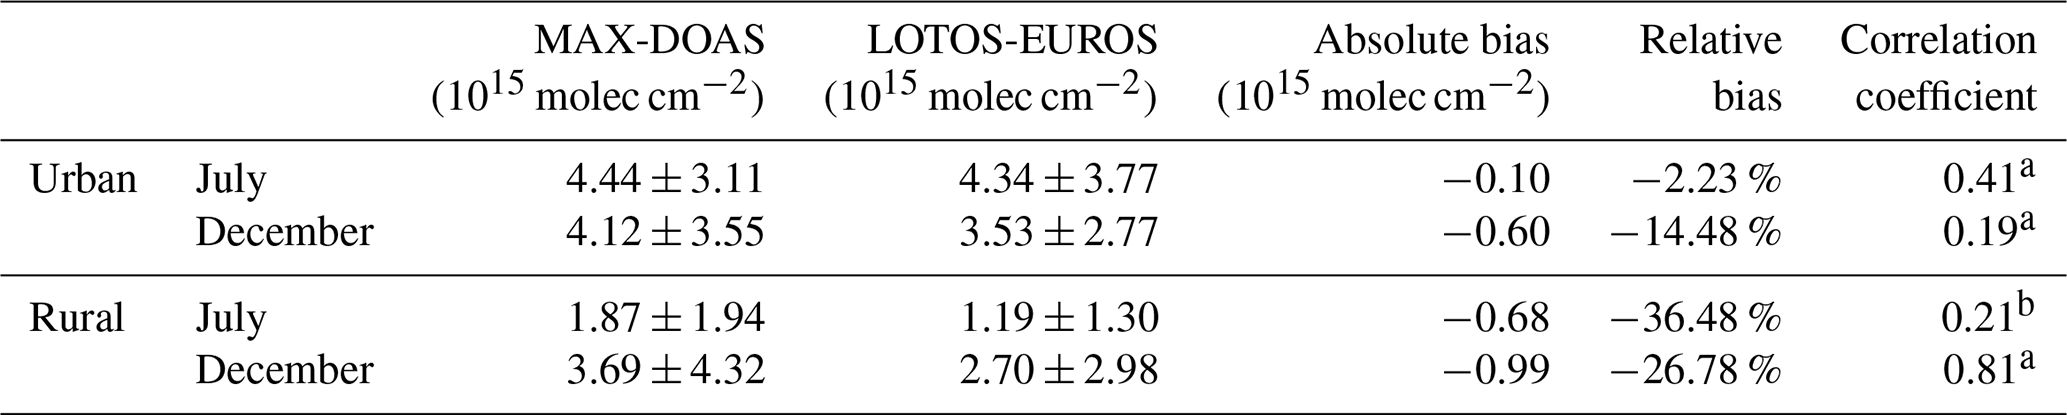
The full set of statistics for both viewing directions of the Athens MAX-DOAS are given in Table 4. As discussed above, the LOTOS-EUROS simulations for the urban direction perform very well, with a minimal relative bias of less than % for both seasons, slightly better during summer than winter. For the rural direction, the absolute biases remain low, below the 1×10¹⁵ molec cm−2 level; however, due to the small overall levels, the relative biases are stronger, at % and % for summer and winter accordingly.
We proceed with examining the diurnal cycle of the urban direction in July (Fig. 9, left) and December (Fig. 9, right) of the LOTOS-EUROS full profile (red line) and partial column above 424 m (blue line), the MAX-DOAS observations (green line), and the boundary layer height (black line) used for the simulations and obtained from the ECMWF, while Fig. S6 shows the average diurnal cycle for the rural direction. The importance of calculating a partial CTM profile when comparing to the Athens MAX-DOAS observations, due to their specific viewing geometry, is fully shown in this figure, where it can be easily observed that the partial profile column of LOTOS-EUROS captures the daily variability of the measurements compared to the full column. Furthermore, the MAX-DOAS-observed diurnal cycle is highly overestimated by the LOTOS-EUROS full profile, while the same NO2 levels are given by the partial CTM column.
The CTM overestimation for low NO2 tropospheric levels, and underestimation for higher levels, is also revealed, same as for Thessaloniki (Fig. S4) with different magnitudes, by the scatter plots of the daily mean loads for the urban direction (Fig. S7) and rural directions (Fig. S8), with the equivalent statistics shown in Table 4.
The temporal evolution of the boundary layer height (Fig. 9, black line), directly determined within LOTOS-EUROS by the ECMWF data, could explain the differences between the diurnal variability of the LOTOS-EUROS partial column and full column (Fig. 9, blue and red lines respectively). In Fig. S9, the relative biases between the simulated partial column and the measurements at the urban direction in July against the boundary layer heights are binned. When the height of the boundary layer is relatively low (between 0 and 500 m) the model highly underestimates the measurements with relative differences higher than −50 %. This could point at an underestimated boundary layer height before 07:00 and a subsequent mixing in the model mostly in the lower heights, which leads to lower concentrations in the morning hours above the 500 m. This assumption was further confirmed where the diurnal variation between the surface LOTOS-EUROS NO2 simulations and the in situ measurements of the suburban industrial station Geoponiki, located at the same pixel of the Athens MAX-DOAS urban direction, is examined (Fig. S10). The surface simulations overestimate the NO2 concentrations at 06:00 UTC, while for the remaining hours the model underestimates the in situ measurements.
In the future, this line of investigation will be followed by comparing the MAX-DOAS NO2 profiles (currently not available) against the ECMWF boundary layer heights and LOTOS-EUROS-simulated profiles to provide a clearer relationship between how a low late-evening/early-morning boundary layer affects the mixing processes within the CTM.
Discussion on the validation of tropospheric NO2 columns against ground-based MAX-DOAS observations
From the comparison with measurements by MAX-DOAS instrument stations in Athens and Thessaloniki, we find the overall LOTOS-EUROS simulation of the tropospheric NO2 columns over both urban and rural locations performs very well, representing the diurnal patterns and hourly levels for both summer and winter seasons satisfactorily. The absolute biases for the month of July range between −0.1 and molec cm−2 for both urban and rural scenarios, while a difference in the behaviour of the model for December between the urban observations in Thessaloniki against that of Athens is found, with the model underestimating by molec cm−2 the levels measured over Thessaloniki, mostly at the pollution peaks. The fact that for both urban areas, in Thessaloniki and Athens, the model underestimates only slightly the measurements in July while producing a higher underestimation during the winter month, as in the case of the surface observations, could point at both underestimated NOx emissions as well as too short a NOx modelled lifetime. The boundary layer height assumption appears to play a pivotal role in the case of Athens, where the NO2 columns are measured above the first 500 m, contributing to a stronger mixing of pollutants below 500 m early in the morning and a subsequent underestimation of NO2 at higher altitudes. The importance of the appropriate boundary layer height in comparisons is also strong for the case of Thessaloniki, where the ground-based instrument views from the surface upwards. Figure S11 shows the diurnal variations of the surface LOTOS-EUROS NO2 simulations at the same grid cell as the Thessaloniki MAX-DOAS for July (upper) and December (lower) together with the surface measurements of the in situ stations in the area. They show a similar variation with the MAX-DOAS and simulated columns, overall underestimating all hourly in situ measurements. However, during the early hours in July the model simulates higher NO2, pointing to an overestimation of the surface simulations that is not present in the columnar comparisons and may be attributed to a low boundary layer assumed in the simulations.
Other parameters that play a pivotal role in both measurements and the simulations are related to meteorology, namely temperature and cloud coverage. According to Schaub et al. (2007), high temperatures and longer days result in shorter NOx lifetimes compared to lower temperatures and fewer daylight hours, while they also showed that a cloud fraction of 0.2 results in a longer NOx lifetime than a cloud fraction of 0.1, as a result of the decreased amount of solar radiation caused by the higher cloud fraction. Therefore, uncertainties in the meteorological input data (cloudiness and temperature) in the model may induce uncertainties in the photochemical conversion and lifetime of NOx. In addition, the MAX-DOAS tropospheric columns in both cities have been derived using the geometric approximation without taking into account the actual NO2 profile, therefore introducing additional uncertainty.
Finally, the pixel size used in the simulations, which is constrained by the current CTM input parameters, should be discussed at this point. The 0.1×0.05∘ pixel covers a relatively large area of the city of Thessaloniki and inadvertently includes some inhomogeneous air pollution patterns, since it engulfs both the city centre as well as the surrounding, cleaner, areas, while the MAX-DOAS probes air straight from the city centre (Drosoglou et al., 2017). As a result, the relatively large grid pixel of the model simulation might underestimate a possible horizontal plume from industrial areas, such as that from chimneys. Vlemmix et al. (2015) found that MAX-DOAS low daily averaged NO2 columns are overestimated by LOTOS-EUROS, while higher columns are underestimated, well in agreement with the results of this study at the rural directions.
3.3 LOTOS-EUROS and Sentinel-5P TROPOMI vertical columns
Daily Sentinel-5P TROPOMI tropospheric NO2 columns were gridded onto the LOTOS-EUROS grid with the same spatial resolution (0.1∘ × 0.05∘). The TROPOMI averaging kernels, which express the sensitivity of the instrument to the NO2 abundance within the distinct layers of the atmospheric column, are applied to the model profiles in order to allow a consistent comparison between the modelled and observed columns and to eliminate any possible errors in the TM5-MP a priori profile shapes (Eskes and Boersma, 2003). The averaging kernels are applied directly by the LOTOS-EUROS model as described in Sect. 2.3. Monthly averaged tropospheric NO2 columns for the TROPOMI observations and LOTOS-EUROS simulations are shown in Figs. 10 and 11 for July and December, respectively, over Greece (upper) and the two sub-regions of Athens (middle) and Thessaloniki (lower). The right columns in both figures show the absolute difference between the TROPOMI and LOTOS-EUROS columns. The regions to be statistically analysed in this work are marked with black rectangles, and their resulting statistics are shown in Table 5. Note that in this work temporal correlation refers to the correlation between the average daily values of TROPOMI and the simulations in each region, while spatial correlation refers to the correlation between the monthly average observations and the corresponding simulations in each grid cell of the region.
Over Greece, LOTOS-EUROS generally captures the observed NO2 column abundances very well in July and December (upper panels of Figs. 10 and 11, respectively), such as the densely populated area of Athens and the lignite-burning power plants in the north-west of Greece, in the area of Ptolemaida. The spatial correlation is quite high, at 0.78 for July and 0.87 in December, while the high background levels of TROPOMI (a well-known feature to be updated in the next version of the official dataset) can be easily distinguished in the difference plot (right column) where the purple colour covering the entire region is molec cm−2. This feature is mostly noticeable during July when the mean bias is strongly negative, at molec cm−2, which leads us to estimate that, for this issue, the relative bias between LOTOS-EUROS and TROPOMI tropospheric NO2 columns over Greece is well within the 10 % level.
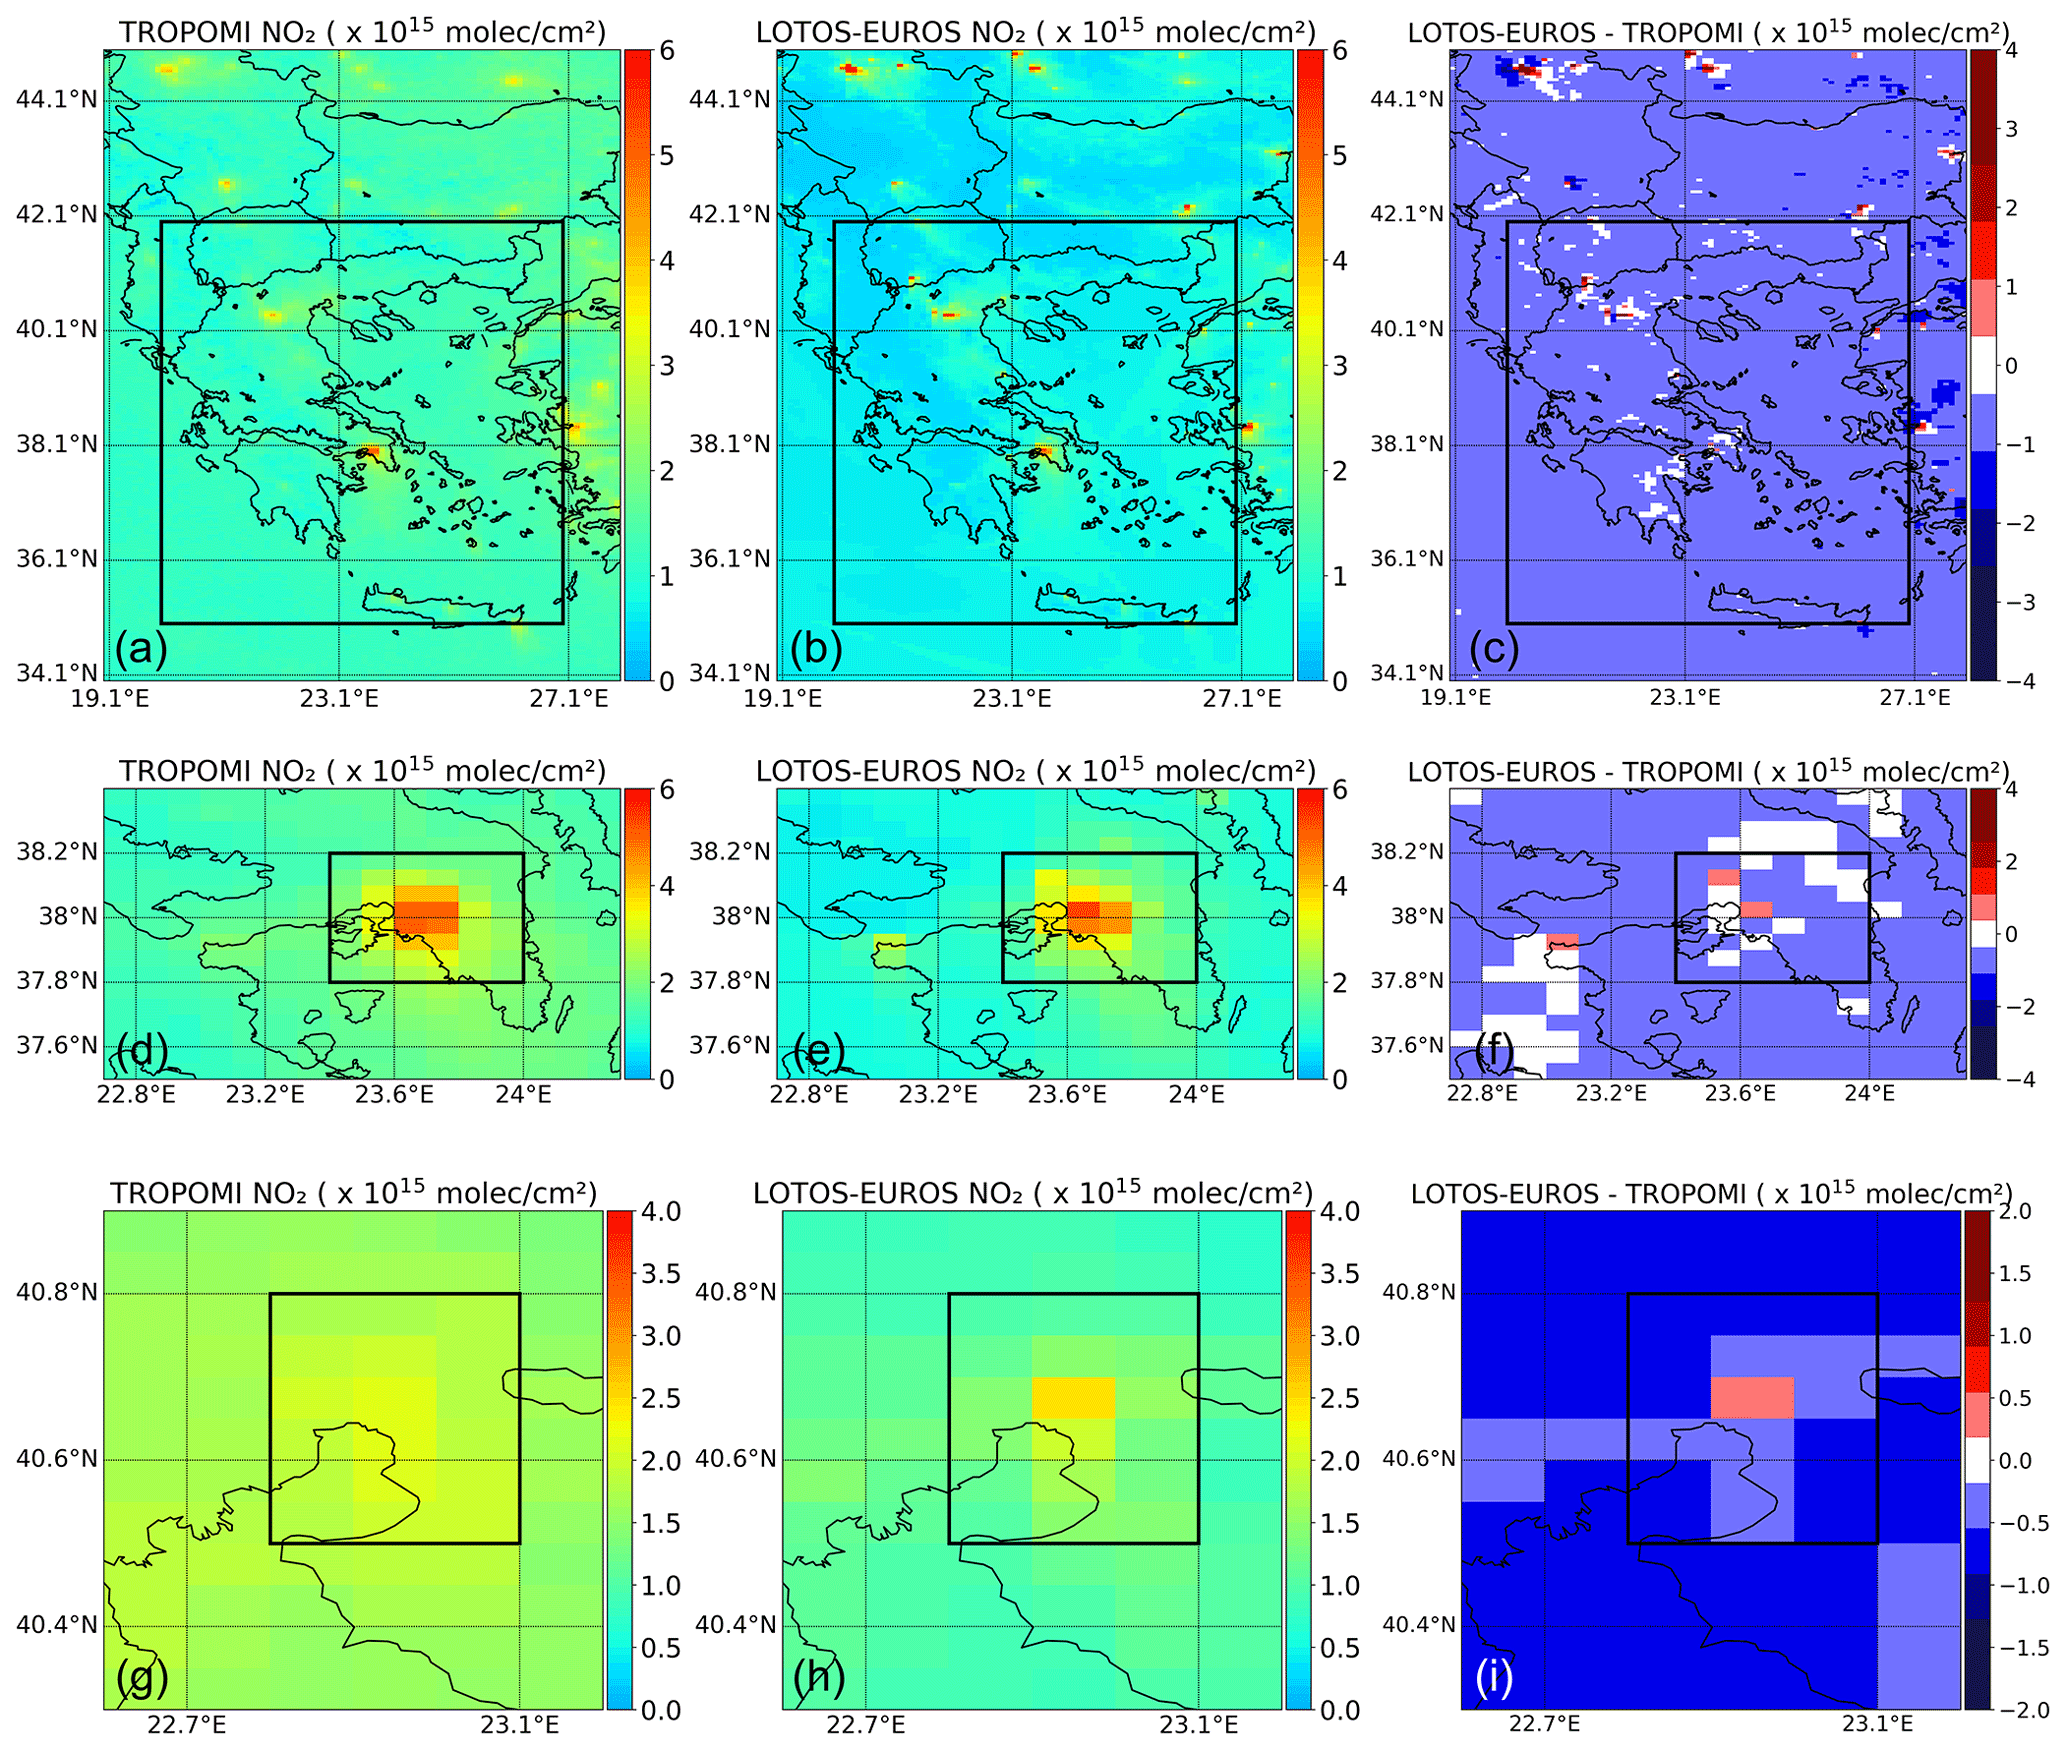
Figure 10TROPOMI (a, d, g) and LOTOS-EUROS (b, e, h) NO2 vertical columns over the region of Greece (a, b, c) and the sub-regions of Athens (d, e, f) and Thessaloniki (g, h, i) for July and their absolute differences (c, f, i).
Over Athens, the spatial correlation is extremely high, at 0.95 for summer and 0.82 for winter (Figs. 10 and 11, middle panels) while the absolute bias is extremely low, well below the 1×10¹⁵ molec cm−2 level, resulting in relative biases 15 %. In December, the LOTOS-EUROS NO2 columns are higher mostly in the southern part of the sub-region of Athens, over the sea area compared to TROPOMI, pointing to a possible overestimation of the shipping emissions by the CAMS 2015 inventory used in the simulations. Another hot spot, shown by LOTOS-EUROS but not TROPOMI over Athens, is at the Isthmus of Corinth, the narrow land bridge which connects the Peloponnese peninsula with the rest of the mainland of Greece, near the city of Corinth (approx. 37.9∘ N, 23∘ E). Suggestions for possible NOx reductions in the area will be studied when emission inventories for year 2018 are officially released.
Over Thessaloniki, the same conclusions can be drawn (lower panels of Figs. 10 and 11), with the comparisons within the 0.5×10¹⁵ molec cm−2 level for both seasons and a higher spatial correlation in July (0.82) than in December (0.66). The spatial patterns created by the higher winter emissions may explain this seasonal difference in the comparisons, compared to the summertime where the main NO2 load is seen directly over the city centre.
Compared to similar studies over urban sprawls, we report on the comparison of the TROPOMI NO2 data with Pandora total columns in Helsinki which showed that TROPOMI slightly overestimates the NO2 columns when they are relatively low and underestimates the high columns (Ialongo et al., 2020). This same feature was also shown by Zhao et al. (2020), who compared the TROPOMI total columns with Pandora total columns in the Greater Toronto Area over an urban and suburban site and found negative biases while the same comparisons over a rural site showed positive bias. Dimitropoulou et al. (2020) validated TROPOMI NO2 tropospheric columns with MAX-DOAS measurements over an urban area in Belgium and confirmed that TROPOMI underestimates the measurements by about 40 %–50 % at urban sites and argued the need of more appropriate a priori profiles in the TROPOMI algorithm retrieval. Since in this work the averaging kernel is applied to the modelled profiles before columnar integration, there is no expected retrieval profile-related bias influencing the comparisons.
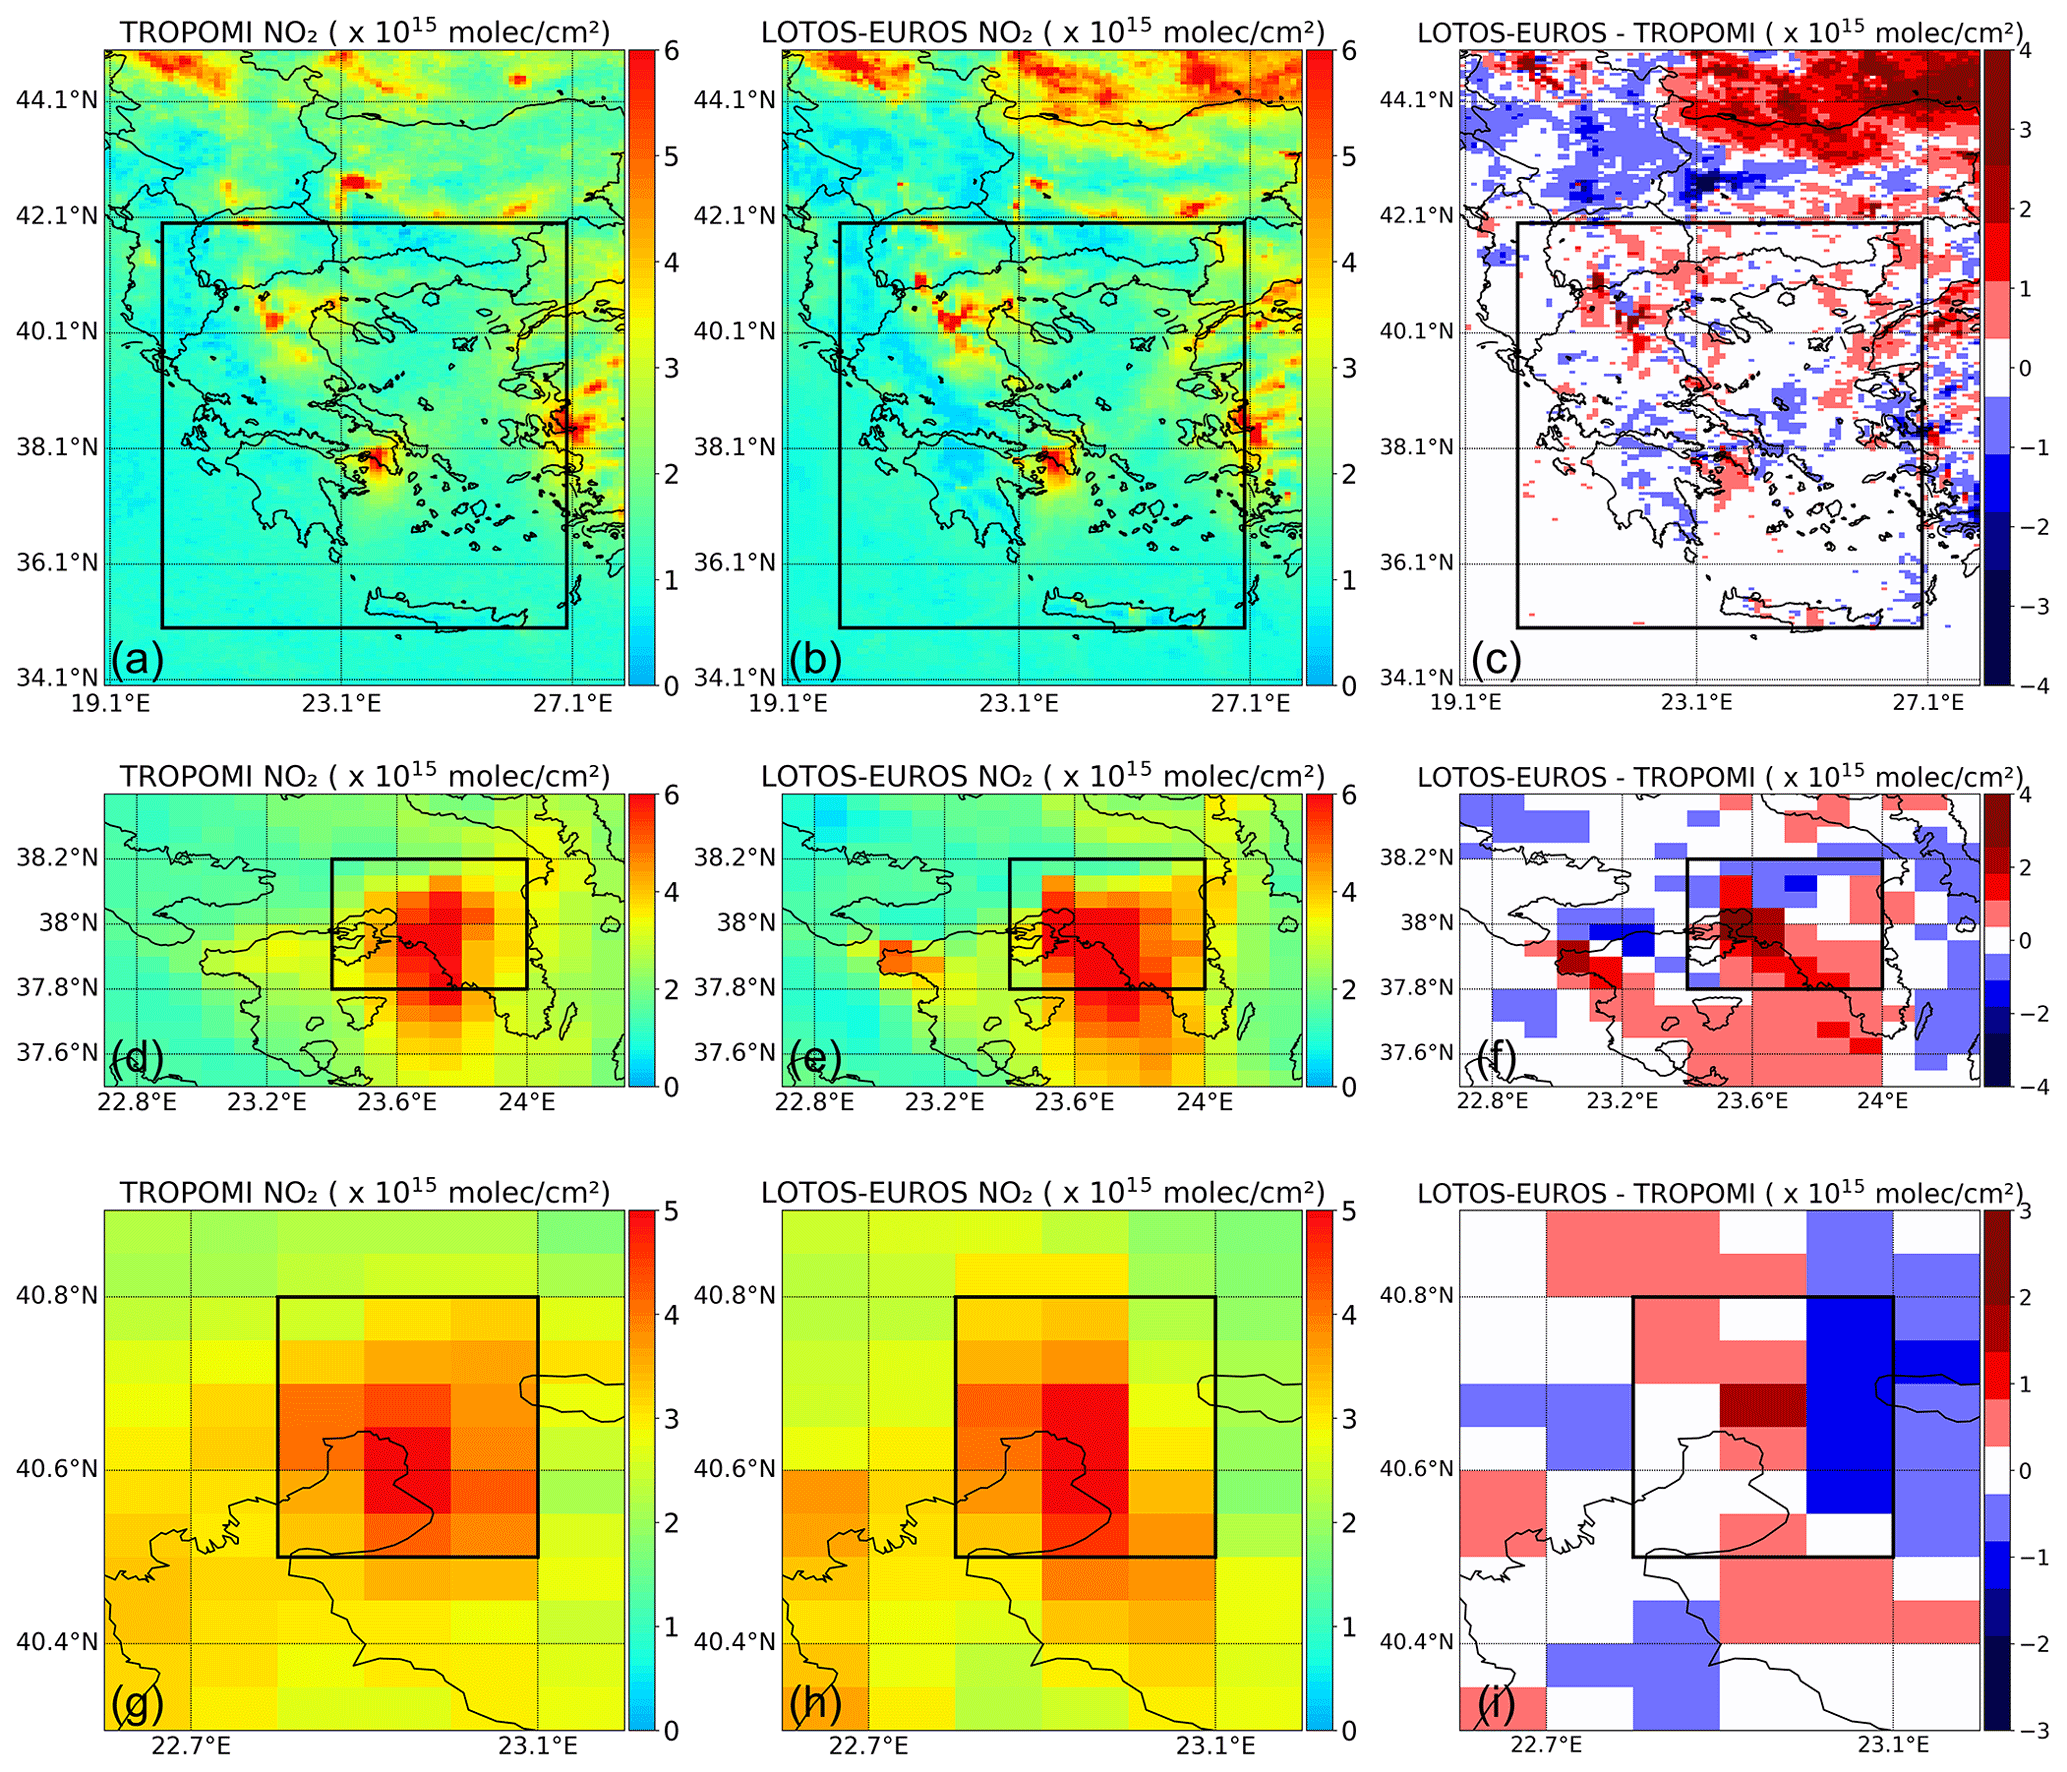
Figure 11TROPOMI (a, d, g) and LOTOS EUROS (b, e, h) NO2 tropospheric vertical columns over the region of Greece (a, b, c) and the sub-regions of Athens (d, e, f) and Thessaloniki (g, h, i) for December and their absolute differences (c, f, i).
Table 5Statistics between the LOTOS-EUROS vertical NO2 columns and the TROPOMI observations for July and December 2018. Columns and the absolute bias are expressed in 1015 molec cm−2. The correlation coefficients marked with bold are statistically significant at the 95 % level.

In order to study the temporal behaviour of the comparisons and reveal whether sudden high- or low-NO2 events are well captured by the model, time series for the mean columnar levels of the three domains studied (Greece, Athens and Thessaloniki) for July (left) and December (right) are shown in Fig. S12. As already seen above, a near-constant underestimation of the CTM columns compared to the satellite ones is seen for Greece and Thessaloniki for all days in July, beyond the satellite precision error levels, which is not as pronounced in December. For the two main cities, apart from very few exceptions, for most days, the NO2 levels are very similar, with a mean temporal correlation of 0.55 (range between 0.3 and 0.84.)
3.3.1 Discussion on the validation of tropospheric NO2 columns against S5P/TROPOMI observations
From the comparison with measurements by S5P/TROPOMI over Greece, Athens and Thessaloniki, we conclude that LOTOS-EUROS simulates extremely well the tropospheric NO2 patterns over the region with very high spatial correlation of 0.82 on average, ranging between 0.66 and 0.95. All know major hot spots in the region are modelled satisfactorily, and the estimated levels closely follow those of the satellite observations, with absolute biases molec cm−2, negative biases in the summer and positive biases in wintertime. The near-constant bias of molec cm−2 may have two different provenances; the model may underestimate the background values in summer compared to satellite retrievals, which, according to Huijnen et al. (2010), can be a result of an underestimation of NOx lifetime in the model as well as an under-prediction of the transport processes in the free troposphere. The TROPOMI tropospheric columns are also known to have a bias for small tropospheric NO2 values (below 2×10¹⁵ molec cm−2), estimated at 0.5×10¹⁵ molec cm−2 (median of 7 %) (S5P MPC Routine Operations Consolidated Validation Report #9, 2020). Verhoelst et al. (2021) also reported that TROPOMI shows an underestimation of NO2 tropospheric columns of −23 % to −37 % in clean to slightly polluted conditions, further corroborating previous findings (Ialongo et al., 2020), which can also be assumed for the two urban centres discussed here. Recall that the simulations over Greece refer to approximately 12:00 UTC, a time of day where the NO2 levels are already in their photochemically induced decline and hence already rather low. Currently, it is unclear which feature, if not both, affects the LOTOS-EUROS comparisons with TROPOMI for background and low tropospheric NO2 levels shown in this work.
Other LOTOS-EUROS features that might affect the comparisons include the fact that NOx lightning emissions are not included in the model, and as a result some NO2 is missing in the free troposphere. While it is generally assumed that underestimated or missing soil NO emissions usually form an important factor of uncertainty in CTM models, note that the background values of TROPOMI remain high even over the sea, indicating that natural emissions might not be the cause of the high background values.
The application of the averaging kernels to the CTM profiles before integration is shown to play an important part in the agreement shown, even though it is an undisputed fact that the LOTOS-EUROS profiles peak more strongly near the surface, and this sometimes leads to a smaller CTM integrated column and a subsequent difference in the free troposphere. In the future, the averaging kernels will be calculated based on the NO2 a priori profiles used by the LOTOS-EUROS model, and we expect some of the lingering differences to further smooth out. Furthermore, the emission inventory used as input for the simulations is outdated by a few years, and this fact may impact on the NO2 simulations.
3.4 Comparative findings
In the following we give a brief overview, in the form of a table, of all the comparisons between the LOTOS-EUROS NO2 simulations and the different observational datasets discussed previously, before concluding the findings in the final section. In Table 6 we provide a summary table of the different evaluations performed in this work, in order to possibly draw more generalized conclusions. For the case of the surface concentrations, in summertime, these appear to range within ±20 %, pointing to uncertainties in the boundary layer height which could depend on parameters that affect urban environments and are not taken into account, such as the urban heat island effect. In wintertime, a higher spread was found to range between % and ∼35 %, with a mean of %. A reverse picture emerges for the case of the tropospheric columns compared with the satellite data, which can also be performed per location (grid cell) and mean area, to study spatial correlations, like for the surface concentrations. In this case, the summertime comparisons show an underestimation of % on average, irrespective of location, while for the wintertime comparisons the satellite observations are only slightly overestimated, at ∼ 10 %. Finally, comparisons with tropospheric columns from ground-based MAX-DOAS instruments reveal a negligible relative bias for summer, at %, and a stronger one for wintertime, %, more in line with the in situ surface concentration comparisons. The fact that measurements at the rural direction are underestimated in both summer and winter shows a possible underestimation of pollution transfer from neighbouring regions.
Table 6Relative summer and wintertime biases between LOTOS-EUROS simulations of tropospheric of NO2 levels and S5P/TROPOMI (first column) and MAX-DOAS (second column) as well as of NO2 surface simulations and in situ measurements (third column). The “grid cell” spatial resolution refers to biases of NO2 values found at the same grid cell, while “mean area” refers to the biases calculated for the total area depicted in Fig. 10, middle and lower panels.
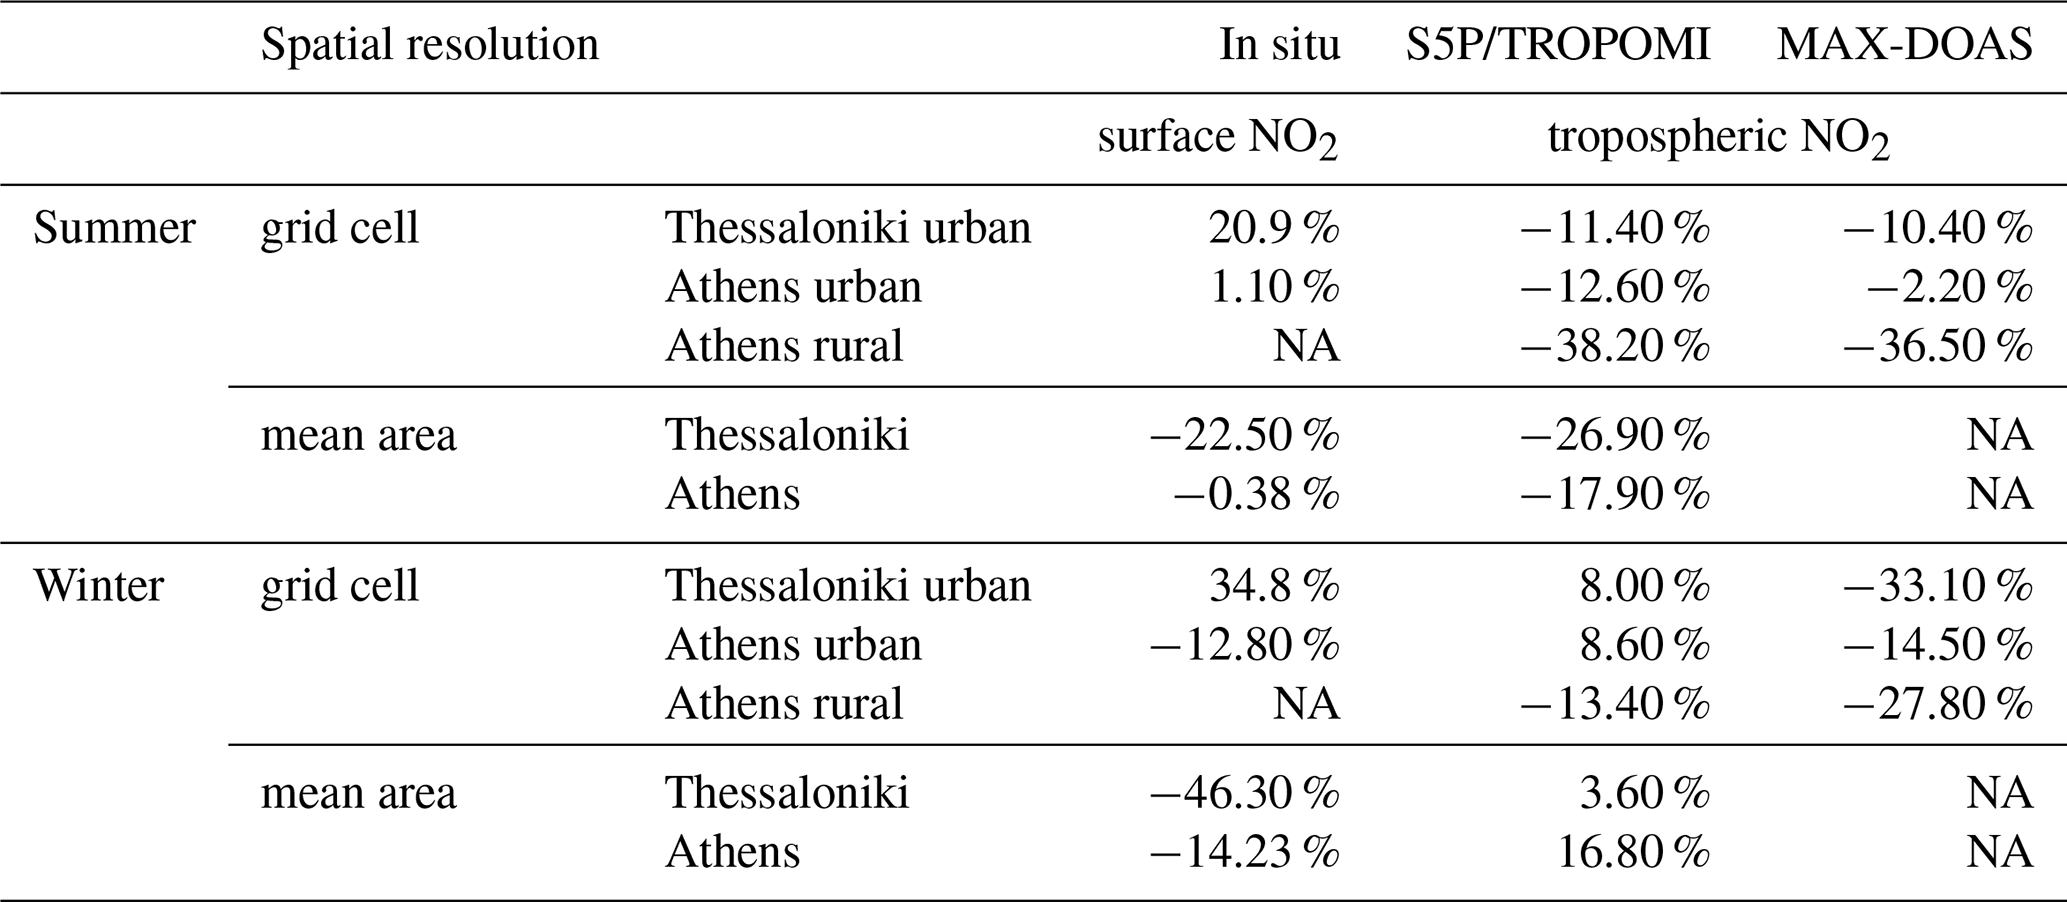
NA – not available.
In this work, we evaluate tropospheric NO2 surface simulations over Greece from the LOTOS-EUROS regional CTM against in situ surface concentrations from 14 air quality stations during June and December 2018. Furthermore, we compare LOTOS-EUROS tropospheric NO2 columns against MAX-DOAS and Sentinel-5P TROPOMI tropospheric NO2 columns in July and December 2018. The model setup is based on the anthropogenic emission inventory TNO-CAMS v2.2 for the year 2015, ECMWF meteorological data, and CAMS near-real-time initial and boundary conditions.
In the tropospheric NO2 surface simulations evaluation we found that the LOTOS-EUROS NO2 surface simulations compare quite reasonably to the in situ measurements over the two major cities of Greece, indicating a mild underestimation of the measurements with a mean relative bias of −11 %, a median relative bias of −10 %, a high spatial correlation coefficient equal to 0.86 and an average temporal correlation of 0.52. The summertime bias is quite low, at ∼ 5 ± 25 %, while in wintertime, a moderate underestimation was found, at ± 25 %.
In the tropospheric NO2 column simulations evaluation we found that the LOTOS-EUROS NO2 column simulations compare very well against MAX-DOAS measurements over both urban and rural locations in the two major Greek cities, representing the diurnal patterns and hourly levels for both summer and winter seasons reasonably. The overall absolute biases range between −0.1 and molec cm−2, for both cities, with the exception of the urban observations in wintertime over Thessaloniki, which show higher underestimations mostly at the early-morning pollution peaks. The fact that for both urban areas, in Thessaloniki and Athens, the model underestimates only slightly the measurements in July while producing a higher underestimation during the winter month, as in the case of the surface observations, could point at both underestimated NOx emissions and too short a NOx modelled lifetime.
The comparisons against the S5P/TROPOMI tropospheric NO2 columns has permitted the analysis of spatial patterns in the simulated tropospheric NO2 levels. It has been shown that the model reproduces very well the spatial variability of TROPOMI NO2 columns over Greece, capturing the locations of low- and high-NO2 columns. The spatial correlation between the simulations over Athens and the TROPOMI observations is 0.95 in July and 0.82 in December, while the levels of NO2 are underestimated and overestimated respectively in summer and winter by 18 %. The same characteristics are observed over the city of Thessaloniki as well, with higher spatial correlation in summer (0.82) and negative relative bias ( %) and lower spatial correlation in winter (0.66) and a negligible positive bias (∼ 4 %). Higher background values of NO2 are observed in TROPOMI product mainly during summertime, possibly due to an underestimation of the free tropospheric column (missing lightning emissions in the simulations, under-prediction of the transport processes in the free troposphere) and the model-simulated TROPOMI column (higher concentrations of LOTOS-EUROS near the surface).
As discussed extensively in the text, the diurnal evolution of the boundary layer height appears to strongly affect both the mixing processes within the CTM and the photochemical NO2 destruction strength, and in our opinion this effect should be further investigated in the future within the continuous LOTOS-EUROS model improvements. Finally, we report that further studies on emission inversions using the data assimilation package of LOTOS-EUROS are currently being conducted to account for uncertainties due to outdated emission inventories.
The open-source version of the LOTOS-EUROS CTM can be found at https://lotos-euros.tno.nl/ (TNO, 2021).
The S5P data used here are publicly available from the Copernicus Open Access Hub (https://scihub.copernicus.eu/, ESA, 2021). The LOTOS-EUROS simulations are available upon request. The air quality monitoring station data are publicly available via the Greek Ministry of the Environment and Energy monitoring network (https://ypen.gov.gr/perivallon/poiotita-tis-atmosfairas/dedomena-metriseon-atmosfairikis-rypansis/; Greek Ministry of the Environment, 2021). The MAX-DOAS observations discussed in this text are available upon request.
The supplement related to this article is available online at: https://doi.org/10.5194/acp-21-5269-2021-supplement.
The satellite and CTM data analysis was performed by IS; methodology and conceptualization were developed by MEK and DB; software development was carried out by IS; MAX-DOAS observations were performed by DK and MG; writing and original draft preparation were performed by IS and MEK; review and editing were performed by all authors. All authors have read and agreed to the published version of the manuscript.
The authors declare that they have no conflict of interest.
We acknowledge the usage of modified Copernicus Sentinel data (2019–2020). Results presented in this work have been produced using the Aristotle University of Thessaloniki (AUTH) high-performance computing infrastructure and resources. Ioanna Skoulidou, Maria-Elissavet Koukouli, and Dimitris Balis would like to acknowledge the support provided by the IT Center of the AUTh throughout the progress of this research work.
This research has been co-financed by the European Union (European Regional Development Fund) and Greek national funds through the Operational Program “Competitiveness, Entrepreneurship and Innovation” (NSRF 2014-2020) by the Panhellenic Infrastructure for Atmospheric Composition and Climate Change project (MIS 5021516) and the Innovative system for Air Quality Monitoring and Forecasting project (code T1EDK-01697, MIS 5031298), implemented under the action “Reinforcement of the Research and Innovation Infrastructure”.
This paper was edited by Jianzhong Ma and reviewed by three anonymous referees.
Boersma, K. F., Jacob, D. J., Trainic, M., Rudich, Y., DeSmedt, I., Dirksen, R., and Eskes, H. J.: Validation of urban NO2 concentrations and their diurnal and seasonal variations observed from the SCIAMACHY and OMI sensors using in situ surface measurements in Israeli cities, Atmos. Chem. Phys., 9, 3867–3879, https://doi.org/10.5194/acp-9-3867-2009, 2009.
Bouwman, A. F., Van Vuuren, D. P., Derwent, R. G., and Posch, M.: A global analysis of acidification and eutrophication of terrestrial ecosystems, Water. Air. Soil Pollut., 141, 349–382, https://doi.org/10.1023/A:1021398008726, 2002.
Crouse, D. L., Peters, P. A., Villeneuve, P. J., Proux, M. O., Shin, H. H., Goldberg, M. S., Johnson, M., Wheeler, A. J., Allen, R. W., Atari, D. O., Jerrett, M., Brauer, M., Brook, J. R., Cakmak, S., and Burnett, R. T.: Within- and between-city contrasts in nitrogen dioxide and mortality in 10 Canadian cities, A subset of the Canadian Census Health and Environment Cohort (CanCHEC), J. Expo. Sci. Environ. Epidemiol., 25, 482–489, https://doi.org/10.1038/jes.2014.89, 2015.
Curier, R. L., Kranenburg, R., Segers, A. J. S., Timmermans, R. M. A., and Schaap, M.: Synergistic use of OMI NO2 tropospheric columns and LOTOS-EUROS to evaluate the NOx emission trends across Europe, Remote Sens. Environ., 149, 58–69, https://doi.org/10.1016/j.rse.2014.03.032, 2014.
Dimitropoulou, E., Hendrick, F., Pinardi, G., Friedrich, M. M., Merlaud, A., Tack, F., De Longueville, H., Fayt, C., Hermans, C., Laffineur, Q., Fierens, F., and Van Roozendael, M.: Validation of TROPOMI tropospheric NO2 columns using dual-scan multi-axis differential optical absorption spectroscopy (MAX-DOAS) measurements in Uccle, Brussels, Atmos. Meas. Tech., 13, 5165–5191, https://doi.org/10.5194/amt-13-5165-2020, 2020.
Drosoglou, T., Bais, A. F., Zyrichidou, I., Kouremeti, N., Poupkou, A., Liora, N., Giannaros, C., Koukouli, M. E., Balis, D., and Melas, D.: Comparisons of ground-based tropospheric NO2 MAX-DOAS measurements to satellite observations with the aid of an air quality model over the Thessaloniki area, Greece, Atmos. Chem. Phys., 17, 5829–5849, https://doi.org/10.5194/acp-17-5829-2017, 2017.
Dunlea, E. J., Herndon, S. C., Nelson, D. D., Volkamer, R. M., San Martini, F., Sheehy, P. M., Zahniser, M. S., Shorter, J. H., Wormhoudt, J. C., Lamb, B. K., Allwine, E. J., Gaffney, J. S., Marley, N. A., Grutter, M., Marquez, C., Blanco, S., Cardenas, B., Retama, A., Ramos Villegas, C. R., Kolb, C. E., Molina, L. T., and Molina, M. J.: Evaluation of nitrogen dioxide chemiluminescence monitors in a polluted urban environment, Atmos. Chem. Phys., 7, 2691–2704, https://doi.org/10.5194/acp-7-2691-2007, 2007.
EL.STAT: Resident population census 2011, available at: http://www.statistics.gr/en/home (last access: 30 June 2020), 2012.
ESA: Copernicus Open Access Hub, available at: https://scihub.copernicus.eu/, last access: 24 March 2021.
Eskes, H. J. and Boersma, K. F.: Averaging kernels for DOAS total-column satellite retrievals, Atmos. Chem. Phys., 3, 1285–1291, https://doi.org/10.5194/acp-3-1285-2003, 2003.
Fameli, K. M. and Assimakopoulos, V. D.: The new open Flexible Emission Inventory for Greece and the Greater Athens Area (FEI-GREGAA): Account of pollutant sources and their importance from 2006 to 2012, Atmos. Environ., 137, 17–37, https://doi.org/10.1016/j.atmosenv.2016.04.004, 2016.
Flemming, J., Inness, A., Flentje, H., Huijnen, V., Moinat, P., Schultz, M. G., and Stein, O.: Coupling global chemistry transport models to ECMWF's integrated forecast system, Geosci. Model Dev., 2, 253–265, https://doi.org/10.5194/gmd-2-253-2009, 2009.
Fountoukis, C. and Nenes, A.: ISORROPIA II: a computationally efficient thermodynamic equilibrium model for K+–Ca2+–Mg2+––Na+–––Cl−–H2O aerosols, Atmos. Chem. Phys., 7, 4639–4659, https://doi.org/10.5194/acp-7-4639-2007, 2007.
Gery, M. W., Whitten, G. Z., Killus, J. P., and Dodge, M. C.: A photochemical kinetics mechanism for urban and regional scale computer modeling, J. Geophys. Res., 94, 12925–12956, https://doi.org/10.1029/jd094id10p12925, 1989.
Gratsea, M., Vrekoussis, M., Richter, A., Wittrock, F., Schönhardt, A., Burrows, J., Kazadzis, S., Mihalopoulos, N., and Gerasopoulos, E.: Slant column MAX-DOAS measurements of nitrogen dioxide, formaldehyde, glyoxal and oxygen dimer in the urban environment of Athens, Atmos. Environ., 135, 118–131, https://doi.org/10.1016/j.atmosenv.2016.03.048, 2016.
Greek Ministry of the Environment: Air quality monitoring station data, available at: https://ypen.gov.gr/perivallon/poiotita-tis-atmosfairas/dedomena-metriseon-atmosfairikis-rypansis/, last access: 24 March 2021.
Grivas, G., Chaloulakou, A., and Kassomenos, P.: An overview of the PM10 pollution problem, in the Metropolitan Area of Athens, Greece. Assessment of controlling factors and potential impact of long range transport, Sci. Total Environ., 389, 165–177, https://doi.org/10.1016/j.scitotenv.2007.08.048, 2008.
Huijnen, V., Eskes, H. J., Poupkou, A., Elbern, H., Boersma, K. F., Foret, G., Sofiev, M., Valdebenito, A., Flemming, J., Stein, O., Gross, A., Robertson, L., D'Isidoro, M., Kioutsioukis, I., Friese, E., Amstrup, B., Bergstrom, R., Strunk, A., Vira, J., Zyryanov, D., Maurizi, A., Melas, D., Peuch, V.-H., and Zerefos, C.: Comparison of OMI NO2 tropospheric columns with an ensemble of global and European regional air quality models, Atmos. Chem. Phys., 10, 3273–3296, https://doi.org/10.5194/acp-10-3273-2010, 2010.
Ialongo, I., Virta, H., Eskes, H., Hovila, J., and Douros, J.: Comparison of TROPOMI/Sentinel-5 Precursor NO2 observations with ground-based measurements in Helsinki, Atmos. Meas. Tech., 13, 205–218, https://doi.org/10.5194/amt-13-205-2020, 2020.
Judd, L. M., Al-Saadi, J. A., Szykman, J. J., Valin, L. C., Janz, S. J., Kowalewski, M. G., Eskes, H. J., Veefkind, J. P., Cede, A., Mueller, M., Gebetsberger, M., Swap, R., Pierce, R. B., Nowlan, C. R., Abad, G. G., Nehrir, A., and Williams, D.: Evaluating Sentinel-5P TROPOMI tropospheric NO2 column densities with airborne and Pandora spectrometers near New York City and Long Island Sound, Atmos. Meas. Tech., 13, 6113–6140, https://doi.org/10.5194/amt-13-6113-2020, 2020.
Kaiser, J. W., Heil, A., Andreae, M. O., Benedetti, A., Chubarova, N., Jones, L., Morcrette, J.-J., Razinger, M., Schultz, M. G., Suttie, M., and van der Werf, G. R.: Biomass burning emissions estimated with a global fire assimilation system based on observed fire radiative power, Biogeosciences, 9, 527–554, https://doi.org/10.5194/bg-9-527-2012, 2012.
Kallos, G., Kassomenos, P., and Pielke, R. A.: Synoptic and mesoscale weather conditions during air pollution episodes in Athens, Greece, Bound.-Lay. Meteorol., 62, 163–184, https://doi.org/10.1007/BF00705553, 1993.
Koukouli, M.-E., Skoulidou, I., Karavias, A., Parcharidis, I., Balis, D., Manders, A., Segers, A., Eskes, H., and van Geffen, J.: Sudden changes in nitrogen dioxide emissions over Greece due to lockdown after the outbreak of COVID-19, Atmos. Chem. Phys., 21, 1759–1774, https://doi.org/10.5194/acp-21-1759-2021, 2021.
Koulidis, A. G., Progiou, A. G., and Ziomas, I. C.: Air Quality Levels in the Vicinity of Three Major Greek Airports, Environ. Model. Assess., 25, 749–760, https://doi.org/10.1007/s10666-020-09699-6, 2020.
Kouremeti, N., Bais, A., Kazadzis, S., Blumthaler, M., and Schmitt, R.: Charge-coupled device spectrograph for direct solar irradiance and sky radiance measurements, Appl. Optics, 47, 1594–1607, https://doi.org/10.1364/AO.47.001594, 2008.
Kuenen, J. J. P., Visschedijk, A. J. H., Jozwicka, M., and Denier van der Gon, H. A. C.: TNO-MACC_II emission inventory; a multi-year (2003–2009) consistent high-resolution European emission inventory for air quality modelling, Atmos. Chem. Phys., 14, 10963–10976, https://doi.org/10.5194/acp-14-10963-2014, 2014.
Lampe, A.: Evaluation of the diurnal cycle of trace gases over Beijing as modelled by CHIMERE, available at: http://bibliotheek.knmi.nl/stageverslagen/stageverslag_Lampe.pdf (last access: 8 August 2020), 2009.
Liu, F., van der A, R. J., Eskes, H., Ding, J., and Mijling, B.: Evaluation of modeling NO2 concentrations driven by satellite-derived and bottom-up emission inventories using in situ measurements over China, Atmos. Chem. Phys., 18, 4171–4186, https://doi.org/10.5194/acp-18-4171-2018, 2018.
Manders, A. M. M., Builtjes, P. J. H., Curier, L., Denier van der Gon, H. A. C., Hendriks, C., Jonkers, S., Kranenburg, R., Kuenen, J. J. P., Segers, A. J., Timmermans, R. M. A., Visschedijk, A. J. H., Wichink Kruit, R. J., van Pul, W. A. J., Sauter, F. J., van der Swaluw, E., Swart, D. P. J., Douros, J., Eskes, H., van Meijgaard, E., van Ulft, B., van Velthoven, P., Banzhaf, S., Mues, A. C., Stern, R., Fu, G., Lu, S., Heemink, A., van Velzen, N., and Schaap, M.: Curriculum vitae of the LOTOS–EUROS (v2.0) chemistry transport model, Geosci. Model Dev., 10, 4145–4173, https://doi.org/10.5194/gmd-10-4145-2017, 2017.
Mavroidis, I. and Ilia, M.: Trends of NOx, NO2 and O3 concentrations at three different types of air quality monitoring stations in Athens, Greece, Atmos. Environ., 63, 135–147, https://doi.org/10.1016/j.atmosenv.2012.09.030, 2012.
Miyazaki, K., Eskes, H., Sudo, K., Boersma, K. F., Bowman, K., and Kanaya, Y.: Decadal changes in global surface NOx emissions from multi-constituent satellite data assimilation, Atmos. Chem. Phys., 17, 807–837, https://doi.org/10.5194/acp-17-807-2017, 2017.
Moussiopoulos, N., Vlachokostas, C., Tsilingiridis, G., Douros, I., Hourdakis, E., Naneris, C., and Sidiropoulos, C.: Air quality status in Greater Thessaloniki Area and the emission reductions needed for attaining the EU air quality legislation, Sci. Total Environ., 407, 1268–1285, https://doi.org/10.1016/j.scitotenv.2008.10.034, 2009.
Müller, J.-F. and Stavrakou, T.: Inversion of CO and NOx emissions using the adjoint of the IMAGES model, Atmos. Chem. Phys., 5, 1157–1186, https://doi.org/10.5194/acp-5-1157-2005, 2005.
Novak, J. H. and Pierce, T. E.: Natural emissions of oxidant precursors, Water, Air, Soil Pollut., 67, 57–77, https://doi.org/10.1007/BF00480814, 1993.
Pateraki, S., Assimakopoulos, V. D., Maggos, T., Fameli, K. M., Kotroni, V., and Vasilakos, C.: Particulate matter pollution over a Mediterranean urban area, Sci. Total Environ., 463/464, 508–524, https://doi.org/10.1016/j.scitotenv.2013.05.076, 2013.
Poupkou, A., Nastos, P., Melas, D., and Zerefos, C.: Climatology of discomfort index and air quality index in a large urban mediterranean agglomeration, Water. Air. Soil Pollut., 222, 163–183, https://doi.org/10.1007/s11270-011-0814-9, 2011.
S5P MPC Routine Operations Consolidated Validation Report (ROCVR): Quarterly Validation Report of the Copernicus Sentinel-5 Precursor Operational Data Products #06: April 2018–February 2020, S5P-MPC-IASB-ROCVR-06.0.1-20200330., 2020.
Schaap, M., Timmermans, R. M. A., Roemer, M., Boersen, G. A. C., Builtjes, P. J. H., Sauter, F. J., Velders, G. J. M., and Beck, J. P.: The LOTOS-EUROS model: Description, validation and latest developments, Int. J. Environ. Pollut., 32, 270–290, https://doi.org/10.1504/IJEP.2008.017106, 2008.
Schaap, M., Kranenburg, R., Curier, L., Jozwicka, M., Dammers, E., and Timmermans, R.: Assessing the sensitivity of the OMI-NO2 product to emission changes across europe, Remote Sens., 5, 4187–4208, https://doi.org/10.3390/rs5094187, 2013.
Schaub, D., Brunner, D., Boersma, K. F., Keller, J., Folini, D., Buchmann, B., Berresheim, H., and Staehelin, J.: SCIAMACHY tropospheric NO2 over Switzerland: estimates of NOx lifetimes and impact of the complex Alpine topography on the retrieval, Atmos. Chem. Phys., 7, 5971–5987, https://doi.org/10.5194/acp-7-5971-2007, 2007.
Seidel, D. J., Zhang, Y., Beljaars, A., Golaz, J. C., Jacobson, A. R., and Medeiros, B.: Climatology of the planetary boundary layer over the continental United States and Europe, J. Geophys. Res.-Atmos., 117, D17106, https://doi.org/10.1029/2012JD018143, 2012.
Seinfeld, J. H. and Pandis, S. N.: From Air Pollution to Climate Change, Atmospheric Chemistry and Physics, Wiley, New York, 724–743, 1998.
Shaiganfar, R., Beirle, S., Sharma, M., Chauhan, A., Singh, R. P., and Wagner, T.: Estimation of NOx emissions from Delhi using Car MAX-DOAS observations and comparison with OMI satellite data, Atmos. Chem. Phys., 11, 10871–10887, https://doi.org/10.5194/acp-11-10871-2011, 2011.
Sinreich, R., Frieß, U., Wagner, T., and Platt, U.: Multi axis differential optical absorption spectroscopy (MAX-DOAS) of gas and aerosol distributions, Faraday Discuss., 130, 153–164, https://doi.org/10.1039/b419274p, 2005.
Terrenoire, E., Bessagnet, B., Rouïl, L., Tognet, F., Pirovano, G., Létinois, L., Beauchamp, M., Colette, A., Thunis, P., Amann, M., and Menut, L.: High-resolution air quality simulation over Europe with the chemistry transport model CHIMERE, Geosci. Model Dev., 8, 21–42, https://doi.org/10.5194/gmd-8-21-2015, 2015.
TNO: LOTOS-EUROS Air quality modelling and emissions, available at: https://lotos-euros.tno.nl/, last access: 24 March 2021.
van Geffen, J., Eskes, H. J., Boersma, K. F., Maasakkers, J. D., and Veefkind, J. P.: TROPOMI ATBD of the total and tropospheric NO2 data products, Report S5P-KNMI-L2-0005-RP, version 1.4.0, De Bilt, The Netherlands, available at: http://www.tropomi.eu/documents/atbd/ (last access: 24 March 2021), 2019.
van Geffen, J., Boersma, K. F., Eskes, H., Sneep, M., ter Linden, M., Zara, M., and Veefkind, J. P.: S5P TROPOMI NO2 slant column retrieval: method, stability, uncertainties and comparisons with OMI, Atmos. Meas. Tech., 13, 1315–1335, https://doi.org/10.5194/amt-13-1315-2020, 2020.
Veefkind, J. P., Aben, I., McMullan, K., Förster, H., de Vries, J., Otter, G., Claas, J., Eskes, H. J., de Haan, J. F., Kleipool, Q., van Weele, M., Hasekamp, O., Hoogeveen, R., Landgraf, J., Snel, R., Tol, P., Ingmann, P., Voors, R., Kruizinga, B., Vink, R., Visser, H., and Levelt, P. F.: TROPOMI on the ESA Sentinel-5 Precursor: A GMES mission for global observations of the atmospheric composition for climate, air quality and ozone layer applications, Remote Sens. Environ., 120, 70–83, https://doi.org/10.1016/j.rse.2011.09.027, 2012.
Verhoelst, T., Compernolle, S., Pinardi, G., Lambert, J.-C., Eskes, H. J., Eichmann, K.-U., Fjæraa, A. M., Granville, J., Niemeijer, S., Cede, A., Tiefengraber, M., Hendrick, F., Pazmiño, A., Bais, A., Bazureau, A., Boersma, K. F., Bognar, K., Dehn, A., Donner, S., Elokhov, A., Gebetsberger, M., Goutail, F., Grutter de la Mora, M., Gruzdev, A., Gratsea, M., Hansen, G. H., Irie, H., Jepsen, N., Kanaya, Y., Karagkiozidis, D., Kivi, R., Kreher, K., Levelt, P. F., Liu, C., Müller, M., Navarro Comas, M., Piters, A. J. M., Pommereau, J.-P., Portafaix, T., Prados-Roman, C., Puentedura, O., Querel, R., Remmers, J., Richter, A., Rimmer, J., Rivera Cárdenas, C., Saavedra de Miguel, L., Sinyakov, V. P., Stremme, W., Strong, K., Van Roozendael, M., Veefkind, J. P., Wagner, T., Wittrock, F., Yela González, M., and Zehner, C.: Ground-based validation of the Copernicus Sentinel-5P TROPOMI NO2 measurements with the NDACC ZSL-DOAS, MAX-DOAS and Pandonia global networks, Atmos. Meas. Tech., 14, 481–510, https://doi.org/10.5194/amt-14-481-2021, 2021.
Verstraeten, W. W., Boersma, K. F., Douros, J., Williams, J. E., Eskes, H., Liu, F., Beirle, S., and Delcloo, A.: Top-down NOx emissions of european cities based on the downwind plume of modelled and space-borne tropospheric NO2 columns, Sensors, 18, 5–8, https://doi.org/10.3390/s18092893, 2018.
Vlemmix, T., Eskes, H. J., Piters, A. J. M., Schaap, M., Sauter, F. J., Kelder, H., and Levelt, P. F.: MAX-DOAS tropospheric nitrogen dioxide column measurements compared with the Lotos-Euros air quality model, Atmos. Chem. Phys., 15, 1313–1330, https://doi.org/10.5194/acp-15-1313-2015, 2015.
Vrekoussis, M., Richter, A., Hilboll, A., Burrows, J. P., Gerasopoulos, E., Lelieveld, J., Barrie, L., Zerefos, C., and Mihalopoulos, N.: Economic crisis detected from space: Air quality observations over Athens/Greece, Geophys. Res. Lett., 40, 458–463, https://doi.org/10.1002/grl.50118, 2013.
Wagner, T., Ibrahim, O., Shaiganfar, R., and Platt, U.: Mobile MAX-DOAS observations of tropospheric trace gases, Atmos. Meas. Tech., 3, 129–140, https://doi.org/10.5194/amt-3-129-2010, 2010.
Zhao, X., Griffin, D., Fioletov, V., McLinden, C., Cede, A., Tiefengraber, M., Müller, M., Bognar, K., Strong, K., Boersma, F., Eskes, H., Davies, J., Ogyu, A., and Lee, S. C.: Assessment of the quality of TROPOMI high-spatial-resolution NO2 data products in the Greater Toronto Area, Atmos. Meas. Tech., 13, 2131–2159, https://doi.org/10.5194/amt-13-2131-2020, 2020.
Zyrichidou, I., Koukouli, M. E., Balis, D. S., Kioutsioukis, I., Poupkou, A., Katragkou, E., Melas, D., Boersma, K. F., and van Roozendael, M.: Evaluation of high resolution simulated and OMI retrieved tropospheric NO2 column densities over Southeastern Europe, Atmos. Res., 122, 55–66, https://doi.org/10.1016/j.atmosres.2012.10.028, 2013.