the Creative Commons Attribution 4.0 License.
the Creative Commons Attribution 4.0 License.
 | 15 Jan 2021
Measurement report: Properties of aerosol and gases in the vertical profile during the LAPSE-RATE campaign
Jani Gustafsson
Ville Vakkari
Osku Kemppinen
Gijs de Boer
Anne Hirsikko
Unmanned aerial systems (UASs) are increasingly being used as observation platforms for atmospheric applications. The Lower Atmospheric Process Studies at Elevation – a Remotely-piloted Aircraft Team Experiment (LAPSE-RATE) in Alamosa, Colorado, USA, on 14–20 July 2018 investigated and validated different UASs, measurement sensors and setup configurations. Flight teams from the Finnish Meteorological Institute (FMI) and Kansas State University (KSU) participated in LAPSE-RATE to measure and investigate properties of aerosol particles and gases in the lower atmosphere. During the experiment, the performance of different UAS configurations were investigated and confirmed to operate reliably, resulting in a scientifically sound observational dataset. As an example, concentration of aerosols – including two new particle formation events, CO2 and water vapor, and meteorological parameters in the atmospheric vertical profile were measured during the short experiment. Such observations characterizing atmospheric phenomena of this specific environment would have not been possible in any other way and, thus, demonstrate the power of UASs as new, promising tools in atmospheric and environmental research.
- Article
(11197 KB) - Full-text XML
-
Supplement
(390 KB) - BibTeX
- EndNote


Most air pollution, including gases and particulates, is released near Earth's surface from various sources. The dispersion, transport and removal from the atmosphere of these particles and gases depends very much on deposition and atmospheric dynamical properties such as turbulent mixing (Tunved et al., 2013). The mixing height of the atmospheric boundary layer and wind speed and direction are influenced by a number of factors, including the amount of solar and surface stored energy and terrain inhomogeneity (Carbone et al., 2010). The atmospheric boundary layer can be investigated through various means, including balloon-borne soundings, tethersondes, dropsondes and hot-air balloons (e.g., Laakso et al., 2007; Greenberg et al., 2009; Nygård et al., 2017); towers (e.g., Heintzenberg et al., 2011; Andreae et al., 2015); remote sensors, including ceilometers, sodars, Doppler lidars and radar techniques (e.g., O'Connor et al., 2010; Schween et al., 2014; Hirsikko et al., 2014; Vakkari et al., 2015); and conventional research aircrafts (Hermann et al., 2003; Twohy et al., 2002; Benson et al., 2008). Unmanned aerial systems (UASs) have recently gained popularity as measurement platforms in atmospheric research. Generally, UASs possess numerous advantages over conventional platforms, since they are lightweight, low-cost and highly maneuverable with exceptional spatial and temporal coverage. However, use of UASs as measurement platforms still lacks specifically designed instrumentation, since the off-the-shelf instruments were typically used. Such an approach often requires extensive validation in order to ensure accurate and reliable observations in an atmospheric column (e.g., Ramanathan et al., 2007; Jonassen et al., 2015; Kral et al., 2018; Barbieri et al., 2019; de Boer et al., 2020a; Girdwood et al., 2020).
The Lower Atmospheric Process Studies at Elevation – a Remotely-piloted Aircraft Team Experiment (LAPSE-RATE; de Boer et al., 2020a) campaign broadly investigated the influence of continental, inhomogeneous terrain on lower atmospheric properties, land–air interactions, and the vertical distribution of aerosol particle and gas properties. LAPSE-RATE took place in the greater San Luis Valley (SLV) of Colorado on 14–20 July 2018. The experiment was organized in conjunction with the sixth conference of the International Society for Atmospheric Research using Remotely-piloted Aircraft (ISARRA) and included over 100 participants from a number of university, governmental and industrial teams. These participants supported the coordinated deployment of 35 different UASs, completing over 1300 flights and 250 flight hours in less than a week. Distributed research flight plans were made and carried out to observe several atmospheric phenomena, including the evolution of the atmospheric boundary layer during morning hours, the diurnal cycle of valley flows, convective initiation, and also the concentration of gases and properties of aerosol particles.
LAPSE-RATE flights were conducted under both Federal Aviation Administration (FAA) Certificates of Authorization (COAs) and FAA Part 107, with the COAs supporting flights up to altitudes of 914 m (3000 feet) above the ground level. In addition to the aerial assets, a variety of ground-based observational assets were deployed including the University of Colorado's Mobile UAS Research Collaboratory (MURC), the University of Oklahoma Collaborative Lower Atmospheric Mobile Profiling System (CLAMPS; Klein et al., 2015), two University of Colorado Doppler lidar systems, numerous radiosondes, and mobile surface instrumentation associated with vehicles and small towers deployed by a variety of institutes. For additional information on LAPSE-RATE, please see de Boer et al. (2020a, b, c) and Bell et al. (2020).
A flight team including two people from the Finnish Meteorological Institute (FMI) and one person from Kansas State University (KSU) participated in LAPSE-RATE. This publication summarizes the measurement setups and observations made by the FMI and KSU teams during the campaign. Section 2 provides an overview of the deployed rotorcraft and measurement modules, as well as an introduction of the validation techniques applied to the deployed sensors. A summary of the collected meteorological, aerosol and gas observations demonstrates the benefits of using UAS for making measurements of these quantities (Sect. 3). Finally, a concluding section outlines overall successes of the aerosol and gas payloads deployed by FMI and KSU during LAPSE-RATE. As a summary, the deployment of UAS-borne sensors provided new perspectives which could have not been collected with other profiling methods (e.g., ground-based remote sensing instrumentation).
During LAPSE-RATE, the FMI and KSU teams were stationed at a sampling site along County Road 53, approximately 15 km north from Leach Airport (37∘54′32.94′′ N, 106∘2′6.83′′ W; see Fig. 1). The location was generally very quiet, surrounded by farmland on all sides and only sporadically disturbed by passing local farm trucks. The elevation of the operation site was 2291 m (7516 feet) above the mean sea level (m.s.l.). The FMI team conducted flights under an FAA COA with a maximum allowed altitude of 914 m (3000 feet) above the ground level (a.g.l.). The KSU team conducted flights under FAA Part 107 with a maximum altitude of 121 m (400 feet) a.g.l.
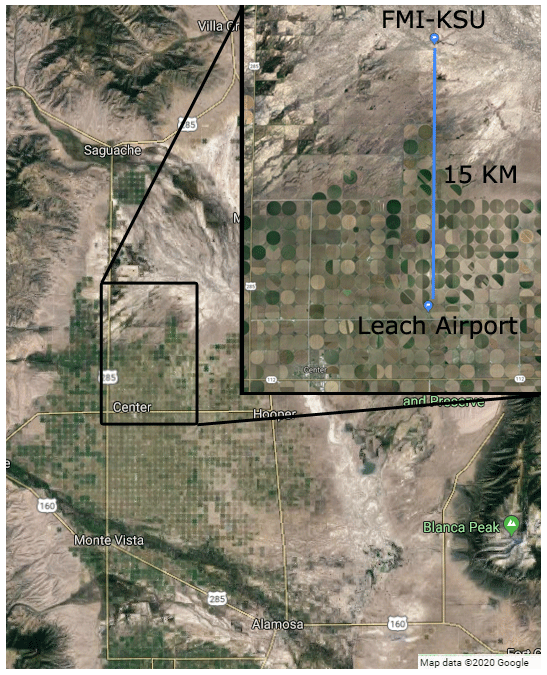
Figure 1Map of the wider San Luis Valley. The insert shows location of the FMI–KSU team spot and distance from Leach Airport. The airfield is located approximately 3.2 km east-northeast of the commercial district of Center, Colorado, and 32 km north-northwest of Alamosa, Colorado. Background map courtesy of © Google Maps.
2.1 Technical description of rotorcraft
The FMI team deployed two rotorcraft (FMI-PRKL1 and FMI-PRKL2) during LAPSE-RATE. Both of these aircraft shared the same configuration and were custom-built around the Tarot X6 hexacopter platform. The maximum endurance of these rotorcraft was about 15 min, using brand new 22.2 V, 16 000 mAh rechargeable lithium polymer (LiPo) batteries. This flight time was sufficient to achieve 893 m a.g.l. (close to the maximally allowed COA height of 914 m a.g.l.), when flying in stabilized flight mode and ideal low-wind conditions. A maximum gross takeoff weight of the rotorcraft was close to 11 kg.
Flight missions were carried out in a manual (stabilized) or loiter (GPS – Global Positioning System – position fix) mode, and autonomous flight missions were not carried out during the campaign. The flights were conducted using a 3DR Pixhawk PX4 flight controller running the ArduPilot software. The rotorcraft airframe was 960 mm (rotor-to-rotor) in diameter. Both rotorcraft used the same propulsion system consisting of 340 kV brushless motors, 40 A electronic speed controllers and 18 in. (0.46 m) (5.5 in. – 0.14 m – pitch) carbon fiber propellers. Such a setup supported lifting approximately 2 kg of active payload (i.e., scientific instrumentation). The rotorcraft also utilized a first-person viewer (FPV) video link, allowing for a real-time video broadcast from the aircraft to be viewed on a ground station monitor. The video link provided visual confirmation of the UAV (unmanned aerial vehicle) performance together with telemetry information overlaid via an on-screen display (OSD). UAV flight performance was recorded with a high-resolution digital video recorder (DVR) and stored for post-flight analysis. Finally, to avoid any high-energy impacts and to protect the expensive scientific instrumentation on board in case of a multi-level safety system failure, we employed a parachute system using a 60 in. (1.52 m) parachute rated for a 7 m s−1 descent speed for a 12 kg UAV. The parachute system had an independent power system and was configured for both manual and automatic launch; it was not used regularly for landing and only was in the case of an emergency to protect the costly payload.
The KSU rotorcraft was a DJI Matrice 600 Pro without any modifications, aside from payload attachments. The rotorcraft was controlled with the Matrice 600 Pro remote controller. Both DJI TB47S (six 4500 mAh, 22.2 V) and DJI TB48S (six 5700 mAh, 22.8 V) rechargeable LiPo batteries were used, alternating between battery types between flights. The maximum gross takeoff weight recommended by the manufacturer was 15.5 kg, which would have resulted in a maximum payload capacity of roughly 5.5 kg. However, such a takeoff weight would likely have been challenging given the high elevation of the San Luis Valley. The actual weight of the DJI Matrice 600 Pro was 9.5 or 10 kg depending on the battery set used. The payload maximum total weight was about 1.1 kg, comprised of the following: a DJI Zenmuse X3 (221 g), GoPro Hero 7 (117 g), naked POPS (700 g; Portable Optical Particle Counter, Handix Scientific LLC) and meteorological sensor (30 g, iMetXQ2, International Met Systems, Grand Rapids, Michigan, USA) borrowed from Oklahoma State University. Not all payload parts were used together during all flights.
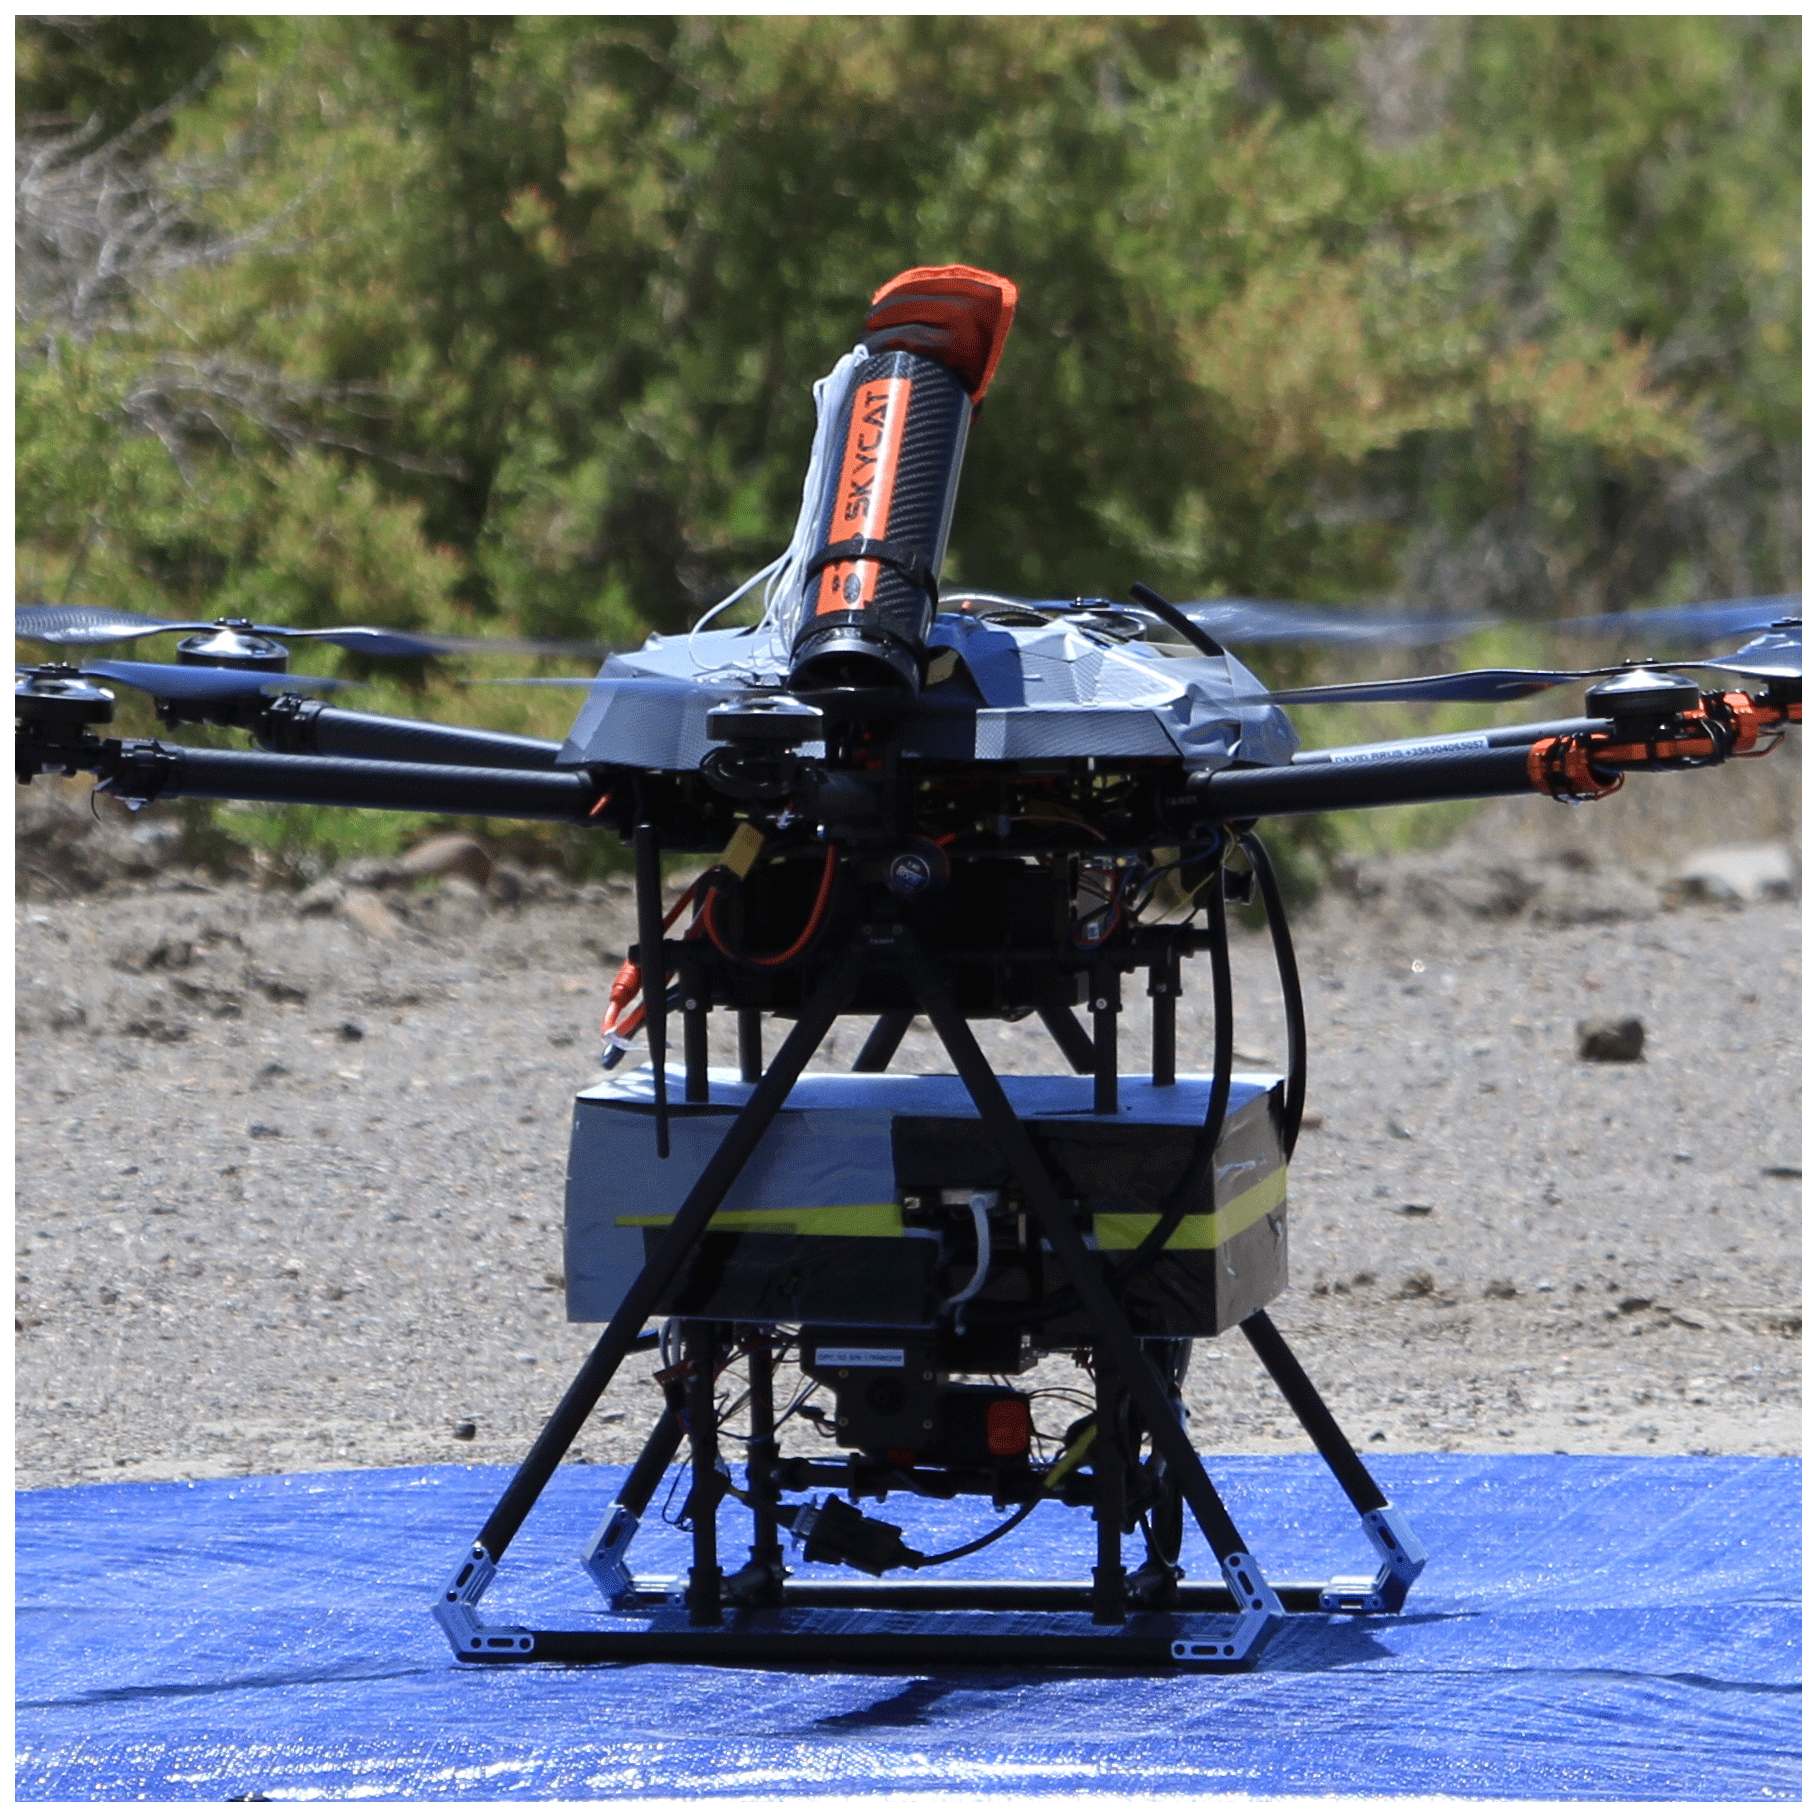
Figure 2Particle module attached to the Tarot X6 hexacopter at the takeoff and landing spot (blue tarp).
2.2 Description of payload modules
Both FMI rotorcraft carried custom-built payload modules consisting of a carbon fiber frame made out of tubes (outer diameter – o.d. – of 12 mm). A carbon fiber plate (30 at 20 cm and 2 mm thick), on which scientific instruments were attached, was centrally mounted on the module. The cm (height × weight × depth) frame was attached between the rotorcraft's retractable landing gear on the rails supporting the battery plate (Figs. 2 and 3). These modules could be easily detached from the rotorcraft frame, allowing for swapping between sensor modules to meet the requirements of a given flight. However, this was not necessary, since a pair of rotorcraft was available during the LAPSE-RATE campaign. The first FMI rotorcraft (FMI-PRKL1) was equipped with a FMI-developed particle measurement module. This module consisted of two condensational particle counters (CPCs; model 3007, TSI Corp.; total count in range from 0.01 to >1.0 µm), a factory-calibrated optical particle counter (OPC; model N2, Alphasense; 16 bins size resolved range from 0.38 to 17 µm) and a basic meteorological sensor (Bosch BME280; P, pressure; T, temperature; and RH, relative humidity). The CPCs were set to different cutoff diameters (7 and 14 nm, respectively; cf. Altstädter et al., 2015, 2018). Such a configuration enables observation of freshly nucleated particles in a diameter range between 7 and 14 nm. The voltage applied to the thermoelectric device (TED) of a CPC regulates the temperature difference between the saturation and condensation regions. This temperature difference determines how fast particles grow to CPC-detectable sizes (i.e., the cutoff diameter). Therefore, limitations to instrumental stability and sensitivity from changing saturator–condenser temperature differences limited the ability to observe the full nucleation mode range up to 20 nm. TED (thermoelectric device) values of 2000 and 1000 mV were used for CPC1 and CPC2, respectively. Each of the CPCs used a 30 cm inlet made of conductive tubing, led from the sides upwards to the center of the rotorcraft, where both lines were merged to an additional 10 cm piece of conductive inlet tubing, also facing upwards. Penetration for such an inlet was estimated to be between 90 % and 99 % for particles between 7 and 100 nm and 99 % for particles between 100 nm and 1 µm. The CPC calibration was done in the same way as described in Hämeri et al. (2002); the uncertainty of D50 values was determined to be ±0.8 nm. The total count was compared to a desktop, full-sized, more precise CPC (model 3772, TSI Corp.) with an accuracy of about 20 %, when the ambient air was sampled. There was no inter-comparison done for OPC-N2 counters against any more precise OPCs. Both OPCs, in the surface and particle module, were used with no additional inlet, as those OPCs were not meant to be used with any kind of inlet due to the use of a fan for aerosol intake. On the rotorcraft the OPC-N2 was mounted from the bottom and middle of the carbon plate of the module, thus shielding it from air mass movement and propeller eddies. In addition to the CPCs and OPC, FMI-PRKL1 included an Arduino Bosch BME280 sensor, located below the modular platform, to measure pressure (P), temperature (T) and relative humidity (RH). The platform was covered from all sides except the bottom, with polylactic acid (PLA) foam to protect sensors from solar radiation and keep the particle module thermally stable. The BME280 sensor was shielded from solar radiation but not forcefully aspirated. The BME280 sensor has a manufacturer-stated response time and accuracy of 6 ms and ±1 hPa for P, 1 s and ±0.5 ∘C for T, and 1 s and ±3 % RH for RH.
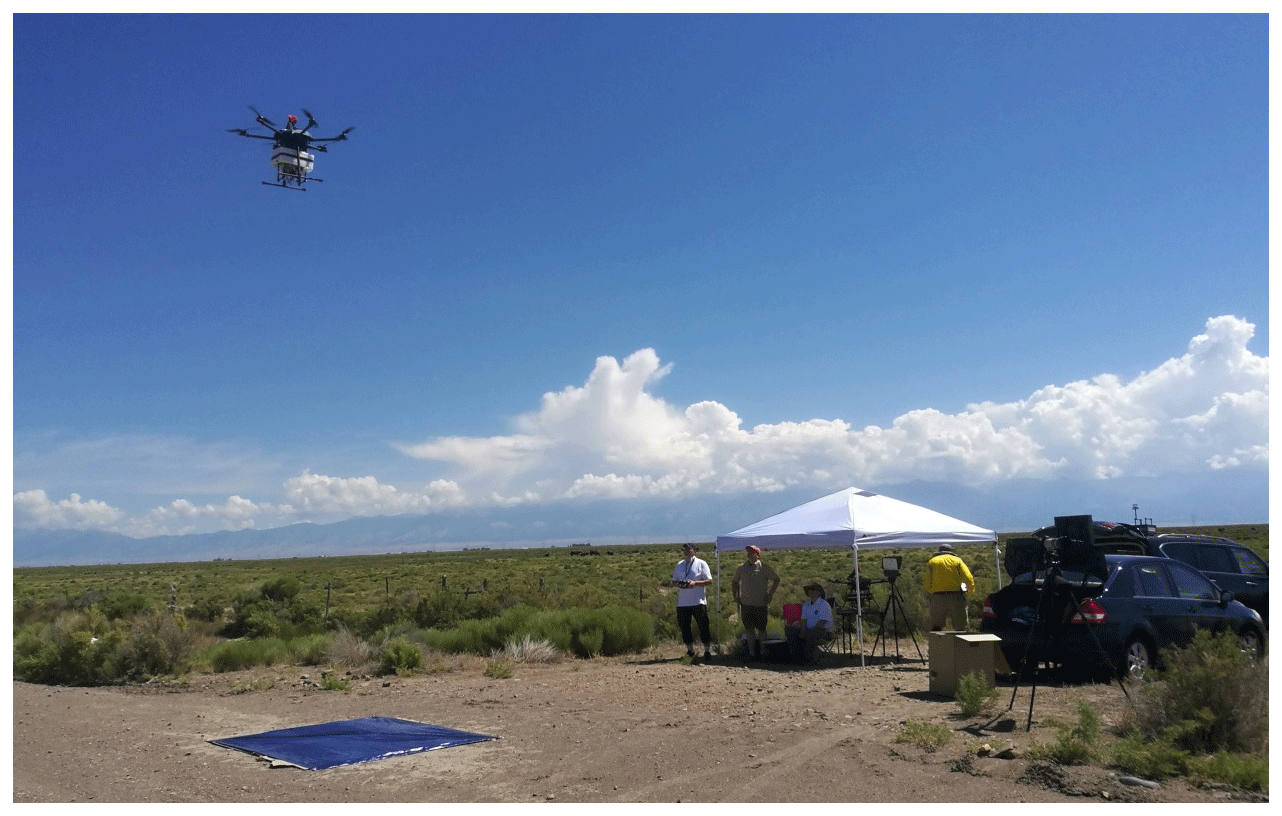
Figure 3FMI–KSU team at the dedicated spot during the LAPSE-RATE campaign. Gas module attached to the Tarot X6 hexacopter during airborne operation. Ground module with the TriSonica Mini can be seen on the roof of the car.
The second FMI rotorcraft (FMI-PRKL2) was equipped with a second FMI-developed module, carrying instrumentation to measure gases and basic meteorological parameters (P, T and RH). The gas module consisted of a flow-through CO2 concentration sensor (Carbocap model GMP343, Vaisala Inc.); a CO2 and water vapor analyzer (model LI-840A, LI-COR Environmental); and a sensor to measure concentrations of CO, NO2, SO2 and O3 (model AQT400, Vaisala Inc.). An Arduino BME280 sensor measured pressure, temperature and humidity. The BME280 sensor was mounted identically to the respective sensor on the FMI-PRKL1. Both BME280 sensors showed a difference of about +2 hPa in pressure, +2 ∘C in temperature and −12 % in RH, when compared to measurements from the MURC platform during LAPSE-RATE inter-comparison flights (for details please see Barbieri et al., 2019). Both CO2 sensors were forcefully aspirated using micro-blowers configured as air pumps (Murata, model MZB1001T02) and leveraging custom 3D-printed housings connected to the sensor exhaust. A Gelman filter in the sample airstream in front of both CO2 sensors prevented contamination of the optical path. Micro-blowers were supplied with 12 V DC (direct current) resulting in a constant flow rate of 0.6 L min−1 to continually flush measured air through the sample cells. The GMP343 and LI-840A are non-dispersive infrared (NDIR) gas analyzers based upon a single-path, dual-wavelength infrared detection system. The GMP343 has a manufacturer-stated accuracy of ±3 ppm ±1 % of the measured reading, and the LI-840A has an accuracy better than 1.5 % of the measured reading for both CO2 and water vapor.
Both CO2 sensors were laboratory-calibrated before and after the LAPSE-RATE campaign and showed no drift in calibration. The sensors were calibrated against standard carbon dioxide gases (traceable to World Meteorological Organization – WMO – CO2 scale X2007 at the FMI) at several concentrations (zero gas and 436 ppm before the campaign and 370, 405.4 and 440.2 ppm after the campaign). Also, both sensors were tested in the lab against a calibrated high-precision gas concentration analyzer (model G2401, Picarro, Inc.) at ambient CO2 concentration. The GMP343 data were biased on average −3.4 (±1.3) and LI-840A 0.3 (±1.1) ppm. Data from the GMP343 sensor were post-processed to account for pressure, temperature, RH (obtained from BME280 sensor) and oxygen by using the proprietary compensation algorithm of the probe obtained from Vaisala. For the LI-COR LI-840A, the built-in option for internal pressure, temperature and water vapor compensation of CO2 concentration was used. LI-COR LI-840A water vapor was calibrated in dew point measurements against a DewMaster Chilled Mirror Hygrometer (Edgetech Instruments Inc.).
The AQT400 (Vaisala Inc.) gas sensor is based on proprietary advanced algorithms and electrochemical technology. The sampled gas causes a reduction or oxidation reaction in an electrochemical cell, thereby creating a weak electric current that is directly dependent on the volume of the measured gas. The gas content is subsequently calculated using an advanced compensation algorithm. The detection limits of the Vaisala AQT400 are 5 ppb for NO2, O3 and SO2 and 10 ppb for CO, and the in-field accuracy is ±25, 60, 200 and 50 ppb for NO2, O3, CO and SO2, respectively.
A third FMI-developed sensor module was operated on the ground, consisting of a condensational particle counter (CPC; model 3007, TSI Corp.), an optical particle counter (OPC; model N2, Alphasense) and a TriSonica Mini Wind and Weather Sensor (Applied Technologies, Inc.). The manufacturer-stated accuracies for pressure, temperature and RH are ±3 hPa, ±0.5 ∘C and ±3 % RH, respectively. The surface sensor module was covered from all sides with PLA foam to protect sensors from solar radiation and keep the particle module thermally stable. The module was placed on the rooftop of a car at about 2 m from the ground; the TriSonica Mini was mounted on a 45 cm long carbon fiber tube on top of the surface sensor module, i.e., about 2.75 m from the ground and about 75 cm from the car roof.
All FMI-PRKL1 particle module and meteorological sensors were logged at a rate of 1 Hz, except the OPC-N2 that was logged at rate of 0.5 Hz. The sensors included in the FMI-PRKL2 gas module were logged at different rates, with the meteorological variables, CO2 and water vapor analyzer (LI-840A) logged at 1 Hz; the flow-through CO2 concentration sensor (Carbocap GMP343) logged at 0.5 Hz; and the gas sensor (AQT400, Vaisala Inc.) logged once per minute. The surface sensor module data were logged at 1 Hz, except the OPC-N2 that was logged at rate of 0.5 Hz. Data from both rotorcraft and the surface sensor module were logged as ASCII (American Standard Code for Information Interchange) comma-separated files to embedded Raspberry Pi 3+ minicomputers using simple Python scripts. This information was aligned with position and orientation information from the autopilot in post-processing, using cross-correlation techniques to align the signals in time.
The KSU Matrice 600 Pro was equipped with an optical particle counter (POPS, Handix Scientific LLC) with 16 size bins covering a range from 0.132 to 3.648 µm and measuring at 1 Hz. During LAPSE-RATE the airborne POPS used a horizontally oriented naked inlet measuring approximately 9 cm (3.5 in.) long with an inner diameter of 1.7 mm (0.069 in.). POPS included electronics, and its data were logged to a microSD card. POPS was attached to the top surface of the rotorcraft body with Velcro tape. It was not shielded from direct sunlight during the flights but was kept in shade while on the ground. The airborne POPS was in direct sunshine only for a limited time due to the short flight durations and was cooled during flight by airflow relative to the platform's motion. As a consequence, the highest optical-chamber temperature recorded was 33 ∘C. A duplicate POPS instrument was operated as a ground reference; it was located approximately 1.8 m a.g.l. and used a vertically oriented tube inlet of approximately 45 cm (18 in.) long with an inner diameter of 3.175 mm (0.125 in.). The penetration through the inlet was estimated to be ∼92 % for 3 µm particles and better for smaller ones. The ground POPS was exposed to a longer duration of direct sunshine and less airflow. As a result, the highest optical-chamber temperature recorded was 53 ∘C. The manufacturer does not give a specific recommendation for the optical-chamber temperature, but after reviewing the data no concerns were raised about the potential of instrument overheating. As such, we believe that the temperatures are within acceptable ranges, especially for the airborne unit.
2.3 Auxiliary data
Air mass history was investigated using the Lagrangian particle dispersion model FLEXPART (FLEXible PARTicle), version 9.02 (Seibert and Frank, 2004; Stohl et al., 2005). European Centre for Medium-Range Weather Forecasts (ECMWF) operational forecasts were used as meteorological input to the FLEXPART back trajectories. The spatial resolution of the ECMWF forecast is 9 km horizontally and variable in the vertical (137 model levels), and we obtained the model fields at 0.1∘ latitude–longitude resolution for an area of 10–75∘ N and 175–70∘ W. The temporal resolution of this ECMWF product is 1 h. We obtained potential emission sensitivity fields from backwards simulations with FLEXPART to estimate air mass history (Seibert and Frank, 2004). The simulations were run 96 h backwards, and output was saved at a 30 min time resolution. We used also mixing height of the atmospheric boundary layer (mixing-layer height – MLH) from the ECMWF operational forecast, calculated as the mean of the four nearest model grid points to the measurement location.
Altogether, the FMI team completed 38 vertical-profile flights. Of these, 14 flights were completed with the particle module, and 24 flights were completed with the gas module. The maximum achieved height was 893 m a.g.l. (i.e., altitude of 3201 m m.s.l.). Vertical profiles were performed by alternating flights between the particle and gas modules, with approximately 30 min between flights. The surface module logged continuously during the whole flight operation period. The first six flights conducted on 15 July were test flights designed to evaluate and fix several issues that arose due to the transport of equipment between Finland and Colorado. The KSU team completed in total 33 flights with their payload, including 40 individual vertical profiles. It should be noted that some of these profiles were redundant, made within a few minutes of each other and repeated in the exact same location as another profile. The redundant flights were completed to test the consistency of the instrument. All profiles were measured up to 121 m a.g.l. During the first 3 d (15–18 July), the FMI and KSU teams' flight missions focused on the vertical profiling of aerosol particle and gas properties. During the last sampling day (19 July), the FMI and KSU teams joined the other LAPSE-RATE participants in order to conduct flights evaluating cold-air drainage from local valleys during the morning hours.
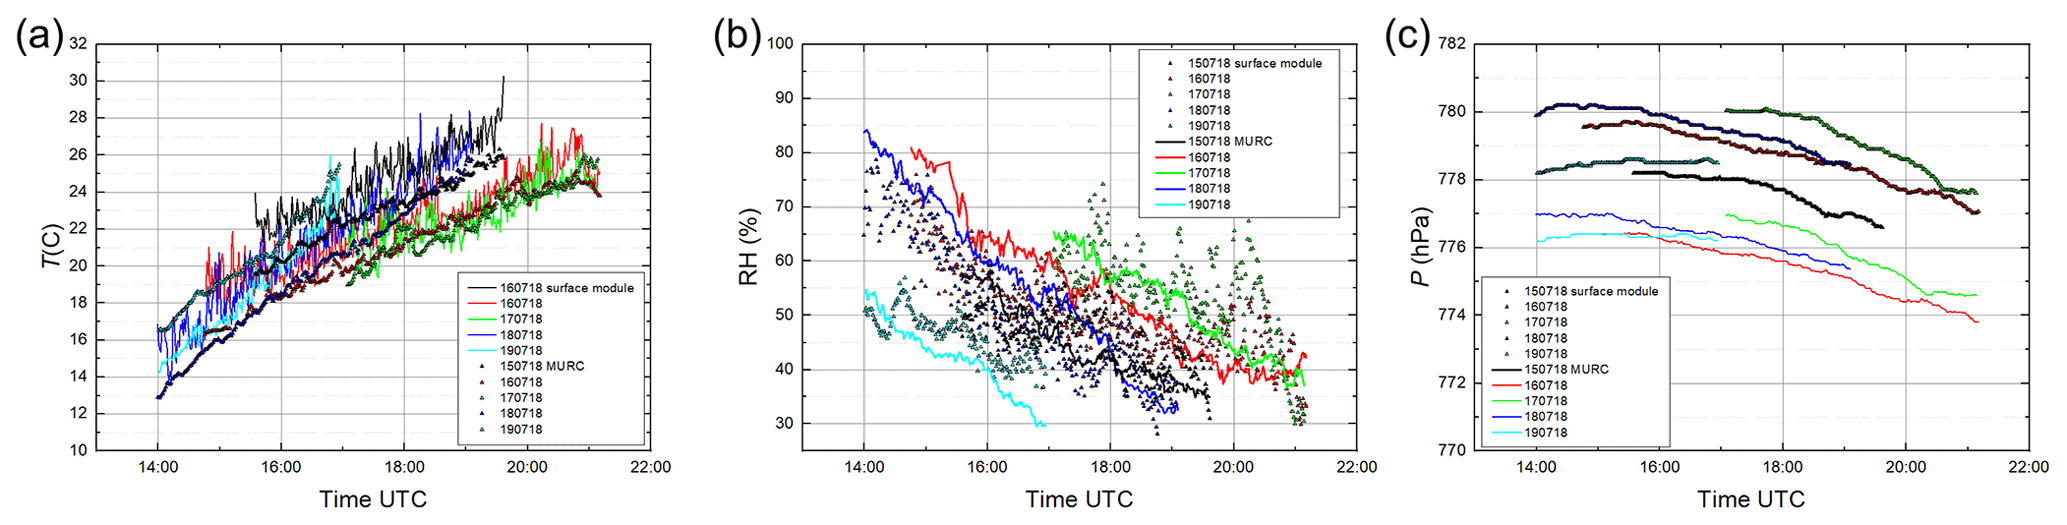
Figure 4Diurnal values measured with the TriSonica Mini mounted to the FMI surface module compared to observations by the MURC tower positioned at Leach Airport: (a) temperature, (b) RH and (c) pressure. The local time is minus 6 h from UTC.
3.1 Ground observations
3.1.1 Meteorological variables
Weather forecasting and modeling support for the LAPSE-RATE campaign was provided by the National Weather Service forecast office in Pueblo, Colorado, and the National Center for Atmospheric Research (NCAR). In general the San Luis Valley is dry during summer months, though convections occur frequently over the surrounding mountains. A convection results in an afternoon thunderstorm which, in favorable wind and moisture conditions, can occasionally precipitate over the valley. The detailed description of daily meteorological conditions in the SLV during the LAPSE-RATE campaign was given in de Boer et al. (2020a).
The surface sensor module measured continuously meteorological variables (temperature, relative humidity, pressure, and wind speed and direction) and aerosol concentration (CPC and OPC-N2) but only during the UAV operation. We compared observed meteorological variables to those obtained with MURC. MURC was equipped with a 15 m high expandable mast mounted with several meteorological sensors including a Gill MetPak Pro Base Station that provided barometric pressure, temperature and humidity; a Gill 3D sonic anemometer for 3D wind measurements; and an R. M. Young Wind Monitor anemometer that provided a redundant horizontal wind measurement (see de Boer et al., 2020c). During the majority of the campaign, MURC was positioned at Leach Airport, about 15 km south from our location (Fig. 1). The MURC tower was the only reference measurement point in the vicinity of our location. Figure 4a and b presents diurnal temperature and relative humidity measured with the TriSonica Mini mounted on the FMI surface module together with MURC data for the same time span. Comparison of observed temperatures suggests that just before midday, when ambient air temperature exceeds 20 ∘C and is likely homogeneously distributed over a large area, differences between values were within the accuracy of the sensors. During morning hours localized gradients in ambient conditions were more pronounced, resulting in significant differences (up to 4 ∘C) between observations at the two locations. Observations for pressure follow similar diurnal trends at the two locations (Fig. 4c). However, pressure measured by the TriSonica Mini is on average 3 hPa higher than the values measured by MURC. Constant bias corresponds to about 13 m higher elevation of MURC sensors compared to the TriSonica.
3.1.2 Aerosol particle concentration
The FMI and KSU teams were the only ones to perform aerosol measurements during LAPSE-RATE. The aerosol number concentrations measured with the CPC of the surface sensor module were relatively stable during the whole campaign (15–19 July), and a similar diurnal cycle was observed every day (Fig. 5). The average total aerosol number concentration measured was around 1551 cm−3, with minimum and maximum concentrations around 1211 and 2249 cm−3, respectively, over the whole campaign. A slight increase in aerosol concentration occurred during the midday hours, between approximately 16:00 and 19:00 UTC (from 10:00 to 13:00 LT – local time; Fig. 5). Increased anthropogenic activity in the San Luis Valley during morning hours is believed to result in an increase in production of primary particles from traffic and also creation of a pool of precursors for gas-to-particle conversion which activate due to daytime solar radiation. On average the total aerosol number concentration measured by the POPS at the surface was about one-third of that measured by the CPC, around 532 cm−3, with minimum and maximum concentrations around 338 and 787 cm−3, respectively, over 3 d of POPS measurements (Fig. 5). Occasional spikes in aerosol number concentration, up to 40 000 cm−3 for the CPC and up to 16 000 cm−3 for the POPS and lasting up to 3 min, were removed from datasets. Such high concentration peaks were caused by farm vehicles passing the sampling location. The number concentration of particles measured by the OPC-N2 (particles diameter between 0.38 to 17 µm) was generally very low, with an average concentration of about 1.2 cm−3, a minimum concentration of 0.7 cm−3 and a maximum concentration of 5.3 cm−3 (Fig. 6). Coarse-mode particle number concentration made up only a marginal fraction of the total aerosol number concentration. Corresponding average PM10 values were observed to be around 4.4 µg m−3, with a minimum 0.8 µg m−3 and a maximum of 127 µg m−3. Such total particle number concentrations and particulate matter mass concentrations are typical for rural areas, which the San Luis Valley undoubtedly is. Continuous air quality measurements are sparse throughout Colorado, and according to the Environmental Protection Agency website the average PM2.5 concentration is 18±5 µg m−3, and the PM10 concentration is 58±23 µg m−3, published as an averaged maximum 24 h concentration.
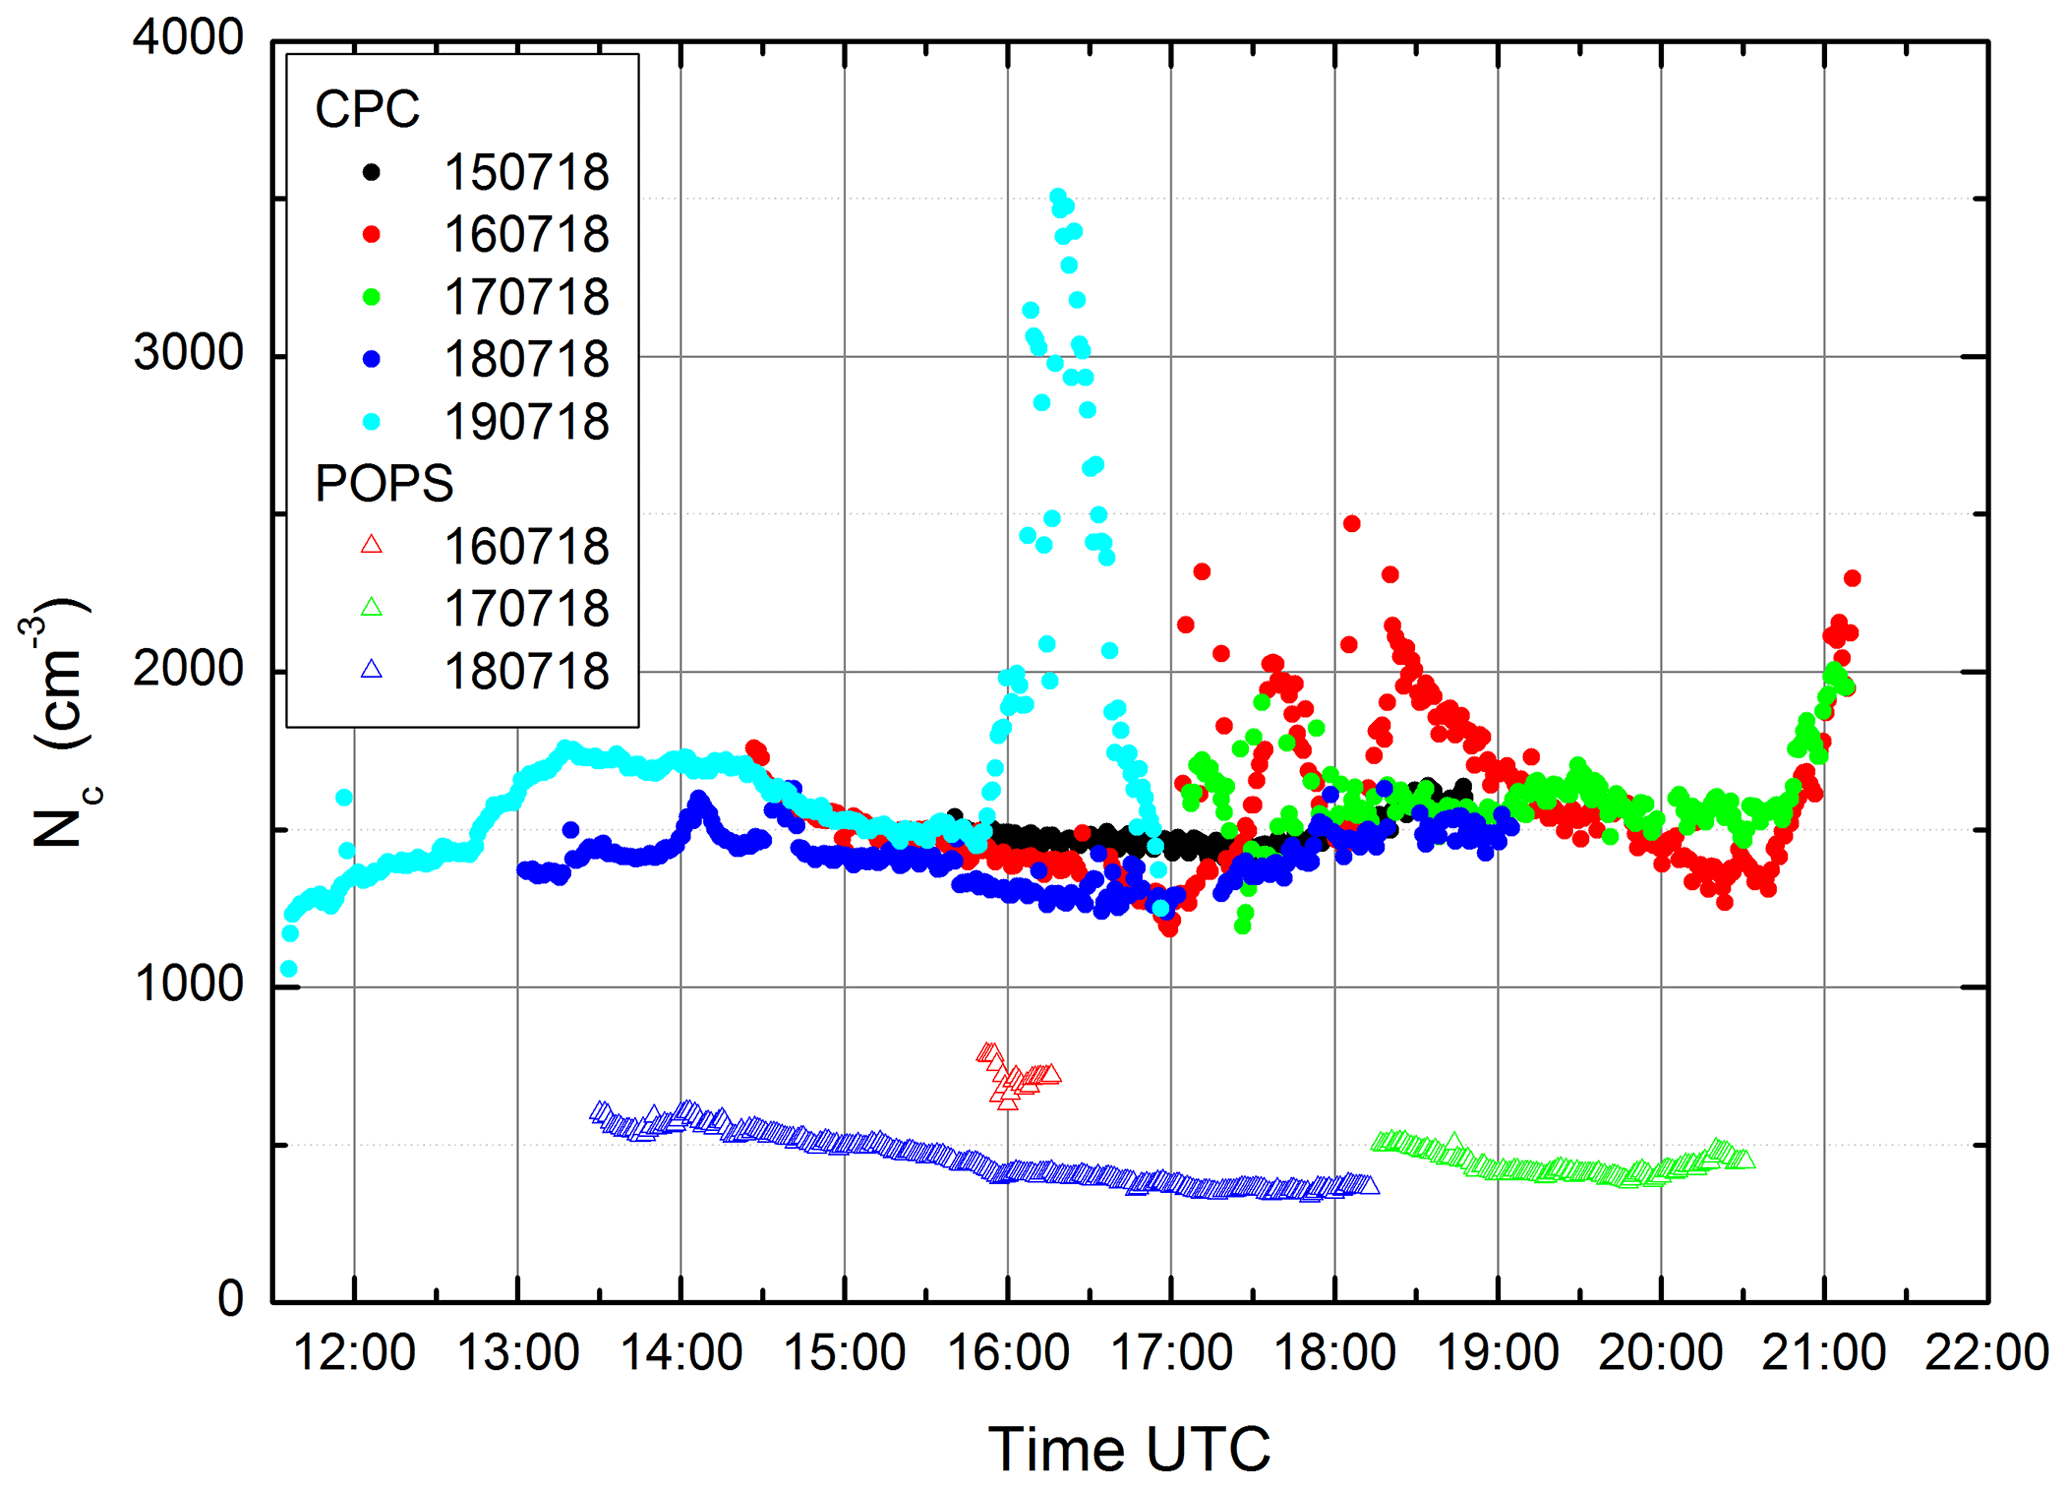
Figure 5Total aerosol number concentration (minute averages) measured with the CPC TSI 3007 (from 15 to 19 July) and POPS (from 16 to 18 July) at the surface.

Figure 6Total aerosol number concentration (minute averages) measured with the OPC-N2 at the surface from 15 to 19 July.
The particle number size distributions measured by the POPS and OPC-N2 agree within a factor of 2 in the overlapping size range between 0.46 to 3.5 µm, and together both particle counters cover accumulation and coarse modes (Fig. 7). The diurnal changes in number size distribution were minimal, and neither condensation nor evaporation processes were observed.
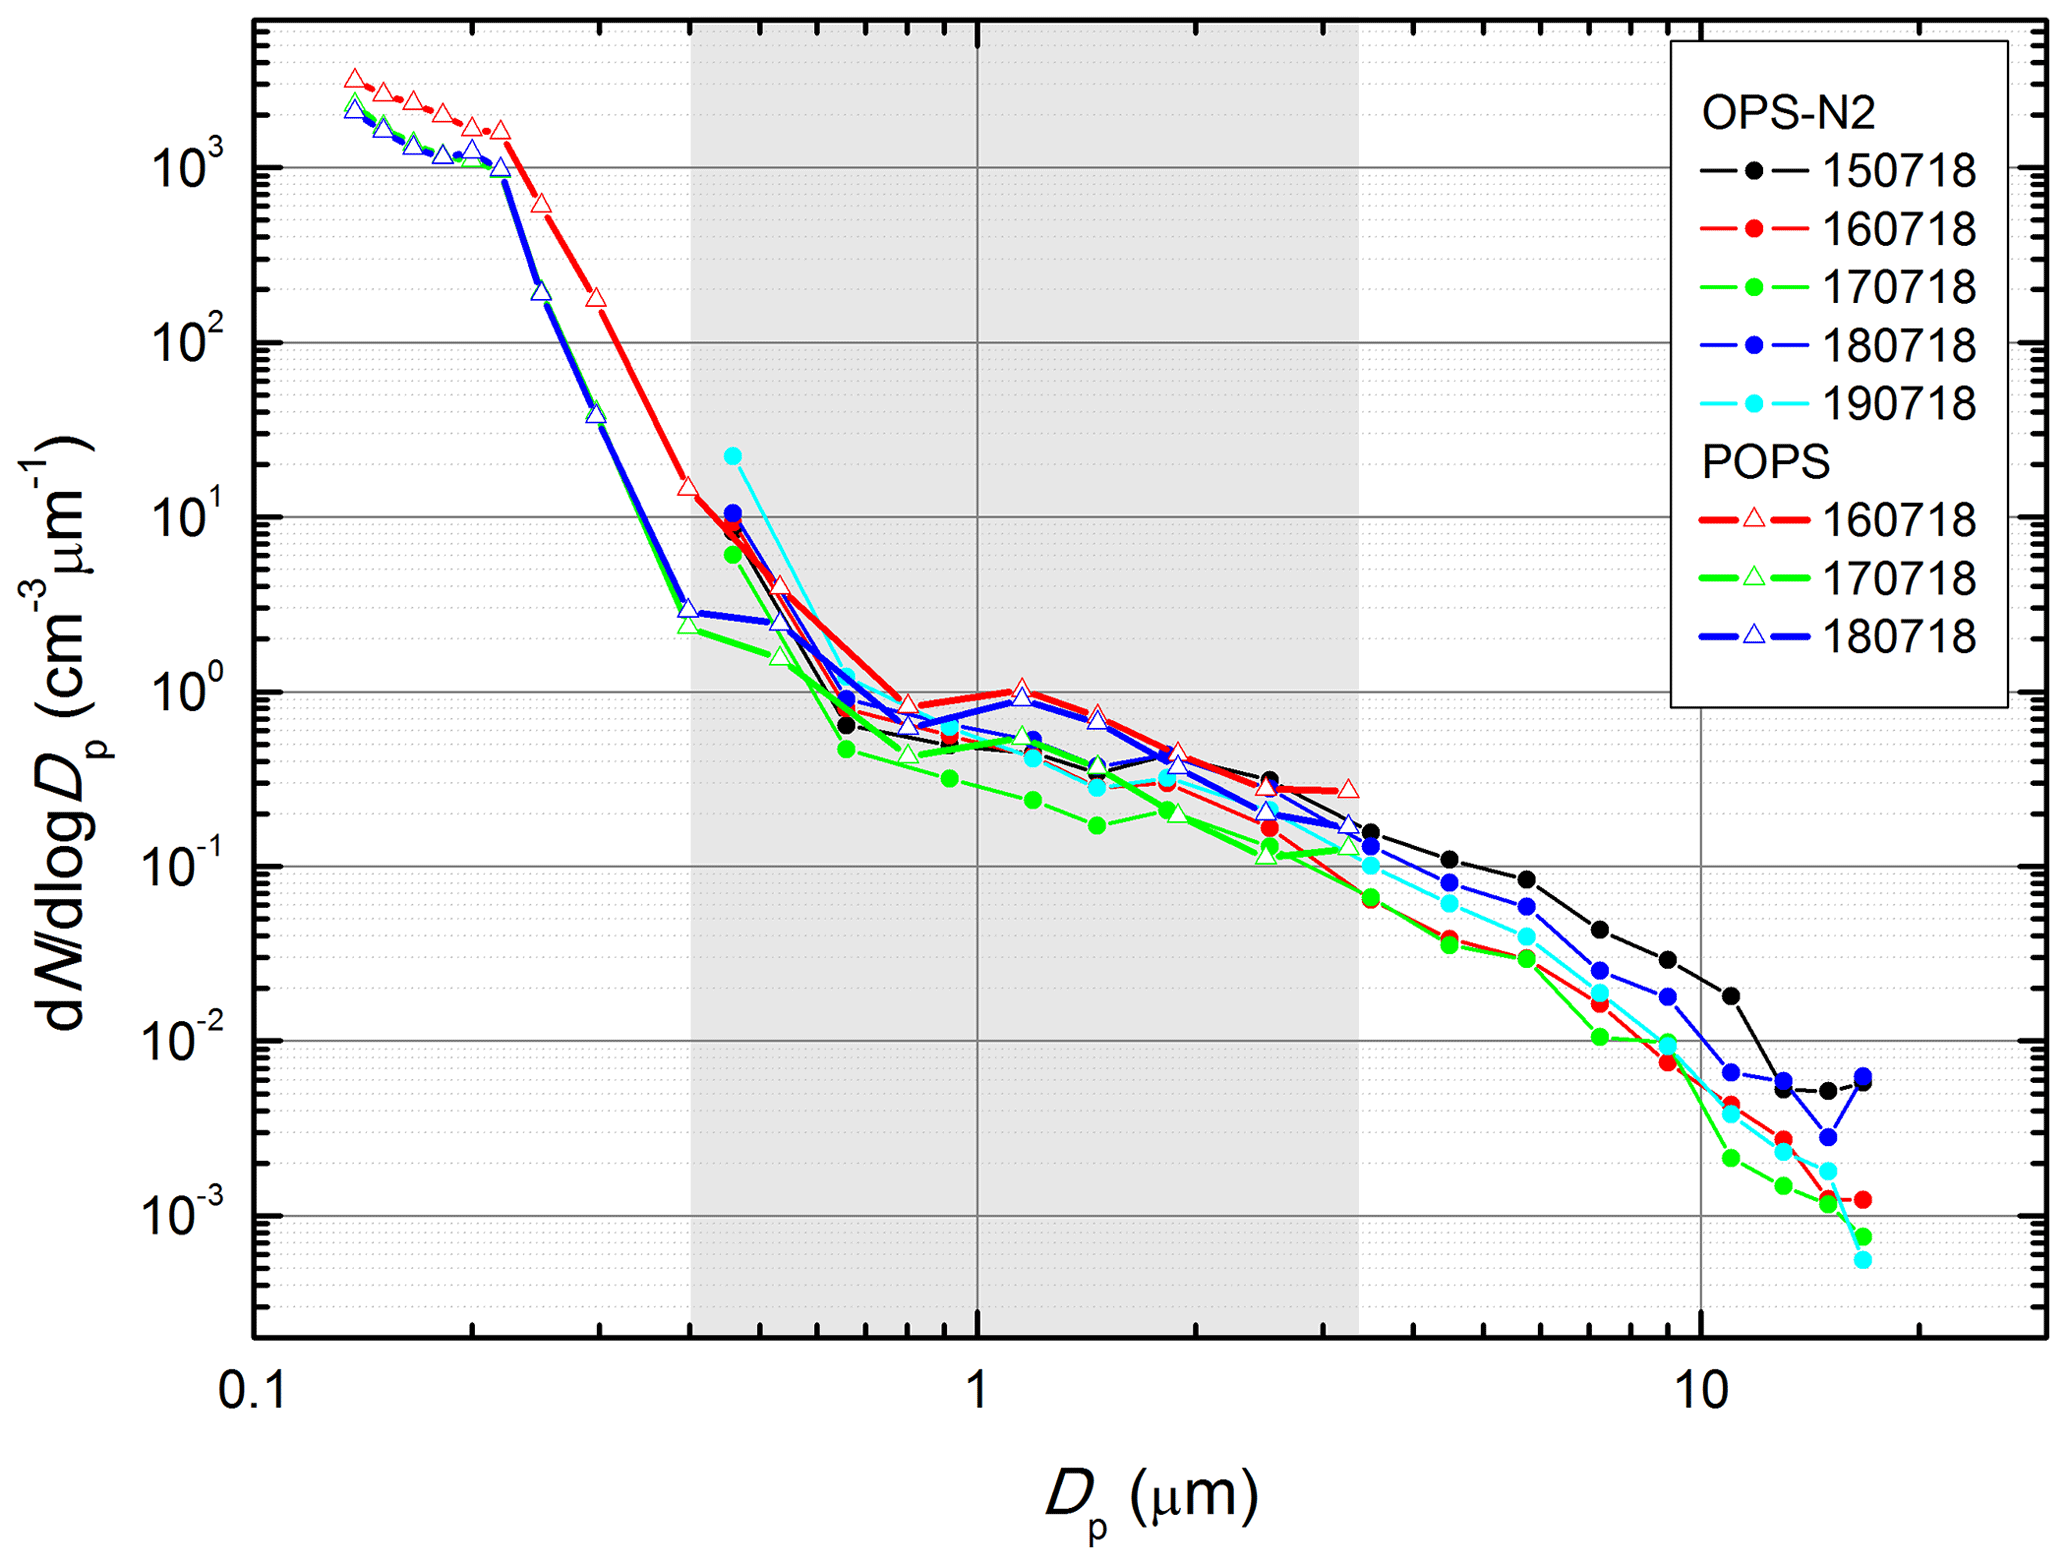
Figure 7Aerosol number size distribution (diurnal averages) measured with the OPC-N2 and POPS (plotted separately) at the surface from 15 to 19 July. The grey area represents overlapping sizes of both particle counters.
Also, a short inter-comparison (∼5 min) was performed before each flight among the surface and airborne particle counters to check their performance, with comparisons being completed through visual comparisons of real-time data on the laptop screen. Based on data post-processing, the particle and surface module CPCs compared well within the paper's stated uncertainty of 10 %, except for 16 July when new particle formation (NPF) at the surface level took place. This difference is a result of the different calibrated cutoff diameters implemented in each CPC. The OPCs compared within a factor of 2; however it has to be considered that very low particle concentrations were measured, about 2 cm−3 in the OPCs size range. There were no inter-comparison measurements made for POPS instruments. For more details, please see the Supplement of the paper.
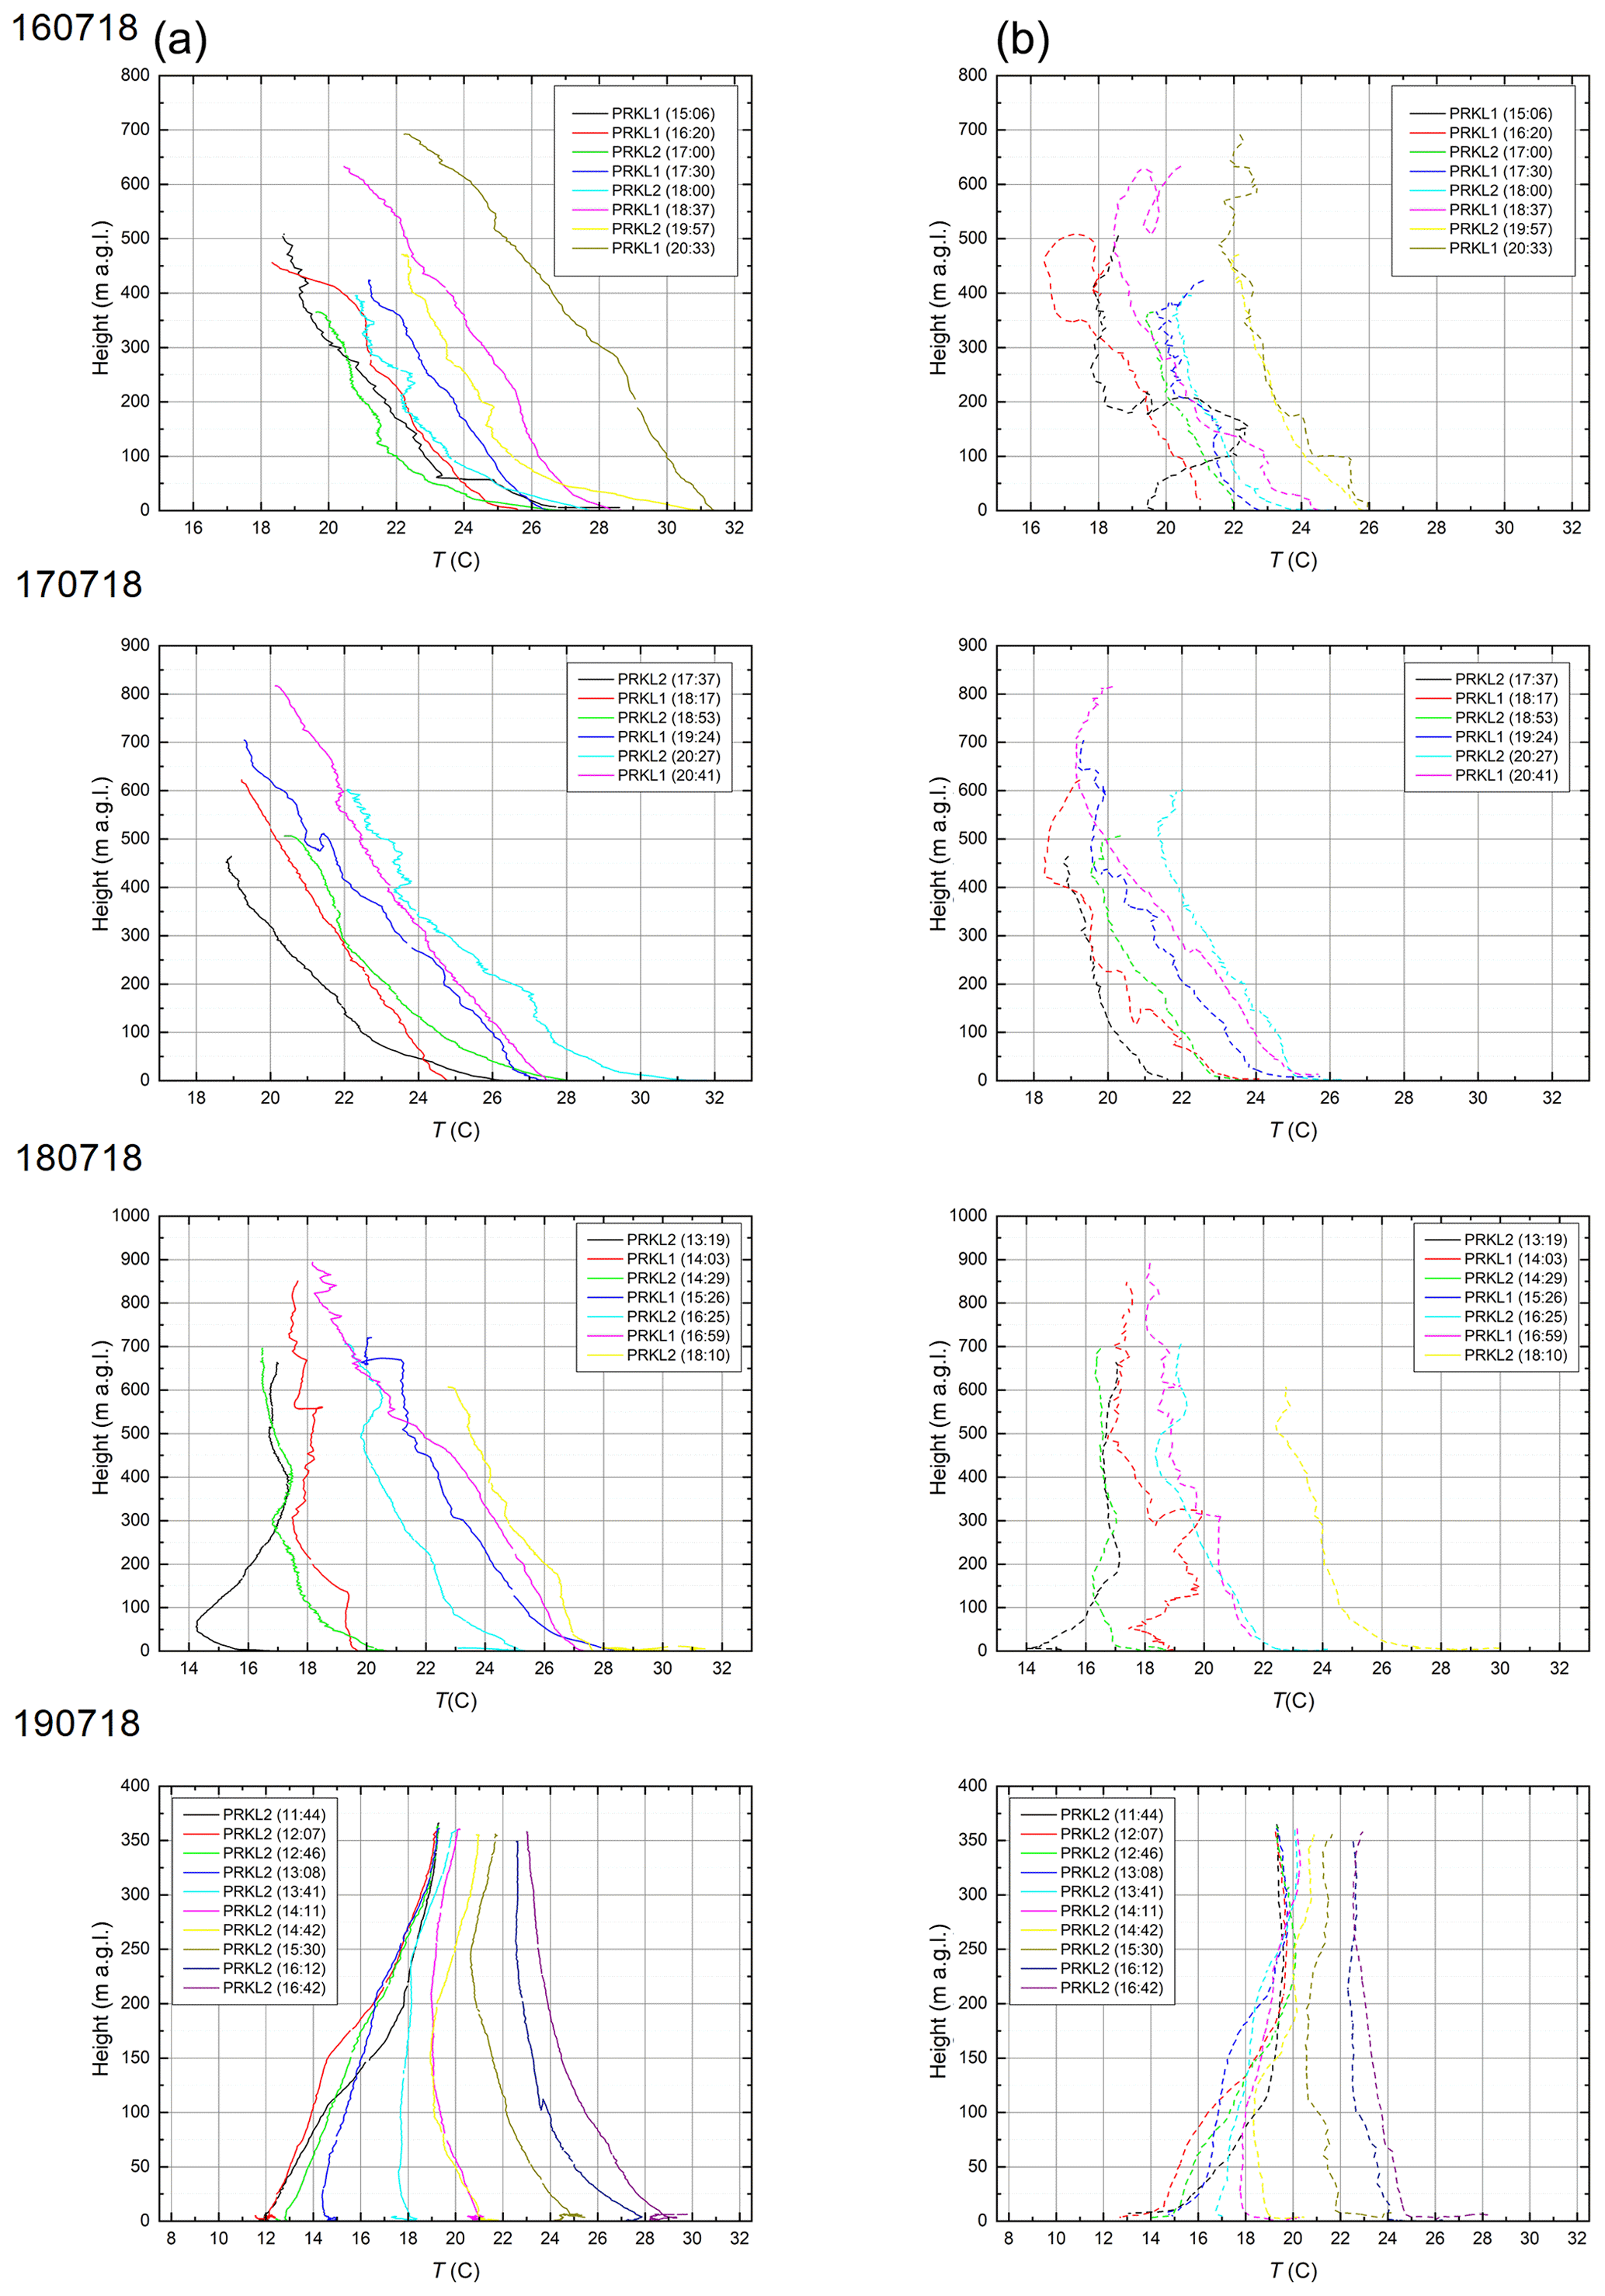
Figure 8Vertical profiles of temperature measured by the BME280 Arduino sensor from 16 to 19 July. Solid lines (a) represent ascent data, and dashed lines (b) represent descent data.

Figure 9Vertical profiles of relative humidity measured by the BME280 Arduino sensor from 16 to 19 July. Solid lines (a) represent ascent data, and dashed lines (b) represent descent data.
3.2 Vertical-profile observations
3.2.1 Reliability of observations
The measured profiles of temperature (Fig. 8) and relative humidity (Fig. 9) were divided between ascending and descending datasets by recorded altitude parameters. The data profiles showed quite a strong hysteresis in observed temperature and relative humidity, resulting in significant offsets between the ascending and descending profiles. Therefore, the observations are presented separately as solid curves for ascending legs and dashed curves for descending portions of the profiles. The hysteresis is a result of the flight strategy, the goal of which was to reach the highest altitudes possible in a very short time. The BME280 Arduino sensor response was not fast enough to equilibrate to the quick changes in ambient conditions. Our ascent rates were approximately 5–8 and 3–5 m s−1, and descent rates were about 2–5 and 2–3 m s−1 for flights with a particle module (FMI-PRKL1) and gas module (FMI-PRKL2), respectively. Based on our experience, the strong hysteresis disappears when the ascent and descent rates are close to 1 m s−1 or slower. The correction of the hysteresis error was not made, since it is the coupled effect of the wet and dry RH values and the elapsed time from the RH condition change during the fast vertical movement of the rotorcraft. The ascent data are probably closer to the “true” profile and are preferred over the descent data.
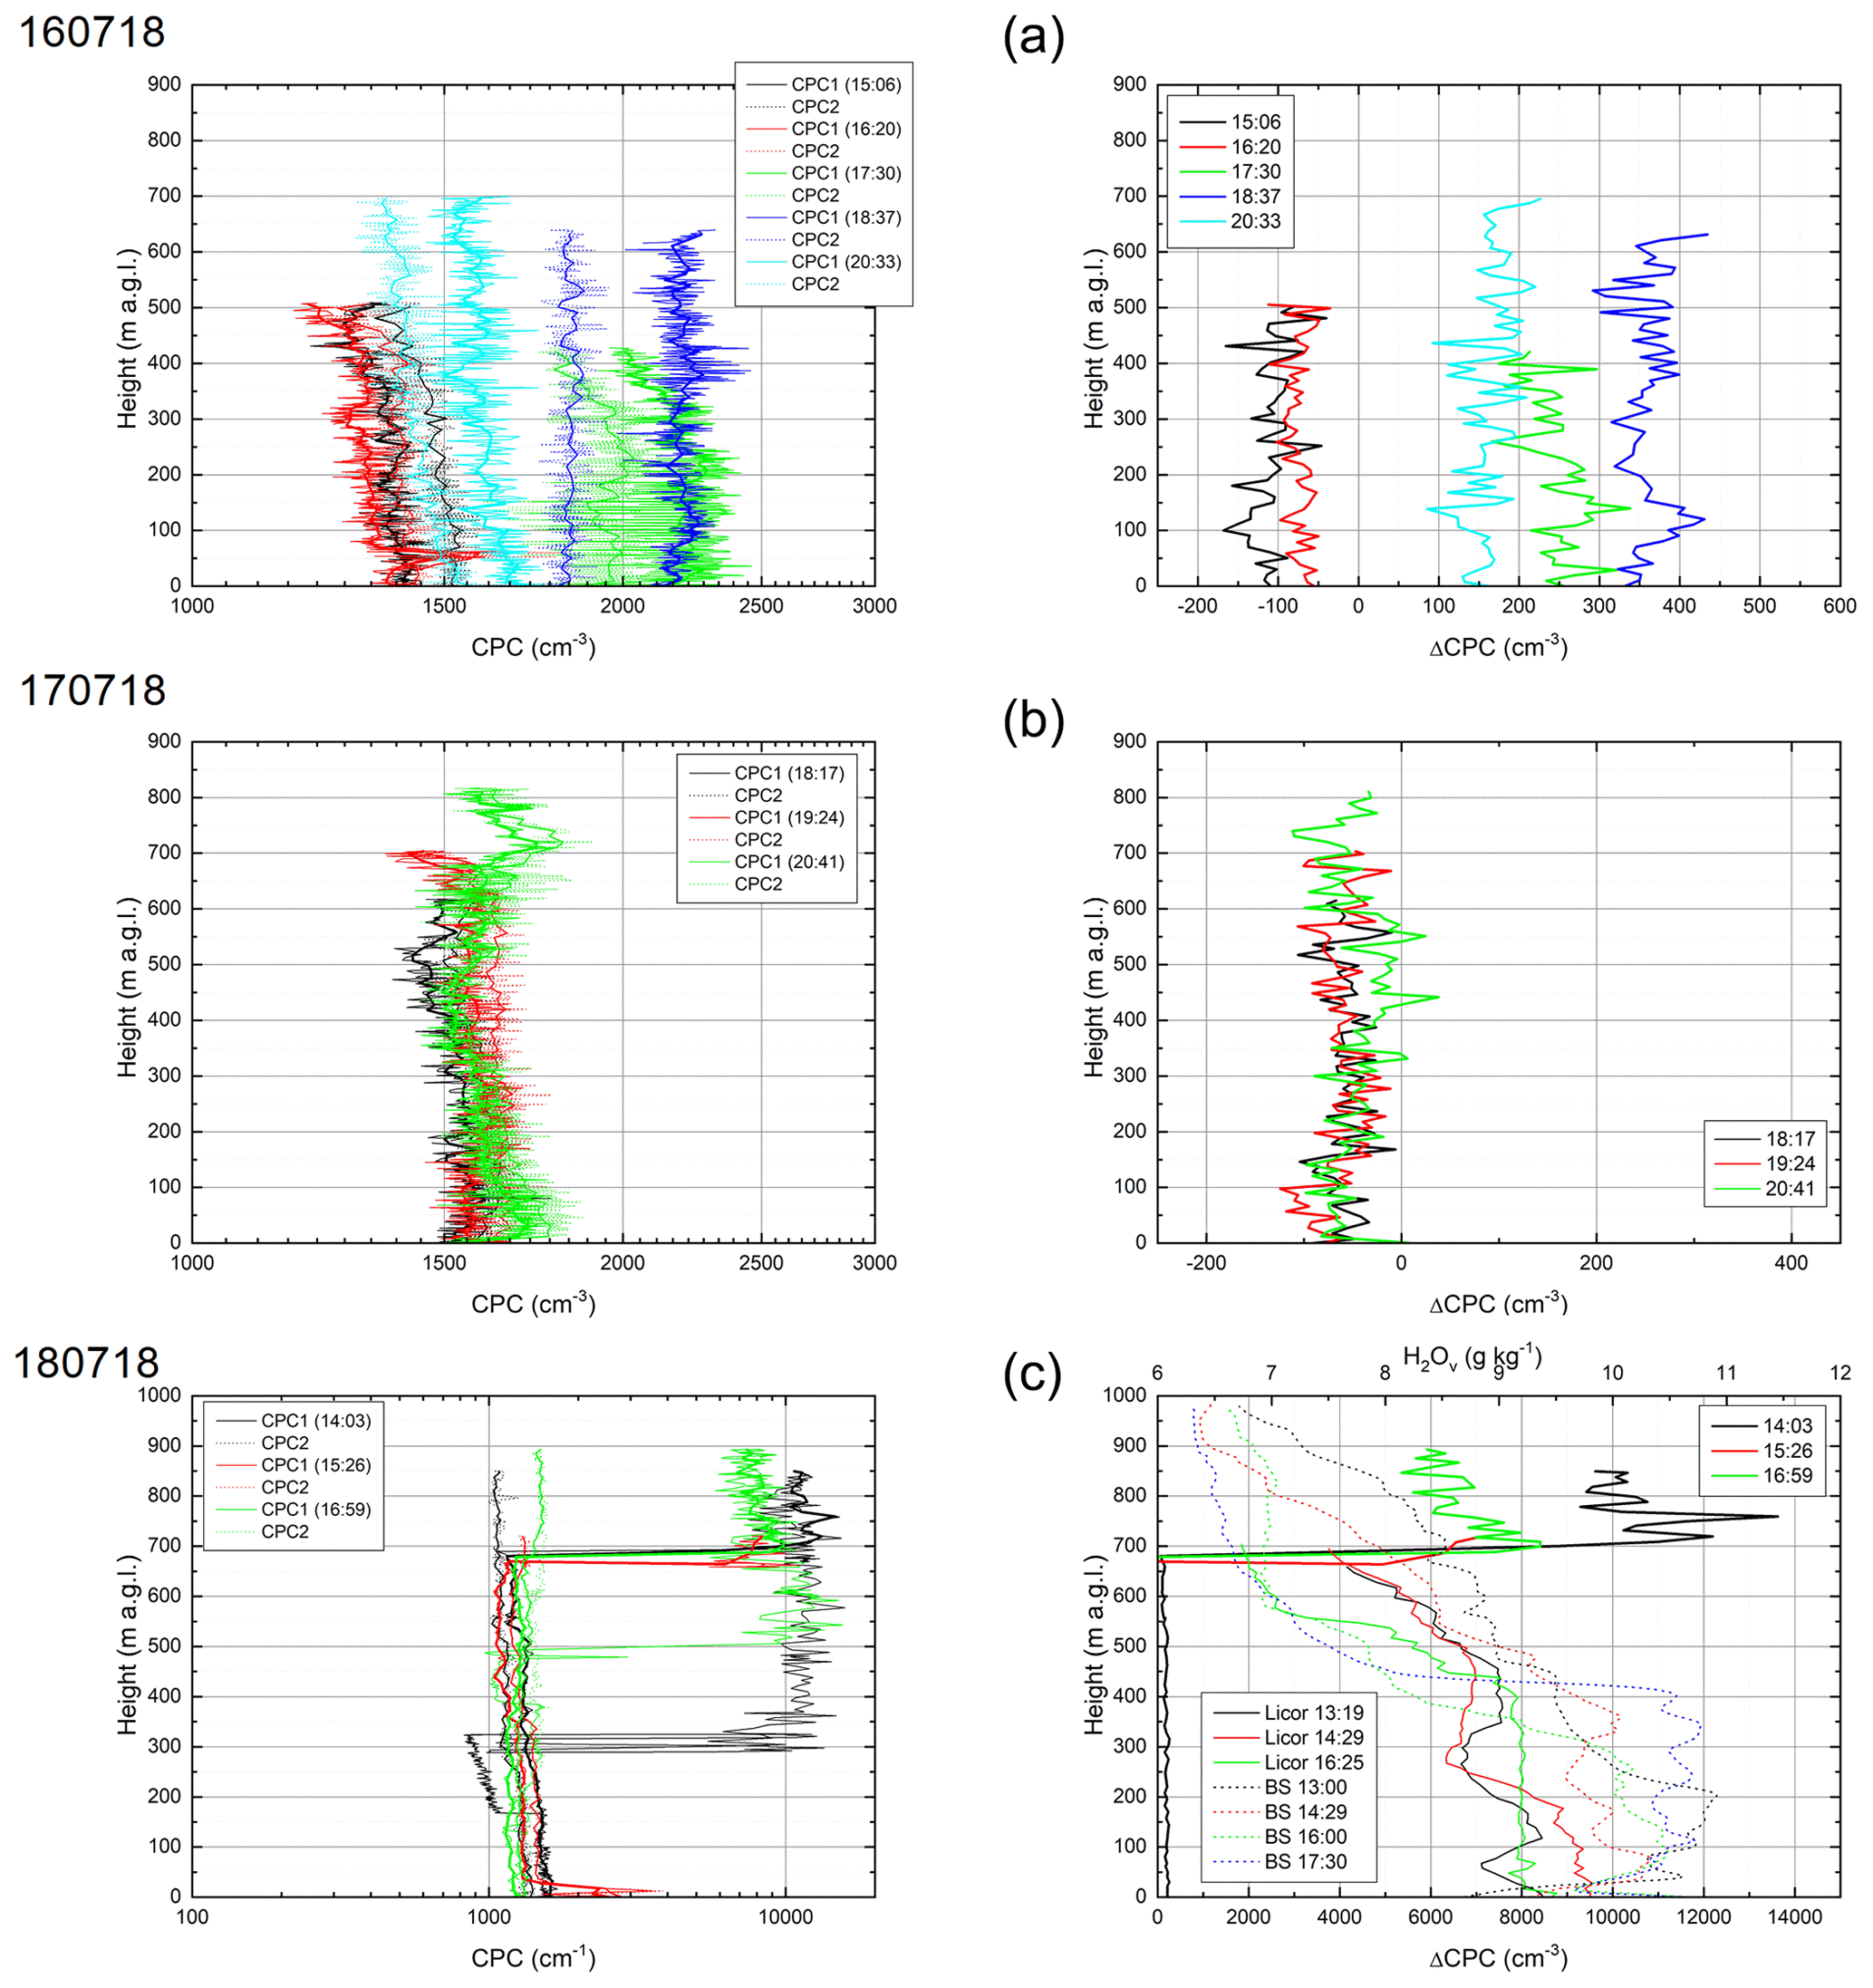
Figure 10Vertical profiles of total aerosol measured with two CPC TSI 3007 units in the particle module on 16–18 July. CPC1 with a cutoff diameter D50 of 7 nm (solid lines) and CPC2 with D50 of 14 nm (dotted lines). Observation of new particle formation (NPF) event: (a) a weak NPF event measured throughout the measurement heights on 16 July; the event developed throughout the day with no NPF in the morning, followed by a slight increase in the particle freshly formed particle number concentration during midday and a decrease during the afternoon. (b) No NPF event measured on 17 July. (c) A strong NPF event was observed on 18 July from 700 m a.g.l. (3000 m m.s.l.) upwards through early morning (08:03 LT – local time) and midday (10:59 LT). Water concentration vertical profiles measured with the LI-COR LI-840A and calculated from the balloon sounding (BS) parameters demonstrate the decoupling of free-troposphere nucleation from the atmospheric boundary layer.
Measured profiles of aerosol particles did not show any lag in instrument response during ascending and descending legs, and therefore both profiles were bin-averaged using 1 and 10 m vertical bins. Conversely, measured profiles of CO2 revealed a slight lag in sensor response time, though both ascending and descending profiles were within the boundaries of measurement scatter. Therefore, despite the apparent time lag, we proceeded similarly, as in the case of aerosols, with both ascending and descending profiles being averaged using 1 and 10 m vertical bins.
Temperature and relative humidity vertical profiles showed expected behavior, a decrease in air temperature with altitude during the first 3 d, 16–18 July. A temperature inversion was observed during the first two flights completed in the early morning of 18 July. The temperature on the ground gradually increased due to increasing solar energy, resulting in the gradual development of a convective boundary layer and a general warming of the environment near the surface. At the same time, relative humidity was observed to generally increase with decreasing temperature as would be expected in well-mixed conditions, though occasional single layers were detected with the opposite behavior (Figs. 8 and 9). During the last flight day of the campaign, when the FMI and KSU teams joined the common LAPSE-RATE mission to monitor cold-air drainage, a temperature inversion was observed. During the first flight day (on 16 July) the relative humidity was not recorded, since the calibration constants were not read correctly.
3.2.2 New particle formation in the atmospheric vertical profile
Vertical profiles of particle number concentrations suggest that new particle formation (NPF) events were observed as an increase in particle number concentration in the nucleation mode (<20 nm) of the number size distribution. With the employed instrumentation suite, NPF can be monitored as a difference in particle number concentrations between readings from CPC1 (cutoff D50 of 7 nm) and CPC2 (cutoff D50 of 14 nm). It should be noted that in some cases the CPC2 slightly over-counted particles compared to CPC1, resulting in negative ΔCPC values. However, the difference in observed counts remains within the uncertainty of the instrument (<10 %) at all times.
For the entire dataset, we have attempted to separate collected measurements into three different NPF classification regimes. These can be classified as follows: (1) no NPF event (15 July, in Fig. 10b), (2) a weak NPF event (16 July, in Fig. 10a) and (3) a strong NPF event (18 July, in Fig. 10c). On 16 July, an NPF event developed throughout the day, with no NPF in the morning, a slight increase in particle number concentrations and a peak in NPF during midday followed by a slight decrease in particle concentration towards the afternoon. NPF was observed at the surface throughout the observation period.
On 18 July, an NPF event was observed from the early morning (08:03 LT) and continued until midday (10:59 LT; see Fig. 10c). During this event, NPF took place only at high altitudes (about 3000 m m.s.l. or 700 m a.g.l.), and it was not observable at the surface at all. In Fig. 10a–c the data only from ascending flights are shown for clarity, since the descending rotorcraft would push aerosol particles downwards. This bias caused NPF events to be visible at much lower altitudes (about 2600 m m.s.l. or 300 m a.g.l.) compared to observations made during ascending flight. Previously, similar elevated layers of nucleation-mode particles have been observed in a number of different environments including for instance clean-marine (e.g., Wehner et al., 2015), boreal-forest (e.g., Leino et al., 2019) and other continental locations with varying amounts of anthropogenic influence (e.g., Wehner et al., 2010; Platis et al., 2016; Altstädter et al., 2018; Junkermann et al., 2018; Qi et al., 2019). Junkermann et al. (2018) linked their observations with elevated emissions from fossil fuel combustion. However, other sources likely contribute to particle formation in the cleaner environments.
We used the FLEXPART dispersion model to investigate the air mass history of the elevated layer of nucleation-mode particles observed on 18 July. The 96 h backwards footprint for 18 July at 20:00 UTC arriving at the SLV at 1000 m a.g.l. is presented in Fig. 11. On this day, the bulk of the air mass is transported from the west and was over the Pacific Ocean 72–96 h before arrival at the San Luis Valley. A minor fraction of the air mass has continental origins between the measurement location and western coast of North America. A branch of this continental contribution covers the location of the San Juan coal-fired power plant approx. 200 km southwest of the San Luis Valley (Fig. 11). Therefore, it is possible that the elevated layer of nucleation-mode particles would originate in the power plant emissions. Decoupling of the layer above 1 km from the surface can be observed as a substantial drop in water vapor concentration at about 500 m a.g.l. (see Fig. 10c).
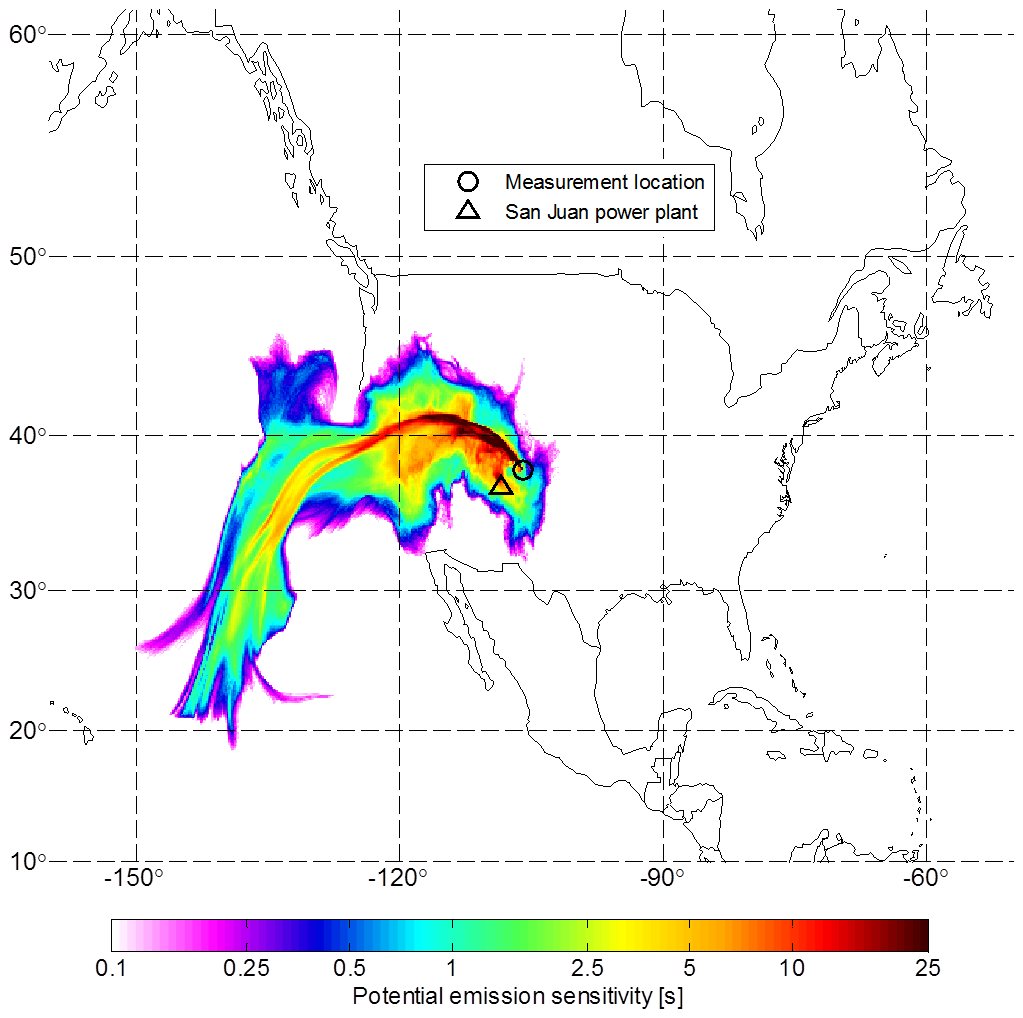
Figure 11Emission footprint calculated by the FLEXPART dispersion model for 18 July from 96 h backwards, arriving at 20:00 UTC at 1000 m a.g.l.
The presented observations on NPF support the following conclusions: (1) precursor vapors can be distributed within the mixing height of the atmospheric boundary layer resulting in NPF at a deep vertical extent (16 July, Fig. 10a). (2) In addition to vapor precursors, sink due to background aerosol for particles from NPF must be small enough. Levels of background aerosol concentrations are discussed below and support this conclusion. (3) The influence of long-range transport can be observed in the vertical profile. Free-tropospheric NPF is known to be a significant source of secondary aerosol over both marine and continental regions (e.g., Hermann et al., 2003; Benson et al., 2008; Merikanto et al., 2009). In such a situation, the surface area concentrations are usually observed to be very low (e.g., Twohy et al., 2002).

Figure 12Daily averaged vertical profiles of total particle count and number size distributions measured with the POPS, from 16 to 18 July.
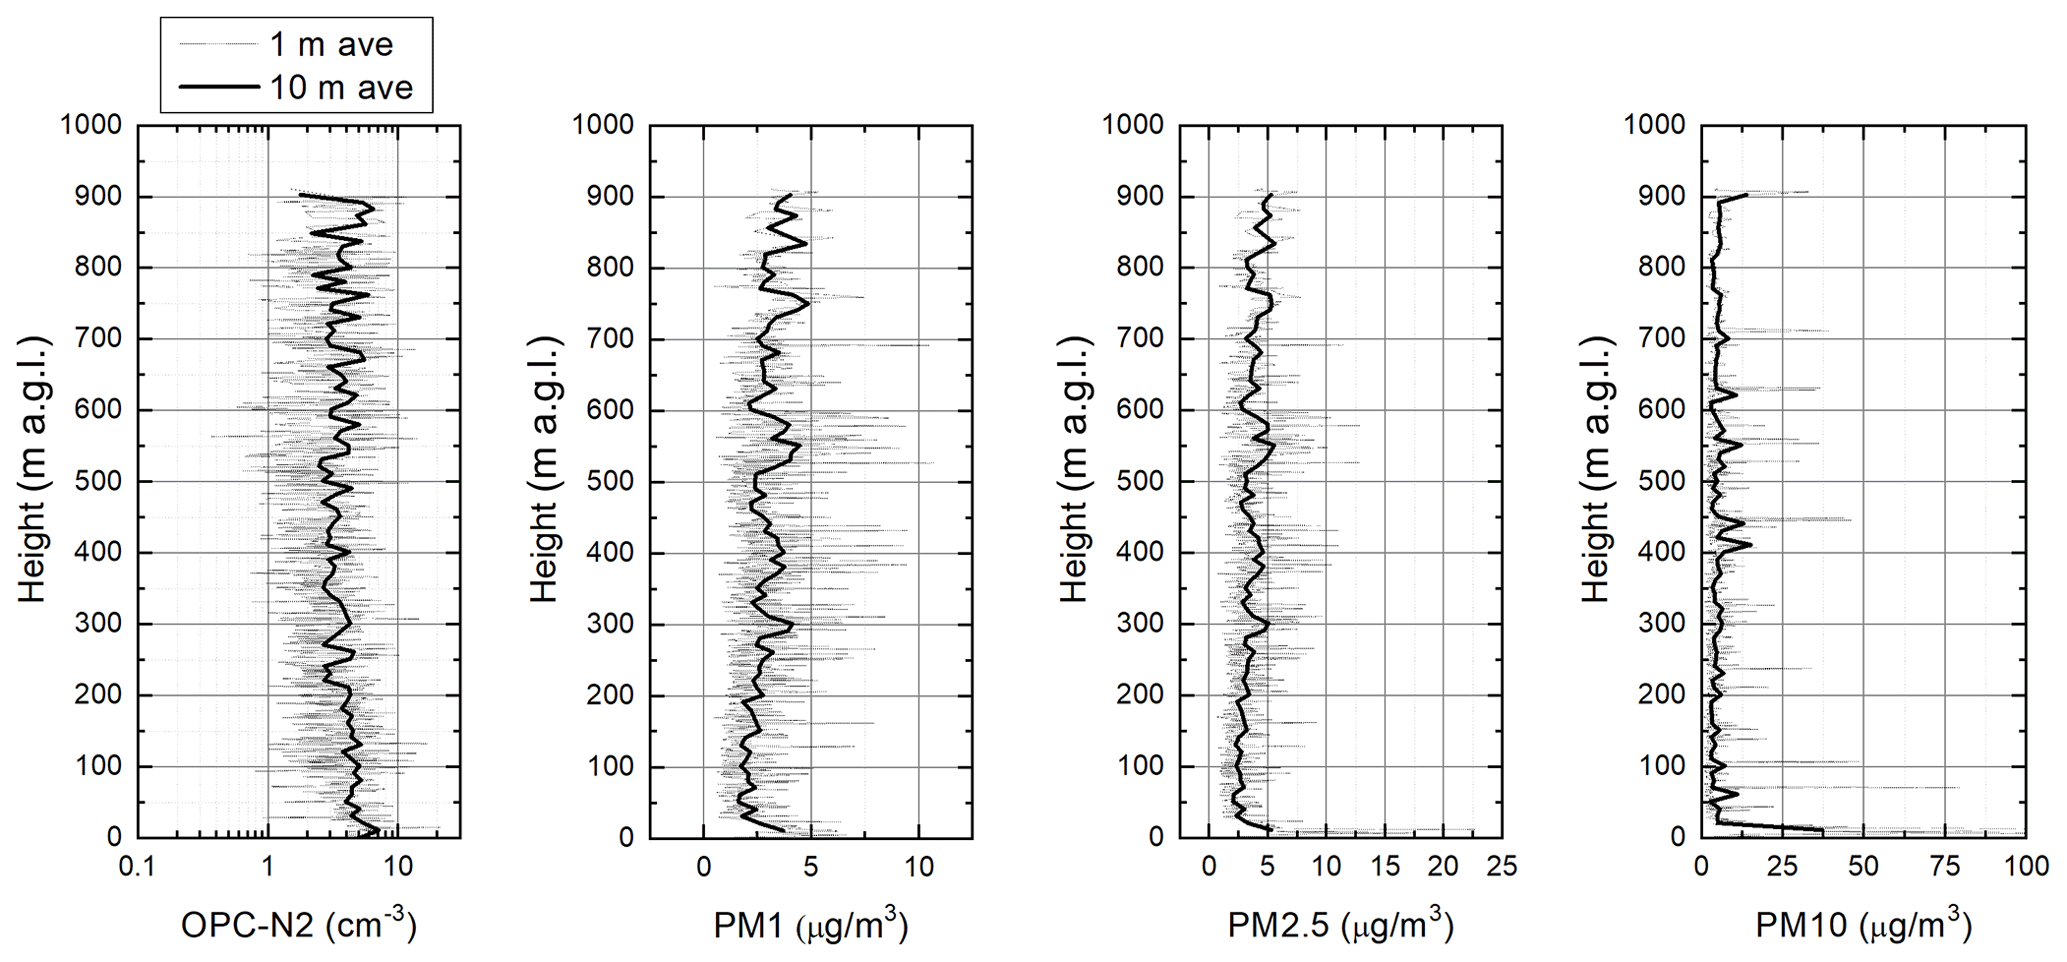
Figure 13Averaged (ave) vertical profile OPC-N2 coarse-particle total count. Black line from 16 to 18 July. Averaged vertical profiles of PM1, PM2.5 and PM10 values measured with the OPC-N2. Black line from 16 to 18 July.
3.2.3 Accumulation- and coarse-mode aerosol particles
Vertical profiles measured with the POPS up to 140 m a.g.l. are presented as diurnal 1 m averages in Fig. 12. The profiles did not show any variation with increasing altitude; the averaged particle concentration of 672 cm−3 had minimum and maximum concentrations of 500 and 1727 cm−3, respectively. Flat profile concentrations correspond to those measured with the POPS at the surface. Similarly, averaged diurnal number size distribution did not go through any observable dynamical changes resulting from growth or evaporation of particles. The occasional scatter in POPS data was caused by fast motion of the rotorcraft, resulting in acceleration of the ambient air against the POPS' inlet in line with the flight direction during horizontal transects. Such acceleration created a pressure drop that the internal pump system did not handle very well, resulting in bias in the POPS measured volumetric flow. However, there were only a few such flights.
Vertical profiles of particles measured by the OPC-N2 did not show any significant variation with increasing altitude and thus indicate a well-mixed boundary layer throughout the measurement column (Fig. 13). The averaged particle concentration was 5 cm−3, while similarly averaged PM1, PM2.5 and PM10 were 3.1, 4 and 9.7 µg m−3, respectively. The main contribution to mass was made by the aerosol particle load close to the surface. The result implies a lack of elevated plumes, despite the fact that there were extensive forest fires in southern Colorado before and during the LAPSE-RATE campaign.
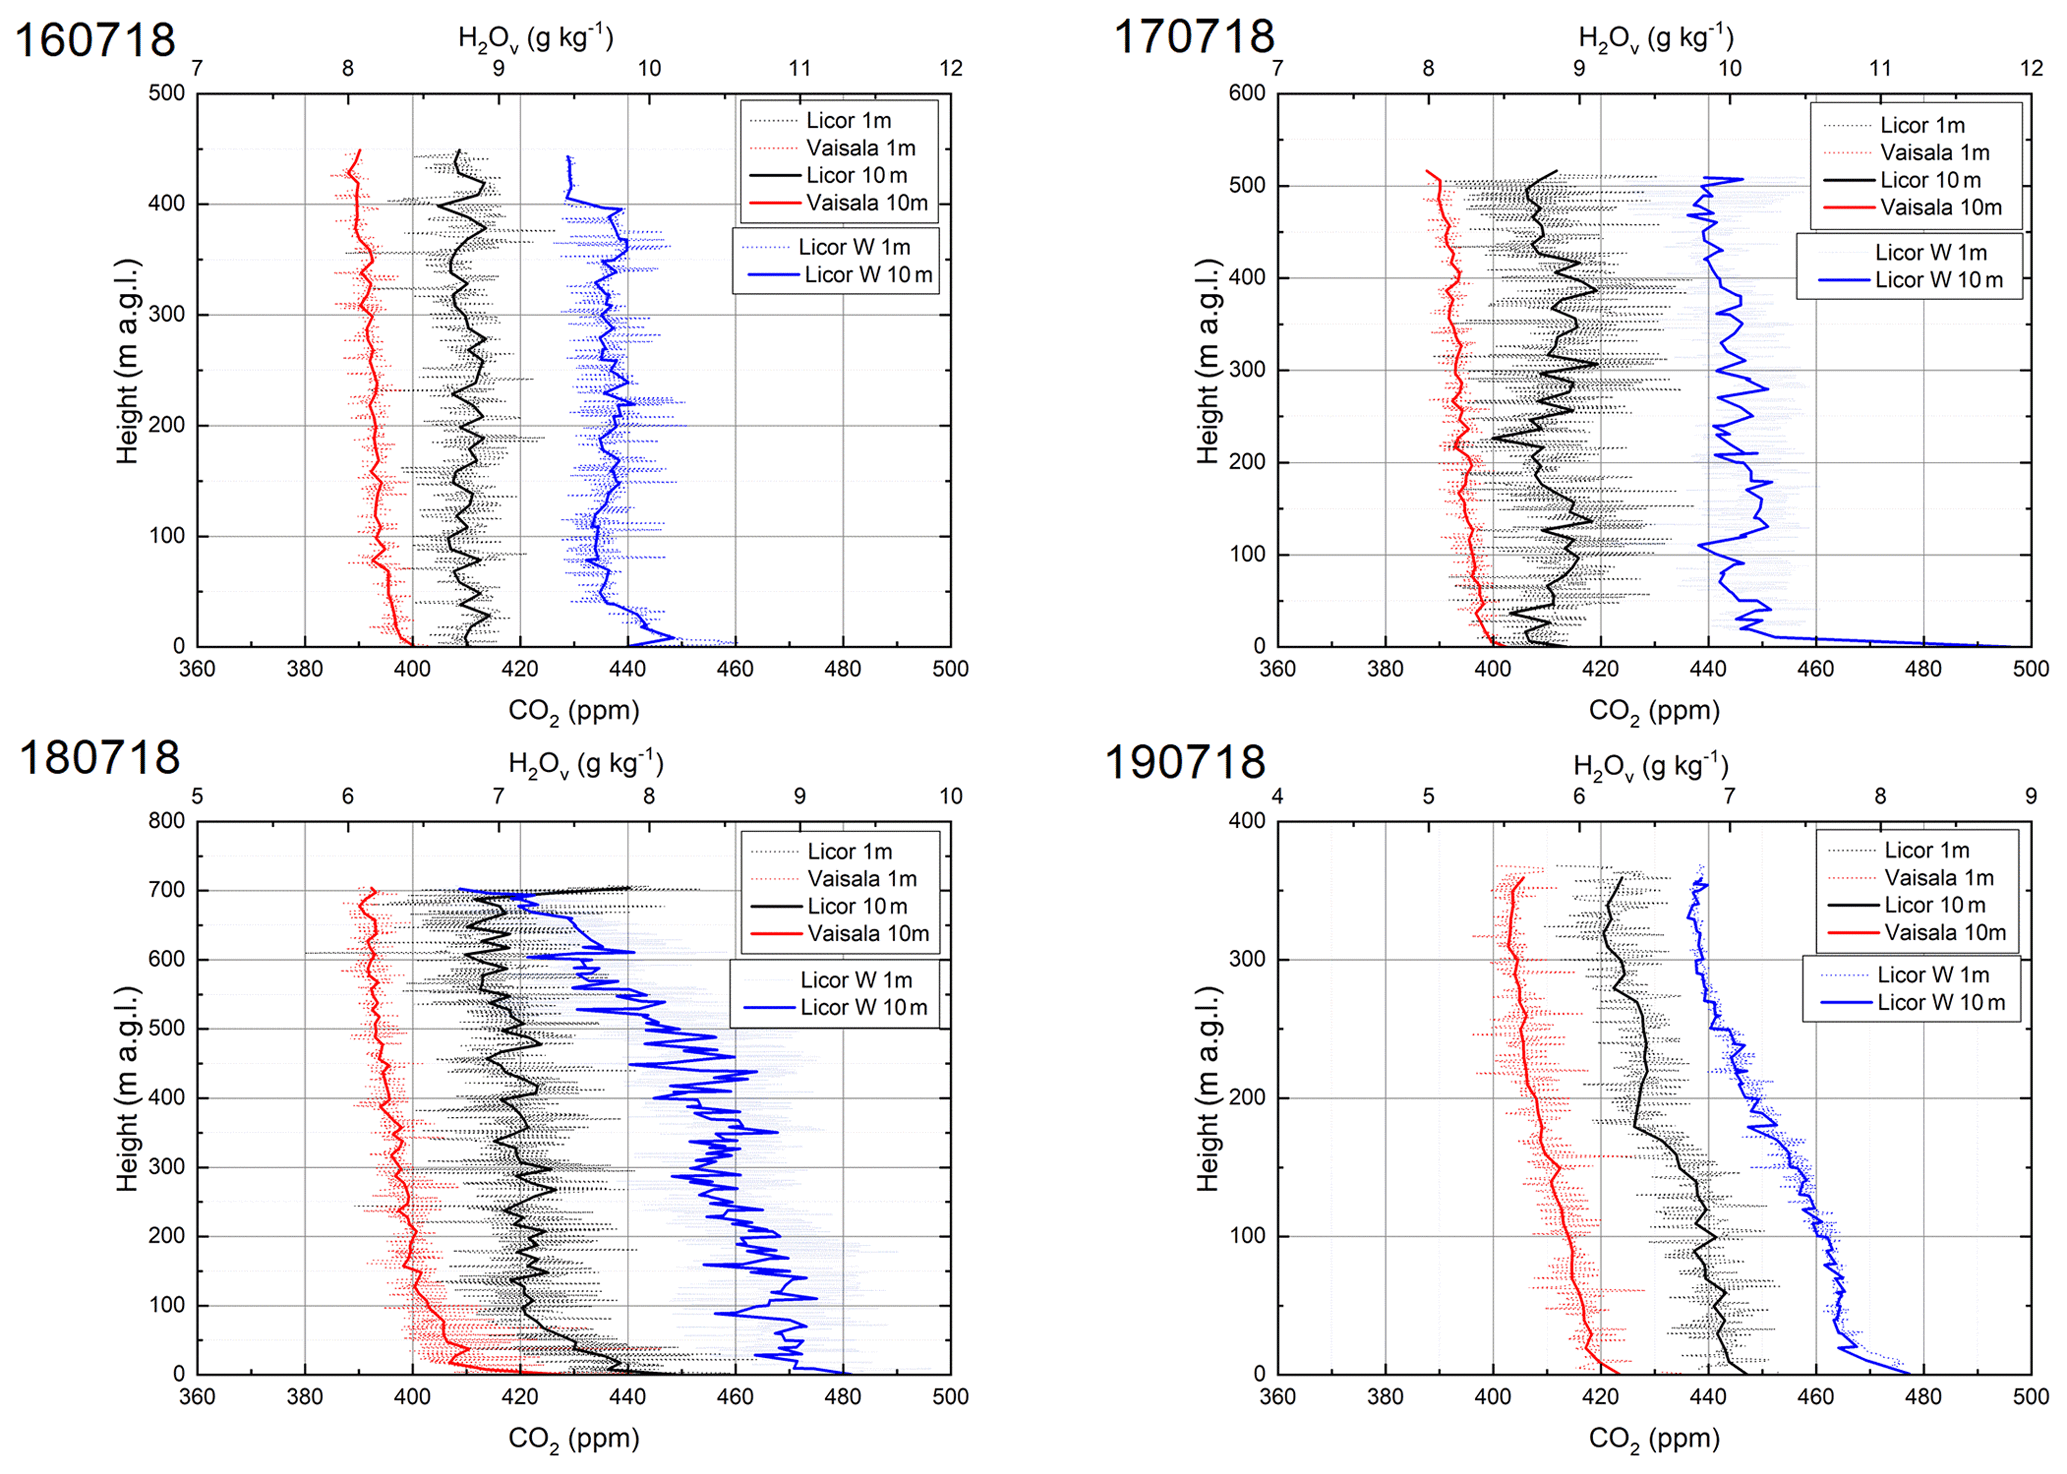
Figure 14CO2 and water vapor vertical profiles measured with the LI-COR LI-840A and Vaisala GMP343 on 16–19 July. Data plotted as 1 m (dotted lines) and 10 m averages (solid lines). Please note different heights on daily figures.
3.2.4 Gas concentrations in the atmospheric vertical profile
Concentrations of CO2 in the vertical profiles depend on both local sources and sinks as well as on atmospheric conditions including altitude, the atmospheric mixing state and transport. The CO2 and H2O vapor profiles showed higher concentrations only near the surface due to sources from soil and vegetation canopy evapotranspiration. Averaged semi-diurnal (morning to early afternoon) vertical profiles of CO2 and water vapor on 16–19 July for both probes (Vaisala GMP343 and LI-COR LI-840A) are presented in Fig. 14. Even though both probes were calibrated in the laboratory at sea level with satisfactory results, they showed different absolute CO2 concentrations in the field (SLV). The difference in CO2 concentration increased with increasing altitude, and the GMP343 was found to measure CO2 gradients independent of the time of day. This might be the result of imprecise pressure compensation for the GMP343 as provided by Vaisala (see the Sect. 2 for details). Since we compensated the GMP343 with temperature, RH and pressure obtained from the BME280 sensor that showed a bias of about +2 ∘C in temperature, −12 % in RH and +2 hPa in pressure during the LAPSE-RATE inter-comparison measurements against MURC (Barbieri et al., 2019), we also accounted for that bias in compensation resulting in an increase of CO2 concentration by only 2 ppm. Very little variation in CO2 concentrations was observed as a function of altitude on 16 and 17 July (Fig. 14), indicating a well-mixed boundary layer. The same holds for water vapor concentration. However, on 17 July elevated surface concentrations were observed. On 18 and 19 July, profiling started earlier in the morning (about 13:00 and 12:00 UTC, 07:00 and 06:00 LT, respectively), and we were able to observe gradients in CO2 concentration between the rotorcraft and the ground level. These gradients extend to approximately 100 m from the surface on 18 July and 250 m on 19 July. Similarly for water vapor concentration, on 18 and 19 July the gradient extends across the whole profile.
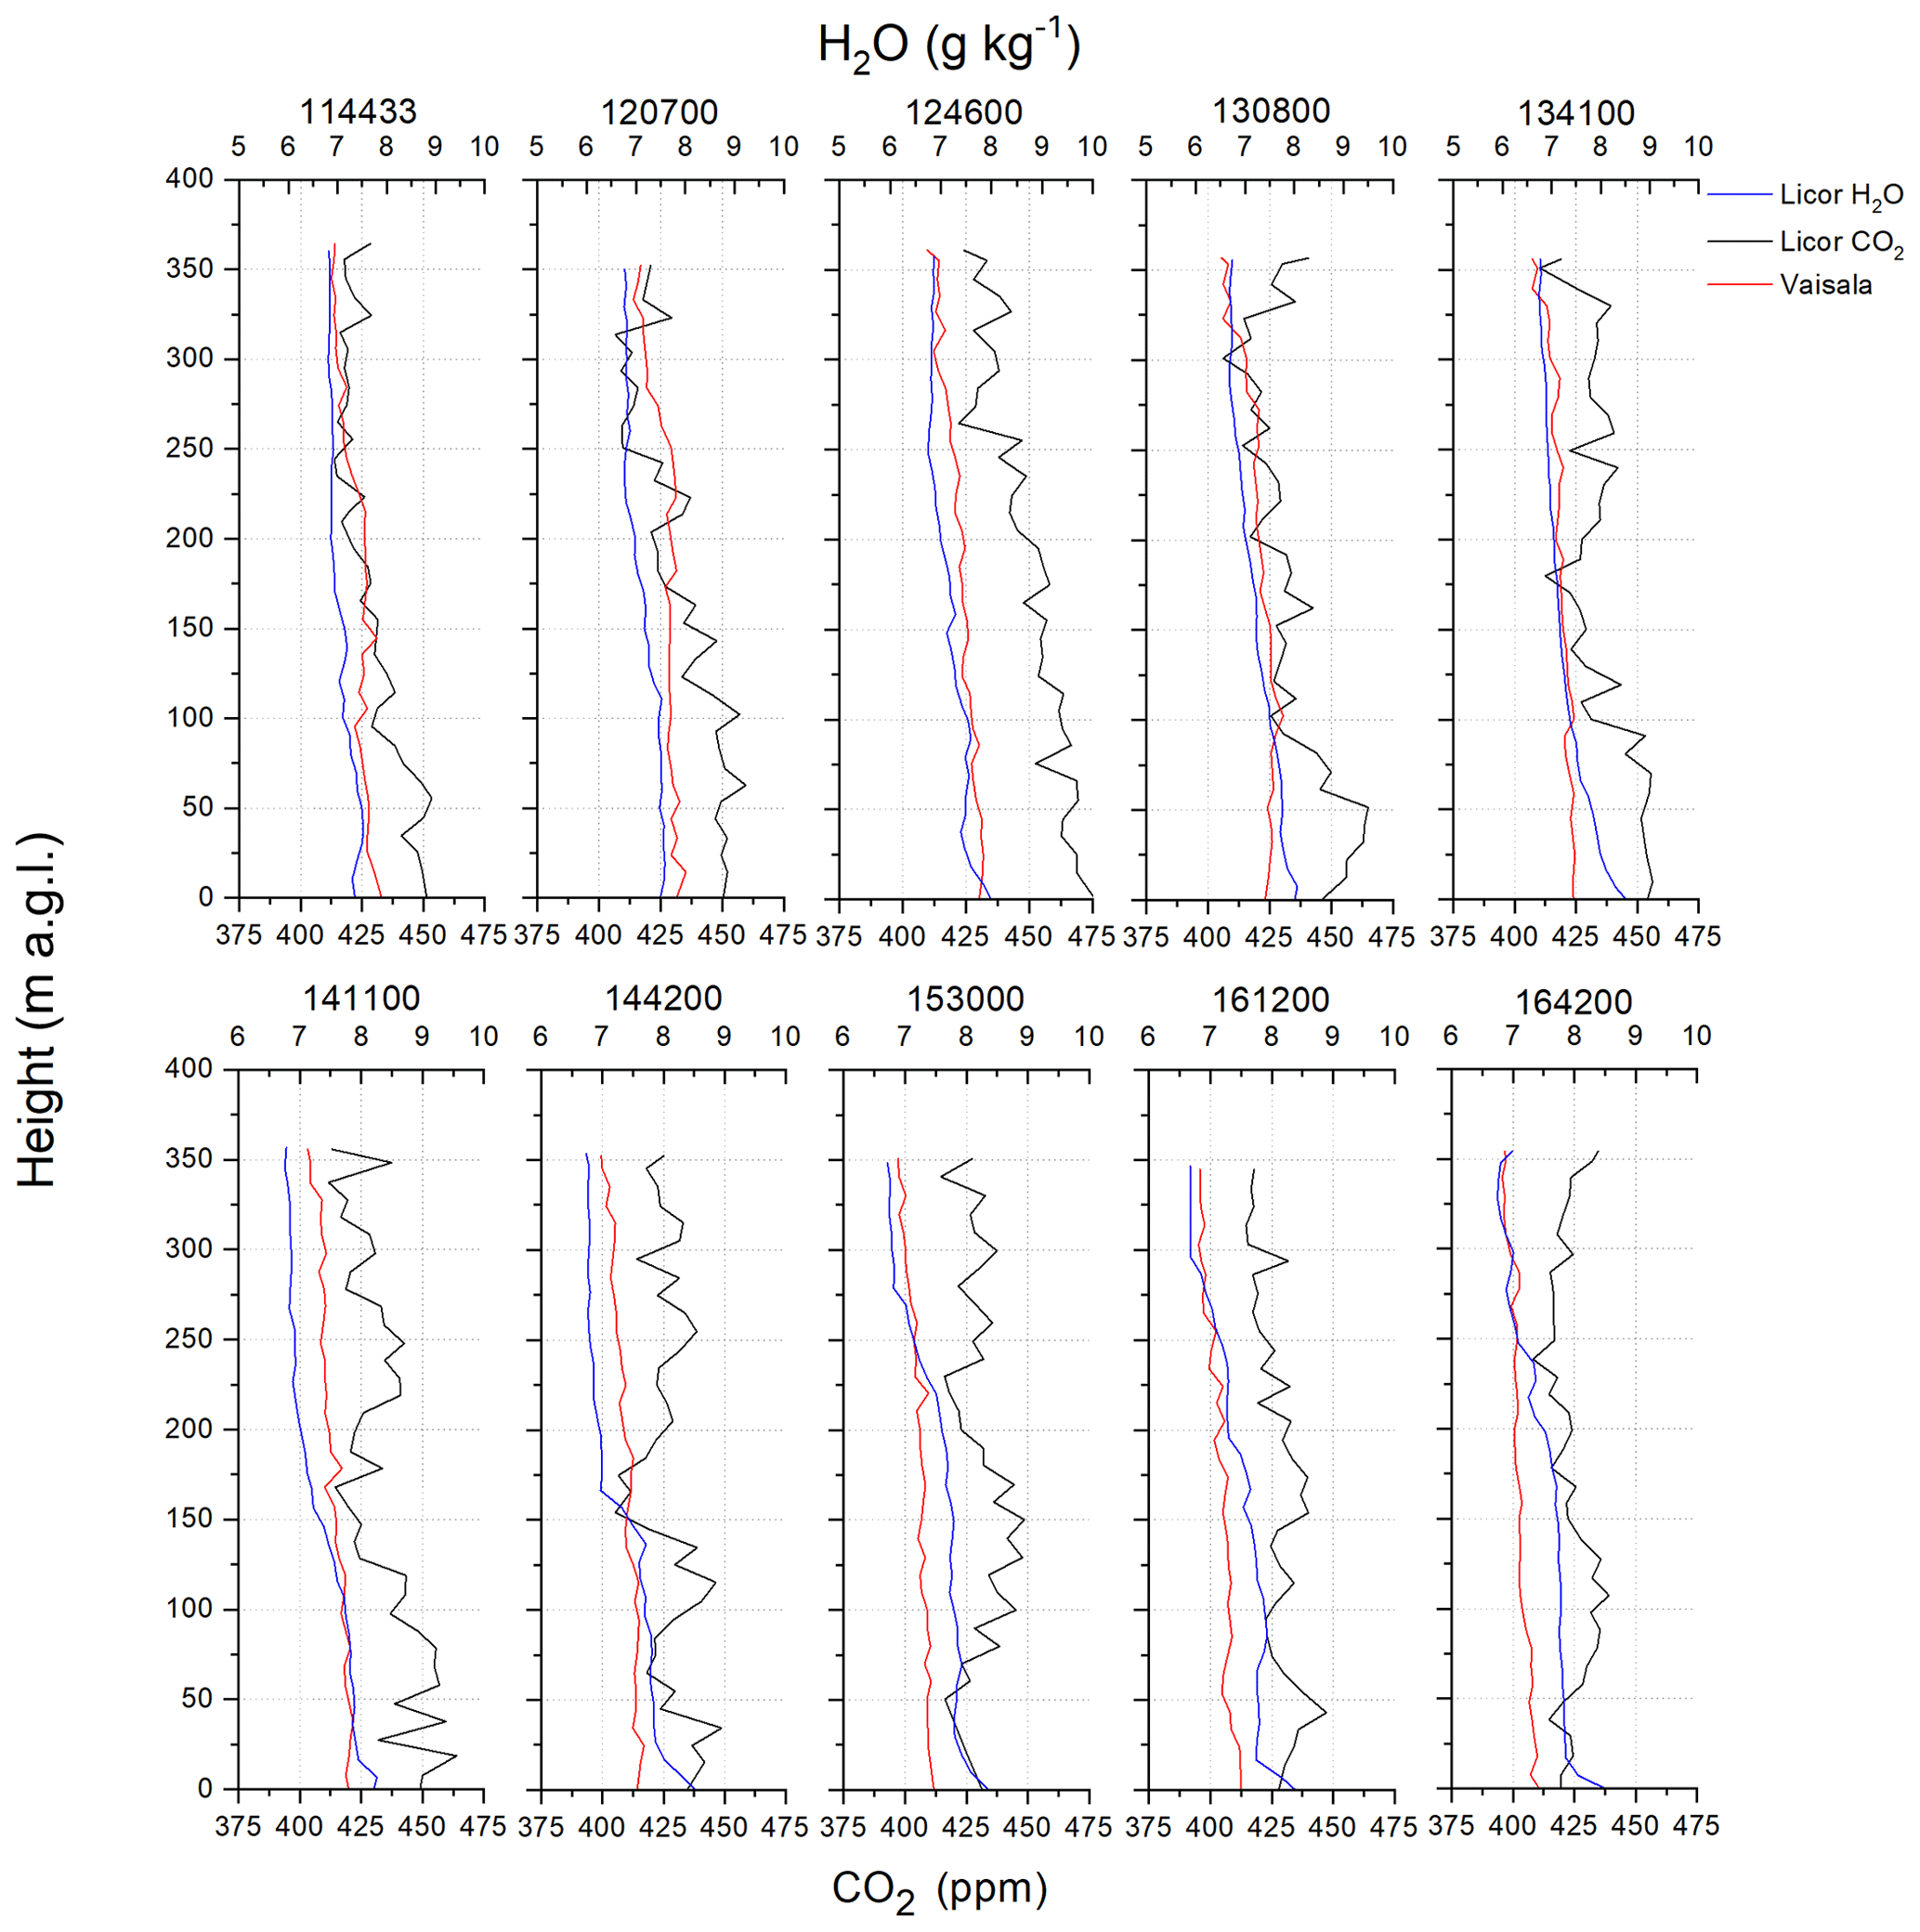
Figure 15CO2 and water vapor vertical profiles measured with the LI-COR LI-840A and Vaisala GMP343 on 19 July. Early-morning data measured with the LI-840A show a visible gradient with higher CO2 concentrations at the ground level; the profile flattens with increased solar activity. The profiles measured with the Vaisala GMP343 show a weaker gradient because of its lower sensitivity. Water vapor profiles were firstly flat with a gradient that developed with time due to increased solar radiation.
Figure 15 demonstrates a notable change in CO2 concentration with increasing altitude on 19 July, where the first five flights from 11:44 to 13:41 UTC show a near-surface CO2 gradient. This gradient is detected to include a decrease of approximately 30 ppm (450 to 420 ppm for the LI-840A and 430 to 400 ppm for the GMP343) in first 350 m above the surface. During the subsequent five flights (14:11 to 16:42 UTC, 08:00 and 10:00 LT), the CO2 concentration profiles began to be more uniform all the way to the surface, with hints of a slight negative gradient observed with the LI-840A. A negative gradient was not observed with the GMP343 sensor, probably due to its lower sensitivity. Such a negative gradient could be explained by ground vegetation photosynthetic uptake and the vertical transport of CO2 to higher altitudes, as reported e.g., by Li et al. (2014). However, no ground flux measurements were present during the campaign to support this hypothesis. Water vapor concentration showed an opposite trend, with the profile being flat in the early morning (about 7 g kg−1) and the concentration at the surface gradually increasing up to 8.5 g kg−1, and at 350 m above the surface it was 6.75 g kg−1 for the last flight at 16:42 UTC.
Unfortunately, we were not able to acquire vertical profiles or ground level concentrations of NO2, O3, CO and SO2 with the Vaisala AQT400 sensor. All data collected during LAPSE-RATE were far below the manufacturer-declared detection limits. The AQT400 sensor is rather suitable for detection or identification of sources with higher concentrations, though this is not supportive of detailed measurements in clean environments with very low background concentrations of both gases and particulate matter. Furthermore, the AQT400 standard calibration is valid for the range 800–1200 hPa, and given the elevation of the San Luis Valley (about 2300 m m.s.l.) the ambient pressure during the campaign was around 780 hPa at the surface, impacting the accuracy of the calibration significantly.
Flight teams from the Finnish Meteorological Institute and Kansas State University participated in the LAPSE-RATE campaign in the San Luis Valley, Colorado, USA, on 14–19 July 2018. The teams were operating from the same location and created a sound dataset on the properties of aerosol particles and gases in the atmospheric vertical profile. During the campaign the FMI modular system with off-the-shelf instrumentation was tested.
From deployment of UAS-borne off-the-self sensors in a high-altitude environment we learned that particle counters used during the LAPSE-RATE campaign worked flawlessly together. Even though they were deployed on different platforms, the obtained number size distributions overlapped well over several size bins. The particle counters together covered aerosol particles ranging between 7 nm and 18 µm in diameter, however with a gap in the size range between 15 and 130 nm. Such a setup in principle allows for very affordable observations of new particle formation events (nucleation mode), particle growth by condensation and coagulation (accumulation mode), and dust episodes (coarse mode) in vertical profile. We also learned that the Vaisala GMP343 CO2 concentrations and vertical profiles do not match the LI-COR LI-840A after post-processing the data due to not very precise pressure correction provided by the manufacturer. The precision and response times of the LI-840A remain better. Water vapor content profiles obtained by the LI-840A compared well against those calculated from radiosonde profiles. The Vaisala AQT400 air quality sensor is more suitable for environments with elevated levels of gas pollutants; in a clean background location like the SLV the measured values remained lower than the manufacturer-stated detection limits.
During the short measurement campaign features of aerosol particles, CO2 and water vapor specific to the San Luis Valley were acquired. As an example, a new particle formation event at altitudes at and above 700 m above the surface, decoupled from the ground, was observed. This is an observation that could not easily be obtained by known remote sensing methods but is easily collected using airborne in situ methods.
Datasets collected by the Finnish Meteorological Institute and Kansas State University during LAPSE-RATE were published together within the LAPSE-RATE community in a Zenodo open data repository at https://zenodo.org/communities/lapse-rate/ (last access: 11 February 2020) (de Boer, 2020). For data collected using the platforms outlined in this paper, the Finnish Meteorological Institute FMI-PRKL1, FMI-PRKL2 and FMI surface module datasets can be all found at https://doi.org/10.5281/zenodo.3993996 (Brus et al., 2020a). The Kansas State University KSU M600 and KSU surface datasets can be found both at https://doi.org/10.5281/zenodo.3736772 (Brus et al., 2020b).
The supplement related to this article is available online at: https://doi.org/10.5194/acp-21-517-2021-supplement.
DB, AH, GdB, OK and VV took part in the writing, reviewing and editing of the paper. DB, JG and OK conducted the measurements. DB performed the dataset analysis and validation. VV performed the FLEXPART analysis.
The authors declare that they have no conflict of interest.
Authors would like to acknowledge the following foundations for providing financial support for the project: the Kone Foundation, ACTRIS-2 through the European Union's Horizon 2020 Framework Programme for Research and Innovation (grant agreement no. 654109), ACTRIS PPP through the European Commission under the Horizon 2020 Framework Programme for Research and Innovation (H2020-INFRADEV-2016-2017; grant agreement no. 739530), the Academy of Finland Center of Excellence Programme (grant no. 307331) and the US National Science Foundation (CAREER; grant no. 1665456). In addition, limited general support for LAPSE-RATE was provided by the US National Science Foundation (grant no. AGS 1807199) and the US Department of Energy (grant no. DE-SC0018985) in the form of travel support for early-career participants. Support for the planning and execution of the campaign was provided by the NOAA Physical Sciences Laboratory and NOAA UAS Program Office. Finally, the support of UAS Colorado and local government agencies (Alamosa County and Saguache County) was critical in securing site permissions and other local logistics. David Brus and Jani Gustafsson would like to especially acknowledge Dave L. Coach for acting as a pilot in command for the FMI team. Handix Scientific LLC is acknowledged for providing their POPS instruments for the campaign at no cost.
This research has been supported by the Kone Foundation, ACTRIS-2 through the European Union's Horizon 2020 Framework Programme for Research and Innovation (grant agreement no. 654109), ACTRIS PPP through the European Commission under the Horizon 2020 Framework Programme for Research and Innovation (H2020-INFRADEV-2016-2017; grant agreement no. 739530), the Academy of Finland Center of Excellence Programme (grant no. 307331) and the US National Science Foundation (CAREER; grant no. 1665456). In addition, limited general support for LAPSE-RATE was provided by the US National Science Foundation (grant no. AGS 1807199) and the US Department of Energy (grant no. DE-SC0018985) in the form of travel support for early-career participants.
This paper was edited by Barbara Ervens and reviewed by two anonymous referees.
Altstädter, B., Platis, A., Wehner, B., Scholtz, A., Wildmann, N., Hermann, M., Käthner, R., Baars, H., Bange, J., and Lampert, A.: ALADINA – an unmanned research aircraft for observing vertical and horizontal distributions of ultrafine particles within the atmospheric boundary layer, Atmos. Meas. Tech., 8, 1627–1639, https://doi.org/10.5194/amt-8-1627-2015, 2015. a
Altstädter, B., Platis, A., Jähn, M., Baars, H., Lückerath, J., Held, A., Lampert, A., Bange, J., Hermann, M. and Wehner, B.: Airborne observations of newly formed boundary layer aerosol particles under cloudy conditions, Atmos. Chem. Phys., 18, 8249–8264, https://doi.org/10.5194/acp-18-8249-2018, 2018. a, b
Andreae, M. O., Acevedo, O. C., Araùjo, A., Artaxo, P., Barbosa, C. G. G., Barbosa, H. M. J., Brito, J., Carbone, S., Chi, X., Cintra, B. B. L., da Silva, N. F., Dias, N. L., Dias-Júnior, C. Q., Ditas, F., Ditz, R., Godoi, A. F. L., Godoi, R. H. M., Heimann, M., Hoffmann, T., Kesselmeier, J., Könemann, T., Krüger, M. L., Lavric, J. V., Manzi, A. O., Lopes, A. P., Martins, D. L., Mikhailov, E. F., Moran-Zuloaga, D., Nelson, B. W., Nölscher, A. C., Santos Nogueira, D., Piedade, M. T. F., Pöhlker, C., Pöschl, U., Quesada, C. A., Rizzo, L. V., Ro, C.-U., Ruckteschler, N., Sá, L. D. A., de Oliveira Sá, M., Sales, C. B., dos Santos, R. M. N., Saturno, J., Schöngart, J., Sörgel, M., de Souza, C. M., de Souza, R. A. F., Su, H., Targhetta, N., Tóta, J., Trebs, I., Trumbore, S., van Eijck, A., Walter, D., Wang, Z., Weber, B., Williams, J., Winderlich, J., Wittmann, F., Wolff, S., and Yáñez-Serrano, A. M.: The Amazon Tall Tower Observatory (ATTO): overview of pilot measurements on ecosystem ecology, meteorology, trace gases, and aerosols, Atmos. Chem. Phys., 15, 10723–10776, https://doi.org/10.5194/acp-15-10723-2015, 2015. a
Barbieri, L., Kral, S. T., Bailey, S. C. C., Frazier, A. E., Jacob, J. D., Reuder, J., Brus, D., Chilson, P. B., Crick, C., Detweiler, C., Doddi, A., Elston, J., Foroutan, H., González-Rocha, J., Greene, B. R., Guzman, M. I., Houston, A. L., Islam, A., Kemppinen, O., Lawrence, D., Pillar-Little, E. A., Ross, S. D., Sama, M. P., Schmale, D. G., Schuyler, T. J., Shankar, A., Smith, S .W., Waugh, S., Dixon, C., Borenstein, S., and de Boer, G.: Intercomparison of Small Unmanned Aircraft System (sUAS) Measurements for Atmospheric Science during the LAPSE-RATE Campaign, Sensors, 19, 2179, https://doi.org/10.3390/s19092179, 2019. a, b, c
Bell, T. M., Klein, P. M., Lundquist, J. K., and Waugh, S.: Remote sensing and radiosonde datasets collected in the San Luis Valley during the LAPSE-RATE campaign, Earth Syst. Sci. Data Discuss. [preprint], https://doi.org/10.5194/essd-2020-314, in review, 2020. a
Benson, D. R., Li-Hao Young, Shan-Hu Lee, Campos, T. L., Rogers, D. C., and Jensen, J.: The effects of airmass history on new particle formation in the free troposphere: case studies, Atmos. Chem. Phys., 8, 3015–3024, https://doi.org/10.5194/acp-8-3015-2008, 2008. a, b
Brus, D., Gustafsson J., Kemppinen O., de Boer G., and Hirsikko, A.: Atmospheric aerosol, gases and meteorological parameters measured during the LAPSE-RATE campaign – Finnish Meteorological Institute data sets [Data set], Zenodo, https://doi.org/10.5281/zenodo.3993996, 2020a. a
Brus D., Gustafsson, J., Kemppinen, O., de Boer, G., and Hirsikko, A.: Atmospheric aerosol, gases and meteorological parameters measured during the LAPSE-RATE campaign – Kansas State University data sets [Data set], Zenodo, https://doi.org/10.5281/zenodo.3736772, 2020b. a
Carbone, C., Decesari, S., Mircea, M., Giulianelli, L., Finessi, E., Rinaldi, M., S. Fuzzi, Marinoni, A., Duchi, R., Perrino, C., Sargolini, T., Vardè, M., Sprovieri, F., Gobbi, G. P., Angelini, F., and Facchini, M. C.: Size-resolved aerosol chemical composition over the Italian Peninsula during typical summer and winter conditions, Atmos. Environ., 44, 5269–5278, 2010. a
deBoer, G.: Lower Atmospheric Profiling Studies at Elevation – a Remotely-piloted Aircraft Team Experiment, Zenodo, https://zenodo.org/communities/lapse-rate/, last access: 11 February 2020. a
de Boer, G., Diehl, C., Jacob, J., Houston, A., Smith, S. W., Chilson, P., Schmale III, D. G., Intrieri, J., Pinto, J., Elston, J., Brus, D., Kemppinen, O., Clark, A., Lawrence, D., Bailey, S. C. C., Sama, M. P., Frazier, A., Crick, C., Natalie, V., Pillar-Little, E., Klein, P., Waugh, S., Lundquist, J. K., Barbieri, L., Kral, S. T., Jensen, A. A., Dixon, C., Borenstein, S., Hesselius, D., Human, K., Hall, P., Argrow, B., Thornberry, T., Wright, R., and Kelly, J. T.: Development of community, capabilities and understanding through unmanned aircraft-based atmospheric research: The LAPSE-RATE campaign, B. Am. Meteorol. Soc., 101, E684–E699, https://doi.org/10.1175/BAMS-D-19-0050.1, 2020a. a, b, c, d
de Boer, G., Houston, A., Jacob, J., Chilson, P. B., Smith, S. W., Argrow, B., Lawrence, D., Elston, J., Brus, D., Kemppinen, O., Klein, P., Lundquist, J. K., Waugh, S., Bailey, S. C. C., Frazier, A., Sama, M. P., Crick, C., Schmale III, D., Pinto, J., Pillar-Little, E. A., Natalie, V., and Jensen, A.: Data Generated During the 2018 LAPSE-RATE Campaign: An Introduction and Overview, Earth Syst. Sci. Data Discuss., https://doi.org/10.5194/essd-2020-98, in review, 2020b. a
de Boer, G., Waugh, S., Erwin, A., Borenstein, S., Dixon, C., Shanti, W., Houston, A., and Argrow, B.: Measurements from mobile surface vehicles during LAPSE-RATE, Earth Syst. Sci. Data Discuss., https://doi.org/10.5194/essd-2020-173, in review, 2020c. a, b
Girdwood, J., Smith, H., Stanley, W., Ulanowski, Z., Stopford, C., Chemel, C., Doulgeris, K.-M., Brus, D., Campbell, D., and Mackenzie, R.: Design and field campaign validation of a multi-rotor unmanned aerial vehicle and optical particle counter, Atmos. Meas. Tech., 13, 6613–6630, https://doi.org/10.5194/amt-13-6613-2020, 2020. a
Greenberg, J. P., Guenther, A. B., and Turnipseed, A.: Tethered balloon-based soundings of ozone, aerosols, and solar radiation near Mexico City during MIRAGE-MEX, Atmos. Environ., 43, 2672–2677, https://doi.org/10.1016/j.atmosenv.2009.02.019, 2009. a
Hämeri, K., Koponen, I. K., Aalto, P. P. and Kulmala, M.: The particle detection efficiency of the TSI-3007 condensation particle counter, J. Aerosol Sci., 33, 1463–1469, https://doi.org/10.1016/S0021-8502(02)00090-3, 2002. a
Heintzenberg, J., Birmili, W., Otto, R., Andreae, M. O., Mayer, J.-C., Chi, X., and Panov, A.: Aerosol particle number size distributions and particulate light absorption at the ZOTTO tall tower (Siberia), 2006–2009, Atmos. Chem. Phys., 11, 8703–8719, https://doi.org/10.5194/acp-11-8703-2011, 2011. a
Hermann, M., Heintzenberg, J., Wiedensohler, A., Zahn, A., Heinrich, G., and Brenninkmeijer, C. A. M.: Meridional distributions of aerosol particle number concentrations in the upper troposphere and lower stratosphere obtained by Civil Aircraft for Regular Investigation of the Atmosphere Based on an Instrument Container (CARIBIC) flights, J. Geophys. Res., 108, 4114, https://doi.org/10.1029/2001JD001077, 2003. a, b
Hirsikko, A., O'Connor, E. J., Komppula, M., Korhonen, K., Pfüller, A., Giannakaki, E., Wood, C. R., Bauer-Pfundstein, M., Poikonen, A., Karppinen, T., Lonka, H., Kurri, M., Heinonen, J., Moisseev, D., Asmi, E., Aaltonen, V., Nordbo, A., Rodriguez, E., Lihavainen, H., Laaksonen, A., Lehtinen, K. E. J., Laurila, T., Petäjä, T., Kulmala, M., and Viisanen, Y.: Observing wind, aerosol particles, cloud and precipitation: Finland's new ground-based remote-sensing network, Atmos. Meas. Tech., 7, 1351–1375, https://doi.org/10.5194/amt-7-1351-2014, 2014. a
Jonassen, M. O., Tisler, P., Altstädter, B., Scholtz, A., Vihma, T., Lampert, A., König-Langlo, G., and Lüpkes, C.: Application of remotely piloted aircraft systems in observing the atmospheric boundary layer over Antarctic sea ice in winter, Polar Res., 34, 25651, https://doi.org/10.3402/polar.v34.25651, 2015. a
Junkermann, W. and Hacker, J. M.: Ultrafine Particles in the Lower Troposphere: Major Sources, Invisible Plumes, and Meteorological Transport Processes, B. Am. Meteorol. Soc., 99, 2587–2602, https://doi.org/10.1175/BAMS-D-18-0075.1, 2018. a, b
Klein, P., Bonin, T. A., Newman, J. F., Turner, D. D., Chilson, P. B., Wainwright, C. E., Blumberg, W. G., Mishra, S., Carney, M., Jacobsen, E. P., SWharton, S., and Newsom, R. K.: LABLE: A multi-institutional, student-led, atmospheric boundary layer experiment, B. Am. Meteool. Soc., 96, 1743–1764, https://doi.org/10.1175/BAMS-D-13-00267.1, 2015. a
Kral, S. T., Reuder, J., Vihma, T., Suomi, I., O'Connor, E., Kouznetsov, R., Wrenger, B., Rautenberg, A., Urbancic, G., Jonassen, M. O., Båserud, L., Maronga, B., Mayer, S., Lorenz, T., Holtslag, A. A. M., Steeneveld, G.-J., Seidl, A., Müller, M., Lindenberg, C., Langohr, C., Voss, H., Bange, J., Hundhausen, M., Hilsheimer, P., and Schygulla, M.: Innovative Strategies for Observations in the Arctic Atmospheric Boundary Layer (ISOBAR) – The Hailuoto 2017 Campaign, Atmosphere, 9, 268, https://doi.org/10.3390/atmos9070268, 2018. a
Laakso, L., Grönholm, T., Kulmala, L., Haapanala, S., Hirsikko, A., Lovejoy, E. R., Kazil, J., Kurtén, T., Boy, M., Nilsson, E. D., Sogachev, A., Riipinen, I., Stratmann, F., and Kulmala, M.: Hot-air balloon as a platform for boundary layer profile measurements during particle formation, Boreal Environ. Res., 12, 279–294, 2007. a
Leino, K., Lampilahti, J., Poutanen, P., Väänänen, R., Manninen, A., Buenrostro Mazon, S., Dada, L., Franck, A., Wimmer, D., Aalto, P. P., Ahonen, L. R., Enroth, J., Kangasluoma, J., Keronen, P., Korhonen, F., Laakso, H., Matilainen, T., Siivola, E., Manninen, H. E., Lehtipalo, K., Kerminen, V.-M., Petäjä, T., and Kulmala, M.: Vertical profiles of sub-3nm particles over the boreal forest, Atmos. Chem. Phys., 19, 4127–4138, https://doi.org/10.5194/acp-19-4127-2019, 2019. a
Li, Y., Deng, J., Mu, C., Xing, Z., and Du, K.: Vertical distribution of CO2 in the atmospheric boundary layer: characteristics and impact of meteorological variables, Atmos. Environ., 91, 110–117, 2014. a
Merikanto, J., Spracklen, D. V., Mann, G. W., Pickering, S. J., and Carslaw, K. S.: Impact of nucleation on global CCN, Atmos. Chem. Phys., 9, 8601–8616, https://doi.org/10.5194/acp-9-8601-2009, 2009. a
Nygård, T., Tisler, P., Vihma, T., Pirazzini, R., Palo, T., and Kouznetsov, R.: Properties and temporal variability of summertime temperature inversions over Dronning Maud Land, Antarctica, Q. J. Roy. Meteorol. Soc., 143, 582–595, https://doi.org/10.1002/qj.2951, 2017 a
O'Connor, E. J., Illingworth, A. J., Brooks, I. M., Westbrook, C. D., Hogan, R. J., Davies, F., and Brooks, B. J.: A Method for Estimating the Turbulent Kinetic Energy Dissipation Rate from a Vertically Pointing Doppler Lidar, and Independent Evaluation from Balloon-Borne In Situ Measurements, J. Atmos. Ocean. Tech., 27, 1652–1664, https://doi.org/10.1175/2010JTECHA1455.1, 2010. a
Platis, A., Altstädter, B., Wehner, B., Wildmann, N., Lampert, A., Hermann, M., Birmili, W., and Bange, J.: An Observational Case Study on the Influence of Atmospheric Boundary-Layer Dynamics on New Particle Formation, Bound.-Lay. Meteorol., 158, 67–92, https://doi.org/10.1007/s10546-015-0084-y, 2016. a
Qi, X., Ding, A., Nie, W., Chi, X., Huang, X., Xu, Z., Wang, T., Wang, Z., Wang, J., Sun, P., Zhang, Q., Huo, J., Wang, D., Bian, Q., Zhou, L., Zhang, Q., Ning, Z., Fei, D., Xiu, G., and Fu, Q.: Direct measurement of new particle formation based on tethered airship around the top of the planetary boundary layer in eastern China, Atmos. Environ., 209, 92–101, https://doi.org/10.1016/j.atmosenv.2019.04.024, 2019. a
Ramanathan, V., Ramana, M. V., Roberts, G., Kim, D., Corrigan, C., Chung, C., and Winker, D.: Warming trends in Asia amplified by brown cloud solar absorption, Nature, 448, 575–578, 2007. a
Schween, J. H., Hirsikko, A., Löhnert, U., and Crewell, S.: Mixing-layer height retrieval with ceilometer and Doppler lidar: from case studies to long-term assessment, Atmos. Meas. Tech., 7, 3685–3704, https://doi.org/10.5194/amt-7-3685-2014, 2014. a
Seibert, P. and Frank, A.: Source-receptor matrix calculation with a Lagrangian particle dispersion model in backward mode, Atmos. Chem. Phys., 4, 51–63, https://doi.org/10.5194/acp-4-51-2004, 2004. a, b
Stohl, A., Forster, C., Frank, A., Seibert, P., and Wotawa, G.: Technical note: The Lagrangian particle dispersion model FLEXPART version 6.2, Atmos. Chem. Phys., 5, 2461–2474, https://doi.org/10.5194/acp-5-2461-2005, 2005. a
Tunved, P., Ström, J., and Krejci, R.: Arctic aerosol life cycle: linking aerosol size distributions observed between 2000 and 2010 with air mass transport and precipitation at Zeppelin station, Ny-Ålesund, Svalbard, Atmos. Chem. Phys., 13, 3643–3660, https://doi.org/10.5194/acp-13-3643-2013, 2013. a
Twohy, C. H., Clement, C. F., Gandrud, B. W., Weinheimer, A. J., Campos, T. L., Baumgardner, D., Brune, W. H., Faloona, I., Sachse, G. W., Vay, S. A., and Tan, D.: Deep convection as a source of new particles in the midlatitude upper troposphere, J. Geophys. Res., 107, 4560, https://doi.org/10.1029/2001JD000323, 2002. a, b
Vakkari, V., O'Connor, E. J., Nisantzi, A., Mamouri, R. E., and Hadjimitsis, D. G.: Low-level mixing height detection in coastal locations with a scanning Doppler lidar, Atmos. Meas. Tech., 8, 1875–1885, https://doi.org/10.5194/amt-8-1875-2015, 2015. a
Wehner, B., Siebert, H., Ansmann, A., Ditas, F., Seifert, P., Stratmann, F., Wiedensohler, A., Apituley, A., Shaw, R. A., Manninen, H. E., and Kulmala, M.: Observations of turbulence-induced new particle formation in the residual layer, Atmos. Chem. Phys., 10, 4319–4330, https://doi.org/10.5194/acp-10-4319-2010, 2010. a
Wehner, B., Werner, F., Ditas, F., Shaw, R. A., Kulmala, M., and Siebert, H.: Observations of new particle formation in enhanced UV irradiance zones near cumulus clouds, Atmos. Chem. Phys., 15, 11701–11711, https://doi.org/10.5194/acp-15-11701-2015, 2015. a