the Creative Commons Attribution 4.0 License.
the Creative Commons Attribution 4.0 License.
 | 01 Apr 2021
Influence of low-level blocking and turbulence on the microphysics of a mixed-phase cloud in an inner-Alpine valley
Fabiola Ramelli
Jan Henneberger
Robert O. David
Annika Lauber
Julie T. Pasquier
Jörg Wieder
Johannes Bühl
Patric Seifert
Ronny Engelmann
Maxime Hervo
Ulrike Lohmann
Previous studies that investigated orographic precipitation have primarily focused on isolated mountain barriers. Here we investigate the influence of low-level blocking and shear-induced turbulence on the cloud microphysics and precipitation formation in a complex inner-Alpine valley. The analysis focuses on a mid-level cloud in a post-frontal environment and a low-level feeder cloud induced by an in-valley circulation. Observations were obtained from an extensive set of instruments including ground-based remote sensing instrumentation, in situ instrumentation on a tethered-balloon system and ground-based precipitation measurements.
During this event, the boundary layer was characterized by a blocked low-level flow and enhanced turbulence in the region of strong vertical wind shear at the boundary between the blocked layer in the valley and the stronger cross-barrier flow aloft. Cloud radar observations indicated changes in the microphysical cloud properties within the turbulent shear layer including enhanced linear depolarization ratio (i.e., change in particle shape or density) and increased radar reflectivity (i.e., enhanced ice growth). Based on the ice particle habits observed at the surface, we suggest that riming, aggregation and needle growth occurred within the turbulent layer. Collisions of fragile ice crystals (e.g., dendrites, needles) and the Hallett–Mossop process might have contributed to secondary ice production.
Additionally, in situ instrumentation on the tethered-balloon system observed the presence of a low-level feeder cloud above a small-scale topographic feature, which dissipated when the low-level flow turned from a blocked to an unblocked state. Our observations indicate that the low-level blocking (due to the downstream mountain barrier) created an in-valley circulation, which led to the production of local updrafts and the formation of a low-level feeder cloud. Although the feeder cloud did not enhance precipitation in this particular case (since the majority of the precipitation sublimated when falling through a subsaturated layer above), we propose that local flow effects such as low-level blocking can induce the formation of feeder clouds in mountain valleys and on the leeward slope of foothills upstream of the main mountain barrier, where they can act to enhance orographic precipitation through the seeder–feeder mechanism.
- Article
(10310 KB) - Full-text XML
- BibTeX
- EndNote


Mountains can alter and reorganize incoming weather systems or force air masses to lift and thus produce a large proportion of the Earth's annual precipitation (Roe, 2005). Besides the total amount of precipitation, also its spatial distribution across the mountain range becomes of increasing importance for public warning (e.g., avalanche, flash flood), water resources, hydropower production and winter tourism (Stoelinga et al., 2013). In addition to orographic lifting and the subsequent production of condensate, additional processes are required to efficiently form precipitation-sized particles within the lifetime of the cloud as it crosses the mountain barrier (e.g., Smith, 1979; Frei and Schär, 1998; Roe, 2005; Houze, 2012; Smith, 2019). As such, extensive knowledge of these physical processes and the interplay between dynamics, microphysics and orography is essential to understand precipitation formation over complex terrain.
Numerous mechanisms have been identified to affect the airflow and enhance orographic precipitation (e.g., Borys et al., 2003; Rotunno and Houze, 2007; Lowenthal et al., 2011; Houze, 2012; Medina and Houze, 2015; Kirshbaum et al., 2018; Smith, 2019). For example, if the airflow impinging on a mountain barrier is sufficiently weak, the mountain barrier is too high, or the atmosphere is stably stratified, the low-level flow might be blocked or diverted around the mountain. As a consequence, a stagnant blocked layer can form in front of the mountain barrier, which extends the effective width of the mountain barrier and causes lifting further upstream (e.g., Rotunno and Ferretti, 2001; Medina and Houze, 2003; Jiang and Smith, 2003). Additionally, a layer of strong shear is usually present at the interface between the blocked layer and the strong cross-barrier flow aloft, which can be the source of turbulent motions. This shear-induced turbulent layer can enhance orographic precipitation (e.g., Houze and Medina, 2005; Medina et al., 2005, 2007) and is the focus of the present study.
Besides the dynamical response of the airflow to the orography, a wide range of microphysical interactions can occur between cloud droplets, ice crystals and water vapor. For example, individual ice crystals can grow by vapor deposition, can collide and stick together with other ice crystals (aggregation), or can collide with supercooled cloud droplets that freeze upon contact (riming) (e.g., Pruppacher and Klett, 1980; Lohmann et al., 2016). Turbulence and updrafts can accelerate ice growth through riming and aggregation and thus precipitation fallout by sustaining the production of supercooled liquid water (Rauber and Tokay, 1991) and by increasing the collision efficiencies between cloud particles (Pinsky et al., 2016). Furthermore, enhanced ice–ice collisions can promote mechanical break-up of ice crystals and lead to the production of a large number of small secondary ice particles (e.g., Vardiman, 1978; Yano et al., 2016). Additionally, riming can also produce secondary ice through the Hallett–Mossop process, which is known to be active at temperatures between −3 and −8 ∘C (Hallett and Mossop, 1974).
In this study, we investigate the influence of low-level blocking and shear-induced turbulence on the microphysics and precipitation formation of a mixed-phase cloud in an inner-Alpine valley. Previous studies found that flow blocking and shear-induced turbulence can facilitate rapid ice growth and ultimately enhance orographic precipitation (e.g., Marwitz, 1983; Overland and Bond, 1995; Yu and Smull, 2000; Hogan et al., 2002; Neiman et al., 2002; Neiman et al., 2004; Houze and Medina, 2005; Loescher et al., 2006; Olson et al., 2007; Olson and Colle, 2009; Geerts et al., 2011; Medina and Houze, 2015; Grazioli et al., 2015; Aikins et al., 2016). For example, turbulent updraft cells were observed over the Oregon Cascade Mountains in regions where the vertical shear in the horizontal wind exceeded 10 (Houze and Medina, 2005). Houze and Medina (2005) suggested that these turbulent updraft cells can enhance ice growth through riming and aggregation. Both mechanisms can lead to rapid conversion of condensate to precipitation-sized particles. More recent studies confirmed the findings by Houze and Medina (2005) that turbulent updraft cells enhance ice growth and precipitation (e.g., Medina and Houze, 2015; Geerts et al., 2011; Aikins et al., 2016). However, Geerts et al. (2011) could not draw any conclusions regarding the dominant ice growth processes due to restrictions in the aircraft flight level. On the other hand, Aikins et al. (2016) proposed depositional growth and aggregation as the dominant ice growth mechanisms for their study rather than riming due to the low amounts of liquid water observed in the shear layer. Thus, the dominant growth process within shear-induced turbulent layers depends on the environmental conditions such as temperature, updraft velocity, and the ice crystal and cloud droplet size distributions.
This work builds on previous studies that investigated the implications of shear-induced turbulence on the cloud microphysics and precipitation formation and extends the analysis to a more complex terrain. While previous observational studies have mainly focused on the effect of an isolated mountain barrier, we investigated the role of shear-induced turbulence in an inner-Alpine valley near Davos, Switzerland. The region around Davos, or more generally the Alpine region, is characterized by complex terrain with narrow valleys and multiple mountain barriers, which can cause complex interactions between numerous mechanisms on different scales. This complexity has already been recognized during the Mesoscale Alpine Programme (MAP) (e.g., Rotunno and Houze, 2007). In an environment with a series of parallel mountain ridges, a superposition of upstream and downstream effects can occur. In the present study, we attempt to investigate whether a “simple” conceptual mechanism as described in Houze and Medina (2005) can also be observed in a complex environment that is embedded between two mountain ridges and which is likely influenced by upstream and downstream effects. In addition, we extend the analysis to lower altitudes, which were inaccessible in previous studies due to limits in the flight levels, by using a tethered-balloon system. The balloon-borne profiles can provide information on the microphysical cloud properties in the lowest part of the boundary layer. These questions are addressed in a case study on 7 March 2019, when a blocked low-level flow was observed in a post-frontal air mass during the Role of Aerosols and CLouds Enhanced by Topography on Snow (RACLETS) campaign. The multi-instrument analysis is based on (1) wind profiler and wind lidar measurements; (2) observations of a Ka-band polarimetric cloud radar, a Raman lidar and a microwave radiometer; (3) in situ microphysical measurements on a tethered-balloon system; and (4) ground-based precipitation measurements.
The main measurement locations and instruments are briefly described in Sect. 2. An overview of the synoptic weather situation and the case study is given in Sect. 3. Section 4 presents the influence of low-level blocking and shear-induced turbulence on the cloud microphysics and precipitation formation. The findings are discussed in a larger context and presented in a conceptual model in Sect. 5. A summary of the main findings is given in Sect. 6.
The RACLETS campaign took place from 8 February 2019 to 28 March 2019 in the region around Davos in the Swiss Alps. The main objective of the campaign was to investigate the pathways of precipitation formation in orographic clouds, covering the entire aerosol–cloud–precipitation–snow distribution process chain, in order to improve our understanding of orographic precipitation. The overall goal of the RACLETS campaign was to use the gained process understanding of orographic clouds to improve regional precipitation forecasting in complex terrain. For this purpose, a multi-dimensional set of instruments and measurements were deployed to provide a comprehensive dataset of orographic clouds (see also Ramelli et al., 2020b; Lauber et al., 2020; Mignani et al., 2020; Georgakaki et al., 2020).
2.1 Measurement location
A map of the instrument setup and the relevant measurement locations is shown in Fig. 1. Davos is located in the Swiss Alps in the eastern part of Switzerland. The Alpine massif is oriented in a southwest–northeast direction and has a mean ridge height of around 3000 m a.s.l., or 2400 m above the surrounding lowlands. The Alps represent a barrier for incoming weather systems, which predominantly approach the measurement location in Davos from the northwest or south. During the case study presented here, the large-scale flow was from the southwestern direction and thus followed approximately the direction of the Davos valley. Weather systems approaching Davos from the south are influenced by topography to a larger extent because the main ridge of the Alps is located south of Davos (indicated by B1 in Fig. 1b).

Figure 1Overview of the measurement location and setup. The geographical location of Davos (black cross) and the surrounding topography are shown in (b). The large-scale wind direction during the event is shown by the black arrow, and the relevant mountain barriers are indicated by B1 (upstream mountain barrier) and B2 (downstream mountain barrier). An enlarged section of the measurement sites (black rectangle in b) and the instrument setup are shown in (a). The elevation data were obtained from the digital height model DHM25 of the Federal Office of Topography.
The main measurement locations consist of two mountaintop stations (Weissfluhjoch: 2700 m; Gotschnagrat: 2300 m) and three valley stations (Wolfgang: 1630 m; Laret: 1500 m; Klosters: 1200 m), which are located within a distance of 10 km (see Fig. 1a). The region around Klosters and Davos is characterized by complex topography. The Klosters valley is oriented from northwest to southeast, and the elevation gradually increases from the lowlands (500 m) to 1200 m. In contrast, the Davos valley is oriented in a northeast–southwest direction. The height rapidly increases from Klosters (1200 m) towards Wolfgang (1630 m) before it slowly decreases on the way to Davos (1560 m). In the following, we briefly describe the relevant instruments which have been used in the present study. More information about the instrumentation can be found in Ramelli et al. (2020b).
2.2 Instrument setup
A set of ground-based remote sensing and in situ instruments were installed at Wolfgang to study the microphysical cloud structure (Fig. 1a). A vertically pointing Ka-band cloud radar Mira-36 (METEK GmbH, Germany; Melchionna et al., 2008; Görsdorf et al., 2015; Löhnert et al., 2015) provided vertical profiles of radar reflectivity factor, Doppler velocity, Doppler spectra, spectral width and linear depolarization ratio (LDR) with a vertical resolution of 31.17 m and a temporal resolution of 10 s. A PollyXT Raman and depolarization lidar (e.g., Engelmann et al., 2016) was deployed to study the aerosol and cloud properties. Moreover, a 14-channel microwave radiometer (HATPRO, Radiometer Physics GmbH, Germany; Rose et al., 2005) provided information about the vertical temperature and humidity profiles as well as the column-integrated water vapor content (IWV) and liquid water path (LWP). In situ observations of the low-level microphysical cloud structure were obtained with a tethered-balloon system (HoloBalloon; Ramelli et al., 2020a). The main component of the measurement platform is the HOLographic cloud Imager for Microscopic Objects (HOLIMO), which can image cloud particles in the size range of 6 µm to 2 mm (Henneberger et al., 2013; Beck et al., 2017; Ramelli et al., 2020a). It provides information about the phase-resolved number concentration, water content, size distribution and particle shape. Additionally, a ceilometer (CL31, Vaisala, Finland) was installed at Klosters, which was used to identify the height of the cloud base (Fig. 1a).
Observations of the three-dimensional wind fields were obtained with a radar wind profiler (LAP-3000 Wind profiler, Vaisala, Finland) and a wind lidar (Windcube 100S, Leosphere, France) at Wolfgang (Fig. 1a). The wind profiler had a temporal resolution of 5 min and a vertical resolution of 200 m, whereas the wind lidar provided wind measurements with a higher vertical resolution of 50 m. The wind profiler was operated at a frequency of 1290 MHz. Both the wind profiler and wind lidar operated in Doppler beam swinging (DBS) mode with one vertical and four oblique beams at an elevation angle of 75∘ from horizontal. Additionally, range height indicator (RHI) scans were performed every 30 min in four different azimuth directions (0, 70, 180 and 250∘).
Precipitation was measured using a set of different ground-based precipitation instruments. Three particle size–velocity (PARSIVEL) disdrometers (OTT Parsivel2, OTT HydroMet, Germany; Tokay et al., 2014) were installed at Wolfgang (1630 m), Laret (1500 m) and Gotschnagrat (2300 m), respectively (see Fig. 1a). PARSIVEL disdrometers can measure the size and the fall velocity of hydrometeors falling through the sample volume independently. The particle size is estimated from the signal attenuation, whereas the particle fall velocity is estimated from the duration of the measured signal. Precipitation particles in the size range between 0.2 and 25 mm can be measured by the disdrometer with a temporal resolution of 30 s. Additionally, a multi-angle snowflake camera (MASC) at Laret took photographs of hydrometeors from three different angles and measured their fall velocity simultaneously (Garrett et al., 2012). The MASC is sensitive to particles in the size range of 30 µm to 3 cm. Lastly, a snow drift station was installed at Gotschnagrat, which provided information about the snow redistribution at the ground and the low-level wind field (Walter et al., 2020).
The observations presented in this case study were measured in a post-frontal environment on 7 March 2019. The synoptic situation over Europe was dominated by an occluding low-pressure system (980 hPa) located east of the British Isles. As the low-pressure system continued to propagate towards Scandinavia, it drove a cold front over the Alps, which passed the measurement location at 08:00 UTC. Based on observations, rainfall of up to 50 mm was produced on the southern side of the Alps during the passage of the cold front (not shown). By 15:00 UTC, southwesterly flow in the post-frontal air mass continued to advect cold air and moisture into the Alpine region (see Fig. 2a), which produced light precipitation on the south side of the Alps with some spillover precipitation on the lee side (i.e., north side) of the Alps. The case study was measured in the post-frontal air mass between 16:00 and 20:00 UTC, when some spillover precipitation reached the measurement locations in the Davos region.
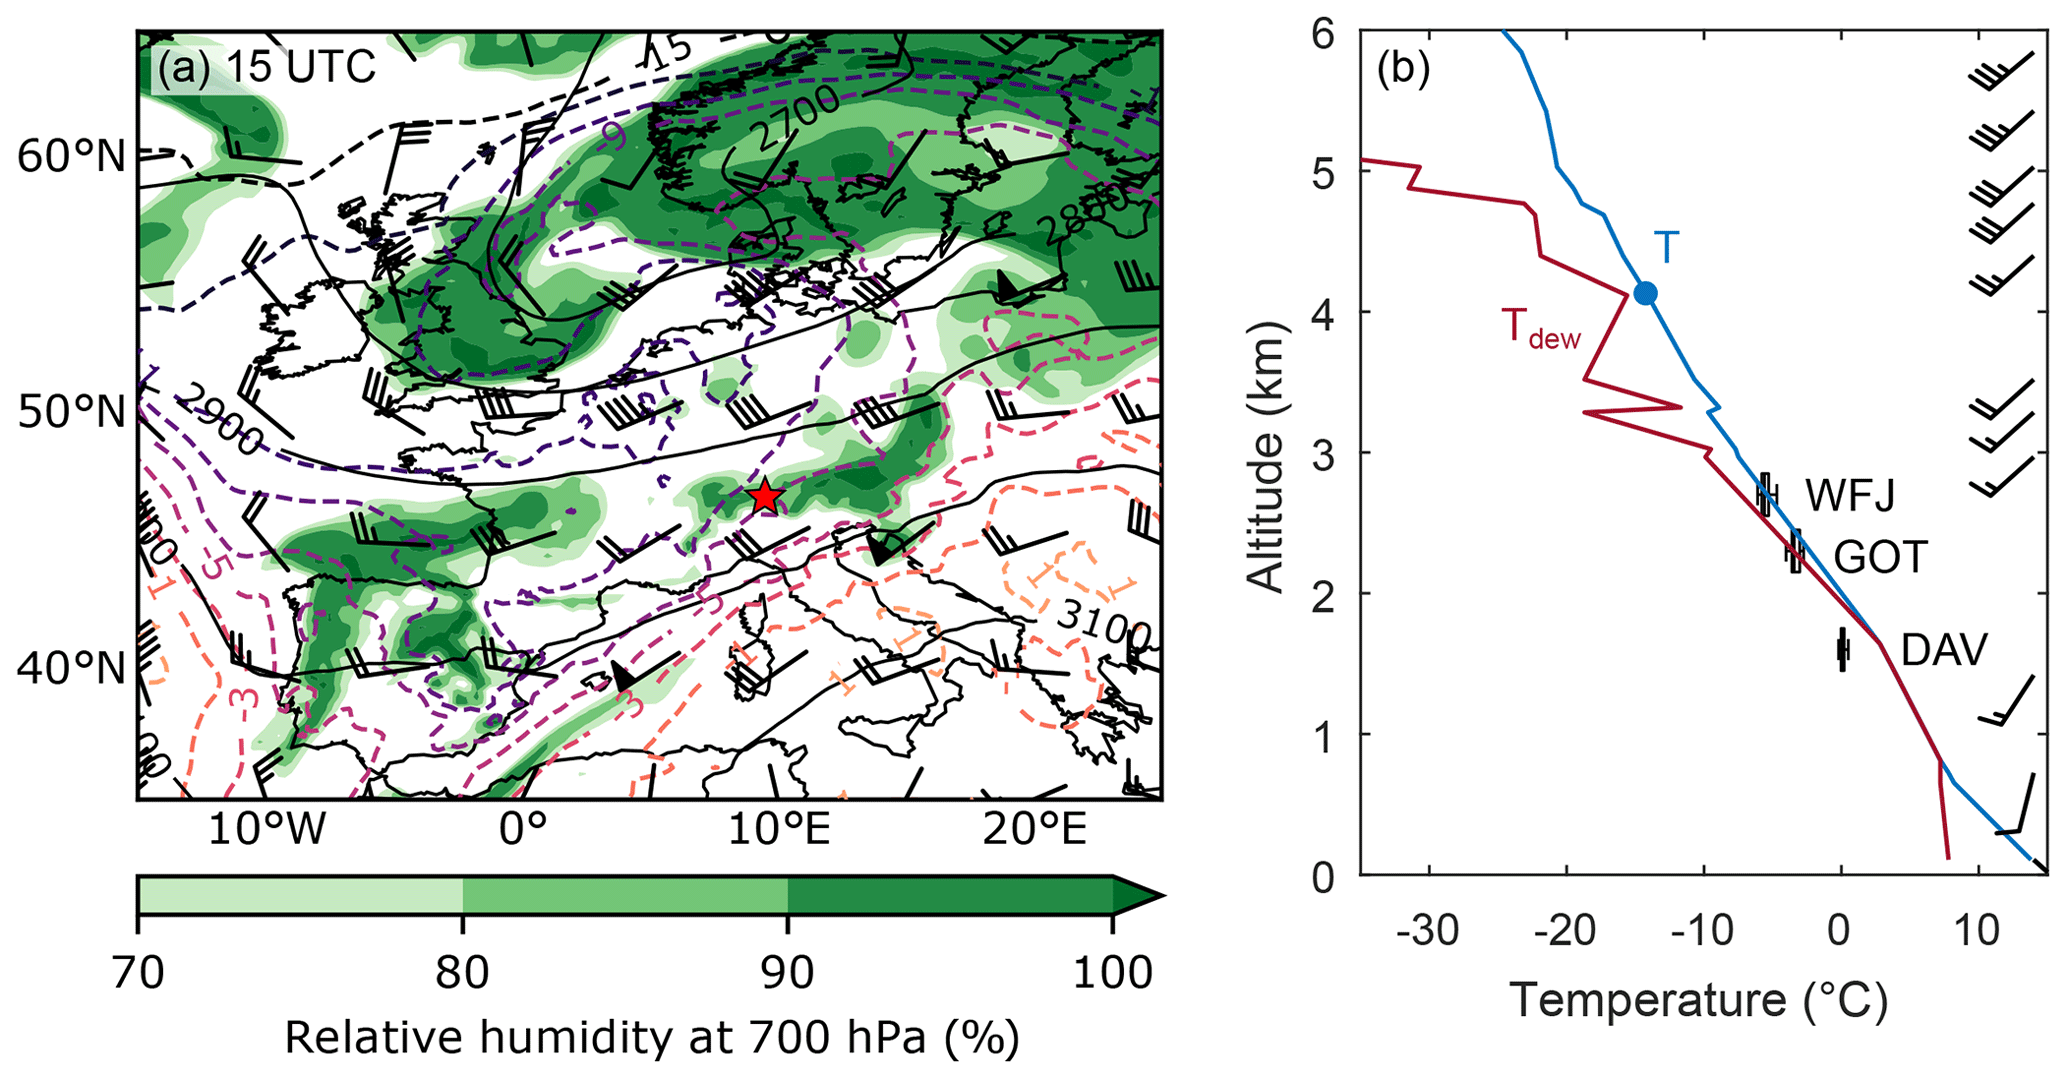
Figure 2Overview of the synoptic weather situation on 7 March 2019 showing a map of ERA5 reanalysis data at 700 hPa height with a horizontal resolution of 0.25∘ (a) and the temperature profile of a radiosonde ascent (b). The reanalysis shows the relative humidity in percent (colored area), the temperature in degrees Celsius (dashed lines), the geopotential height in meters (black lines), and the wind speed and direction in knots (wind barbs) at the 700 hPa pressure level at 15:00 UTC (data obtained from the C3S Climate Data Store, dataset by Hersbach et al., 2018). The 700 hPa pressure level was chosen as it represents the mean Alpine ridge height. The red star indicates the measurement location. The radiosonde was launched from Milan (12:00 UTC; source: UQAM-Montreal Weather Centre) and shows the temperature (blue) and dew point temperature (red) profiles. The boxplots in (b) show the temperature measured at Davos (DAV; 1600 m), Gotschnagrat (GOT; 2300 m) and Weissfluhjoch (WFJ; 2700 m) during the measurement period. The cloud top temperature (−14 ∘C) and height (4000 m; estimated from cloud radar observations averaged between 17:00 and 18:30 UTC) are indicated by the blue dot. The wind barbs are shown on the right side.
The temperature at Davos (1600 m) was around 0 ∘C during the entire observational period, whereas the temperature at Weissfluhjoch (2700 m) decreased from −4.5 to −6 ∘C between 16:00 and 20:00 UTC. Due to the lack of a sounding in the Davos area during the measurement period, the vertical temperature profile of a radiosonde ascent from Milan (Italy; at 12:00 UTC), which is located 150 km southwest of Davos, is shown instead (Fig. 2b). The sounding in Milan is assumed to be representative of the upper air situation in Davos as the airflow was from the southwest. In addition, the temperatures measured at Gotschnagrat and Weissfluhjoch were in good agreement with the temperature profile of the radiosonde (within 1–2 ∘C), whereas the temperature observed in Davos was slightly colder. A cloud top temperature of around −14 ∘C was estimated from the observed temperature profile.
An overview of the microphysical cloud structure is shown in Figs. 3 and 4. The cloud radar observations indicate the presence of a mid-level cloud with a cloud top at around 4000 m. The highest reflectivities (>5 dBZ) were observed between 2500 and 3500 m (Fig. 3a). The reflectivity decreased below 2500 m, suggesting the presence of a sublimation layer. The Doppler velocity showed mainly regions with negative Doppler velocity (Fig. 3b). Positive Doppler velocities (i.e., updrafts) were only observed after 18:00 near the cloud top and after 19:00 UTC near the ground. Additionally, several regions of enhanced spectral width were observed (Fig. 3c). High values in the spectral width can be the result of enhanced turbulence and/or indicate the presence of multiple particle populations with different fall speeds (e.g., Shupe et al., 2004, 2006). The linear depolarization ratio (LDR) ranged between −32 and −22 dB (Fig. 3d) and provides information about the shape and density of cloud particles. A perfectly spherical particle (e.g., small cloud droplet) has no depolarization and thus has an LDR of −∞ dB, whereas a particle with a high aspect ratio has an LDR close to 0 dB. The LDR of a specific hydrometeor type depends on the elevation angle (North et al., 2014). Since a vertically pointing cloud radar was used in this study, the observed LDR signal can only differentiate between isometric particles (e.g., droplets, plates, dendrites) and prolate particles (e.g., needles, columns). Furthermore, the LDR depends on the particle refractive index. Liquid water has a higher refractive index (0.88 for Ka-band) than ice (0.197) (Houze, 2014). For ice particles, the refractive index is related to the particle density, such that hail and graupel have a higher refractive index compared to snowflakes (Bringi and Chandrasekar, 2001). Therefore, changes in the LDR are indicative of changes in the particle shape and/or particle density (e.g., riming). The LDR signal was enhanced locally in some fallstreaks at altitudes below 3000 m (Fig. 3d). The band of enhanced LDR at 2100 m, which was visible during the entire measurement period, shows the effects of ground clutter (i.e., echoes received from objects on the ground or sidelobes reflected from nearby mountains).

Figure 3Cloud radar observations of the radar reflectivity (a), Doppler velocity (b), spectral width (c) and linear depolarization ratio (d) measured on 7 March 2019. Note that the color bar in (b) is centered at −1 m s−1 to approximately account for the hydrometeor fall speed. The red line in panel (d) indicates the track of the 18:00 UTC LDR fallstreak, which is investigated in Fig. 10. The measurement period is divided into three periods, where P1_bl and P3_bl indicate blocked low-level flow, and P2_unbl indicates unblocked low-level flow (see Sect. 4.1 for more details).
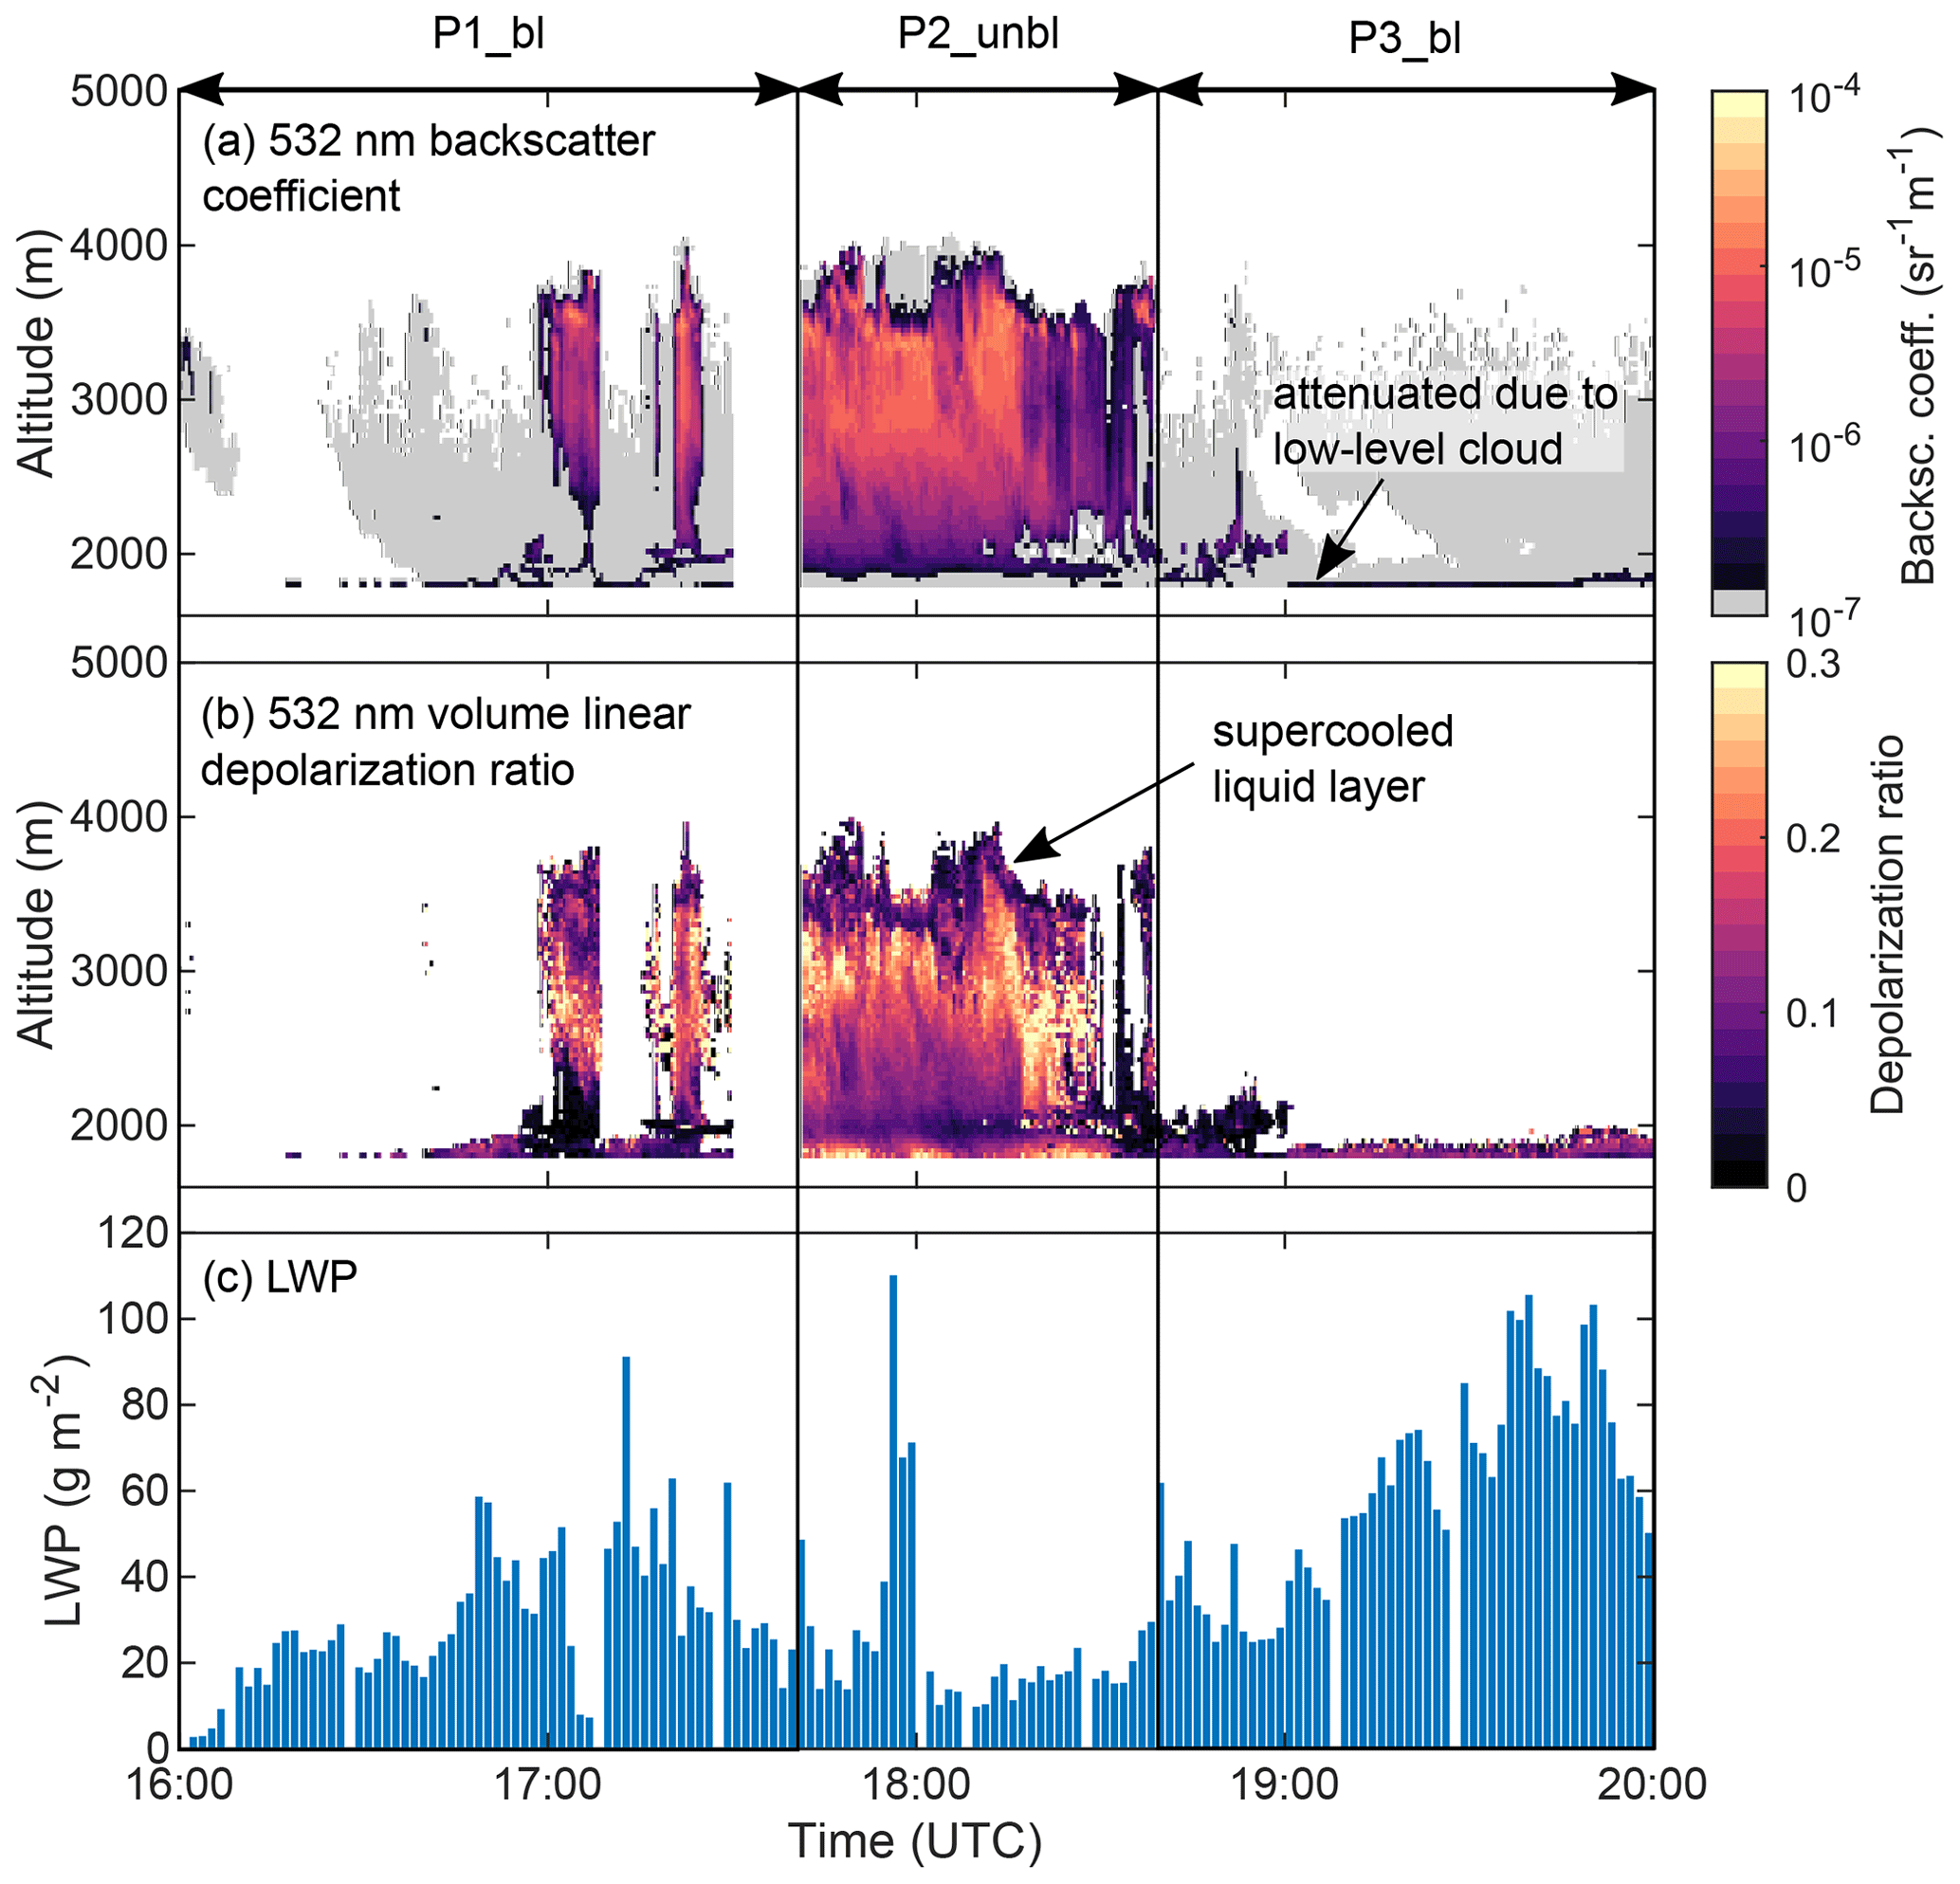
Figure 4Observations of the (lidar) attenuated backscatter coefficient (a), the lidar linear depolarization ratio (b) and the liquid water path measured by the microwave radiometer (c). The measurement period is divided into three periods, where P1_bl and P3_bl indicate blocked low-level flow, and P2_unbl indicates unblocked low-level flow (see Sect. 4.1 for more details).
The lidar signal was mainly attenuated due to the presence of a low-level liquid cloud (Fig. 4). When the low-level liquid cloud dissipated (17:45–18:40 UTC), the lidar signal indicated the presence of an embedded liquid layer at an altitude of around 3500 m. This can be seen by the enhanced attenuated backscatter signal (Fig. 4a) and the low lidar depolarization ratio (Fig. 4b). Indeed, the LWP measured by the microwave radiometer ranged between 20 and 100 g m−2 during the measurement period (Fig. 4c), suggesting the presence of liquid water in some regions (likely at the top) of the mid-level cloud.
The case study was divided into three periods: period P1_bl (16:00–17:45 UTC) and P3_bl (18:40–20:00 UTC) were characterized by blocked low-level flow and the presence of a low-level liquid cloud at around 2000 m. The low-level blocking weakened, and the low-level feeder cloud dissipated during period P2_unbl (17:45–18:40 UTC). In the following, we characterize the dynamics of the flow during the measurement period (Sect. 4.1). In a second step, we investigate the influence of shear-induced turbulence on the cloud microphysics and precipitation formation (Sect. 4.2). Lastly, the role of the low-level blocking for the formation of a low-level feeder cloud is discussed in Sect. 4.3.
4.1 Low-level flow blocking and wind shear
The horizontal wind fields were measured with a radar wind profiler and a wind lidar at Wolfgang (Fig. 5). Both wind profiler and wind lidar data are shown as the wind lidar was attenuated during most of P1_bl and P3_bl due to the presence of a low-level liquid cloud (see Sect. 4.3). The wind speed measured by the wind profiler increased from around 4 m s−1 at 2200 m up to 18 m s−1 at 3500 m (Fig. 5a). The wind lidar revealed a second layer of increased wind speed between 2500 and 3000 m (Fig. 5b), which was not captured by the wind profiler due to its lower resolution. The layer of increased wind speed lowered between 17:00 and 18:30 UTC, suggesting stronger downward propagation of the cross-barrier flow. The large-scale wind direction was from the southwest. Only in the lowest 100 m of the boundary layer was a flow from the northeast observed by the wind lidar.
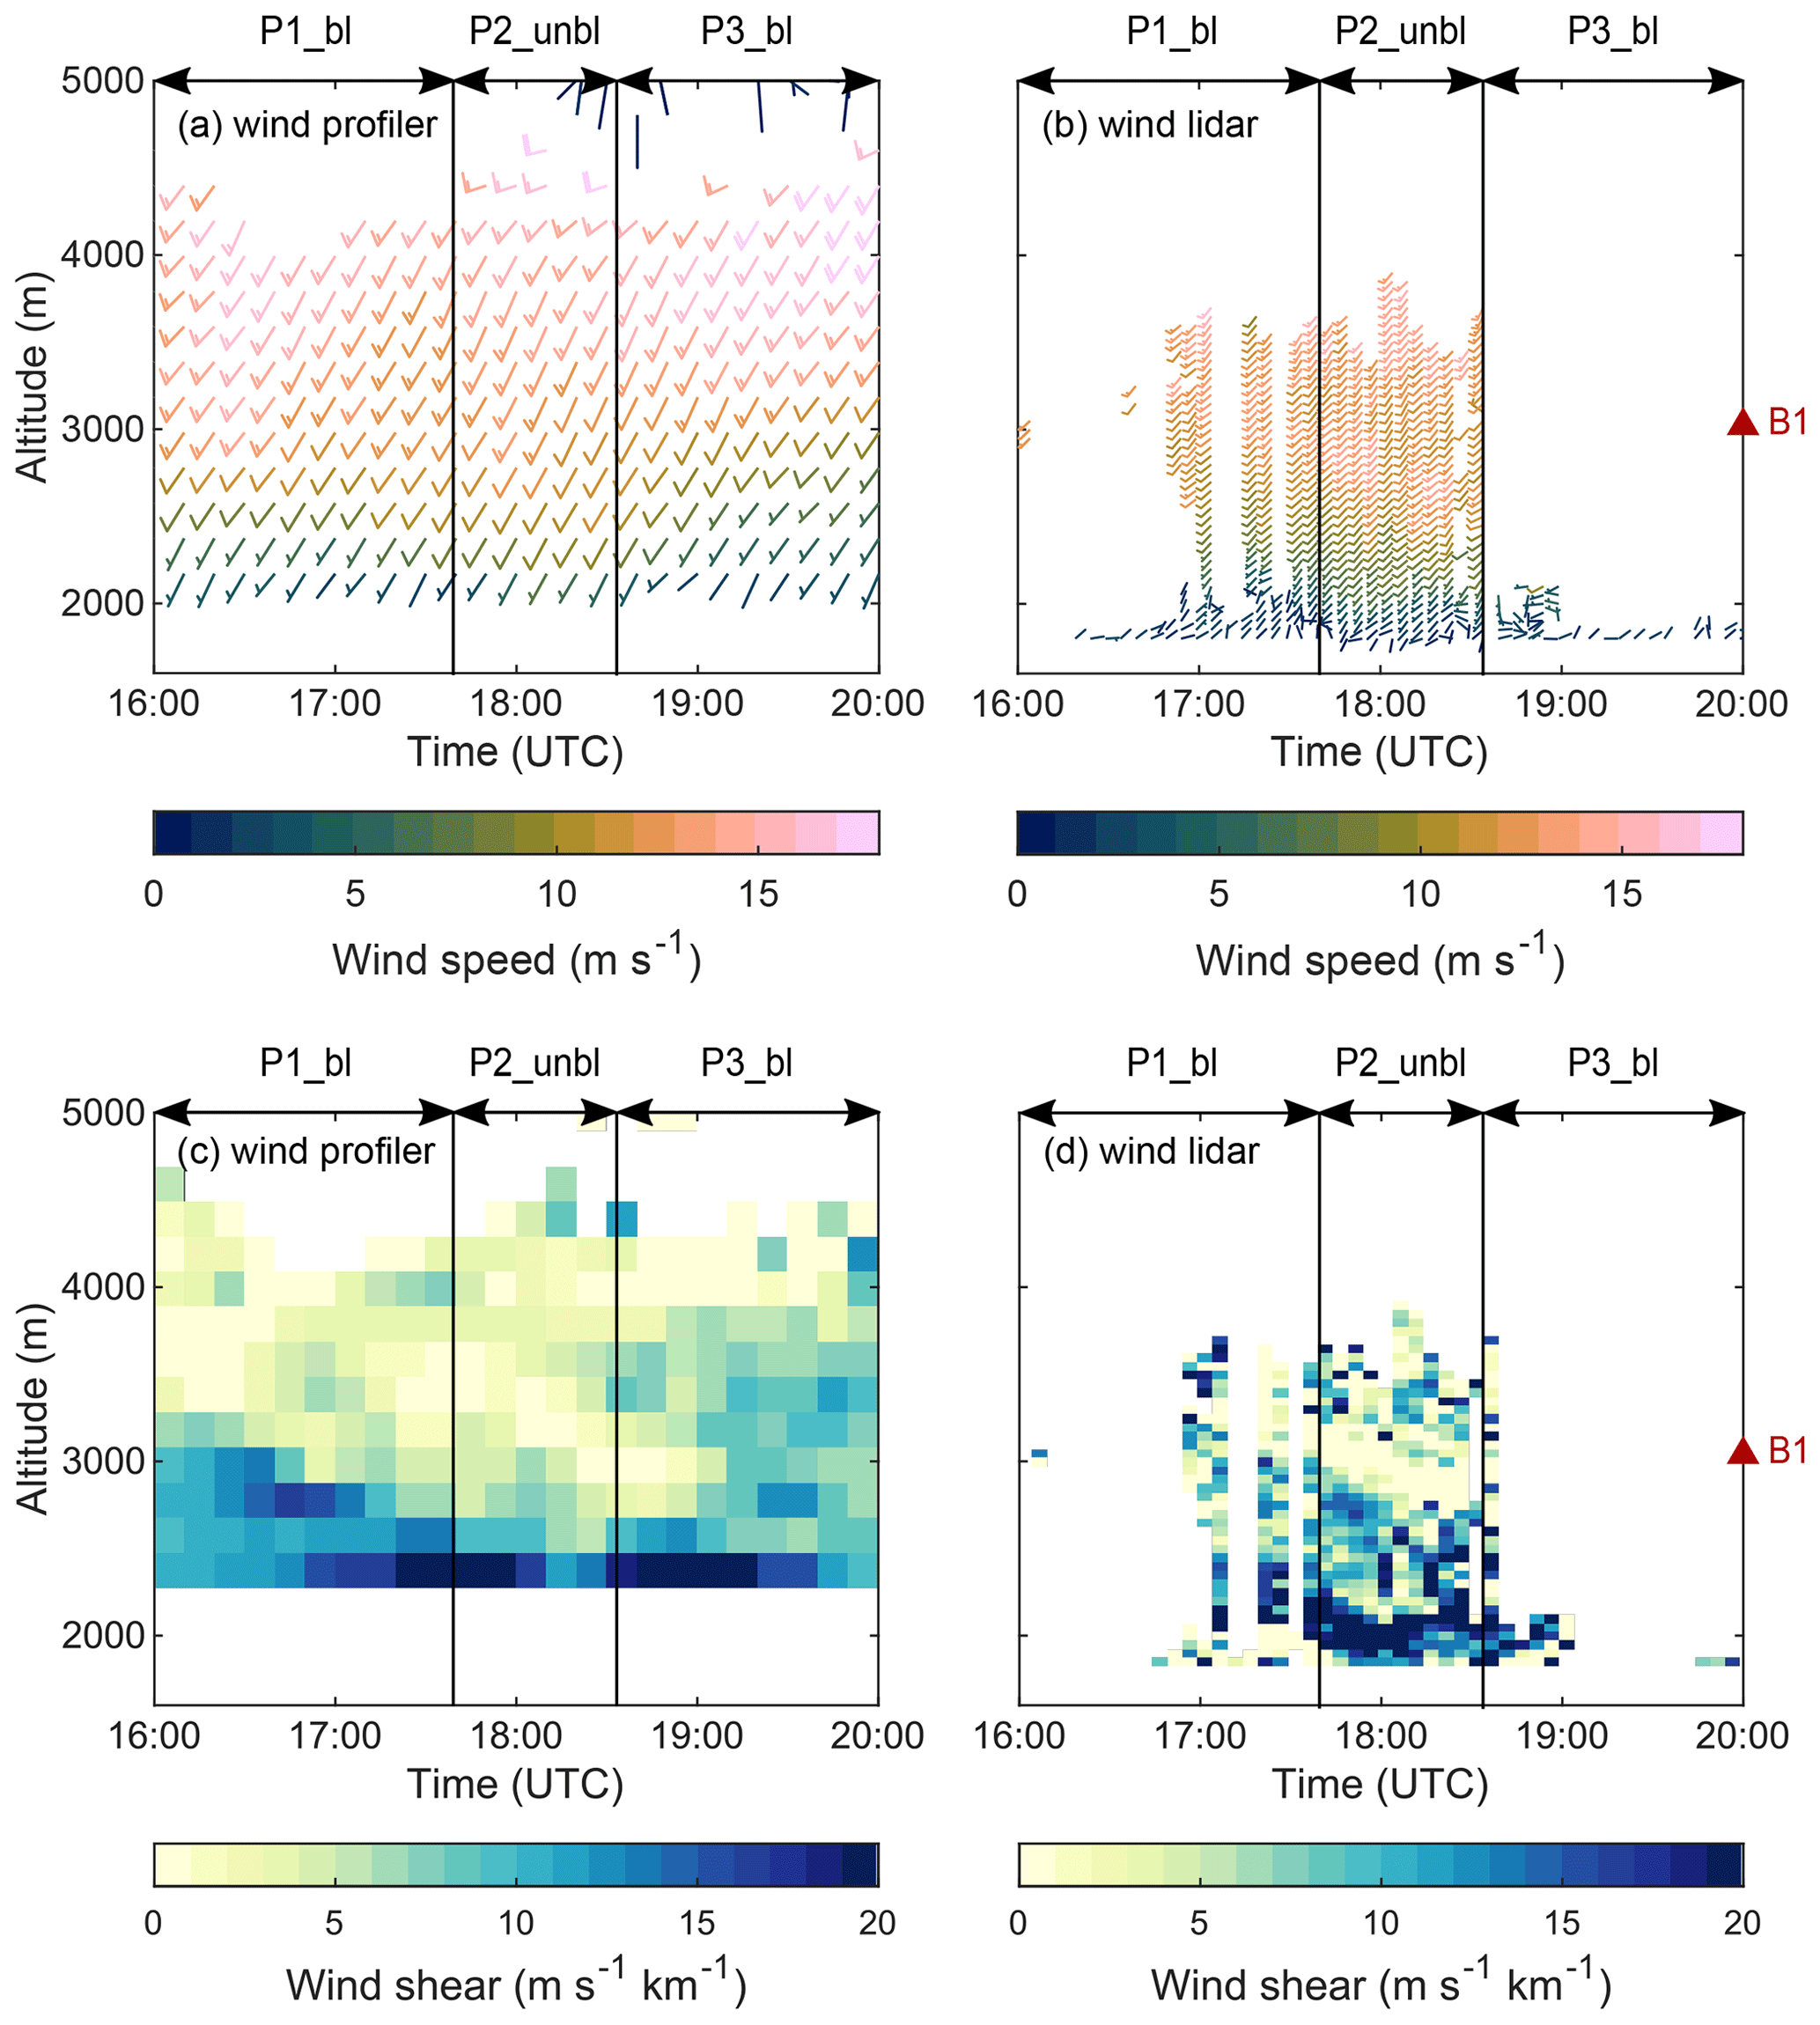
Figure 5Vertical profiles of the horizonal wind speed and direction (a, b) and vertical shear in the horizontal wind (c, d) measured by the radar wind profiler (a, c) and wind lidar (b, d). The vertical wind shear was calculated from the wind observations, considering changes in the horizontal wind speed between two adjacent height levels. The red triangle symbol on the right side indicates the mean height of the upstream mountain barrier B1 (see Fig. 1b).
The counterflow at low levels with respect to the large-scale flow as well as the low wind speed close to the surface is indicative of blocked low-level flow (e.g., Houze and Medina, 2005). More specifically, the low-level flow at Wolfgang might have been too weak to ascend over the mountain barrier located downstream of Wolfgang (B2 in Fig. 1b) and might have generated a counterflow when it impinged on the mountain barrier. To test this hypothesis and to study the observed pattern in the low-level wind field in more detail, wind measurements from different valley and mountaintop weather stations around Davos and Klosters were analyzed (Fig. 6). Several valley stations (Davos, Davos Seehornwald, Wolfgang, Klosters Gatschiefer) observed the presence of a counterflow (i.e., wind from northeastern direction), indicative of blocked low-level flow. The wind pattern at Klosters Madrisa, which is located immediately below the mountain barrier B2, was more diverse, showing large variations in the prevailing wind direction. The mountaintop stations (Weissfluhjoch, Gotschnagrat, Klosters Sant Jaggem) observed wind from the south and southwestern direction in accordance with the large-scale wind direction. Therefore, the observed wind pattern at the different locations supports the hypothesis of a blocked low-level flow. It is important to note that a counterflow was only observed during P1_bl and P3_bl at the valley stations in Davos (Davos, Davos Seehornwald, Wolfgang), indicating that the low-level flow changed from a blocked (P1_bl, P3_bl) to an unblocked (P2_unbl) state during the event (see also Fig. 7 for the temporal evolution at Wolfgang). The flow at Klosters Gatschiefer was still blocked during P2_unbl, suggesting that the blocking became weaker and moved closer to the mountain barrier B2 located downstream.
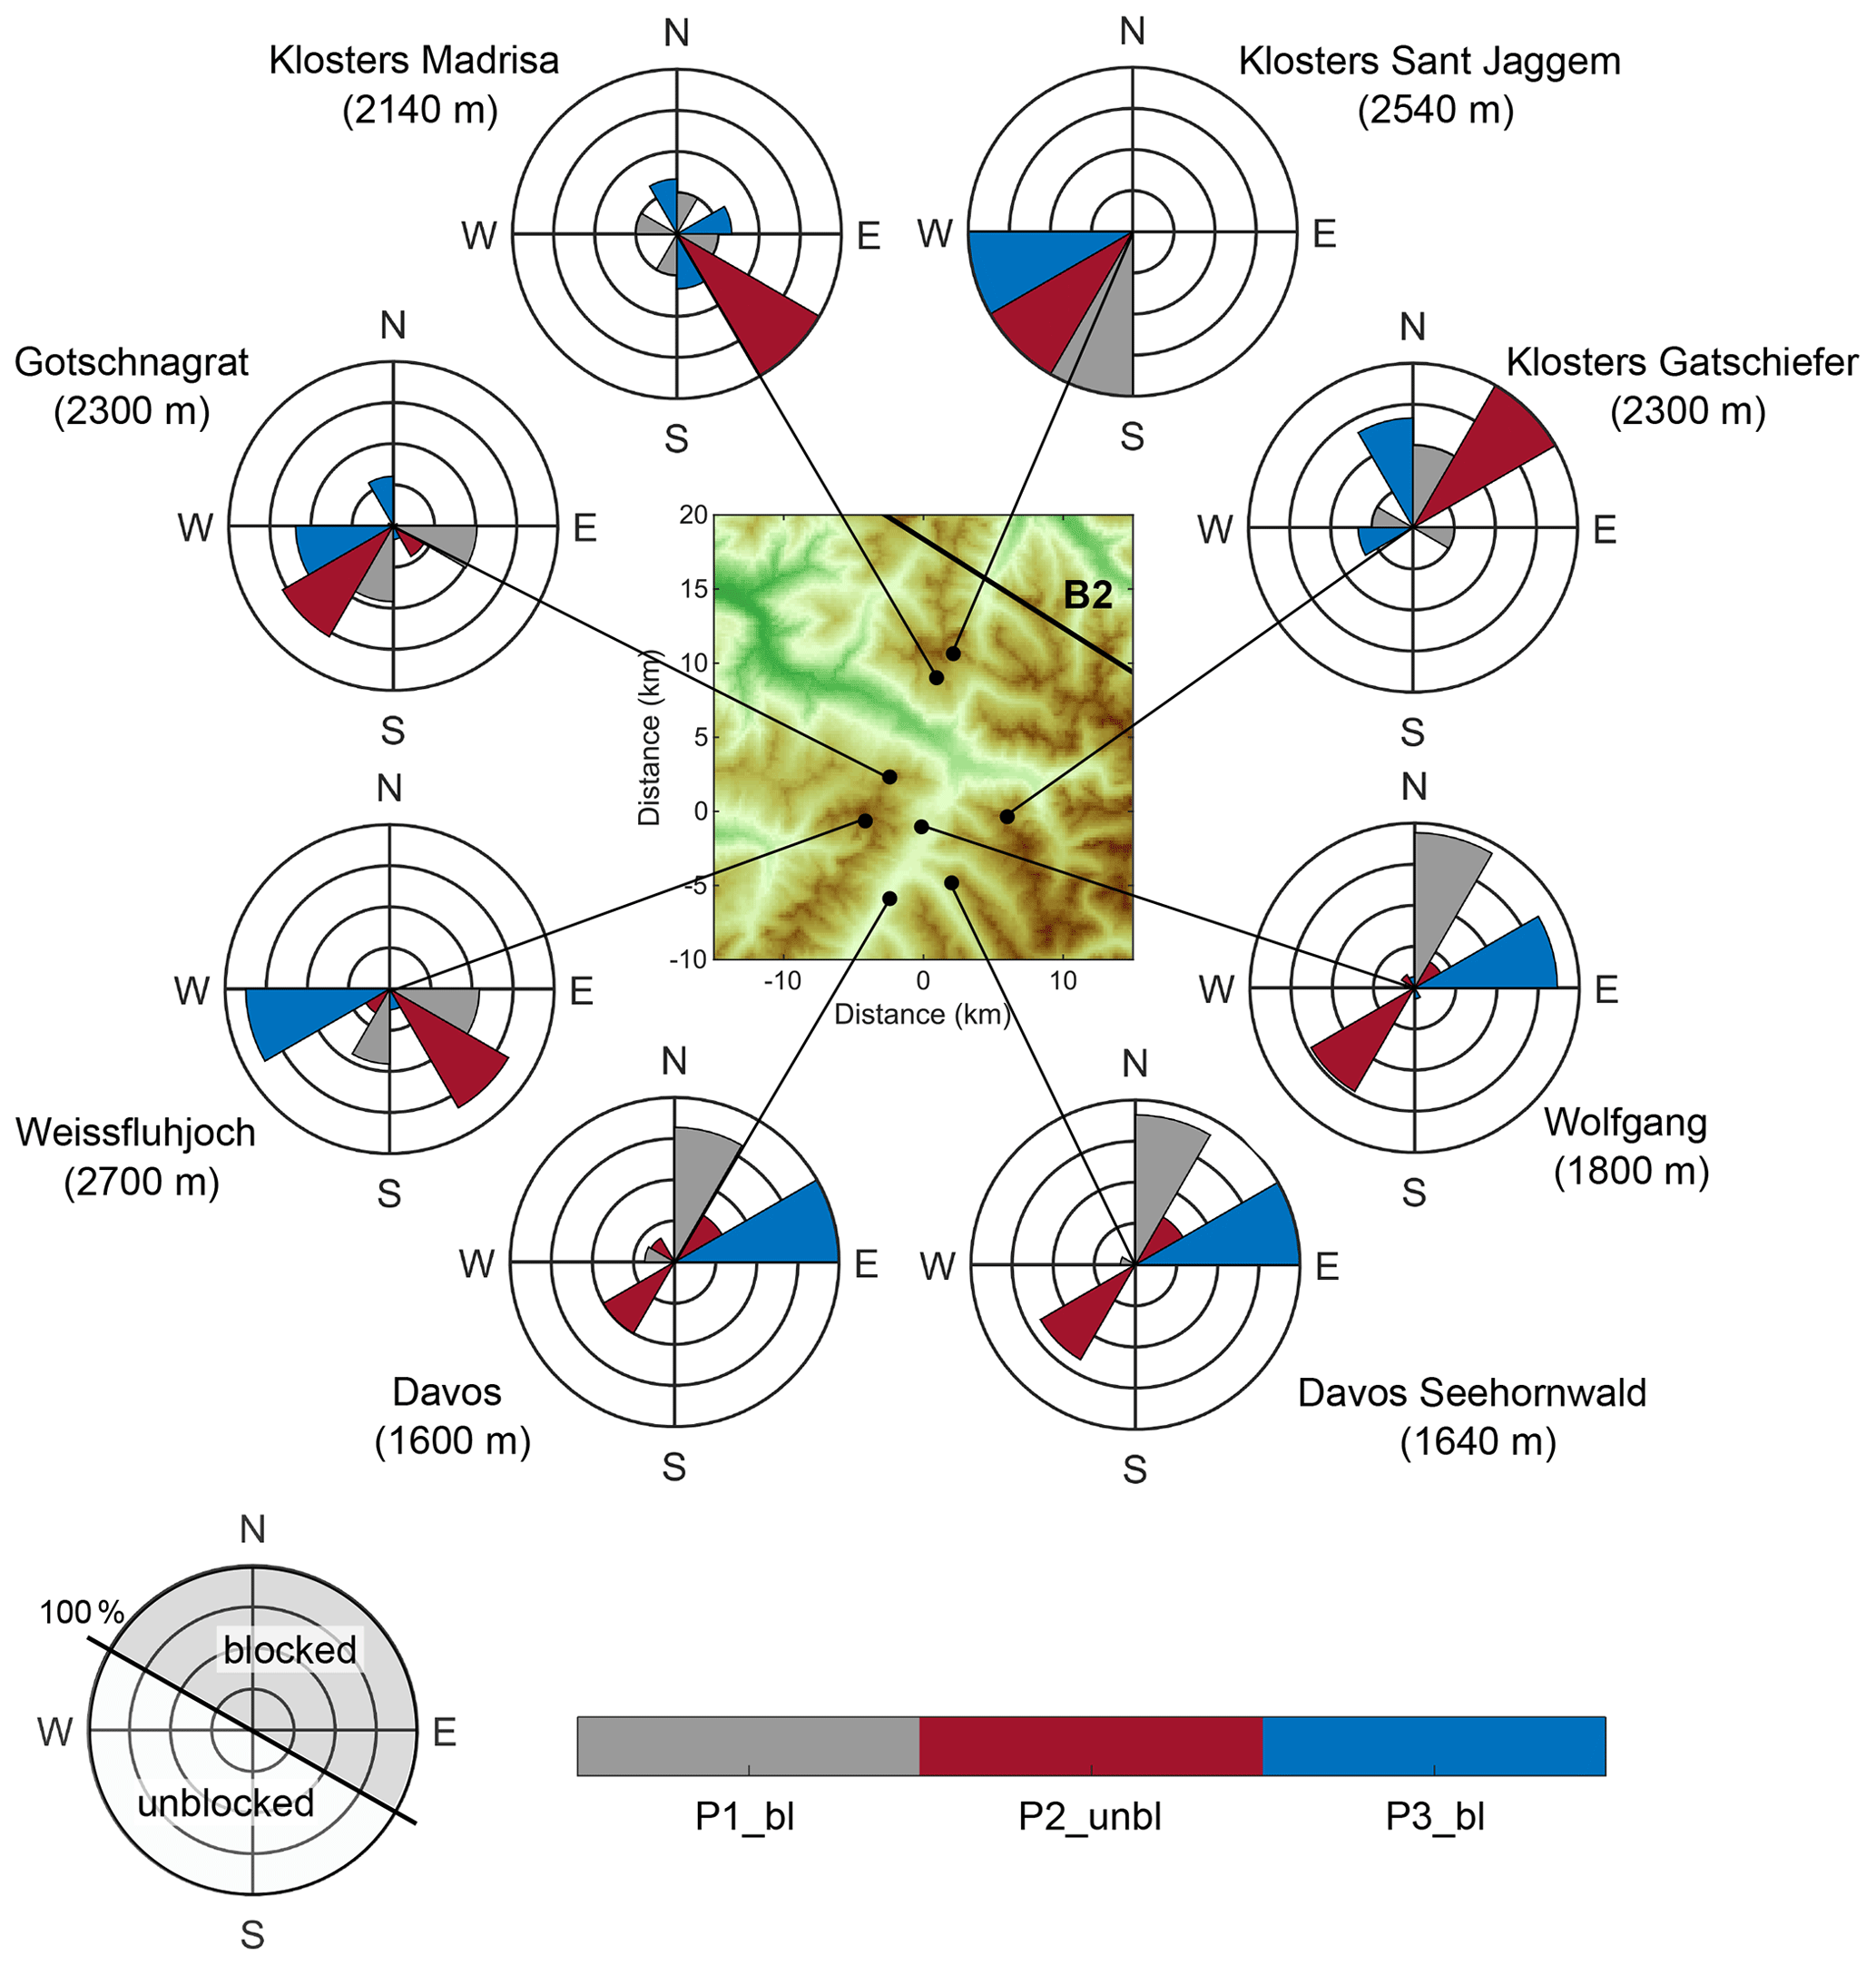
Figure 6Wind observations at different weather stations around Davos and Klosters, indicating the wind direction observed during the time periods P1_bl (gray), P2_unbl (red) and P3_bl (blue). The wind directions in the different periods were normalized and binned in sectors of 90∘ (NE, SE, SW, NW). Each line indicates 25 %. The example wind rose on the bottom left shows the wind directions during a blocked (gray)/unblocked (white) low-level flow in the Davos valley. The wind observations at the weather stations in Davos had a temporal resolution of 10 min, whereas the stations around Klosters had a temporal resolution of 30 min. The measurements at Wolfgang were obtained from the wind lidar observations at an altitude of 1800 m and the measurements at Gotschnagrat from a 3D ultrasonic anemometer that was an integral part of the snow drift station.
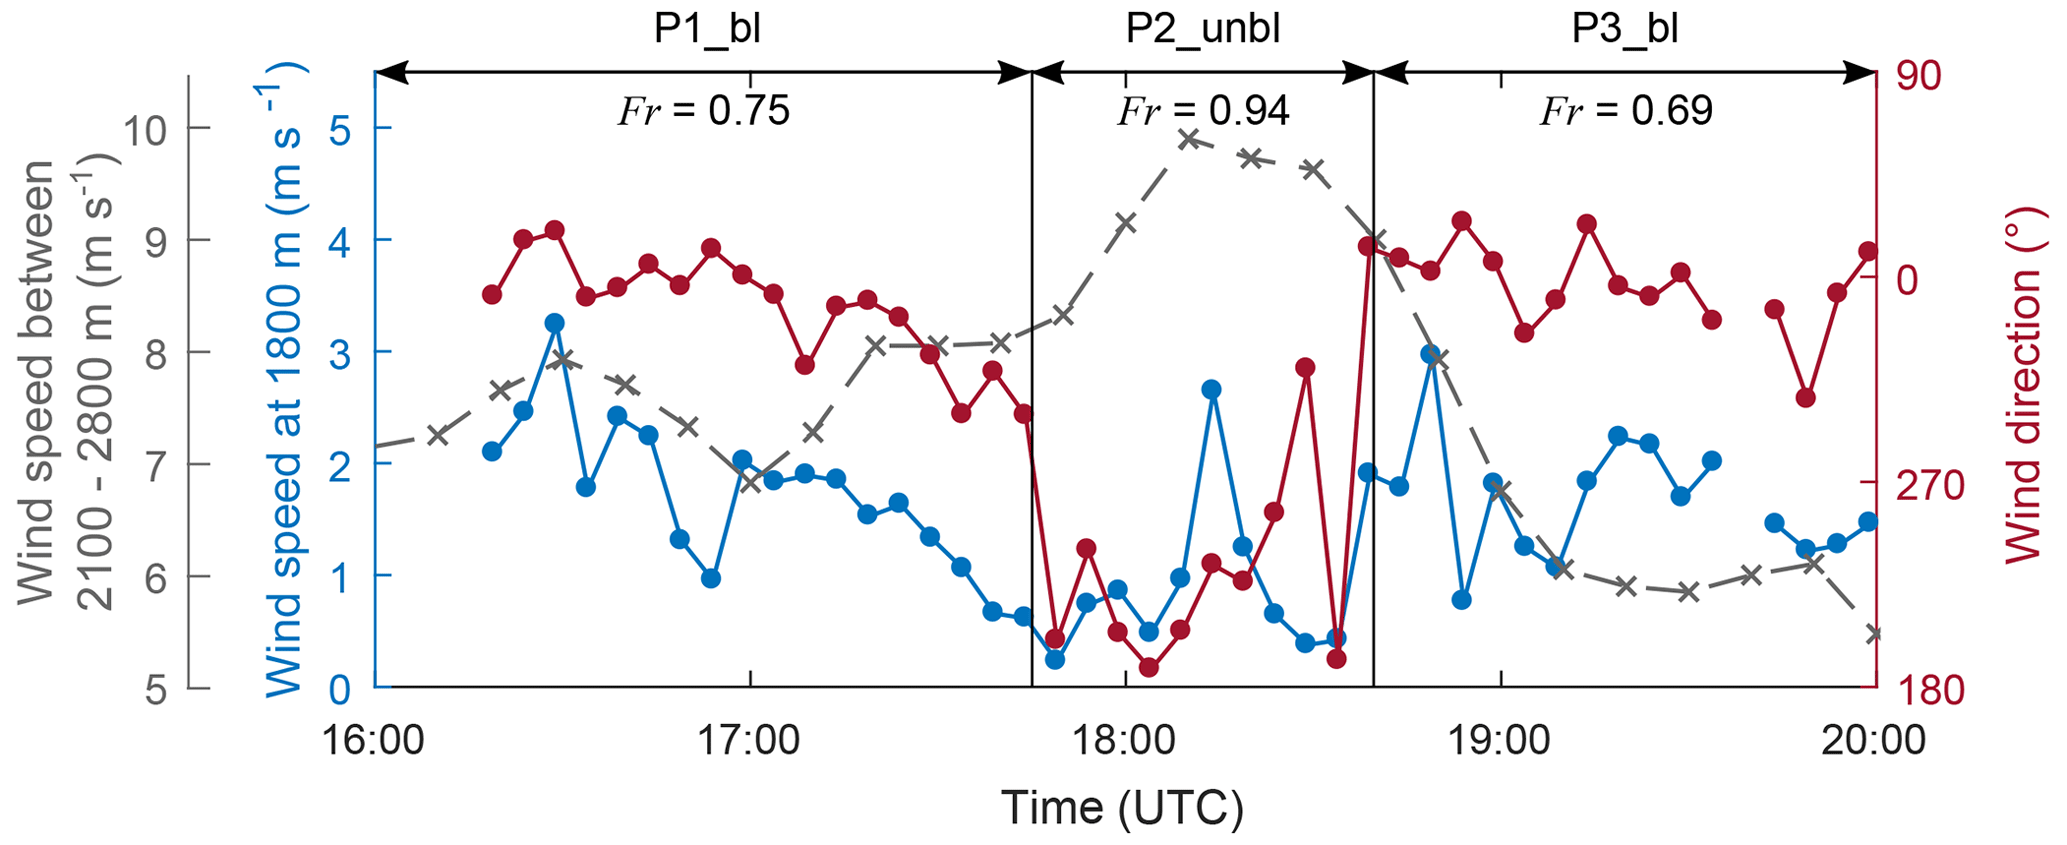
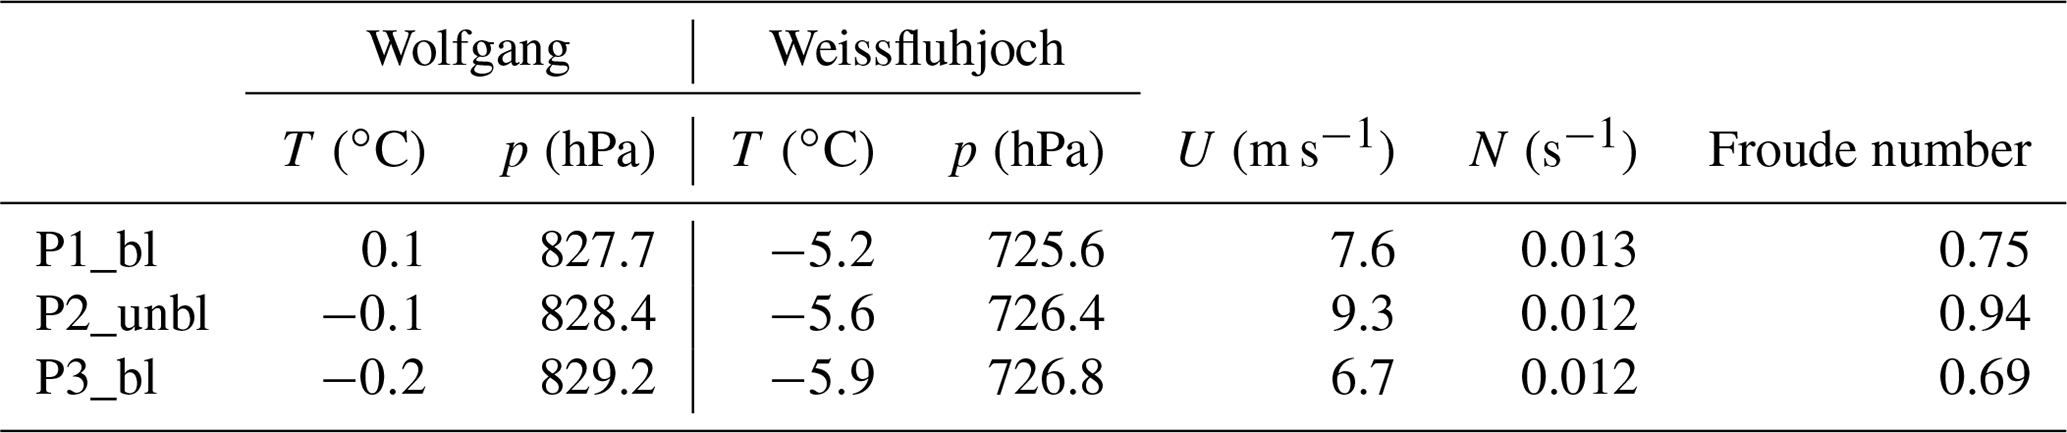
Figure 7Temporal evolution of the horizontal wind speed (blue) and wind direction (red) at Wolfgang obtained from the wind lidar measurements at an altitude of 1800 m. The mean wind speed between 2100 and 2800 m (gray) measured by the wind profiler at Wolfgang is shown as a proxy for the strength of the downward-propagating cross-barrier flow. The Froude numbers (Fr) for the different periods are indicated at the top (see Appendix A for calculations).
From a theoretical perspective, the Froude number can be used to estimate whether a flow that encounters a mountain barrier can pass over the mountain barrier or not (Smith, 1979; Durran, 1990; Rotunno and Houze, 2007; Houze, 2012). The Froude number Fr is given by the following equation:
where U is the wind speed perpendicular to the mountain barrier, h is the height of the mountain barrier, and N is the Brunt–Väisälä frequency (Colle et al., 2013). The Froude number was below 1 for all periods (see Appendix A and Fig. 7), indicating that the low-level flow was blocked. The Froude number increased from 0.75 during P1_bl to 0.94 during P2_unbl (Fig. 7), suggesting that the blocking became weaker during P2_unbl. We refer to period P2_unbl as unblocked flow as no counterflow was observed during this period at Wolfgang (Fig. 7), even though it can be seen that the flow at low levels was still slowed down, and the Froude number was slightly below 1. Period P2_unbl could also be regarded as a weaker blocking.
The wind profiler and wind lidar indicated the presence of a region of strong vertical wind shear (>10 ) at the boundary between the blocked layer in the valley and the stronger cross-barrier flow aloft (Fig. 5c and d). The region of enhanced vertical wind shear descended from 3000 to 2000 m between 16:00 and 18:00 UTC (Fig. 5c) in accordance with the weaker blocking and stronger downward propagation of the cross-barrier flow (Fig. 7). As the influence of the downward-propagating cross-barrier flow weakened, and the strength of the low-level blocking increased again at around 18:30 UTC, the shear layer ascended (Fig. 5c). Thus, the height of the shear layer might be determined by a delicate balance of upstream (e.g., blocking) and downstream (e.g., cross-barrier flow) effects as Wolfgang is located in an inner-Alpine valley and surrounded by multiple mountain barriers. Sloping shear features have also been observed in connection with synoptic-scale frontal systems (e.g., Keyser and Shapiro, 1986; Chapman and Browning, 2001), where similar vertical wind shear values have been measured (Chapman and Browning, 2001). The observations presented here cannot provide conclusive evidence about whether the observed wind and shear patterns were orographically or synoptically driven. We suggest that the sloping shear feature was influenced – at least to some extent – by the orography as the height of the shear layer was related to the altitude of the upstream mountain barrier B1 and the strength of the blocking and downward-propagating cross-barrier flow (Figs. 5c and d and 7).
Regardless of the formation mechanism, wind shear can be a source of turbulence and have important implications for cloud microphysics. Houze and Medina (2005) defined a critical threshold of 10 for the formation of shear-induced turbulent cells. The observed wind shear (10–20 ) was above this threshold value in the entire shear layer, suggesting that turbulent cells were embedded within the shear layer. In the following section, we characterize the microphysical cloud structure and investigate the influence of shear-induced turbulence on the cloud microphysics and precipitation formation.
4.2 Influence of shear-induced turbulence on the cloud microphysics
Contour-frequency-by-altitude diagrams (CFADs) are a useful tool for analyzing the magnitude and the vertical frequency distribution of cloud properties (e.g., Yuter and Houze, 1995). CFADs of the cloud radar reflectivity (a and b), spectral width (c and d) and LDR (e and f) are shown in Fig. 8 averaged over sub-periods of P1_bl (a, c and e) and P2_unbl (b, d and f). A strong increase in the radar reflectivity was observed near the cloud top (Fig. 8a and b), indicative of ice formation and growth between 4000 and 3500 m. Since the region of rapid increase in radar reflectivity was coincident with the height of the supercooled liquid layer measured by the Raman lidar (L in Fig. 8a and b), it is likely that this supercooled liquid layer played an important role for ice nucleation and initial ice growth. The cloud particles continued growing below 3500 m until they reached a subsaturated region within the blocked layer in the valley, which was identified by the layer of decreasing radar reflectivity. The sublimation layer lowered between P1_bl and P2_unbl (Fig. 9), likely as a consequence of the stronger downward-propagating cross-barrier flow and the subsequent lowering of the region of enhanced vertical wind shear. Consequently, the extent of the subsaturated layer decreased between P1_bl (800 m) and P2_unbl (400 m) (Fig. 8a and b), which enabled the hydrometeors to reach the surface prior to complete sublimation (Fig. 9). The highest radar reflectivities were observed within the upper part of the turbulent shear layer (marked with S1 and S2 in Fig. 8), suggesting that turbulence created updrafts high enough for exceeding ice saturation and thereby enhanced ice growth. The CFADs of the spectral width (Fig. 8c and d) show two local maxima embedded within the shear layer (at 2500 and at 2000 m), which can arise from enhanced turbulence and/or the presence of multiple particle populations with different fall velocities. Additionally, an increase in the LDR was observed within the shear layer (Fig. 8f), which is indicative of a change in the hydrometeor shape or density.
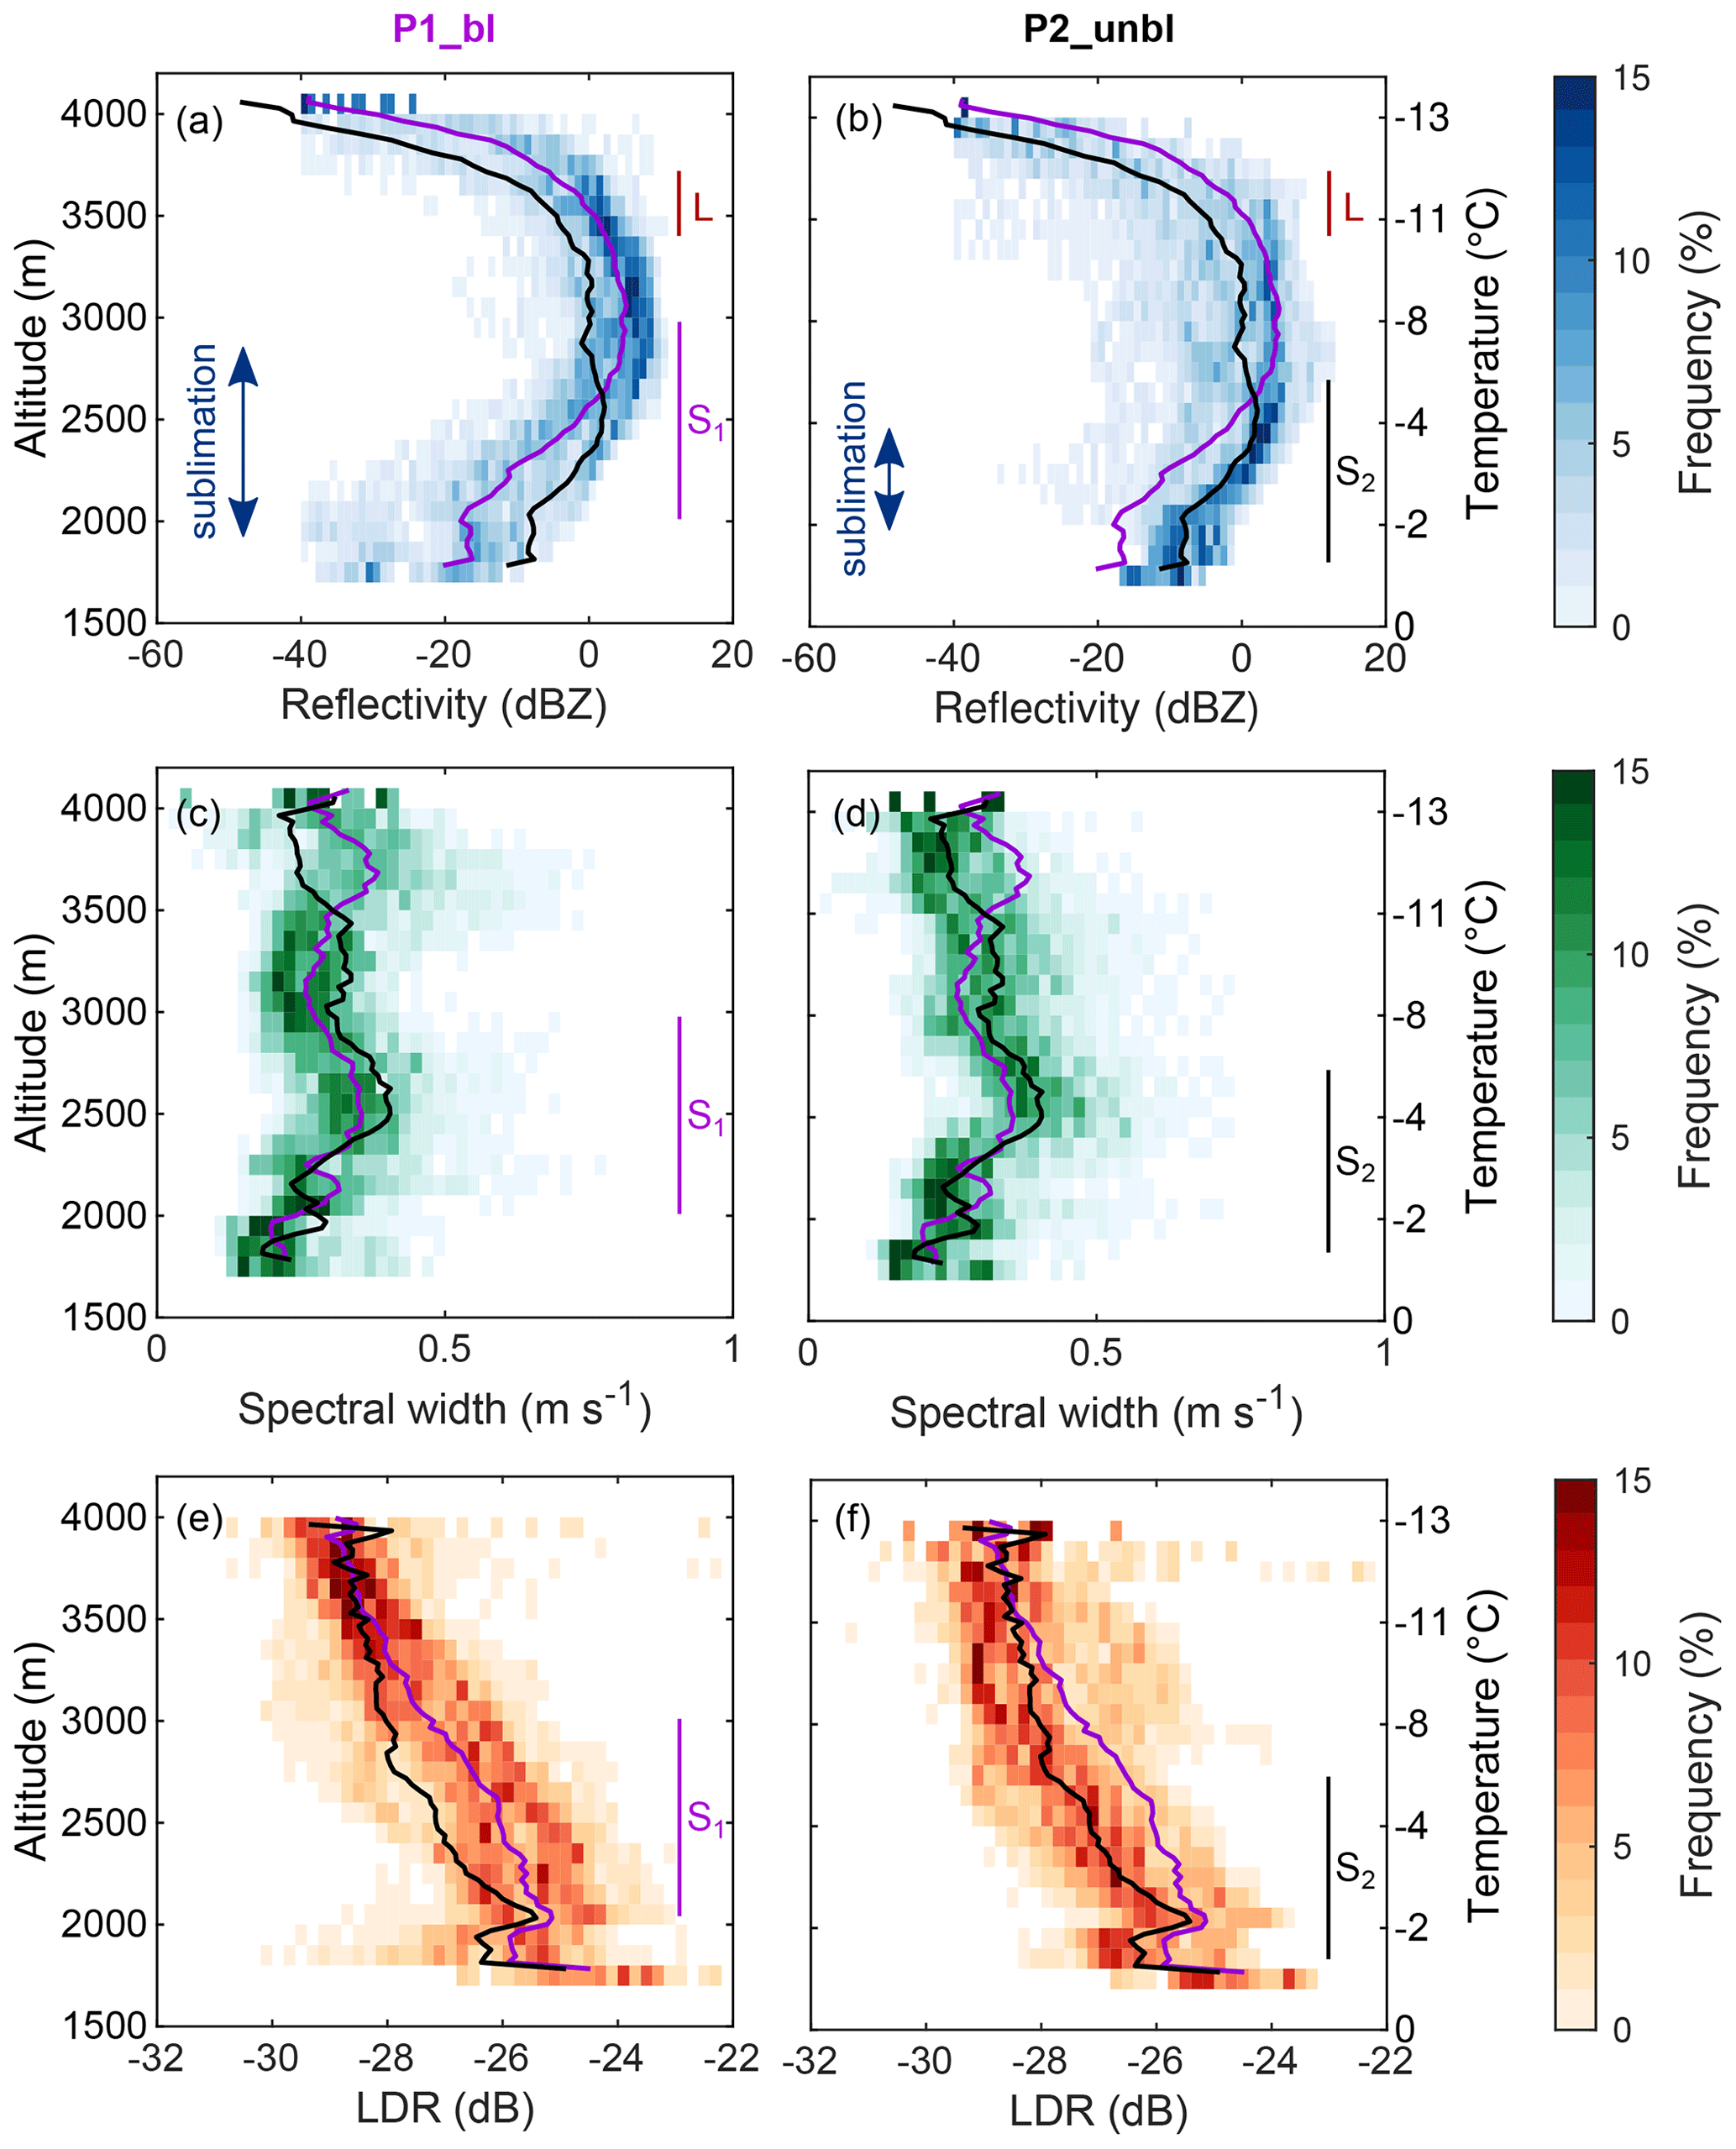
Figure 8CFADs of the radar reflectivity (a, b), spectral width (c, d) and linear depolarization ratio (e, f) averaged over sub-periods of P1_bl (left; 17:00–17:45 UTC) and P2_unbl (right; 17:45–18:30 UTC). The following bin sizes were applied: (1) radar reflectivity from −40 to 20 dBZ in 1 dBZ intervals, (2) spectral width from 0 to 0.8 m s−1 in 0.02 m s−1 intervals and (3) LDR from −32 to −22 dB in 0.2 dB intervals. A height interval of 100 m was used for all radar properties. The solid lines represent the mean vertical profile of P1_bl (purple) and P2_unbl (black). The temperature profile measured by the radiosonde is shown on the right y axis. The extent of the shear layer (S1, S2; from wind profiler), the supercooled liquid layer (L; from cloud lidar) and the sublimation layer (blue arrow; from cloud radar) is indicated.
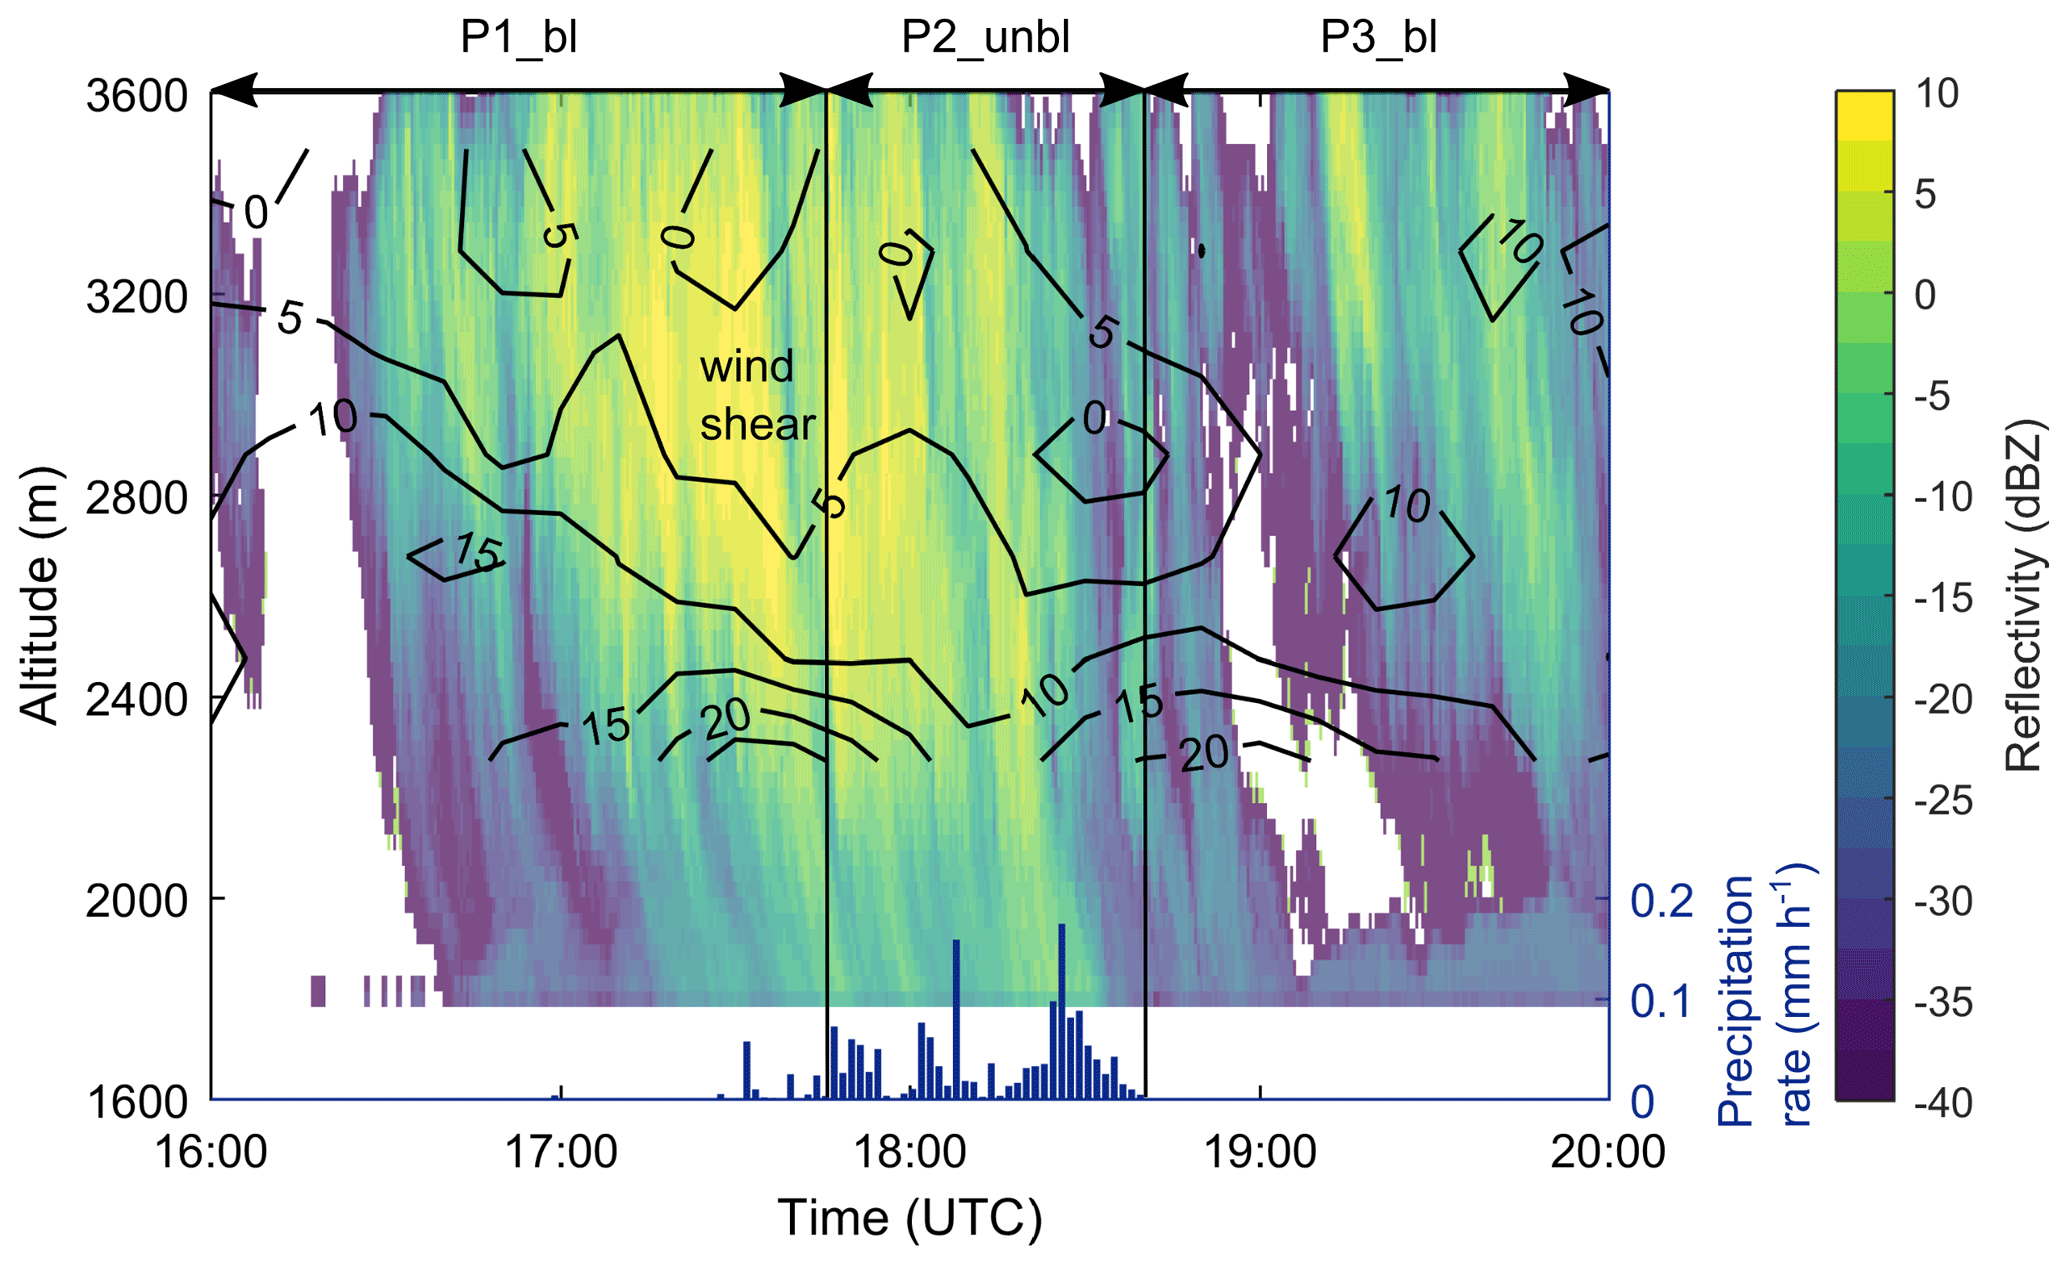
Figure 9Temporal and spatial evolution of the vertical wind shear (in ; black contour lines), the radar reflectivity (colored area) and the precipitation rate (blue bars). The wind shear was calculated from the wind profiler observations (Fig. 5), and the precipitation rate was measured with a disdrometer at Wolfgang (1630 m).
To further explore the microphysics within the region of enhanced vertical wind shear, the Doppler spectra of the radar reflectivity and LDR along the 18:00 UTC fallstreak (Fig. 10; highlighted by red line in Fig. 3d) and the surface-based hydrometeor particle observations (Fig. 11) were analyzed. A mean LDR of around −28 dB was observed near the cloud top (Fig. 10b), which is characteristic of oblate particles such as dendrites and plates (e.g., Myagkov et al., 2016; Bühl et al., 2016). This is in agreement with the ice habit expected to form at a cloud top temperature of −14 ∘C (Magono and Lee, 1966; Bailey and Hallett, 2009) and with the ice particles observed by the MASC at the surface (see D in Fig. 11a). Since a rather constant LDR was observed between 4000 and 3000 m (Fig. 10b), we assume that the ice crystals grew in size by vapor deposition without changing their habit. Below 3000 m, the LDR of the faster-falling part of the spectrum increased up to −21 dB (Fig. 10b), and the spectrum broadened (Fig. 10a). Interestingly, the increase in the LDR was collocated with the region of maximum radar reflectivity (2900 m; Fig. 10a) and of maximum (negative) Doppler velocity (2900 m; Fig. 10a) as well as the upper part of the shear layer. The spatial coincidence between maximum radar reflectivity, shear layer and increase in LDR was also observed for other fallstreaks (Fig. 3d), suggesting that the enhanced turbulence at the interface between the blocked layer in the valley and the upper cross-barrier flow led to additional updrafts that helped produce supersaturation and enhance hydrometeor growth (e.g., through riming, aggregation). The increase in the Doppler velocity might be indicative of riming. Previous studies observed that an increase in the Doppler velocity can be indicative of riming, which leads to a higher terminal fall velocity of particles due to the rapid gain of ice particle mass (e.g., Mosimann, 1995; Kneifel and Moisseev, 2020). This is further supported by the increase in the LDR of the faster-falling population of the spectrum as a consequence of the higher particle density. In addition, turbulence within the shear layer could increase the number of collisions between ice particles and promote the formation of aggregated particles (e.g., Pinsky and Khain, 1998). Indeed, the hydrometeors observed by the MASC and HOLIMO show indications of rimed particles and large aggregates (Fig. 11), suggesting that both processes were occurring.
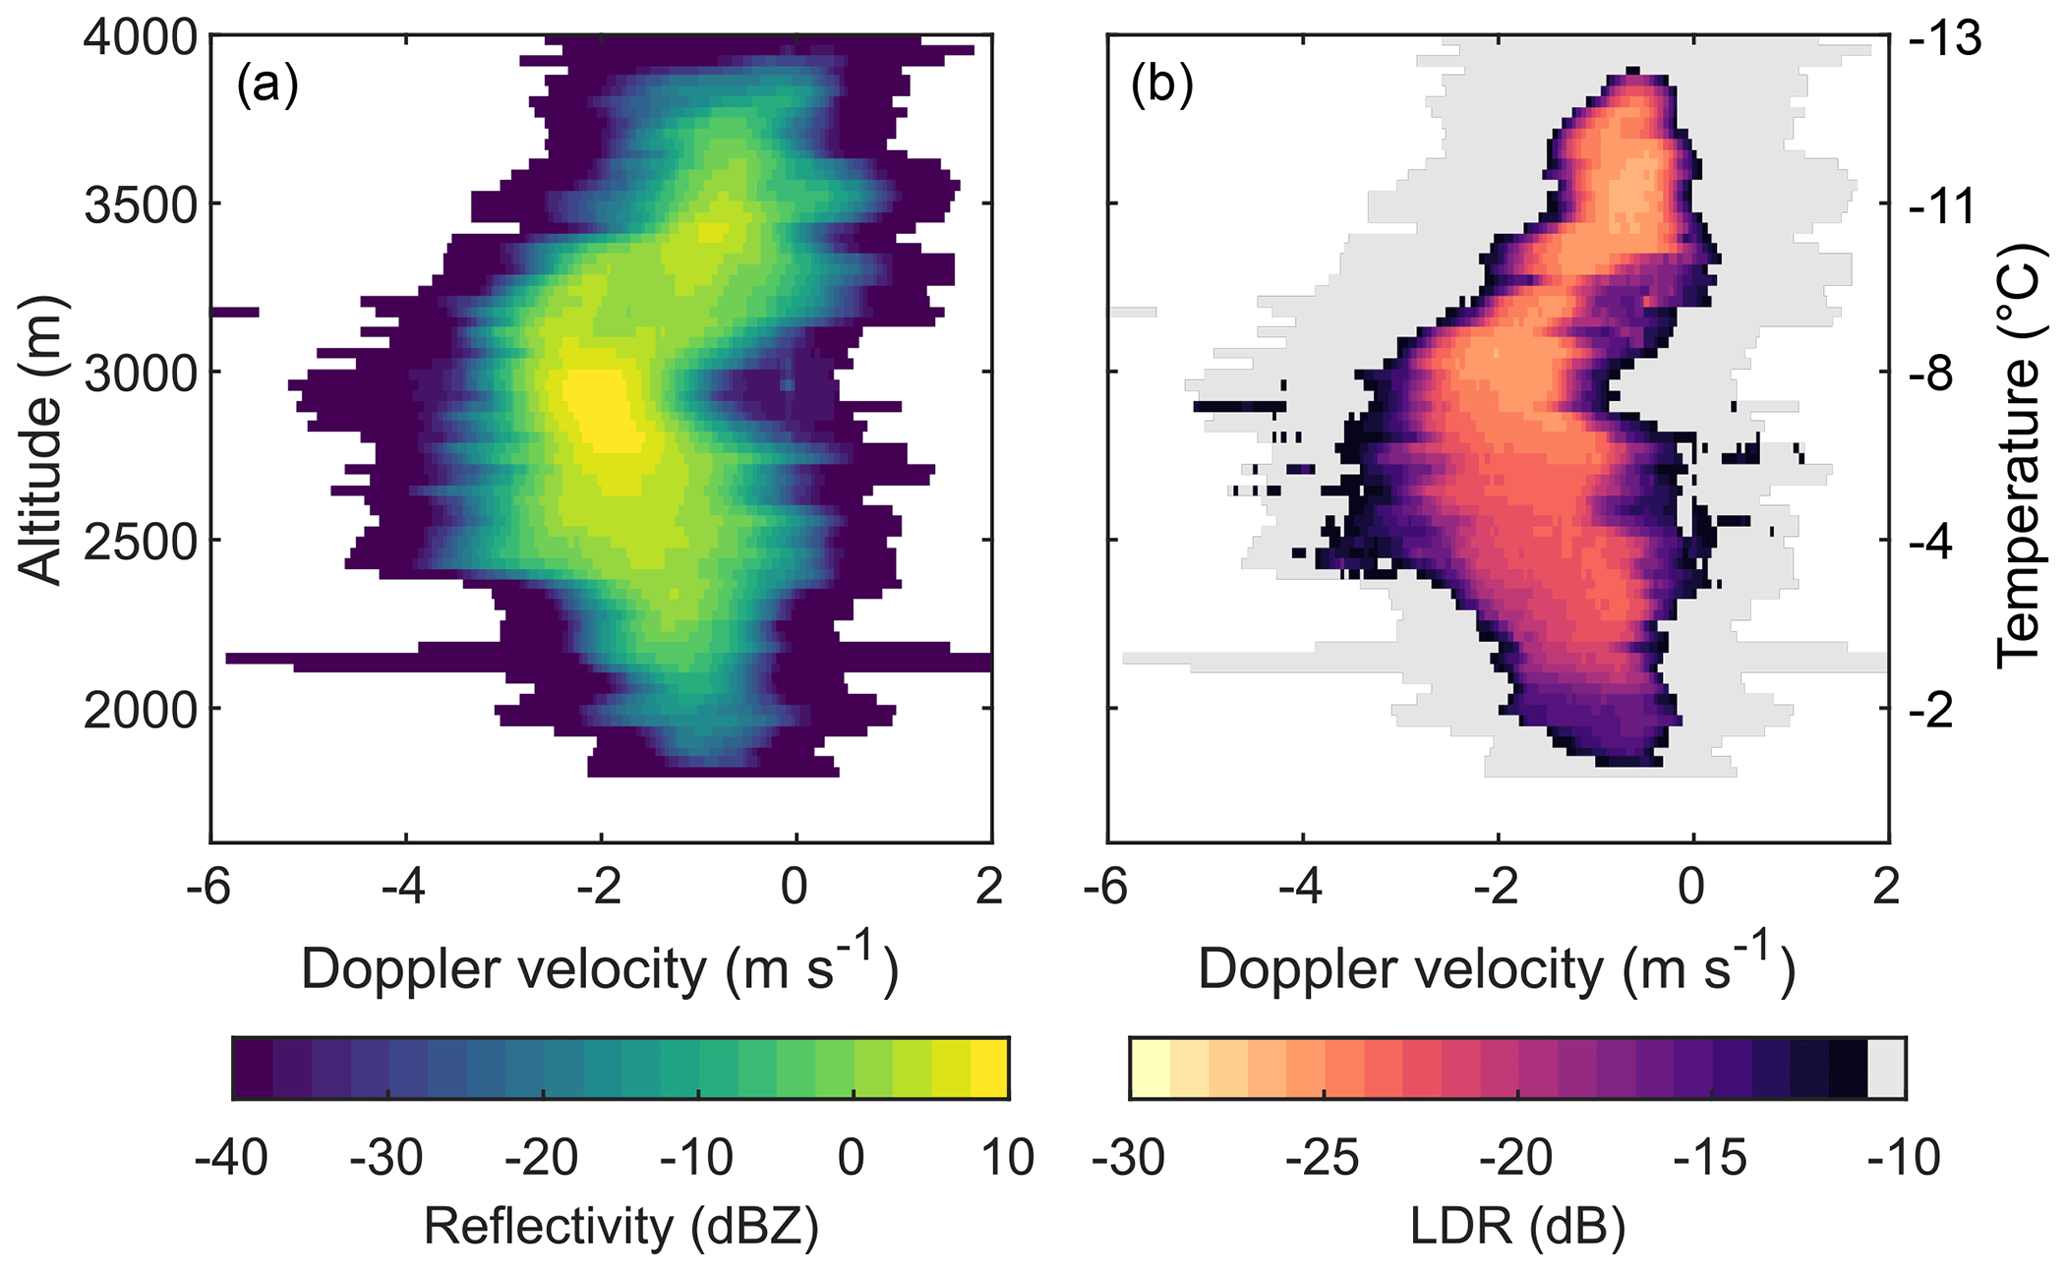
Figure 10Vertical profile of the radar reflectivity (a) and LDR (b) Doppler spectra along the LDR fallstreak at 18:00 UTC averaged over 1 min (see red line in Fig. 3d). LDR values larger than −10 dB are shown in gray. The temperature profile measured by the radiosonde is shown on the right y axis.
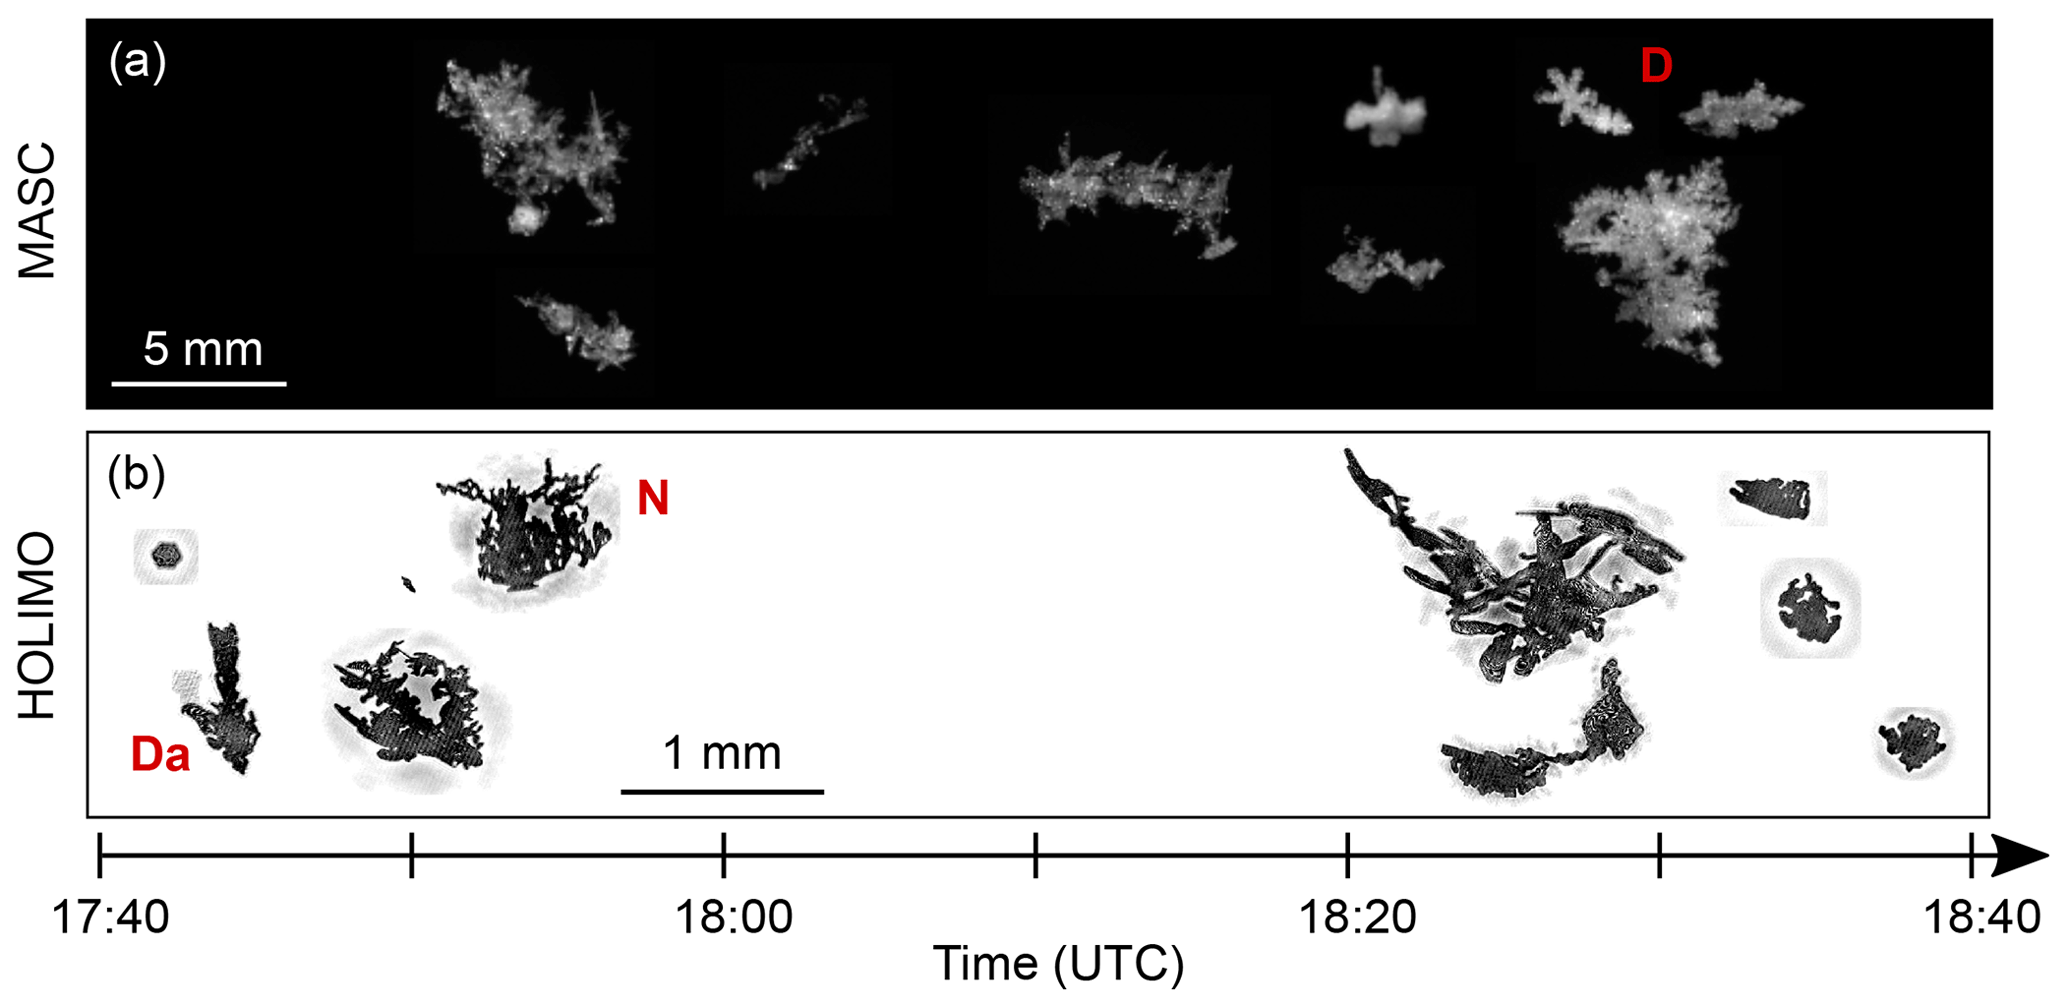
Figure 11Photographs of ice crystals and snow particles taken with the MASC (a) and HOLIMO (b). No observations of HOLIMO were available between 17:50 and 18:20 UTC. Please note the different size scale of the particles observed by the MASC and HOLIMO. Examples of crystal types observed by the MASC and HOLIMO are highlighted in red: dendrites (D), dendritic arm (Da), ice particles with needle-like structures (N). The hydrometeors measured by the disdrometer at Wolfgang were primarily in the size range between 0.5 and 1.5 mm (not shown).
The temperature between 3000 and 2500 m ranged from −8 to −4 ∘C and was thus in the temperature regime of columnar growth and of the Hallett–Mossop process. Thus, secondary ice particles might be produced upon riming, which could then rapidly grow by vapor deposition into column-like particles. These particles would be characterized by higher LDR values. Furthermore, the ice particles observed by the HoloBalloon platform show indications of needle-like structures (e.g., N in Fig. 11b), which might have grown on the existing ice particles while they fell through that cloud layer. If fragile ice crystals such as dendrites or needle-like structures collide with large ice particles within the turbulent shear layer, small ice fragments might break off and lead to the production of secondary ice particles upon collision (e.g., Vardiman, 1978; Yano et al., 2016). For example, the ice particle measured by HOLIMO at 17:45 UTC could be a dendritic arm that broke off upon collision (see Da in Fig. 11). The analysis of the Doppler spectra showed no evidence of discrete multiple spectral peaks (i.e., the presence of multiple particle populations with different fall speed), which would support the occurrence of secondary ice production. However, turbulent regions or sublimation could broaden the size distributions and thus mask the presence of discrete multiple peaks in the Doppler spectra.
For a more sophisticated analysis, a larger number of particles would be necessary, but due to the moderate precipitation rate at Wolfgang and Laret, only a limited number of ice and snow particles were observed. However, in general, the in situ and surface observations of ice particles support the radar-based assumptions above in that (1) dendrites formed near the cloud top, and (2) riming, aggregation and needle growth occurred within the turbulent shear layer. It remains unclear whether the Hallett–Mossop process and mechanical break-up in ice–ice collisions contributed to the formation of secondary ice particles (see also Sect. 5).
4.3 Flow blocking as a driver for the formation of low-level feeder clouds
In the last part of this study, we focus on the lower part of the boundary layer and investigate the role of low-level blocking for the formation of a low-level feeder cloud. The low-level cloud structure was observed with the measurement platform HoloBalloon. Vertical profiles of the in situ cloud properties are shown in Fig. 12. The liquid water content (LWC) showed a rather inhomogeneous cloud structure during P1_bl. Cloud swaths with a cloud droplet number concentration (CDNC) of up to 100 cm−3 alternated with “cloud-free” regions with low CDNC. No vertical profiles were performed between 17:50 and 18:20 UTC because the low-level cloud dissipated during this time period. This is also visible from the cloud lidar signal, which was not attenuated during P2_unbl in the lower part of the boundary layer (see Fig. 4a and b). A second low-level cloud formed during P3_bl. This cloud had a more homogeneous structure, with an LWC in the range between 0.1 and 0.2 g m−3. A low-level cloud was also observed by the cloud base observations of the ceilometer located in Klosters (not shown).
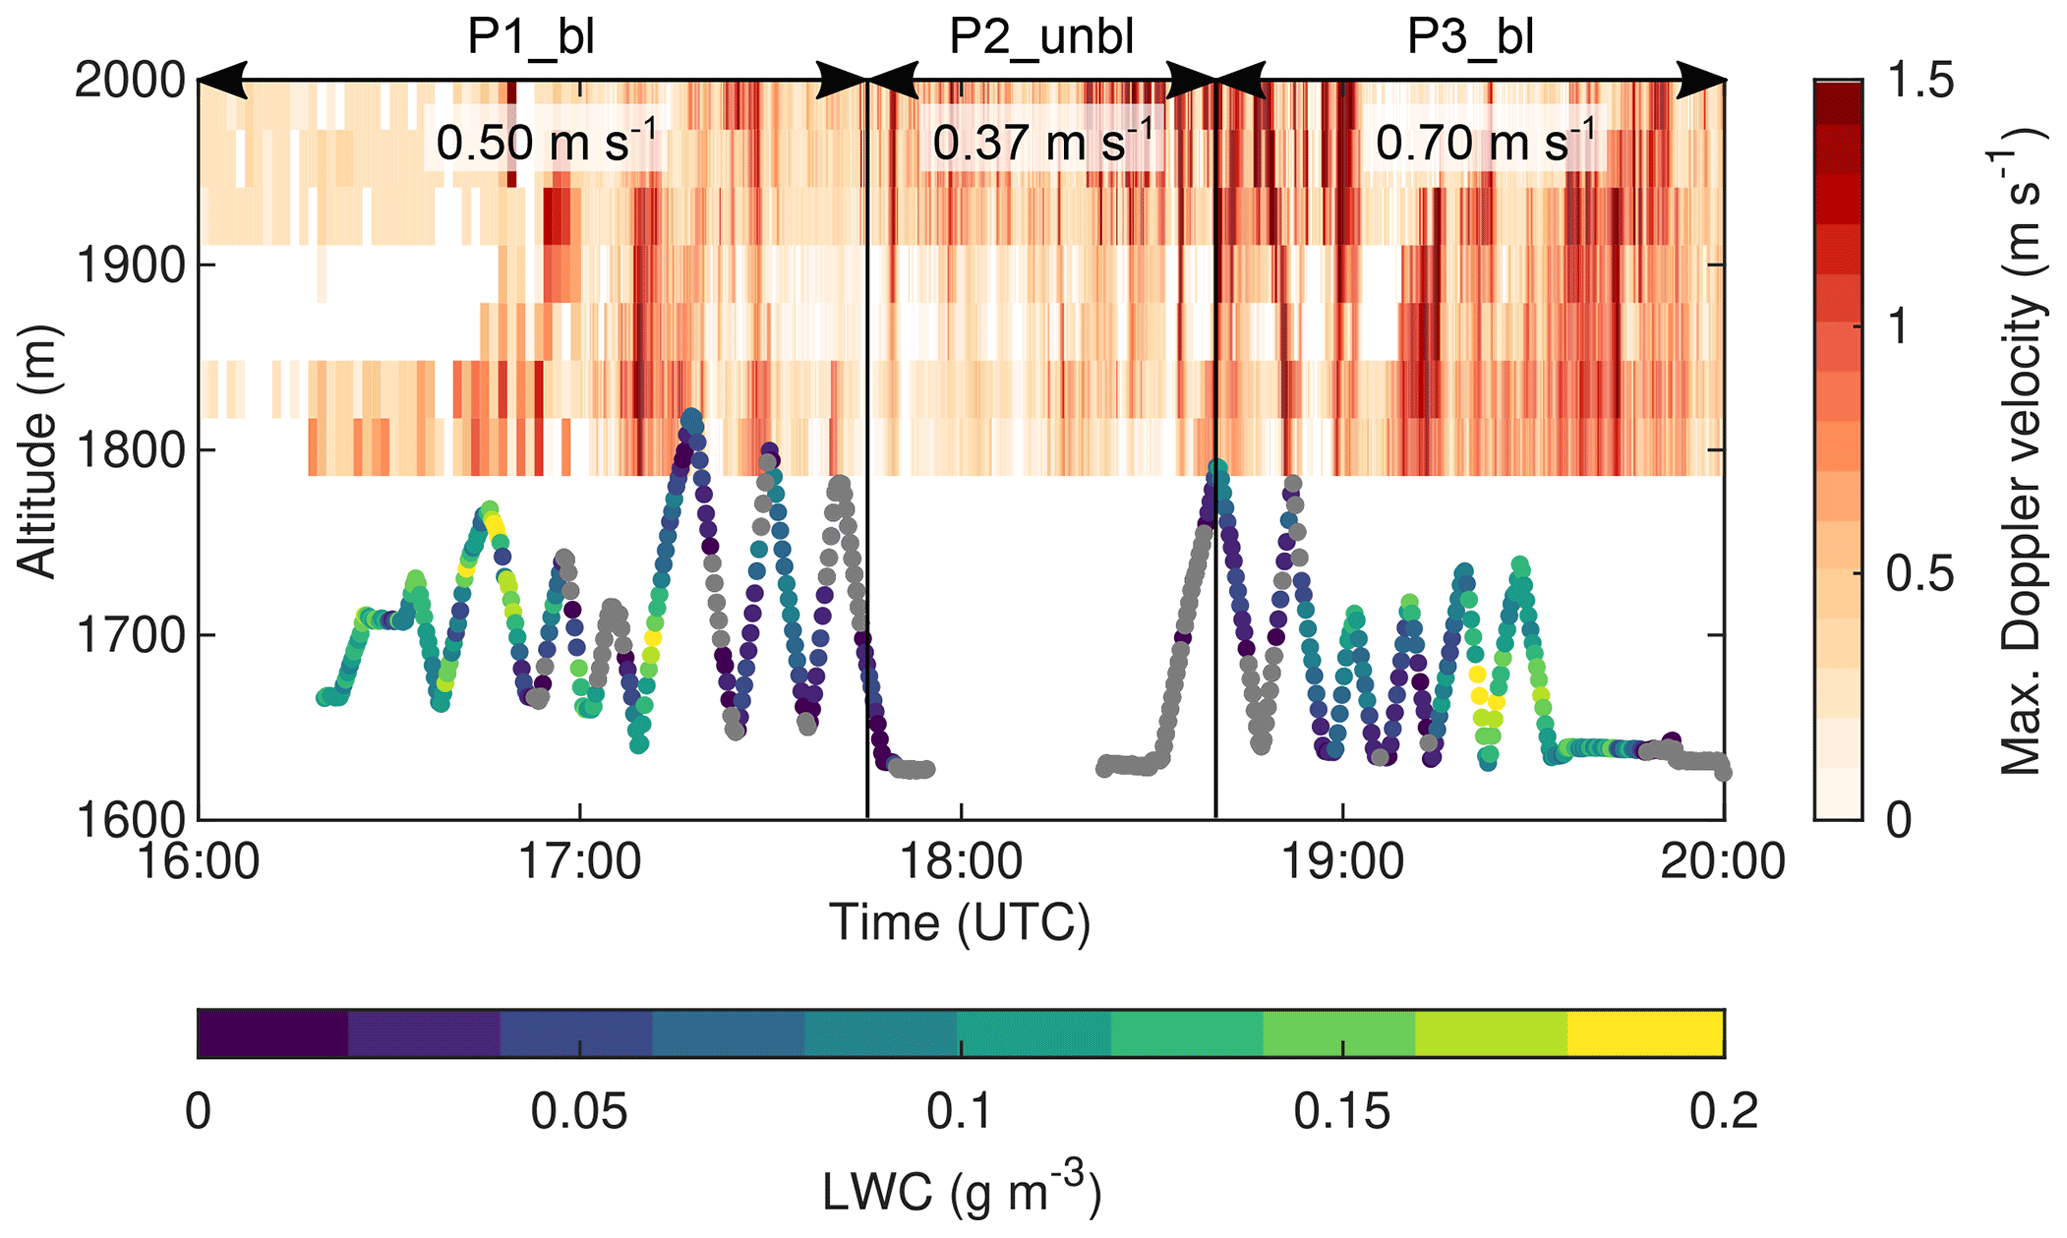
Figure 12Vertical profiles of the liquid water content measured with the HoloBalloon platform. Data points with a liquid water content below 0.01 g m−3 are indicated by gray dots. No measurements were obtained between 17:50 and 18:20 UTC. The maximum Doppler velocity, which was derived from the Doppler spectra and was used as a proxy for the updraft velocity, is shown by the colored area. The values at the top indicate the mean maximum Doppler velocity for the periods P1_bl, P2_unbl and P3_bl averaged over the height interval between the surface and 1850 m.
The interesting observation was that the low-level cloud dissipated during P2_unbl, when the low-level flow turned from a blocked to an unblocked state, pointing to the importance of the blocking situation in forming and sustaining the low-level liquid cloud. We suggest that an overturning cell formed as a consequence of the low-level flow impinging on the mountain barrier B2 located downstream of Wolfgang (as shown in Fig. 14a), which generated an in-valley circulation with a low-level counterflow from Klosters towards Davos. Several weather stations in the Davos region confirm that a counterflow was present during P1_bl and P3_bl (Fig. 6). Since Wolfgang is located on a small-scale topographic feature (400 m), the low-level flow was forced to rise from Klosters (1200 m) to Wolfgang (1630 m) over the local topography and thereby acted as an updraft source, which led to the formation of a low-level feeder cloud. Indeed, the cloud radar indicated the presence of higher Doppler velocities and thus higher updraft velocities during P1_bl (0.5 m s−1) and P3_bl (0.7 m s−1) (Fig. 12). When the blocking weakened, and the updraft velocity decreased during P2_unbl (0.37 m s−1), the low-level cloud at Wolfgang dissipated likely due to insufficient upward motion to sustain the production of liquid water. The correlation plots between different dynamical (mean and maximum Doppler velocity) and microphysical properties (LWC, CDNC, mean diameter) in Fig. 13 further support the assumption that the updrafts driven by the in-valley circulation induced the formation of the low-level liquid cloud. Moderate positive Spearman's rank correlation coefficients were observed between the maximum Doppler velocity (vmax) and the LWC (0.42) and CDNC (0.46), whereas a weak correlation was found between the maximum Doppler velocity and the mean diameter D (0.17). Similar correlation coefficients were observed between the mean Doppler velocity and the microphysical properties (not shown). The increase in CDNC with increasing updraft velocity (Fig. 13c) suggests that droplet formation was limited by the vertical velocity that generates supersaturation; i.e., velocity-limited conditions were encountered at Wolfgang. This aspect is dealt with in more detail in a paper by Georgakaki et al. (2020), where they investigated the drivers of droplet formation in mixed-phase clouds using observations from the RACLETS campaign.
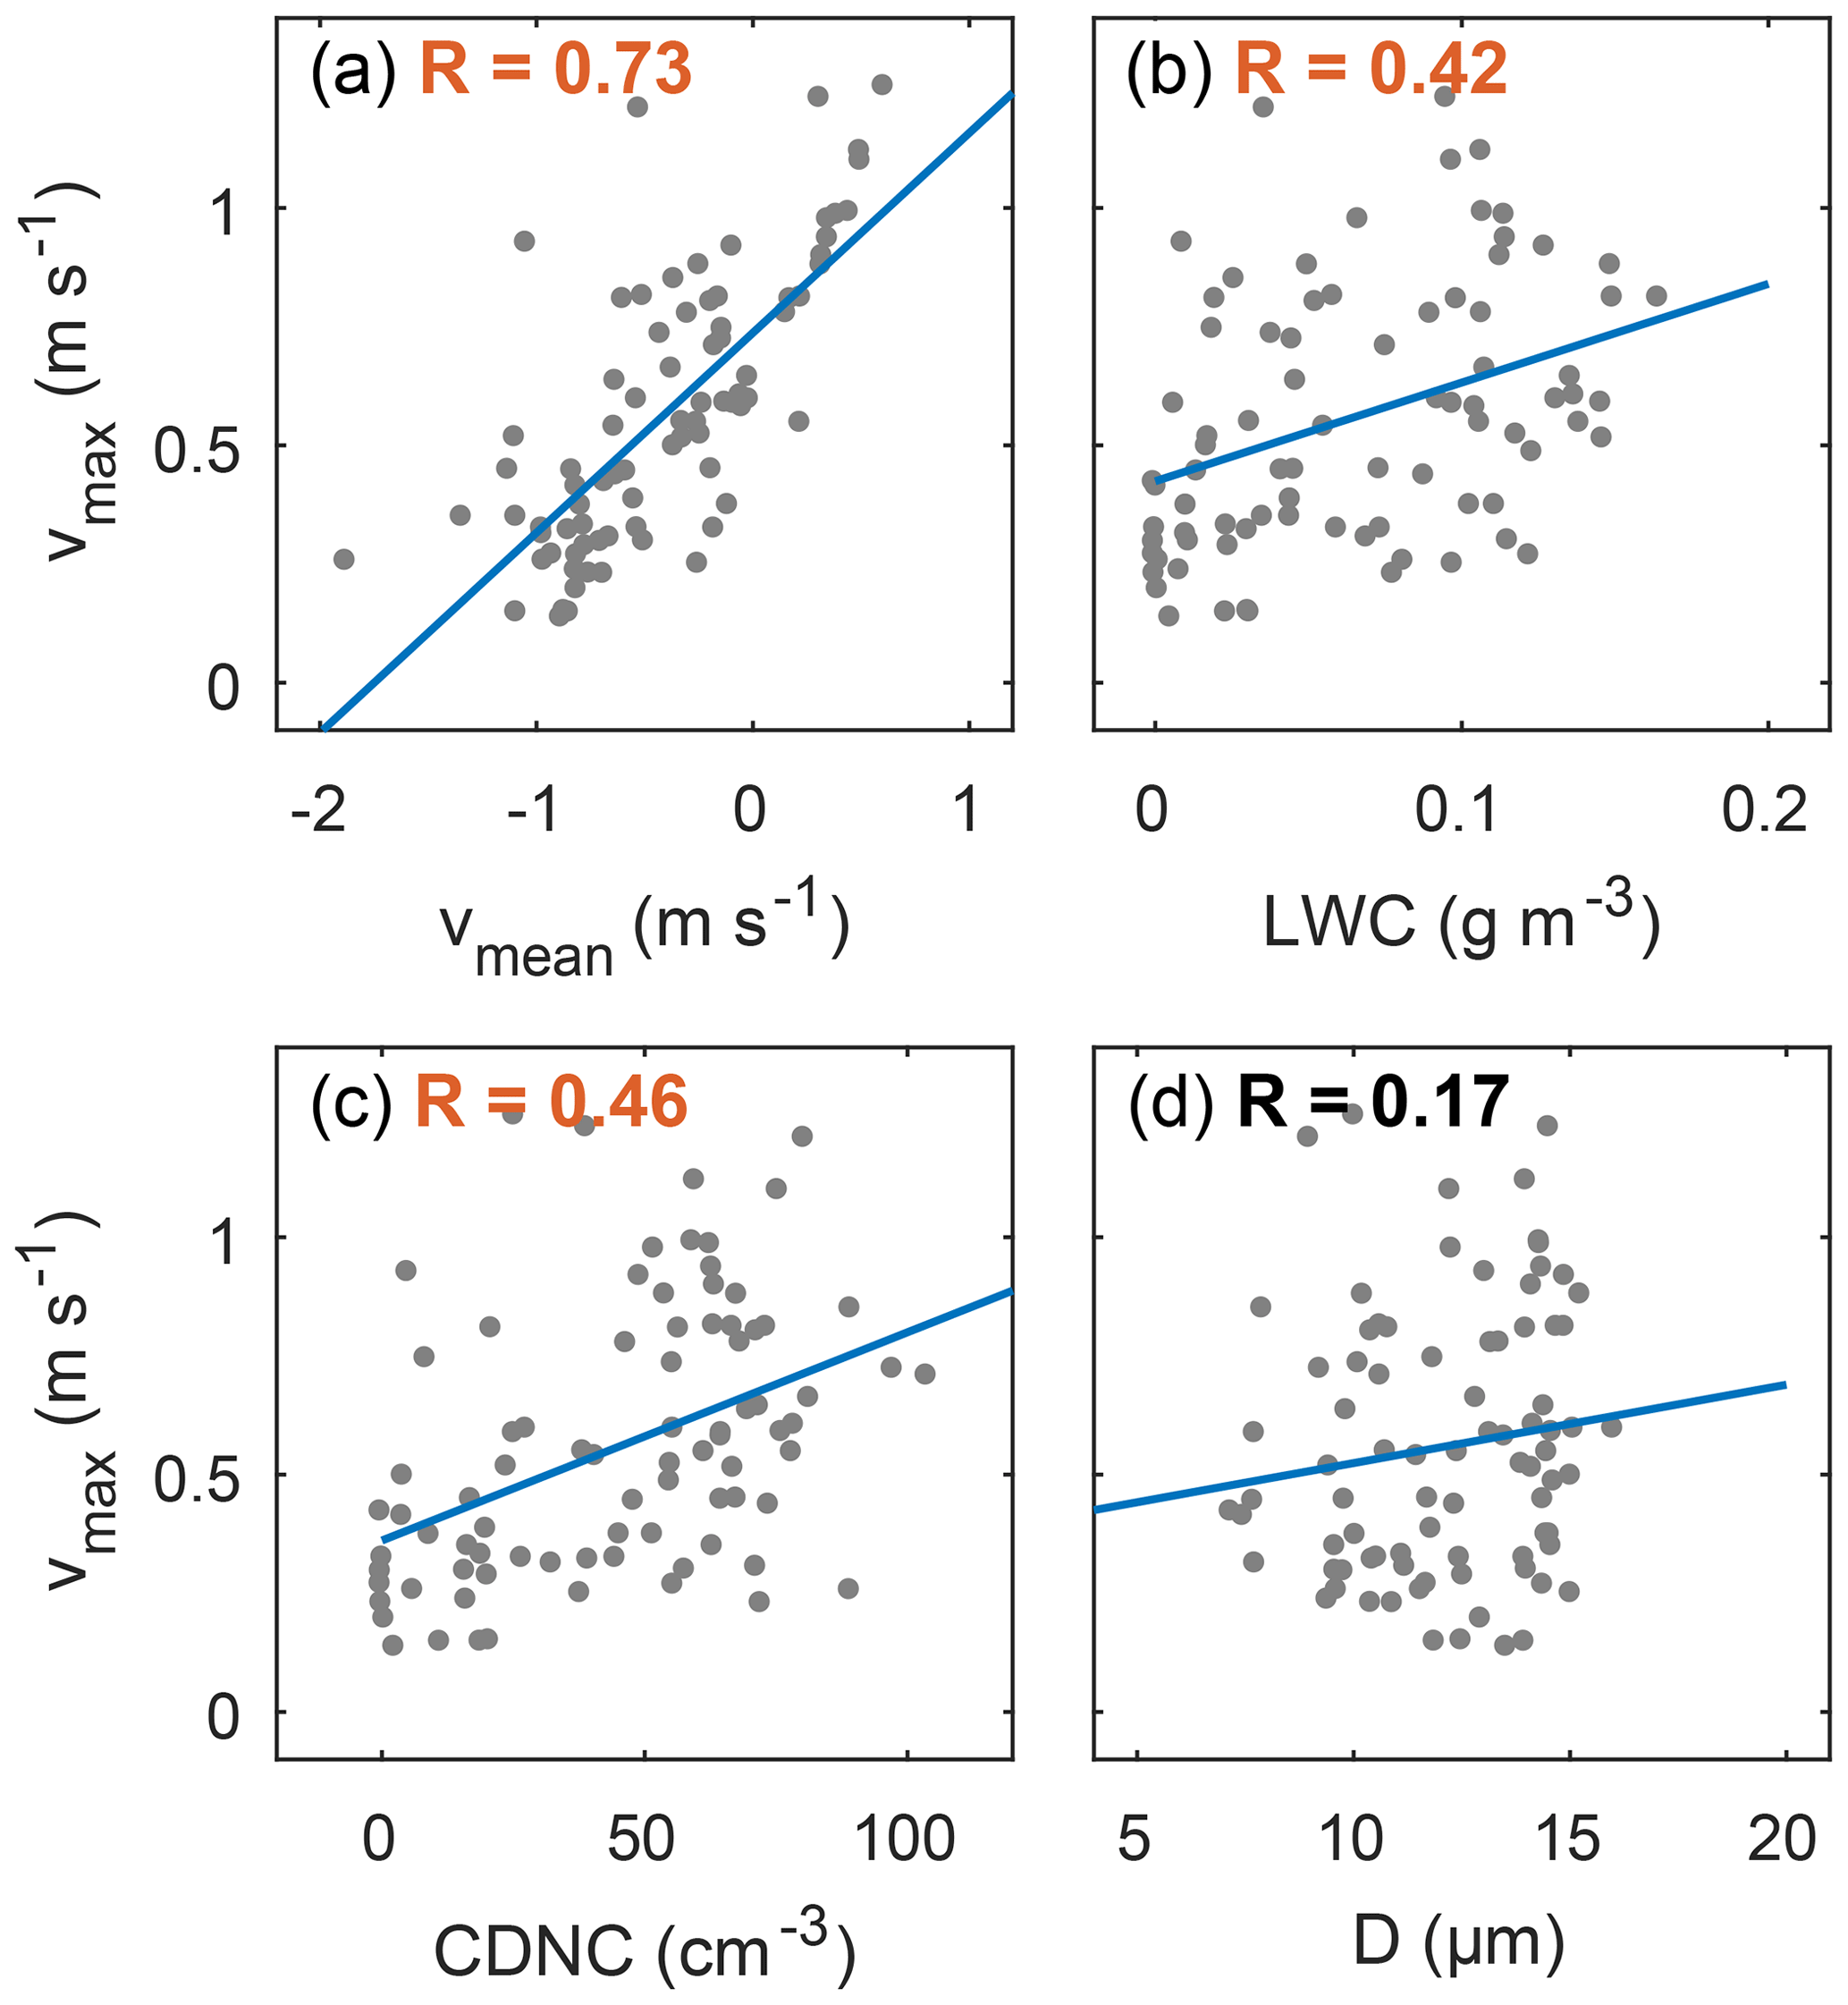
Figure 13Correlations among dynamical (vmean, vmax) and microphysical parameters (LWC, CDNC, D) of the low-level cloud properties. The dynamical properties that were observed with the cloud radar were averaged between the surface and 1850 m. The gray dots represent the 2 min averages for the time periods between 16:20–17:55 and 18:30–19:45 UTC. The blue lines indicate the least-square-regression line. The Spearman's rank correlation coefficients are shown in the top left corner, where correlation coefficients highlighted in orange indicate correlations significantly different from zero (5 % significance level).
The results presented above point to the importance of localized flow effects that interact with the topography in producing low-level feeder clouds over small-scale topographic features. Feeder clouds can enhance orographic precipitation through the seeder–feeder mechanism (Bergeron, 1965; Bader and Roach, 1977; Hill et al., 1981) by providing an environment where hydrometeors that formed aloft (i.e., in the seeder region) can “feed” on the low-level liquid layer and enhance precipitation by riming and depositional growth. We assume that in the case study presented here, the low-level feeder cloud did not play a crucial role for precipitation enhancement as a significant fraction of the hydrometeor mass sublimated before reaching the feeder cloud. However, in other cases of the RACLETS campaign, we found that orographically induced low-level feeder clouds could enhance precipitation through the seeder–feeder mechanism and provide an environment for secondary ice production mechanisms (Ramelli et al., 2020b). We propose that local flow effects such as low-level blocking can also induce the formation of feeder clouds in other mountain valleys and in hilly regions and suggest that the extent of this effect depends on the strength of the blocking, the thermodynamics of the atmosphere and the altitude of the small-scale topographic feature that is located upstream of the mountain barrier.
The microphysical evolution of the mixed-phase cloud and the low-level feeder cloud in the inner-Alpine valley was determined by a complex interplay between orography, dynamics and microphysics. A conceptual overview of the observed clouds is shown in Fig. 14 (a: blocked state; b: unblocked state). Primary ice nucleation was suggested to occur close to the cloud top in the embedded supercooled liquid cloud layer. Based on the cloud top temperature and cloud radar and hydrometeor observations, dendrites and hexagonal plates were assumed to form, which could rapidly grow by vapor deposition. The ice particles encountered a turbulent shear layer while falling through the cloud, within which changes in the microphysical cloud properties were observed including enhanced radar reflectivity (i.e., increased ice growth) and LDR (i.e., change in particle shape or density). This suggests that enhanced turbulence within the region of strong vertical wind shear created an ice supersaturated environment and thereby influenced the cloud microphysics.
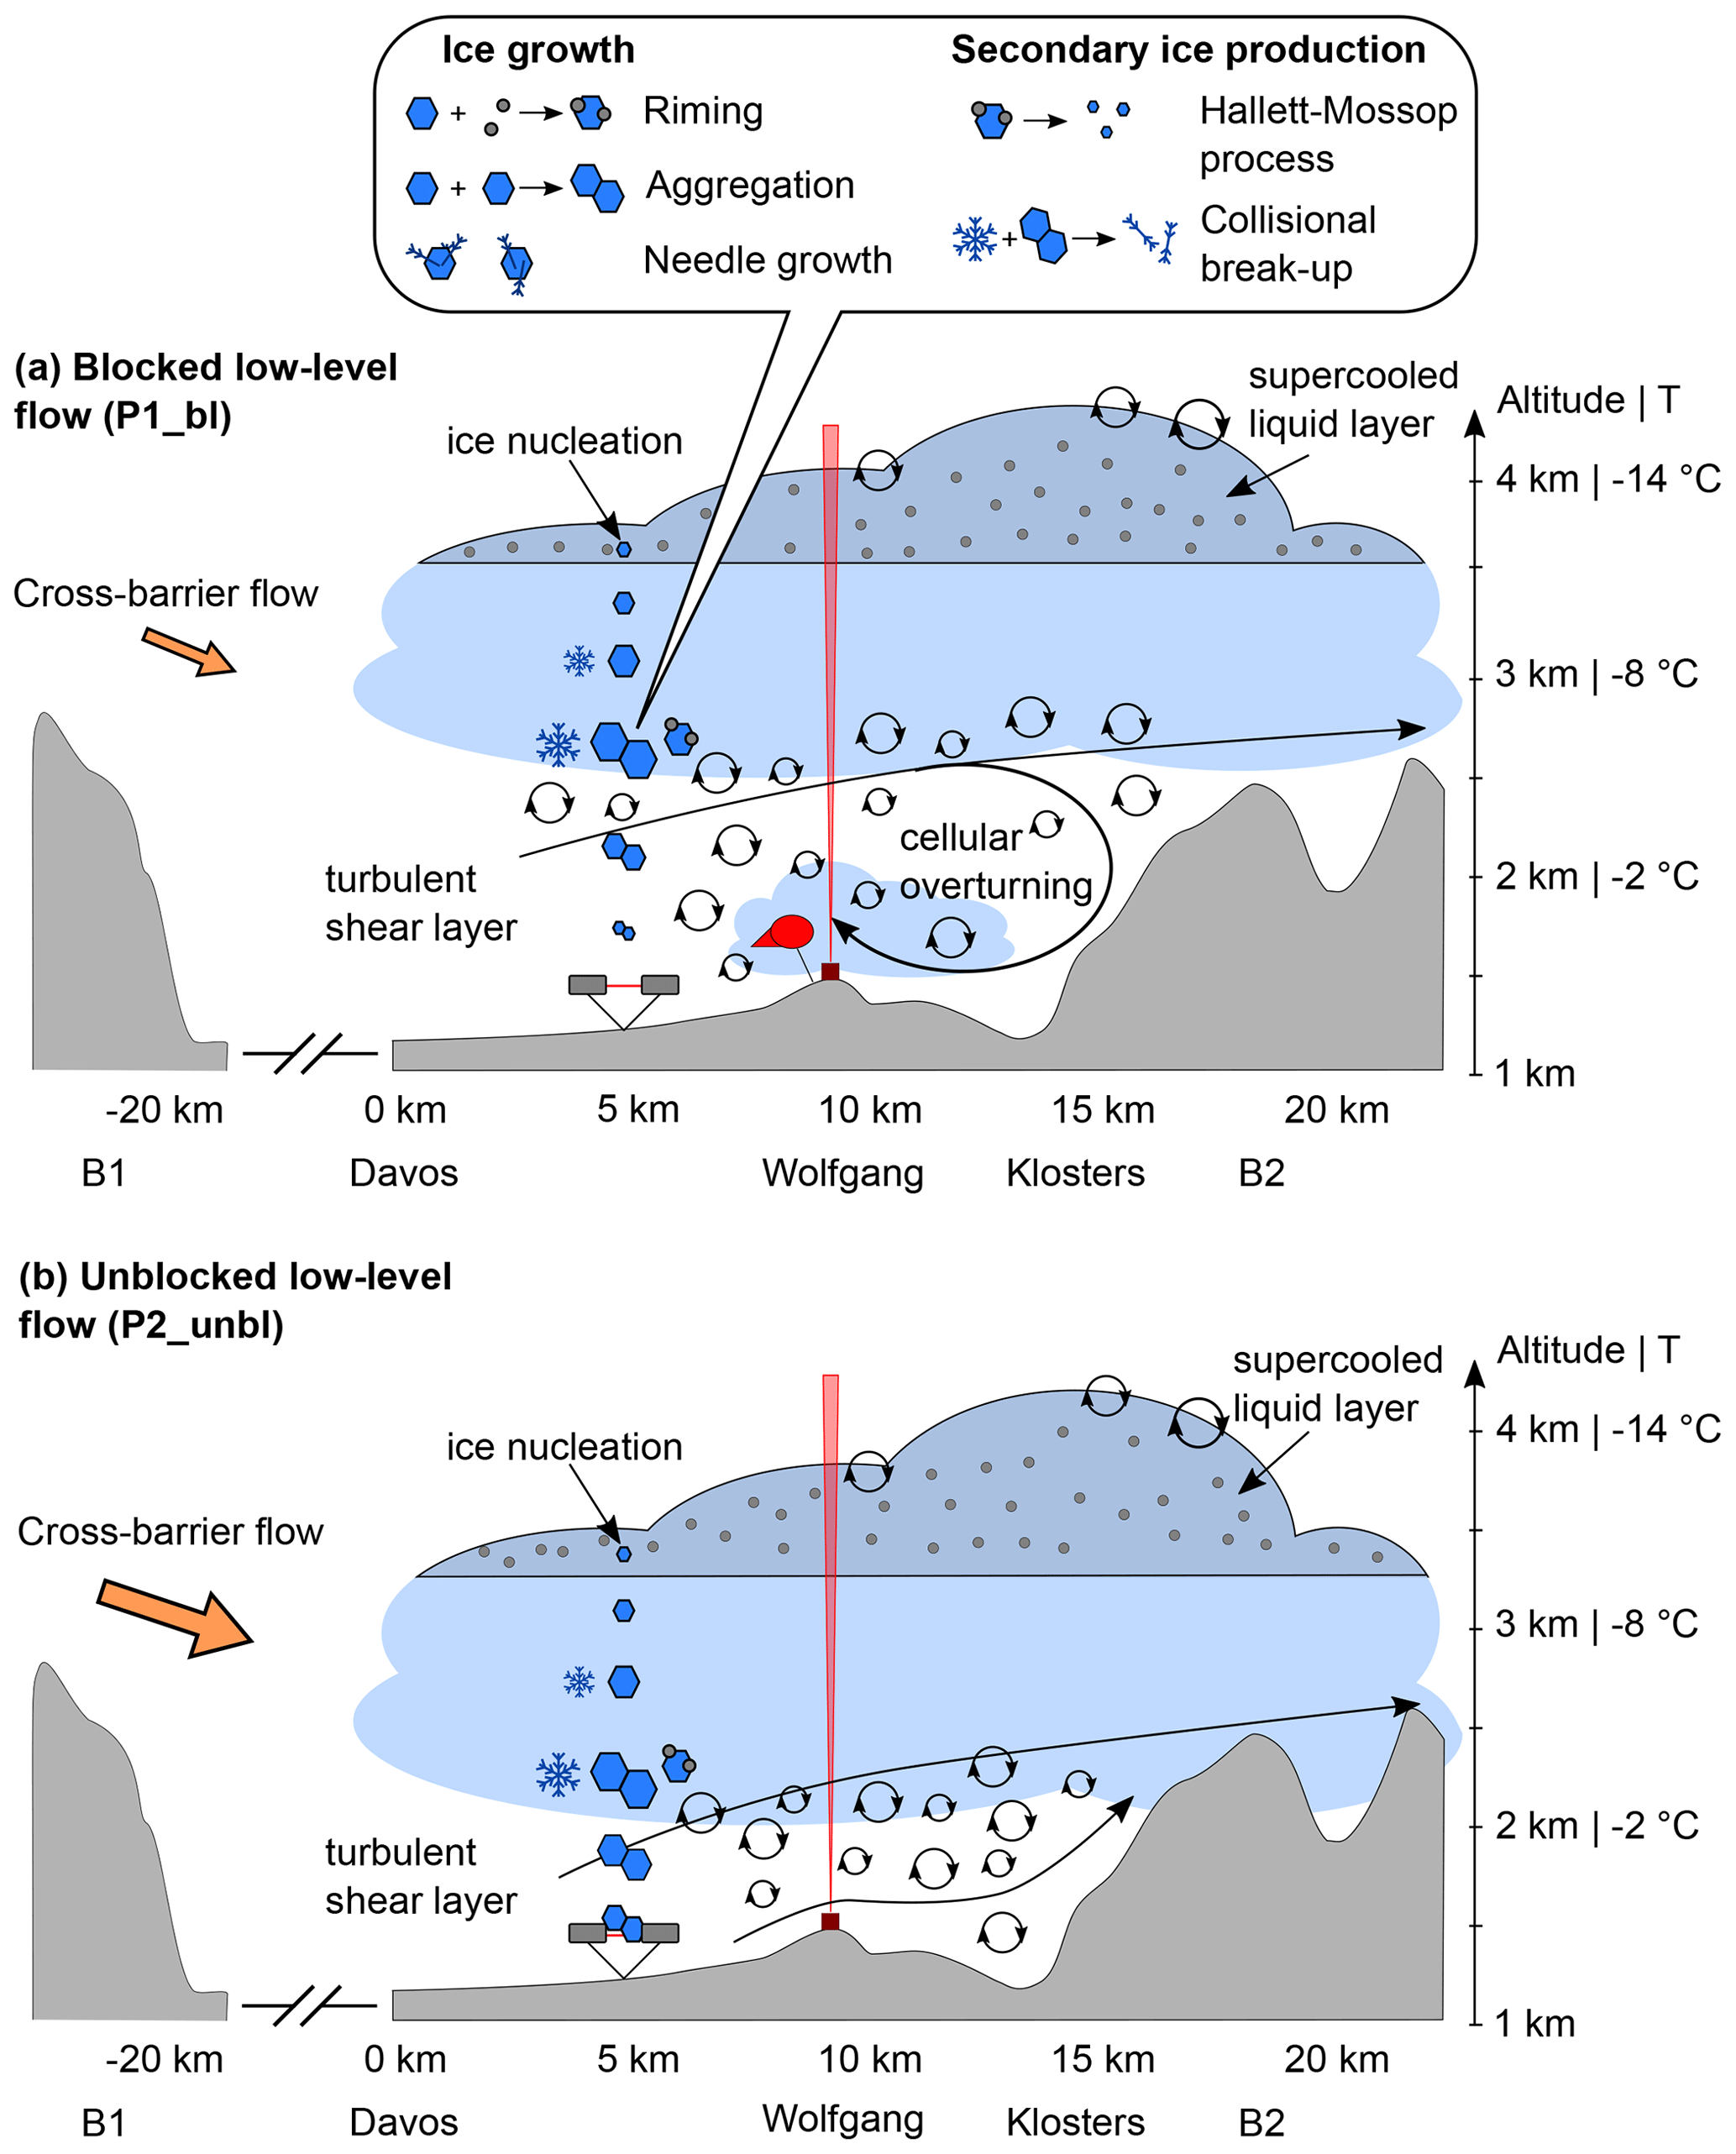
Figure 14Conceptual overview of the dynamical and microphysical processes observed within the mid-level cloud and low-level feeder cloud during low-level blocked flow (a) and unblocked flow (b) (see text for more details).
Previous studies identified flow blocking and shear-induced turbulence as a microphysical pathway for enhancing snow growth and precipitation (e.g., Marwitz, 1983; Overland and Bond, 1995; Yu and Smull, 2000; Hogan et al., 2002; Neiman et al., 2002, 2004; Houze and Medina, 2005; Loescher et al., 2006; Olson et al., 2007; Olson and Colle, 2009; Geerts et al., 2011; Medina and Houze, 2015; Grazioli et al., 2015; Aikins et al., 2016). Different microphysical processes have been proposed to occur in turbulent layers, such as enhanced growth by riming due to pockets of higher liquid water content (e.g., Houze and Medina, 2005; Medina and Houze, 2015 Grazioli et al., 2015) or enhanced growth by aggregation due to increased collisions between hydrometeors (e.g., Geerts et al., 2011; Aikins et al., 2016). Based on the cloud radar observations and the ground-based snow particle measurements, we suggest that riming and aggregation were the dominant ice growth mechanisms in the present case study. The increase in the LDR at the upper edge of the shear layer was assumed to be related to riming as the LDR of the faster-falling part of the spectrum was increased, likely due to the higher particle density (Fig. 10b). Depending on the rime mass fraction, riming can have a significant impact on the ice particle properties (Li et al., 2018; Moisseev et al., 2017).
In addition, secondary ice production processes might have been active within the shear layer. The prevailing temperature (from −8 to −5 ∘C) was in the range of the Hallett–Mossop process. Furthermore, the ice particles observed near the surface suggest that needle growth occurred on the existing ice particles within the turbulent shear layer (Fig. 11). Previous laboratory studies have observed needle growth at temperatures of −5 ∘C slightly below liquid water saturation (Knight, 2012). If fragile ice crystals with needle-like structures collide with large rimed particles, small ice fragments might break off and lead to the production of secondary ice particles (e.g., Vardiman, 1978; Yano et al., 2016). Previous studies have observed a large number of small ice particles within turbulent shear layers, which were likely generated through secondary ice production mechanisms (e.g., Hogan et al., 2002; Grazioli et al., 2015). For example, Hogan et al. (2002) observed high concentrations of small ice particles (100–1000 L−1) in and above a region of embedded convection, which were likely produced through the Hallett–Mossop mechanism during riming. Since the fall velocity of small ice particles is low, these secondary ice particles were found to recirculate in the updrafts and to feed the regions above the shear layer with ice crystals (Hogan et al., 2002; Grazioli et al., 2015), where they could continue growing to precipitation-sized particles and act as a seed to trigger secondary ice production. Additionally, a few laboratory-based studies suggested that ice fragmentation upon sublimation can lead to the production of secondary ice particles (e.g., Oraltay and Hallett, 1989; Dong et al., 1994; Bacon et al., 1998). However, secondary ice particles that formed within a subsaturated environment need to be transported to an ice supersaturated environment to influence the cloud microphysics (Korolev et al., 2020). In order to further investigate the role of secondary ice production in the turbulent shear layer, in situ observations of the cloud properties would be useful. Unfortunately, the tethered-balloon system was limited to lower altitudes and could not sample the cloud properties within the upper part of the shear layer.
While previous research that investigated orographic precipitation has mainly focused on isolated mountain barriers, here we studied the role of low-level blocking and shear-induced turbulence on the cloud microphysics in a more complex terrain with narrow valleys and a series of mountain barriers. The interface between the blocked layer in the valley and the stronger cross-barrier flow aloft was characterized by a region of enhanced turbulence and vertical wind shear. We found that the region of strong vertical wind shear, the extent of the subsaturated layer within the blocked layer in the valley and as a consequence the amount of precipitation reaching the valley were determined by the strength of the downward-propagating cross-barrier flow on the upstream mountain barrier B1 and the strength of the low-level blocking on the windward slope of the downstream mountain barrier B2 (Sect. 4.2). Furthermore, we found that local flow effects in mountain valleys (i.e., in-valley circulation due to blocked low-level flow) can induce the formation of low-level feeder clouds by producing local updrafts and thus enhance orographic precipitation through the seeder–feeder mechanism (Sect. 4.3). This case study demonstrates that it is challenging to study “simple” conceptual mechanisms in complex terrain due to numerous interactions between dynamics, microphysics and orography on different scales, and the superposition of upstream and downstream effects. Nevertheless, it is important to perform field campaigns in complex terrain in order to improve our understanding of these processes and of orographic precipitation. Field campaigns in complex terrain should be designed in such a way that an extensive set of complementary instruments are deployed over the measurement area. The observations presented here were obtained within a region of 10 km×10 km and mostly focused on the vertical structure. Information about the horizontal cloud structure (e.g., radar RHI scans, in situ aircraft observations) and observations over a larger area (e.g., covering the entire region between upstream and downstream mountain barriers) would be beneficial to obtain a more complete picture of the cloud dynamics and microphysics.
In this paper, we studied the influence of low-level flow blocking and shear-induced turbulence on the microphysics of a mid-level cloud in a post-frontal environment and a low-level feeder cloud induced by an in-valley circulation. Observations from a multi-dimensional set of ground-based remote sensing, balloon-borne in situ and ground-based precipitation instruments were analyzed, which were acquired during the RACLETS campaign in the Swiss Alps. The key findings are summarized as follows:
-
The wind observations indicated the transition from a blocked to an unblocked low-level flow during the observational period and the presence of enhanced turbulence in the region of strong vertical wind shear in the boundary between the blocked layer in the valley and the stronger cross-barrier flow aloft. A supercooled liquid layer was embedded near the cloud top, which provided a favorable environment for ice nucleation and growth. Changes in the microphysical cloud properties were observed within the turbulent shear layer including enhanced LDRs (i.e., change in particle shape or density) and increased radar reflectivities (i.e., enhanced ice growth). Our results are consistent with previous studies that have observed enhanced ice growth and precipitation formation through riming and aggregation in turbulent layers. In addition, based on the ice particle habits observed at the surface, we suggest that needle growth on existing ice particles occurred within the turbulent layer and that collisions of these fragile ice crystals with large rimed ice particles might have caused mechanical break-up and the subsequent production of small secondary ice particles. These ice fragments have the potential to recirculate in the shear layer and influence the cloud microphysics aloft. However, this process could not be directly measured in this study. Further studies are required to investigate the role of secondary ice production mechanisms in turbulent shear layers.
-
The region of enhanced turbulence at the boundary between the blocked layer in the valley and the cross-barrier flow aloft was determined by a complex interplay of upstream and downstream effects. More specifically, the region of strong vertical wind shear was observed to lower as stronger cross-barrier flow propagated downward, and the low-level blocking weakened on the windward slope of the downstream mountain barrier. Due to the lower humidity of the blocked layer in the valley, the majority of the hydrometeors that formed in the mid-level cloud sublimated when falling through the subsaturated layer. Accordingly, precipitation was only observed in the valley when the subsaturated layer was shallowest. Thus, we propose that the amount of precipitation observed in a mountain valley is influenced by several factors such as (1) the strength of the cross-barrier flow and low-level blocking, (2) the vertical extent of the subsaturated layer, and (3) the thermodynamic state of the boundary layer.
-
In situ instrumentation on a tethered-balloon system observed a low-level feeder cloud, which dissipated when the low-level flow turned from a blocked to an unblocked state. We propose that an overturning cell formed as a consequence of the low-level flow impinging on the downstream mountain barrier, which created an in-valley circulation. As a small-scale topographic feature was located upstream of the mountain barrier, we suggest that the generated counterflow (i.e., blocked flow) was forced to rise over the local topography and thereby acted as an updraft source and as a driving force for the formation of a low-level feeder cloud. Although we assume that the feeder cloud did not enhance precipitation in this particular case (due to the subsaturated layer aloft), we propose that local flow effect, such as low-level blocking can induce the formation of feeder clouds in other mountain valleys or on the leeward slope of foothills upstream of the main mountain barrier, where they can enhance orographic precipitation through the seeder–feeder mechanism.
The dynamical response of a stable flow encountering a mountain barrier depends on the strength of the upstream airflow, the thermodynamic stability of the flow and the height of the mountain barrier. These components can be combined into a dimensionless number (Froude number; e.g., Colle et al., 2013):
where U is the wind speed perpendicular to the mountain barrier; h is the height of the mountain barrier; and N is the Brunt–Väisälä frequency, which is a measure for the atmospheric stability. If the Froude number is large (Fr≫1), the airflow can rise over the mountain barrier. When the Froude number is small (Fr≪1), the upstream flow is blocked and cannot ascend over the mountain barrier. The parameters to calculate the Froude number for the periods P1_bl (16:00–17:45 UTC), P2_unbl (17:45–18:40 UTC) and P3_bl (18:40–20:00 UTC) are given in Table A1.
The effective terrain height h was around 800 m (see Fig. 1b). The wind speed was obtained from the radar wind profiler and averaged over the 2100–2800 m height interval. The temperature and pressure were measured at Wolfgang (1630 m) and at Weissfluhjoch (2700 m), and a linear temperature gradient was assumed between the two measurement locations. The calculated Froude numbers were below 1 for all periods, indicative of a blocked low-level flow. The Froude number increased during P2_unbl (from 0.75 to 0.94), suggesting a weakening of the blocking.
Table A1Parameters used to calculate the Froude number during P1_bl, P2_unbl and P3_bl.
The dataset of this study is available for download at https://doi.org/10.5281/zenodo.4338815 (Ramelli et al., 2020c). The scripts to reproduce the figures of this study are available at https://doi.org/10.5281/zenodo.4339254 (Ramelli et al., 2020d). The elevation data were obtained from the digital height model DHM25 of the Federal Office of Topography swisstopo: https://shop.swisstopo.admin.ch/de/products/height_models/dhm25200 (last access: 9 March 2020). The ERA5 reanalysis data can be accessed from the Copernicus Climate Change Service (C3S): https://doi.org/10.24381/cds.bd0915c6 (Hersbach et al., 2018; last access: 18 December 2020). The radiosonde data were obtained from the UQAM-Montreal Weather Centre: http://meteocentre.com/radiosonde/ (last access: 16 March 2020). The datasets of the RACLETS campaign are available for download at https://www.envidat.ch/group/raclets-field-campaign (last access: 18 December 2020).
FR analyzed the observational data and prepared the figures of the paper. FR, JH, JTP, AL and JW performed the HoloBalloon measurements. JB and PS processed the remote sensing data and helped in interpreting the remote sensing observations. RE operated the OCEANET container during the RACLETS campaign. MH operated the radar wind profiler and processed the wind profiler data. FR, JH, ROD and UL helped in analyzing and interpreting the data. FR prepared the manuscript with contributions from all authors.
The authors declare that they have no conflict of interest.
The authors would like to thank the participants of the RACLETS campaign for their technical support and many fruitful discussions. In particular, we are thankful to Michael Lehning (WSL/SLF, EPFL) and his whole team for their substantial support in realizing the RACLETS campaign by providing local contacts and support in requesting the necessary permissions. We would like to thank Paul Fopp for providing his land for the RACLETS campaign. We would also like to thank Alexander Beck for helping with the organization of the field campaign. Moreover, the authors are thankful to Susanne Crewell (University of Cologne) and Bernhard Pospichal (University of Cologne) for their help in interpreting the microwave radiometer data. We would also like to acknowledge Benjamin Walter (SLF) for providing data of the snowdrift station located at Gotschnagrat. We thank the Swiss Federal Office of Meteorology and Climatology for providing the meteorological measurements, ceilometer data from Klosters, MASC observations, and access to the COSMO1 and weather radar data. Furthermore, we would also like to thank Eberhard Bodenschatz (MPI Göttingen) for his technical support during the development of the HoloBalloon platform. We would like to thank the Federal Office of Civil Aviation, particularly Judith Baumann and Jeroen Kroese, for their pragmatic approach in obtaining the flight permit. Finally, we thank Dmitri Moisseev and an anonymous reviewer for their constructive and helpful feedback on the manuscript, which strengthened the paper.
This research has been supported by the Swiss National Science Foundation (SNSF) (grant no. 200021_175824). Robert O. David received funding from the European Research Council (ERC) (grant no. StG 758005).
This paper was edited by Ari Laaksonen and reviewed by Dmitri Moisseev and one anonymous referee.
Aikins, J., Friedrich, K., Geerts, B., and Pokharel, B.: Role of a cross-barrier jet and turbulence on winter orographic snowfall, Mon. Weather Rev., 144, 3277–3300, 2016. a, b, c, d, e
Bacon, N. J., Swanson, B. D., Baker, M. B., and Davis, E. J.: Breakup of levitated frost particles, J. Geophys. Res.-Atmos, 103, 13763–13775, 1998. a
Bader, M. and Roach, W.: Orographic rainfall in warm sectors of depressions, Q. J. Roy. Meteor. Soc., 103, 269–280, 1977. a
Bailey, M. P. and Hallett, J.: A comprehensive habit diagram for atmospheric ice crystals: Confirmation from the laboratory, AIRS II, and other field studies, J. Atmos. Sci., 66, 2888–2899, 2009. a
Beck, A., Henneberger, J., Schöpfer, S., Fugal, J., and Lohmann, U.: HoloGondel: in situ cloud observations on a cable car in the Swiss Alps using a holographic imager, Atmos. Meas. Tech., 10, 459–476, https://doi.org/10.5194/amt-10-459-2017, 2017. a
Bergeron, T.: On the low-level redistribution of atmospheric water caused by orography, in: Suppl. Proc. Int. Conf. Cloud Phys., Tokyo, paper presented at the International Conference on Cloud Physics, Tokyo and Sapporo, Japan, Int. Assoc. of Meteorol. and Atmos. Phys. of the Int. Union of Geod. and Geophys., 24 May to 1 June, 96–100, 1965. a
Borys, R. D., Lowenthal, D. H., Cohn, S. A., and Brown, W. O.: Mountaintop and radar measurements of anthropogenic aerosol effects on snow growth and snowfall rate, Geophys. Res. Lett., 30, 1538, https://doi.org/10.1029/2002GL016855, 2003. a
Bringi, V. N. and Chandrasekar, V.: Polarimetric Doppler weather radar: principles and applications, Cambridge University Press, Cambridge, https://doi.org/10.1017/CBO9780511541094, 2001. a
Bühl, J., Seifert, P., Myagkov, A., and Ansmann, A.: Measuring ice- and liquid-water properties in mixed-phase cloud layers at the Leipzig Cloudnet station, Atmos. Chem. Phys., 16, 10609–10620, https://doi.org/10.5194/acp-16-10609-2016, 2016. a
Chapman, D. and Browning, K.: Measurements of dissipation rate in frontal zones, Q. J. Roy. Meteor. Soc., 127, 1939–1959, 2001. a, b
Colle, B. A., Smith, R. B., and Wesley, D. A.: Theory, observations, and predictions of orographic precipitation, in: Mountain Weather Research and Forecasting, Springer, Dordrecht, 291–344, https://doi.org/10.1007/978-94-007-4098-3_6, 2013. a, b
Dong, Y., Oraltay, R. G., and Hallett, J.: Ice particle generation during evaporation, Atmos. Res., 32, 45–53, 1994. a
Durran, D. R.: Mountain waves and downslope winds, in: Atmospheric Processes over Complex Terrain, edited by: Blumen, W., Meteorological Monographs, vol. 23, American Meteorological Society, Boston, MA, https://doi.org/10.1007/978-1-935704-25-6_4, 1990. a
Engelmann, R., Kanitz, T., Baars, H., Heese, B., Althausen, D., Skupin, A., Wandinger, U., Komppula, M., Stachlewska, I. S., Amiridis, V., Marinou, E., Mattis, I., Linné, H., and Ansmann, A.: The automated multiwavelength Raman polarization and water-vapor lidar PollyXT: the neXT generation, Atmos. Meas. Tech., 9, 1767–1784, https://doi.org/10.5194/amt-9-1767-2016, 2016. a
Frei, C. and Schär, C.: A precipitation climatology of the Alps from high-resolution rain-gauge observations, Int. J. Climatol., 18, 873–900, 1998. a
Garrett, T. J., Fallgatter, C., Shkurko, K., and Howlett, D.: Fall speed measurement and high-resolution multi-angle photography of hydrometeors in free fall, Atmos. Meas. Tech., 5, 2625–2633, https://doi.org/10.5194/amt-5-2625-2012, 2012. a
Geerts, B., Miao, Q., and Yang, Y.: Boundary layer turbulence and orographic precipitation growth in cold clouds: Evidence from profiling airborne radar data, J. Atmos. Sci., 68, 2344–2365, 2011. a, b, c, d, e
Georgakaki, P., Bougiatioti, A., Wieder, J., Mignani, C., Ramelli, F., Kanji, Z. A., Henneberger, J., Hervo, M., Berne, A., Lohmann, U., and Nenes, A.: On the drivers of droplet variability in Alpine mixed-phase clouds, Atmos. Chem. Phys. Discuss. [preprint], https://doi.org/10.5194/acp-2020-1036, in review, 2020. a, b
Görsdorf, U., Lehmann, V., Bauer-Pfundstein, M., Peters, G., Vavriv, D., Vinogradov, V., and Volkov, V.: A 35-GHz polarimetric Doppler radar for long-term observations of cloud parameters–Description of system and data processing, J. Atmos. Ocean. Technol., 32, 675–690, 2015. a
Grazioli, J., Lloyd, G., Panziera, L., Hoyle, C. R., Connolly, P. J., Henneberger, J., and Berne, A.: Polarimetric radar and in situ observations of riming and snowfall microphysics during CLACE 2014, Atmos. Chem. Phys., 15, 13787–13802, https://doi.org/10.5194/acp-15-13787-2015, 2015. a, b, c, d, e
Hallett, J. and Mossop, S.: Production of secondary ice particles during the riming process, Nature, 249, 26–28, https://doi.org/10.1038/249026a0, 1974. a
Henneberger, J., Fugal, J. P., Stetzer, O., and Lohmann, U.: HOLIMO II: a digital holographic instrument for ground-based in situ observations of microphysical properties of mixed-phase clouds, Atmos. Meas. Tech., 6, 2975–2987, https://doi.org/10.5194/amt-6-2975-2013, 2013. a
Hersbach, H., Bell, B., Berrisford, P., Biavati, G., Horányi, A., Muñoz Sabater, J., Nicolas, J., Peubey, C., Radu, R., Rozum, I., Schepers, D., Simmons, A., Soci, C., Dee, D., and Thépaut, J.-N.: ERA5 hourly data on single levels from 1979 to present, Copernicus Climate Change Service (C3S) Climate Data Store (CDS), https://doi.org/10.24381/cds.adbb2d47, 2018. a, b
Hill, F., Browning, K., and Bader, M.: Radar and raingauge observations of orographic rain over south Wales, Q. J. Roy. Meteor. Soc., 107, 643–670, 1981. a
Hogan, R. J., Field, P., Illingworth, A., Cotton, R., and Choularton, T.: Properties of embedded convection in warm-frontal mixed-phase cloud from aircraft and polarimetric radar, Q. J. Roy. Meteor. Soc., 128, 451–476, 2002. a, b, c, d, e
Houze Jr., R. A.: Orographic effects on precipitating clouds, Rev. Geophys., 50, 2012. a, b, c
Houze Jr., R. A.: Cloud dynamics, Academic Press, Oxford, 2014. a
Houze Jr., R. A. and Medina, S.: Turbulence as a mechanism for orographic precipitation enhancement, J. Atmos. Sci., 62, 3599–3623, 2005. a, b, c, d, e, f, g, h, i, j
Jiang, Q. and Smith, R. B.: Cloud timescales and orographic precipitation, J. Atmos. Sci., 60, 1543–1559, 2003. a
Keyser, D. and Shapiro, M.: A review of the structure and dynamics of upper-level frontal zones, Mon. Weather Rev., 114, 452–499, 1986. a
Kirshbaum, D. J., Adler, B., Kalthoff, N., Barthlott, C., and Serafin, S.: Moist orographic convection: Physical mechanisms and links to surface-exchange processes, Atmosphere, 9, 80, 2018. a
Kneifel, S. and Moisseev, D.: Long-Term Statistics of Riming in Nonconvective Clouds Derived from Ground-Based Doppler Cloud Radar Observations, J. Atmos. Sci., 77, 3495–3508, 2020. a
Knight, C. A.: Ice growth from the vapor at −5 ∘C, J. Atmos. Sci., 69, 2031–2040, 2012. a
Korolev, A., Heckman, I., Wolde, M., Ackerman, A. S., Fridlind, A. M., Ladino, L. A., Lawson, R. P., Milbrandt, J., and Williams, E.: A new look at the environmental conditions favorable to secondary ice production, Atmos. Chem. Phys., 20, 1391–1429, https://doi.org/10.5194/acp-20-1391-2020, 2020. a
Lauber, A., Henneberger, J., Mignani, C., Ramelli, F., Pasquier, J. T., Wieder, J., Hervo, M., and Lohmann, U.: Continuous secondary-ice production initiated by updrafts through the melting layer in mountainous regions, Atmos. Chem. Phys., 21, 3855–3870, https://doi.org/10.5194/acp-21-3855-2021, 2021. a
Li, H., Moisseev, D. and von Lerber, A.: How does riming affect dual-polarization radar observations and snowflake shape?, J. Geophys. Res.-Atmos, 123, 6070–6081, 2018. a
Loescher, K. A., Young, G. S., Colle, B. A., and Winstead, N. S.: Climatology of barrier jets along the Alaskan coast. Part I: Spatial and temporal distributions, Mon. Weather Rev., 134, 437–453, 2006. a, b
Lohmann, U., Lüönd, F., and Mahrt, F.: An introduction to clouds: From the microscale to climate, Cambridge University Press, Cambridge, https://doi.org/10.1017/CBO9781139087513, 2016. a
Löhnert, U., Schween, J., Acquistapace, C., Ebell, K., Maahn, M., Barrera-Verdejo, M., Hirsikko, A., Bohn, B., Knaps, A., O'connor, E., et al.: JOYCE: Jülich observatory for cloud evolution, Bull. Am. Meteorol. Soc., 96, 1157–1174, 2015. a
Lowenthal, D. H., Borys, R. D., Cotton, W., Saleeby, S., Cohn, S. A., and Brown, W. O.: The altitude of snow growth by riming and vapor deposition in mixed-phase orographic clouds, Atmos. Environ., 45, 519–522, 2011. a
Magono, C. and Lee, C. W.: Meteorological classification of natural snow crystals, Journal of the Faculty of Science, Hokkaido University, Series 7, Geophysics, 2, 321–335, 1966. a
Marwitz, J. D.: The kinematics of orographic airflow during Sierra storms, J. Atmos. Sci., 40, 1218–1227, 1983. a, b
Medina, S. and Houze, R. A.: Air motions and precipitation growth in Alpine storms, Q. J. Roy. Meteor. Soc., 129, 345–371, 2003. a
Medina, S. and Houze Jr., R. A.: Small-scale precipitation elements in midlatitude cyclones crossing the California Sierra Nevada, Mon. Weather Rev., 143, 2842–2870, 2015. a, b, c, d, e
Medina, S., Smull, B. F., Houze Jr., R. A., and Steiner, M.: Cross-barrier flow during orographic precipitation events: Results from MAP and IMPROVE, J. Atmos. Sci., 62, 3580–3598, 2005. a
Medina, S., Sukovich, E., and Houze Jr., R. A.: Vertical structures of precipitation in cyclones crossing the Oregon Cascades, Mon. Weather Rev., 135, 3565–3586, 2007. a
Melchionna, S., Bauer, M., and Peters, G.: A new algorithm for the extraction of cloud parameters using multipeak analysis of cloud radar data–first application and preliminary results, Meteorol. Z., 17, 613–620, 2008. a
Mignani, C., Wieder, J., Sprenger, M. A., Kanji, Z. A., Henneberger, J., Alewell, C., and Conen, F.: Towards parameterising atmospheric concentrations of ice-nucleating particles active at moderate supercooling, Atmos. Chem. Phys., 21, 657–664, https://doi.org/10.5194/acp-21-657-2021, 2021. a
Moisseev, D., von Lerber, A., and Tiira, J.: Quantifying the effect of riming on snowfall using ground-based observations, J. Geophys. Res.-Atmos, 122, 4019–4037, 2017. a
Mosimann, L.: An improved method for determining the degree of snow crystal riming by vertical Doppler radar, Atmos. Res., 37, 305–323, 1995. a
Myagkov, A., Seifert, P., Wandinger, U., Bühl, J., and Engelmann, R.: Relationship between temperature and apparent shape of pristine ice crystals derived from polarimetric cloud radar observations during the ACCEPT campaign, Atmos. Meas. Tech., 9, 3739–3754, https://doi.org/10.5194/amt-9-3739-2016, 2016. a
Neiman, P. J., Ralph, F. M., White, A., Kingsmill, D., and Persson, P.: The statistical relationship between upslope flow and rainfall in California's coastal mountains: Observations during CALJET, Mon. Weather Rev., 130, 1468–1492, 2002. a, b
Neiman, P. J., Martin Ralph, F., Persson, P. O. G., White, A. B., Jorgensen, D. P., and Kingsmill, D. E.: Modification of fronts and precipitation by coastal blocking during an intense landfalling winter storm in southern California: Observations during CALJET, Mon. Weather Rev., 132, 242–273, 2004. a, b
North, G. R., Pyle, J. A., and Zhang, F.: Encyclopedia of Atmospheric Sciences, 2nd edn., Elsevier Science, Burlington, 2014. a
Olson, J. B. and Colle, B. A.: Three-dimensional idealized simulations of barrier jets along the southeast coast of Alaska, Mon. Weather Rev., 137, 391–413, 2009. a, b
Olson, J. B., Colle, B. A., Bond, N. A., and Winstead, N.: A comparison of two coastal barrier jet events along the southeast Alaskan coast during the SARJET field experiment, Mon. Weather Rev., 135, 2973–2994, 2007. a, b
Oraltay, R. and Hallett, J.: Evaporation and melting of ice crystals: A laboratory study, Atmos. Res., 24, 169–189, 1989. a
Overland, J. E. and Bond, N. A.: Observations and scale analysis of coastal wind jets, Mon. Weather Rev., 123, 2934–2941, 1995. a, b
Pinsky, M. and Khain, A.: Some effects of cloud turbulence on water–ice and ice–ice collisions, Atmos. Res., 47, 69–86, 1998. a
Pinsky, M., Khain, A., and Korolev, A.: Theoretical analysis of mixing in liquid clouds – Part 3: Inhomogeneous mixing, Atmos. Chem. Phys., 16, 9273–9297, https://doi.org/10.5194/acp-16-9273-2016, 2016. a
Pruppacher, H. R. and Klett, J. D.: Microphysics of clouds and precipitation, Nature, 284, 88–88, 1980. a
Ramelli, F., Beck, A., Henneberger, J., and Lohmann, U.: Using a holographic imager on a tethered balloon system for microphysical observations of boundary layer clouds, Atmos. Meas. Tech., 13, 925–939, https://doi.org/10.5194/amt-13-925-2020, 2020a. a, b
Ramelli, F., Henneberger, J., David, R. O., Bühl, J., Radenz, M., Seifert, P., Wieder, J., Lauber, A., Pasquier, J. T., Engelmann, R., Mignani, C., Hervo, M., and Lohmann, U.: Microphysical investigation of the seeder and feeder region of an Alpine mixed-phase cloud, Atmos. Chem. Phys. Discuss. [preprint], https://doi.org/10.5194/acp-2020-772, in review, 2020b. a, b, c
Ramelli, F., Henneberger, J., David, R. O., Lauber, A., Pasquier, J. T., Wieder, J., Bühl, J., Seifert, P., Engelmann, R., Hervo, M., and Lohmann, U.: Data for the publication “Influence of low-level blocking and turbulence on the microphysics of a mixed-phase cloud in an inner-Alpine valley”, https://doi.org/10.5281/zenodo.4338816, 2020c. a
Ramelli, F., Henneberger, J., David, R. O., Lauber, A., Pasquier, J. T., Wieder, J., Bühl, J., Seifert, P., Engelmann, R., Hervo, M., and Lohmann, U.: Scripts for the publication “Influence of low-level blocking and turbulence on the microphysics of a mixed-phase cloud in an inner-Alpine valley”, https://doi.org/10.5281/zenodo.4339255, 2020d. a
Rauber, R. M. and Tokay, A.: An explanation for the existence of supercooled water at the top of cold clouds, J. Atmos. Sci., 48, 1005–1023, 1991. a
Roe, G. H.: Orographic precipitation, Annu. Rev. Earth Planet. Sci., 33, 645–671, 2005. a, b
Rose, T., Crewell, S., Löhnert, U., and Simmer, C.: A network suitable microwave radiometer for operational monitoring of the cloudy atmosphere, Atmos. Res., 75, 183–200, 2005. a
Rotunno, R. and Ferretti, R.: Mechanisms of intense Alpine rainfall, J. Atmos. Sci., 58, 1732–1749, 2001. a
Rotunno, R. and Houze, R. A.: Lessons on orographic precipitation from the Mesoscale Alpine Programme, Q. J. Roy. Meteor. Soc., 133, 811–830, 2007. a, b, c
Shupe, M. D., Kollias, P., Matrosov, S. Y., and Schneider, T. L.: Deriving mixed-phase cloud properties from Doppler radar spectra, J. Atmos. Ocean. Technol., 21, 660–670, 2004. a
Shupe, M. D., Matrosov, S. Y., and Uttal, T.: Arctic mixed-phase cloud properties derived from surface-based sensors at SHEBA, J. Atmos. Sci., 63, 697–711, 2006. a
Smith, R. B.: The influence of mountains on the atmosphere, Adv. Geophys., 21, 87–230, https://doi.org/10.1016/S0065-2687(08)60262-9, 1979. a, b
Smith, R. B.: 100 Years of Progress on Mountain Meteorology Research, Meteorological Monographs, 59, 20.1–20.73, https://doi.org/10.1175/AMSMONOGRAPHS-D-18-0022.1, 2019. a, b
Stoelinga, M. T., Stewart, R. E., Thompson, G., and Thériault, J. M.: Microphysical Processes Within Winter Orographic Cloud and Precipitation Systems, in: Mountain Weather Research and Forecasting, edited by: Chow, F., De Wekker, S., and Snyder, B., Springer Atmospheric Sciences, Springer, Dordrecht, https://doi.org/10.1007/978-94-007-4098-3_7, 2013. a
Tokay, A., Wolff, D. B., and Petersen, W. A.: Evaluation of the new version of the laser-optical disdrometer, OTT Parsivel2, J. Atmos. Ocean. Technol., 31, 1276–1288, 2014. a
Vardiman, L.: The generation of secondary ice particles in clouds by crystal–crystal collision, J. Atmos. Sci., 35, 2168–2180, 1978. a, b, c
Walter, B., Huwald, H., Gehring, J., Bühler, Y., and Lehning, M.: Radar measurements of blowing snow off a mountain ridge, The Cryosphere, 14, 1779–1794, https://doi.org/10.5194/tc-14-1779-2020, 2020. a
Yano, J.-I., Phillips, V. T., and Kanawade, V.: Explosive ice multiplication by mechanical break-up in ice–ice collisions: a dynamical system-based study, Q. J. Roy. Meteor. Soc., 142, 867–879, 2016. a, b, c
Yu, C.-K. and Smull, B. F.: Airborne Doppler observations of a landfalling cold front upstream of steep coastal orography, Mon. Weather Rev., 128, 1577–1603, 2000. a, b
Yuter, S. E. and Houze Jr., R. A.: Three-dimensional kinematic and microphysical evolution of Florida cumulonimbus. Part II: Frequency distributions of vertical velocity, reflectivity, and differential reflectivity, Mon. Weather Rev., 123, 1941–1963, 1995. a